Article

Hyperspectral Identification of Ginseng Growth Years and Spectral Importance Analysis Based on Random Forest

1
Aerospace Information Research Institute, Chinese Academy of Sciences, Beijing 100094, China
2
School of Software Engineering, Jiangxi University of Science and Technology, Nanchang 330013, China
3
Northwest Institute of Eco-Environment and Resources, Chinese Academy of Sciences, Lanzhou 730000, China
4
State Key Laboratory Breeding Base of Dao-di Herbs, National Resource Center for Chinese Materia Medica, Chinese Academy of Chinese Medical Sciences, Beijing 100700, China
*
Author to whom correspondence should be addressed.
Appl. Sci. 2022, 12(12), 5852; https://doi.org/10.3390/app12125852
Submission received: 16 April 2022 / Revised: 5 June 2022 / Accepted: 7 June 2022 / Published: 8 June 2022
(This article belongs to the Special Issue Big Data and AI for Food and Agriculture)

Abstract

:
The growth year of ginseng is very important as it affects its economic value and even defines if ginseng can be used as medicine or food. In the case of large-scale developments in the ginseng industry, a set of non-destructive, fast, and nonprofessional operations related to the growth year identification method is needed. The characteristics of ginseng reflectance spectral data were analyzed, and the growth year recognition model was constructed by a decision-tree-based random forest machine learning method. After independent verification, the accuracy of distinguishing ginseng food and medicine can reach 92.9%, with 6-year growth as the boundary, and 100%, with 5-year growth as the boundary. The research results show that the spectral change of ginseng is the most obvious in the fifth year, which provides a reference for the key research years based on chemical analyses and other methods. For the application of growth year recognition, the NIR band (1000–2500 nm) had little contribution to the recognition of ginseng growth years, and the band with the largest contribution was 400–650 nm. The recognition model based on machine learning provides a non-destructive, fast, and simple scheme with high accuracy for ginseng year recognition, and the spectral importance analysis conclusion of ginseng growth years provides a design reference for the development of special lightweight spectral equipment for year recognition.

1. Introduction

Ginseng has a long history in the traditional Chinese medicine system. Shennong’s traditional Classic of Materia Medica lists ginseng as a top-grade product: “it mainly replenishes the five internal organs, calms the spirit, calms the soul, stops palpitations, brightens the eyes, benefits intelligence. Taking it for a long time can make people relax and prolong life”. Ginseng is used as medicine and food simultaneously. Thus, the market demand is huge. In China, the artificial cultivation of ginseng has experienced a major expansion. Saponins, vitamins, polysaccharides, and other active components contained in ginseng are highly correlated with the growth years [1,2]. Therefore, ginseng usually needs to be planted for many years. The National Compilation of Chinese Traditional Medicine requires that ginseng “generally should be reaped more than 5 years of growth”. In 2012, China’s Ministry of Health issued a document approving ginseng (artificial cultivation) as a new resource food, and the attachment indicated the conditions of 5 years or less for food (http://www.gov.cn/gzdt/2012-09/05/content_2217143.htm, accessed on 17 January 2021). Ginseng grown for 6 years or more is considered to be medicine; otherwise, it can only be used as food. Ginseng mainly grows in the northern regions in China. The annual change is reflected in the physical form of reed head, which is easy to identify. The difference between medicine and food also provides different economic values to ginseng in different growth years. Thus, the ginseng market induced a phenomenon of disguising young ginseng as old ones by changing its appearance. Therefore, the identification method based on the appearance characteristics, such as reed, root, body, and fibril, is no longer reliable [3,4]. The microscopic identification method is based on examining calcium oxalate cluster crystal contents in reed heads [5]. Mass spectrometry identifies ginseng growth years by the analysis of saponins and other components, and all three types of ginsenosides were successfully detected and visualized in images, which proved the advantages of matrix-assisted laser desorption/ionization time-of-flight mass spectrometry imaging (MALDI-TOF-MSI) over traditional methods for the analysis of herbs. However, the differentiation of ginsenosides isomers was not available in the analysis of ginseng by MALDI-TOF-MSI [6,7]. Liquid chromatography [8,9,10,11] and other methods have high identification accuracy in terms of the year, but all of them need to cause damage to ginseng samples. Laser-induced identification methods induce little damage to samples and have good accuracy and high identification speeds [12,13], but they still require complex processes such as purification, drying, grinding, and high-pressure pressing. The above methods are not applicable to non-professionals and do not have value for on-site identification and promotion. Kwon et al. measured ginseng leaves in the farmland and judged the growth years only by using direct spectral observation information, with a recognition accuracy of 94.8%. Although there is no direct measurement of dried ginseng roots (medicinal part), the direction of ginseng growth years identified by spectral information was pointed out [14].
Using only spectral information, it has the advantage of nondestructive, fast, and simple identification in reflective spectral bands [15,16,17,18,19,20]. Woo et al. used the near-infrared (NIR) reflectance spectra to classify ginseng successfully [15]. Chung et al. proposed a fusion model based on data fusion and decision fusion from hyperspectral images to detect the foreign materials on the surfaces of broiler breast fillets, and the detection accuracy is up to 95% [16]. Aboonajmi et al. predicted egg freshness by using transmission visible near infrared spectroscopy, and it showed good prediction abilities [18]. Gopal et al. detected Jaggery adulterants in honey using near-infrared spectroscopy techniques with Chemometrics, and the calibration error was only 0.00751 [19]. The previous research studies used specific spectral ranges such as visible and near-infrared (VNIR), short wave infrared (SWIR), and terahertz. However, the importance of different spectral ranges was not compared and analyzed.
At 400–2500 nm wavelengths, the electromagnetic wave only reflects light signal; it provides no thermal radiation information and has no penetrability toward opaque targets. Therefore, hyperspectral reflectance basically reflects only the surface layer information of ginseng, which can be used to carry out year identification research. In order to test and construct spectral recognition methods of ginseng growth years, the hyperspectral images of 400–2500 nm were obtained by using garden ginseng (artificially planted) samples with growth years of 1–7 years. The model of ginseng growth years identification was trained by machine learning methods, and the feature bands were extracted by providing the importance of every wavelength band.

2. Materials and Methods

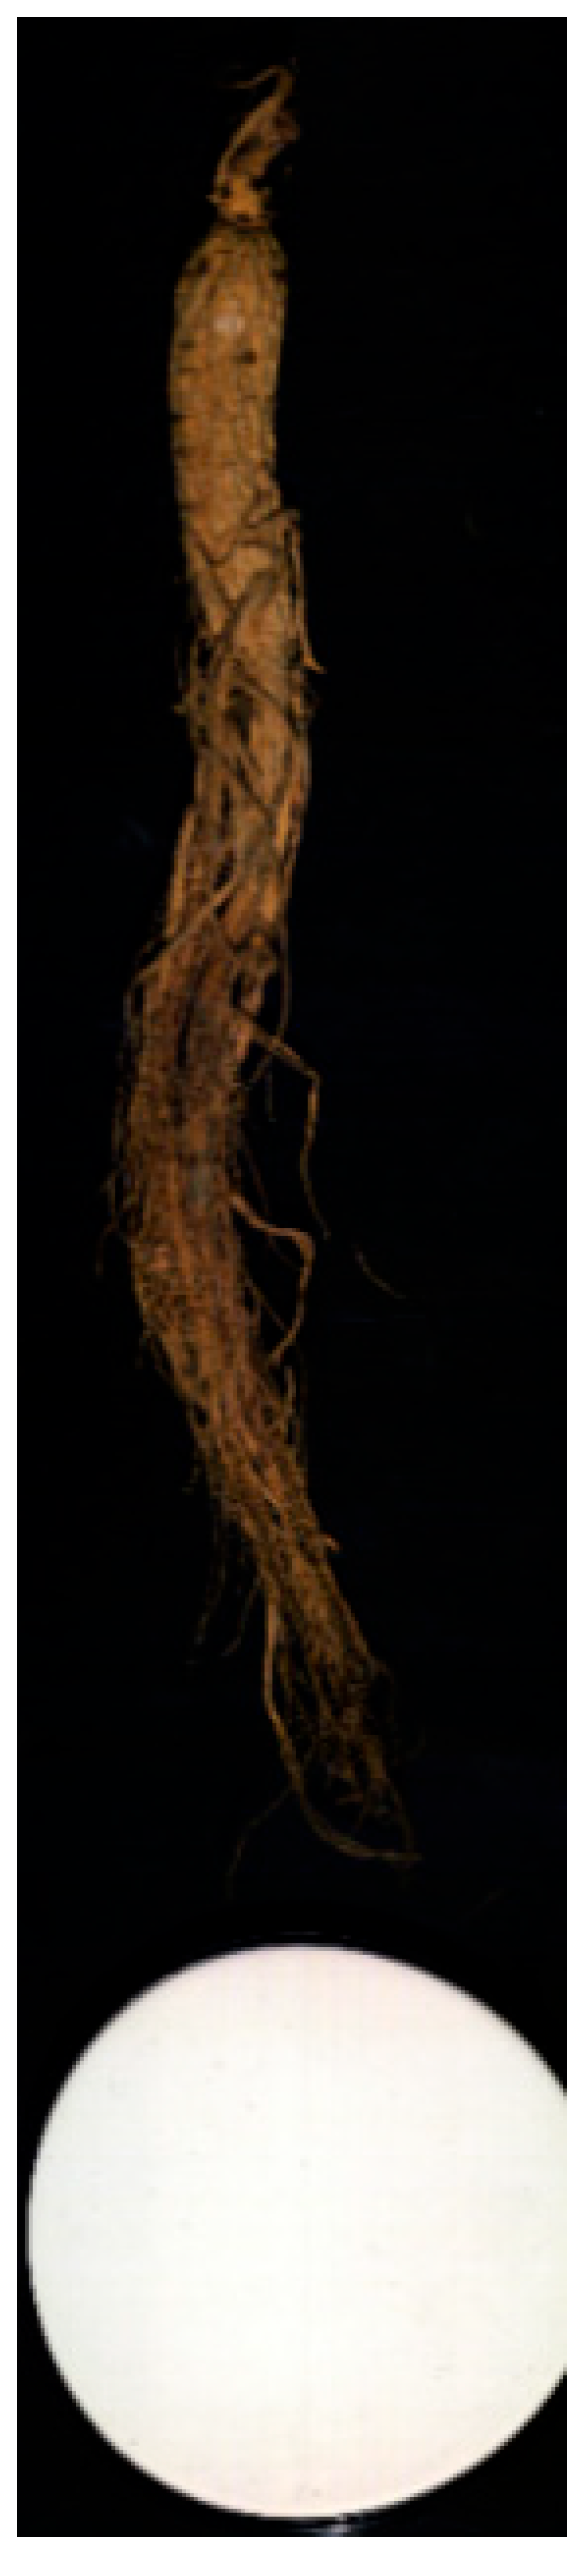
2.1. Ginseng Samples in Different Years

Thirty-five ginseng samples were planted in field, and the growth years and number of samples were as follows: 1 year (3), 2 years (2), 3 years (2), 4 years (4), 5 years (6), 6 years (6), and 7 years (12). Dried ginseng root samples were collected without any processing.

2.2. Hyperspectral Imaging and Processing

Hyperspectral imaging equipment comprises a combination of Hyspex VNIR-1024 (covering 400–1000 nm, 108 spectral bands) visible near-infrared hyperspectral camera and Hyspex SWIR-384 (covering 1000–2500 nm, 288 spectral bands) short-wave infrared hyperspectral camera, which were made by the Norwegian NEO company. The image data processing method is introduced in this section. Illumination was provided by a fixed artificial light source, and ambient light was shielded through from the darkroom environment. During the hyperspectral imaging of ginseng samples, a white board was placed at the same time. The color of background was black, which can reduce the impact of ambient reflectivity. The imaging effect is shown in Figure 1.
Hyperspectral images cover nearly 50% of the surface area of ginseng. For each pixel, there are differences caused by the differing reflectance of ginseng reed, body, and fibril, and these differences are also caused by different angles of illumination geometry [21]. In order to comprehensively utilize the overall information of ginseng samples and remove noise, the hyperspectral image of a single ginseng sample was processed into spectral reflectance over 396 spectral bands. Radiometric correction for the pixels of ginseng in the image includes relative and absolute corrections [22,23]. Along the swath direction, every pixel was under different illuminating geometric conditions. As shown in Figure 1, the middle columns of white board are brighter than the left and right columns. Based on the Lambertian reflective property of a white board, it can be used as a standard reference for absolute correction [24,25].
The reflectance is defined as follows:
ρ λ i , j = D N i , j E D N w b : ,     j
where ρ λ is the reflectance on wavelength λ, (i, j) are the row and column of pixel in the ginseng subimage, E D N w b : ,   j is the mathematical expectation of all DNs in the white board in the column j, and D N i , j is the DN positioned at (i, j) in the ginseng’s subimage.
Therefore, ρ λ is the reflectance that normalized by the white board. When the DNs of ginseng’s subimage had been processed column-by-column using Equation (1), the reflectance image after absolute and relative radiometric corrections was acquired.
The specific data processing steps are as follows.
Firstly, according to the significant brightness difference of 3 targets including ginseng, a black background and white board were used in any spectral band. A threshold method was used for image segmentation to distinguish and mark the 3 targets.
Secondly, ginseng pixels were divided by the mean of white board pixels in the same column to obtain a reflectance image.
Thirdly, the reflectance of all pixels labeled as ginseng in the same band was averaged to obtain the mean reflectance value of the band.
Fourthly, after batch processing all hyperspectral bands, 35 spectral curves with good smoothness were obtained, as shown in Figure 2.

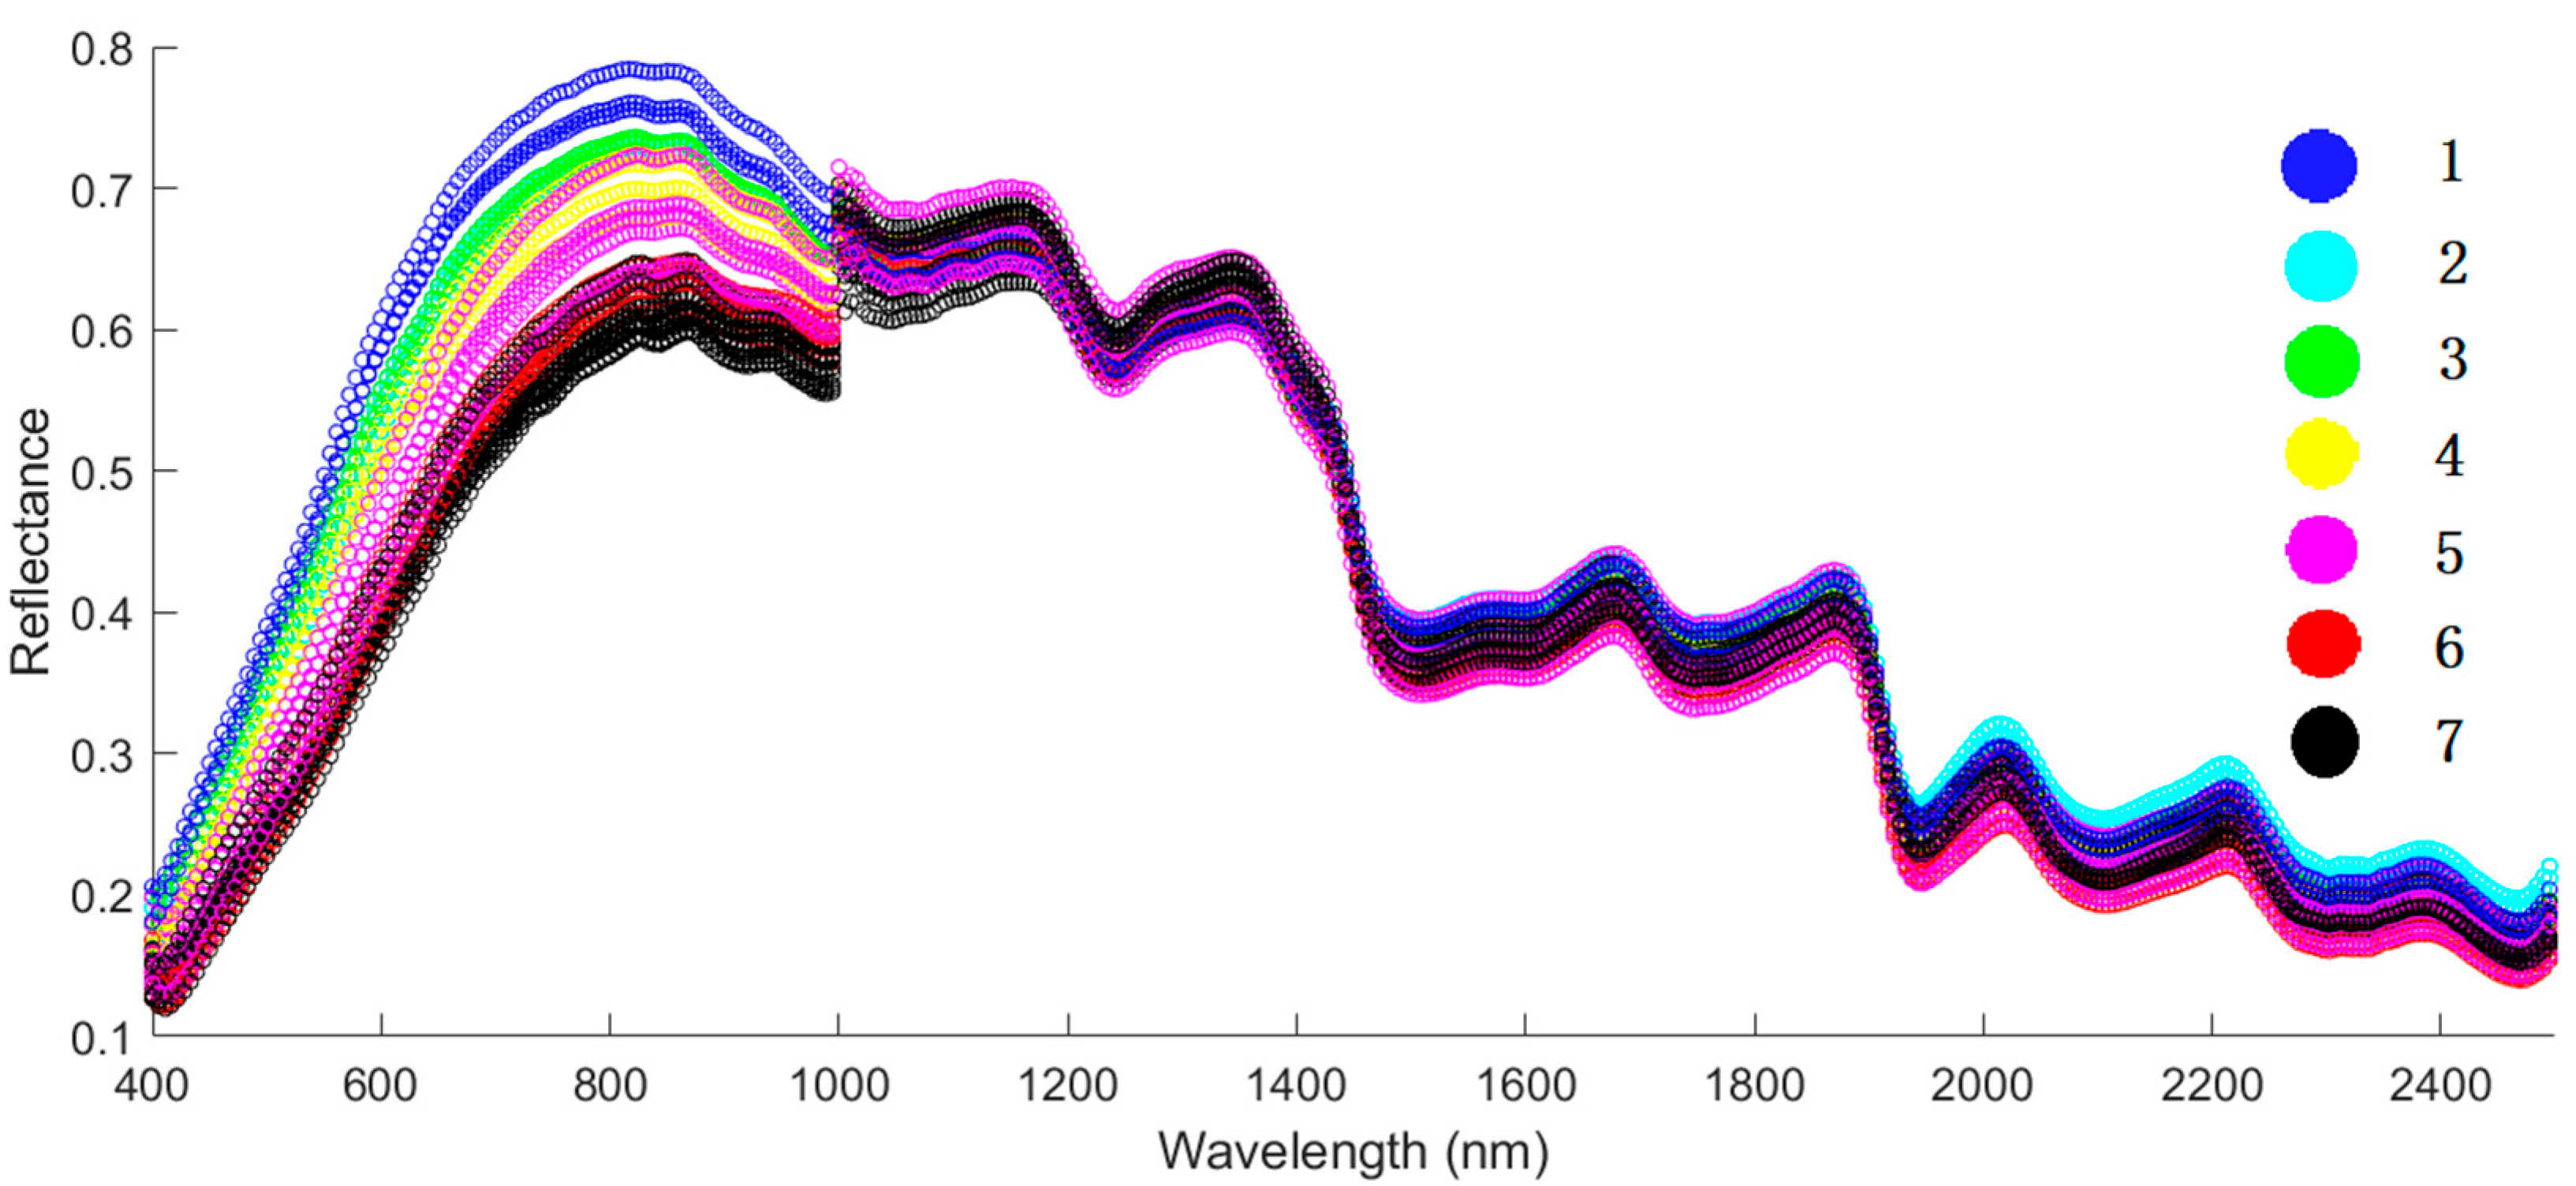
2.3. Spectral Curve Analysis and Machine Learning Modeling

As shown in Figure 2, the difference of the spectral curve in different years is mainly reflected in the VNIR (400–1000 nm) range but not in the SWIR (1000–2500 nm) bands. It is easy to distinguish between 1 and 3 years, but the samples during 4–7 years appear to be aliasing in the VNIR region, so it is difficult to form a recognition method based on the threshold or threshold ratio. The identification of growth years is a classification problem. The statistical method of machine learning is used for identification, and the random forest method, which has the advantage of analyzing high-dimensional data, was selected [26]. Liu et al. proposed a method that combines terahertz spectroscopy with machine learning to identify the origin of ginseng. The identification rate of two classification models, which are random forest and support vector machines (SVM), can be achieved at 88.5% and 87.5%, respectively. Compared with the SVM model, the random forest model can obtain better results. Therefore, the random forest method was used to identify the ginseng year [27]. Random forest is a machine learning method that uses multiple weak decision trees to vote to determine the output, and it can provide the importance of the input spectral band. It contains many decision trees representing a distinct instance of the classification of data inputs into the random forest model [28]. The random forest technique considers the instances individually, taking the one with the majority of votes as the selected prediction. Each tree in the classifications takes input from samples in the initial dataset. Features are then randomly selected, which are used in growing the tree at each node. Every tree in the forest should not be pruned until the end of the exercise when the prediction is reached decisively. In such a manner, random forest enables any classifiers with weak correlations to create a strong classifier. The random forest identification program is developed based on the scikit-learn platform using Python coding language.
Each sample contains one spectral curve data as input, and the marked year’s value is used as output. Among the 35 samples, 80% (28 samples) were used as the training data sets and 20% (7 samples) are used as the test verification data sets. Considering the number of samples (the appropriate sample number depends on the significance of data characteristics, which is difficult to evaluate before training and testing, but after the data type is determined, the larger the sample number is generally the better), training and testing for 10 instances were adopted, seven test verification data are randomly selected each time, and it is ensured that each growth year has samples participating in training. The stratified k-fold cross validation is applied in the experiments in order to effectively solve the problem of producing an unbalanced sample number. Each fold preserves the proportions of the categories in the original data, which can render the verification more credible [29].

3. Results and Discussion

Three types of year-scale classifications are tested. Firstly, the identification of year-by-year differentiation is tested; that is, there are seven random forest outputs. Secondly, the distinction between food and medicine was tested, and the random forest output was divided into 0 (1–5 years) and 1 (6–7 years). Thirdly, two types ((1–4 years) and (5–7 years)) were tested. By obtaining the confusion matrix of the trials, the accuracy and spectral band importance of identification tests for each year scale are provided. The accuracy of identification is the number of correct samples identified in the validation test sample set divided by the total number of validation test samples and expressed as a percentage.

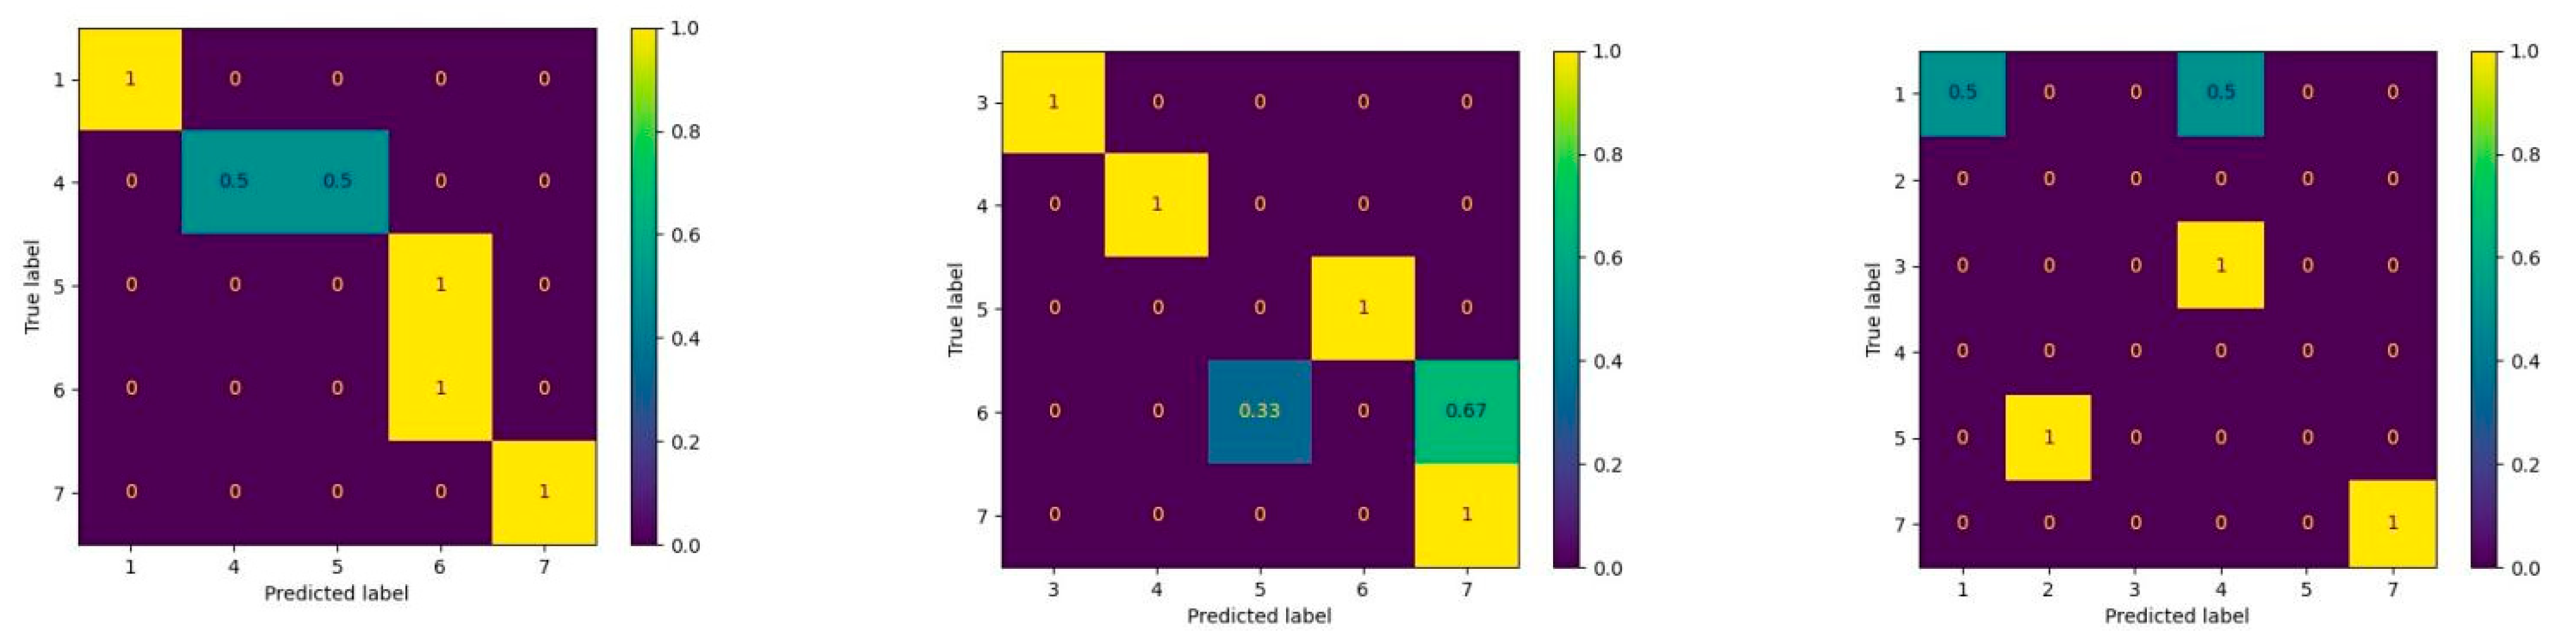
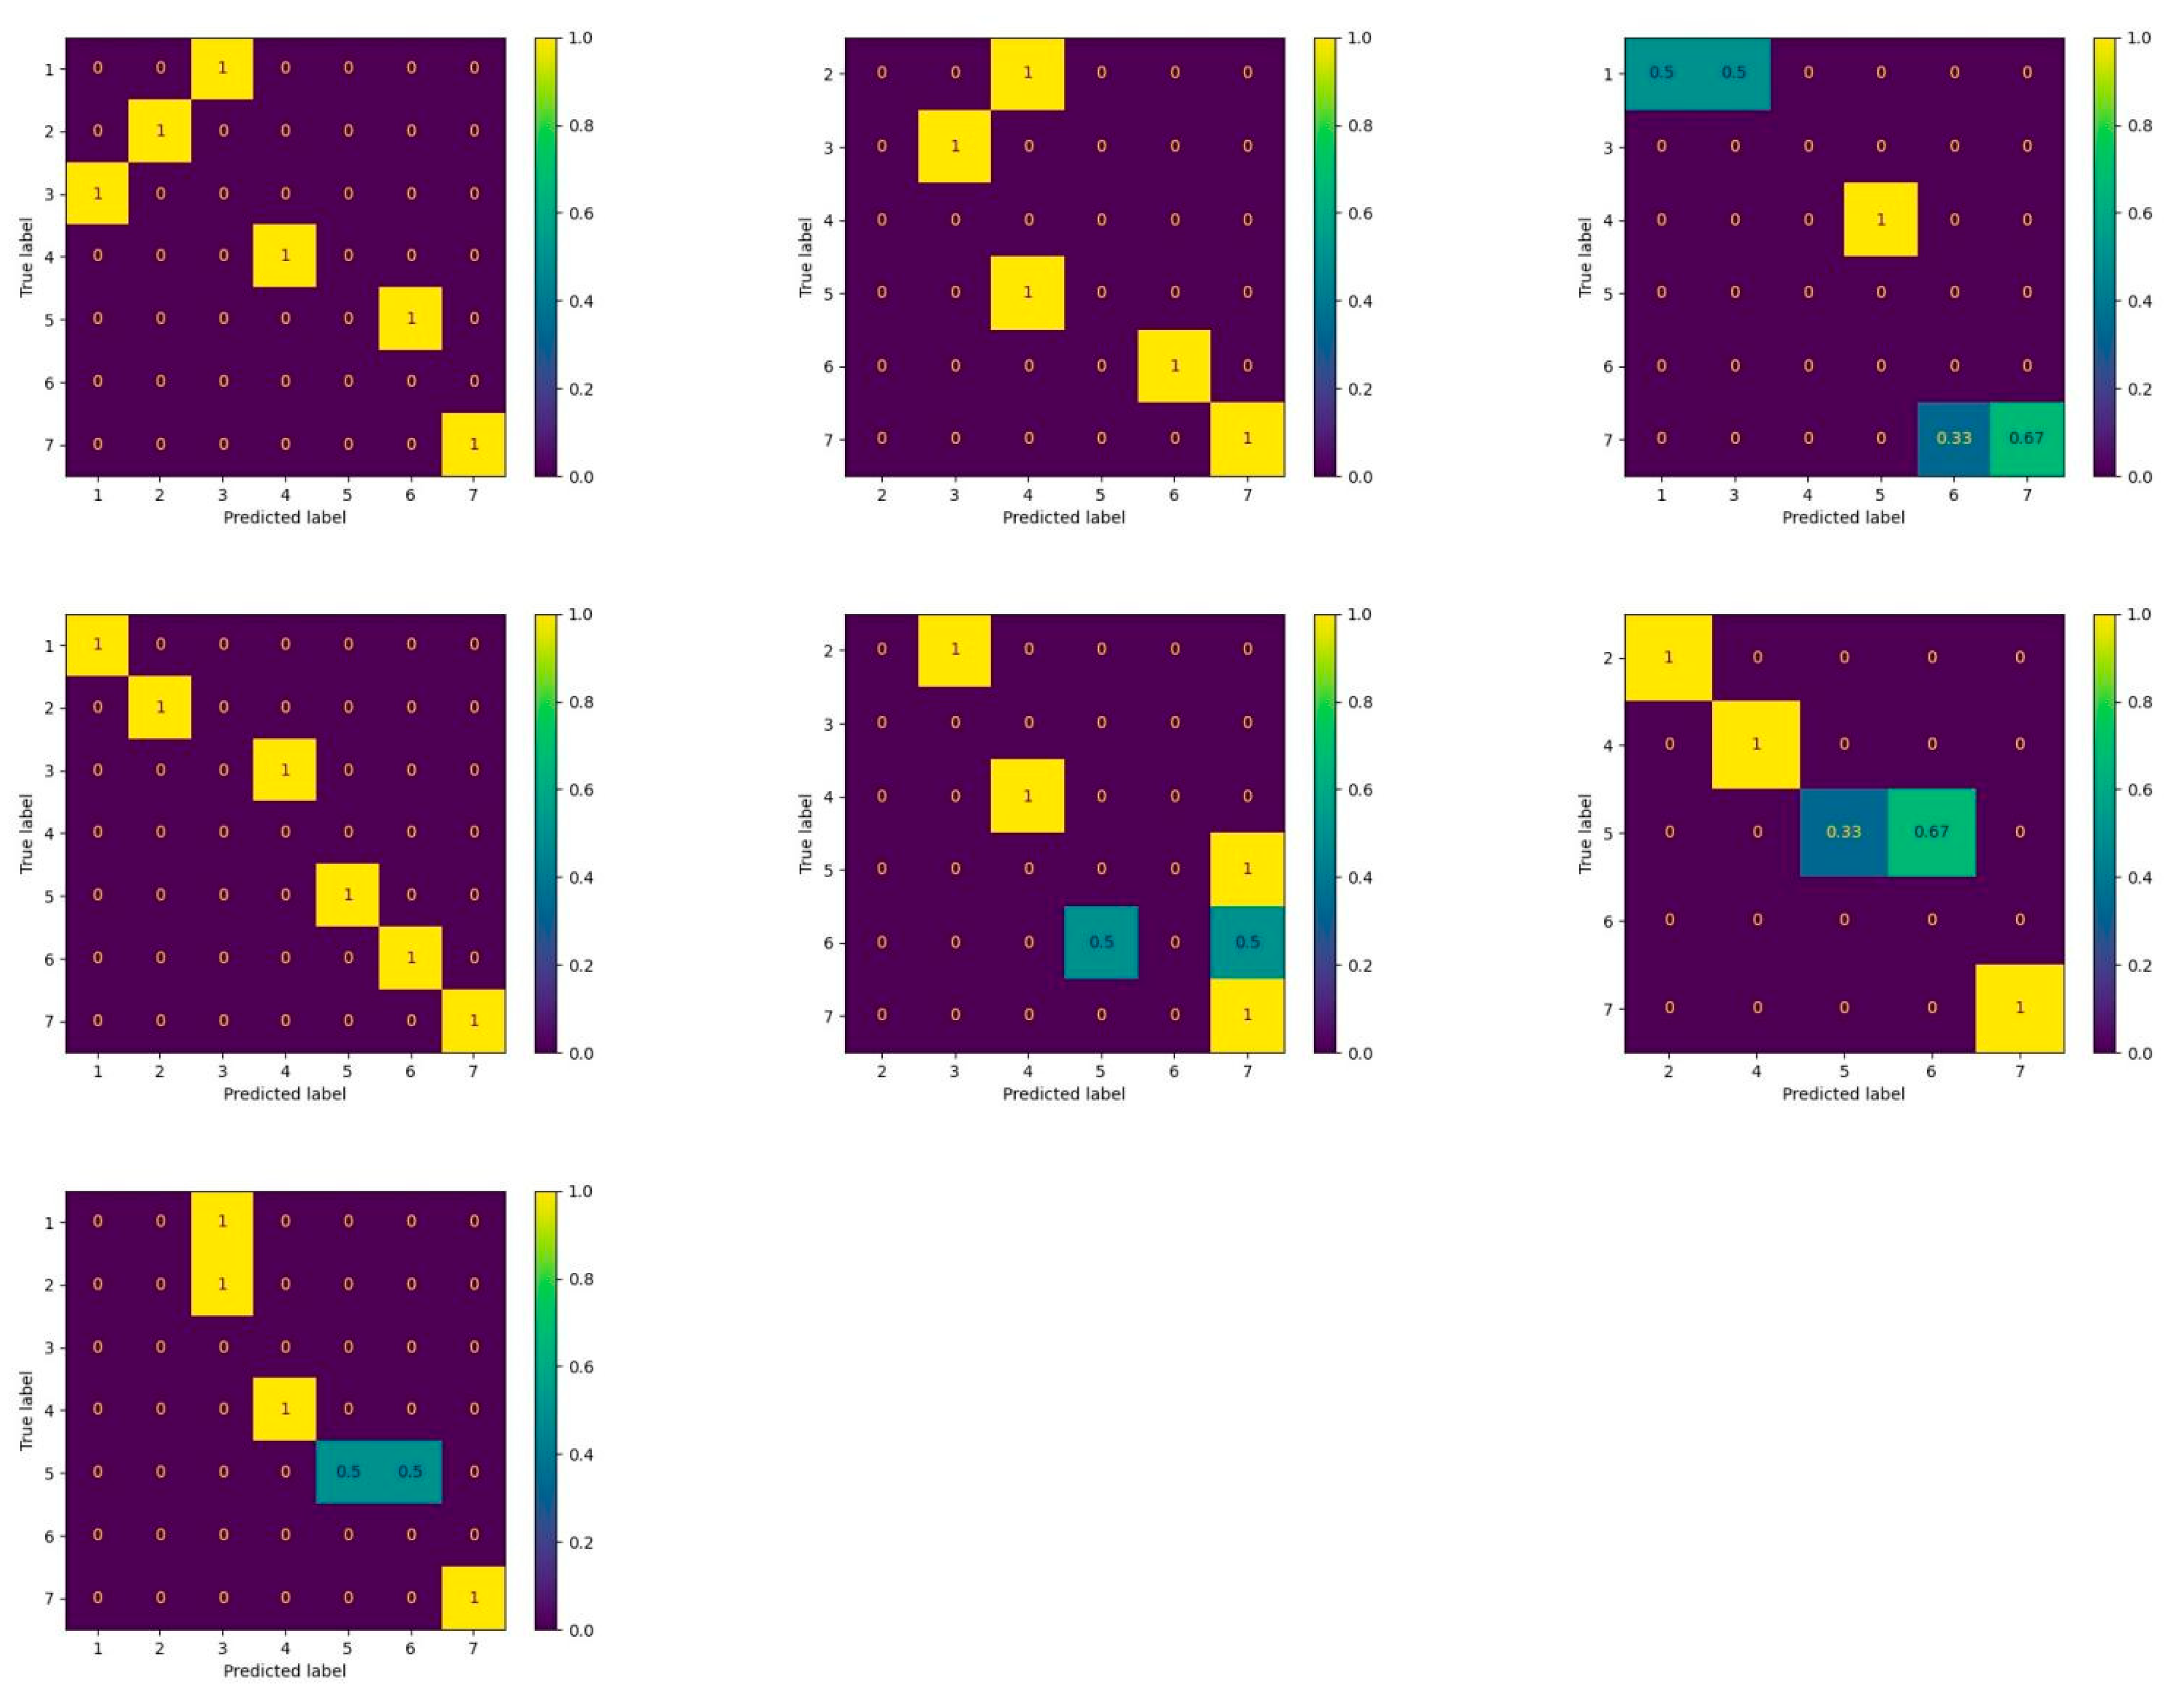
3.1. Year by Year Identification

We set the number of training sample for each year to be no less than one. The verification samples may not cover seven different years, but verification tests of 10 times cover all seven years. After running verification tests 10 times, each time, the obfuscation matrix was obtained as shown in Figure 3, and each year’s label corresponds to the times of prediction errors in Table 1. These charts show that ginseng at age 5 is more likely to be mispredicted and ginseng at age 7 has the highest prediction accuracy. The age of 5-year-old ginseng can be easily overestimated, and most of them are predicted to be 6 years old. Generally, ginseng increases rapidly in 3–4 years, and the growth rate will slow down after 4–5 years, which may be one of the reasons why 5- and 6-year ginseng can easily be mispredicted [30].
The 10-time validation test accuracy of year-by-year identification tests is shown in Table 2. The highest accuracy is 85.7%, but it fluctuates greatly. The lowest accuracy is only 42.9%, and its average accuracy is 60%. The change of different ginseng saponin contents is different with age, which may cause the results of each test to differ greatly [30].
For each training and test, random forest can provide the band’s importance. The year-by-year identification was repeated 10 times randomly, and their band importance is shown in Figure 4. By averaging the importance of 10 times, VNIR has 108 bands in total, accounting for 68.9% of the importance, especially between 900 nm and 1000 nm. SWIR has 288 bands in total, with only some contributions near 1940 nm and 2480 nm, accounting for a small proportion.
The year-by-year identification was divided into seven categories, and the samples were divided into verification data sets and test data sets. The number of training samples in some categories is 1 or 2. The number of samples prepared for the experiment is insufficient and the distribution in each year is uneven, which has a negative impact.

3.2. Identification between Food and Medicine

Based on the difference of selected test sample sets, food and medicine identification experiments were carried out 10 times randomly in Table 3, and the obfuscation matrix of each test was obtained, as shown in Figure 5. The identification between food and medicine could be classified as a dichotomous problem. Figure 5 shows that the total number of validation samples was 70, of which 5 were misidentified, 3 five-year-old ginsengs were misidentified as medicine, and 2 six-year-old ginsengs were misidentified as food. As shown in the VNIR bands, in Figure 2, we can observe that the spectral curves of ginseng with ages 5, 6, and 7 are mixed, but generally, all the spectral curves of ginseng at age 7 are at the bottom. Therefore, distinguishing 5- and 6-year-old ginseng is the most difficult because of their maximum spectral uncertainty. Among them, the highest accuracy is 100%, the lowest accuracy is 85.7%, and the average accuracy is 92.9%, as shown in Table 3.
The importance of spectral bands for was examined 10 times under the food and medicine classification scale, as shown in Figure 6. The VNIR band accounts for 92% of the importance, and SWIR only accounts for 8%. For the purpose of food and medicine identification, SWIR spectral bands can be abandoned. We used the same random forest identification method, and only used the 108 bands of VNIR in all sample data; the average accuracy of verification results could reach 90%. There are seven validation samples in total, and each error will lead to an error of 14.3%. Therefore, increasing the number of samples could still improve the identification accuracy of food and medicine identification. For the binary classification problem with a certain year as the boundary, the number of samples is enough to prove the validity of the proposed method; therefore, it is studied as the focus.

3.3. Differentiation and Identification of Five-Year Boundaries

In consideration of the difference between food and medicine, the misunderstanding is mainly caused by confusion between those at 5-year growth and those at 6-year growth; thus, we carried out discrimination identification with 5 years as the boundary (<5 or ≥5). The test accuracies of the 10-time experiment results are all 100%, and the importance of the spectral band is shown in Figure 7. By jointly considering the food and medicine identification results, we can conclude that 1-, 2-, 3-, 4-, and 7-year-old ginseng are easy to identify with spectral reflectance, but this is not the case with 5- and 6-year old ginseng.
Over the spectrum in 400–2500 nm, VNIR accounted for 98.1% of the importance, while SWIR accounted for 1.9%; we can regard SWIR as irrelevant. In Figure 2, we can also find spectrum aliasing in SWIR bands and clear year-to-year changes in VNIR bands. The 400 nm to 650 nm range accounted for 67% of the importance. For identification with a five-year boundary, the SWIR band can be ignored and only VNIR hyperspectral equipment needs to be used. The spectral reflectance characteristics of ginseng changed greatly in the fifth year. The chemical analysis of ginseng should pay attention to the changes of active components in the fifth year.

4. Conclusions

The proposed reflective spectroscopy method, which combines machine learning and spectral analysis, is fast, nondestructive, and simple to use for the identification of ginseng growth years. The random forest method, which has the advantage of assessing the importance of variables, is easy to implement for nonprofessional technical personnel and has a high precision classifier. Using 35 samples from 7 years, through the identification and spectral analysis of the random forest method, the following conclusions can be obtained.
(1) The accuracy of food and medicine identification was 92.9% when the food and medicine identification was distinguished by less than 6 years or not. Incorrect classification only occurred in the fifth and the sixth years and not in other years. Accuracy can reach 100% by using two types recognition less than 5 years or not. These two kinds of identification can be used at the same time to provide more identification information. The age identification accuracies are comparable to 94.8% of ginseng leaves by using Fourier transform infrared spectroscopy [14].
(2) For food and medicine differentiation and identification bounded by five years, only 400–1000 nm (VNIR) information is necessary, and 1000–2500 nm can be discarded. In VNIR, 400–650 nm is particularly important. The reason why VNIR is important is that the year’s information is not reflected in the shape of the spectral reflectance curve, but data processing in this study has completed relative and absolute radiometric correction, which is comparable in high and low values of reflectance. Therefore, when designing special instruments, it is not necessary to have very high spectral resolution in this band range, but there is a need to control the absolute precision of radiation measurements.
(3) The uncertainty of 5-year ginseng samples is high, indicating that the fifth year is a year with vigorous growth processes and the largest changes in ginseng are observed. Although, from the perspective of the spectrum, it is easier to identify using 5 years as the boundary, however, in traditional Chinese medicine, ginseng for no more than 5 years is regarded as food, and ginseng for 6 years or more is regarded as medicinal material, which fully take into account the instability of 5-year-old ginseng and ensures the accumulation of effective components. The traditional classification method of food and medicine by less 6 years or not is supported by the results of the hyperspectral study provided in this paper.
Although spectral information and random forest methods have been used, either individually or in combination, to investigate synthetic pharmaceutical drug molecules, their combined use has not been performed in the area of traditional Chinese medicine, particularly for ginseng quality surveillance. We used the method proposed to achieve the identification of ginseng as food and medicine. The age identification accuracy of the proposed method in this paper is equal to that of other methods using spectral information. The proposed method is mainly based on spectral data, so there is no damage induced toward ginseng samples. In addition, the implementation of this method does not require professional technicians or professional laboratories, which provides great convenience and expands the application’s scope. At the moment, only spectral information was used for ginseng growth year identification. However, hyperspectral data also include spatial information in two-dimensional images. The spectrum and image could be jointly used to obtain better accuracies in identification. More samples of different ages could be helpful to improve identification accuracy.

Author Contributions

Conceptualization, X.C. and S.L.; methodology, X.C. and L.Z.; software, X.C., Z.W., and R.Y.; validation, X.C. and T.S.; formal analysis, L.Z. and X.C.; investigation, X.C.; resources, L.Z. and S.L.; data curation, K.Z. and Y.Z.; writing—original draft preparation, X.C.; writing—review and editing, S.L. and T.S.; visualization, J.L. All authors have read and agreed to the published version of the manuscript.

Funding

This research was funded by the National Natural Science Foundation of China (Grant No. 82003901 and 61761021), National Key Research and Development Program of China (Grant No. 2019YFE0126600 and 2020YFE0200700), CACMS Innovation Fund (Grant No. CI2021A03902 and CI2021A03901) and Anhui Provincial Key Research and Development Project (Grant No. 2021003).

Institutional Review Board Statement

Not applicable.

Informed Consent Statement

Not applicable.

Data Availability Statement

The data that support the findings of this study are available from the corresponding author upon request.

Acknowledgments

The authors would like to acknowledge Xiaobo Zhang from Chinese Academy of Chinese Medical Sciences for his professional accreditation and for providing ginseng samples.

Conflicts of Interest

The authors declare no conflict of interest. The funders had no role in the design of the study; in the collection, analyses, or interpretation of data; in the writing of the manuscript; or in the decision to publish the results.

References

  1. Liang, J.; Jiang, C.; Peng, H.; Shi, Q.; Guo, X.; Yuan, Y.; Huang, L. Analysis of the age of Panax ginseng based on telomere length and telomerase activity. Sci. Rep. 2015, 5, 7985. [Google Scholar] [CrossRef] [PubMed]
  2. Zhu, L.; Xu, L.; Dou, D.; Huang, L. The distinct of chemical profiles of mountainous forest cultivated ginseng and garden ginseng based on ginsenosides and oligosaccharides. J. Food Compost. Anal. 2021, 104, 104165. [Google Scholar] [CrossRef]
  3. Chen, H.; Tan, C.; Lin, Z. Identification of ginseng according to geographical origin by near-infrared spectroscopy and pattern recognition. Vib. Spectrosc. 2020, 110, 103149. [Google Scholar] [CrossRef]
  4. Pisano, P.L.; Silva, M.F.; Olivieri, A.C. Anthocyanins as markers for the classification of Argentinean wines according to botanical and geographical origin. Chemometric modeling of liquid chromatography–mass spectrometry data. Food Chem. 2015, 175, 174–180. [Google Scholar] [CrossRef]
  5. Zhao, Z.; Liang, Z.; Ping, G. Macroscopic identification of Chinese medicinal materials: Traditional experiences and modern understanding. J. Ethnopharmacol. 2011, 134, 556–564. [Google Scholar] [CrossRef]
  6. Bai, H.; Wang, S.; Liu, J.; Gao, D.; Jiang, Y.; Liu, H.; Cai, Z. Localization of ginsenosides in Panax ginseng with different age by matrix-assisted laser-desorption/ionization time-of-flight mass spectrometry imaging. J. Chromatogr. B 2016, 1026, 263–271. [Google Scholar] [CrossRef]
  7. Savarino, P.; Demeyer, M.; Decroo, C.; Colson, E.; Gerbaux, P. Mass spectrometry analysis of saponins. Mass Spectrom. Rev. 2021, 1–30. [Google Scholar] [CrossRef]
  8. Yang, Y.; Yang, Y.; Qiu, H.; Ju, Z.; Shi, Y.; Wang, Z.; Yang, L. Localization of constituents for determining the age and parts of ginseng through ultraperfomance liquid chromatography quadrupole/time of flight-mass spectrometry combined with desorption electrospray ionization mass spectrometry imaging. J. Pharm. Biomed. Anal. 2021, 193, 113722. [Google Scholar] [CrossRef]
  9. Lee, D.G.; Lee, J.; Kim, K.-T.; Lee, S.-W.; Kim, Y.-O.; Cho, I.-H.; Kim, H.-J.; Park, C.-G.; Lee, S. High-performance liquid chromatography analysis of phytosterols in Panax ginseng root grown under different conditions. J. Ginseng Res. 2018, 42, 16–20. [Google Scholar] [CrossRef] [Green Version]
  10. Gafner, S.; Bergeron, C.; McCollom, M.M.; Cooper, L.M.; McPhail, K.L.; Gerwick, W.H.; Angerhofer, C.K. Evaluation of the efficiency of three different solvent systems to extract triterpene saponins from roots of Panax quinquefolius using high-performance liquid chromatography. J. Agric. Food Chem. 2004, 52, 1546–1550. [Google Scholar] [CrossRef]
  11. Popovich, D.G.; Kitts, D.D. Generation of ginsenosides Rg3 and Rh2 from North American ginseng. Phytochemistry 2004, 65, 337–344. [Google Scholar] [CrossRef] [PubMed]
  12. Liang, Z.; Chen, Y.; Xu, L.; Qin, M.; Yi, T.; Chen, H.; Zhao, Z. Localization of ginsenosides in the rhizome and root of Panax ginseng by laser microdissection and liquid chromatography–quadrupole/time of flight-mass spectrometry. J. Pharm. Biomed. Anal. 2015, 105, 121–133. [Google Scholar] [CrossRef] [PubMed]
  13. Qin, J.; Leung, F.C.; Fung, Y.; Zhu, D.; Lin, B. Rapid authentication of ginseng species using microchip electrophoresis with laser-induced fluorescence detection. Anal. Bioanal. Chem. 2005, 381, 812–819. [Google Scholar] [CrossRef] [PubMed]
  14. Kwon, Y.-K.; Ahn, M.S.; Park, J.S.; Liu, J.R.; In, D.S.; Min, B.W.; Kim, S.W. Discrimination of cultivation ages and cultivars of ginseng leaves using Fourier transform infrared spectroscopy combined with multivariate analysis. J. Ginseng Res. 2014, 38, 52–58. [Google Scholar] [CrossRef] [Green Version]
  15. Woo, Y.; Cho, C.; Kim, H.; Yang, J.; Seong, K. Classification of cultivation area of ginseng by near infrared spectroscopy and ICP-AES. Microchem. J. 2002, 73, 299–306. [Google Scholar] [CrossRef]
  16. Chung, S.; Yoon, S.-C. Detection of Foreign Materials on Broiler Breast Meat Using a Fusion of Visible Near-Infrared and Short-Wave Infrared Hyperspectral Imaging. Appl. Sci. 2021, 11, 11987. [Google Scholar] [CrossRef]
  17. Chen, H.; Lin, Z.; Tan, C. Fast discrimination of the geographical origins of notoginseng by near-infrared spectroscopy and chemometrics. J. Pharm. Biomed. Anal. 2018, 161, 239–245. [Google Scholar] [CrossRef]
  18. Aboonajmi, M.; Abbasian Najafabadi, T. Prediction of poultry egg freshness using Vis-NIR spectroscopy with maximum likelihood method. Int. J. Food Prop. 2014, 17, 2166–2176. [Google Scholar] [CrossRef]
  19. Kumaravelu, C.; Gopal, A. Detection and quantification of adulteration in honey through near infrared spectroscopy. Int. J. Food Prop. 2015, 18, 1930–1935. [Google Scholar] [CrossRef]
  20. Brereton, R.G.; Jansen, J.; Lopes, J.; Marini, F.; Pomerantsev, A.; Rodionova, O.; Roger, J.M.; Walczak, B.; Tauler, R. Chemometrics in analytical chemistry—part I: History, experimental design and data analysis tools. Anal. Bioanal. Chem. 2017, 409, 5891–5899. [Google Scholar] [CrossRef]
  21. Smith, G.M.; Milton, E.J. The use of the empirical line method to calibrate remotely sensed data to reflectance. Int. J. Remote Sens. 1999, 20, 2653–2662. [Google Scholar] [CrossRef]
  22. Aasen, H.; Honkavaara, E.; Lucieer, A.; Zarco-Tejada, P.J. Quantitative remote sensing at ultra-high resolution with UAV spectroscopy: A review of sensor technology, measurement procedures, and data correction workflows. Remote Sens. 2018, 10, 1091. [Google Scholar] [CrossRef] [Green Version]
  23. Suomalainen, J.; Oliveira, R.A.; Hakala, T.; Koivumäki, N.; Markelin, L.; Näsi, R.; Honkavaara, E. Direct reflectance transformation methodology for drone-based hyperspectral imaging. Remote Sens. Environ. 2021, 266, 112691. [Google Scholar] [CrossRef]
  24. Wang, C.; Myint, S.W. A simplified empirical line method of radiometric calibration for small unmanned aircraft systems-based remote sensing. IEEE J. Sel. Top. Appl. Earth Obs. Remote Sens. 2015, 8, 1876–1885. [Google Scholar] [CrossRef]
  25. Iqbal, F.; Lucieer, A.; Barry, K. Simplified radiometric calibration for UAS-mounted multispectral sensor. Eur. J. Remote Sens. 2018, 51, 301–313. [Google Scholar] [CrossRef]
  26. Ham, J.; Chen, Y.; Crawford, M.M.; Ghosh, J. Investigation of the random forest framework for classification of hyperspectral data. IEEE Trans. Geos. Remote Sens. 2005, 43, 492–501. [Google Scholar] [CrossRef] [Green Version]
  27. Pan, S.; Zhang, H.; Li, Z.; Chen, T. Classification of Ginseng with different growth ages based on terahertz spectroscopy and machine learning algorithm. Optik 2021, 236, 166322. [Google Scholar] [CrossRef]
  28. Zhou, W.; Yang, H.; Xie, L.; Li, H.; Huang, L.; Zhao, Y.; Yue, T. Hyperspectral inversion of soil heavy metals in Three-River Source Region based on random forest model. Catena 2021, 202, 105222. [Google Scholar] [CrossRef]
  29. Zeng, X.; Martinez, T.R. Distribution-balanced stratified cross-validation for accuracy estimation. J. Exp. Theor. Artif. Intell. 2000, 12, 1–12. [Google Scholar] [CrossRef]
  30. Shi, W.; Wang, Y.; Li, J.; Zhang, H.; Ding, L. Investigation of ginsenosides in different parts and ages of Panax ginseng. Food Chem. 2007, 102, 664–668. [Google Scholar] [CrossRef]
Figure 1. True color composite image extracted from hyperspectral image of ginseng sample.
Applsci 12 05852 g001
Figure 2. The spectral reflectance of ginseng samples. Ages from 1 to 7 years are marked as different colors. There are 35 samples in total. For the different illuminating angles between VNIR and SWIR cameras, the curve shows a fault on 1000 nm, which can be neglected for fixed viewing and illuminating conditions for every sample.
Applsci 12 05852 g002
Figure 3. The obfuscation matrix of 10 verification tests. The horizontal and vertical coordinates, respectively, represent the predicted and real years of ginseng. The values on the diagonal refer to the percentage of correct label predictions; other values that are not on the diagonal include the percentage of labels that are incorrectly predicted for the corresponding year label.
Applsci 12 05852 g003aApplsci 12 05852 g003b
Figure 4. The importance of spectral band under one year classification scale provided by random forest. The colorful curves have ten colors in total from experiments repeated 10 times.
Applsci 12 05852 g004
Figure 5. The obfuscation matrix of identification tests performed 10 times between food and medicine. The horizontal and vertical coordinates, respectively, represent the predicted and real years of ginseng, and 0 is ginseng at 1–5 years, and 1 represents ginseng at 6–7 years. The values on the diagonal refer to the number of correct label predictions; other values that are not on the diagonal include the number of labels that are incorrectly predicted for the corresponding year label.
Applsci 12 05852 g005
Figure 6. The importance of spectral band under food or medicine classification scale provided by random forest. The colorful curves have ten colors in total from experiments repeated 10 times.
Applsci 12 05852 g006
Figure 7. The importance of spectral bands under younger than 5 years or not provided by random forest.
Applsci 12 05852 g007
Table 1. Each year’s label corresponds to the times of prediction errors.
Year LabelError Times
14
23
33
43
59
65
71
Table 2. The recognition accuracies under a one-year classification scale.
RoundsAccuracy (%)Average Accuracy (%)
171.460
242.9
357.1
457.1
571.4
642.9
785.7
842.9
971.4
1057.1
Table 3. The recognition accuracies under food or medicine classification scale.
RoundsAccuracy (%)Average Accuracy (%)
110092.9
285.7
385.7
485.7
585.7
6100
7100
885.7
9100
10100
Publisher’s Note: MDPI stays neutral with regard to jurisdictional claims in published maps and institutional affiliations.

