
Quality Prediction in Directed Energy Deposition Using Artificial Neural Networks Based on Process Signals


1
Institute of Machine Tools and Factory Management, Technical University Berlin, Straße des 17. Juni 135, 10623 Berlin, Germany
2
Fraunhofer Institute of Production Systems and Design Engineering (IPK), Pascalstraße 8-9, 10587 Berlin, Germany
3
Federal Institute of Materials Research and Testing (BAM), Unter den Eichen 87, 12205 Berlin, Germany
*
Author to whom correspondence should be addressed.
Appl. Sci. 2022, 12(8), 3955; https://doi.org/10.3390/app12083955
Submission received: 21 March 2022
/
Revised: 6 April 2022
/
Accepted: 12 April 2022
/
Published: 14 April 2022
(This article belongs to the Topic Additive Manufacturing)
Abstract
:The Directed Energy Deposition process is used in a wide range of applications including the repair, coating or modification of existing structures and the additive manufacturing of individual parts. As the process is frequently applied in the aerospace industry, the requirements for quality assurance are extremely high. Therefore, more and more sensor systems are being implemented for process monitoring. To evaluate the generated data, suitable methods must be developed. A solution, in this context, was the application of artificial neural networks (ANNs). This article demonstrates how measurement data can be used as input data for ANNs. The measurement data were generated using a pyrometer, an emission spectrometer, a camera (Charge-Coupled Device) and a laser scanner. First, a concept for the extraction of relevant features from dynamic measurement data series was presented. The developed method was then applied to generate a data set for the quality prediction of various geometries, including weld beads, coatings and cubes. The results were compared to ANNs trained with process parameters such as laser power, scan speed and powder mass flow. It was shown that the use of measurement data provides additional value. Neural networks trained with measurement data achieve significantly higher prediction accuracy, especially for more complex geometries.
1. Introduction
In recent years, additive manufacturing has increased in relevance due to function- and weight-optimized designs, and the individualization of products in combination with shorter product life cycles [1]. For these reasons, additive manufacturing processes such as Directed Energy Deposition (DED) are becoming more and more important in industrial applications [2]. With DED, metal geometries can be rapidly built up by locally welding a powder or wire material onto substrates or existing components [3].
Various factors influence the welding result in DED: laser power, scan speed, spot diameter and the feed rate of the filler material are the main factors to consider. In addition, the working distance to the substrate, the amount of shielding and carrier gas, the cooling times and the preheating phases can also affect the quality of the produced component [4]. Additive manufacturing processes are primarily used in the aerospace industry, as they are still expensive production processes [5]. Quality standards are consequently high. To increase economic efficiency, expensive post-process quality checks must be reduced. Data-driven quality assurance is a possible approach for this. The aim is to ensure comprehensive documentation of the process. In this context, each production step is evaluated by algorithms that analyze sensor data to provide evidence of the product’s quality [6].
Artificial neural networks (ANN) represent a tool for digital quality assurance in the DED process. They map complex processes in the form of a black box and learn to predict target values based on defined input data [7]. The structure of neural networks consists of different layers: the input layer, the hidden layer or layers, and the output layer. Each layer consists of neurons that are connected by weights. The ANN can be designed associatively (the input data are related to the output data) or abstractly (predictions about unlearned samples) [8].
Existing studies for the application of ANNs in the DED process focus either on the prediction of optimal welding parameters [9,10], process monitoring and the prediction of measurement data [11,12], or the correlation of quality characteristics. There is currently high research potential, particularly regarding the correlation of component properties, as previous investigations only consider tracks and do not provide results on coatings or additive components. Moreover, process signals are not yet widely used to correlate quality characteristics using ANNs. S. Saqib et al. [13] show, in their work, that ANNs can predict the weld geometry based on laser power, feed rate, powder mass flow and focus position with an accuracy of 96.3%. Mondal et al. [14] achieved an accuracy of nearly 96% for the prediction of track width and burn-in depth with the use of an ANN. The track height could only be predicted with an accuracy of 72% [15]. Another approach for using ANNs in the DED process is the prediction of optimal welding parameters. Guo et al. [16] demonstrated how the weld bead geometry and hardness can be used as input to predict parameter combinations of laser power, velocity and powder mass flow. The trained neural network achieved an accuracy of around 90%.
The accuracy of ANNs always depends on the given input data that are used for the training and test runs. In particular, extrapolations of target variables outside the considered data range are almost impossible with the current models [17]. On the one hand, this is caused by the limited number of data points used and, on the other hand, it is caused by the static input parameters in the form of welding parameters. Studies show that ANNs can process all kinds of information as input data. Therefore, in addition to welding parameters, prepared process signals can be used to increase the performance and the robustness of the algorithms. This approach is already being practiced in other welding processes [18] and should now be transferred to the DED process. One main task is the preparation of the data and the associated selection of relevant features [19].
In the DED process, a variety of sensors can be used for process monitoring. Most of them are optical systems that detect emissions in a specific wavelength range. They are comparatively easy to handle and are inexpensive [20]. Essential information for the evaluation and control of a build-up process is often obtained from the temperature and its distribution, as well as the melt pool geometry.
Generated measurement data consist of dynamic curves. To train an ANN, static features must be extracted from those curves. This procedure is known as feature extraction and can be realized in different ways [21]. In addition to manually selecting common and simple mathematically and physically explainable features, automated feature extraction carried out, for example, by using the python package tsfresh, has become increasingly popular in recent years [22].
Until now, there have been few studies in the literature on the consideration of measurement data by ANNs for quality assurance in the DED process. Ren et al. [23] show, in their work on the aluminum alloy Al7075, how promising this approach is. They use an Artificial Intelligence (AI) technique based on the process data from emission spectroscopy to predict the component quality. In this context, the importance of data preparation and appropriate feature extraction is demonstrated. However, it is also shown that there is no standardized procedure.
This study investigates the influence of measurement data on the accuracy of ANNs in the DED process. In addition to welding parameters, various measurement data from different sensors are used as a data basis. A combination of different sensors offers the possibility to create a large information base for different quality characteristics. It is necessary to identify significant features from dynamic measurement series to make them usable in the ANN application. The preparation of data, especially measurement data, is an important and critical step in data analysis for ANNs, and has a significant impact on ANN accuracy. In the context of this work, focus is placed on feature analysis, as methods for the practical application case have not been sufficiently represented in the state of the art so far. Furthermore, based on the evaluated features, ANNs are trained and validated for three different geometries. The results are compared with an ANN based on welding parameters alone. Finally, the added value of measurement data in ANNs for the DED process is evaluated.
2. Materials and Methods
2.1. Experimental Procedure
2.1.1. Process Setup
The experimental tests were performed on a TRUMPF TruLaserCell 7020 with a 2 kW Yb: YAG disk laser and a wavelength of 1030 nm. The processing head was equipped with a coaxial ring jet nozzle that had an ideal working distance to the substrate of 9 mm. The nickel alloy Inconel 718 was used as substrate material and a filler material. It is a widely used material in gas turbines and turbochargers, as well as in additive manufacturing applications [5]. The substrate plate had a dimension of 300 × 300 × 10 mm3. Sets of 50 weld beads, 50 coatings and 50 cubes were built. The parameter combinations were randomly selected as recommended in [10]. The process window is shown in Table 1. Based on the results of the weld beads, it was ensured that the process window for coatings and cubes guaranteed at least sufficient material bonding with the substrate.
2.1.2. Sensors
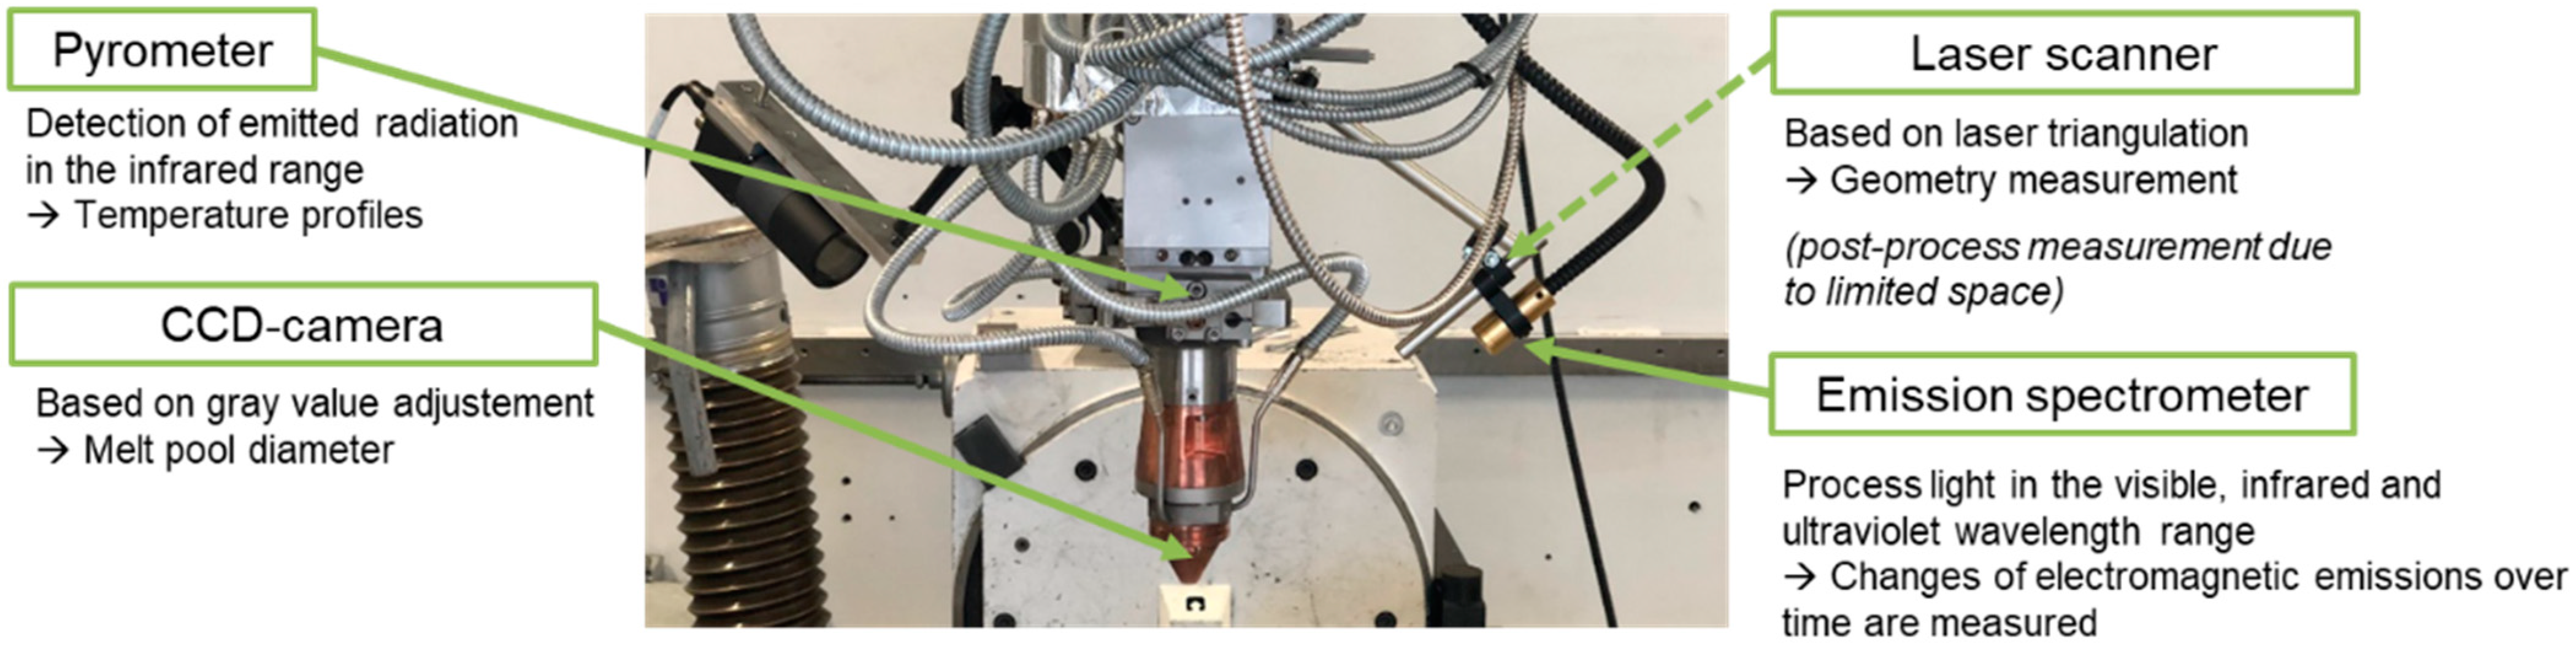
Measurement data were generated by a pyrometer, a CCD camera, an emission spectrometer and a laser scanner. The measurement setup is shown in Figure 1.
Pyrometers allow conclusions to be drawn about the temperature of an object based on the measurement of infrared radiation. The material-specific emissivity must be considered [20]. The use of this sensor system in DED is known from a variety of publications [24,25]. In this work, the quotient pyrometer Sensortherm Metis H311 was used in a coaxial configuration. A material emissivity of 1.02 was determined for the alloy Inconel 718.
A CCD sensor (CCD = Charge-Coupled Device) generates an electrical signal proportional to the amount of incoming light and converts it into digital video signals. In the DED process, this enables an observation of the melt pool [4]. In the context of this work, the monochrome CCD camera module CF 8/5 MX was mounted on the focusing optics of the laser system. The recorded images were processed by a self-developed computer program. In the first step, the contour of the melt pool was extracted. Based on this, geometric parameters could be measured. In this work, information about the diameter and its change over the process time were used.
Welding processes such as laser beam welding emit process light in the visible, infrared and ultraviolet spectra. Specific changes in this process light can indicate welding defects. We used a process observer from Plasmo GmbH, which enables the detection of these changes [26].
Methods of laser position detection are based on the principle of laser triangulation. They are usually applied for weld tracking, distance measurement and the detection of simple contours [27]. In this work, the scanControl 2500 laser scanner from Micro Epsilon was used after the build-up process to measure geometric dimensions.
2.1.3. Data Preparation
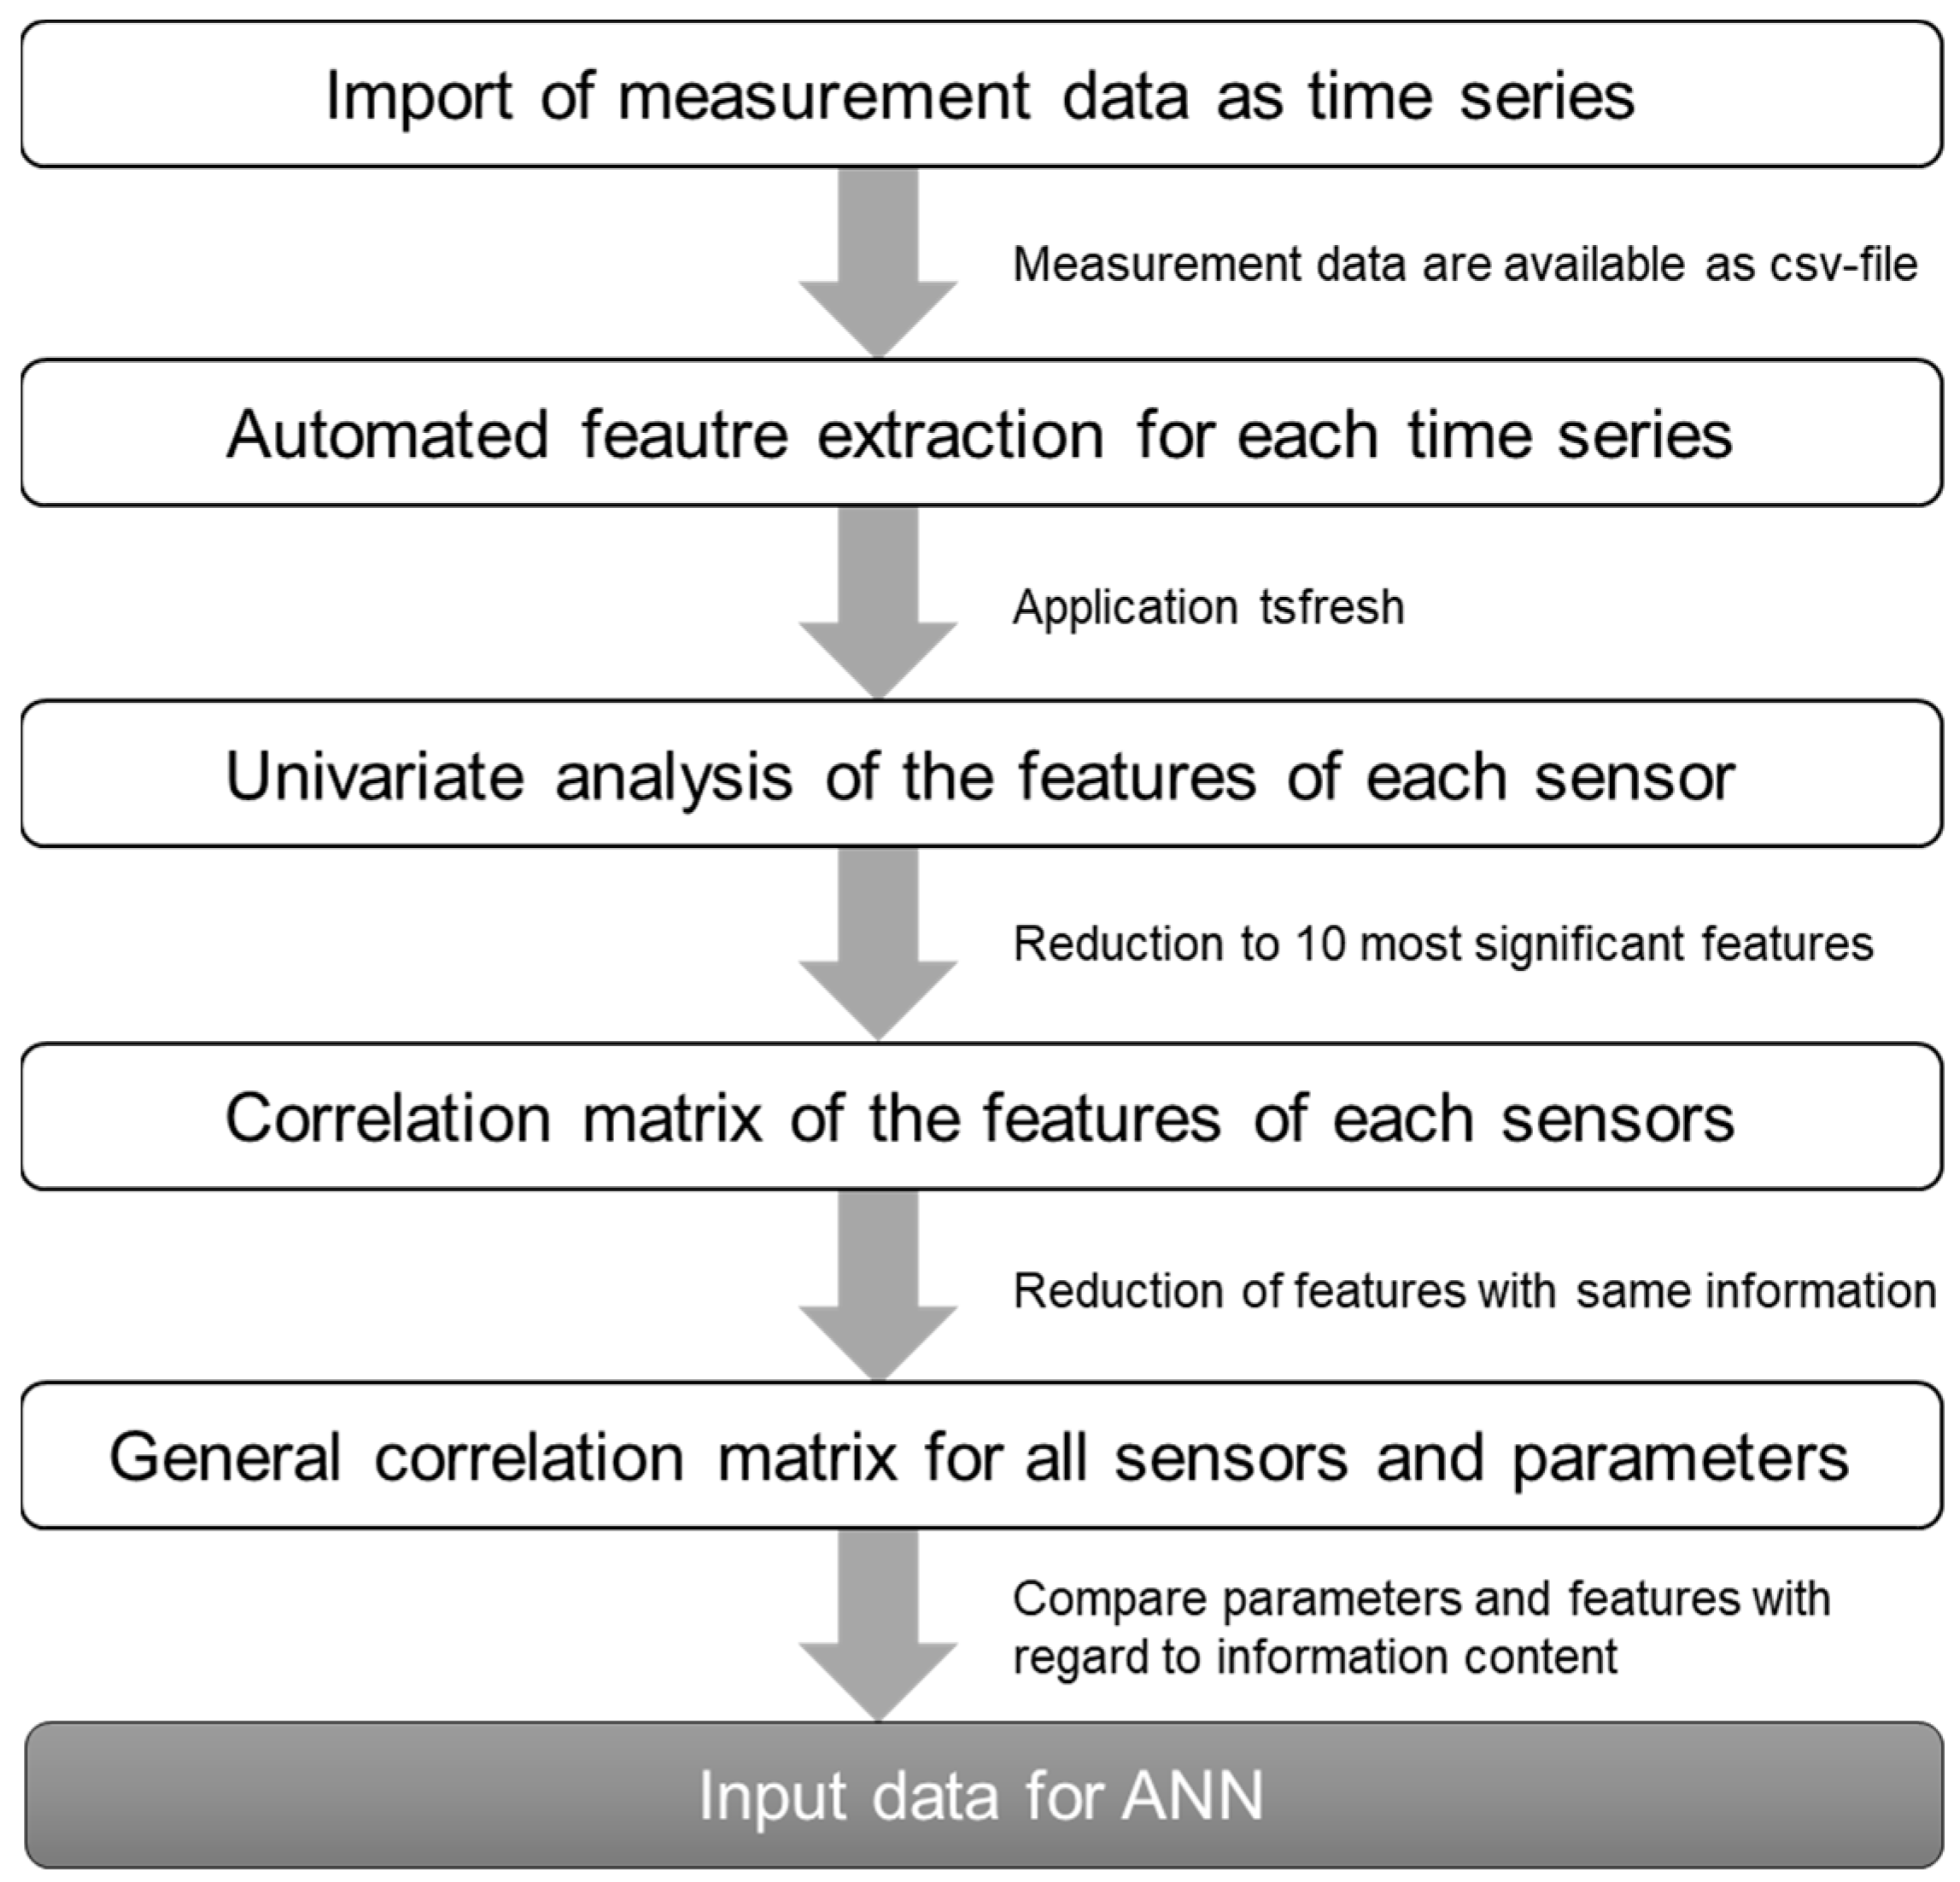
Data preparation in the field of AI is carried out to create a data set suitable to train artificial neural networks, for instance. In this work, in addition to the process parameters, measurement data were made available as inputs. The Python package “tsfresh” was applied to automatically extract several hundreds of features from the measurement data. They had to be analyzed, and the number of features had to be considerably reduced to make sure that only relevant information was given into the network. Figure 2 represents the procedure applied in the context of this work.
As can be seen in Figure 2, univariate analysis and correlation matrices were used as tools to select the ideal features from those originally extracted with tsfresh. The aim was to significantly limit the number of input neurons in each case.
2.1.4. Artificial Neural Networks
For each geometry, an ANN was trained and evaluated, with and without consideration of the measurement data, using the open-source software Python, as well as its machine learning framework PyTorch. Depending on whether the measurement data were considered or not, the number of input neurons was determined by the number of relevant features according to the feature analysis or the number of process parameters. Moreover, a single hidden layer with 5 neurons was chosen. In the past, the number of hidden layers and neurons has been mostly determined using a trial-and-error method. There has been a constant attempt by researchers to replace this time-consuming method with exact approaches to optimize the number of hidden layers and neurons. Nevertheless, in this case, a trial-and-error approach was sufficient, since the data set used to train the ANN was comparatively small and the goal was to compare neural networks with the same design for different input data, instead of optimizing a single ANN for a specific use case. The number of neurons in the output layer was always 3, as the quality categories of all data points were converted into numerical values: good (2), medium (1) and poor (0). Thus, setting the number of neurons in the hidden layer to 5 also ensured that it was between the number of neurons in the input and output layers.
In addition to the topology of the networks, the activation function, the loss function and the optimization algorithm are essential hyper-parameters that influence the functionality of ANN. This work was based on the comparatively simple and often-used activation function, Rectified Linear Unit [28]. Furthermore, because a categorical target variable was used, the common loss function Cross-Entropy Loss was applied in the training phase to determine the error between the predicted and actual quality categories. As it has proven successful in other applications, especially in classification tasks, the Adam optimizer was selected to update the weights between the neurons [29]. The validation was performed using the train-and-test approach. In this method, the data sets are divided up. In this work, the data were divided up into training, test and validation data, with a percentage ratio of 70/10/20.
3. Results and Discussion
3.1. Welding Results
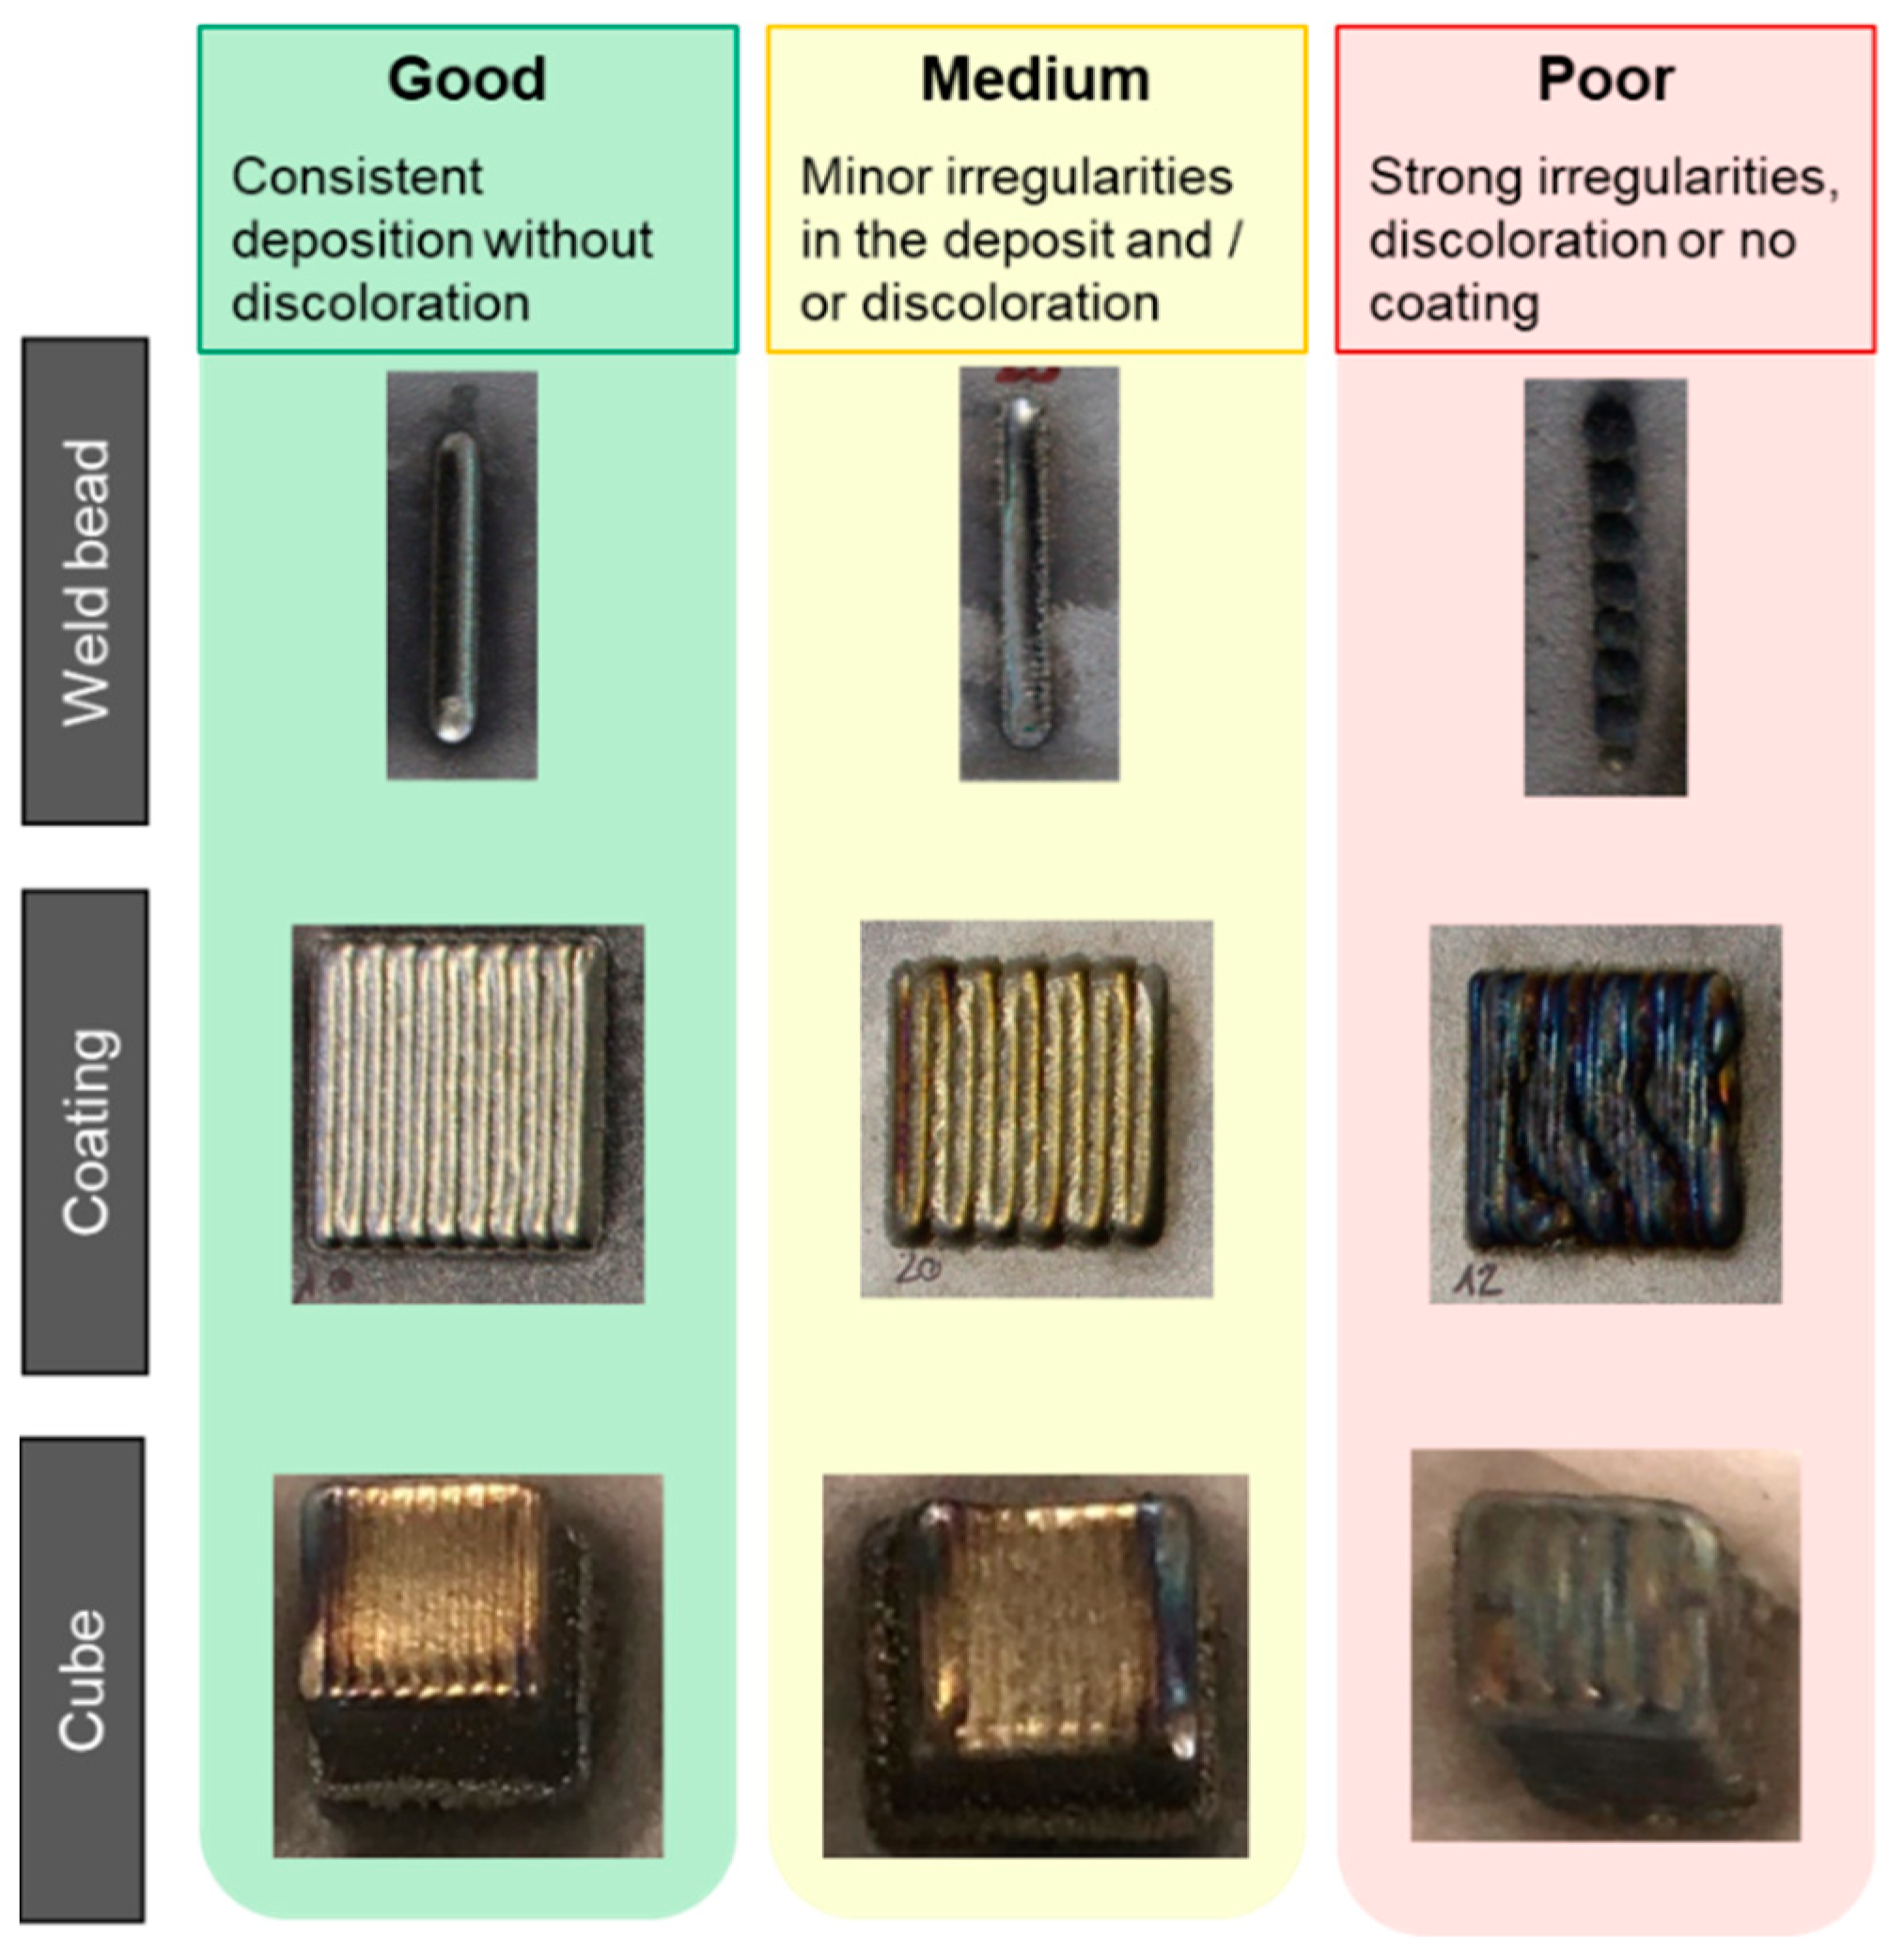
Fifty samples of each geometry (weld beads, coatings and cubes) were produced. It was ensured that a large random variation would provide a good data base for the artificial neural networks. For this reason, approximately the same ratio was generated from each category (good, medium, poor). Figure 3 exemplifies one sample from each geometry and category.
Quality characteristics are different for individual applications and geometries. In practice, additively manufactured components are often compared with cast components. In this case, a visual inspection according to DIN EN 13018 [30] was used for quality assessment. This includes surface defects such as cracks, shrinkage cavities, gas pores or non-metallic inclusions, as well as a dimensional inspection. Typical defects in the DED process are pores, fine holes, poor bonding, spatter and microcracks in a layer. Due to the multilayer structure, these can lead to deviations in the shape of the entire structure, as well as to a change in the melt bath properties.
Categorization is one way of combining various target variables. The machine operator often decides, based on experience, if the welding result is sufficient or not. This procedure was used to evaluate the results of this work. The categories were selected in consultation with practice users. To ensure objective validation, the categorization was performed independently by three different operators. In the case of results that could not be classified unambiguously, a consensus was reached. The aim here was to reflect practice as closely as possible.
3.2. Data Preparation
The importance of good data preparation is well known [19,23], but there is no standardized procedure for data preparation yet [21]. It is often an iterative process to figure out how to create the best database for an ANN, especially in the early phase of model development. By applying the approach shown in Figure 2 on all the geometries, and by analyzing the obtained results, it could be verified as suitable for feature extraction and analysis in DED applications. The individual methods are explained in the following paragraphs.
The first step of the data preparation is the import of measurement data as time series. Next, an automated feature extraction algorithm (tsfresh) is applied to obtain discrete values from the individual measurement series. It is already established in other applications [22]. Thus, about 800 features are calculated for each sensor and there are about 3200 feature values for each data point. Theoretically, a network could process this large amount of information, but it is not useful for practical applications. On the one hand, a high number of input values would make a larger data set necessary to identify correlations between input and output. On the other hand, redundant information is included, which would hinder and impair the training of the ANN. Therefore, a reduction in features is necessary. Simple and plausible physical and mathematical quantities that can be easily explained are desirable for the later evaluation. These include, for example, deviations from the mean value and linear trends. At the same time, however, the characteristics should reflect the relationship between the input and output variables as well as possible. In this context, complex quantities that are not obvious or easily physically explainable, such as Fourier coefficients, are also identified.
With a univariate analysis, a simple procedure is applied to individually examine the influence of each feature on the target value and to calculate individual scores. The higher the score, the more significant the influence of the according feature on the output variable. Regarding the correlation statistics, a differentiation is made between numerical and categorical inputs: an ANOVA is carried out for numerical features, whereas Chi2 is required for categorical features. This distinction is important for determining the significance of the respective feature. The significance indicates the strength of the relationship between the feature and the target variable. In the context of this work, a ranking of features was created, and the 10 highest-listed features were retained, while the rest were no longer considered. To realize this kind of sortation, the desired feature quantity, as well as a specific significance level, can be used as a criterion.
Next, the remaining features of all the measurement data series are brought together and compared in a correlation matrix. Such a matrix examines the correlation of two characteristics to each other without considering the target value. The correlation is represented by numbers from −1 to +1. For −1 there is a strong anti-proportional correlation between two features, while for 1, the correlation is strongly proportional. The closer the number is to 0, the lower the correlation. If a considerable correlation is found between two features, the feature with the lower significance based on the univariate analysis is removed. Again, depending on the specific situation, the sortation can either be executed by defining a specific number of final features or by defining a threshold for the correlation value. In the context of this work, all correlations with an absolute value greater than 0.5 were reviewed and checked. The goal is to reduce the number of redundant features that provide little additional information gain. The correlation matrix is applied in two stages. First, the correlation matrix is applied to the features of a single sensor. Subsequently, with a minimized number of features, a total correlation analysis is carried out with respect to the features of all sensors.
In the last step, another univariate analysis with respect to the target variable is performed including all the selected features, as well as the process parameters such as laser power, powder mass flow and scan speed. Based on this last univariate analysis, the final input data set is generated. The described feature extraction was performed for each geometry individually.
3.3. Feature Analysis
The feature analysis performed on the measurement data of the weld beads resulted in a total of 7 input variables. An overview of the identified features, ranked by significance, is shown in Table 2.
Two features of the laser scanner have the highest information content: the longest strike above mean and the count below mean. The first feature indicates the length of the longest sequence of values that are higher than the mean value of the time series. The second feature describes the number of values in a measuring sequence that are smaller to the mean value. Therefore, both values reflect whether a weld bead shows a uniform course. Possible defects such as an increase at the ends or a dip in the middle of the weld bead can be identified by the selected features. The uniformity of a weld bead can also be described by the course of the ratio between the bead width and bead height; these are target values that are often examined as quality characteristics [13].
The median temperature measured by the pyrometer is also of high significance. If it is too low, not enough powder is melted. In contrast, excessive power is applied if the temperature exceeds a certain limit. This can, on the one hand, lead to tarnishing, and on the other hand, to powder melting irregularly. The quotient of laser power and powder mass flow defines the melted powder mass. Thus, both process parameters are considered to be important features.
For the Plasmo sensor system, the change quantiles and linear trend are significant features. Change quantiles describes the average change of measured values in a certain frequency range. The linear trend represents a linear regression of the measurement series and indicates that the overall trend of measured values is important. Both features can be explained in physical terms by considering the sensor’s functionality; changes in the emitted process light indicate irregularities in the process.
The measuring data of the process camera were not considered due to low significance. The reason for this is the comparatively short welding time for a weld bead. Moreover, at the beginning and end of a welding process, a process glow occurs that falsifies the results of the applied image-processing algorithm. A substantial lengthening of the weld bead would be inappropriate given the effort.
The relevance of features depends on the geometry that is built up. For the coatings, the feature analysis identified different significant features than for the weld beads. The six relevant features of the coatings are listed in Table 3.
As with the weld beads before, the laser scanner also provides the most important information for coatings. In this case, sum values are the integral over the cross-sectional area of the coating. The feature contains information about the size and height and, thus, the dimension of the coating. One explanation for the strong quality correlation is the non-uniform deposition of the coatings if their heights exceed a certain limit.
The second most significant feature for coatings was extracted from the measurement data of the Plasmo sensor system. The count above mean indicates the number of values in the measurement series that are higher than the average value. These amplitudes are caused by increased light reflections and process lightning. They either occur if the introduced laser power is too high or if the powder is melted irregularly. In both cases, poor coatings with a strong tarnish or wavy surface are the consequence. The identified feature of count above mean takes both cases into account.
The CWT coefficient (CWT = continuous wavelet transformation) extracted from the melt-pool diameter measurement series is also considered significant. It is a way to represent the changing characteristics of non-stationary signals by decomposing the signal into wavelets. Wavelets are oscillations that appear in a short time section. Thus, stationary recurring parts of a signal can be detected. In the context of coatings, the CWT coefficient correlates with the uniformity of recurring subsections in the measurement data during the deposition of individual weld beads. It can be concluded that there is a correlation between the melt-pool diameter development of the individual beads and the overall quality of the coating.
The entropy of the temperature data recorded by the pyrometer describes the complexity of the temperature curve. It is a measure of randomness for data series and contains information about the information gained with every new data point in the series with respect to the previously recorded points. Therefore, a high entropy of the temperature data indicates an unsteady temperature curve and, thus, irregularities in the whole build-up process.
For coatings, all the extracted features are connected to laser power distribution and the general uniformity of the deposition process. Since laser power was already covered by features extracted from the measurement data, it was not included as an explicit feature. As for the weld beads, the quotient of laser power and powder mass flow defined the melted powder mass. Thus, powder mass flow was added as a feature. Moreover, the energy per unit length, defined as the ratio of laser power and scan speed, was a key factor for the deposition of coatings. The consideration of the process parameter of scan speed, therefore, seems reasonable.
After variations in the significance of features from weld beads and coatings were observed, a different feature distribution was also obtained for the cubes. An overview of the nine relevant features is listed in Table 4.
First of all, it can be noted that for additively manufactured components such as cubes, the significance of process parameters is no longer relevant. All the selected features are obtained from the measurement data series of the different sensors.
The most important information is provided by the measurement data of the Plasmo sensor. As for the beads, change quantiles were selected as an important feature. In addition, the feature of time reversal contains information about the curve of the data series as well, since it is a measure of symmetry. Therefore, the emitted process light and its change over time is a good indicator for the quality of complex additive structures. Moreover, information about the build strategy is included in the measurement data and can be obtained from changes in the process light curve. For instance, the application of a frame structure can be distinguished from a filling zig-zag movement, where the afterglow of each weld bead was detected.
The features extracted from the laser scanner are essential indicators for the quality of cubes, as well. Complexity, a Fourier coefficient and the partial autocorrelation are significant features. In the present case, complexity refers to the detected surface roughness of a cube. For example, a low complexity indicates only minor geometric irregularities in the coating of a cube and, thus, a good surface shape. The Fourier coefficient refers to the cross-sectional area of a cube. In general, it describes the degree of recurrence of trigonometric functions in the data series. In this particular case, it refers to the pattern of weld beads in the top layer and their distinctiveness. In contrast, partial autocorrelation identifies the dependency between values of a measurement series at different times, and provides information about the predictability of a data point based on previous or subsequent points. Since this feature was extracted from the total height of the cubes, it indicates their overall geometric structure. For additive components, dimensional accuracy is of high importance. Thus, it is reasonable that three different features, related to the surface roughness, cross-section and absolute height of the cubes, are selected.
For the temperature measurement data, a Fourier coefficient and change quantiles are relevant. The Fourier coefficient refers to a pattern structure in the temperature curve that is related to recurring parts due to the repetitive application of individual tracks and layers. Furthermore, a high change quantile value indicates strong temperature fluctuations and, therefore, an irregular process. Moreover, the part quality is influenced by the build-up strategy. For instance, if the cooling time between layers is below a certain threshold, overheating during the build-up can occur.
The process camera with the features of number crossing 1 and linear trend also provides important information on the quality of the cubes. Number crossing 1 defines how many times the curve of the melt-pool size undercuts the value 1 or approaches 0. In this context, that undercutting can be equated to no melt pool being detected. This can be due to a deposition pause between single weld beads or layers. In this case, number crossing 1 is a measure of the number of individual weld beads in the whole cube. Another possible reason is a strong process irregularity that prevents the image processing algorithm from detecting a melt pool. In contrast, the linear trend considers the melt-pool diameter change over time. If the size of the weld pool increases, the weld bead geometry changes, which has a direct effect on the geometry of the cube. If the melt-pool diameter decreases, the distance between the component and the nozzle increases, not enough energy is introduced, and the powder is no longer melted. Cubes with significantly lower overall height and a smoothed surface are the result.
In summary, the extracted features vary depending on the geometry. The more complex the manufactured structures are, the more important the measurement data become. Thus, it can be concluded that in the case of additive components such as cubes, the significance of process parameters is extremely low. When compared to the extracted and analyzed features, they no longer provide any significant information for the ANN. In the following section, the importance of selected features for quality prediction will be explained.
3.4. Additional Value of Process Data
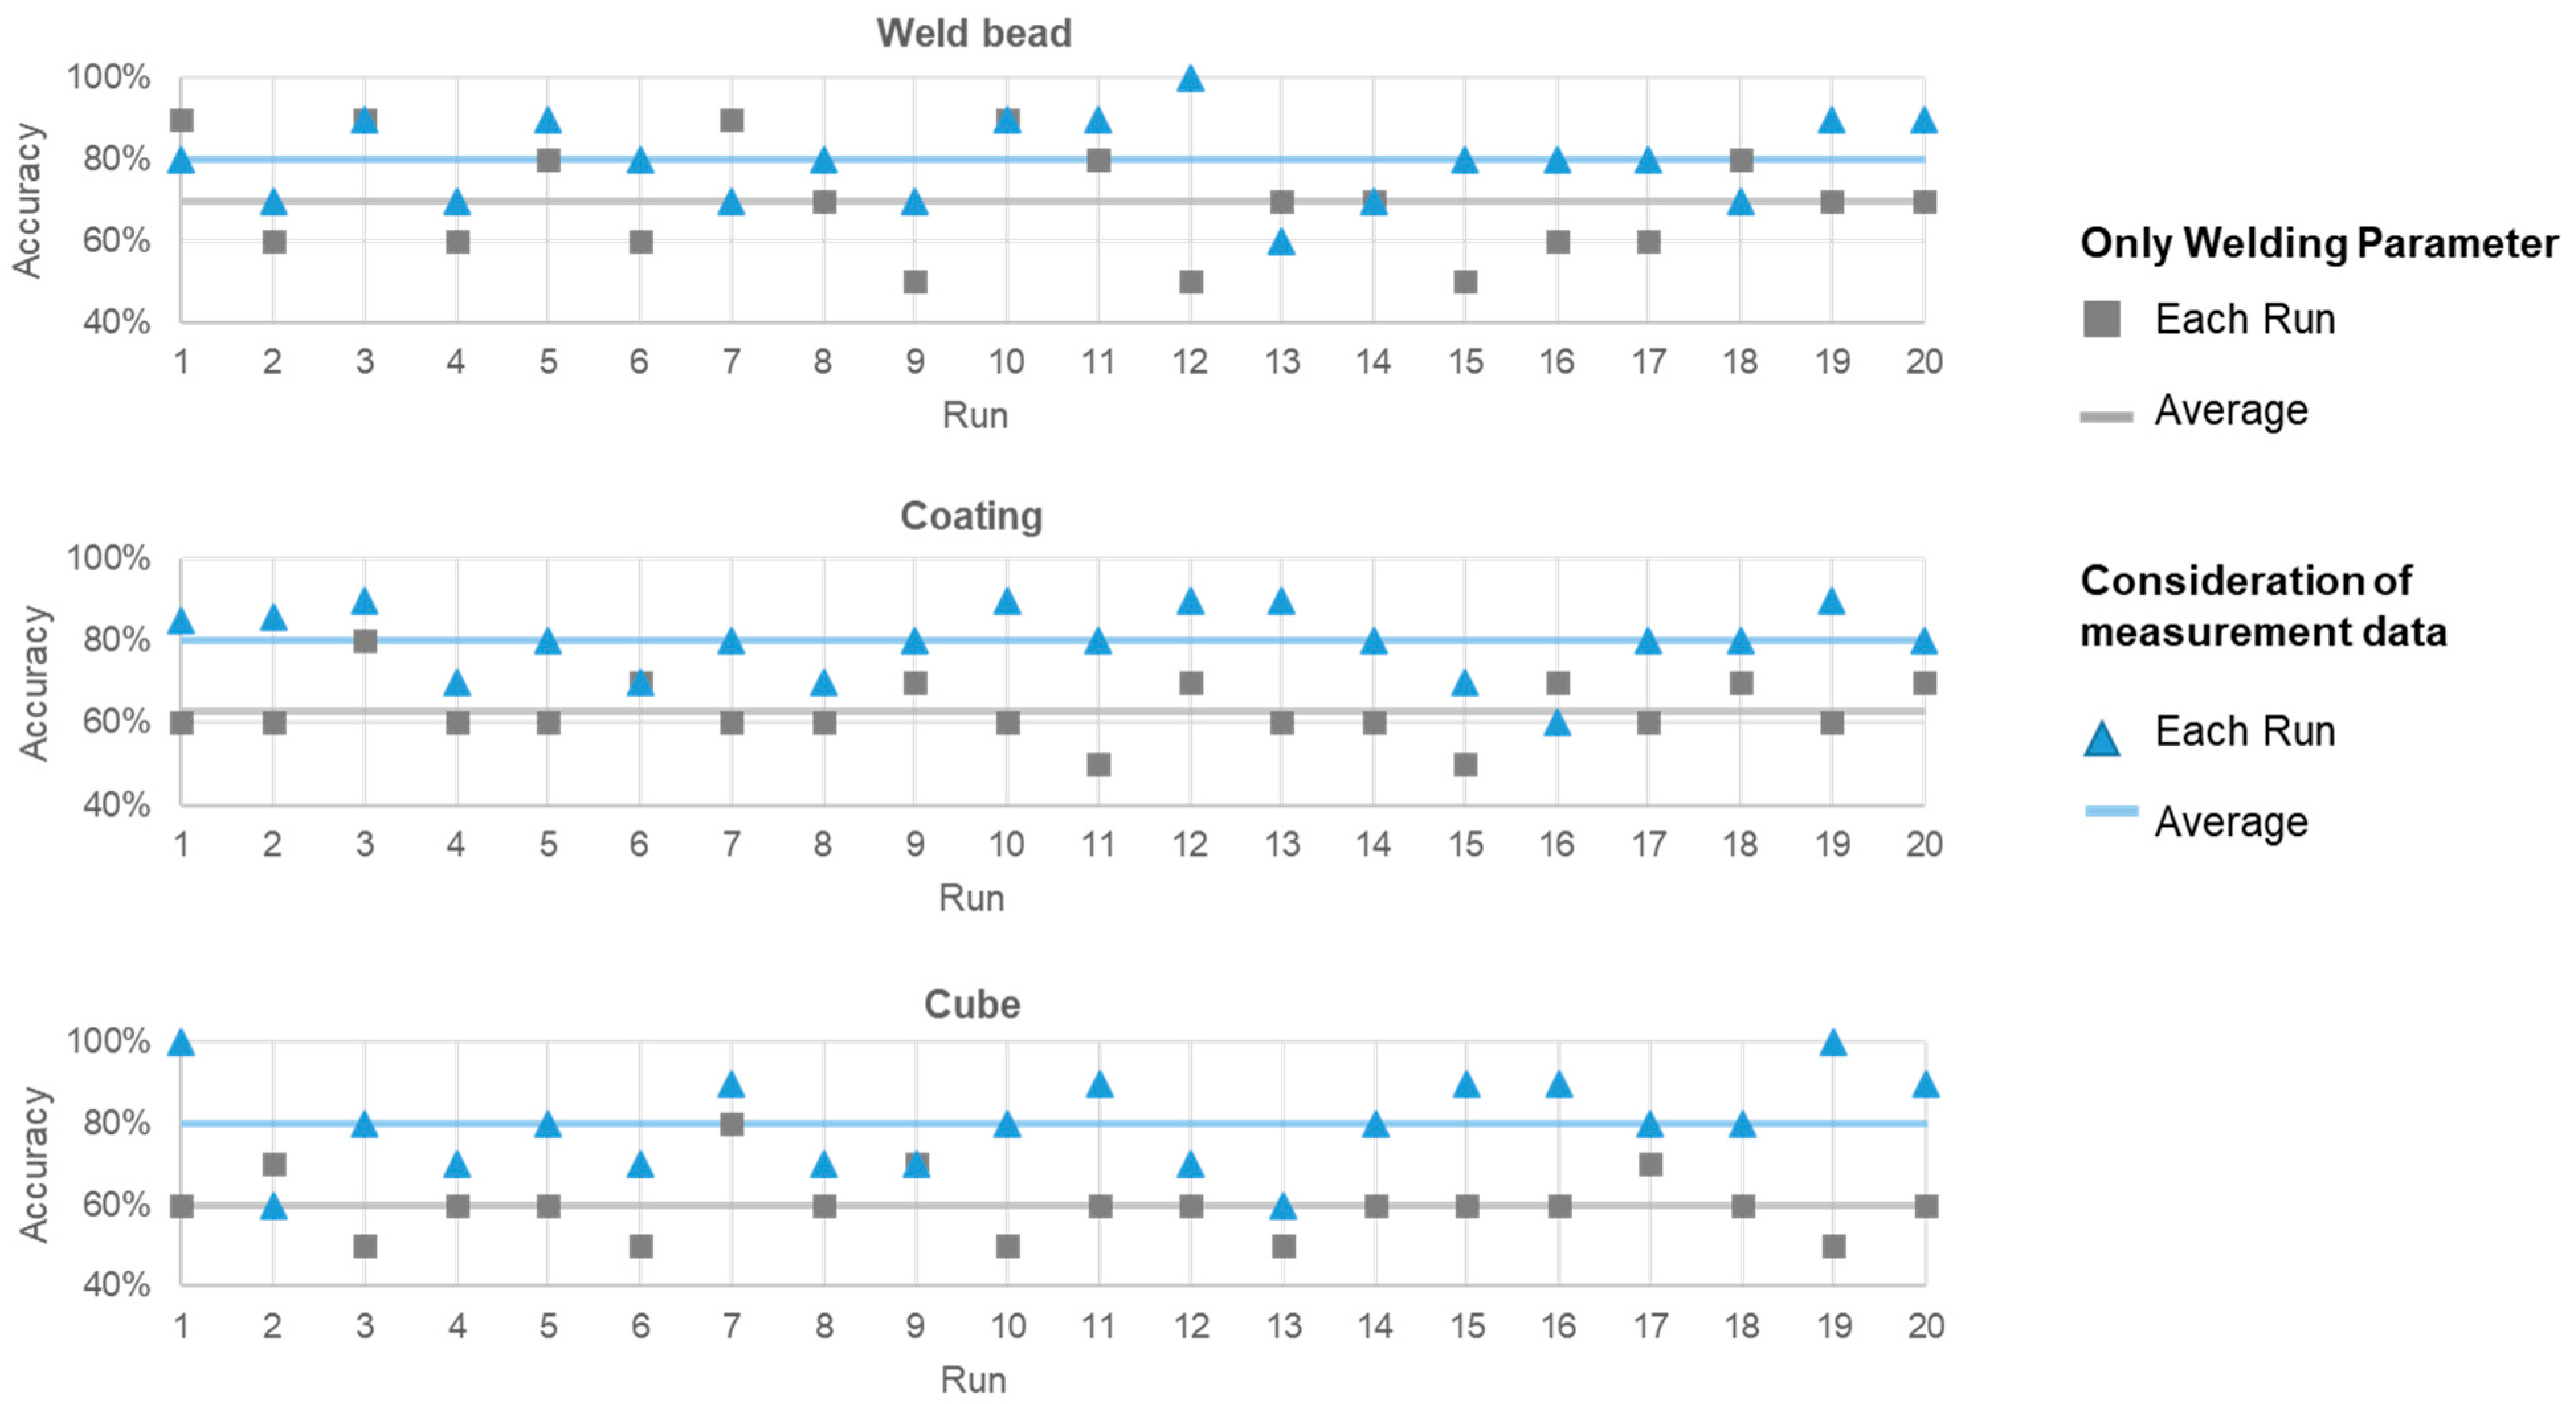
Based on the previous results, one ANN based only on process parameters and one ANN based on the selected features were created, trained and validated for each of the different geometries. A total of 20 training and test runs were executed for each ANN. The accuracies of the individual runs can be taken from Figure 4.
In a single run, the prediction accuracy of an ANN trained with a small data set is not very meaningful due to a possible unfavorable distribution of the training and test data. The average accuracy after multiple runs reduces the risk of a falsified statement about the network’s prediction accuracy.
In general, the accuracies are below the values of similar publications in the literature [9,10,11,12]. There are two main reasons for this. Firstly, previous research usually uses continuous parameters as target values. In most cases, the effects of process parameters on bead width and bead height are predicted. The prediction accuracy calculation for continuous target values is generally performed by evaluating the relative error. Depending on the process, the kind of target value, and the used data set, these deviations are never large so that the general accuracy of the ANN is correspondingly high [13]. Secondly, it must be noted that the previous studies consider only weld beads. There is no transferability of the results to additive components. The quality characteristics of a weld bead can already be predicted well with a statistical test design [31]. The categorization considered in this work is, therefore, much more complex. In such cases, there is only the possibility of being right or wrong. Apart from that, it is not considered that all wrong classifications were off by just one category. Furthermore, a categorical evaluation of produced parts can already cause discussions among different operators. While the criteria for the respective quality categories are defined in principle, such an evaluation is also always subjective.
The accuracy of the ANN based on process parameters decreases significantly with the complexity of the geometries; while for weld beads an accuracy of 70% could be reached, the accuracy drops to 60% for cubes. It is assumed that the predictions become even less accurate for relevant additive components, which usually have much higher degrees of complexity. This is primarily caused by the fact that the varied process parameters do not contain sufficient information to make correct quality predictions. The build-up strategy plays an especially major role in additive manufacturing. Since the build-up strategy is not given to the network as an input variable, the information is missing to correctly predict the quality category. Simply adding new aspects such as the build-up strategy as new training parameters and including them directly in the training phase is not practical, because the additional effort and time taken to produce sufficient training data would be too high.
The integration of measurement data is a practical way of providing the network with varying and flexible information about the build-up process. It has been shown that with the selected features, the quality of all the considered geometries can be consistently predicted with an average prediction accuracy of 80%. Using geometry-dependent selection of features from the measurement data, specific information on the individual building processes can be collected and made available to the ANN. This includes information about changes in the process, as well as information about the dimensional accuracy of components. This way, the ANN can recognize an unsteady process or a failed build-up.
4. Conclusions
In this work, the added value of measurement data in the application of an ANN was demonstrated. For this purpose, a procedure for the extraction and analysis of features from a dynamic measurement data series was presented. Conclusions pertaining to the extracted measurement data characteristics and the weld quality were discussed for each geometry individually. The added value of the procedure was validated, and the following conclusions can be drawn:
- -
- ANNs are only as good as the data set provided. It is essential that sufficient information is available to describe the target values adequately. Previous work has always used process parameters as input data. In the present work, this was sufficient for predicting the quality category of weld beads. With increasing complexity of the geometry, the process parameters became less and less significant due to a lack of information about the welding process.
- -
- Measurement data provide essential information about the welding process. To use measurement data for an ANN, the focus must be put on data preparation. This includes a suitable feature extraction method to convert dynamic measurement series into static characteristic values.
- -
- A variety of tools are available for feature extraction, depending on the application. In the present case, the Python package tsfresh, univariate analyses and correlation matrices were successfully used. In this context, it must be considered that the feature analysis is dependent on geometry, as well as on the target value.
- -
- The comparison of the ANN with and without the consideration of measurement data shows a clear added value regarding the integration use of sensors. This way, especially complex additive manufactured components can be evaluated significantly more effectively.
- -
- The described feature extraction and analysis method is suitable to reliably identify relevant features.
Author Contributions
Conceptualization, A.M. and S.B.; methodology, A.M.; software, S.B.; validation, A.M., S.B. and J.R.; formal analysis, A.M.; investigation, A.M., S.B. and J.R.; resources, A.M.; data curation, S.B.; writing—original draft preparation, A.M. and S.B.; writing—review and editing, J.R., M.B. and M.R.; visualization, A.M.; supervision, M.B. and M.R.; project administration, A.M.; funding acquisition, A.M., M.B. and M.R. All authors have read and agreed to the published version of the manuscript.
Funding
This research was funded by the German Federal Ministry for Economic Airs and Energy (BMWi) through the Industrial Cooperative Research Association (AiF) and the German Welding Association (DVS) under the project entitled “Certify as you build—Quality assurance for the directed energy deposition”, with the grant number IGF 20.612 N. The authors would like to thank the BMWi, AiF and DVS for their support.
Institutional Review Board Statement
Not applicable.
Informed Consent Statement
Not applicable.
Data Availability Statement
Not applicable.
Conflicts of Interest
The authors declare no conflict of interest.
References
- Attaran, M. The rise of 3-D printing: The advantages of additive manufacturing over traditional manufacturing. Bus. Horiz. 2017, 60, 677–688. [Google Scholar] [CrossRef]
- Wohlers, T.; Campbell, R.I.; Diegel, O.; Kowen, J.; Mostow, N. Wohlers report 2021. In 3D Printing and Additive Manufacturing: Global State of the Industry; Wohlers Associate: Fort Collins, CO, USA, 2021. [Google Scholar]
- Frazier, W.E. Metal Additive Manufacturing: A Review. J. Mater. Eng. Perform. 2014, 23, 1917–1928. [Google Scholar] [CrossRef]
- Dass, A.; Moridi, A. State of the Art in Directed Energy Deposition: From Additive Manufacturing to Materials Design. Coatings 2019, 9, 418. [Google Scholar] [CrossRef] [Green Version]
- Saboori, A.; Aversa, A.; Marchese, G.; Biamino, S.; Lombardi, M.; Fino, P. Application of Directed Energy Deposition-Based Additive Manufacturing in Repair. Appl. Sci. 2019, 9, 3316. [Google Scholar] [CrossRef] [Green Version]
- Tao, F.; Qi, Q.; Liu, A.; Kusiak, A. Data-driven smart manufacturing. J. Manuf. Syst. 2018, 48, 157–169. [Google Scholar] [CrossRef]
- Dayhoff, J.E.; DeLeo, J.M. Artificial neural networks. Cancer 2001, 91, 1615–1635. [Google Scholar] [CrossRef]
- Goldberg, Y. Neural Network Methods for Natural Language Processing. Synth. Lect. Hum. Lang. Technol. 2017, 10, 1–309. [Google Scholar] [CrossRef]
- Feenstra, D.R.; Molotnikov, A.; Birbilis, N. Utilisation of artificial neural networks to rationalise processing windows in directed energy deposition applications. Mater. Des. 2021, 198, 109342. [Google Scholar] [CrossRef]
- Song, C.; Liu, L.; Yang, Y.; Weng, C. Prediction on Geometrical Characteristics of Laser Energy Deposition Based on Regression Equation and Neural Network. IFAC-PapersOnLine 2020, 53, 89–96. [Google Scholar] [CrossRef]
- Mozzaffar, M.; Paul, A.; Al-Bahrani, R.; Wolff, S.; Choudhary, A.; Agrawal, A.; Ehmann, K.; Cao, J. Data-driven prediction of the high-dimensional thermal history in directed energy deposition processes via recurrent neural networks. Manuf. Lett. 2018, 18, 35–39. [Google Scholar] [CrossRef]
- El Fetni, S.; Duchene, L.; Tran, H.S. Thermal field predicition in DED manufacturing process using Artificial Neural Network. In Proceedings of the ESAFORM 2021 24th Internation Conference on Material Forming, Liege, Belgium, 16–14 April 2021. [Google Scholar]
- Saqib, S.; Urbanic, R.J.; Aggarwal, K. Analysis of Laser Cladding Bead Morphology for Developing Additive Manufacturing Travel Paths. Procedia CIRP 2014, 17, 824–829. [Google Scholar] [CrossRef] [Green Version]
- Mondal, S.; Tudu, B.; Bandyopadhyay, A.; Pal, P.K. Process Optimization for Laser Cladding Operation of Alloy Steel using genetic algorithm and artifical neural network. Int. J. Comput. Eng. Res. 2012, 2, 2250–3005. [Google Scholar]
- Mondal, S.; Bandyopadhyay, A.; Pal, P.K. Application of artificial neural network for the prediction of laser cladding process characteristics at Taguchi-based optimized condition. Int. J. Adv. Manuf. Technol. 2014, 70, 2151–2158. [Google Scholar] [CrossRef]
- Guo, S.; Chen, Z.; Cai, D.; Zhang, Q.; Kovalenko, V.; Yao, J. Prediction of Simulating and Experiments for Co-based Alloy Laser Cladding by HPDL. Phys. Procedia 2013, 50, 375–382. [Google Scholar] [CrossRef] [Green Version]
- Zhou, K.; Yao, P. Overview of recent advances of process analysis and quality control in resistance spot welding. Mech. Syst. Signal Process. 2019, 124, 170–198. [Google Scholar] [CrossRef]
- Lee, J.; Noh, I.; Jeong, S.I.; Lee, Y.; Lee, S.W. Development of Real-time Diagnosis Framework for Angular Misalignment of Robot Spot-welding System Based on Machine Learning. Procedia Manuf. 2020, 48, 1009–1019. [Google Scholar] [CrossRef]
- Qi, X.; Chen, G.; Li, Y.; Cheng, X.; Li, C. Applying Neural-Network-Based Machine Learning to Additive Manufacturing: Current Applications, Challenges, and Future Perspectives. Engineering 2019, 5, 721–729. [Google Scholar] [CrossRef]
- Everton, S.K.; Hirsch, M.; Stravroulakis, P.; Leach, R.K.; Clare, A.T. Review of in-situ process monitoring and in-situ metrology for metal additive manufacturing. Mater. Des. 2016, 95, 431–445. [Google Scholar] [CrossRef]
- Zebari, R.; Abdulazeez, A.; Zeebaree, D.; Zebari, D.; Saeed, J. A Comprehensive Review of Dimensionality Reduction Techniques for Feature Selection and Feature Extraction. J. Appl. Sci. Technol. Trends 2020, 1, 56–70. [Google Scholar] [CrossRef]
- Christ, M.; Braun, N.; Neuffer, J.; Kempa-Liehr, A.W. Time Series FeatuRe Extraction on basis of Scalable Hypothesis tests (tsfresh—A Python package). Neurocomputing 2018, 307, 72–77. [Google Scholar] [CrossRef]
- Ren, W.; Wen, G.; Zhang, Z.; Mazumder, J. Quality monitoring in additive manufacturing using emission spectroscopy and unsupervised deep learning. Mater. Manuf. Processes 2021, 61, 1–8. [Google Scholar] [CrossRef]
- Tapia, G.; Elwany, A. A Review on Process Monitoring and Control in Metal-Based Additive Manufacturing. J. Manuf. Sci. Eng. 2014, 136, 6. [Google Scholar] [CrossRef]
- Tang, L.; Landers, R.G. Melt Pool Temperature Control for Laser Metal Deposition Processes—Part I: Online Temperature Control. J. Manuf. Sci. Eng. 2010, 132, 1. [Google Scholar] [CrossRef]
- Song, L.; Bagavath-Singh, V.; Dutta, B.; Mazumder, J. Control of melt pool temperature and deposition height during direct metal deposition process. Int. J. Adv. Manuf. Technol. 2012, 58, 247–256. [Google Scholar] [CrossRef]
- Steiger, C.; Ptacek, W.; Kronreif, G.; Wögerer, C. Online control sensors for welding processes based on optical recognition. IFAC Proc. 2006, 39, 1193–1197. [Google Scholar] [CrossRef]
- Binega, E.; Yang, L.; Sohn, H.; Cheng, J.C.P. Online geometry monitoring during directed energy deposition additive manufacturing using laser line scanning. Precis. Eng. 2022, 73, 104–114. [Google Scholar] [CrossRef]
- Goyal, M.; Goyal, R.; Reddy, P.V.; Lall, B. Activation Functions. arXiv 2020, arXiv:1906.09529. [Google Scholar]
- DIN Deutsches Institut für Normung e.V. Non-Destructive Testing—Visual Testing—General Principles (DIN EN 13018:2016-06); German Version EN 13018:2016; Beuth Verlag: Berlin, Germany, 2016. [Google Scholar]
- Kingma, D.P.; Ba, J. Adam: A Method for Stochastic Optimization. arXiv 2014, arXiv:1412.6980. [Google Scholar]
Figure 1.
Measurement setup.

Figure 2.
Procedure for data preparation.

Figure 3.
Categorization of the different geometries.

Figure 4.
Accuracies and average values of the runs for each geometry.


Table 1.
Process window.
| Lower Limit | Upper Limit | |
|---|---|---|
| Laser power (P) | 200 W | 1000 W |
| Scan speed (v) | 200 mm/min | 1000 mm/min |
| Powder feed rate (m) | 3.5 g/min | 21 g/min |
| Working distance (w) | 7 mm | 11 mm |
Table 2.
Relevant features for weld bead categorization.
| Weld Bead | ||
|---|---|---|
| Feature | Parameter/Sensor | |
| 1 | Longest strike above mean | Laser scanner |
| 2 | Count below mean | Laser scanner |
| 3 | Median | Pyrometer |
| 4 | Change quantiles | Emission spectrometer |
| 5 | Laser Power | Parameter |
| 6 | Linear Trend | Emission spectrometer |
| 7 | Powder mass flow | Parameter |
Table 3.
Relevant features for coating categorization.
| Coating | ||
|---|---|---|
| Feature | Parameter/Sensor | |
| 1 | Sum values | Laser scanner |
| 2 | Count above mean | Emissions spectrometer |
| 3 | Powder mass flow | Parameter |
| 4 | CWT Coefficient | CCD Camera |
| 5 | Entropy | Pyrometer |
| 6 | Scan speed | Parameter |
Table 4.
Relevant features for cube categorization.
| Cube | ||
|---|---|---|
| Feature | Parameter/Sensor | |
| 1 | Change quantiles | Emission spectrometer |
| 2 | Complexity | Laser scanner |
| 3 | Fourier coefficient | Laser scanner |
| 4 | Time reversal | Emission spectrometer |
| 5 | Partial autocorrelation | Laser scanner |
| 6 | Fourier coefficient | Pyrometer |
| 7 | Number crossing 1 | CCD Camera |
| 8 | Change quantiles | Pyrometer |
| 9 | Linear trend | CCD Camera |
Publisher’s Note: MDPI stays neutral with regard to jurisdictional claims in published maps and institutional affiliations. |
© 2022 by the authors. Licensee MDPI, Basel, Switzerland. This article is an open access article distributed under the terms and conditions of the Creative Commons Attribution (CC BY) license (https://creativecommons.org/licenses/by/4.0/).
Share and Cite
MDPI and ACS Style
Marko, A.; Bähring, S.; Raute, J.; Biegler, M.; Rethmeier, M. Quality Prediction in Directed Energy Deposition Using Artificial Neural Networks Based on Process Signals. Appl. Sci. 2022, 12, 3955. https://doi.org/10.3390/app12083955
AMA Style
Marko A, Bähring S, Raute J, Biegler M, Rethmeier M. Quality Prediction in Directed Energy Deposition Using Artificial Neural Networks Based on Process Signals. Applied Sciences. 2022; 12(8):3955. https://doi.org/10.3390/app12083955
Chicago/Turabian StyleMarko, Angelina, Stefan Bähring, Julius Raute, Max Biegler, and Michael Rethmeier. 2022. "Quality Prediction in Directed Energy Deposition Using Artificial Neural Networks Based on Process Signals" Applied Sciences 12, no. 8: 3955. https://doi.org/10.3390/app12083955
Note that from the first issue of 2016, this journal uses article numbers instead of page numbers. See further details here.