
Automated Beehive Acoustics Monitoring: A Comprehensive Review of the Literature and Recommendations for Future Work


1
INRS-EMT, University of Quebec, 800 Rue de la Gauchetiere Ouest, Montreal, QC H5A 1K6, Canada
2
Faculty of Science and Engineering, Biology Department, Laval University, 2325 rue de l’Universite, Quebec, QC G1V 0A6, Canada
*
Author to whom correspondence should be addressed.
Appl. Sci. 2022, 12(8), 3920; https://doi.org/10.3390/app12083920
Submission received: 11 March 2022
/
Revised: 4 April 2022
/
Accepted: 8 April 2022
/
Published: 13 April 2022
(This article belongs to the Special Issue Frontier Research in Apiculture (Diagnosis and Control of Bee Diseases, Bee Products, Environmental Monitoring))
Abstract
:Bees play an important role in agriculture and ecology, and their pollination efficiency is essential to the economic profitability of farms. The drastic decrease in bee populations witnessed over the last decade has attracted great attention to automated remote beehive monitoring research, with beehive acoustics analysis emerging as a prominent field. In this paper, we review the existing literature on bee acoustics analysis and report on the articles published between January 2012 and December 2021. Five categories are explored in further detail, including the origin of the articles, their study goal, experimental setup, audio analysis methodology, and reproducibility. Highlights and limitations in each of these categories are presented and discussed. We conclude with a set of recommendations for future studies, with suggestions ranging from bee species characterization, to recording and testing setup descriptions, to making data and codes available to help advance this new multidisciplinary field.
1. Introduction
Honeybees (Apis mellifera) are vital to environmental welfare. Beyond producing honey, beeswax, and royal jelly, their pollination activity supports biodiversity and major agricultural crops, making them an important agro-environmental “service provider” [1]. In fact, close to 75 percent of the crops in the United States of America producing fruits and seeds for human consumption depend, at least in part, on honeybees for sustained production, yield, and quality [2]. While all types of bees contribute to pollination, honey bees are the main pollinators of almonds, citrus fruits, blueberries, and curcubits [2]. Therefore, any change in bee colony behaviour and health, as well as drops in population sizes, can have drastic effects on the food industry. To this end, continuous monitoring of honey bee health and colony strength is performed by beekeepers.
Traditionally, beehive monitoring has relied on manual and visual examinations. These inspections, however, are time-consuming for the beekeepers and disruptive for the colonies, hence are not performed continuously. Commonly, beekeepers inspect their hives every two weeks during pollination services or honey production periods and less often, if at all, during winter months. Important changes in population dynamics of a colony and in overall colony health can occur, however, during a two-week period (e.g., full colony death due to swarming or parasite infestation), hence there is a need for continuous monitoring. In fact, massive colony losses have been observed all over the world [3,4,5,6,7,8]. Scientists believe that multiple stressors, either acting independently, in combination, or even synergistically, are responsible for this phenomenon [9,10,11]. As such, passive monitoring of honey bee colony health has become of great interest to the beekeeping and honey bee research communities [12].
With advances in Internet of Things (IoT) sensors and devices, such passive monitoring has become a reality, and precision beekeeping applications have emerged [13]. For example, hive health and colony strength monitoring applications have emerged based on temperature, humidity, and CO2 sensors [12,14,15,16]. More recently, audio and vibrations monitoring have also emerged as a viable alternative to remote hive monitoring. For example, honeybees are known to generate special sounds in response to triggers such as airborne toxicants, predatory mites, and failing queens [17]. In fact, bees communicate within the colony via vibration and sound signals [18]. Gross body movements, wing movements, high-frequency muscle contractions without wing movements, and pressing the thorax against the substrates or another bee are just some of these vibroacoustic signals present within a hive [19]. Moreover, vibroacoustic signals generated by bees modulate behaviours that affect swarming, as well as the queen’s behaviour during swarming. In this regard, research has shown correlations between the frequencies of the vibroacoustic signals and their amplitudes with events such as swarming [20,21].
Additionally, unique auditory signatures are present in a hive when multiple queen bees are present, typically a virgin bee and a mature queen bee; such sounds have been termed piping, quacking, and tooting [22]. Queen piping, for example, is emitted by young queens to signal readiness for battle with the mature queen (only one queen can lead the colony). The sound made as soon as they emerge is called tooting, which has been shown to have a fundamental frequency between 400 Hz during the day of emergence, to around 500 Hz two to four days post-emergence. It starts with around 17 short pulses, and the number decreases to around 7 after several days [23]. When a virgin queen emerges, several other mature queens may still be in their cells. These typically reply with a sound called quacking. Quacking is described as a series of short pulses (with duration shorter than 0.2 s) having a fundamental frequency of around 350 Hz [23]. If multiple mature bees are available in their cells, a chorus of synchronized quacking can follow each tooting event. Although experts still do not know the exact purpose of quacking, one theory is that quacking is used as a call to worker bees asking for protection against the emerged virgin queen which may try to kill them while they are still in their cells [24].
Worker bees are also able to produce acoustic signals that are similar to piping. While it was believed that piping in worker bees only happened with lack of a queen or disturbance of the hive, this signal has been observed in colonies that are neither disturbed nor without a queen [25]. When produced by undisturbed foragers, this signal is emitted once every few seconds and has a fundamental frequency of 330–430 Hz with an evident harmonic behaviour [26]. The piping produced by worker bees before or during swarming is shown to have greater frequency variability, ranging from 100 to 500 Hz or beyond, and each pipe is a pulse that has a duration of around one second [27]. Worker piping happens before or during hissing, which is an acoustic signal produced by worker bees when they are distressed or during swarms [28]. Having a large fundamental frequency ranging from 300 to 3600 Hz, the hissing signal has a broadband and noisy structure. In addition, worker bees produce the sounds by slight movements of their wings; hence, they can be audible to the human ear. Hissing is accompanied by a rapid cessation of certain hive behaviours, such as forager dancing and hive departures [29]. A unique feature of hissing is that depending on the presence of precursory piping, it can indicate different events in the colony. Past research indicates that a sequential and coordinated piping and hissing occurs as a response when potential predators are present near the colony. It is also believed that the hissing audio effect and the combined cessation of flight will frighten predators, such as birds or other insects [29]. However, hissing in the absence of precursory piping is more often indicative of swarming, happening several days prior to the actual departure [28].
While some of these important sounds can be detected by experienced beekeepers, their classification is difficult without manual inspections. As such, microphones and/or vibration sensors (e.g., accelerometers) placed inside and outside of the hives have been proposed as a method for real-time precision beekeeping and hive health monitoring with little disturbance to the hives [30,31]. Audio beehive monitoring, as a branch of eco-acoustics [32], is not new, and one of the first studies, published in Nature in the late 1950s by Edward Woods [33], showed that a rise in acoustic signal magnitude at 255 +/– 35 Hz was indicative of swarming or that the queen was failing. Moreover, a hiss at 3000+ Hz in response to banging on the hive could determine that the colony was healthy. Woods patented a device for detecting swarms, known as the Apidictor [34], but his device was not very practical due to its large size and complexity.
Recent advances in computational power and hardware miniaturization, however, have been the driving forces behind the IoT revolution. This has enabled new solutions for portable bee acoustics monitoring. For example, the Apivox Smart Monitor, released in 2015, uses the microphone of an Android smartphone to monitor hive sounds to detect swarming and brood control, among other factors [35]. More recently, the Bee Health Guru (released in 2019) [36] also proposes the use of a smartphone to record sound inside a hive in 30-s- to 1-min-long tracks. These sound snippets are then processed by artificial intelligence to determine whether the hive has a queen, has a Varroa mite infestation, or the presence of small hive beetles. Other companies, such as Arnia [37] and Nectar Technologies Inc. [38], have developed multi-sensor solutions to monitor hive health and strength, queen bee presence, and parasite presence, to name a few, including relying on acoustic data recorded via microphones placed inside the hive.
Burgeoning of such devices has allowed for acoustic hive data to be more easily measured and, oftentimes, released as open-source data to stimulate citizen science projects. Representative examples include the Nu-hive project [39] and the Open Source BeeHive (OSBH) project [40], as well as other bee detection datasets, such as [41]. These innovations have resulted in an increase in the number of publications pertaining to audio analytics of beehives. While recent reviews have focused on the technological advances in recording audio in beehives, as well as the use of multi-sensor approaches (e.g., see [13,42,43]), the literature lacks a review on the observed acoustic events enabled by precision apiculture. Such a review would provide researchers with insights on what characteristics future technologies should aim to monitor (or avoid). We aim to fill this gap with the present review and build on the work in [44]. In particular, focus will be placed on honeybees (Apis mellifera) and the bumble bee (Bombus spp.), on a wider range of applications of acoustics analyses for beehive monitoring (e.g., reactions to environmental factors), as well as more recent works proposed in the literature.
The remainder of this review paper is organized as follows: Section 2 describes how the systematic review was conducted and how the studies were selected, assessed, and analyzed. Section 3 then presents and discusses the review results, with a list of recommendations for future research directions. Lastly, Section 4 presents our concluding remarks.
2. Methods
English journal and conference papers, as well as electronic preprints, published between January 2012 and August 2021, were chosen as the target of this review. PubMed, Google Scholar, Scopus, IEEE Xplore, and arXiv were queried to collect an initial list of papers containing specific search terms in their title or abstract. Additional papers were identified by scanning the reference sections of these papers. The search terms used included:
- Apis mellifera;
- Apis cerana;
- Apis dorsata;
- Apis bombus;
- Bumblebee;
- Bee;
- Hive;
- Honeybee;
- Apiculture;
- Sound;
- Audio;
- Acoustics;
- ZigBee.
These search terms were combined using the following rule: (1 OR 2 OR 3 OR 4 OR 5 OR 6 OR 7 OR 8 OR 9) AND (10 OR 11 OR 12) AND NOT 13. The last rule was included in order to avoid erroneous hits with papers focusing on ZigBee, a wireless transmission technology used with IoT devices that is not related to the review. Since the Google Scholar search engine only allows searches of full text or titles, and not titles and abstracts, the query was performed using the flag “allintitle” to search titles only. On arXiv, Scopus, and PubMed, on the other hand, both abstracts and titles were queried. With IEEExplore, all metadata were queried. From the resulting hits, the inclusion and exclusion criteria presented in Table 1 were used.
To assess the eligibility of the selected papers, the titles were read first. If the title did not clearly indicate whether the inclusion and exclusion criteria were met, the abstract was read as well. Finally, when reading the full text during the data collection process, papers that did not meet the review criteria were also rejected. For the included papers, Table 2 lists the items that were extracted and used for further analyses. The first category covers the origin of the article, i.e., whether it was published as a journal manuscript, in a conference proceedings, or as a non-peer-reviewed preprint, the first author’s affiliation and country, as well as the venue in which the paper was published. These details provide a quick overview of the types of publication available, as well as which countries are working most actively in the field. It is important to highlight that we have chosen to include non-peer-reviewed articles, such as those available on arXiv electronic preprints, as there is an increasing trend in publishing preprints, especially within the artificial intelligence community, prior to submission to major conferences and/or journals. This also allows for inclusion of a more diverse pool of papers from all corners of the world.
Next, the rationale category focuses on the goals of the selected studies. This is valuable information to understand how bee acoustics have been used and allows for trends to be characterized. Third, the experiment setup describes the species of bees, number of beehives or colonies used in each study, time of the recording, the sampling rate used, microphone information, and the preprocessing steps. These are important details needed for study replication. Fourth, the audio analysis method is assessed in order to focus on the feature extraction method, the analysis method (e.g., machine learning or simple correlations), and evaluation metrics used. Finally, the reproducibility of the work in selected articles is quantified by looking at the availability of the data and code.
3. Results and Discussion
The database queries yielded 487 different results that matched the search terms (see Figure 1). Based on the inclusion and exclusion criteria listed in Table 1, 57 papers were selected for our review. Four additional papers were identified using the reference sections of these initial articles, which resulted in a total of 61 papers for analysis.
3.1. Origin of the Selected Articles
Our search methodology returned 33 journal papers, 21 conference papers, and 3 preprints that met the inclusion criteria. Of these, 52.5% of the papers were from Scopus and 29.5% from IEEE, with the remaining coming from the other sources, 4.9% of them coming from ArXiv. Next, we looked at the location of the first author’s affiliation to obtain a sense of the geographical distribution of research on bee acoustics analysis. Figure 2 summarizes the distribution of countries of the included articles. As can be seen, most contributions came from the USA, UK, Japan, Slovenia, Italy, and Poland. In the figure, countries listed as “others” group all countries in which only one paper was included; representative countries in this category include Canada, France, Australia, New Zealand, Belgium, India, Latvia, Ireland, Republic of Korea, The Bahamas, Uruguay, and Germany.
3.2. Study Goal
The study goals of the included papers can be summarized by Figure 3, as a function of publication year. As can be seen, the most common goals in using beehive acoustics are to detect queen bees and swarming events. A handful of articles have also explored the influence of external factors on beehive acoustics, including pollution, chemicals exposure, smoke, microwave electromagnetic field, 2.4 GHz radio frequency exposure, and solar eclipses, to name a few. Moreover, as can be seen from Figure 3, the number of papers increased substantially starting in 2018, coinciding with the period in which open datasets started becoming available. The recent drop in publication numbers from 2020 onwards could be due to the limited number of available open datasets, hence suggesting that new and more diverse datasets may be needed to help advance the research.
Table 3 provides a more detailed description of the aspects explored in each paper. In this section, we start with the studies that focused on honeybees and proceed with studies focusing on other bee species, such as Bombus, Halictus, and Megachile.
3.2.1. Honeybees
As a first step in honey bee analytics, one must first discriminate bee sounds from non-bee sounds, such as wind, rain, and urban sounds. Therefore, one of the common goals in the included papers is to develop bee activity detection algorithms for (i) classification of bee and non-bee sound as a preprocessing step [41,48], and potentially use the processed audio for detecting swarming and queen bee absence, and (ii) detection of bee foraging for pollen or nectar [45]. The authors in [41], for example, used a machine learning framework to discriminate bee buzzing from cricket chirping and ambient noise. In [45], in turn, a bee detection system based on the harmonic characteristic of buzzes recorded using microphones placed in the orchard trees was designed for pollination mapping and to evaluate pollen production.
A recent study has shown that hive acoustics could be useful to measure hive strength [49], defined as the number of frames within a hive that were at least 60% covered by bees, disease type, and disease severity. While the disease types were not mentioned in the study, four disease severity levels were considered, namely, none, low, moderate, and severe. The designed system is a semi-supervised generative-prediction network (GPN) that takes advantage of environmental variables such as temperature, humidity, and air pressure, alongside labelled and unlabelled audio. The average Huber loss [100] for predicting number of full frames and disease severity were around and , respectively, while the accuracy of disease type was around 78%.
Queen bees are essential for colony survival and thrivingness. The death of the queen, or a serious decline in her health, will usually lead to the colony producing a new queen, unless a new queen is introduced by the beekeeper. As such, one of the most active research topics in bee audio analysis has been the detection of a queen bee within the hive. Articles that aimed to detect queen bee presence mostly relied on frequency domain features. While the work in [52,57] aimed at reporting differences between a hive with a queen and a queenless hive, the work in [50,53,55] relied on machine learning algorithms to classify between these two states (presence/absence).
Another common goal has been swarming detection. During swarming, a colony produces a new queen, and the old queen leaves her colony with approximately half of the worker bee population to start a new colony. Swarming is part of the reproduction cycle of the colony and typically occurs when resources are plentiful. After mating, the younger queen takes over the colony that is left behind and is tasked with growing it. With swarming, the result will be two smaller colonies that will use most of their energy for colony growth, rather than honey harvesting. If weather conditions are not suitable (e.g., close to winter), this can lead to colony deaths. Moreover, if not well controlled by the beekeeper, swarming can also have a significant economical impact on honey production. The work in [20,21,59,60,61,62,63,64] showed that swarming prediction could be predicted using a remote and automated acoustics-based system. Using power spectral density, it was shown that the power increases by around 200 Hz when approaching the swarming period [20,60].
Furthermore, it is known that honey bees will collect nectar or honey from any source they can find, and that includes a weak, or poorly guarded, colony. The process of invading another hive to steal the stored honey is referred to as “robbing”, and it can occur anytime during the year, but it is most evident in the late summer or early fall, especially during a nectar dearth [101]. Authors in [66] showed that hive robbing could be detected via video and audio recordings of a beehive. A Beemon system [102] was placed right above the entrance of the hive with a camera facing down to record the videos and a microphone was placed inside the hive. To estimate the traffic using videos, a technique based on object tracking and neural networks called Beevee [103] was used to count the number of bees entering or leaving the hive. Their analysis on hive traffic video and inside hive audio showed that before robbery, the target hive had become weak and an easy target.
Other important factors contributing to hive health can include the presence of parasites [28] and exposure to environmental pollutants [67,68], to name a few. In fact, recent research has shown that honeybees can be used as environmental bioindicators for heavy metals and polycyclic aromatic hydrocarbons [104]. The work in [28], for example, showed that honeybee hive acoustics could be used to detect a Varroa mite infestation, whereas the work in [105,106] showed that hive acoustics could be used to detect certain atmospheric pollutants. Using four features, namely, spectral centroid, peak frequency, frequency standard deviation, and bandwidth (range of predominant frequencies with the threshold of −9 dB), coupled with a machine learning framework could lead to Varroa mite detection [28] with an accuracy of . In [68], in turn, changes in acoustic behaviour were monitored and classified using machine learning models, when hives were exposed to acetone, trichloromethane, glutaric dialdehyde, and ethyl ether, and compared to the control condition of blank air. Using MFCCs (mel-frequency cepstral coefficients, a widely-used feature in audio analytics) as features and principal component analysis (PCA) to reduce the dimensionality to two, clear differences in the beehive sounds in the morning, relative to the afternoon, were seen in the control group. Smoke is also known to generate a defensive response in bees and is used by beekeepers when manually inspecting hives. The work in [39] showed that smoke can have a direct effect on hive acoustics with several harmonics showing up in the low-frequency spectrum (0–500 Hz).
In addition to the above factors, researchers have also explored the short-term impact that microwave electromagnetic fields [72] and radio frequency electromagnetic radiation [71] have had on hive acoustics. No significant changes were reported; in [71], the same was also true for temperature and humidity sensor data. Designing a hive monitoring system with multiple sensors, in addition to audio, has also been popularized recently [76,79]. The work in [76], for example, also included measures of temperature and humidity inside the hive, bee combs’ weight, and number of entries to the hive to monitor the colony. The long-term monitoring of the colony showed dramatic weight drops, swarming detected in the audio spectrogram analysis with frequency around 400 Hz, as well as entrance counts and temperature.
Lastly, hive acoustic analysis has also been used as a means to better understand bee behaviour. For example, in [75], sound analysis was used to monitor the learning of worker bees (Apis mellifera). In this study, bee hives were presented with two odours, where one of them was also presented alongside an electric shock. While bees did not produce any different sound upon odour presentation only, they responded to the electric shock with a strong hissing response defined as the production of loud sounds or vibrations by simultaneous wing movements of several honey bees and emit short (0.5–1.0 s) bursts of broadband-frequency sounds [107]. After learning, many bees were shown to hiss when presented with the odour that was previously paired with the electric shock, even though the shock was no longer being presented, with fewer bees hissing upon presentation of other odours. While hissing is known to be an aposematic signal [107], the authors in [74] showed that Japanese honeybees (Apis cerana japonica) also hissed when there was no obvious threat near the colony. In a later study by the same authors [73], they explored the relationship of hissing onset and offset times with sunrise and sunset times, as well as environmental factors. They showed that honeybees hiss daily during daytime, most frequently at dawn, and the hissing onset and offset times were close to sunrise and sunset times, respectively.
3.2.2. Bombus and Other Bee Species
Bumble bees’ different acoustics behaviour in the colony and in the field could contain information that aids our understanding and ability to monitor these important pollinators. While some researchers investigated the acoustics in the field for flight [46,80,88,90] and buzz-pollination analysis [81], others used in-colony acoustics for foraging activity [84,85], defence [108] (reaction to mammalian breath and CO2-enriched air), dominance [97] (fundamental frequencies between 300–400 Hz), and thermoregulation [109] (broadband acoustic signal with fundamental frequencies between 180–200 Hz) monitoring [97]. The relationship between “buzz-pollination” and “floral sonication” has been investigated in measures of duration, frequency, and amplitude in [91]. The results showed that airborne recordings of sonication vibrations in B. impatiens characterize duration and frequency faithfully while acoustic amplitude (relative peak amplitude and sound pressure level) are not correlated with vibrational amplitude.
Detecting different species of bees is another research area that has increased interest recently. This information is useful in both agricultural production and ecological research, as it helps to understand and protect the biodiversity of these important pollinators and their habitat and also evaluate the pollination services. Authors in [80], for example, designed a system to distinguish the flight sounds of three pollinating bee species in Japan (i.e., Apis mellifera, Bombus ardens, Tetralonia nipponensis) and one hornet species (i.e., Japanese yellow hornet, Vespa simillima xanthoptera, a predator of honeybees in Japan. Results showed clear differences in the spectra of these sounds, in MFCCs and in fundamental frequency; classification was performed by a support vector machine (SVM) classifier. Using acoustic properties such as peak amplitude, peak frequency, and duration to identify different species of bumblebees during “buzz-pollination” or “floral sonication” (bees vibrating flowers) has been the aim of some studies [81,83,99]. The results showed that body shape or wing size can be correlated with fundamental frequency [81], and also duration of the buzzes was shown to differ with body size (larger bees producing shorter buzzes) in six different species of bumblebees (B. hortorum, B. lapidarius, B. pascuorum, B. pratorum, B. terrestris, and B. lucorum) [99]. Moreover, using amplitude, frequency, and duration of flight and “floral sonication” sounds of 15 pollinating bee species (see Table 4) on Solanum lycopersicum flowers showed that the sonication sounds are more relevant to bee species recognition as the machine learning algorithms reached an accuracy of 73.4% on sonication and 64% flight sounds, respectively [83].
In fact, detection of foraging activity has also been explored to provide insight into pollination service [85,86]. The work in [86], for example, used microphones installed in front of the colony entrance of three different species of bumblebees (B. pascuorum, B. humilis and B. hypnorum) to detect arrival and departure of the bees. The daily histogram of departure on each day showed that there are different foraging habits in different species. B. pascuorum were mostly active around noon and in the afternoon, while less active in the morning. On the other hand, B. hypnorum were more active after 3 p.m. Another interesting observation was that light rain in the afternoon made B. humilis workers stay inside, but it did not affect B. hypnorum. Moreover, inspired by computational auditory scene analysis (CASA), the work in [46] used focal templates to recognize audio segments which contained buzzes. To discriminate between arrivals and departures, an algorithm based on the maximum absolute difference between two consecutive peaks of the smoothed signal envelope were used. Classification of arrival and departures reached sensitivity and precision levels of 95%.
In [85], in turn, the foraging activity of the B. sylvicola and B. pascuorum was investigated, and a system based on the time it takes for the maximum peak amplitude of a buzz to be achieved was proposed to classify arrival and departure. Peaks closer to the beginning of a buzz were indicative of an arrival, otherwise a departure was inferred; an overall accuracy around 96% was achieved. In addition to foraging activity detection, the authors of [87] also proposed the use of spectral contents of acoustics to predict pollination efficacy of the bumblebee (B. Terrestris) and wild bees in the field; similar results were found in [88] for B. balteatus and B. sylvicola.
The work in [89], in turn, relied on audio to identify the colony’s circadian rhythm. One-second-length audio were recorded every 15 minutes for 9 days to investigate the existence of circadian rhythm. Using the root mean square (RMS) signal level as bee buzz or loudness, RMS growth in the early hours of the morning and repetitive cycles were noticed. Time range between 11 p.m. and 4 a.m. was concluded as the bees’ deep night, as bees have repetitive behaviour during which colony activity decreases the most. As an attempt to complement this study, the authors in [96] investigated sound indices features to identify the bee day as a convenient time for bee colony characterization. They showed that by using temperature, time, and spectral entropy it is possible to find colony characteristics which are the hive-specific hours when the sound of a particular colony is most valuable. Using a temperature filtering step, they rejected recordings collected during weather conditions that are not favourable to bees, and by comparing each hive’s spectral entropy daily trends, 11:00 a.m. to 4:00 p.m. for the fall and winter seasons were considered as a bee day.
Lastly, in [90], the authors investigated the effect of the 2017 total solar eclipse, which caused a drop in sunlight by three orders of magnitude and temperature by 10–15 °C (21 August 2017, which traversed over 5000 km from coast to coast of North America). Hive acoustics were used to monitor flight patterns of Apis mellifera, bombus, Megachile, and Halictus across the Pacific Coast, Rocky Mountain, and Midwest regions of the United States. It was found that buzzing rates changed as a function of light intensity (and not temperature drop), with the bees ceasing flying during periods of complete darkness.
3.3. Experiment Setup
3.3.1. Bee Species
Western honeybees (Apis mellifera) are the most common species of bees explored in the included studies. Not all of the studies mentioned the exact subspecies of A. mellifera used in their investigation. Notwithstanding, Table 4 shows the bee species and subspecies studies in the respective articles. In the case of detecting arrival and departure of bees and measuring pollination efficacy, the genus Bombus was mostly present [84,85,88]. As shown in [99], buzzing vibrations exhibit species-specific characteristics at least in genus Bombus. Therefore, it is vital to report the species name under experiment in order to better understand the relationship between buzz production and species.
3.3.2. Number of Beehives
The studies included in this review used different numbers of beehives. Some studies (11.5%) used the audio of a limited number of bees for a specific purpose. In [75], the authors used the audio of 104 bees (forager bees which were caught at feeders placed nearby the hives) to investigate hissing patterns in Apis mellifera. In addition, in [86], 60 bees from 3 species of bumblebees, Bombus pascuorum, B. humilis, and B. hypnorum, were used to monitor daily foraging activity and distinguish between their arrivals and departures. The authors in [99] studied similar variables using groups (n = 105) of B. hortorum, B. lapidarius, B. pascuorum, B. pratorum, B. terrestris, and B. lucorum to determine the similarity of vibrations among different species of bees and examine the extent to which vibrations generated from buzz pollination differed from those produced in a defensive context. While the majority (46.4 %) of the studies did not mention the number of beehives, the most common setups in the 54.6% of the remaining studies included between one and six beehives. A limited number of studies used a larger number of beehives [49,84,85]. For example, in [84,85], 46 wooden domiciles were deployed to collect data from Bombus in 2018 and 2019. Out of 46 domiciles, only 6 and 11 were occupied by different bumble bee species in 2018 and 2019, respectively. Moreover, the work in [49] recorded audio of 26 beehives which provided a very large number of audio samples and “hive-independent” models (predicting the beehive state in hives different to the ones where the model was trained on) were used to predict hive strength.
3.3.3. Time of the Recordings
Most of the studies reported that their data collections took place in the months of June [20,61,84,85,93] and July [61,65,84,85,88,93,94], with a few extending to August [57,84] and September [99]. Some studies reported that acoustic changes could be seen according to the time of the day [69,89]. By exploring different acoustic properties during the morning, midday, afternoon, and night, authors in [69] showed that audio frequency changes slowly through the day. Measuring data over a 24 h period was a common setup in many studies [55,71,73,74,76]. On the other hand, some studies focused on recording audio only when the bees are the most active. For example, 3 p.m.–6 p.m. was used for the purpose of swarming detection [20,61], while arrival and departure activity was monitored between 7 a.m.–5 p.m. and between 8 a.m.–6 p.m. in [84,85] and in [86], respectively.
3.3.4. Sampling Rate of the Audio Signals
Sampling rate has a direct effect on the quality of the recorded audio, on storage requirements, and on computational resources needed. It was found that almost 34.4% of the articles did not mention their audio sampling rate, while 18.0% and 9.8% mentioned using 44.1 kHz and 22.05 kHz, respectively. As various studies have emphasized that acoustic events of interest lie typically between 100–1000 Hz [69,110], some studies relied on downsampling from kHz to 4 kHz [31,46,55], or even 3 kHz [89], to reduce storage requirements while still keeping useful information for analysis.
3.3.5. Microphone Characteristics
One important aspect in audio analysis is the description of microphone characteristics, in particular the frequency range that the microphone can cover. Table 5 shows the frequency ranges of the microphones reported in articles that provided this information. As can be seen, the great majority did not report this information (85%). While the upper end of the spectrum clearly covers the regions of interest for beehive acoustics, of greater importance is the lower end of the spectrum. For example, lower frequencies, around 100 Hz, have been linked to fundamental frequencies of some bee species, such as B. hortorum, B. argillaceus, and B. pascuorum [81,84]. Detection of such characteristics, with a microphone with a frequency resolution starting at higher than 100 Hz, for example, would not be possible. As such, accurate characterization of the used microphones should be detailed in future works to facilitate replication.
3.3.6. Audio Preprocessing
Most of the studies reviewed did not mention any preprocessing steps for the audio analysis; thus, it is not clear how background noise was processed and/or removed, or if downsampling was applied. Nevertheless, five manuscripts mentioned using a filtering step to remove noise, as well as high frequencies in the audio files. Different filters were used, including a Butterworth, Chebyshev, elliptic, and a Bessel filter [82]. In [68], a 10th-order Butterworth band-pass filter with edge frequencies set at 50 Hz and 1500 Hz was used to remove background noise (e.g., bird sounds, workers’ voices, and car noises). The work in [28], in turn, relied on a seventh-order Butterworth low-pass filter with a cut-off frequency at 4 kHz for feature extraction for infestation detection. In [80], the goal was bee type identification, and a 12 kHz low-pass filter was applied to eliminate only very-high-frequency sounds, such as machinery. All of these studies, however, did not report results before (i.e., with raw signals) preprocessing, thus it is not clear how much advantage resulted from this signal processing step or if removing high frequencies could be detrimental to some other classification tasks not explored in the related papers. Nonetheless, the gains achieved in storage requirements and real-time processing capability could be well worth the downsampling schemes.
3.4. Audio Analysis Method
We divided the bee acoustic audio analysis methods into two categories: research that used machine learning algorithms and those that did not. For the first category, we look at the feature extraction and classification methods used in each articles. For the second category, only the features used and/or methods of visualization are reported. Table 6 lists the different features that have been extracted from the audio signals, some of them serving as input to different classification algorithms, and more details are provided below.
3.4.1. Features
Mel-frequency cepstral coefficients (MFCCs) [111] are the most common set of features used in studies that exploited a machine learning framework. MFCCs mimic some of the processing performed by the human hearing system, such as the nonlinear perceptual mel-frequency scale of pitch. These features have been widely used in speech-processing applications, including speech/speaker/emotion recognition, to name a few. Around 27% of studies analyzed MFCCs to extract information for bee detection, queen absence and swarming detection, and bee species identification, as well as environmental effects, with the three first coefficients showing the most discrimination. The authors in [51], used the so-called improved MFCC (IMFCC) proposed in [112] to capture additional information from the higher-frequency part of the spectrum that is typically ignored by the traditional MFCC; this was shown to improve classification accuracy for queenless hive detection tasks.
In [61], the short-time Fourier transform (STFT) calculated with filterbank and overlap-add methods was used to detect swarming events. The STFT was calculated using 128, 256, 512, and 1024 bins to investigate the impact of window width. The best time localization and frequency resolution achieved was with 512 bins, thus inline with other studies [41,53]. In [57], in turn, the performance of the fast Fourier transform (FFT), the S-transform (S-T), and the STFT were compared for the task of queenless hive detection. The S-T was shown to be very effective in identifying time-varying events, such as the “warbles” mentioned in [33] which are indicative of a queenless hive. STFT-based features were the second most used in the reviewed works.
In [76], in turn, a spectrogram with a frequency range of 0–512 Hz and resolution of 8 Hz was used to visualize bee behaviour before and during swarming. It was found that higher energy in the 400–500 Hz band could be an indicator of swarming activity. In [53], the authors used MFCCs, mel-scaled spectrogram, and the time-aggregated time–frequency spectrogram produced by Hilbert–Huang transform (HHT) [113] (a time–frequency signal analysis method based on empirical mode decomposition) with different classifiers to detect queenless hives in “hive-dependent” and “hive-independent” scenarios. The results indicated that all tested features could discriminate queenless hives, with the fusion of HHT-based features and MFCCs showing to improve accuracy for the “hive-independent” setup, thus being better suitable for applications that generalize to unseen hives. In comparison with the spectrogram, the HHT better captured the harmonic information, due to its higher resolution, relative to the MFCC, hence the observed gains. In a similar vein, the constant-Q transform (CQT), a time–frequency transform widely used in music processing, was used for bee detection in [47]. Experiments with a bee detection system showed that MFCCs could better distinguish bee sounds from noise, as compared to the mel-scaled spectrogram and the CQT.
Another powerful time–frequency analysis method is the wavelet transform (WT). In [52], the discrete wavelet transform (DWT) was tested for queenless beehive detection. Results indicated that a DWT with a 10-level dyadic filterbank resulted in a clear distinction between queenless and queenright hives. The work in [54] showed that continuous wavelet transform (CWT) outperformed other time–frequency features such as MFCCs, spectrogram, HHT, and DWT in queenless beehive detection with ”hive-independent” setup. The work in [62] also briefly discussed the use of the DWT for swarming detection and compared it with the spectrogram; improved results were attributed to the increased frequency resolution provided by the DWT. Moreover, they showed that CWT had a good signal representation with a higher computational cost.
Linear predictive coding (LPC), motivated by the speech/audio compression field [114], has also been used as a feature extraction method for queen presence detection and swarming detection [56,64]. The work in [64], for example, compared LPC features with MFCCs and showed that MFCCs were slightly better for swarming detection (82.2% vs. 80.4% accuracy). Power spectral density (PSD) was also explored in [20] to look for spectral power changes in certain frequency ranges a few days prior to swarming; experiments showed that increases in spectral power around the 200 Hz region were an indication of swarming. Alternately, other studies have explored changes in audio signal duration and amplitude, as well as changes in spectral characteristics. While the work in [90], for example, explored changes in buzz duration and amplitude due to solar eclipse, the work in [91] showed changes in duration, amplitude, and fundamental frequency during floral sonication vibration (a behaviour in which certain bees generate vibrations by contracting their flight muscles to extract collected pollen). In turn, the authors in [28] showed that peak frequency and relative peak amplitude could be used to detect Varroa mite infestation, whereas in [99], these measures were used to discriminate between pollination from defence buzzes in bumblebees. Computational auditory scene analysis (CASA) tools (see, e.g., [115]) were also used in [46,88] to detect the buzzing of bees from environmental recordings and to measure pollination efficacy by detecting bee buzzes in the environment, respectively. Lastly, the work in [67] proposed new sound indices, such as the acoustic complexity index, acoustic diversity index, acoustic evenness index, and the bioacoustic index to characterize changes in beehive acoustics when exposed to certain chemicals.
3.4.2. Machine Learning Algorithm
A typical machine learning framework encompasses signal measurement, preprocessing, feature extraction, and, lastly, classification. In the area of bee acoustic analysis, many different classifiers have been explored. Table 7 summarizes the different classification algorithms used. As can be seen, the most common classifier is a support vector machine (SVM) [116], a kernel-based method that projects data into higher dimensions in which a hyperplane can separate the classes. Authors in [87] used an SVM to predict the pollination efficacy of bumblebees. The performance of the SVM using different input features (e.g., MFCC, HHT, mel-scaled spectrogram), on the other hand, was explored for queenless hive detection in [53]. The impact of different kernels, including linear, quadratic, and radial basis function, was compared in [68] against random forest classifier [117] and K-nearest neighbours method for detecting common air pollution chemicals such as acetone, trichloromethane, glutaric dialdehyde, and ethyl ether; the SVM with radial basis function as the kernel showed the best accuracy. To detect parasite infestation, authors in [28] compared linear discriminant analysis (LDA) with SVM and found that while LDA outperformed the SVM in most cases, the SVM had lower computational cost and complexity. Logistic regression has also been explored intensively, especially for queenless hive detection [31,50,55].
Decision trees have been widely used for classification as they are easy to interpret [118]. Decision trees have been used to classify bee species [81,82,83]. A performance comparison between decision tree and other classifiers such as SVM, logistic regression, and random forest showed that they are not usually the most accurate one. Naive Bayes has also been used in classifying bee species [81,82]. Authors in [82] showed that random forest, logistic regression, and K-nearest neighbours outperformed naive Bayes in detecting bee species.
The abovementioned methods have been termed “classical” or “conventional” machine learning paradigms, to separate them from the more recent and burgeoning deep-learning neural-network-based methods. The work in [50], for example, proposed the use of so-called long short-term memory (LSTM) recurrent neural networks (RNN) for queen bee presence detection. A comparison between an LSTM, a multi-layer perceptron (MLP) neural network, and logistic regression was made, and it showed the power of the LSTM for the task at hand. The MLP was again explored in [51] for queen bee presence detection and showed to outperform classical SVM and KNN classifiers. It was also tested for swarming detection in [63,64] and compared to traditional methods, such as Gaussian mixture models (GMM) and hidden Markov models (HMM), showing its superiority.
Recently, convolutional neural networks (CNN) have gained popularity, especially within computer vision tasks. To make them directly applicable to bee acoustics analysis, researchers have relied on image-like inputs, such as spectrograms, mel-scaled spectrogram, or other two-dimensional time–frequency representations of the audio. Authors in [53], for example, relied on the spectrogram as input to a CNN with four convolution layers to detect queenless hives. The challenge of training “hive-independent” models was emphasized, and an SVM was shown to better generalize to unseen hives. Notwithstanding, state-of-the-art accuracy was achieved with the CNN for the “hive-dependent” scenario. CNN architectures were also explored in [47] for bee detection with results outperforming SVM, random forest, and XGBoost (a decision tree-based ensemble learning algorithm [119] that uses a gradient boosting framework) classifiers. In a similar vein, the work in [41] compared the performance of 2D (spectrogram input) versus 1D (raw audio input) CNNs and concluded that the latter resulted in more robust decisions, especially when test data differed from the training data by beehive, location, time, and bee race.
3.4.3. Performance Metrics
In classification tasks, different metrics can be used as figures of merit, with some showing improved robustness to unbalanced datasets. Table 8 lists the metrics used in the papers that focused on machine-learning-based classification. As can be seen, the most common metric is accuracy, followed by area under the curve (AUC). The majority of the other metrics rely on the classification confusion matrix, and include, e.g., Precision, recall and F1-score. For cases with class imbalance, measures such as F1-score and AUC are most appropriate for binary classification task.
3.5. Reproducibility
Reproducibility is an important part of science: reproducible results can help move research fields forward, especially in new and interdisciplinary fields, such as beehive acoustics analysis. Here, we evaluate reproducibilty by using two key criteria: the availability of recorded data and the availability of written code.
3.5.1. Data Availability
From the review articles, three main sources of public bee audio data were identified. The first source is the so-called Nu-hive project [39] data, which consisted of audio for queen state identification, smoke reaction, and bee detection. The public release of this dataset is related to queen state identification from two different beehives. Authors in [52,53,54,58] used the Nu-hive data for queen absence detection, whereas [48] used part of this data for bee detection. The second source is the OSBH project [40] audio data, acquired through a citizen science initiative where members of the general public were asked to record sounds from their personal beehives along with some metadata. Given its nature, recordings from the OSBH project present great diversity, including different recording devices, different environments where the hives were placed, and even different positions for the microphones inside the hive. This diversity, while making the dataset valuable for evaluation in real-life conditions, also makes it extremely challenging for machine learning applications. Authors in [21,63,64] used OSBH data for swarming detection, whereas those in [47,48] used it for bee detection.
Lastly, the third public source is a dataset called BUZZ, a bee detection dataset including audio of bee buzzes, ambient noise, and cricket sounds [41]. The data are available from six different hives, which have been each separated into different disjoint train, test, and validation subsets. In the first partition (termed BUZZ1), the train and test samples are separated from the validation set by beehive and location. The second partition (BUZZ2), in turn, separates the train and test samples by beehive and location, while the validation sets are by beehive, location, time (2017 vs. 2018), and bee race (A. Mellifera ligustica vs. A. mellifera carnica). Authors in [41] created and used this datasets for bee detection using CNNs.
3.5.2. Code Availability
3.6. Recommendations
In light of the findings obtained from this literature review, in order to improve the quality and reproducibility of the future work in bee acoustics analysis, we propose the following list of recommendations for future works:
- Provide exact information about bee species: As many studies did not mention what species of bees were used in their research (e.g., [45,51,59]), it becomes hard to replicate findings. As such, it is recommended that future works report this information for better comparisons and understanding of each bee species acoustic behaviour.
- Apply audio denoising methods: Very few studies reported the use of noise removal steps prior to feature analysis. In realistic settings, ambient noise can contaminate the beehive audio, thus potentially leading to erroneous decisions. As such, future work should explore the use of noise removal algorithms, as well as test if existing tools remove discriminatory information from the recordings and if custom algorithms need to be built.
- Consider environmental factors: Environment factors, such as temperature, humidity, and pollution can affect bee behaviour. In the studies that explored foraging behaviour, it was shown to be important to report the flowering species information, as this can affect beehive acoustics. Few works reported environmental factors, and future studies should attempt to incorporate additional sensor information to provide these additional contextual factors.
- Consideration of hive opening for hive inspections: Most articles reviewed included one or more hive inspections. As hive openings can cause changes in hive acoustics, as well as internal temperature and humidity, not to mention the bees’ defensive behaviour and smoke reactions, these could lead to outliers that could result in erroneous decisions. In future studies, hive opening metadata should be collected to allow for hive opening detectors to be built.
- Provide detailed information about the recording procedure: We know that the experiment setup has a direct effect on the audio samples and their quality. Therefore, reporting microphone frequency ranges, sampling rates, and any preprocessing is important to allow for comparisons between works to be made. Very few works reported these details; thus, future works should place some emphasis on these aspects.
- Clear description of the machine learning pipeline: It is known that the procedure to train and test the efficacy of different machine learning algorithms is crucial information needed for replication. For example, changing the testing setup (e.g., cross-validation, versus train/test split versus leave-one-hive-out) can lead to very different models, as can different hyperparameter tuning strategies, different normalization schemes, or regularization methods. These details were seldom reported in the surveyed papers, thus future work should strive to provide a complete description of the testing setup.
- Data and code sharing: As this is a new research field, there are still many unanswered questions that need to be answered. Sharing of data and code will be crucial for the field to grow and for studies to be replicated and benchmarked. Future works should prioritize the sharing of any newly-collected data, as well as any new codes developed. Researchers could also consider running some data processing and machine learning challenges, which have been shown to help advance emerging fields (e.g., see [120]).
4. Conclusions
In this review, a total of 61 articles published between January 2012 and December 2021 on bee acoustic analysis were surveyed. Five important categories were extracted from each article: origin, study goal, experiment setup, audio analysis method, and reproducibility. Highlights and pitfalls of the surveyed works have been detailed and recommendations for future works have been detailed, with the goal of helping advance the new, interdisciplinary field of beehive acoustics.
Author Contributions
Conceptualization, T.H.F. and P.G.; methodology, T.H.F., P.G. and M.A.; writing—original draft preparation, M.A.; writing—review and editing, P.G. and T.H.F.; visualization, M.A.; supervision, T.H.F. and P.G.; funding acquisition, T.H.F. and P.G. All authors have read and agreed to the published version of the manuscript.
Funding
This work was made available through funding from NSERC Canada via its Alliance Grants program (ALLRP 548872-19) in partnership with Nectar Technologies Inc and the Deschambault Animal Science Research Centre (CRSAD).
Institutional Review Board Statement
Not Applicable.
Informed Consent Statement
Not Applicable.
Data Availability Statement
Not Applicable.
Conflicts of Interest
The authors declare no conflict of interest.
References
- FAO; Apimondia; CAAS; IZSLT. Good Beekeeping Practices for Sustainable Apiculture; FAO: Rome, Italy, 2021. [Google Scholar]
- Liao, Y.; McGuirk, A.; Biggs, B.; Chaudhuri, A.; Langlois, A.; Deters, V. Noninvasive Beehive Monitoring through Acoustic Data Using SASA® Event Stream Processing and SAS® Viya®; SAS Institute Inc.: Belgrade, Serbia, 2020. [Google Scholar]
- Van der Zee, R.; Pisa, L.; Andonov, S.; Brodschneider, R.; Charriere, J.D.; Chlebo, R.; Coffey, M.F.; Crailsheim, K.; Dahle, B.; Gajda, A.; et al. Managed honey bee colony losses in Canada, China, Europe, Israel and Turkey, for the winters of 2008–2009 and 2009–2010. J. Apic. Res. 2012, 51, 100–114. [Google Scholar] [CrossRef]
- Jacques, A.; Laurent, M.; Consortium, E.; Ribière-Chabert, M.; Saussac, M.; Bougeard, S.; Budge, G.E.; Hendrikx, P.; Chauzat, M.P. A pan-European epidemiological study reveals honey bee colony survival depends on beekeeper education and disease control. PLoS ONE 2017, 12, e0172591. [Google Scholar]
- Kulhanek, K.; Steinhauer, N.; Rennich, K.; Caron, D.M.; Sagili, R.R.; Pettis, J.S.; Ellis, J.D.; Wilson, M.E.; Wilkes, J.T.; Tarpy, D.R.; et al. A national survey of managed honey bee 2015–2016 annual colony losses in the USA. J. Apic. Res. 2017, 56, 328–340. [Google Scholar] [CrossRef] [Green Version]
- Brodschneider, R.; Gray, A.; Adjlane, N.; Ballis, A.; Brusbardis, V.; Charrière, J.D.; Chlebo, R.; Coffey, M.F.; Dahle, B.; de Graaf, D.C.; et al. Multi-country loss rates of honey bee colonies during winter 2016/2017 from the COLOSS survey. J. Apic. Res. 2018, 57, 452–457. [Google Scholar] [CrossRef] [Green Version]
- Gray, A.; Brodschneider, R.; Adjlane, N.; Ballis, A.; Brusbardis, V.; Charrière, J.D.; Chlebo, R.; Coffey, M.F.; Cornelissen, B.; Amaro da Costa, C.; et al. Loss rates of honey bee colonies during winter 2017/18 in 36 countries participating in the COLOSS survey, including effects of forage sources. J. Apic. Res. 2019, 58, 479–485. [Google Scholar] [CrossRef] [Green Version]
- Gray, A.; Adjlane, N.; Arab, A.; Ballis, A.; Brusbardis, V.; Charrière, J.D.; Chlebo, R.; Coffey, M.F.; Cornelissen, B.; Amaro da Costa, C.; et al. Honey bee colony winter loss rates for 35 countries participating in the COLOSS survey for winter 2018–2019, and the effects of a new queen on the risk of colony winter loss. J. Apic. Res. 2020, 59, 744–751. [Google Scholar] [CrossRef]
- Oldroyd, B.P. What’s killing American honey bees? PLoS Biol. 2007, 5, e168. [Google Scholar] [CrossRef] [Green Version]
- Porrini, C.; Mutinelli, F.; Bortolotti, L.; Granato, A.; Laurenson, L.; Roberts, K.; Gallina, A.; Silvester, N.; Medrzycki, P.; Renzi, T.; et al. The status of honey bee health in Italy: Results from the nationwide bee monitoring network. PLoS ONE 2016, 11, e0155411. [Google Scholar] [CrossRef]
- Stanimirović, Z.; Glavinić, U.; Ristanić, M.; Aleksić, N.; Jovanović, N.; Vejnović, B.; Stevanović, J. Looking for the causes of and solutions to the issue of honey bee colony losses. Acta Vet. 2019, 69, 1–31. [Google Scholar] [CrossRef] [Green Version]
- Cecchi, S.; Spinsante, S.; Terenzi, A.; Orcioni, S. A Smart Sensor-Based Measurement System for Advanced Bee Hive Monitoring. Sensors 2020, 20, 2726. [Google Scholar] [CrossRef]
- Meikle, W.; Holst, N. Application of continuous monitoring of honeybee colonies. Apidologie 2015, 46, 10–22. [Google Scholar] [CrossRef] [Green Version]
- Braga, A.R.; Gomes, D.G.; Rogers, R.; Hassler, E.E.; Freitas, B.M.; Cazier, J.A. A method for mining combined data from in-hive sensors, weather and apiary inspections to forecast the health status of honey bee colonies. Comput. Electron. Agric. 2020, 169, 105161. [Google Scholar] [CrossRef]
- Stalidzans, E.; Berzonis, A. Temperature changes above the upper hive body reveal the annual development periods of honey bee colonies. Comput. Electron. Agric. 2013, 90, 1–6. [Google Scholar] [CrossRef]
- Edwards-Murphy, F.; Magno, M.; Whelan, P.M.; O’Halloran, J.; Popovici, E.M. b+ WSN: Smart beehive with preliminary decision tree analysis for agriculture and honey bee health monitoring. Comput. Electron. Agric. 2016, 124, 211–219. [Google Scholar] [CrossRef]
- Bromenshenk, J.J.; Henderson, C.B.; Seccomb, R.A.; Rice, S.D.; Etter, R.T. Honey Bee Acoustic Recording and Analysis System for Monitoring Hive Health. U.S. Patent 7,549,907, 23 June 2009. [Google Scholar]
- Michelsen, A.; Kirchner, W.H.; Lindauer, M. Sound and vibrational signals in the dance language of the honeybee, Apis mellifera. Behav. Ecol. Sociobiol. 1986, 18, 207–212. [Google Scholar] [CrossRef]
- Hunt, J.; Richard, F.J. Intracolony vibroacoustic communication in social insects. Insectes Sociaux 2013, 60, 403–417. [Google Scholar] [CrossRef]
- Zlatkova, A.; Kokolanski, Z.; Tashkovski, D. Honeybees swarming detection approach by sound signal processing. In Proceedings of the 2020 XXIX International Scientific Conference Electronics (ET), Sozopol, Bulgaria, 16–18 September 2020; pp. 1–3. [Google Scholar]
- Žgank, A. Acoustic monitoring and classification of bee swarm activity using MFCC feature extraction and HMM acoustic modeling. In Proceedings of the 2018 ELEKTRO, Mikulov, Czech Republic, 21–23 May 2018; pp. 1–4. [Google Scholar]
- A Closer Look: Piping, Tooting, Quacking. Available online: https://www.beeculture.com/a-closer-look-piping-tooting-quacking/ (accessed on 31 October 2021).
- Michelsen, A.; Kirchner, W.H.; Andersen, B.B.; Lindauer, M. The tooting and quacking vibration signals of honeybee queens: A quantitative analysis. J. Comp. Physiol. A 1986, 158, 605–611. [Google Scholar] [CrossRef]
- Kirchner, W. Acoustical communication in social insects. In Orientation and Communication in Arthropods; Springer: Berlin, Germany, 1997; pp. 273–300. [Google Scholar]
- Thom, C.; Gilley, D.C.; Tautz, J. Worker piping in honey bees (Apis mellifera): The behavior of piping nectar foragers. Behav. Ecol. Sociobiol. 2003, 53, 199–205. [Google Scholar] [CrossRef]
- Pratt, S.; Kühnholz, S.; Seeley, T.D.; Weidenmüller, A. Worker piping associated with foraging in undisturbed queenright colonies of honey bees. Apidologie 1996, 27, 13–20. [Google Scholar] [CrossRef]
- Seeley, T.D.; Tautz, J. Worker piping in honey bee swarms and its role in preparing for liftoff. J. Comp. Physiol. A 2001, 187, 667–676. [Google Scholar] [CrossRef]
- Qandour, A.; Ahmad, I.; Habibi, D.; Leppard, M. Remote Beehive Monitoring Using Acoustic Signals. Acoust. Aust. 2014, 42, 205. [Google Scholar]
- Sarma, M.S.; Fuchs, S.; Werber, C.; Tautz, J. Worker piping triggers hissing for coordinated colony defence in the dwarf honeybee Apis florea. Zoology 2002, 105, 215–223. [Google Scholar] [CrossRef] [PubMed]
- Ramsey, M.T.; Bencsik, M.; Newton, M.I.; Reyes, M.; Pioz, M.; Crauser, D.; Delso, N.S.; Le Conte, Y. The prediction of swarming in honeybee colonies using vibrational spectra. Sci. Rep. 2020, 10, 1–17. [Google Scholar]
- Robles-Guerrero, A.; Saucedo-Anaya, T.; González-Ramérez, E.; Galván-Tejada, C.E. Frequency Analysis of Honey Bee Buzz for Automatic Recognition of Health Status: A Preliminary Study. Res. Comput. Sci. 2017, 142, 89–98. [Google Scholar] [CrossRef]
- Farina, A.; Gage, S.H. The duality of sounds: Ambient and communication. In Ecoacoustics; Farina, A., Gage, S.H., Eds.; Wiley: Hoboken, NJ, USA, 2017; pp. 13–29. [Google Scholar]
- Woods, E.F. Electronic prediction of swarming in bees. Nature 1959, 184, 842–844. [Google Scholar] [CrossRef]
- Woods, E.F. Means for Detecting and Indicating the Activities of Bees and Conditions in Beehives. U.S. Patent 2806082A, 10 September 1957. [Google Scholar]
- Apivox. Available online: https://apivox-smart-monitor.weebly.com/ (accessed on 31 October 2021).
- Bee Health Guru. Available online: https://www.beehealth.guru/ (accessed on 31 October 2021).
- Arnia. Available online: https://www.arnia.co/ (accessed on 31 October 2021).
- Nectar. Available online: https://www.nectar.buzz/ (accessed on 31 October 2021).
- Cecchi, S.; Terenzi, A.; Orcioni, S.; Riolo, P.; Ruschioni, S.; Isidoro, N. A preliminary study of sounds emitted by honey bees in a beehive. In Proceedings of the Audio Engineering Society Convention 144, Milan, Italy, 23–26 May 2018. [Google Scholar]
- Open Source Beehives Project. Available online: https://www.osbeehives.com/pages/about-us (accessed on 13 October 2021).
- Kulyukin, V.; Mukherjee, S.; Amlathe, P. Toward audio beehive monitoring: Deep learning vs. standard machine learning in classifying beehive audio samples. Appl. Sci. 2018, 8, 1573. [Google Scholar] [CrossRef] [Green Version]
- Barlow, S.E.; O’Neill, M.A. Technological advances in field studies of pollinator ecology and the future of e-ecology. Curr. Opin. Insect Sci. 2020, 38, 15–25. [Google Scholar] [CrossRef]
- Eskov, E. Generation, perception, and use of acoustic and electric fields in honeybee communication. Biophysics 2013, 58, 827–836. [Google Scholar] [CrossRef]
- Terenzi, A.; Cecchi, S.; Spinsante, S. On the importance of the sound emitted by honey bee hives. Vet. Sci. 2020, 7, 168. [Google Scholar] [CrossRef]
- Dubois, S.; Choveton-Caillat, J.; Kane, W.; Gilbert, T.; Nfaoui, M.; El Boudali, M.; Rezzouki, M.; Ferré, G. Bee Detection For Fruit Cultivation. In Proceedings of the 2021 IEEE International Symposium on Circuits and Systems (ISCAS), Daegu, Korea, 22–28 May 2021; pp. 1–5. [Google Scholar]
- Heise, D.; Miller-Struttmann, N.; Galen, C.; Schul, J. Acoustic detection of bees in the field using CASA with focal templates. In Proceedings of the 2017 IEEE Sensors Applications Symposium (SAS), Montréal, QC, Canada, 11–13 August 2017; pp. 1–5. [Google Scholar]
- Kim, J.; Oh, J.; Heo, T.Y. Acoustic Scene Classification and Visualization of Beehive Sounds Using Machine Learning Algorithms and Grad-CAM. Math. Probl. Eng. 2021, 2021, 5594498. [Google Scholar] [CrossRef]
- Nolasco, I.; Benetos, E. To bee or not to bee: Investigating machine learning approaches for beehive sound recognition. arXiv 2018, arXiv:1811.06016. [Google Scholar]
- Zhang, T.; Zmyslony, S.; Nozdrenkov, S.; Smith, M.; Hopkins, B. Semi-Supervised Audio Representation Learning for Modeling Beehive Strengths. arXiv 2021, arXiv:2105.10536. [Google Scholar]
- Ruvinga, S.; Hunter, G.J.; Duran, O.; Nebel, J.C. Use of LSTM Networks to Identify “Queenlessness” in Honeybee Hives from Audio Signals. In Proceedings of the 2021 17th International Conference on Intelligent Environments (IE), Dubai, United Arab Emirates, 20–23 June 2021; pp. 1–4. [Google Scholar]
- Peng, R.; Ardekani, I.; Sharifzadeh, H. An Acoustic Signal Processing System for Identification of Queen-less Beehives. In Proceedings of the 2020 Asia-Pacific Signal and Information Processing Association Annual Summit and Conference (APSIPA ASC), Online, 7–10 December 2020; pp. 57–63. [Google Scholar]
- Terenzi, A.; Cecchi, S.; Orcioni, S.; Piazza, F. Features extraction applied to the analysis of the sounds emitted by honey bees in a beehive. In Proceedings of the 2019 11th International Symposium on Image and Signal Processing and Analysis (ISPA), Dubrovnik, Croatia, 23–25 September 2019; pp. 03–08. [Google Scholar]
- Nolasco, I.; Terenzi, A.; Cecchi, S.; Orcioni, S.; Bear, H.L.; Benetos, E. Audio-based identification of beehive states. In Proceedings of the ICASSP 2019-2019 IEEE International Conference on Acoustics, Speech and Signal Processing (ICASSP), Brighton, UK, 12–17 May 2019; pp. 8256–8260. [Google Scholar]
- Terenzi, A.; Ortolani, N.; Nolasco, I.; Benetos, E.; Cecchi, S. Comparison of Feature Extraction Methods for Sound-based Classification of Honey Bee Activity. IEEE/ACM Trans. Audio Speech Lang. Process. 2021, 30, 112–122. [Google Scholar] [CrossRef]
- Robles-Guerrero, A.; Saucedo-Anaya, T.; González-Ramírez, E.; De la Rosa-Vargas, J.I. Analysis of a multiclass classification problem by lasso logistic regression and singular value decomposition to identify sound patterns in queenless bee colonies. Comput. Electron. Agric. 2019, 159, 69–74. [Google Scholar] [CrossRef]
- Cejrowski, T.; Szymański, J.; Mora, H.; Gil, D. Detection of the bee queen presence using sound analysis. In Proceedings of the Asian Conference on Intelligent Information and Database Systems, Dong Hoi City, Vietnam, 19–21 March 2018; pp. 297–306. [Google Scholar]
- Howard, D.; Duran, O.; Hunter, G.; Stebel, K. Signal processing the acoustics of honeybees (Apis mellifera) to identify the “queenless” state in Hives. Proc. Inst. Acoust. 2013, 35, 290–297. [Google Scholar]
- Gatto, B.B.; Colonna, J.G.; Santos, E.M.D.; Koerich, A.L.; Fukui, K. Discriminative Singular Spectrum Classifier with Applications on Bioacoustic Signal Recognition. arXiv 2021, arXiv:2103.10166. [Google Scholar]
- Krzywoszyja, G.; Rybski, R.; Andrzejewski, G. Bee swarm detection based on comparison of estimated distributions samples of sound. IEEE Trans. Instrum. Meas. 2018, 68, 3776–3784. [Google Scholar] [CrossRef]
- Anand, N.; Raj, V.B.; Ullas, M.; Srivastava, A. Swarm Detection and Beehive Monitoring System using Auditory and Microclimatic Analysis. In Proceedings of the 2018 3rd International Conference on Circuits, Control, Communication and Computing (I4C), Bangalore, India, 3–5 October 2018; pp. 1–4. [Google Scholar]
- Zlatkova, A.; Gerazov, B.; Tashkovski, D.; Kokolanski, Z. Analysis of parameters in algorithms for signal processing for swarming of honeybees. In Proceedings of the 2020 28th Telecommunications Forum (TELFOR), Belgrade, Serbia, 15–16 November 2020; pp. 1–4. [Google Scholar]
- Cecchi, S.; Terenzi, A.; Orcioni, S.; Piazza, F. Analysis of the sound emitted by honey bees in a beehive. In Proceedings of the Audio Engineering Society Convention 147. Audio Engineering Society, New York, NY, USA, 16–19 October 2019. [Google Scholar]
- Zgank, A. IoT-based bee swarm activity acoustic classification using deep neural networks. Sensors 2021, 21, 676. [Google Scholar] [CrossRef]
- Zgank, A. Bee swarm activity acoustic classification for an IoT-based farm service. Sensors 2020, 20, 21. [Google Scholar] [CrossRef] [Green Version]
- Hord, L.; Shook, E. Determining Honey Bee Behaviors from Audio Analysis. 2019. Available online: https://www.google.com.hk/url?sa=t&rct=j&q=&esrc=s&source=web&cd=&ved=2ahUKEwi77vbYhpD3AhUXx4sBHe3HBmgQFnoECAQQAQ&url=https%3A%2F%2Fcs.appstate.edu%2Fret%2Fpapers%2FDeterminingHoneyBeeBehaviorsAudioAnalysis.docx&usg=AOvVaw0mL2ZJS0YDGono-DYA_AcT (accessed on 10 March 2022).
- Tashakkori, R.; Buchanan, G.B.; Craig, L.M. Analyses of Audio and Video Recordings for Detecting a Honey Bee Hive Robbery. In Proceedings of the 2020 SoutheastCon, Online, 12–15 March 2020; pp. 1–6. [Google Scholar]
- Sharif, M.Z.; Wario, F.; Di, N.; Xue, R.; Liu, F. Soundscape Indices: New Features for Classifying Beehive Audio Samples. Sociobiology 2020, 67, 566–571. [Google Scholar] [CrossRef]
- Zhao, Y.; Deng, G.; Zhang, L.; Di, N.; Jiang, X.; Li, Z. Based investigate of beehive sound to detect air pollutants by machine learning. Ecol. Inform. 2021, 61, 101246. [Google Scholar] [CrossRef]
- Pérez, N.; Jesús, F.; Pérez, C.; Niell, S.; Draper, A.; Obrusnik, N.; Zinemanas, P.; Spina, Y.M.; Letelier, L.C.; Monzón, P. Continuous monitoring of beehives’ sound for environmental pollution control. Ecol. Eng. 2016, 90, 326–330. [Google Scholar] [CrossRef]
- Hunter, G.; Howard, D.; Gauvreau, S.; Duran, O.; Busquets, R. Processing of multi-modal environmental signals recorded from a “smart” beehive. Proc. Inst. Acoust. 2019, 41, 339–348. [Google Scholar]
- Henry, E.; Adamchuk, V.; Stanhope, T.; Buddle, C.; Rindlaub, N. Precision apiculture: Development of a wireless sensor network for honeybee hives. Comput. Electron. Agric. 2019, 156, 138–144. [Google Scholar] [CrossRef] [Green Version]
- Zubrzak, B.; Bieńkowski, P.; Cała, P.; Płaskota, P.; Rudno-Rudziński, K.; Nowakowski, P. Thermal and acoustic changes in bee colony due to exposure to microwave electromagnetic field–preliminary research. Przegląd Elektrotechniczny 2018, 94. [Google Scholar] [CrossRef]
- Kawakita, S.; Ichikawa, K.; Sakamoto, F.; Moriya, K. Sound recordings of Apis cerana japonica colonies over 24 h reveal unique daily hissing patterns. Apidologie 2019, 50, 204–214. [Google Scholar] [CrossRef] [Green Version]
- Kawakita, S.; Ichikawa, K.; Sakamoto, F.; Moriya, K. Hissing of A. cerana japonica is not only a direct aposematic response but also a frequent behavior during daytime. Insectes Sociaux 2018, 65, 331–337. [Google Scholar] [CrossRef]
- Wehmann, H.N.; Gustav, D.; Kirkerud, N.H.; Galizia, C.G. The sound and the fury—Bees hiss when expecting danger. PLoS ONE 2015, 10, e0118708. [Google Scholar] [CrossRef]
- Hong, W.; Xu, B.; Chi, X.; Cui, X.; Yan, Y.; Li, T. Long-Term and Extensive Monitoring for Bee Colonies Based on Internet of Things. IEEE Internet Things J. 2020, 7, 7148–7155. [Google Scholar] [CrossRef]
- Zacepins, A.; Kviesis, A.; Ahrendt, P.; Richter, U.; Tekin, S.; Durgun, M. Beekeeping in the future—Smart apiary management. In Proceedings of the 2016 17th International Carpathian Control Conference (ICCC), High Tatras, Slovakia, 29 May–1 June 2016; pp. 808–812. [Google Scholar]
- Murphy, F.E.; Srbinovski, B.; Magno, M.; Popovici, E.M.; Whelan, P.M. An automatic, wireless audio recording node for analysis of beehives. In Proceedings of the 2015 26th Irish Signals and Systems Conference (ISSC), Carlow, Ireland, 24–25 June 2015; pp. 1–6. [Google Scholar]
- Imoize, A.L.; Odeyemi, S.D.; Adebisi, J.A. Development of a Low-Cost Wireless Bee-Hive Temperature and Sound Monitoring System. Indones. J. Electr. Eng. Inform. 2020, 8, 476–485. [Google Scholar]
- Kawakita, S.; Ichikawa, K. Automated classification of bees and hornet using acoustic analysis of their flight sounds. Apidologie 2019, 50, 71–79. [Google Scholar] [CrossRef] [Green Version]
- Gradišek, A.; Slapničar, G.; Šorn, J.; Luštrek, M.; Gams, M.; Grad, J. Predicting species identity of bumblebees through analysis of flight buzzing sounds. Bioacoustics 2017, 26, 63–76. [Google Scholar] [CrossRef]
- Gjoreski, M.; Budna, B.; Gradišek, A.; Gams, M. JSI Sound—A machine-learning tool in Orange for simple biosound classification. In Proceedings of the 26th International Joint Conference on Artificial Intelligence, Melbourne, Australia, 19–25 August 2017. [Google Scholar]
- Ribeiro, A.P.; da Silva, N.F.F.; Mesquita, F.N.; Araújo, P.D.C.S.; Rosa, T.C.; Mesquita-Neto, J.N. Machine learning approach for automatic recognition of tomato-pollinating bees based on their buzzing-sounds. PLoS Comput. Biol. 2021, 17, e1009426. [Google Scholar] [CrossRef] [PubMed]
- Heise, D.; Miller, Z.; Wallace, M.; Galen, C. Bumble Bee Traffic Monitoring Using Acoustics. In Proceedings of the 2020 IEEE International Instrumentation and Measurement Technology Conference (I2MTC), Online, 25 May–25 June 2020; pp. 1–6. [Google Scholar]
- Heise, D.; Miller, Z.; Harrison, E.; Gradišek, A.; Grad, J.; Galen, C. Acoustically Tracking the Comings and Goings of Bumblebees. In Proceedings of the 2019 IEEE Sensors Applications Symposium (SAS), Sophia Antipolis, France, 11–13 March 2019; pp. 1–6. [Google Scholar]
- Gradišek, A.; Cheron, N.; Heise, D.; Galen, C.; Grad, J. Monitoring bumblebee daily activities using microphones. In Proceedings of the 21st Annual International Multiconference Information Society–IS 2018, Ljubljana, Slovenia, 10–14 October 2018; pp. 5–8. [Google Scholar]
- Van Goethem, S.; Verwulgen, S.; Goethijn, F.; Steckel, J. An IoT solution for measuring bee pollination efficacy. In Proceedings of the 2019 IEEE 5th World Forum on Internet of Things (WF-IoT), Limerick, Ireland, 15–18 April 2019; pp. 837–841. [Google Scholar]
- Miller-Struttmann, N.E.; Heise, D.; Schul, J.; Geib, J.C.; Galen, C. Flight of the bumble bee: Buzzes predict pollination services. PLoS ONE 2017, 12, e0179273. [Google Scholar] [CrossRef]
- Cejrowski, T.; Szymański, J.; Logofătu, D. Buzz-based recognition of the honeybee colony circadian rhythm. Comput. Electron. Agric. 2020, 175, 105586. [Google Scholar] [CrossRef]
- Galen, C.; Miller, Z.; Lynn, A.; Axe, M.; Holden, S.; Storks, L.; Ramirez, E.; Asante, E.; Heise, D.; Kephart, S.; et al. Pollination on the dark side: Acoustic monitoring reveals impacts of a total solar eclipse on flight behavior and activity schedule of foraging bees. Ann. Entomol. Soc. Am. 2019, 112, 20–26. [Google Scholar] [CrossRef]
- De Luca, P.A.; Giebink, N.; Mason, A.C.; Papaj, D.; Buchmann, S.L. How well do acoustic recordings characterize properties of bee (Anthophila) floral sonication vibrations? Bioacoustics 2020, 29, 1–14. [Google Scholar] [CrossRef]
- Kulyukin, V.A.; Reka, S.K. Toward Sustainable Electronic Beehive Monitoring: Algorithms for Omnidirectional Bee Counting from Images and Harmonic Analysis of Buzzing Signals. Eng. Lett. 2016, 24, 317–327. [Google Scholar]
- Cane, J.H. The oligolectic bee Osmia brevis sonicates Penstemon flowers for pollen: A newly documented behavior for the Megachilidae. Apidologie 2014, 45, 678–684. [Google Scholar] [CrossRef] [Green Version]
- Schlegel, T.; Visscher, P.K.; Seeley, T.D. Beeping and piping: Characterization of two mechano-acoustic signals used by honey bees in swarming. Naturwissenschaften 2012, 99, 1067–1071. [Google Scholar] [CrossRef]
- Tayal, M.; Kariyat, R. Examining the Role of Buzzing Time and Acoustics on Pollen Extraction of Solanum elaeagnifolium. Plants 2021, 10, 2592. [Google Scholar] [CrossRef] [PubMed]
- Cejrowski, T.; Szymański, J. Buzz-based honeybee colony fingerprint. Comput. Electron. Agric. 2021, 191, 106489. [Google Scholar] [CrossRef]
- Miller, Z.J. What’s the Buzz About? Progress and Potential of Acoustic Monitoring Technologies for Investigating Bumble Bees. IEEE Instrum. Meas. Mag. 2021, 24, 21–29. [Google Scholar] [CrossRef]
- Switzer, C.M.; Hogendoorn, K.; Ravi, S.; Combes, S.A. Shakers and head bangers: Differences in sonication behavior between Australian Amegilla murrayensis (blue-banded bees) and North American Bombus impatiens (bumblebees). Arthropod Plant Interact. 2016, 10, 1–8. [Google Scholar] [CrossRef]
- De Luca, P.A.; Cox, D.A.; Vallejo-Marín, M. Comparison of pollination and defensive buzzes in bumblebees indicates species-specific and context-dependent vibrations. Naturwissenschaften 2014, 101, 331–338. [Google Scholar] [CrossRef] [PubMed]
- Huber, P.J. Robust estimation of a location parameter. In Breakthroughs in Statistics; Springer: Berlin, Germany, 1992; pp. 492–518. [Google Scholar]
- Šekulja, D.; Pechhacker, H.; Licek, E. Drifting behavior of honey bees (Apis Mellifera Carnica Pollman, 1879) in the epidemiology of American foulbrood. Zb. Veleučilišta U Rijeci 2014, 2, 345–358. [Google Scholar]
- Tashakkori, R.; Hernandez, N.P.; Ghadiri, A.; Ratzloff, A.P.; Crawford, M.B. A honeybee hive monitoring system: From surveillance cameras to Raspberry Pis. In Proceedings of the SoutheastCon 2017, Charlotte, NC, USA, 1 April 2017; pp. 1–7. [Google Scholar]
- Kale, D.J.; Tashakkori, R.; Parry, R.M. Automated beehive surveillance using computer vision. In Proceedings of the SoutheastCon 2015, Fort Lauderdale, FL, USA, 9–12 April 2015. [Google Scholar]
- Grenier, É.; Giovenazzo, P.; Julien, C.; Goupil-Sormany, I. Honeybees as a biomonitoring species to assess environmental airborne pollution in different socioeconomic city districts. Environ. Monit. Assess. 2021, 193, 740. [Google Scholar] [CrossRef]
- Como, F.; Carnesecchi, E.; Volani, S.; Dorne, J.; Richardson, J.; Bassan, A.; Pavan, M.; Benfenati, E. Predicting acute contact toxicity of pesticides in honeybees (Apis mellifera) through a k-nearest neighbor model. Chemosphere 2017, 166, 438–444. [Google Scholar] [CrossRef]
- Robertson, H.M.; Wanner, K.W. The chemoreceptor superfamily in the honey bee, Apis mellifera: Expansion of the odorant, but not gustatory, receptor family. Genome Res. 2006, 16, 1395–1403. [Google Scholar] [CrossRef] [Green Version]
- Fuchs, S.; Tautz, J. Colony defence and natural enemies. In Honeybees of Asia; Springer: Berlin, Germany, 2011; pp. 369–395. [Google Scholar]
- Kirchner, W.; Röschard, J. Hissing in bumblebees: An interspecific defence signal. Insectes Sociaux 1999, 46, 239–243. [Google Scholar] [CrossRef]
- Heidelbach, J.; Böhm, H.; Kirchner, W. Sound and vibration signals in a bumble bee colony (Bombus terrestris). Zoology 1998, 101, 82. [Google Scholar]
- Bencsik, M.; Bencsik, J.; Baxter, M.; Lucian, A.; Romieu, J.; Millet, M. Identification of the honey bee swarming process by analysing the time course of hive vibrations. Comput. Electron. Agric. 2011, 76, 44–50. [Google Scholar] [CrossRef]
- Davis, S.; Mermelstein, P. Comparison of parametric representations for monosyllabic word recognition in continuously spoken sentences. IEEE Trans. Acoust. Speech Signal Process. 1980, 28, 357–366. [Google Scholar] [CrossRef] [Green Version]
- Yegnanarayana, B.; Prasanna, S.M.; Zachariah, J.M.; Gupta, C.S. Combining evidence from source, suprasegmental and spectral features for a fixed-text speaker verification system. IEEE Trans. Speech Audio Process. 2005, 13, 575–582. [Google Scholar] [CrossRef]
- Huang, N.E. Introduction to the Hilbert–Huang transform and its related mathematical problems. In Hilbert–Huang Transform and Its Applications; World Scientific: Singapore, 2014; pp. 1–26. [Google Scholar]
- Atal, B.S.; Hanauer, S.L. Speech analysis and synthesis by linear prediction of the speech wave. J. Acoust. Soc. Am. 1971, 50, 637–655. [Google Scholar] [CrossRef] [PubMed] [Green Version]
- Szabó, B.T.; Denham, S.L.; Winkler, I. Computational models of auditory scene analysis: A review. Front. Neurosci. 2016, 10, 524. [Google Scholar] [CrossRef] [Green Version]
- Cortes, C.; Vapnik, V. Support-vector networks. Mach. Learn. 1995, 20, 273–297. [Google Scholar] [CrossRef]
- Breiman, L. Bagging predictors. Mach. Learn. 1996, 24, 123–140. [Google Scholar] [CrossRef] [Green Version]
- Breiman, L.; Friedman, J.H.; Olshen, R.A.; Stone, C.J. Classification and Regression Trees; Routledge: Oxfordshire, UK, 2017. [Google Scholar]
- Chen, T.; Guestrin, C. Xgboost: A scalable tree boosting system. In Proceedings of the 22nd ACM SIGKDD International Conference on Knowledge Discovery and Data Mining, San Francisco, CA, USA, 13–17 April 2016; pp. 785–794. [Google Scholar]
- Sridhar, K.; Cutler, R.; Saabas, A.; Parnamaa, T.; Loide, M.; Gamper, H.; Braun, S.; Aichner, R.; Srinivasan, S. ICASSP 2021 Acoustic Echo Cancellation Challenge: Datasets, Testing Framework, and Results. In Proceedings of the IEEE International Conference on Acoustics, Speech and Signal Processing (ICASSP), Toronto, ON, Canada, 6–11 June 2021; pp. 151–155. [Google Scholar]
Figure 1.
Databases query results and paper selection process.

Figure 2.
Country of first author affiliation.

Figure 3.
Study goal of articles with respect to the year published.


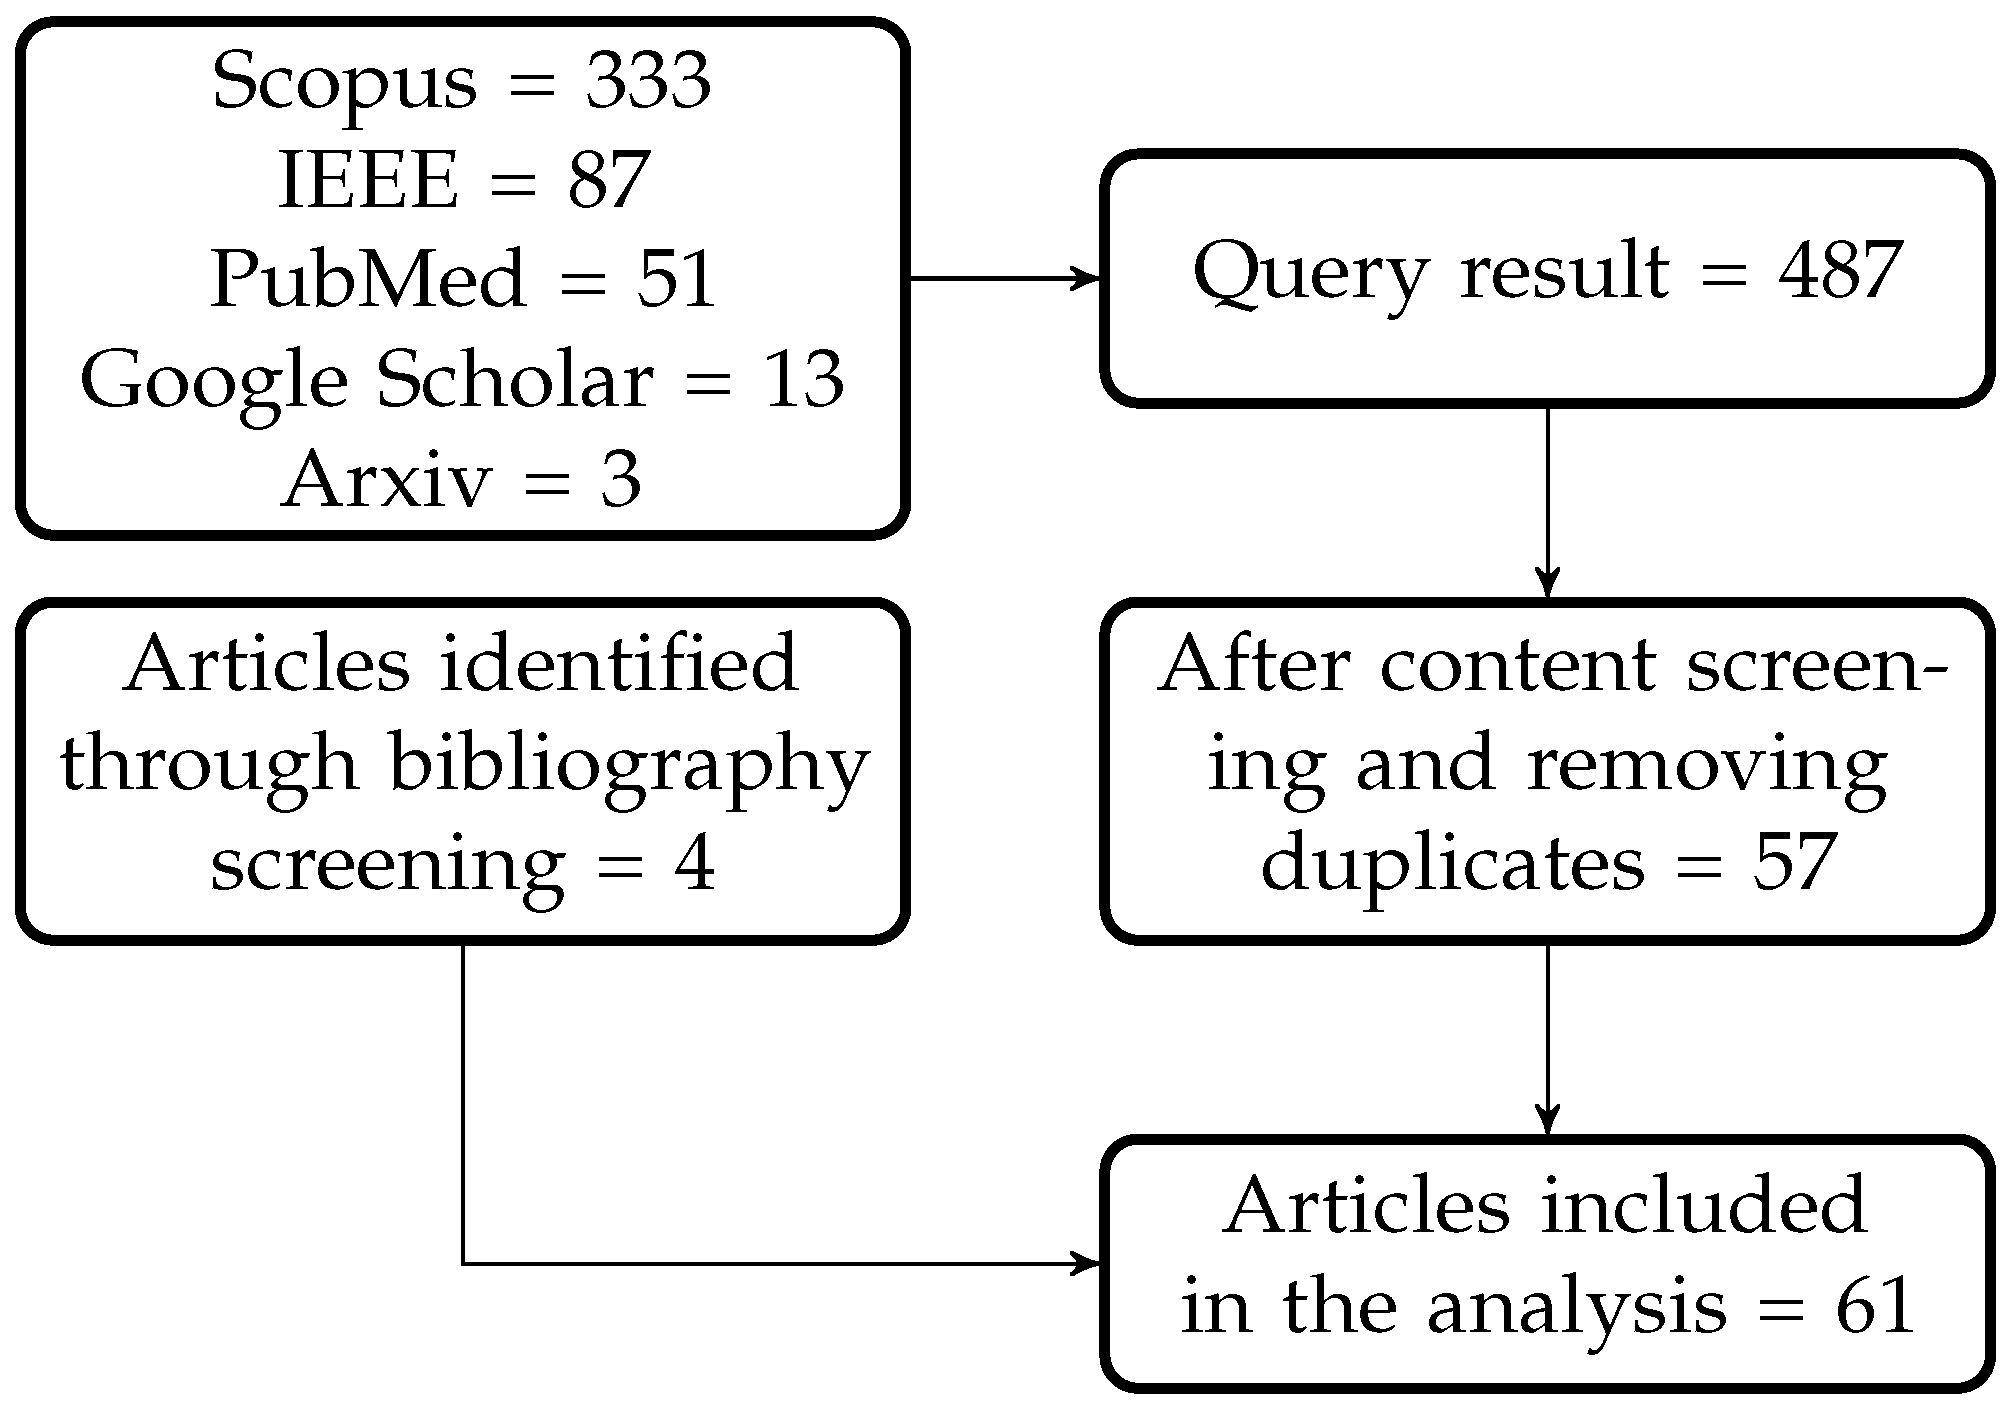
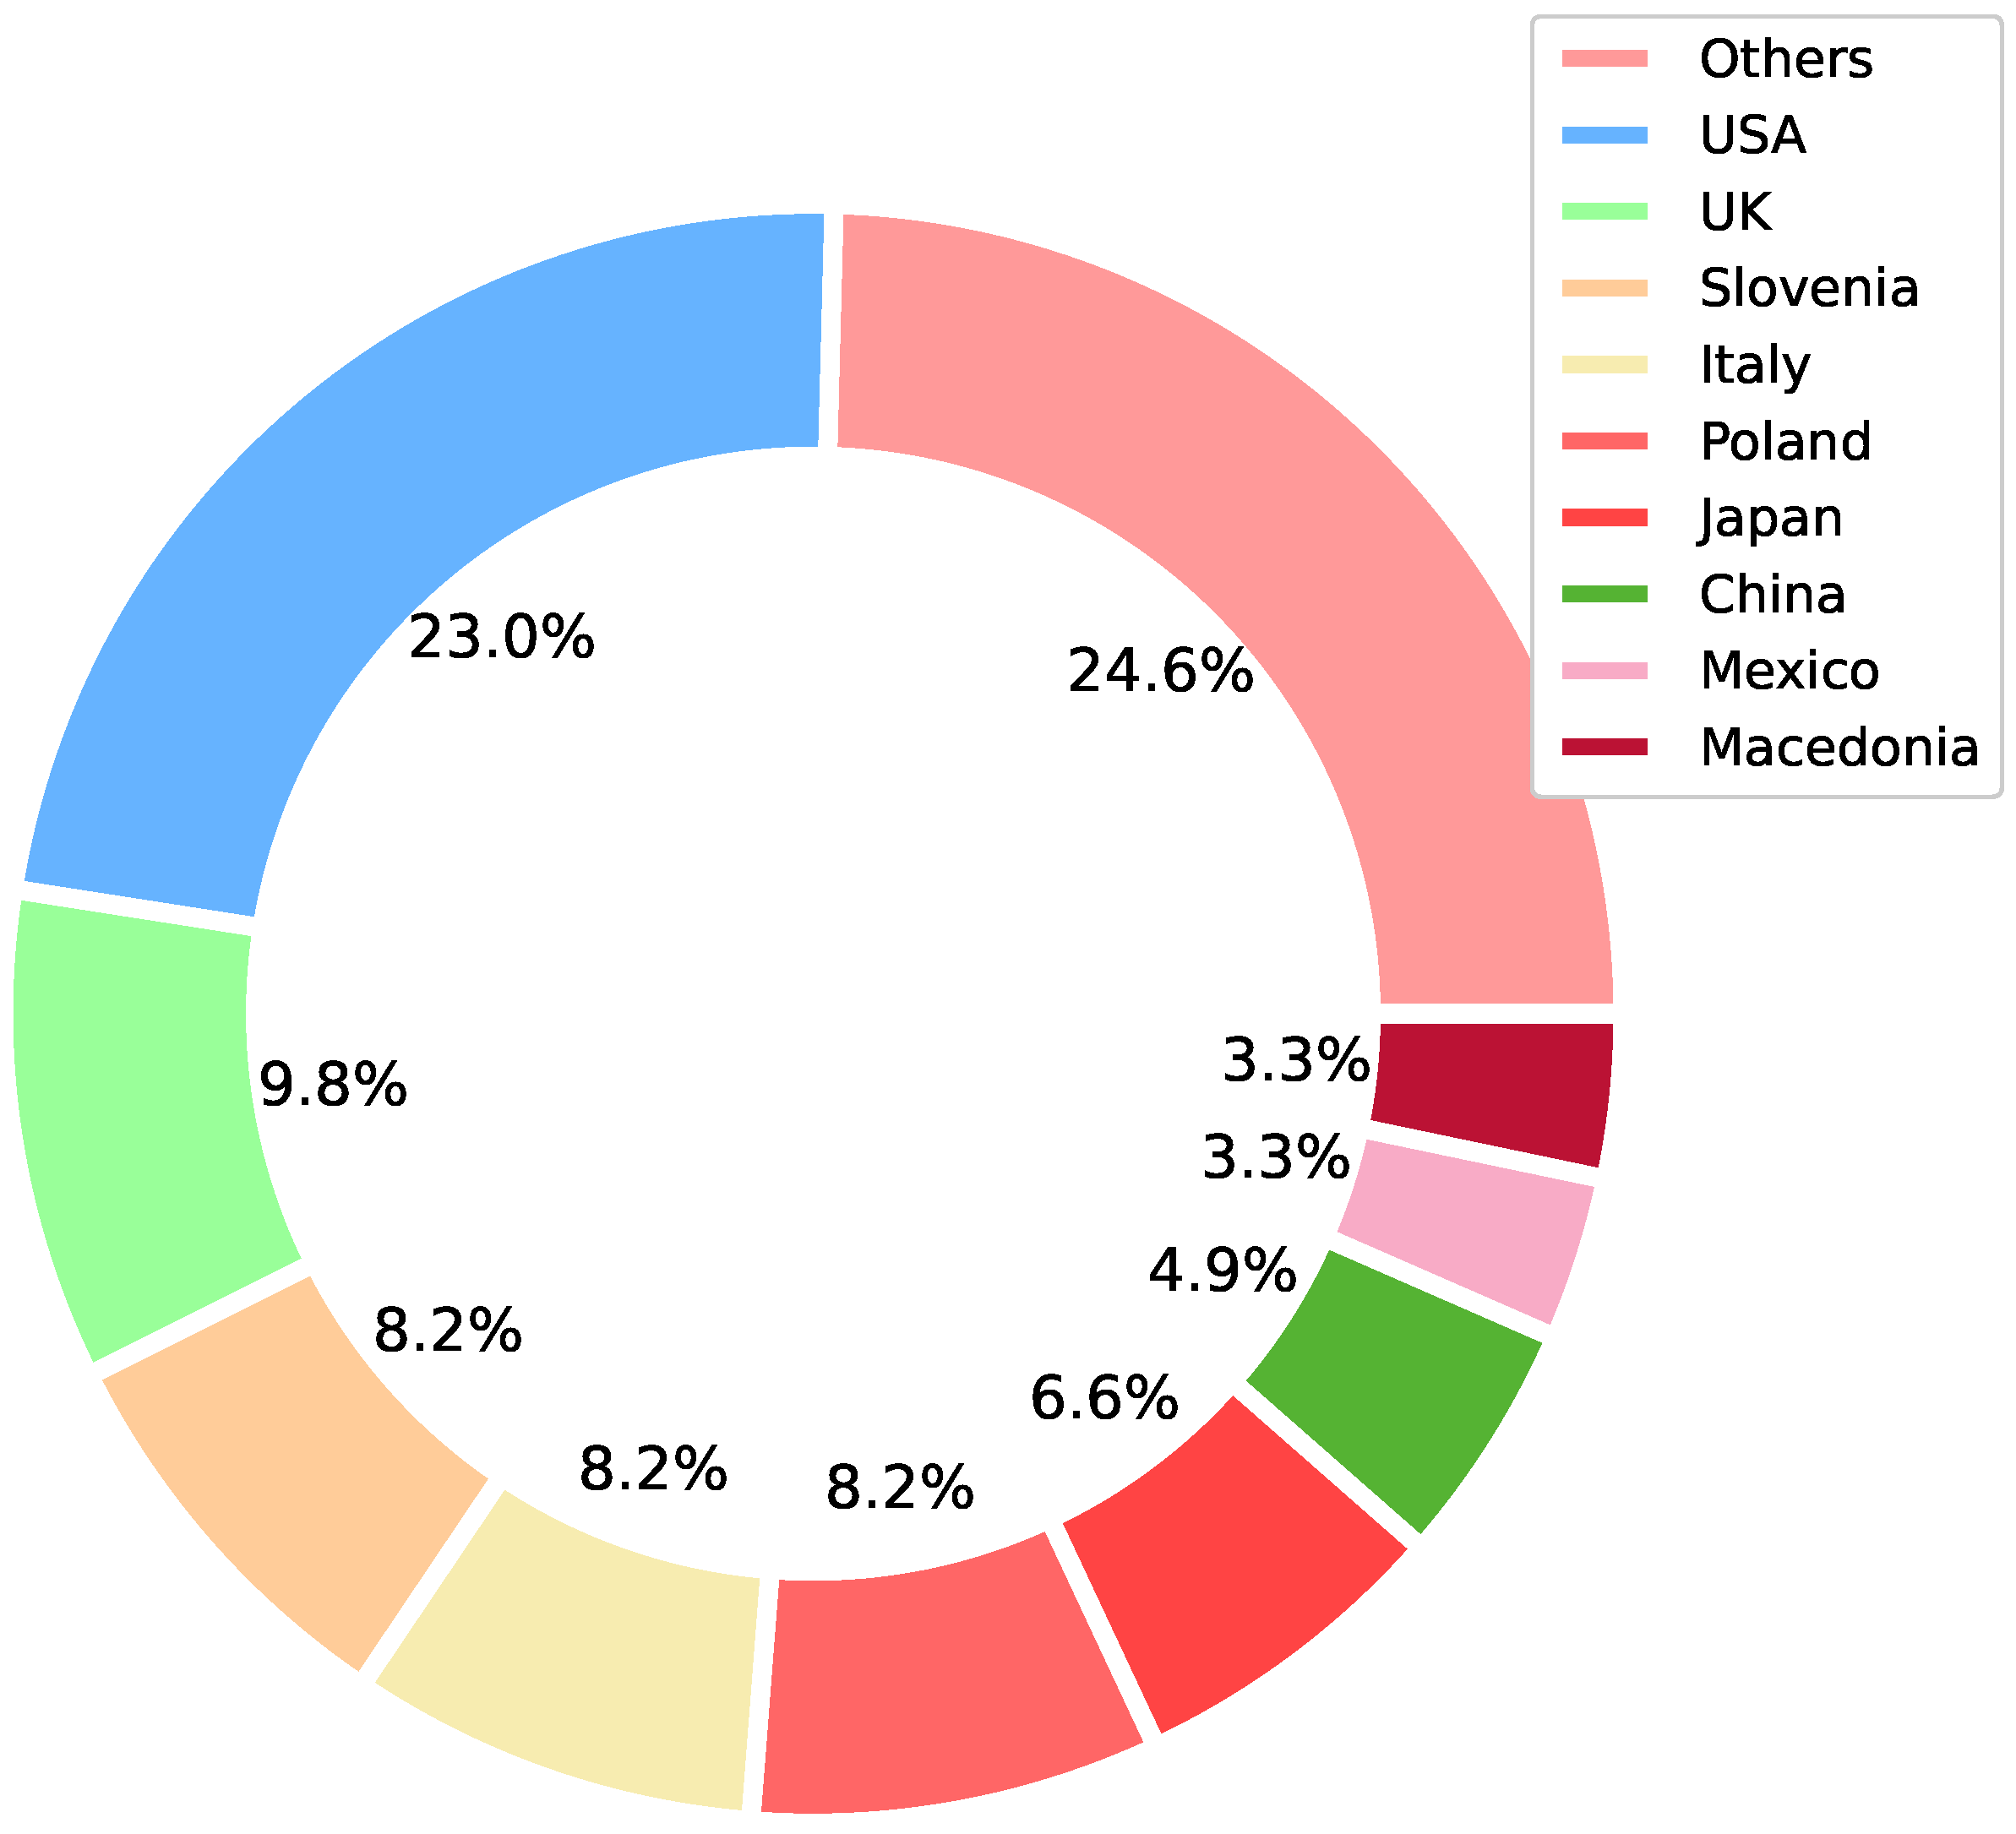
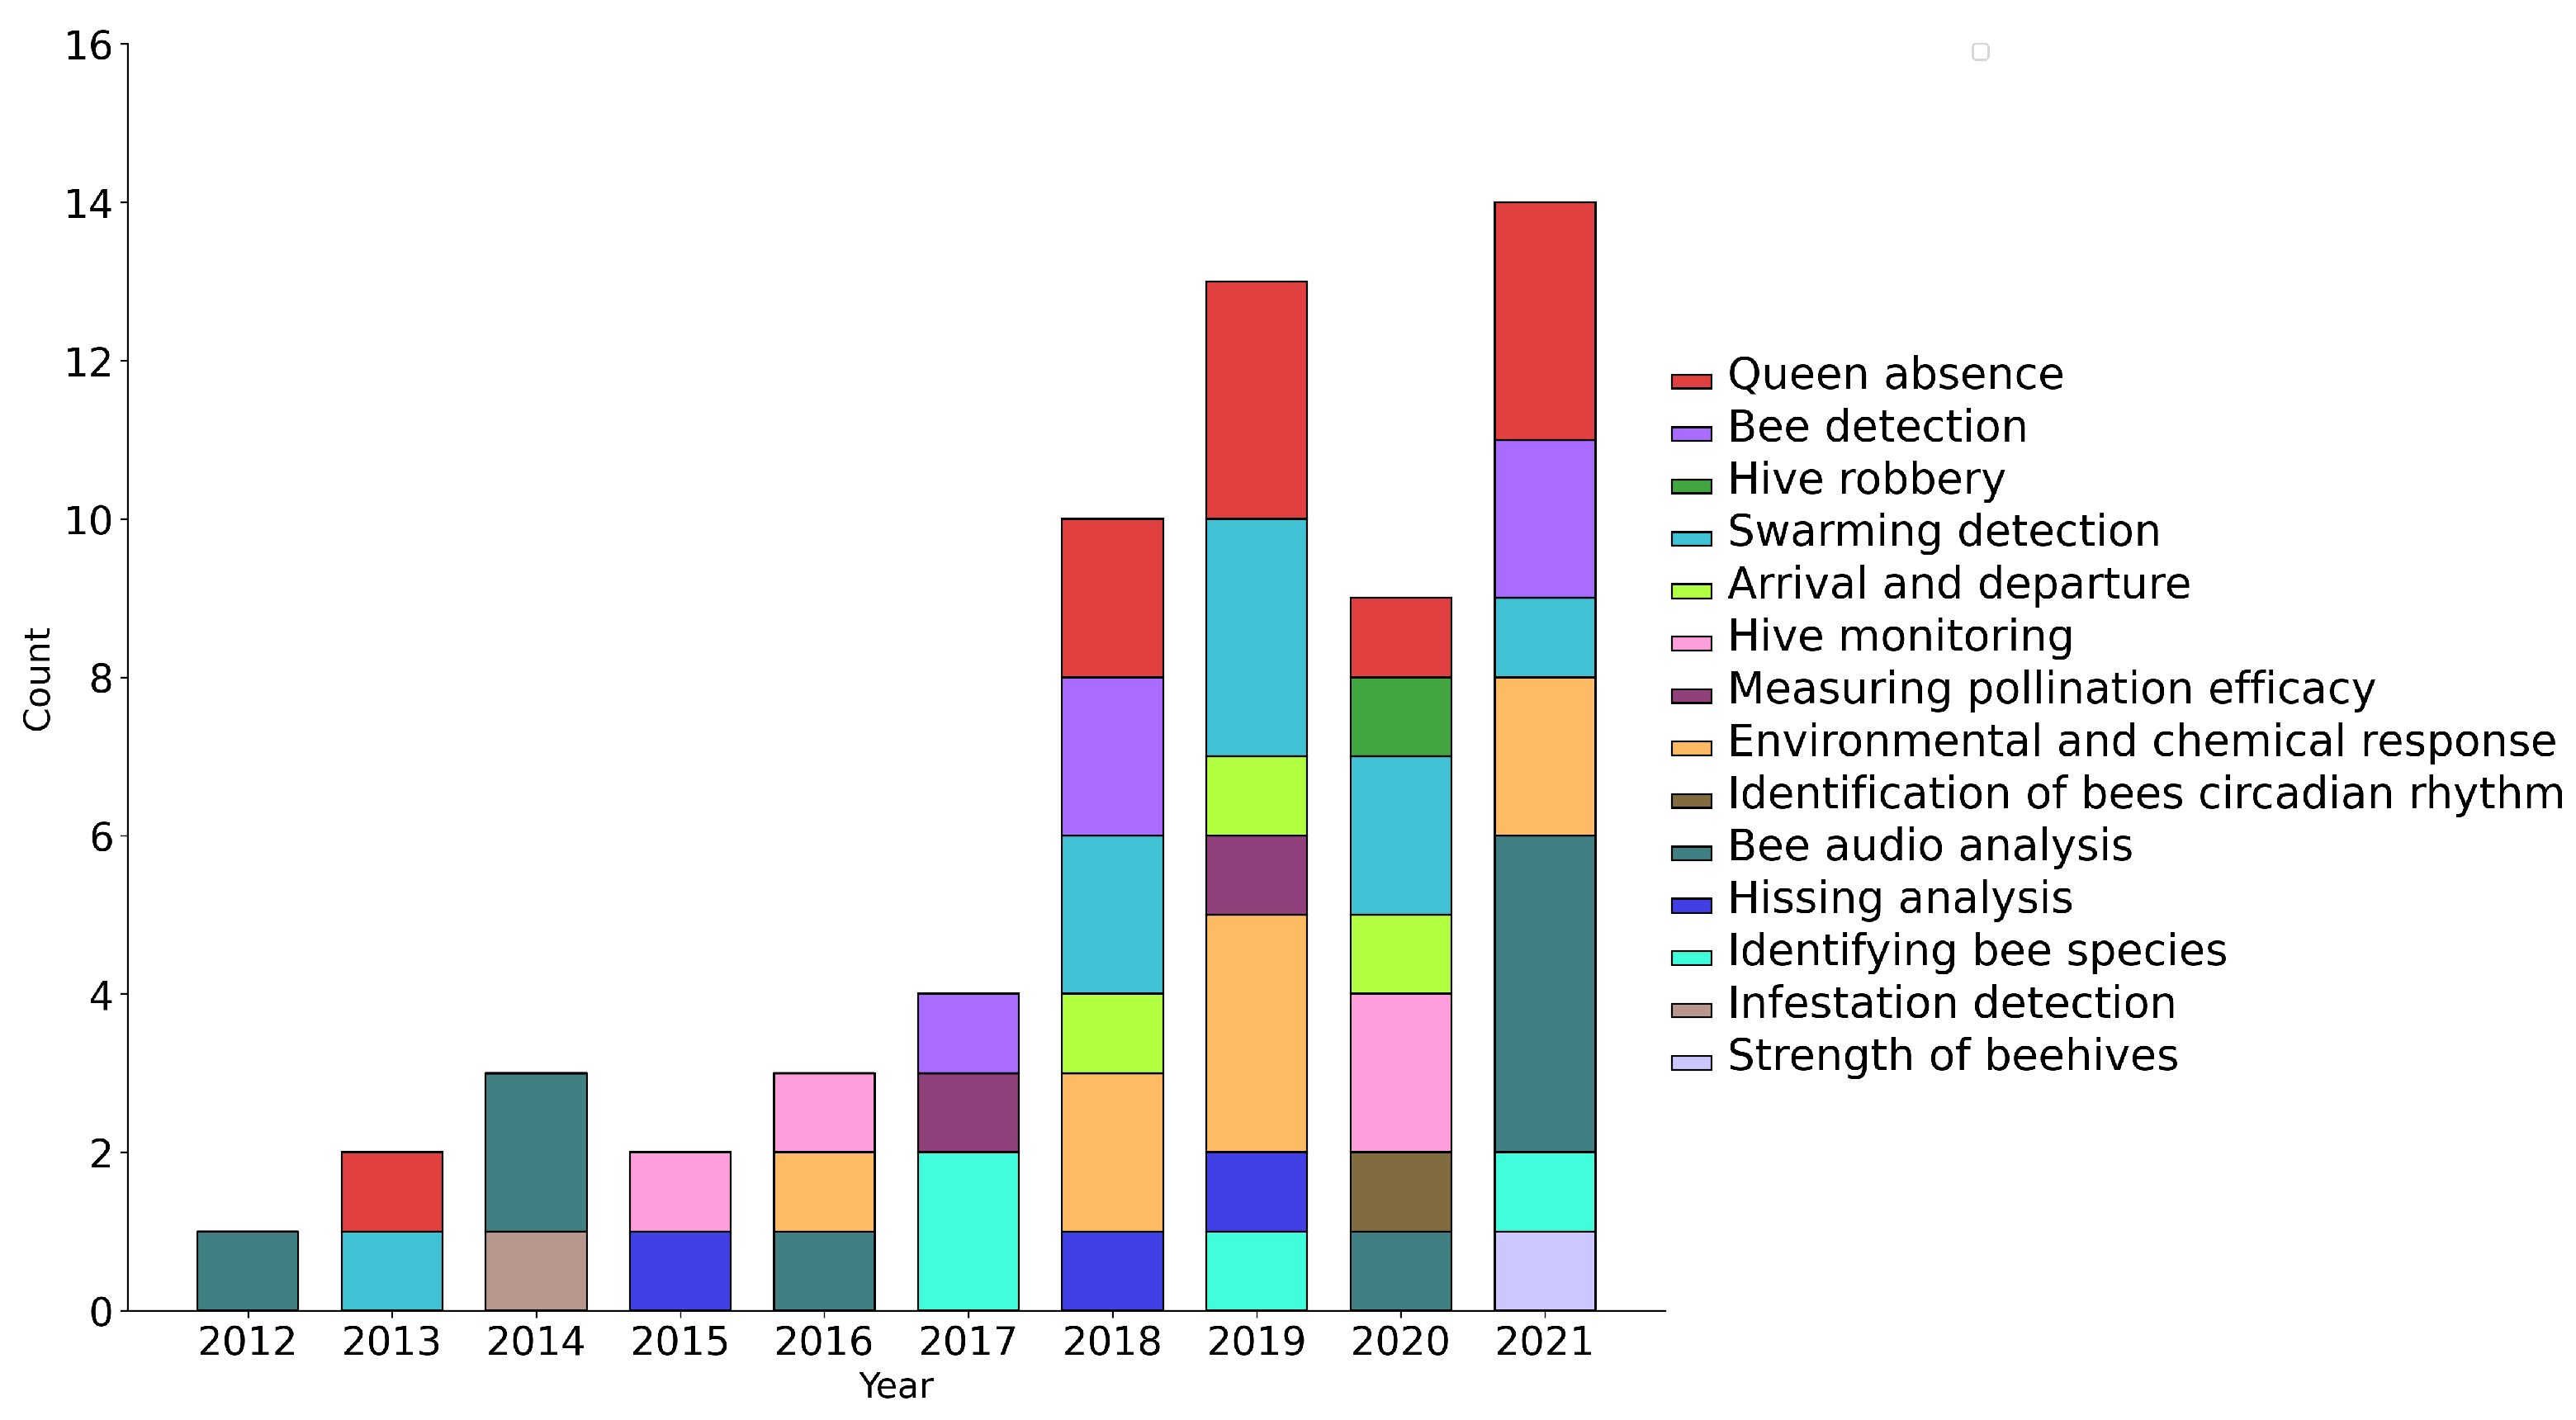
Table 1.
Eligibility criteria for inclusion and exclusion of articles.
| Inclusion–Studies using audio to: |
| Detect bees |
| Predict hive strength |
| Detect swarming |
| Detect queen bee missing |
| Detect mite attack |
| Identify bee species |
| Measure pollination efficacy |
| Detect environmental effects |
| Detect arrival and departure of bees |
| Exclusion–Studies focusing on: |
| Software development of hive monitoring |
| Hardware development of hive monitoring |
Table 2.
Items extracted from each study.
| Category | Data Item | Description |
|---|---|---|
| Origin of article | Type of publication | Whether the study was published as a journal article, a conference paper or in an electronic preprint repository. |
| Venue | Publishing venue, such as the name of a journal or conference. | |
| Country of first author affiliation | Location of the affiliated university, institute or research body of the first author. | |
| Study rationale | Study goal | Application or aim of the article. |
| Experiment setup | Species of bee | Exact name of the bee specie. |
| Number of beehives or bees | Exact number of beehives or single bees. | |
| Time of the recordings | Month and hour of the day for audio recordings. | |
| Sampling rate of audio files | Sampling rate of audio files | |
| Microphone information | Resolution and frequency response of the microphone. | |
| Audio preprocessing | Steps applied to the raw data to prepare it for use by the architecture or for feature extraction. | |
| Audio analysis method | Features | Features extracted from audio files for visualization or a machine learning framework. |
| Machine learning algorithm | Name of machine learning algorithm if a machine learning framework is used | |
| Performance metrics | Metrics used in the study to report performance (e.g., accuracy, f1-score, etc) if a machine learning framework is used. | |
| Reproducibility | Dataset | Whether the data used for the experiment come from private recordings or from a publicly available dataset. |
| Code | Whether the code used for the experiment is available online or not, and if so, where. |
Table 3.
List of articles exploring different study goals.
| Study Goal | Articles |
|---|---|
| Bee detection | [41,45,46,47,48] |
| Strength of beehives | [49] |
| Queen absence | [31,39,50,51,52,53,54,55,56,57,58] |
| Swarming detection | [20,21,59,60,61,62,63,64,65] |
| Hive robbery | [66] |
| Infestation detection | [28] |
| Detecting environmental pollution and chemicals | [67,68,69,70] |
| Smoke reaction | [39] |
| Effect of electromagnetic exposure | [71,72] |
| Hissing analysis | [73,74,75] |
| Hive monitoring | [76,77,78,79] |
| Identifying bee species | [80,81,82,83] |
| Bee arrival and departure | [84,85,86] |
| Measuring bee pollination efficacy | [87,88] |
| Identification of bees circadian rhythm | [89] |
| Impacts of a total solar eclipse on flight behavior | [90] |
| Bee audio analysis | [91,92,93,94,95,96,97,98,99] |
Table 4.
Bee Species.
| Bee Species | Articles |
|---|---|
| Apis mellifera | [20,28,49,56,60,61,62,67,68,69,71,75,78,79,89] |
| A. cerana | [76] |
| A. mellifera ligustica | [39,41,50,52,53,54,57,58,65,66,94] |
| A. cerana japonica | [73,74] |
| A. mellifera carnica | [31,41,55,57,72] |
| Augochloropsis brachycephala | [83] |
| Amegilla murrayensis | [98] |
| Bombus spp. | [82,90,91] |
| B. impatiens | [91] |
| B. ardens | [80] |
| B. latreille | [90] |
| B. balteatus | [88] |
| B. terrestris | [81,87,99] |
| B. pascuorum | [81,85,86,99] |
| B. sylvicola | [84,85,88] |
| B. morio and B. atratus | [83] |
| B. humilis and B. hypnorum | [81,86] |
| B. argillaceus, B. jonellus, B. ruderarius, B. sylvarum | [81] |
| B. hortorum, B. lapidarius, B. pratorum, B. lucorum | [81,99] |
| B. nevadensis, B. frigidus, B. flavifrons, B. mixtus | [84] |
| Centris tarsata and Centris trigonoides | [83] |
| Eulaema nigrita | [83] |
| Exomalopsis analis and Exomalospsis minor | [83] |
| Halictus | [90,95] |
| Megachile | [90,95] |
| Melipona bicolor and Melipona quadrifasciata | [83] |
| Osmia brevis (oligolectic) | [93] |
| Pseudaugochlora graminea | [83] |
| Slovenian apis mellifera carnica | [50] |
| T. nipponensis and V. s. xanthoptera | [80] |
| Xylocopa nigrocincta and Xylocopa suspecta | [83] |
Table 5.
Microphone characterization.
| Microphone Frequency Range (Hz) | Articles |
|---|---|
| 6–20,000 | [64] |
| 15–20,000 | [41] |
| 20–20,000 | [55] |
| 40–20,000 | [75] |
| 50–10,000 | [88] |
| 70–16,000 | [94] |
| 100–15,000 | [39,71] |
Table 6.
Feature extraction methods explored.
| Feature | Articles |
|---|---|
| Fast Fourier transform and s-transform | [57] |
| Spectrogram (STFT) | [28,41,45,54,57,61,62,69,75,76,77,93] |
| Mel-scaled spectrogram | [41,47,48,53,54] |
| Mel-frequency cepstral coefficients | [21,31,47,48,50,53,54,55,62,63,64,67,68,80,81,82,83,89] |
| Improved mel-frequency cepstral coefficients | [51] |
| Discrete wavelet transform | [52,54,62] |
| Continuous wavelet transform | [54,62] |
| Hilbert–Huang transform | [52,53,54,62] |
| Linear predictive coding | [56,64] |
| Power spectral density | [20,78] |
| Constant-Q transform | [47] |
| Temporal features | [71,79,90,91] |
| Spectral features | [28,84,99] |
| Computational auditory scene analysis | [46,85,88] |
| Sound indices | [67,96] |
Table 7.
Classification algorithms.
| Classifier | Articles |
|---|---|
| Linear discriminant analysis | [28] |
| Logistic regression | [31,50,55,83] |
| Support vector machines | [28,41,47,49,53,56,68,80,81,82,83,87,89] |
| K-nearest neighbours | [68] |
| Naive Bayes | [81,82] |
| Decision tree | [81,82,83] |
| Random forest | [47,67,68,81,82,83] |
| XGBoost | [47] |
| Multi-layer perceptron | [49,50,51,63] |
| Convolutional neural networks | [41,47,49,53,54] |
| Long short-term memory | [50] |
| Gaussian mixture models | [21,64] |
| Hidden Markov models | [21,63,64] |
Publisher’s Note: MDPI stays neutral with regard to jurisdictional claims in published maps and institutional affiliations. |
© 2022 by the authors. Licensee MDPI, Basel, Switzerland. This article is an open access article distributed under the terms and conditions of the Creative Commons Attribution (CC BY) license (https://creativecommons.org/licenses/by/4.0/).
Share and Cite
MDPI and ACS Style
Abdollahi, M.; Giovenazzo, P.; Falk, T.H. Automated Beehive Acoustics Monitoring: A Comprehensive Review of the Literature and Recommendations for Future Work. Appl. Sci. 2022, 12, 3920. https://doi.org/10.3390/app12083920
AMA Style
Abdollahi M, Giovenazzo P, Falk TH. Automated Beehive Acoustics Monitoring: A Comprehensive Review of the Literature and Recommendations for Future Work. Applied Sciences. 2022; 12(8):3920. https://doi.org/10.3390/app12083920
Chicago/Turabian StyleAbdollahi, Mahsa, Pierre Giovenazzo, and Tiago H. Falk. 2022. "Automated Beehive Acoustics Monitoring: A Comprehensive Review of the Literature and Recommendations for Future Work" Applied Sciences 12, no. 8: 3920. https://doi.org/10.3390/app12083920
Note that from the first issue of 2016, this journal uses article numbers instead of page numbers. See further details here.