1. Introduction
The edge is the basic feature of images that reflects the discontinuity of the gray level of the image [
1]. Determining and extracting edges is the basis of image analysis and image processing. Edge detection has a wide range of applications in image segmentation, object recognition, industrial detection, and 3D reconstruction [
2,
3]. Image edge-detection algorithms are divided into traditional edge-detection algorithms and edge-detection algorithms based on wavelet transform. Research on traditional edge-detection algorithms first appeared in the 1950s. In 1963, Roberts proposed using the distribution of gradient value to detect the edge of an image by taking advantage of the discontinuity of the gray level of an image. Later, the well-known 2 × 2 Roberts detection operator was formed in 1965 [
4]. In 1970, Sobel proposed an isotropic gradient operator and applied it to image processing, forming a 3 × 3 Sobel operator [
5]. In the same year, Prewitt proposed a 3 × 3 operator similar to Sobel, which extracted the edges of an image by calculating gradients in both the horizontal and vertical directions [
6]. In 1986, Canny proposed an operator with a better effect on image edge extraction, and proposed three criteria for this operator to meet, that is, the Canny operator [
7]. The edge effect of the Canny operator is better than that of the previous operators. Since then, inspired by these classical operators, researchers have also proposed many improved algorithms to improve the accuracy and integrity of edge detection. With the rapid development of wavelet theory, many algorithms of image edge extraction based on wavelet transform appeared quickly. At the beginning of the 21st century, Mallat proposed an algorithm for image edge detection based on wavelet transform. The algorithm first performed wavelet transform on a processed image to obtain a gradient image, and then selected the local maximum points in the obtained gradient image as the edge points [
8]. Since then, edge-detection algorithms based on wavelet transform have developed continuously.
Compared with the traditional edge-detection algorithm, edge-detection algorithms based on wavelet transform have good time–frequency domain characteristics and multi-scale analysis ability, and the edge detection effect is good. However, there are still many problems in these algorithms, which cannot completely extract the effective edge. Therefore, many scholars are committed to studying its improvement. In 2014, Wang et al. proposed an improved wavelet modulus maxima algorithm that used the quadratic discriminant method to detect the local modulus maxima according to the edge and noise difference after wavelet transformation to achieve the separation of noise and edge. This algorithm can solve the problems of the high positioning accuracy and inconsistent denoising ability of traditional edge-detection algorithms [
9]. In 2016, Wang et al. proposed an algorithm that combines local blur enhancement, wavelet transform modulus maxima, and multi-scale products. The algorithm locates defect areas with low contrast in the HSI color space, and then performs local blur enhancement and calculation. A binary image of the defect edge of aluminum foil is obtained by the multi-scale product and wavelet transform. The algorithm can extract sharper and more complete edges [
10]. In 2018, Kostyukhina et al. proposed an image edge detection method based on wavelet transform energy features. The method has a faster edge extraction speed and can be used to solve the detection and recognition problems of objects in images in various information processing and control systems [
11]. In 2020, Feng et al. proposed a wavelet multi-scale edge-detection algorithm. The algorithm multiplies the wavelet coefficients by the adjacent scale products, and the local modulus maximum point of the scale product coefficients is determined as an edge. The algorithm can not only improve the detection performance, but also reduce the interaction between adjacent edges [
12]. In 2021, Isar et al. proposed a robust edge-detection algorithm based on a two-stage denoising system in a super-analytical wavelet transform domain. The algorithm can accurately extract edge information in the case of imposed white Gaussian noise or multiplicative speckle noise [
13].
The current edge-detection algorithm based on wavelet transform mostly uses the gray-level change of the light intensity image to extract the edge. Due to the influence of lighting conditions, weather conditions, and observation locations, the images have noise and low contrast, and this edge information cannot be accurately obtained. The polarization image is a beneficial supplement to the intensity image, which can reflect the material type, surface roughness, improve the contrast between the target and the background, and highlight the edge and detail information [
14,
15]. Therefore, the fusion of the light intensity edge and polarization edge is an effective method to detect more edge details.
In this paper, an improved wavelet modulus maxima algorithm for the fusion of light intensity and degree of polarization is proposed. Firstly, the principle and flow of the algorithm are given. Then, an improved wavelet modulus maxima algorithm is introduced, which can accurately obtain the edge of light intensity image and polarization image. Then, the method of edge refinement and fusion to obtain the light intensity and edge polarization degree is introduced, which can increase the effective edge and eliminate false edges. Finally, we verify the effectiveness of the proposed algorithm through simulation experiments. In this paper, the improved wavelet modulus maxima algorithm for the fusion of light intensity and degree of polarization can solve the problems of poor edge connectivity and adaptive ability of traditional wavelet modulus maxima algorithm, and can overcome the deficiency of less information and low accuracy of edge detection using light intensity image only. The research in this paper provides a reference for edge detection of images with serious noise interference and low contrast.
2. Improved Wavelet Modulus Algorithm Based on Fusion of Light Intensity and Degree of Polarization
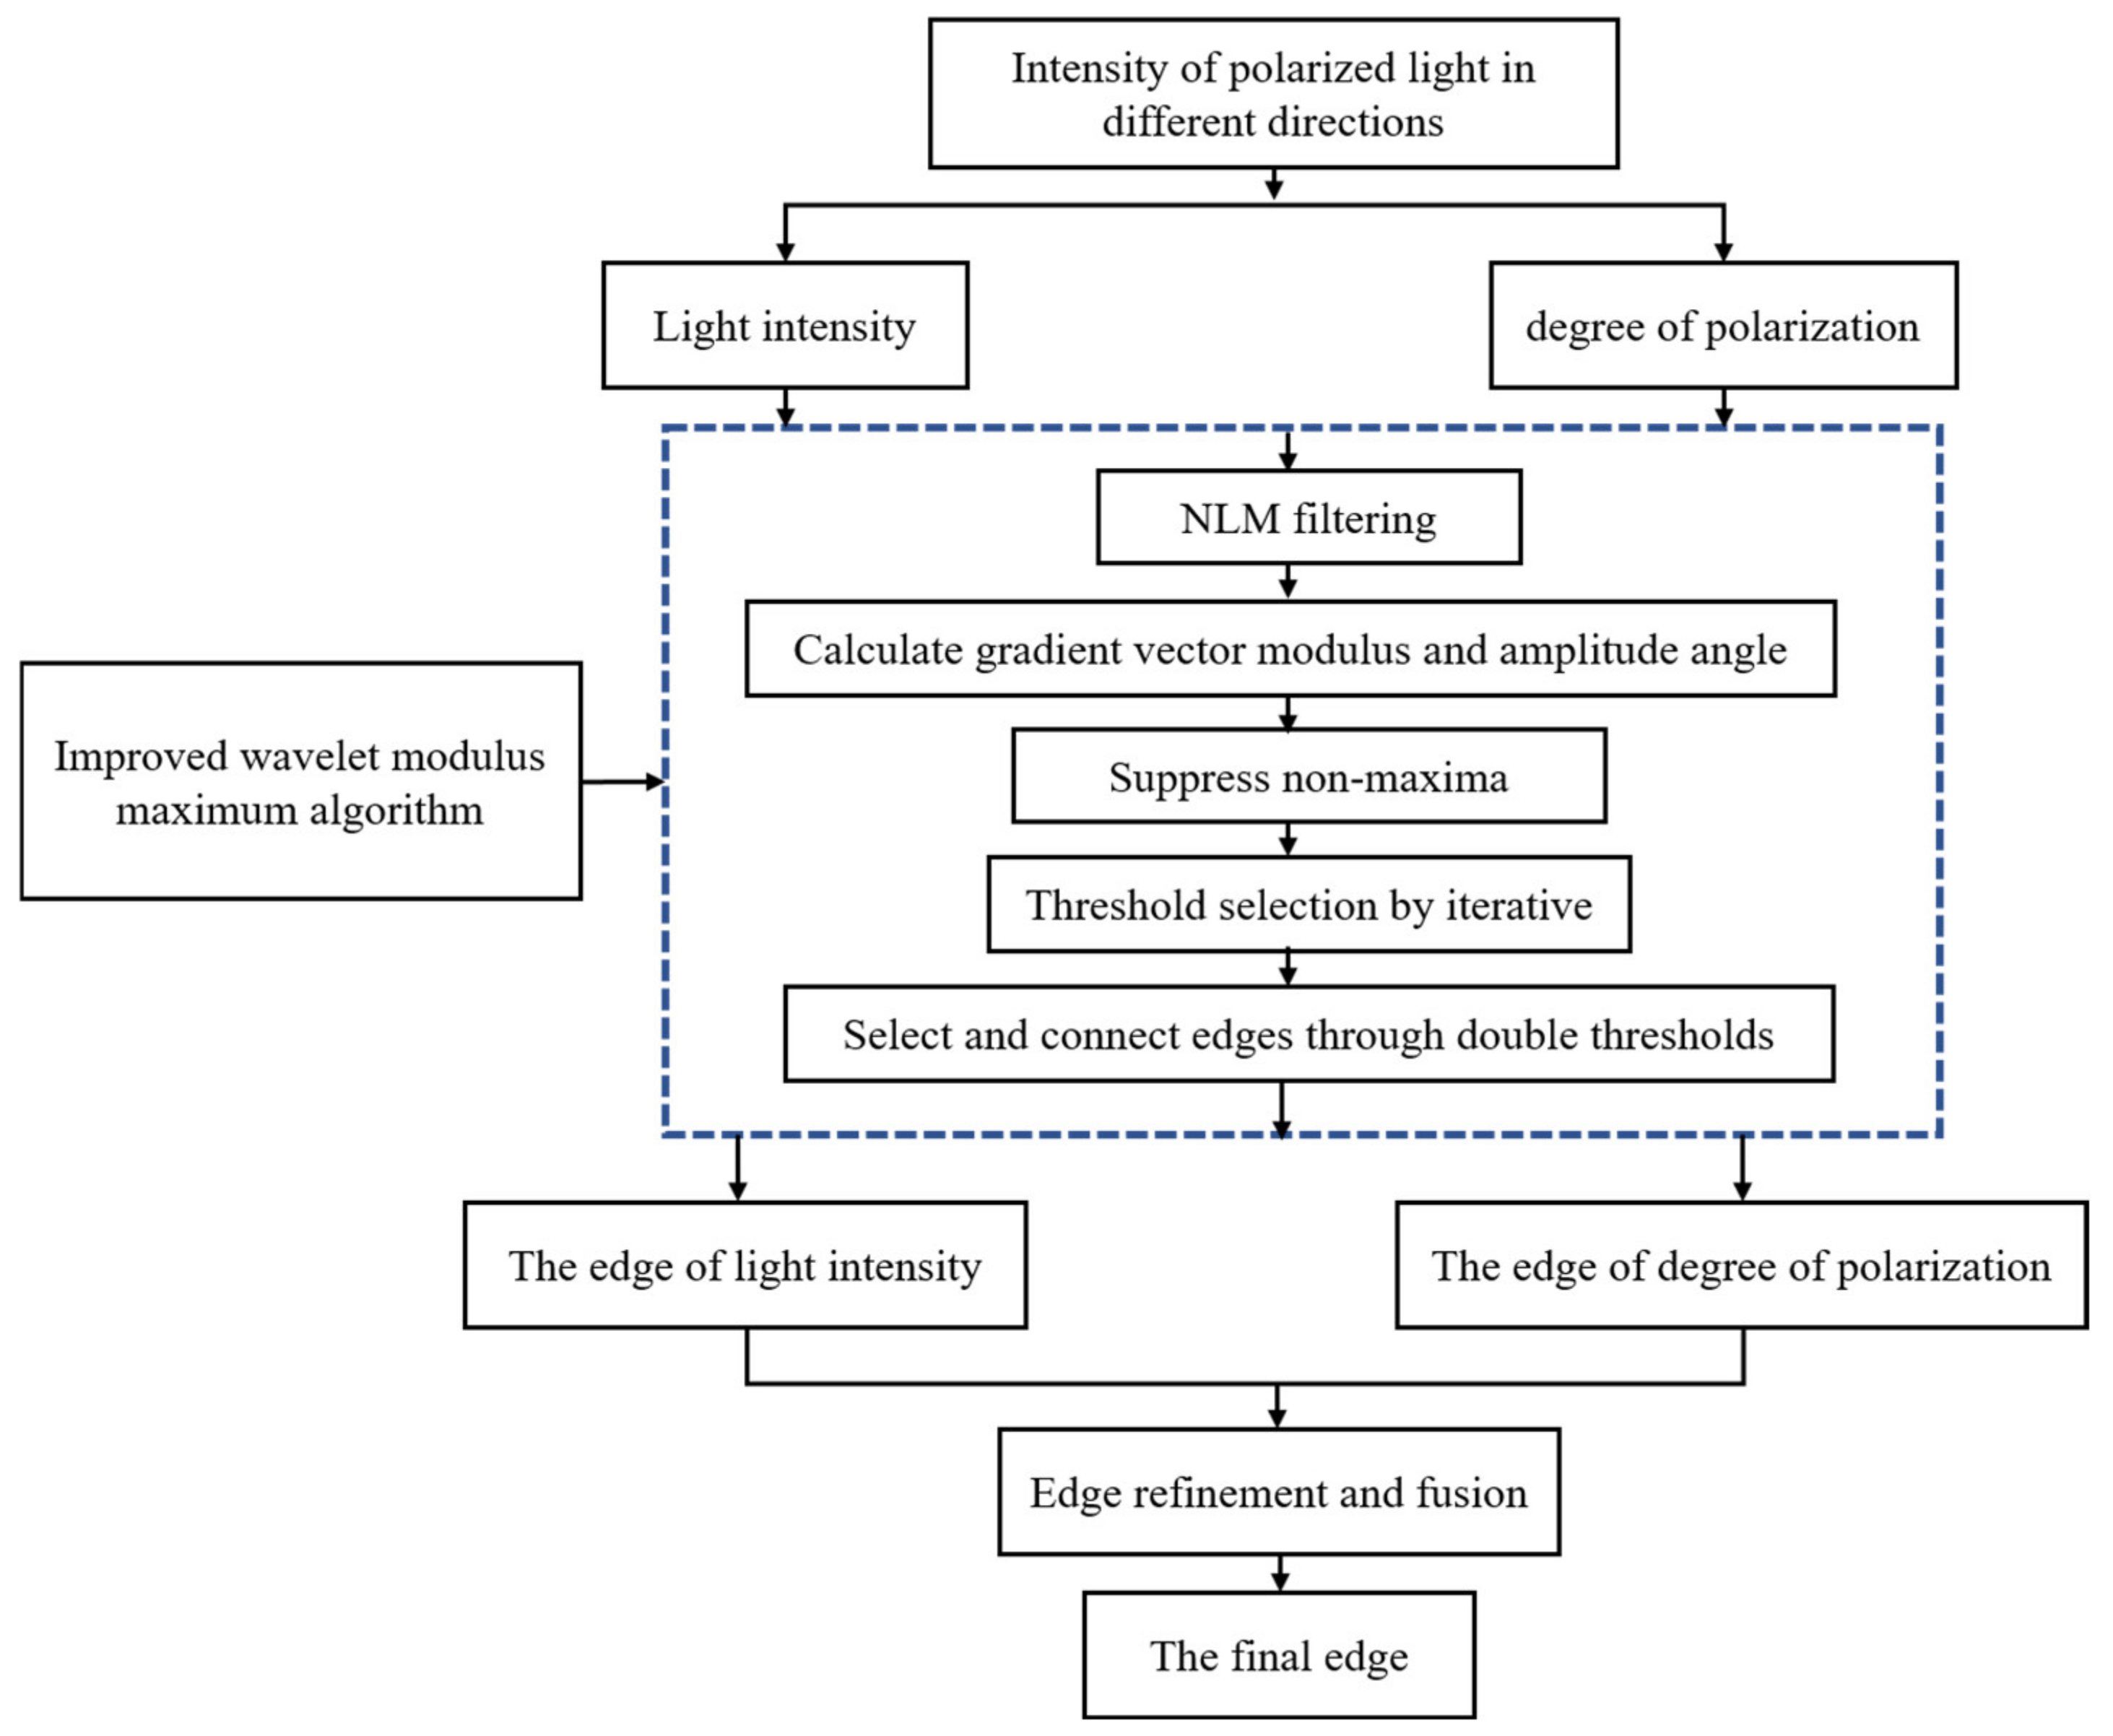
The principle of the improved wavelet modulus maxima algorithm for the fusion of light intensity and degree of polarization is shown in
Figure 1. The specific process of the algorithm is as follows: the total light intensity image and the degree of polarization image are obtained by using the Stokes parameter calculation method for the polarization images at different angles, and the light intensity image and the degree of polarization image are respectively brought into the improved wavelet modulus maximum edge-detection algorithm to obtain the light intensity edge and the degree of polarization edge. Finally, the light intensity edge and the degree of polarization edge are refined and fused to obtain the final edge with rich details. Among them, the improved wavelet modulus maxima algorithm introduces NLM (non-local mean) filtering to improve the denoising ability of traditional wavelet modulus maxima, uses an iterative method for threshold selection to improve the adaptive ability of traditional wavelet modulus maxima, and uses double threshold selection and connection edge to improve the edge continuity of traditional wavelet modulus maxima.
2.1. Improved Wavelet Modulus Maxima Algorithm to Extract the Light Intensity Edge and the Degree of Polarization Edge
The improved wavelet modulus maxima detection algorithm is mainly composed of the following steps: denoising the image by the NLM algorithm, calculating the magnitude and direction of the gradient, suppressing the non-maximum value of the gradient, using the iterative method to find the threshold, and using the double threshold algorithm to select and connect edges.
2.1.1. Non-Local Mean Denoising
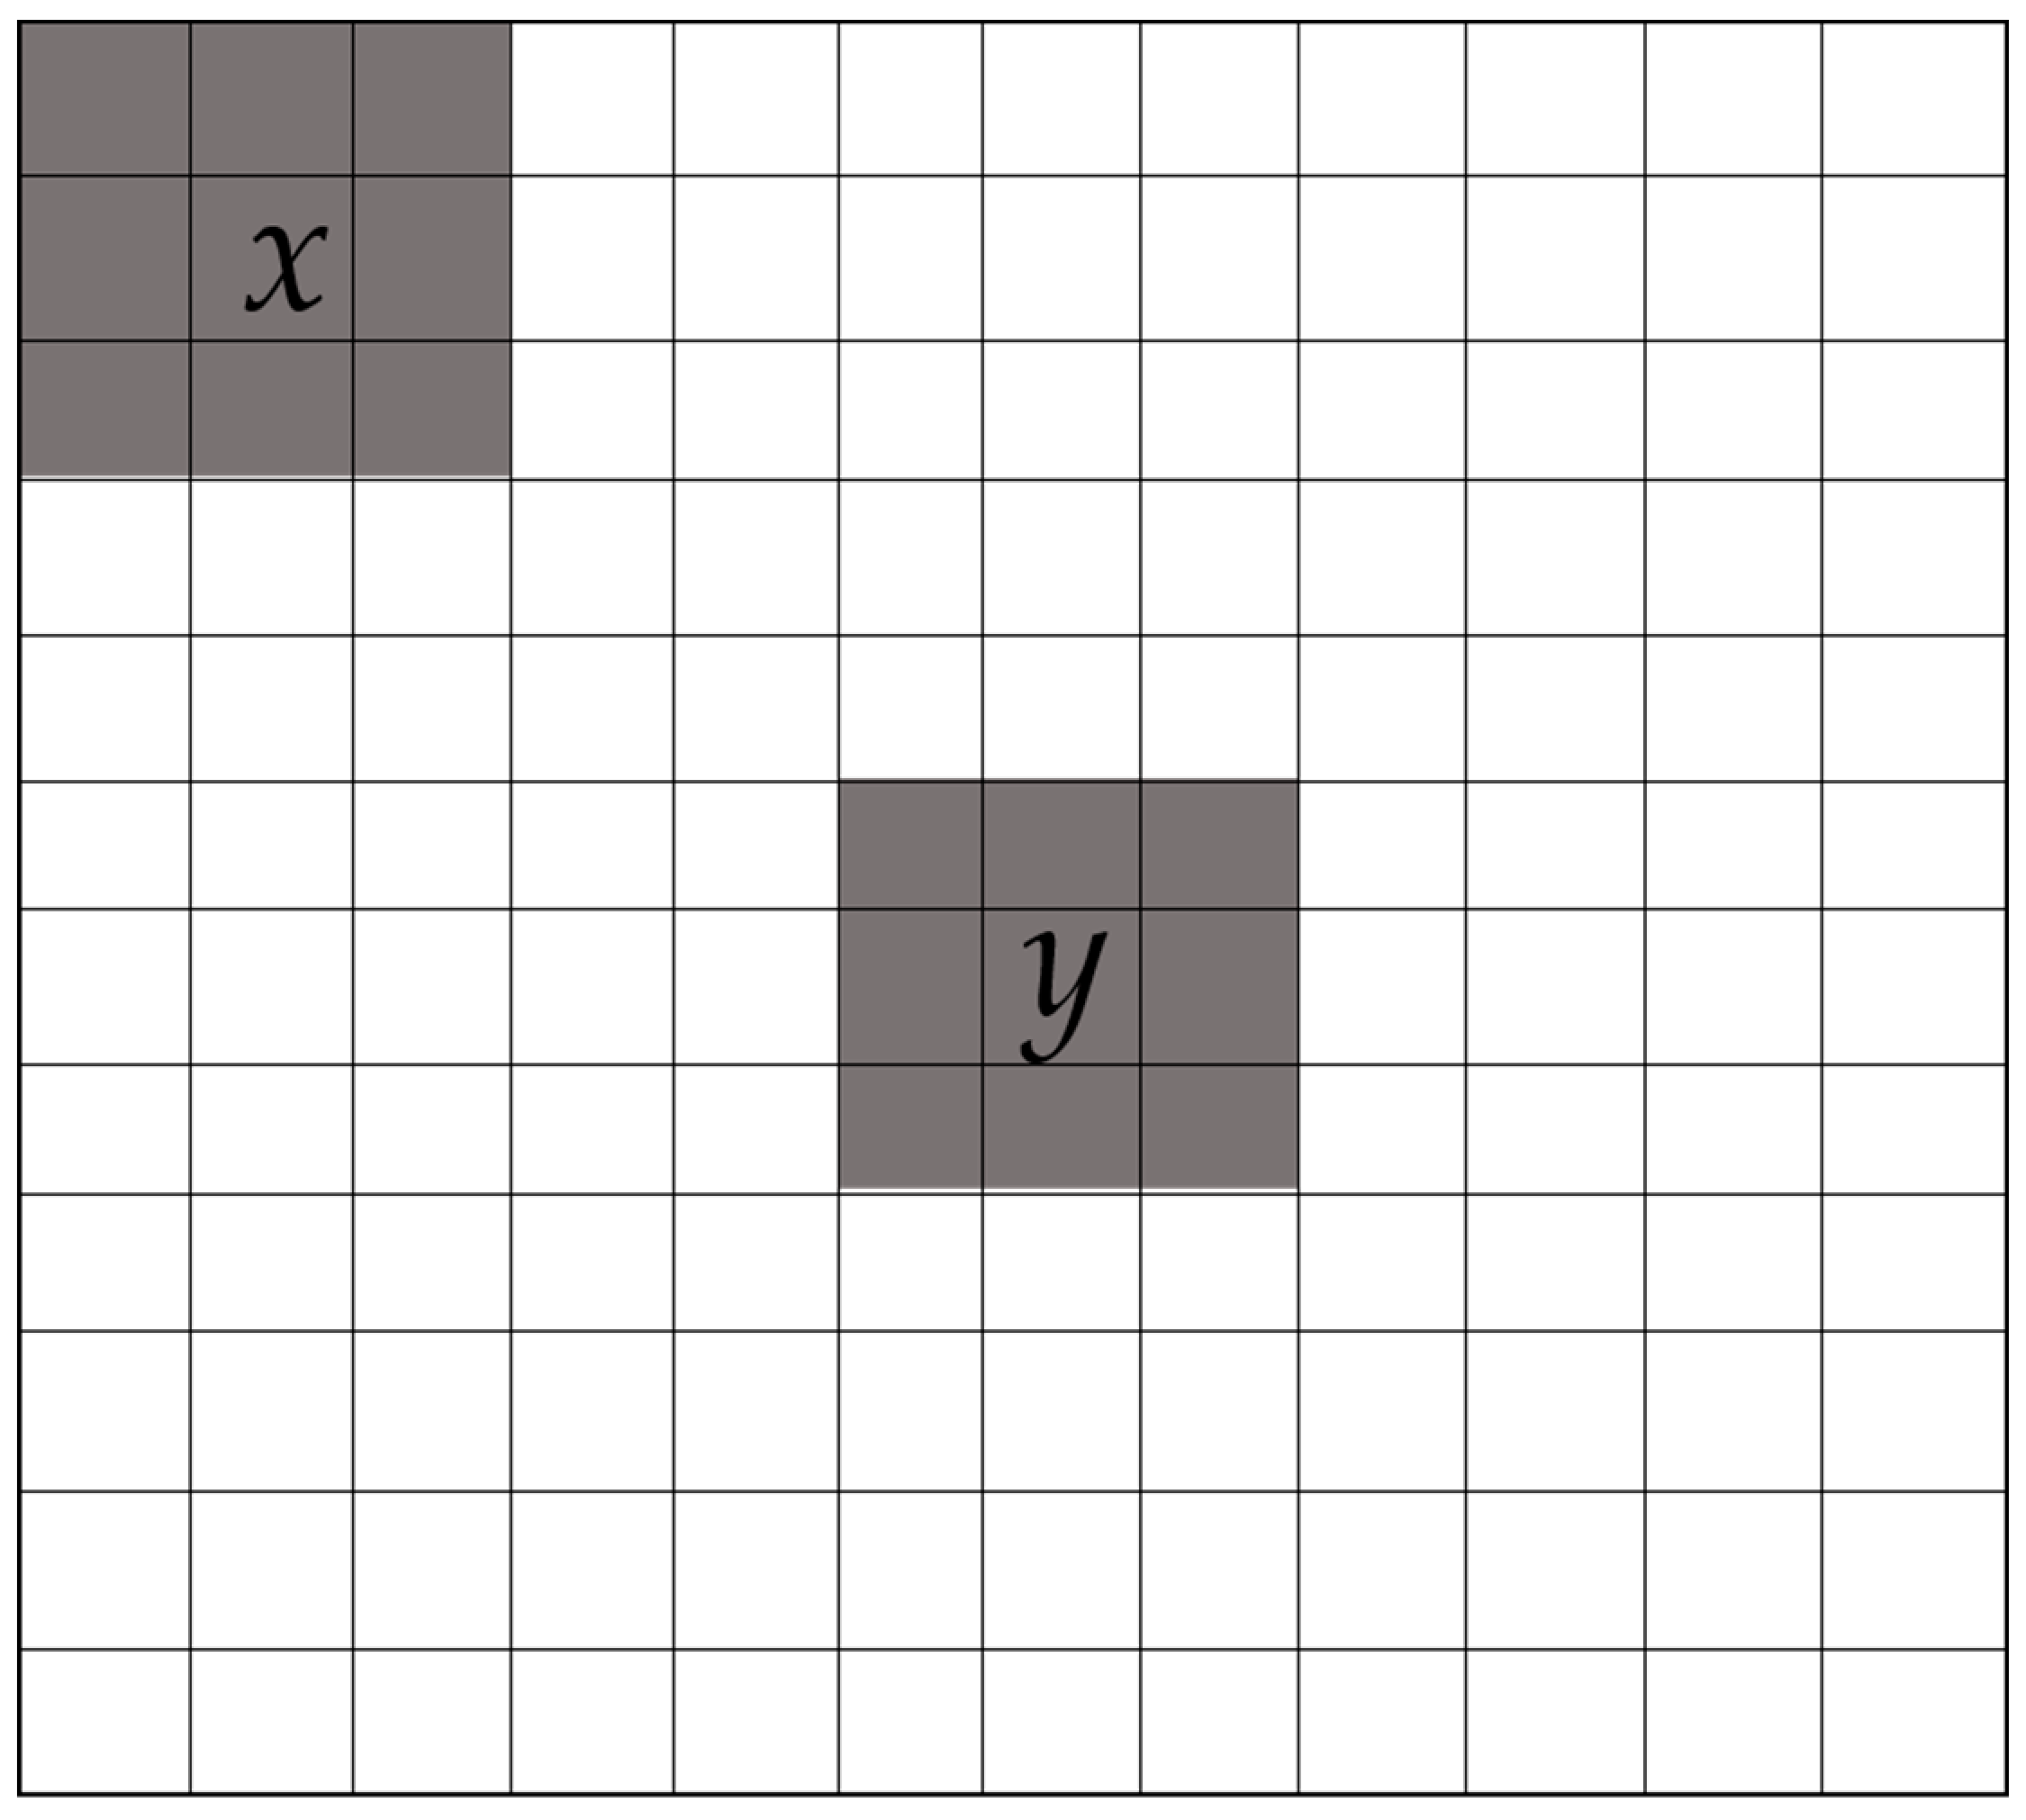
The process of image generation and transmission is often interfered by various noises that reduce the image quality and affect the edge detection results. Although the wavelet modulus maxima algorithm has multi-resolution characteristics, it can reduce the interference of noise on edge extraction, but it will still detect noise as edge points in places with severe noise, resulting in the existence of false edges. In order to solve this problem, this paper adopts the NLM filtering method to remove noise in light intensity images and degree of polarization images. The denoising execution process is shown in
Figure 2:
The NLM algorithm uses image blocks as a unit to find similar areas in the image, and then takes a weighted average of these areas for filtering. When
x and
y are the pixel centers, the weight is calculated as:
where
Nx and
Ny are the image blocks centered on
x and
y, respectively,
v(
Nx) and
v(
Ny) are the collection of pixels in the neighborhood centered on
x and
y, respectively,
a is the standard deviation of the Gaussian kernel function,
h is the filtering parameter that controls the smoothness, and
Z (
x) is a normalization constant, expressed as:
Let
v be the noisy image, expressed as:
where
I is the image area, and the filtered image is:
2.1.2. Calculate Gradient Magnitude and Direction of Gradient
The edge of the image is the part where the brightness changes significantly in the local area of the image, and the modulus maximum point of the gradient corresponds to the edge of the image. Let
θ(
x,
y) denote a two-dimensional Gaussian smooth function, with a scale factor
s = 2
j, and introduce:
Compute the partial derivatives of
θs(
x,
y) along the
x and
y directions as a wavelet function:
Convolve Equations (6) and (7) on the denoised image
f to obtain the two wavelet components of the image in the
x and
y directions:
Then the magnitude of the gradient is:
The direction of the gradient is:
2.1.3. Non-Maximum Suppression
Non-maximum suppression is an important step in edge detection, finding the local maximum of the pixel point, and setting the non-maximum point to 0, so that a large part of the non-edge points can be eliminated. The gradient directions are limited to four directions of 0°, 45°, 90°, and 135°, and the modulus Ms (x, y) of the gradient of each point in the gradient magnitude image is compared with two pixels along the gradient direction. If the gradient magnitude of the pixel position is smaller than the gradient magnitude of two adjacent pixels along the gradient direction, it means that the point is not a local maximum and needs to be suppressed. Let Ms (x, y) = 0; if the gradient magnitude of the pixel position is greater than the gradient magnitudes of two adjacent pixels along the gradient direction, it means that this point is a local maximum and is reserved as an edge point.
2.1.4. Iterative Method for Threshold Selection
Threshold segmentation refers to using a set threshold to separate the signal and noise, and the threshold determines the edge detection effect. The traditional wavelet modulus maximum edge detection needs to set the threshold manually, the optimal threshold for different images is different, and the automation degree is low. Therefore, we use the iterative method as the threshold segmentation method, and the flowchart of the iterative method is shown in
Figure 3.
First, the gradient image after non-maximum suppression is divided into two parts, and the initial threshold
T0 is set as:
where
Mmax and
Mmin are the maximum and minimum values of the gradient image after non-maximum suppression, respectively. Then, the gradient image is divided into two parts by using this threshold, and the average gray values
u1 and
u2 of the two parts are calculated. The new threshold
T1 is obtained as:
Compare the initial threshold T0 and the new threshold T1; if the absolute value of the difference between the two thresholds is less than the given value, the algorithm ends, and the newly obtained threshold is the final iteration threshold of the algorithm. Otherwise, assign the new threshold T1 to the initial threshold T0, then divide the image into two parts and repeatedly calculate the average gray level of the two parts until the difference between the thresholds is less than the given value; the value of Tn is the threshold of the gradient image, denoted as T.
2.1.5. Double Threshold Algorithm to Select and Connect Edges
The traditional wavelet modulus maxima algorithm uses a single threshold algorithm to select the edge. The single threshold algorithm determines that the edge is retained when the gradient is greater than the threshold, and is set to 0 when the gradient is less than the threshold. This method is easy to cause edge breakage. The double threshold algorithm selects two thresholds to remove false edges and retain edge information effectively. Multiple studies have shown that, when two thresholds are used to judge an edge, the edge detection effect is the best when the low threshold is half of the high threshold [
16,
17]. Therefore, we set the high threshold of threshold segmentation to:
Tmax =
T, and the low threshold to:
Tmin = 0.5 ×
Tmax. The specific steps are as follows:
- (1)
When the gradient value of the point is greater than the high threshold, it is reserved as an edge;
- (2)
When the gradient value of the point is less than the low threshold, it is not an edge point and is set to 0;
- (3)
When the gradient value of the point is between the high and low thresholds, judge whether there are pixels in the eight-neighborhood that are greater than the high threshold. If there are pixels larger than high thresholds, the point is reserved as an edge; otherwise, it is not an edge.
2.2. Refinement and Fusion of Light Intensity Edge and Degree of Polarization Edge
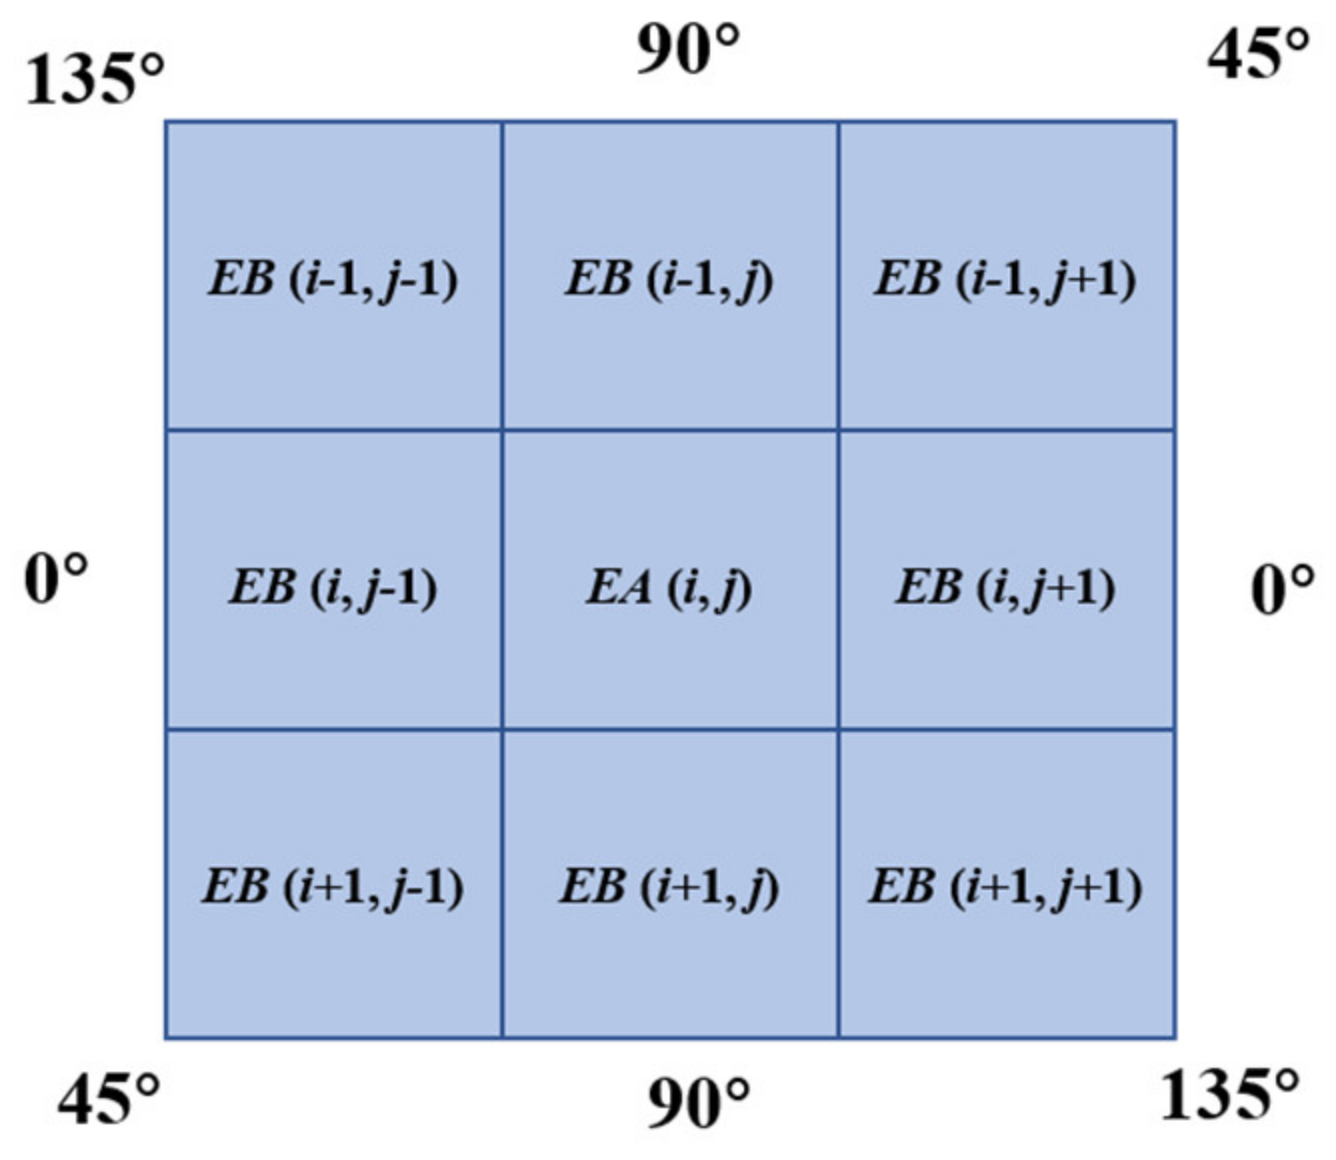
In order to avoid the phenomenon that the edge of light intensity and the edge of polarization degree do not coincide due to factors such as smoothing, the edge needs to be refined. The schematic diagram of edge refinement is shown in
Figure 4.
Assuming that the edge of the light intensity image is EA, and the edge of the degree of polarization image is EB, since the gradient is limited to the four directions of 0°, 45°, 90°, and 135°, then take the pixel point EA (i, j) on the edge of the light intensity as the center, and judge whether there is an edge of the polarization image in the 3 × 3 neighborhood of the vertical light intensity gradient direction. If it exists, it needs to be removed; let EB (i, j) = 0, which can remove non-edge pixels, avoid the situation that the edge is too wide, and keep the thin edge.
We coincided the light intensity edge with the polarization edge, and observed the 3*3 neighborhood of the vertical light intensity gradient direction to determine whether there is a polarization edge to refine the edge. Assume that the pixel point on the edge of the light intensity is EA (i, j). If the gradient direction of this point is 0°, judge whether EB (i − 1, j) and EB (i + 1, j) exist in the direction of 90°. If so, set their values to 0.
Finally, we fused the refined intensity edge with the polarization edge. The fusion rules are as follows:
where α
1 and α
2 are the weighting factors, and
E is the fused edge.
3. Experimental Results and Analysis
In order to verify the effectiveness of the improved wavelet modulus maxima algorithm based on the fusion of light intensity and degree of polarization in a complex environment, we conducted edge detection simulation experiments on the original image and the image with added noise, and used the subjective and objective evaluation methods to measure the effectiveness of the algorithm proposed in this paper. The images used in the experiment were from the “ Database of polarimetric and multispectral images in the visible and NIR regions” [
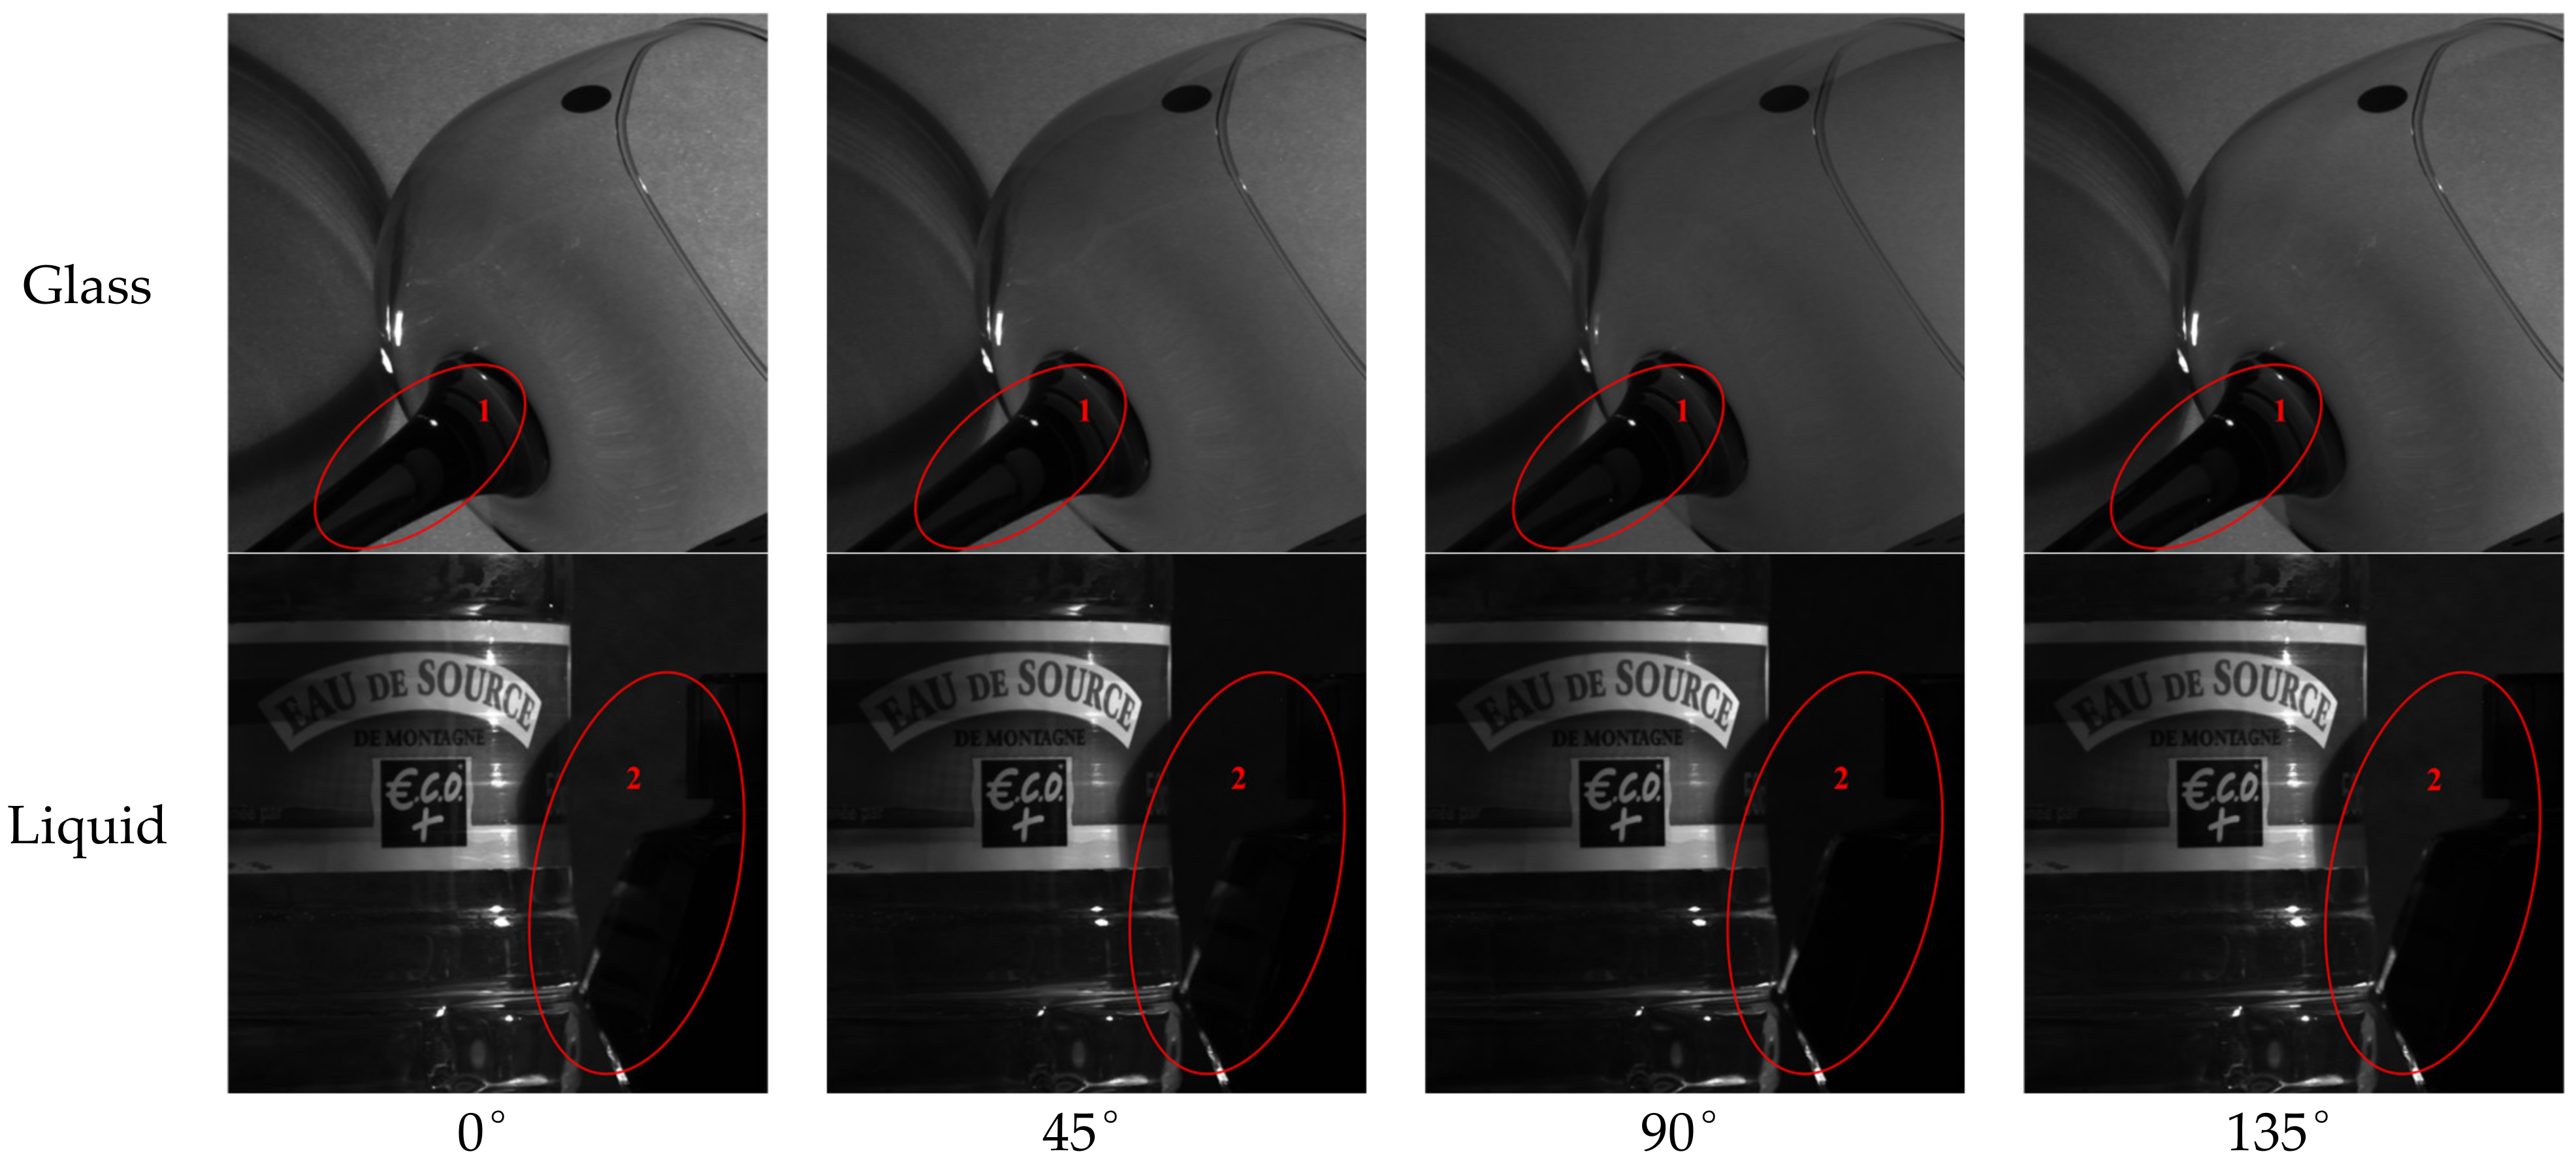
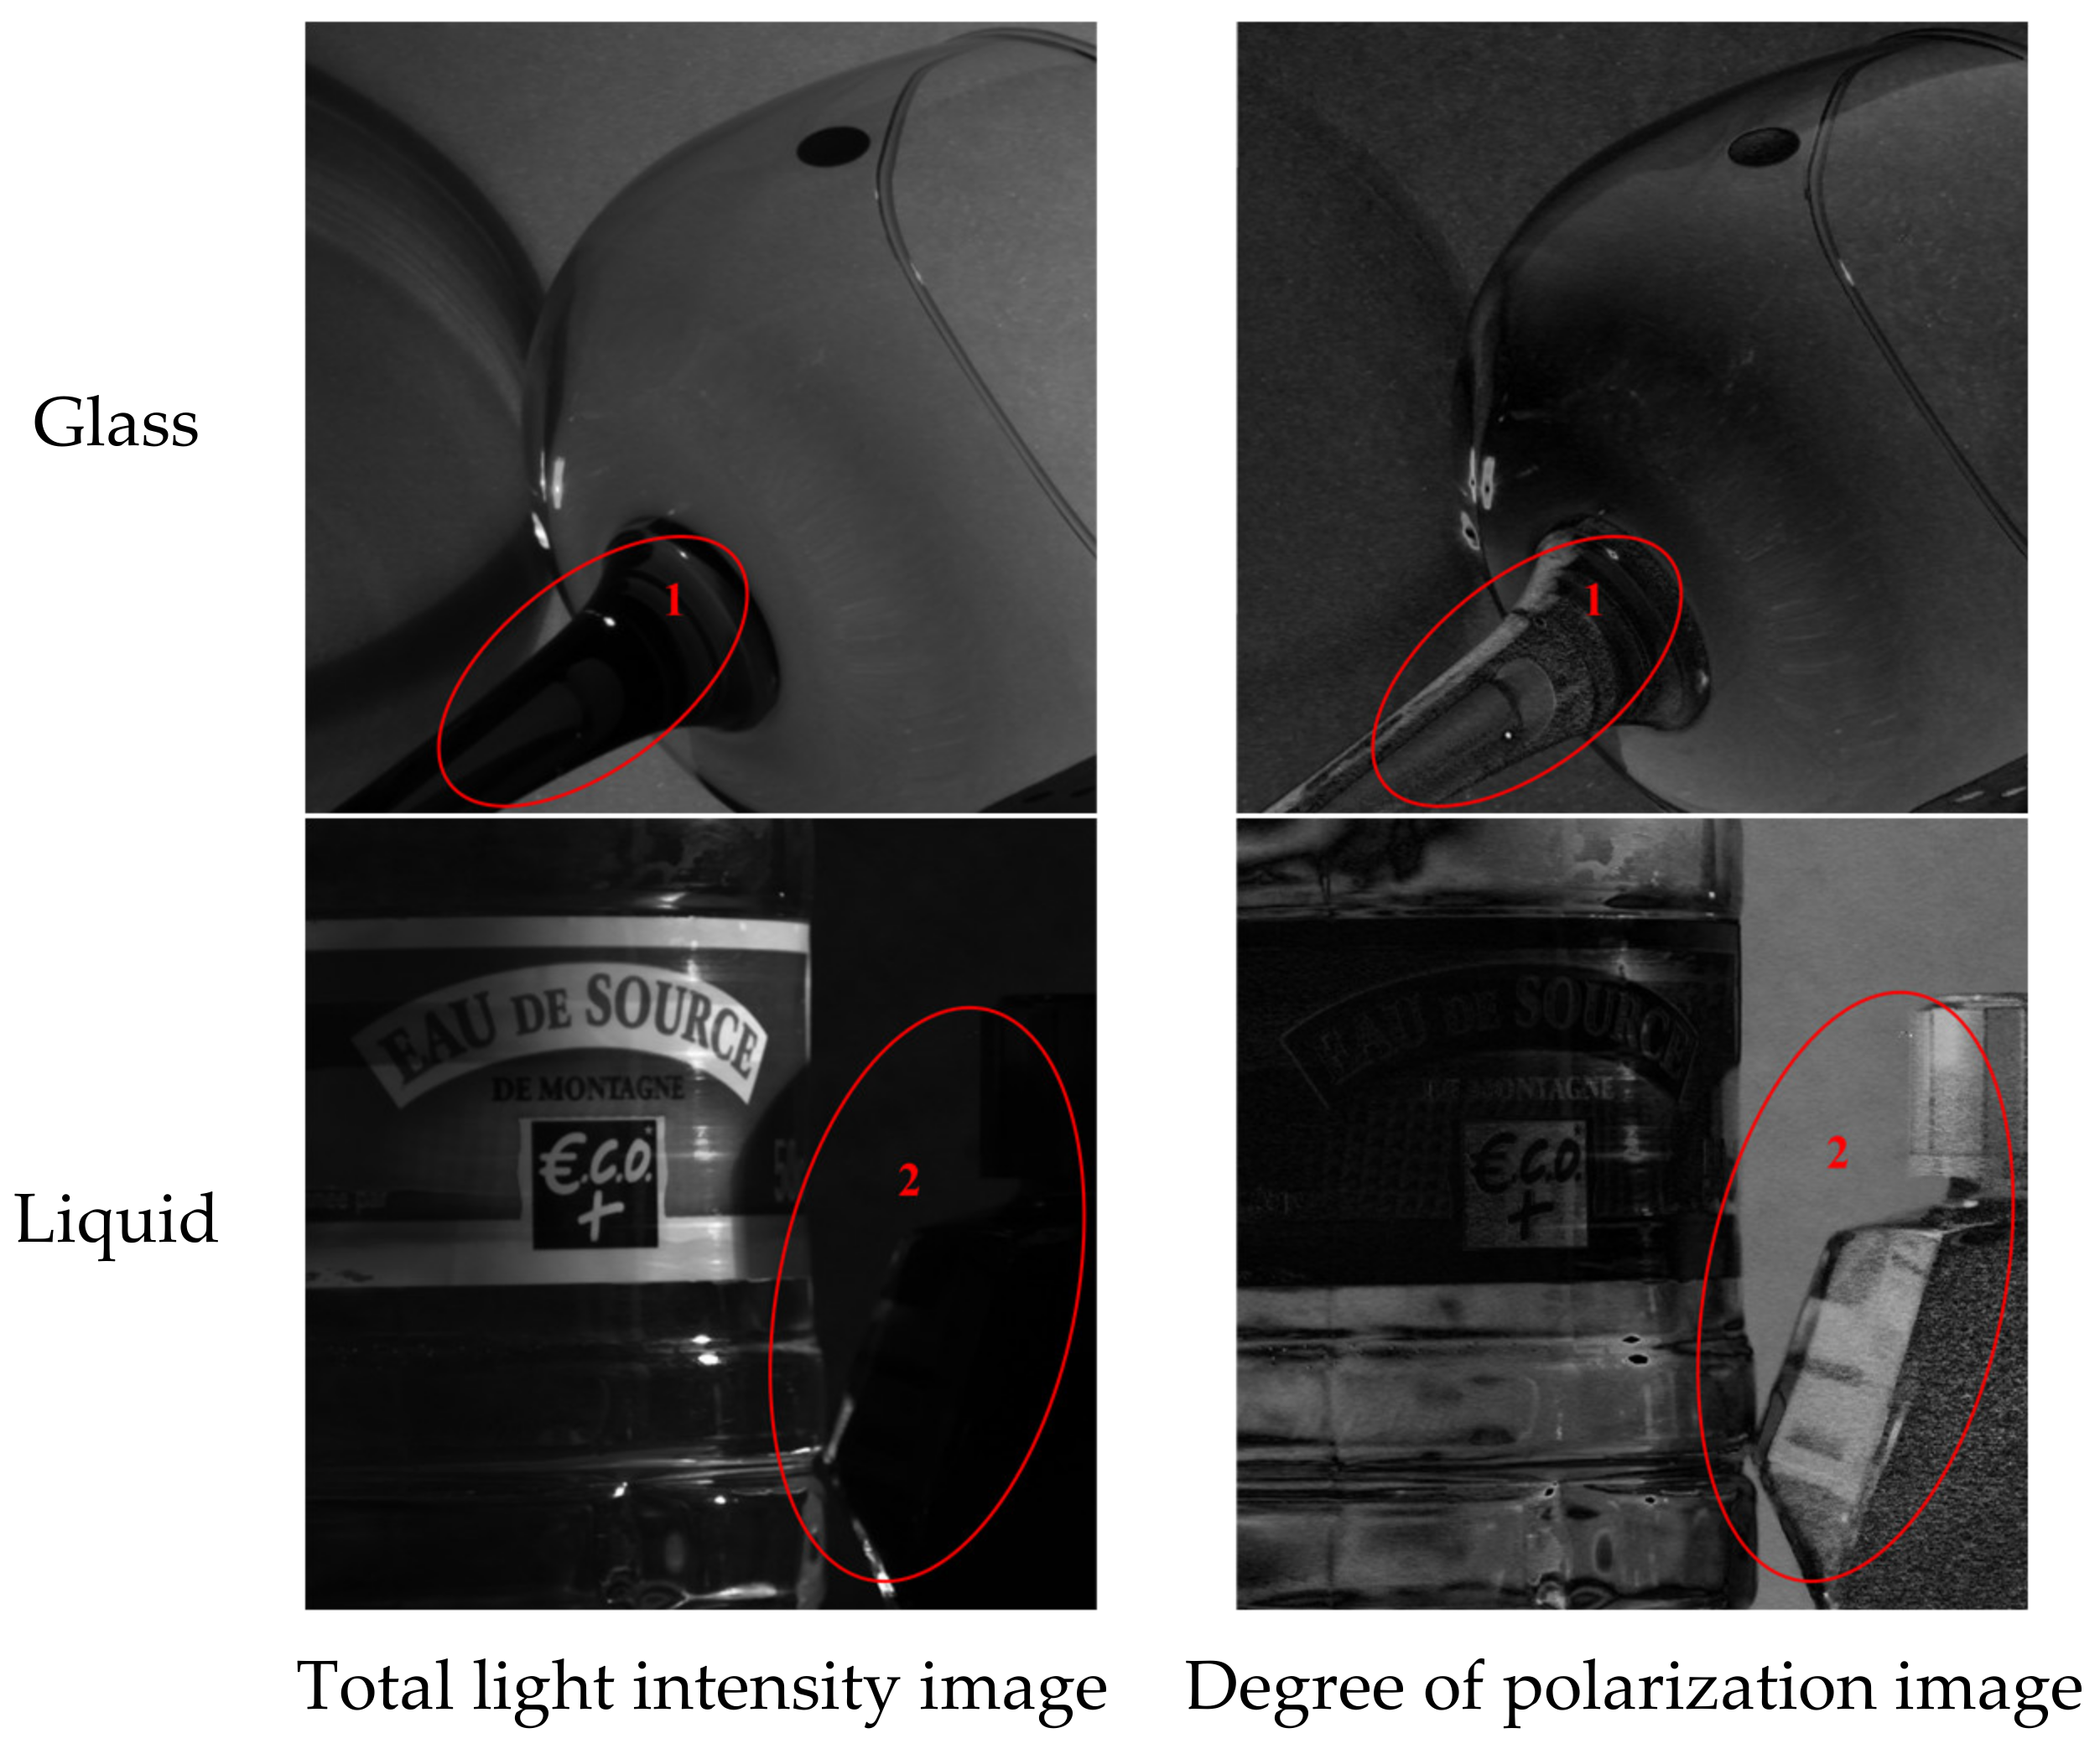
18]; we selected two groups of polarization images in the visible light band, and the polarization directions were 0°, 45°, 90°, and 135°, respectively. To facilitate edge detection, we convert the original image to grayscale, as shown in
Figure 5. These two groups of images were affected by factors such as lighting, and there was a problem of poor contrast. For example, in region 1 of the glass image and region 2 of the liquid image, no matter the angle, the polarized image was unable to distinguish the internal details of the object information.
Using the Stokes vector to calculate the above two sets of images and obtain the total light intensity image and the degree of polarization image, the specific calculation method was as follows:
where
I is the total light intensity,
p is the degree of polarization, and
I0,
I45,
I90, and
I135 are the linearly polarized light intensities of 0°, 45°, 90°, and 135° respectively. The calculation results are shown in
Figure 6. It can be seen from the figure that the total light intensity image was not much different from the polarization image at different angles, the contrast of the degree of polarization image in area 1 and area 2 was significantly improved, and the edge and detail information were highlighted. Since the degree of polarization image had the function of “weakening strong light and strengthening weak light”, more complete edge information could be obtained by combining the edge of the light intensity image with the edge of the degree of polarization image.
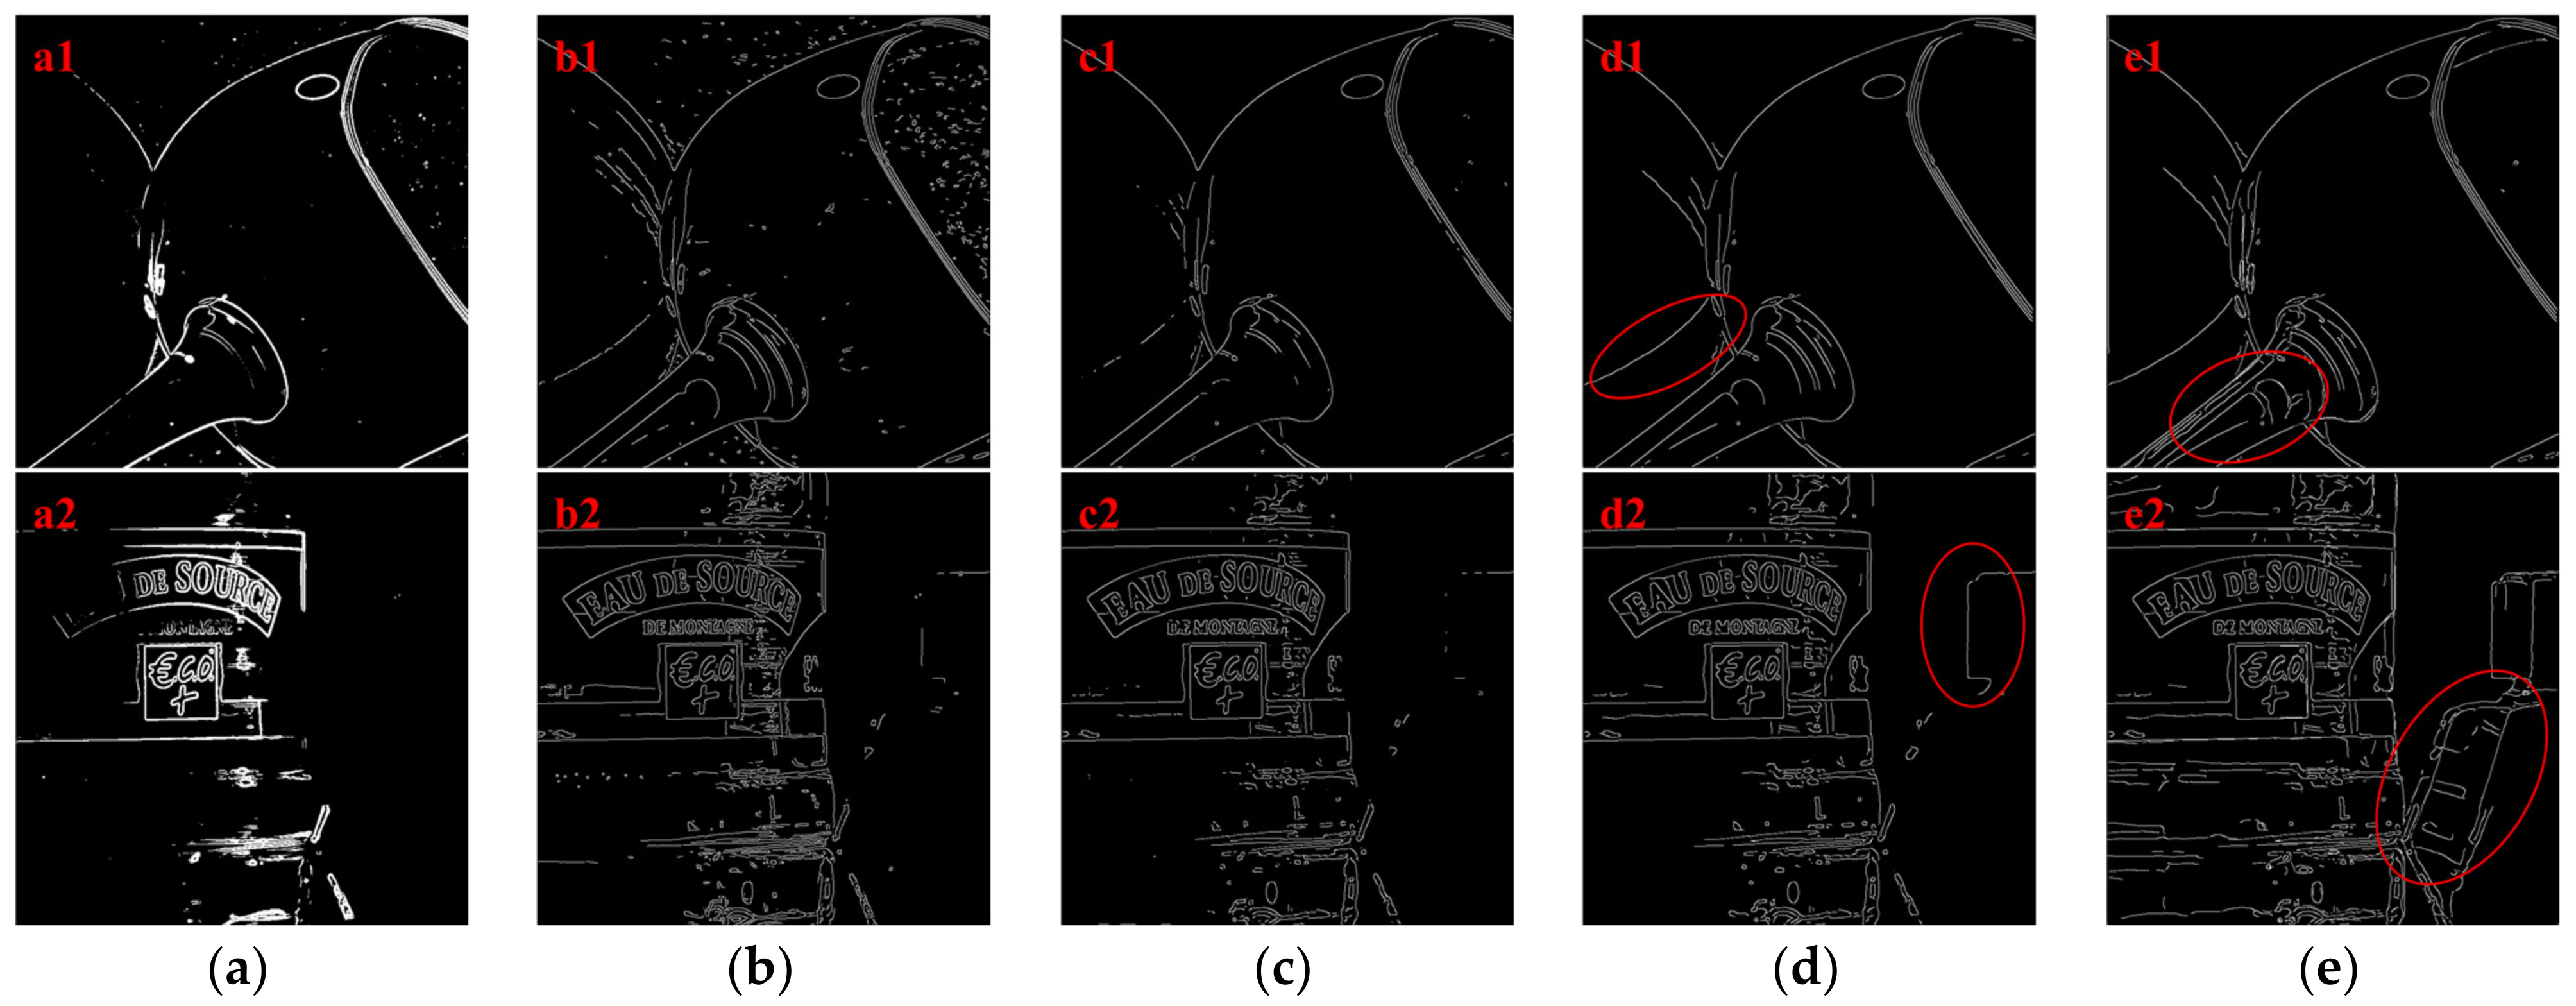
In order to verify the superiority of the improved wavelet modulus maxima algorithm in this paper and the edge extraction integrity of the improved wavelet modulus maxima algorithm based on the fusion of light intensity and degree of polarization, we used the Sobel algorithm, Canny algorithm, traditional wavelet modulus maxima algorithm, and improved the wavelet modulus maxima algorithm to perform edge detection on the total light intensity image, and used the fusion improved wavelet modulus maxima algorithm on the degree of polarization image in
Figure 6. The detection results are shown in
Figure 7. As can be seen from
Figure 7, the Sobel algorithm had the problem of a thick edge in edge detection; the Canny algorithm was sensitive to noise, and there were a lot of noise false edges in the edge detection results. The wavelet modulus maxima algorithm had a strong ability to suppress noise. It is obvious that, compared with the Sobel algorithm and Canny algorithm, there were fewer noise edges, but there was the problem of poor edge continuity. The improved wavelet modulus maxima algorithm also had a strong ability to suppress noise; compared with the traditional wavelet modulus algorithm, the threshold selection was more accurate, and the edge connectivity was stronger. It can be clearly seen that the red regions of (d1) and (d2) in
Figure 7 had better edge connectivity than the (c1) and (c2) regions. The edge extraction of the improved wavelet modulus maxima algorithm based on the fusion of light intensity and degree of polarization was more complete. The red areas of (e1) and (e2) in
Figure 7 were the detailed edges that cannot be detected by any algorithm in the light intensity image.
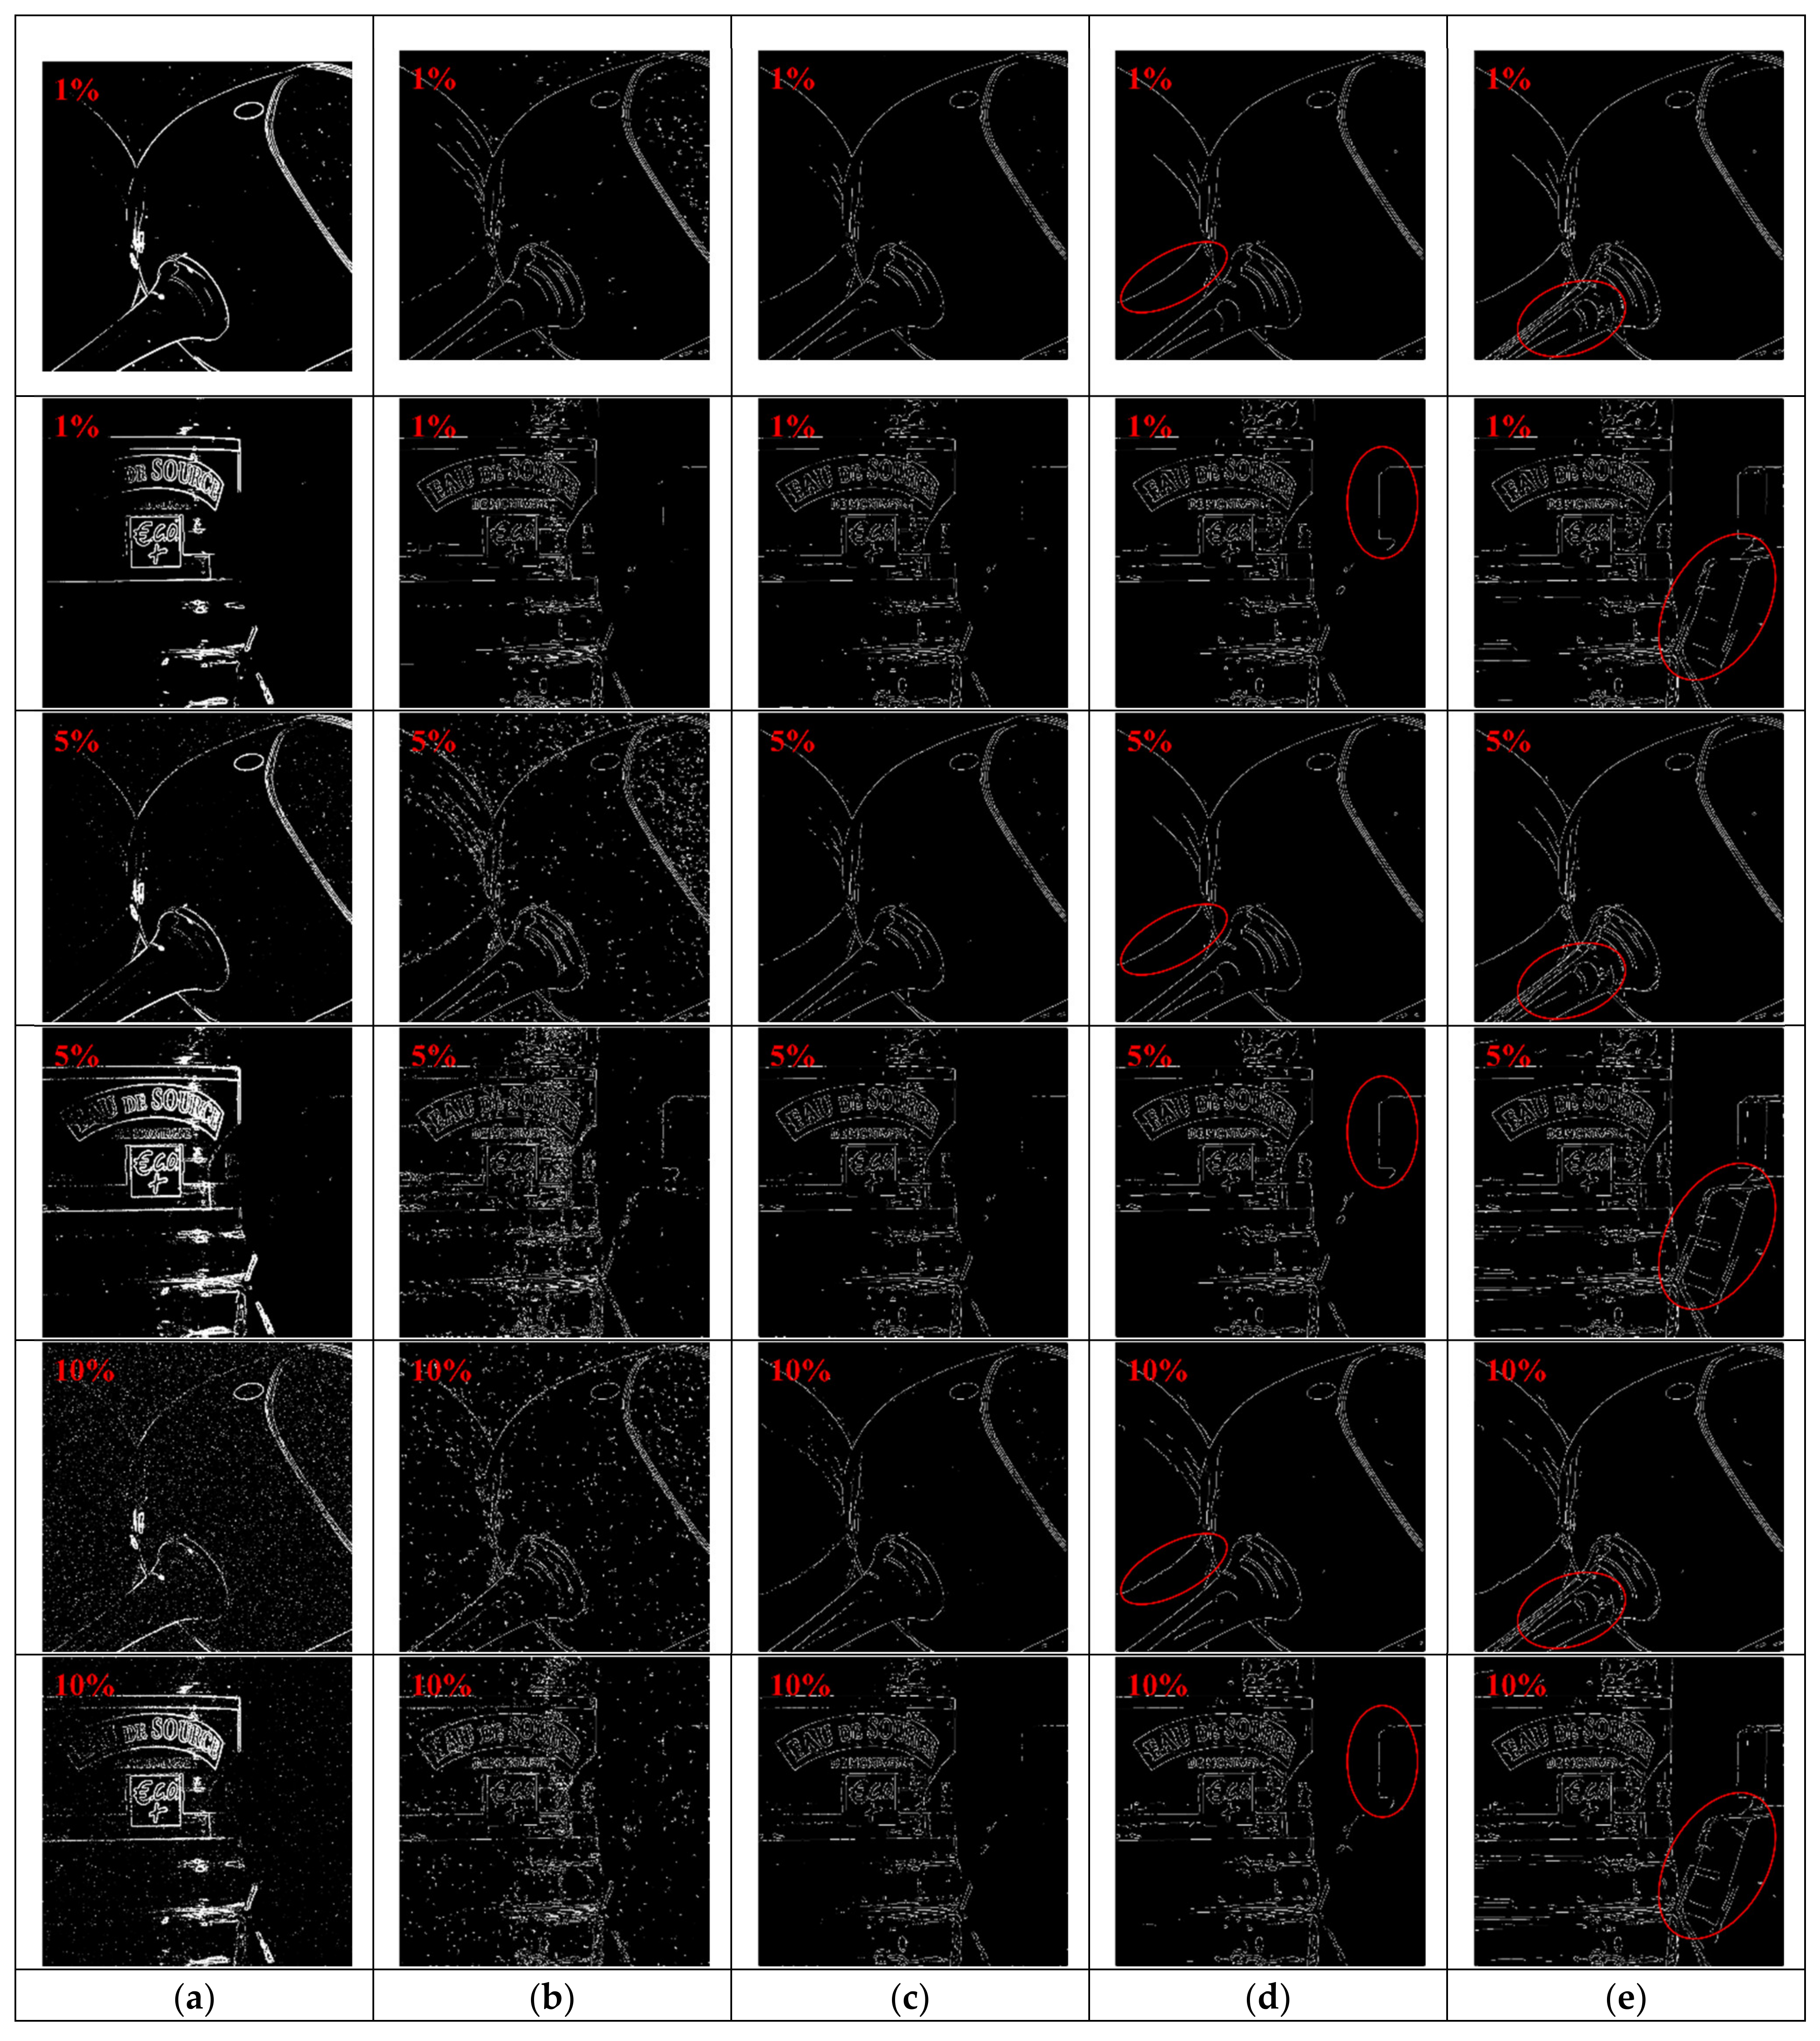
In order to further verify the effectiveness of the algorithm in this paper, 1%, 5%, and 10% uniform random noise were added to each original image, and the edge detection results are shown in
Figure 8. In the figure, the first, third, and fifth lines correspond to the 1%, 5%, and 10% noise images of glass, and the second, fourth, and sixth lines correspond to the 1%, 5%, and 10% noise images of liquid, respectively. It can be seen that the Sobel algorithm for noisy images still had the problem of thick edges, and the Sobel algorithm had false noise edges. Although gaussian filtering exists in the Canny algorithm, false edges of noise are still generated, and the more noise there is, the more false edges are generated. The wavelet modulus maxima algorithm has poor sensitivity to noise. As can be seen from the figure, the wavelet modulus maxima algorithm generated fewer false edges compared with the Sobel algorithm and Canny algorithm, but it had the problem of poor edge continuity. The improved wavelet modulus maxima algorithm was less sensitive to noise and had stronger edge connectivity. It is obvious that the improved wavelet modulus maxima algorithm in
Figure 8 had fewer noise edges than the traditional wavelet mode maximum algorithm, and the edge extraction was more complete. The red area in
Figure 8d was the most obvious. The improved wavelet modulus maxima algorithm for the fusion of light intensity and polarization degree detected more details of edges. The red area (e) in
Figure 8 detected edges that could not be reached by the light intensity image. Therefore, the fusion algorithm of light intensity and polarization degree had the best edge detection effect.
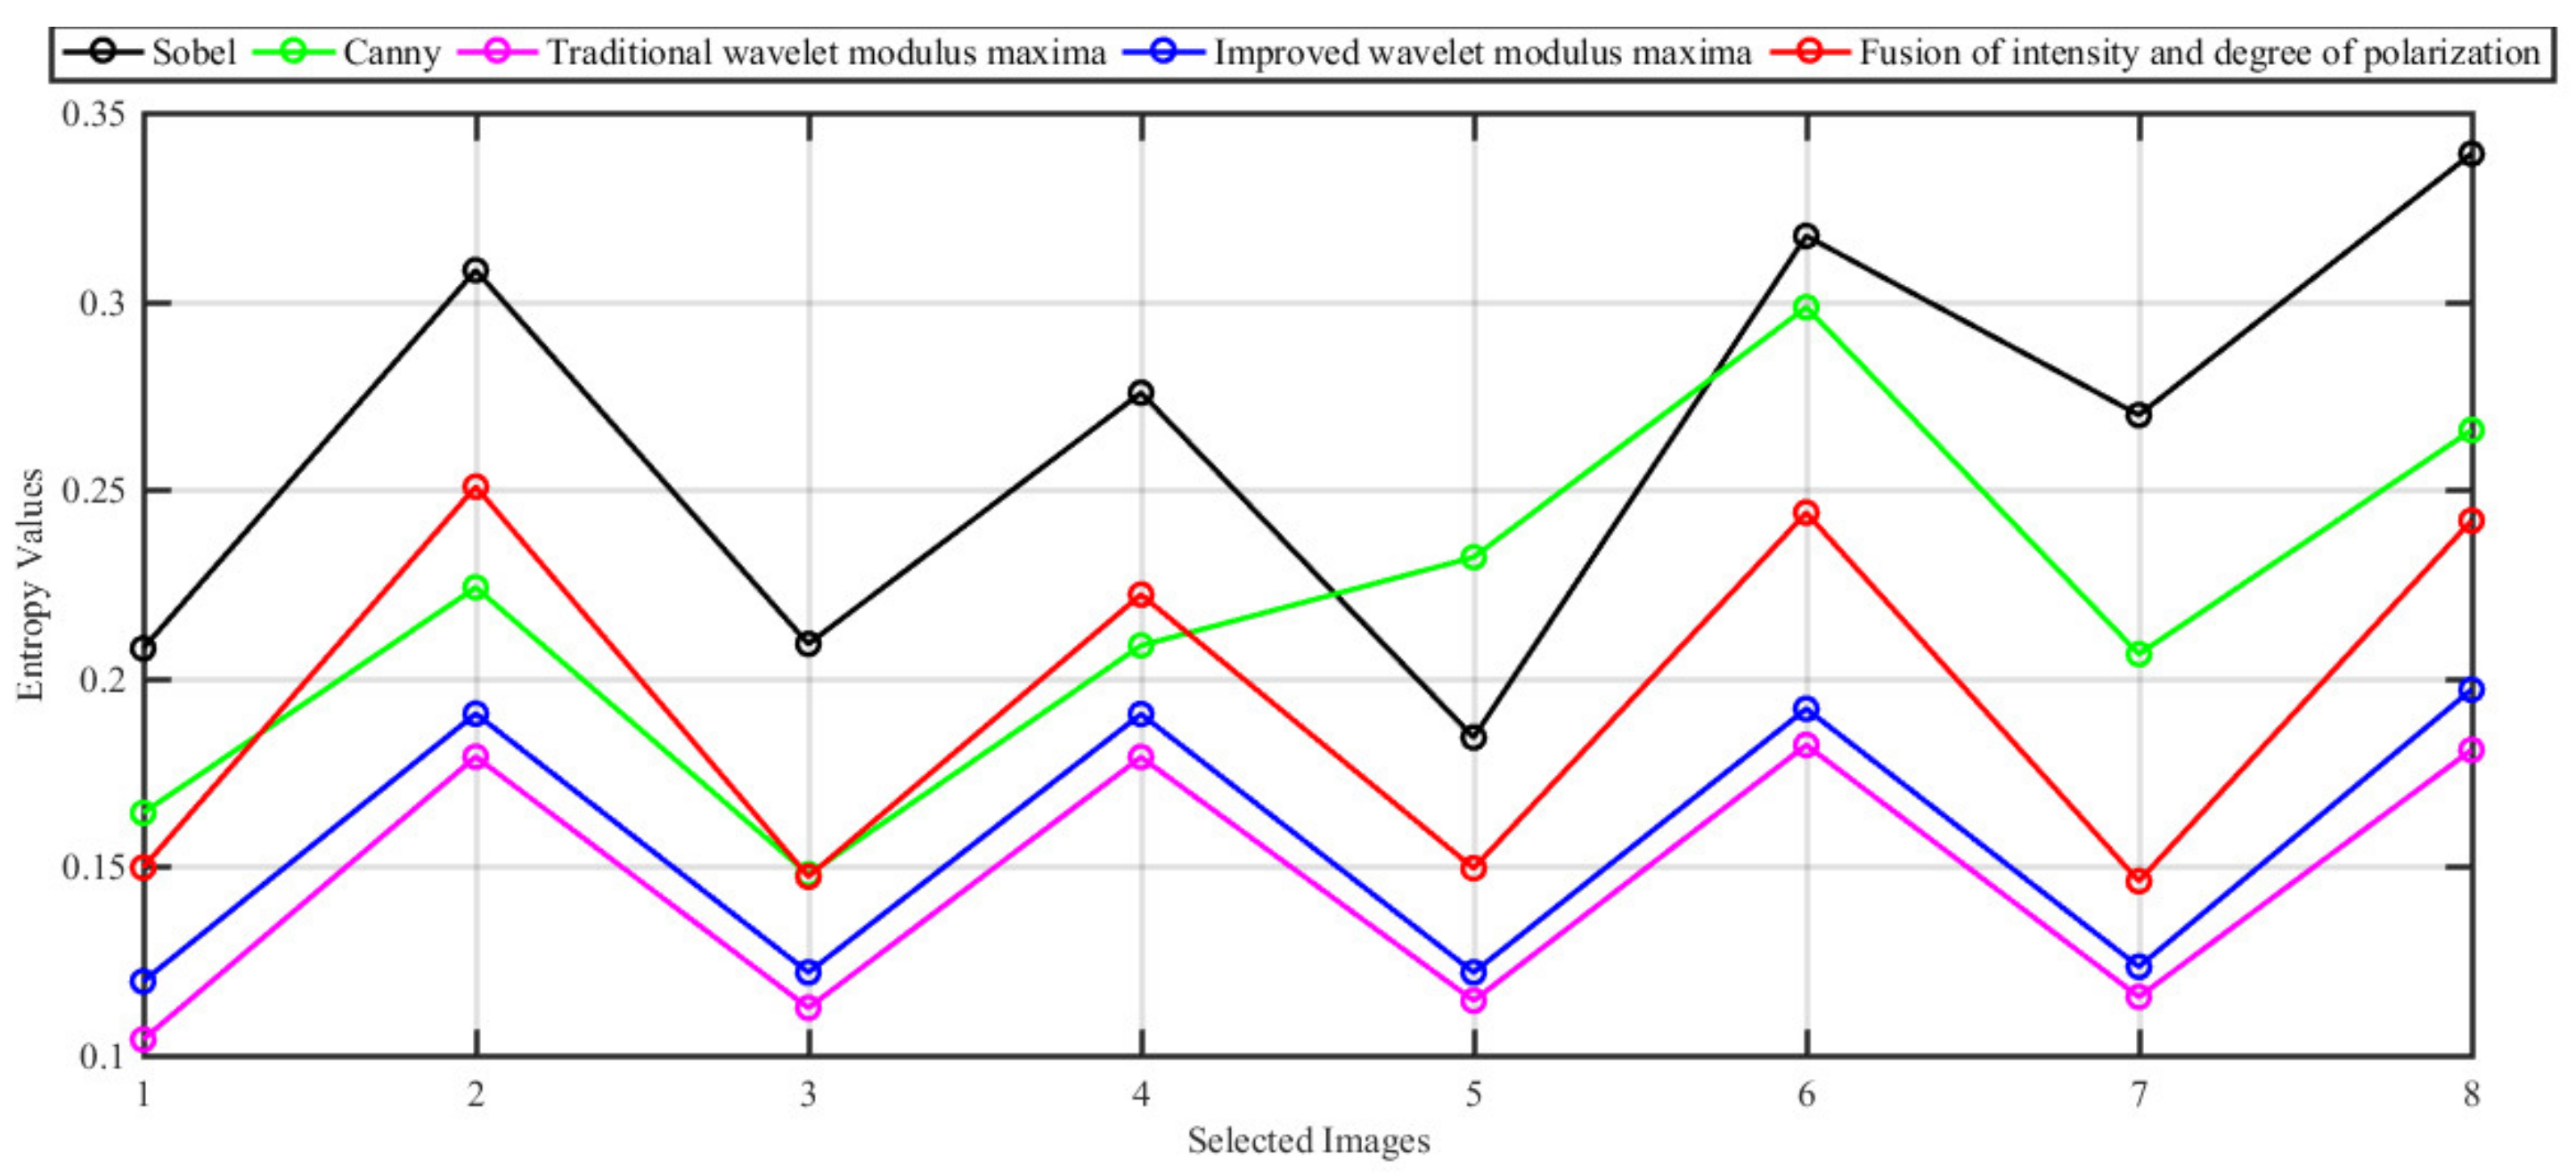
Next, we used the entropy function to evaluate the edge image quality obtained by the improved wavelet modulus algorithm based on the fusion of light intensity and degree of polarization. The definition of entropy in the image is:
where
pi is the probability of occurrence of pixel intensity
i, and
H is the entropy of the image. The evaluation table of edge detection results is obtained as shown in
Table 1.
The smaller the value of
H, the less information the edge has, and the larger the value of
H, the existence of non-single-pixel edges and false noise edges. Therefore, the
H of a good edge-detection algorithm should be between the maximum and minimum of different edge algorithms [
19].
Figure 9 shows the graph analysis of the edge detection results. In the graph, 1357 corresponds to the original glass image and the glass images with 1%, 5%, and 10% noise, and 2468 corresponds to the initial liquid image and the liquid images with 1%, 5%, and 10% noise. It can be seen from the figure that only the improved wavelet modulus maxima algorithm and the improved wavelet modulus maxima algorithm based on the fusion of light intensity and degree of polarization were stable in the middle between the maximum and the minimum, indicating that their edge extraction effect was good. The
H value of the improved wavelet modulus maxima algorithm based on the fusion of light intensity and degree of polarization was higher than that of the improved wavelet modulus maxima algorithm, which shows that the improved wavelet modulus maxima algorithm based on the fusion of light intensity and degree of polarization had a large amount of information, and the edge extraction effect was the best.
4. Summary
In order to overcome the problems of poor adaptive ability and poor edge continuity of traditional wavelet modulus maxima algorithms, as well as the problem of little information for edge extraction using only light intensity images, we propose an improved wavelet modulus maxima algorithm based on the fusion of light intensity and degree of polarization. The algorithm uses the improved wavelet modulus maximum algorithm to extract the edges of the light intensity image and degree of polarization image, and then refines and fuses the light intensity edge and the degree of polarization edge to obtain the edge information with rich details. Compared with other edge-detection algorithms, we found that the edge image obtained by this algorithm had less noise, stronger edge continuity, and a higher amount of edge information through simulation experiments. Therefore, the edge image obtained by the edge-detection algorithm in this paper had a clearer outline and better connectivity. The research in this paper provides a reference for the edge detection of images with serious noise interference and low contrast. The objects in the experimental images in this paper were glass and liquid, and there may have been reflections inside them. Since the degree of polarization image had the characteristics of weakening strong light and strengthening weak light, the reflection of the degree of polarization image was more obvious than that of the total light intensity image, and a small amount of artifacts appeared in the edge detection results in this paper. Edge detection works better if the object in the experimental image is opaque. It should be pointed out that our algorithm combined the light intensity image with the polarization image. The object in the experimental image had a high degree of polarization, so it was convenient to extract the edge of the polarization image. However, for some objects with a low degree of polarization, there would be a lot of noise in the image of degree of polarization, and the difference between the edge and noise would not be obvious, so this method would not be suitable. In the future, we will analyze the relationship between the polarization characteristics of different objects and edge detection results.


 ,
, 


