
Inventory of Historical and Recent Earthquake-Triggered Landslides and Assessment of Related Susceptibility by GIS-Based Analytic Hierarchy Process: The Case of Cephalonia (Ionian Islands, Western Greece)

 , , ,
, , ,  ,
,  ,
,  , ,
, ,
Abstract
:1. Introduction
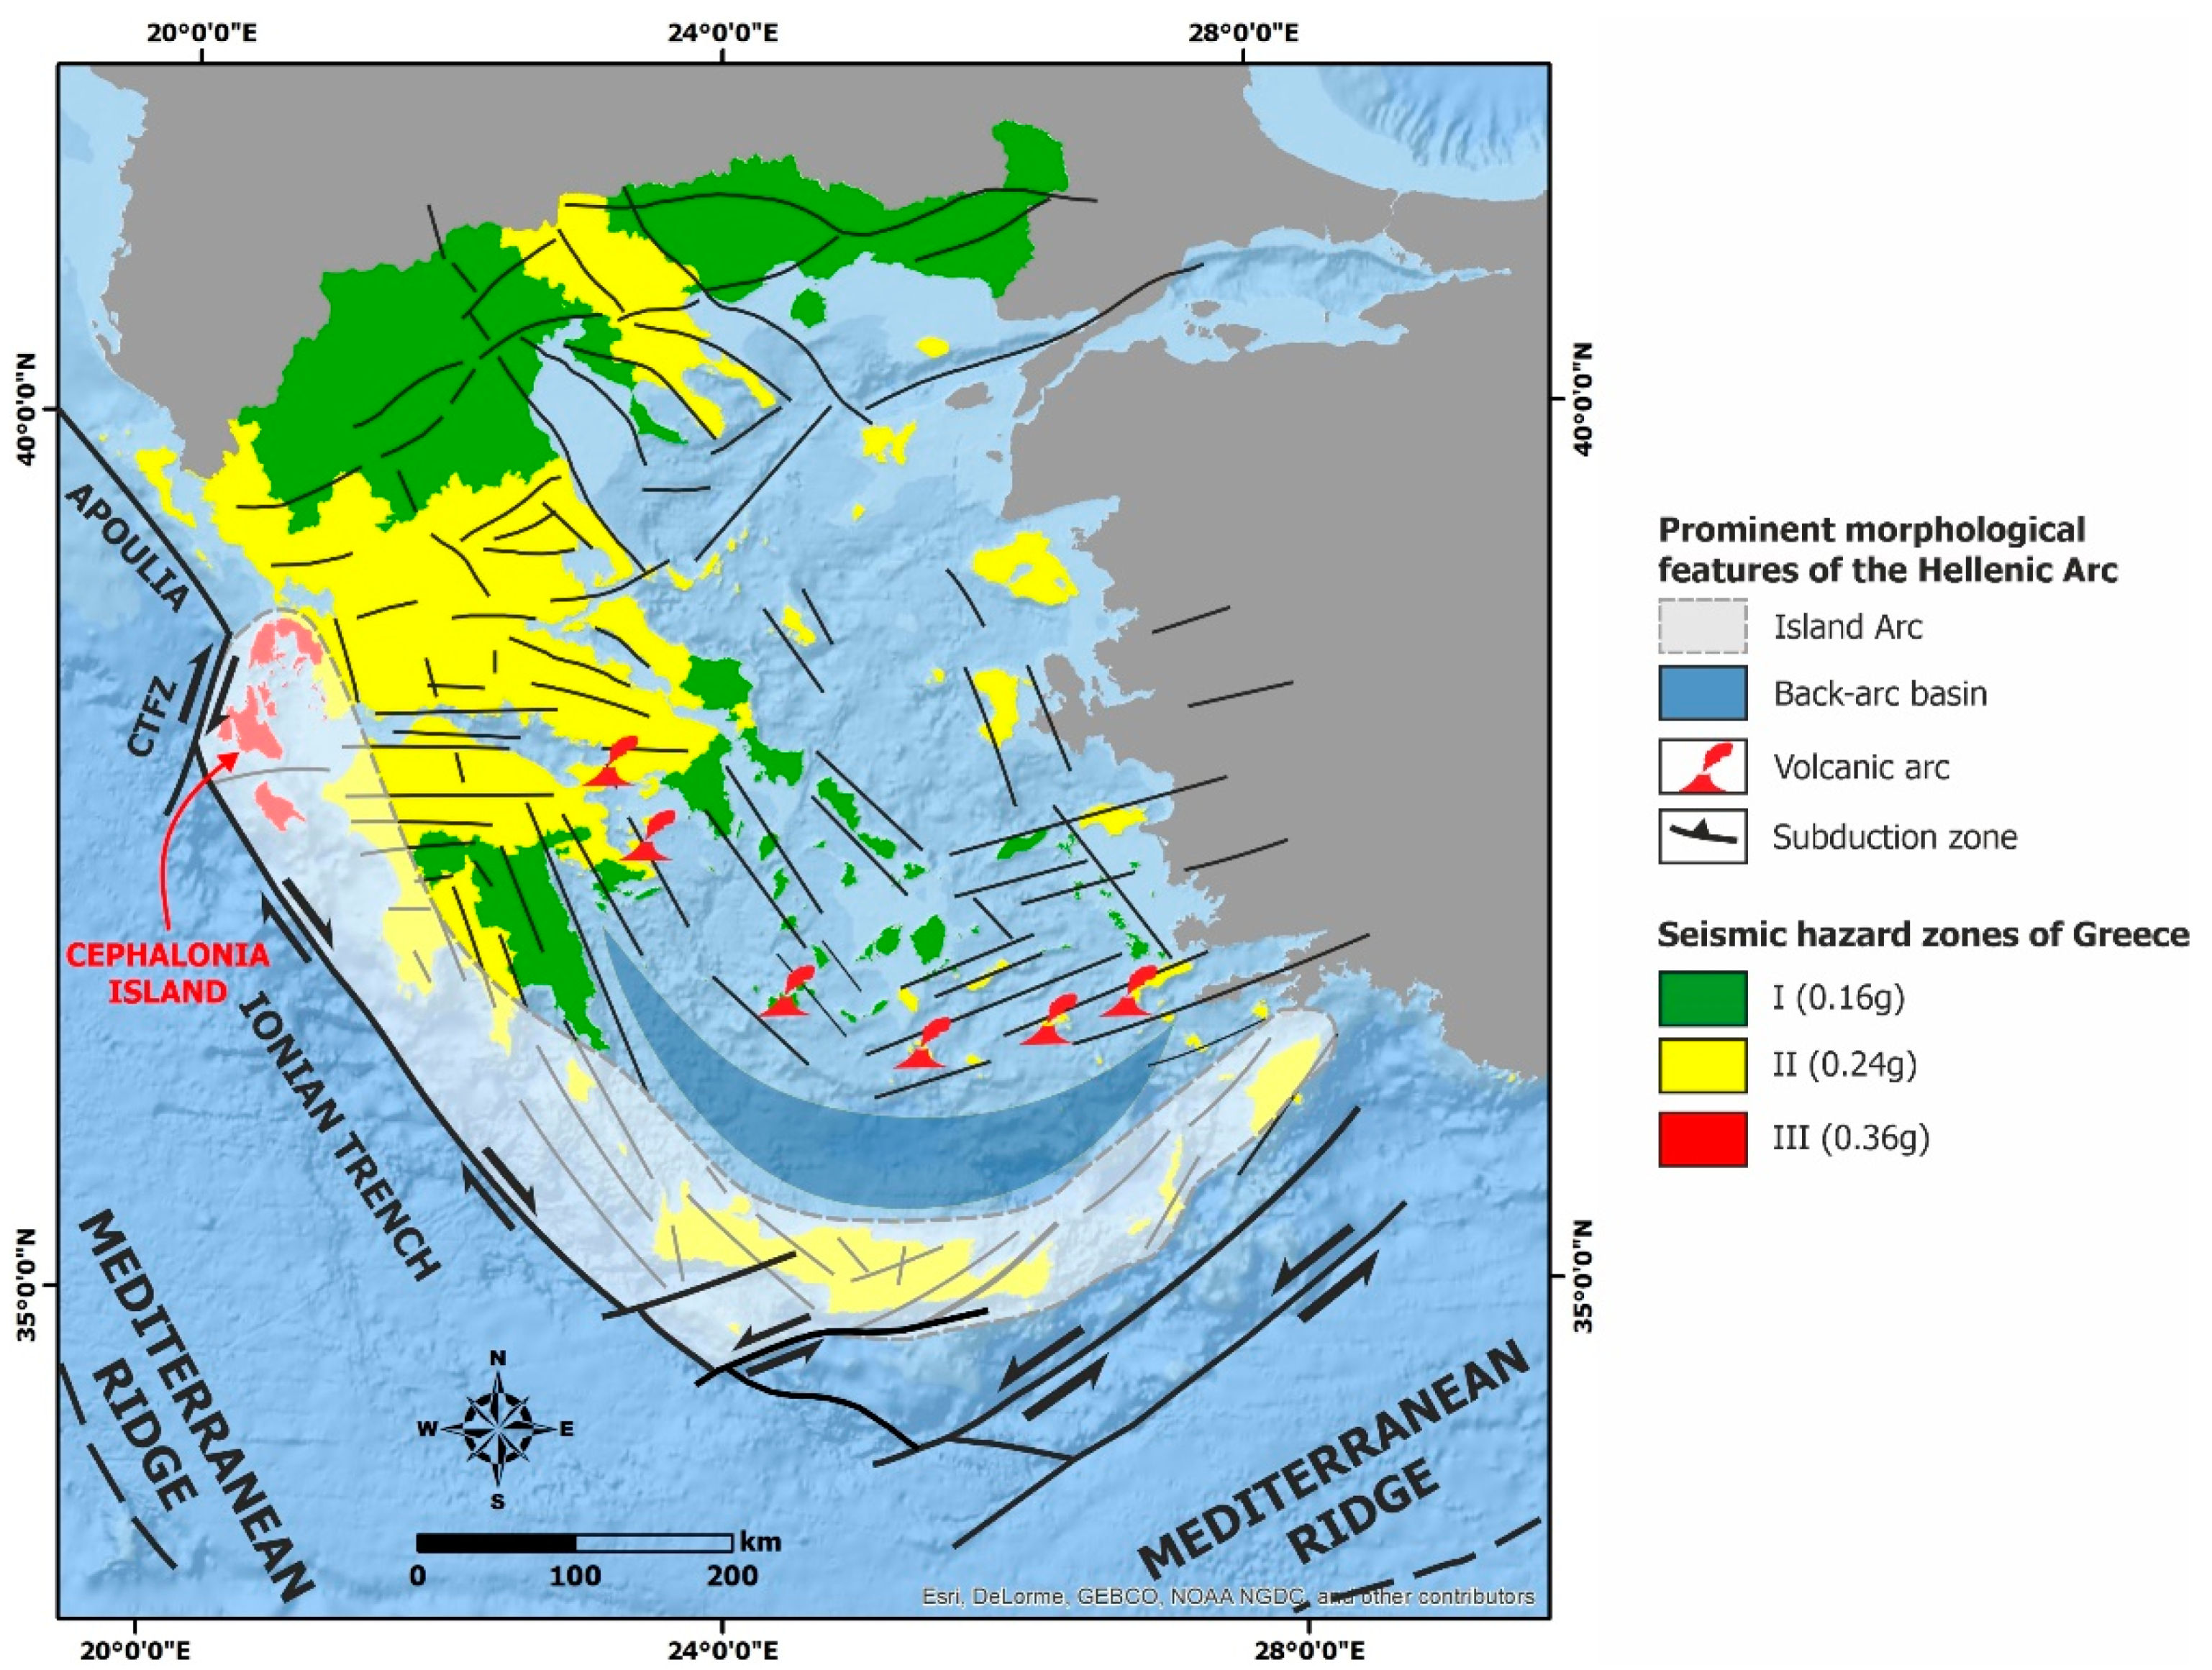
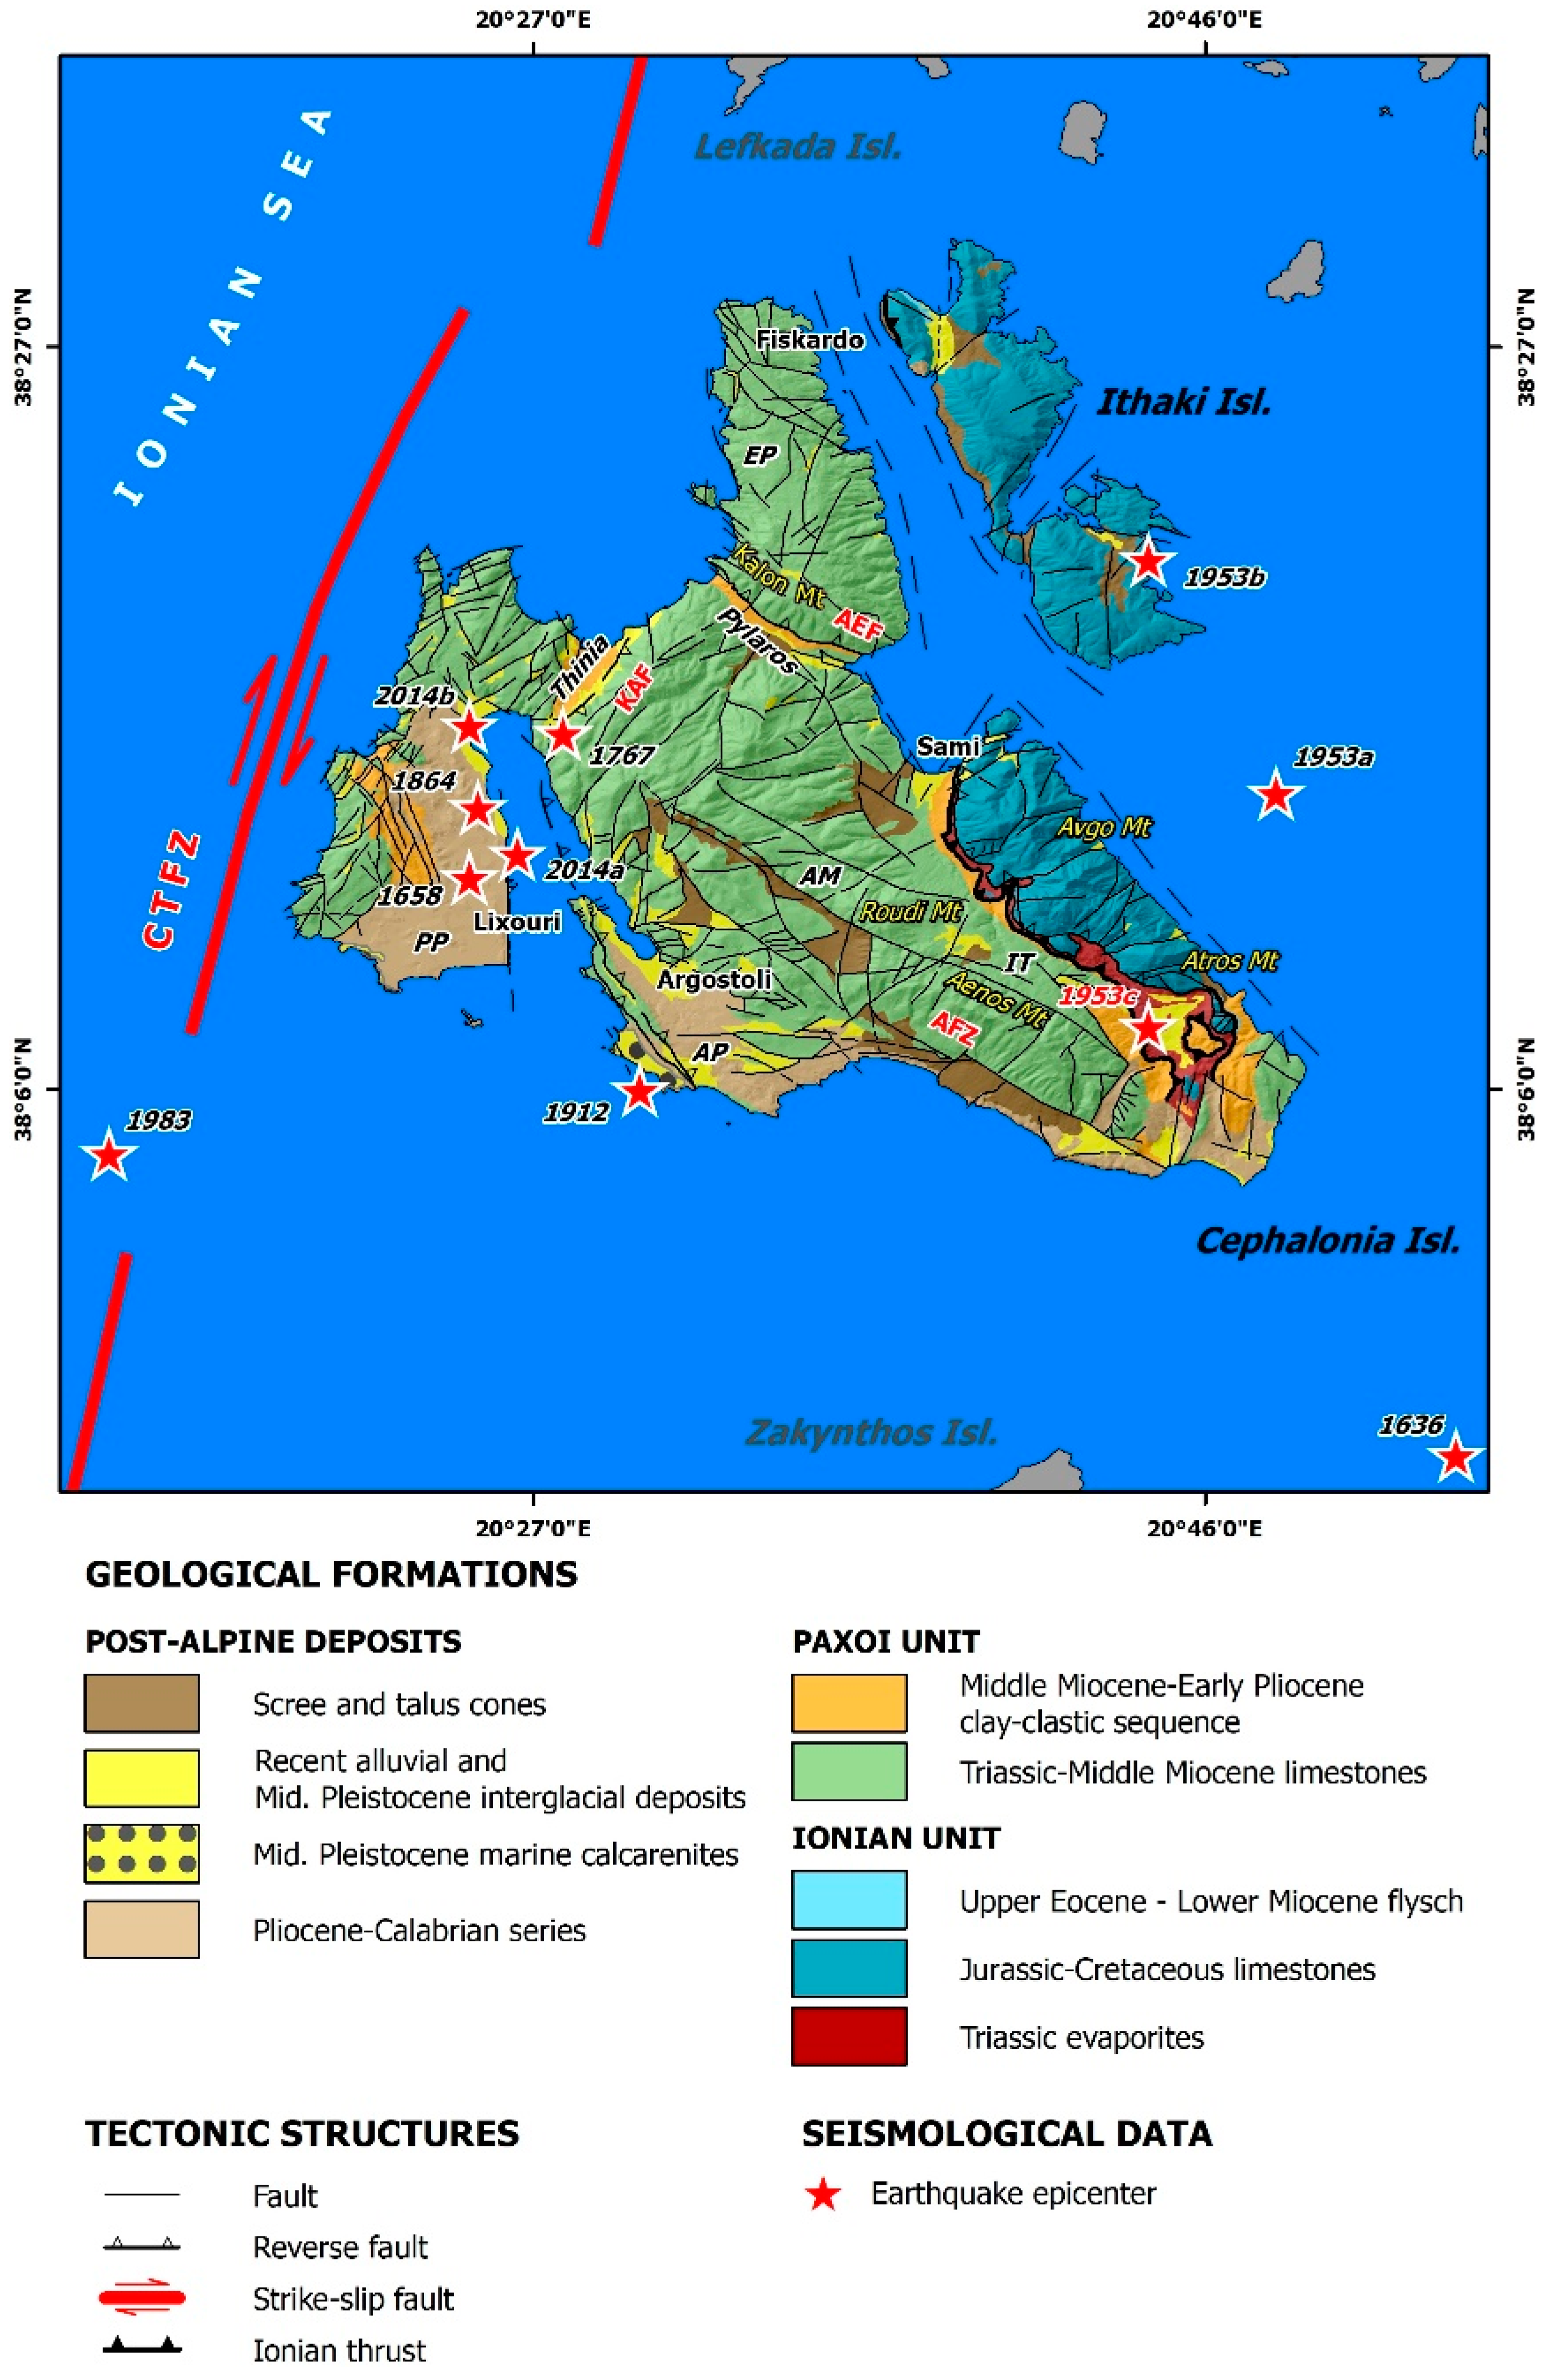
2. Geological and Seismotectonic Setting
3. ETL Inventory in Cephalonia Island
3.1. Recent Studies on Landslide Inventory in Greece
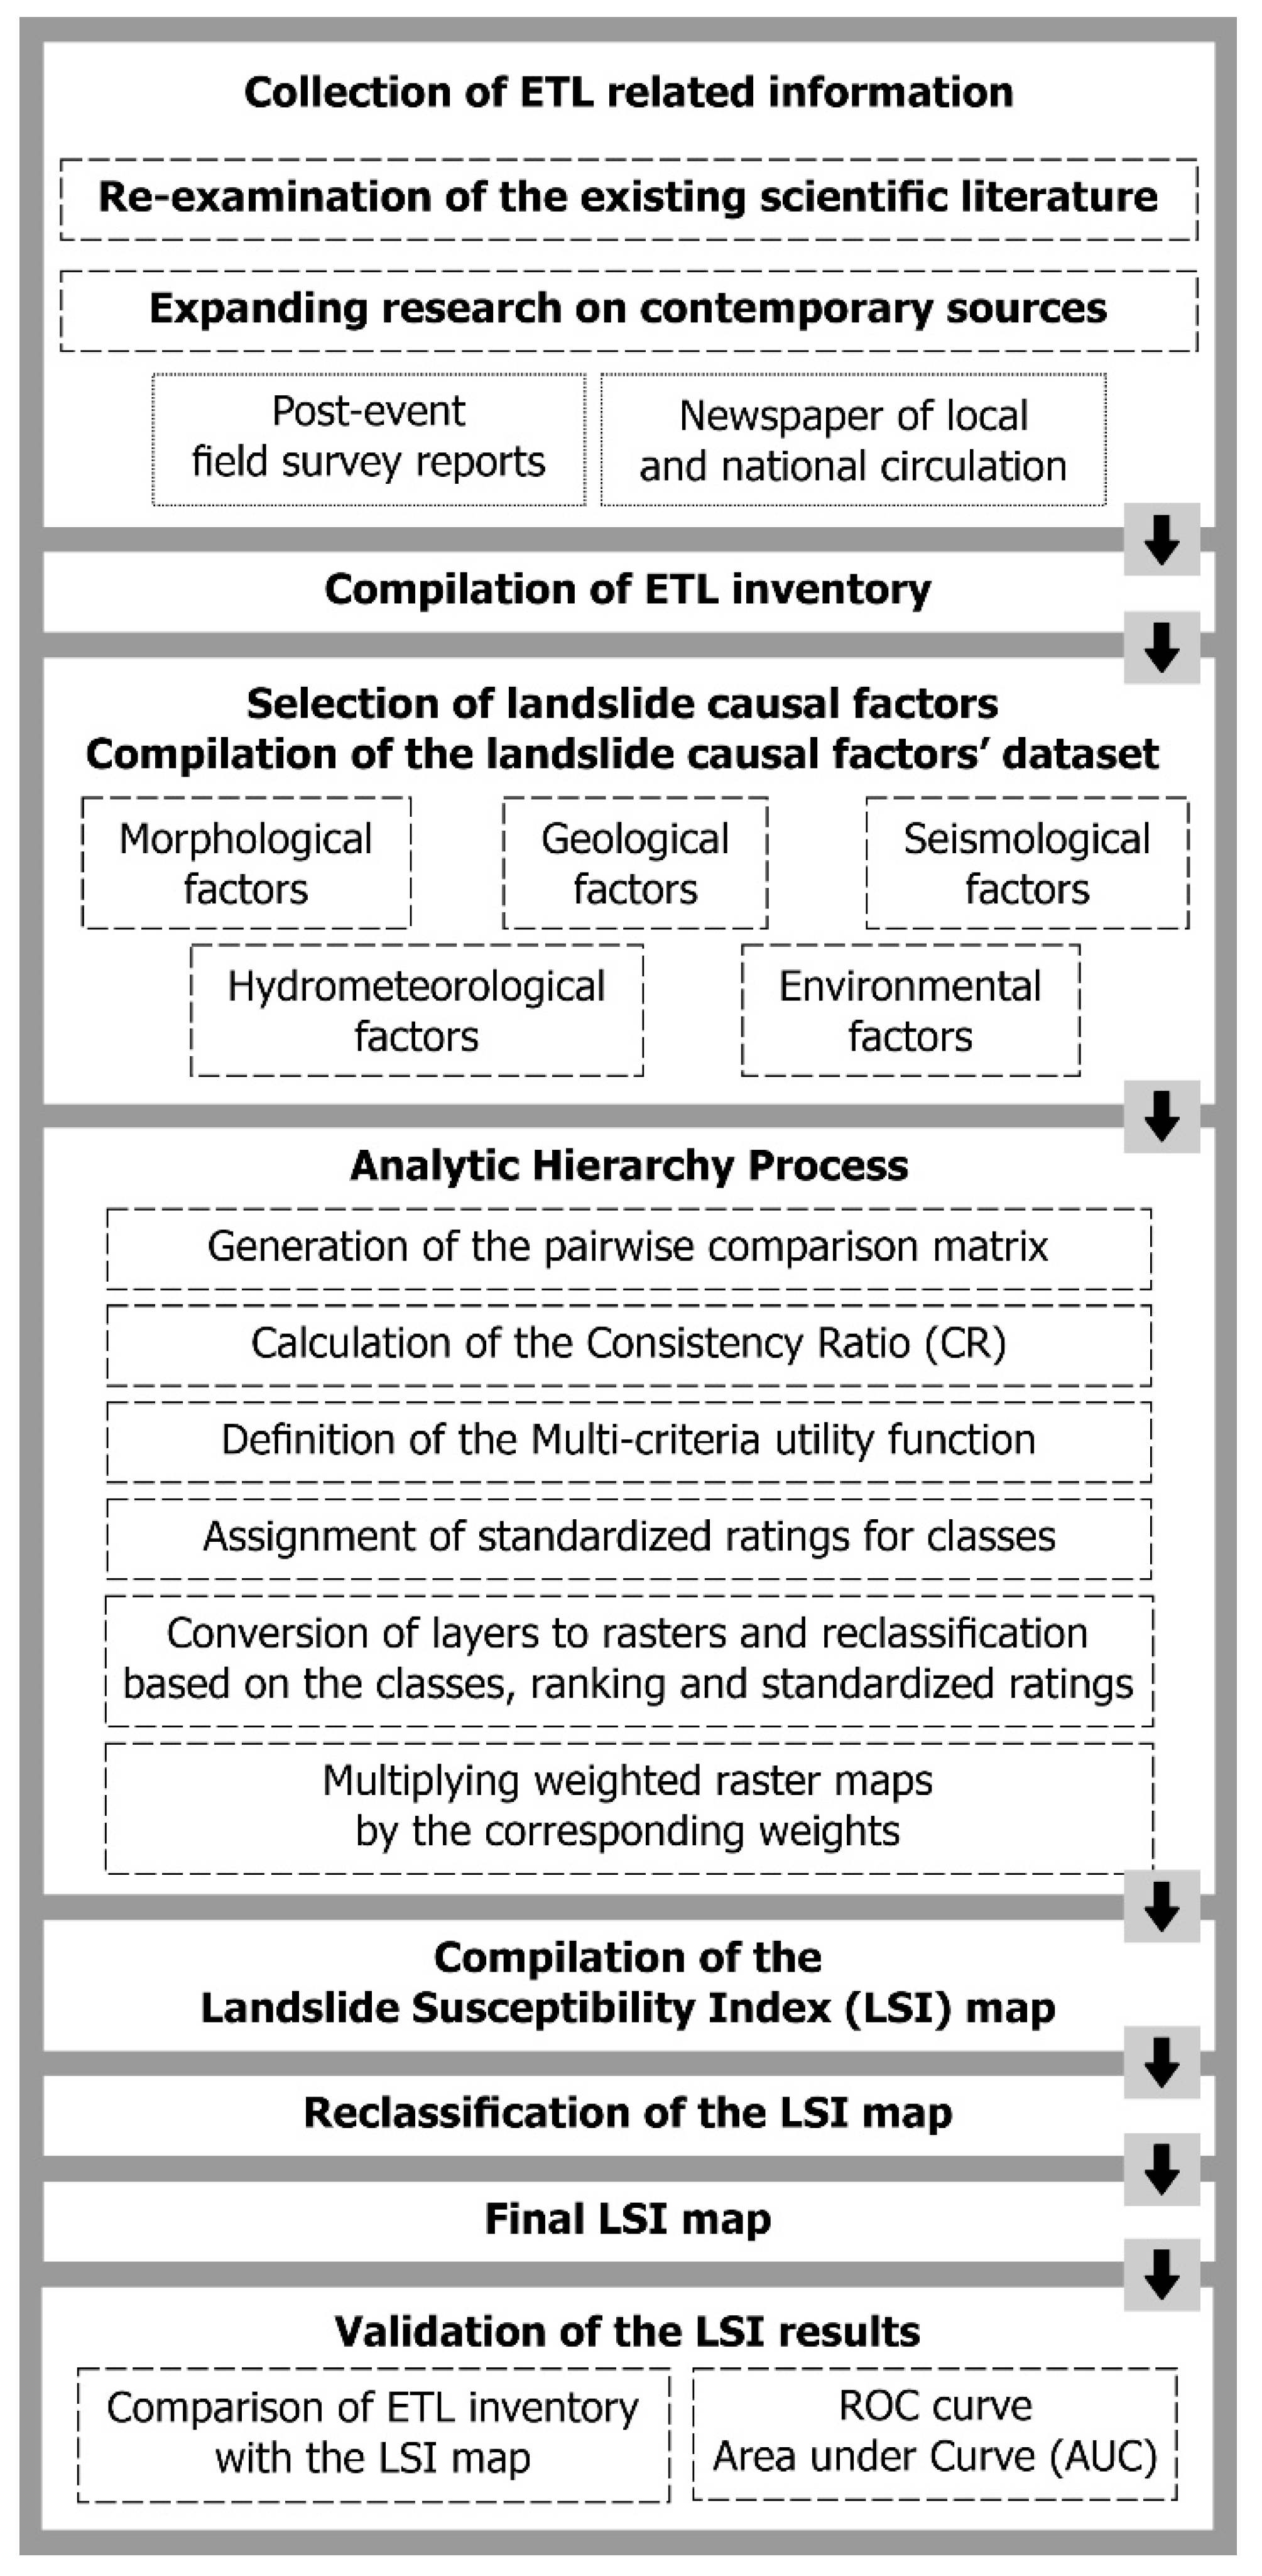
3.2. Methodology
- The Press Museum of the Peloponnese—Epirus—Ionian Islands Daily Newspaper Editors Association [56];
- The Digital Historical Archive of the Lambrakis Press Group [57];
- The Digital Library of Newspapers and Magazines of the National Library of Greece [58];
- The Digital Library of the Greek Parliament [59].
- ETHNIKOS KIRIX (in Greek: Εθνικός Κήρυξ; lit. National Herald, abbreviated by EK)
- I IMERA (in Greek: H Hμέρα; lit. The Day, abbreviated by IM)
- NEOLOGOS PATRON (in Greek: Νεολόγος Πατρών; lit. Patras Neologist, abbreviated by NP)
- PELOPONNISOS (in Greek: Πελοπόννησος; lit. Peloponnese, abbreviated by PL)
- TO VIMA (Greek: TO BHMA, lit: The Tribune, abbreviated by TV)
- TA NEA (Greek: TA NEA, lit: The News, abbreviated by TN)
- ANAMORFOSIS (Greek: Aναμόρφωσις, lit: Reform, abbreviated by AN)
- AVGI (Greek: Aυγή, lit: Dawn, abbreviated by AV)
- MERIMNA (Greek: Μέριμνα, lit: Concern, abbreviated by ME)
- ELEFTHERIA (Greek: Ελευθερία, lit: Freedom, abbreviated by EL)
- EMPROS (Greek: Εμπρός, lit: Ahead, abbreviated by EM)
- ELPIS (Greek: Ελπίς, lit: Hope, abbreviated by EL).
- ZIZANIO (Greek: Ζιζάνιο, lit: Pest, abbreviated by ZN).
- Taxydromos (Greek: Ταχυδρόμος, lit: The Postman, abbreviated by TD).
3.3. Historical and Recent ETL in Cephalonia Island
3.3.1. The 30 September 1636 Earthquake
3.3.2. The 24 August 1658 Earthquake
3.3.3. The 22 July 1767 Earthquake
3.3.4. The 4 February 1867 Earthquake
3.3.5. The 24 January 1912 Earthquake
3.3.6. The August 1953 Seismic Sequence
- The 9 August 1953 earthquake
- The 11 August 1953 earthquake
- The 12 August 1953 earthquake
3.3.7. The 17 January 1983 Earthquake
3.3.8. The Early 2014 Cephalonia Sequence
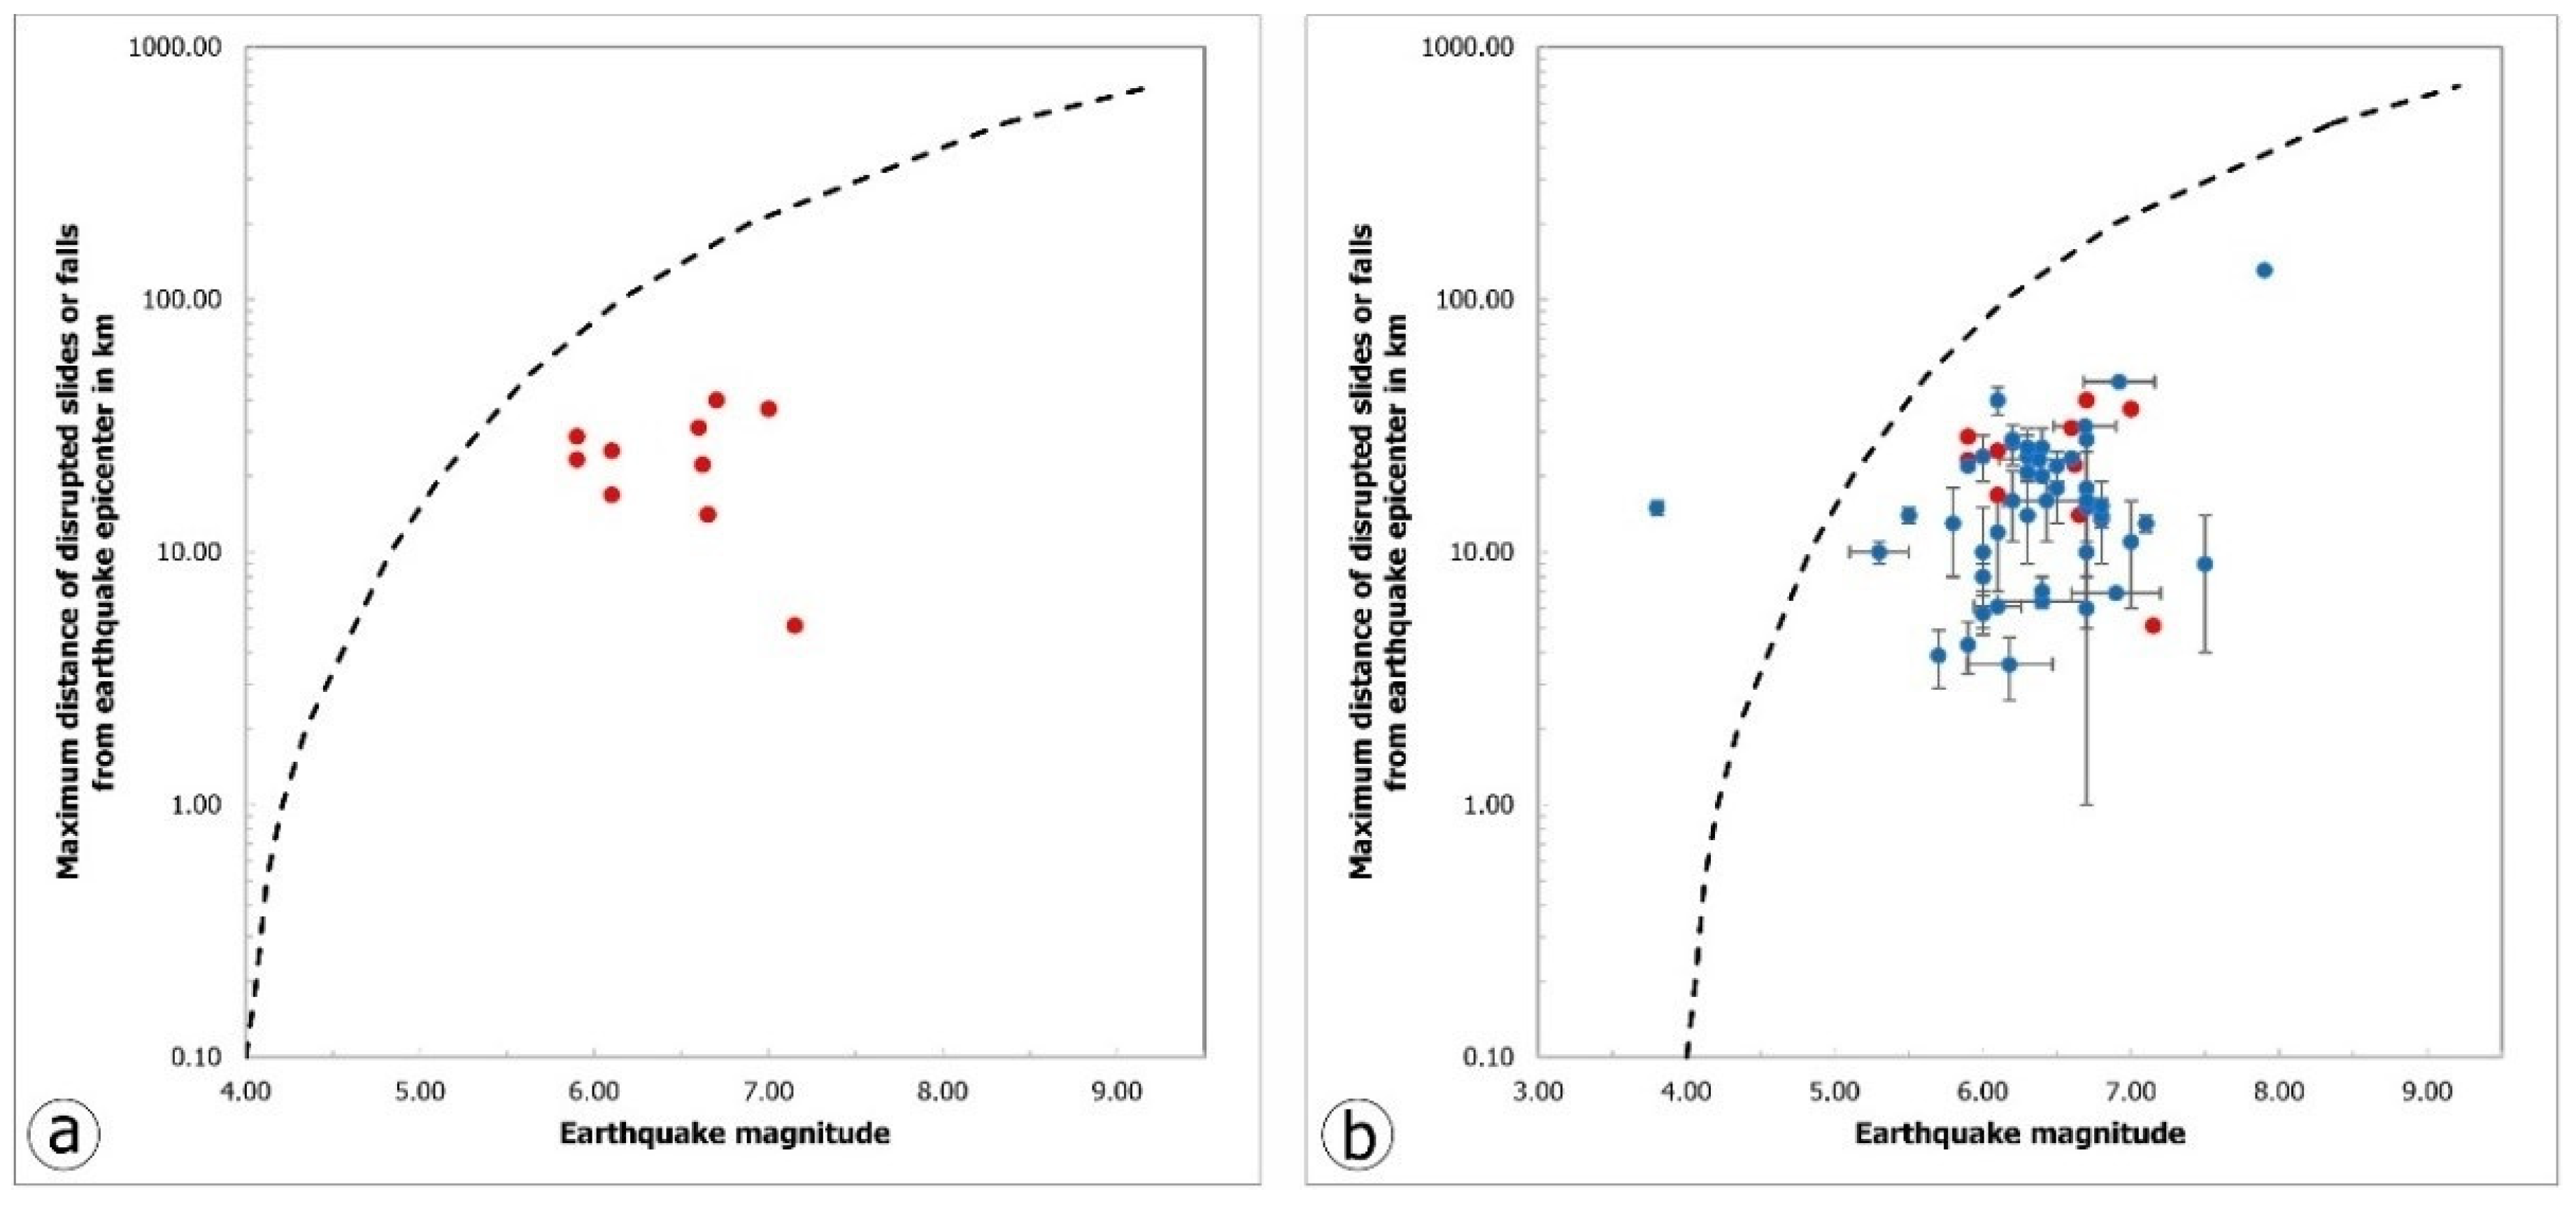
3.4. Maximum Epicentral Distances as a Function of Earthquake Magnitudes
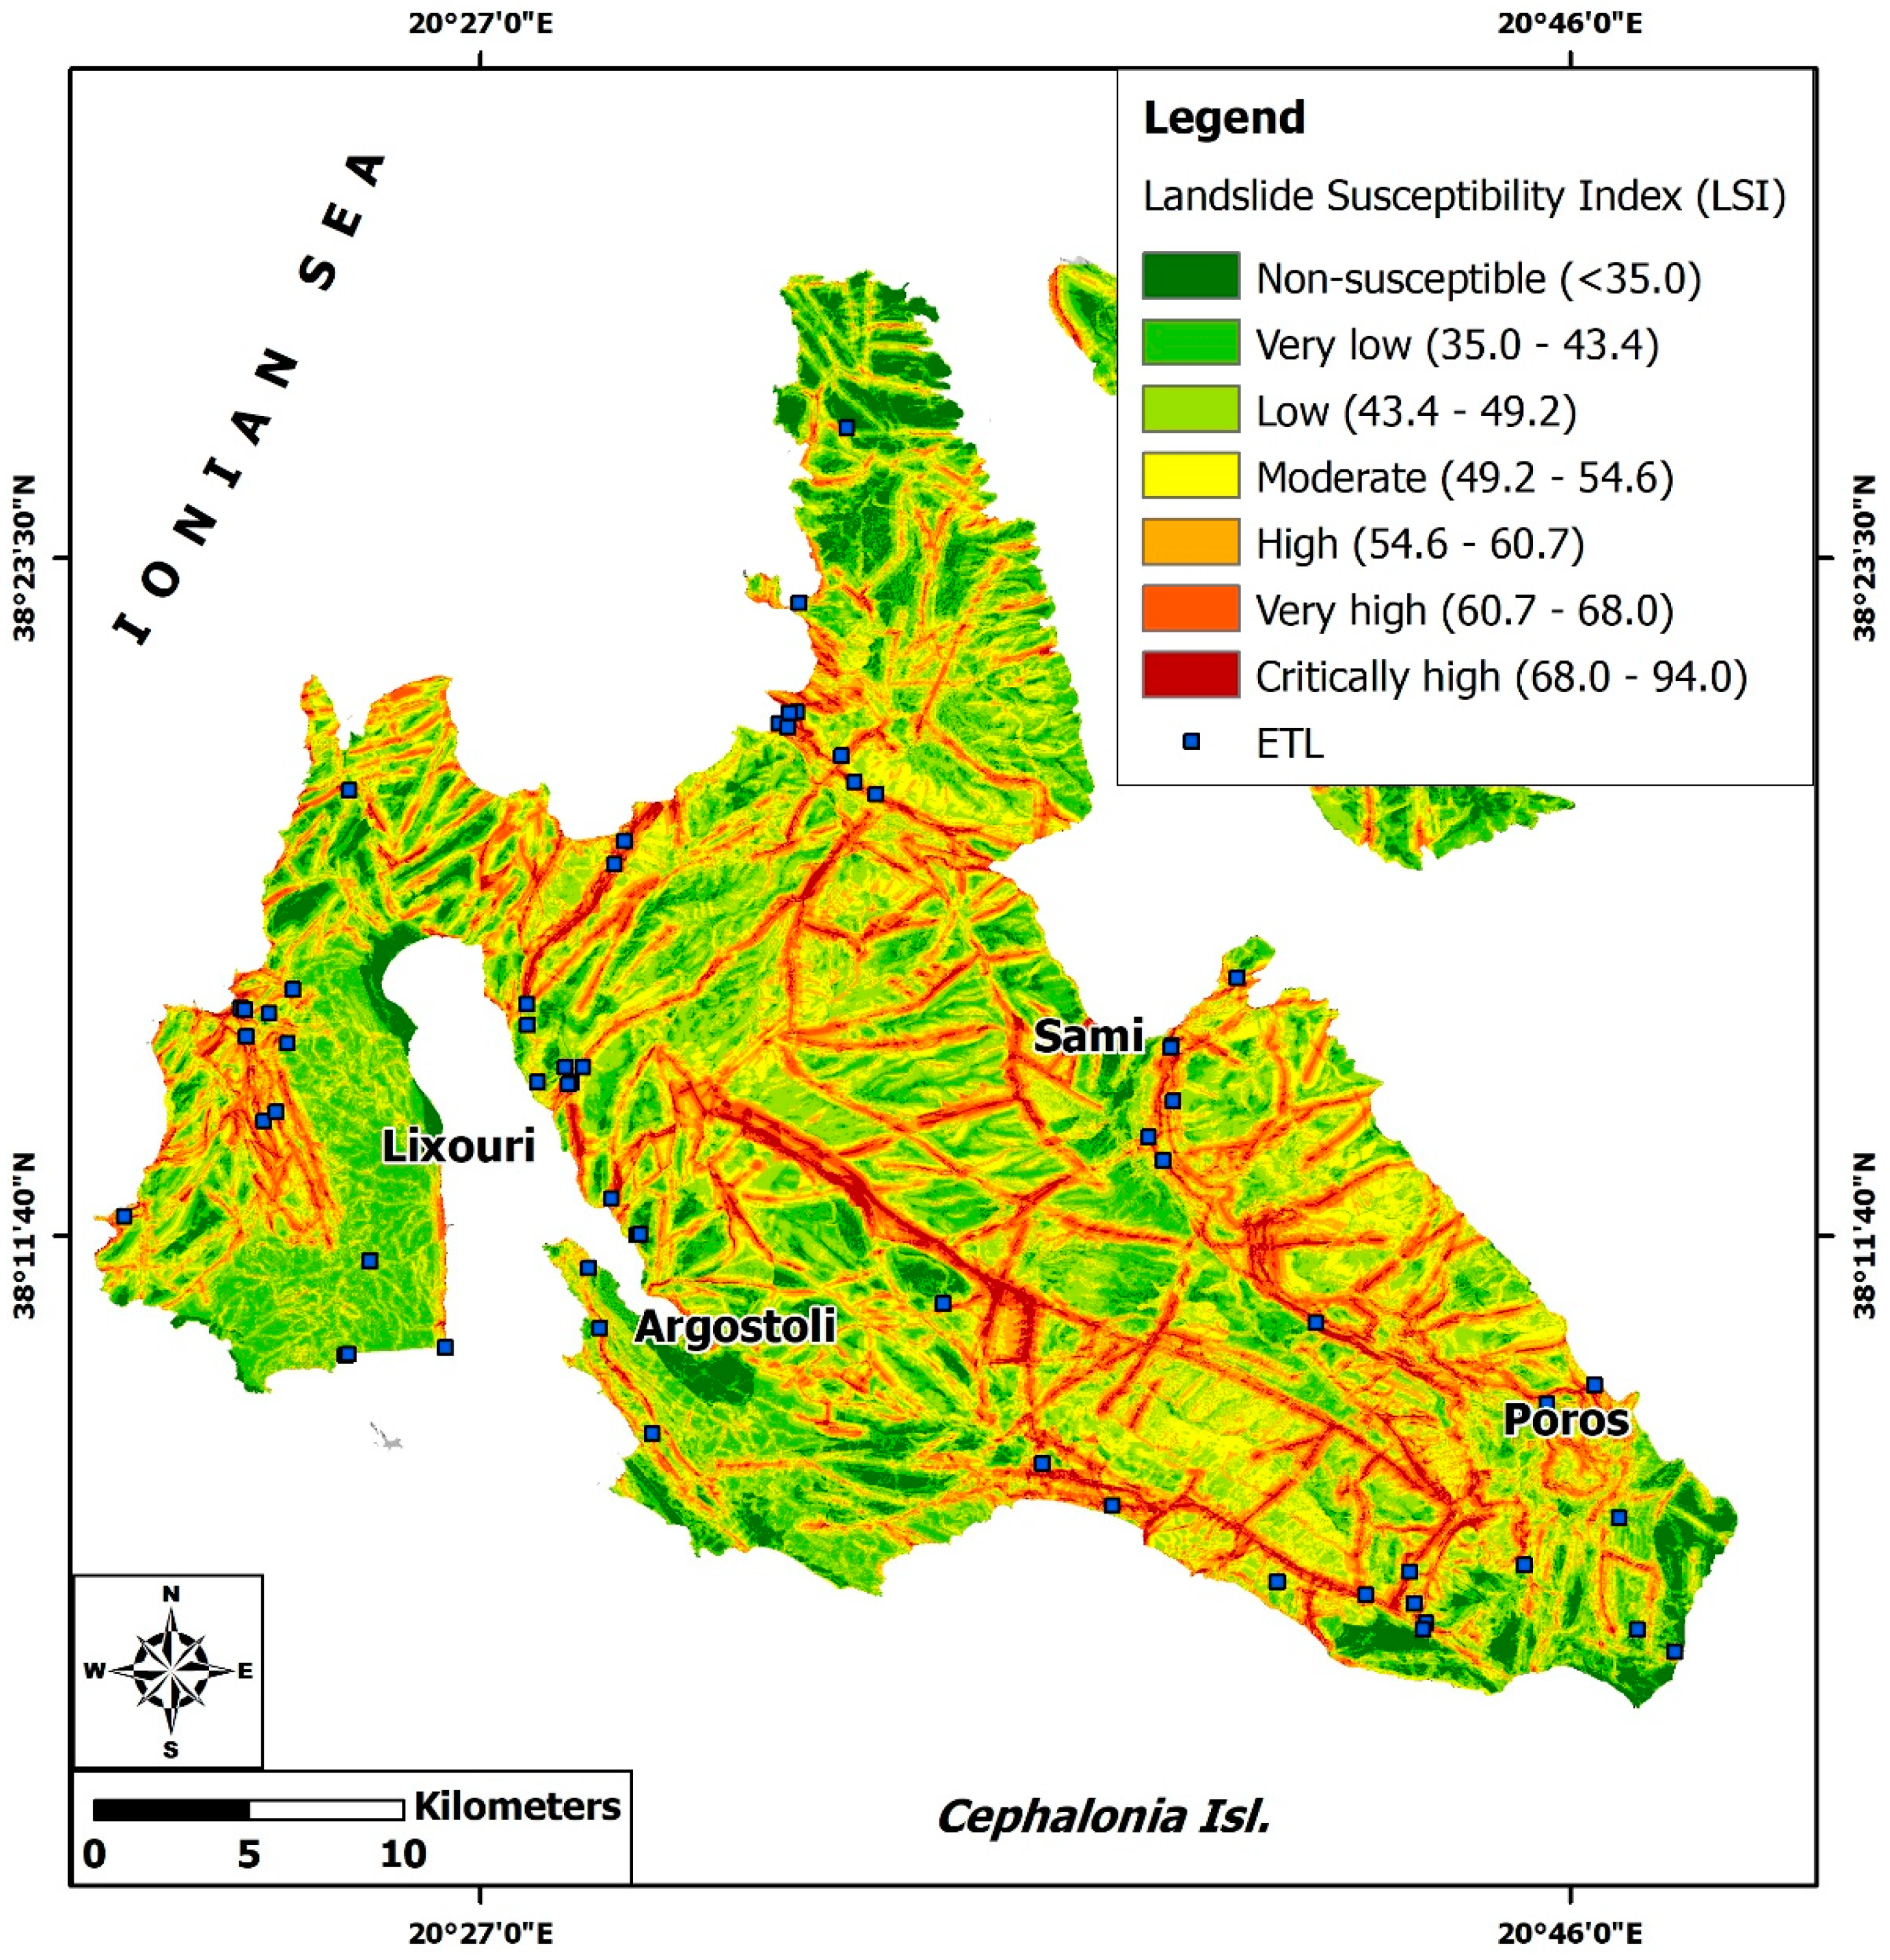
4. ETL Susceptibility Assessment in Cephalonia Based on GIS-Based Analytic Hierarchy Process
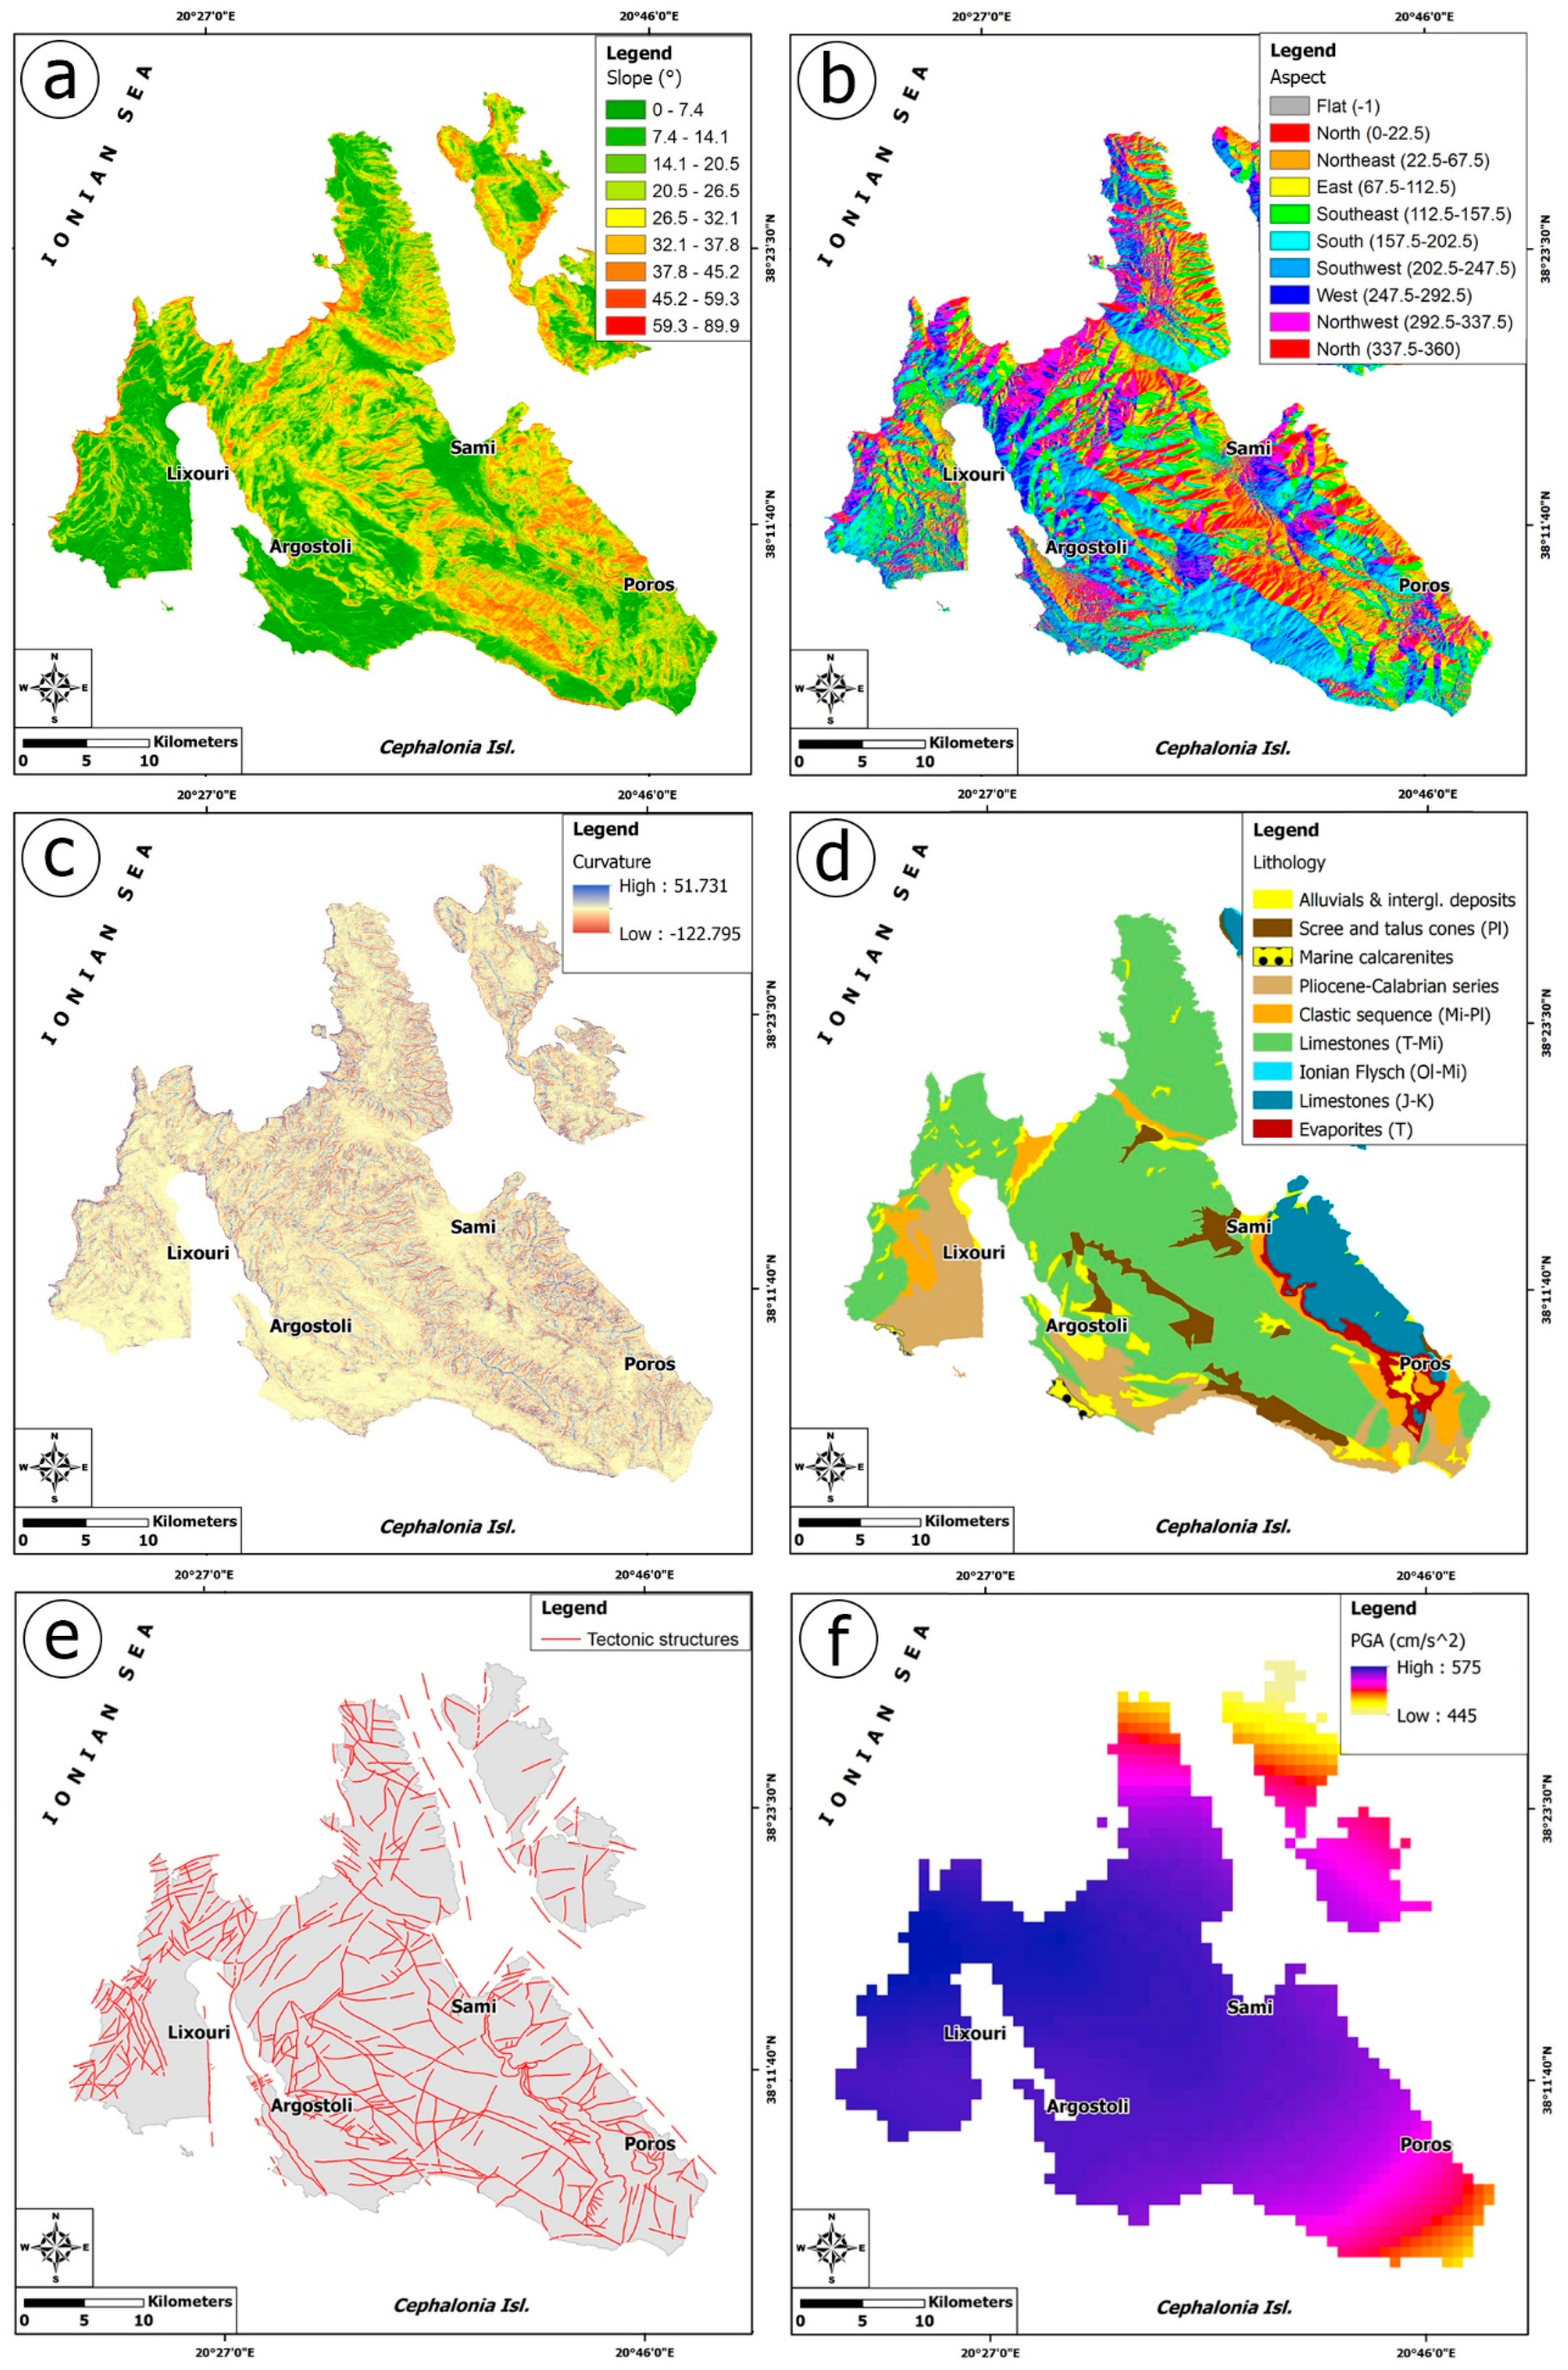
4.1. ETL Susceptibility Model
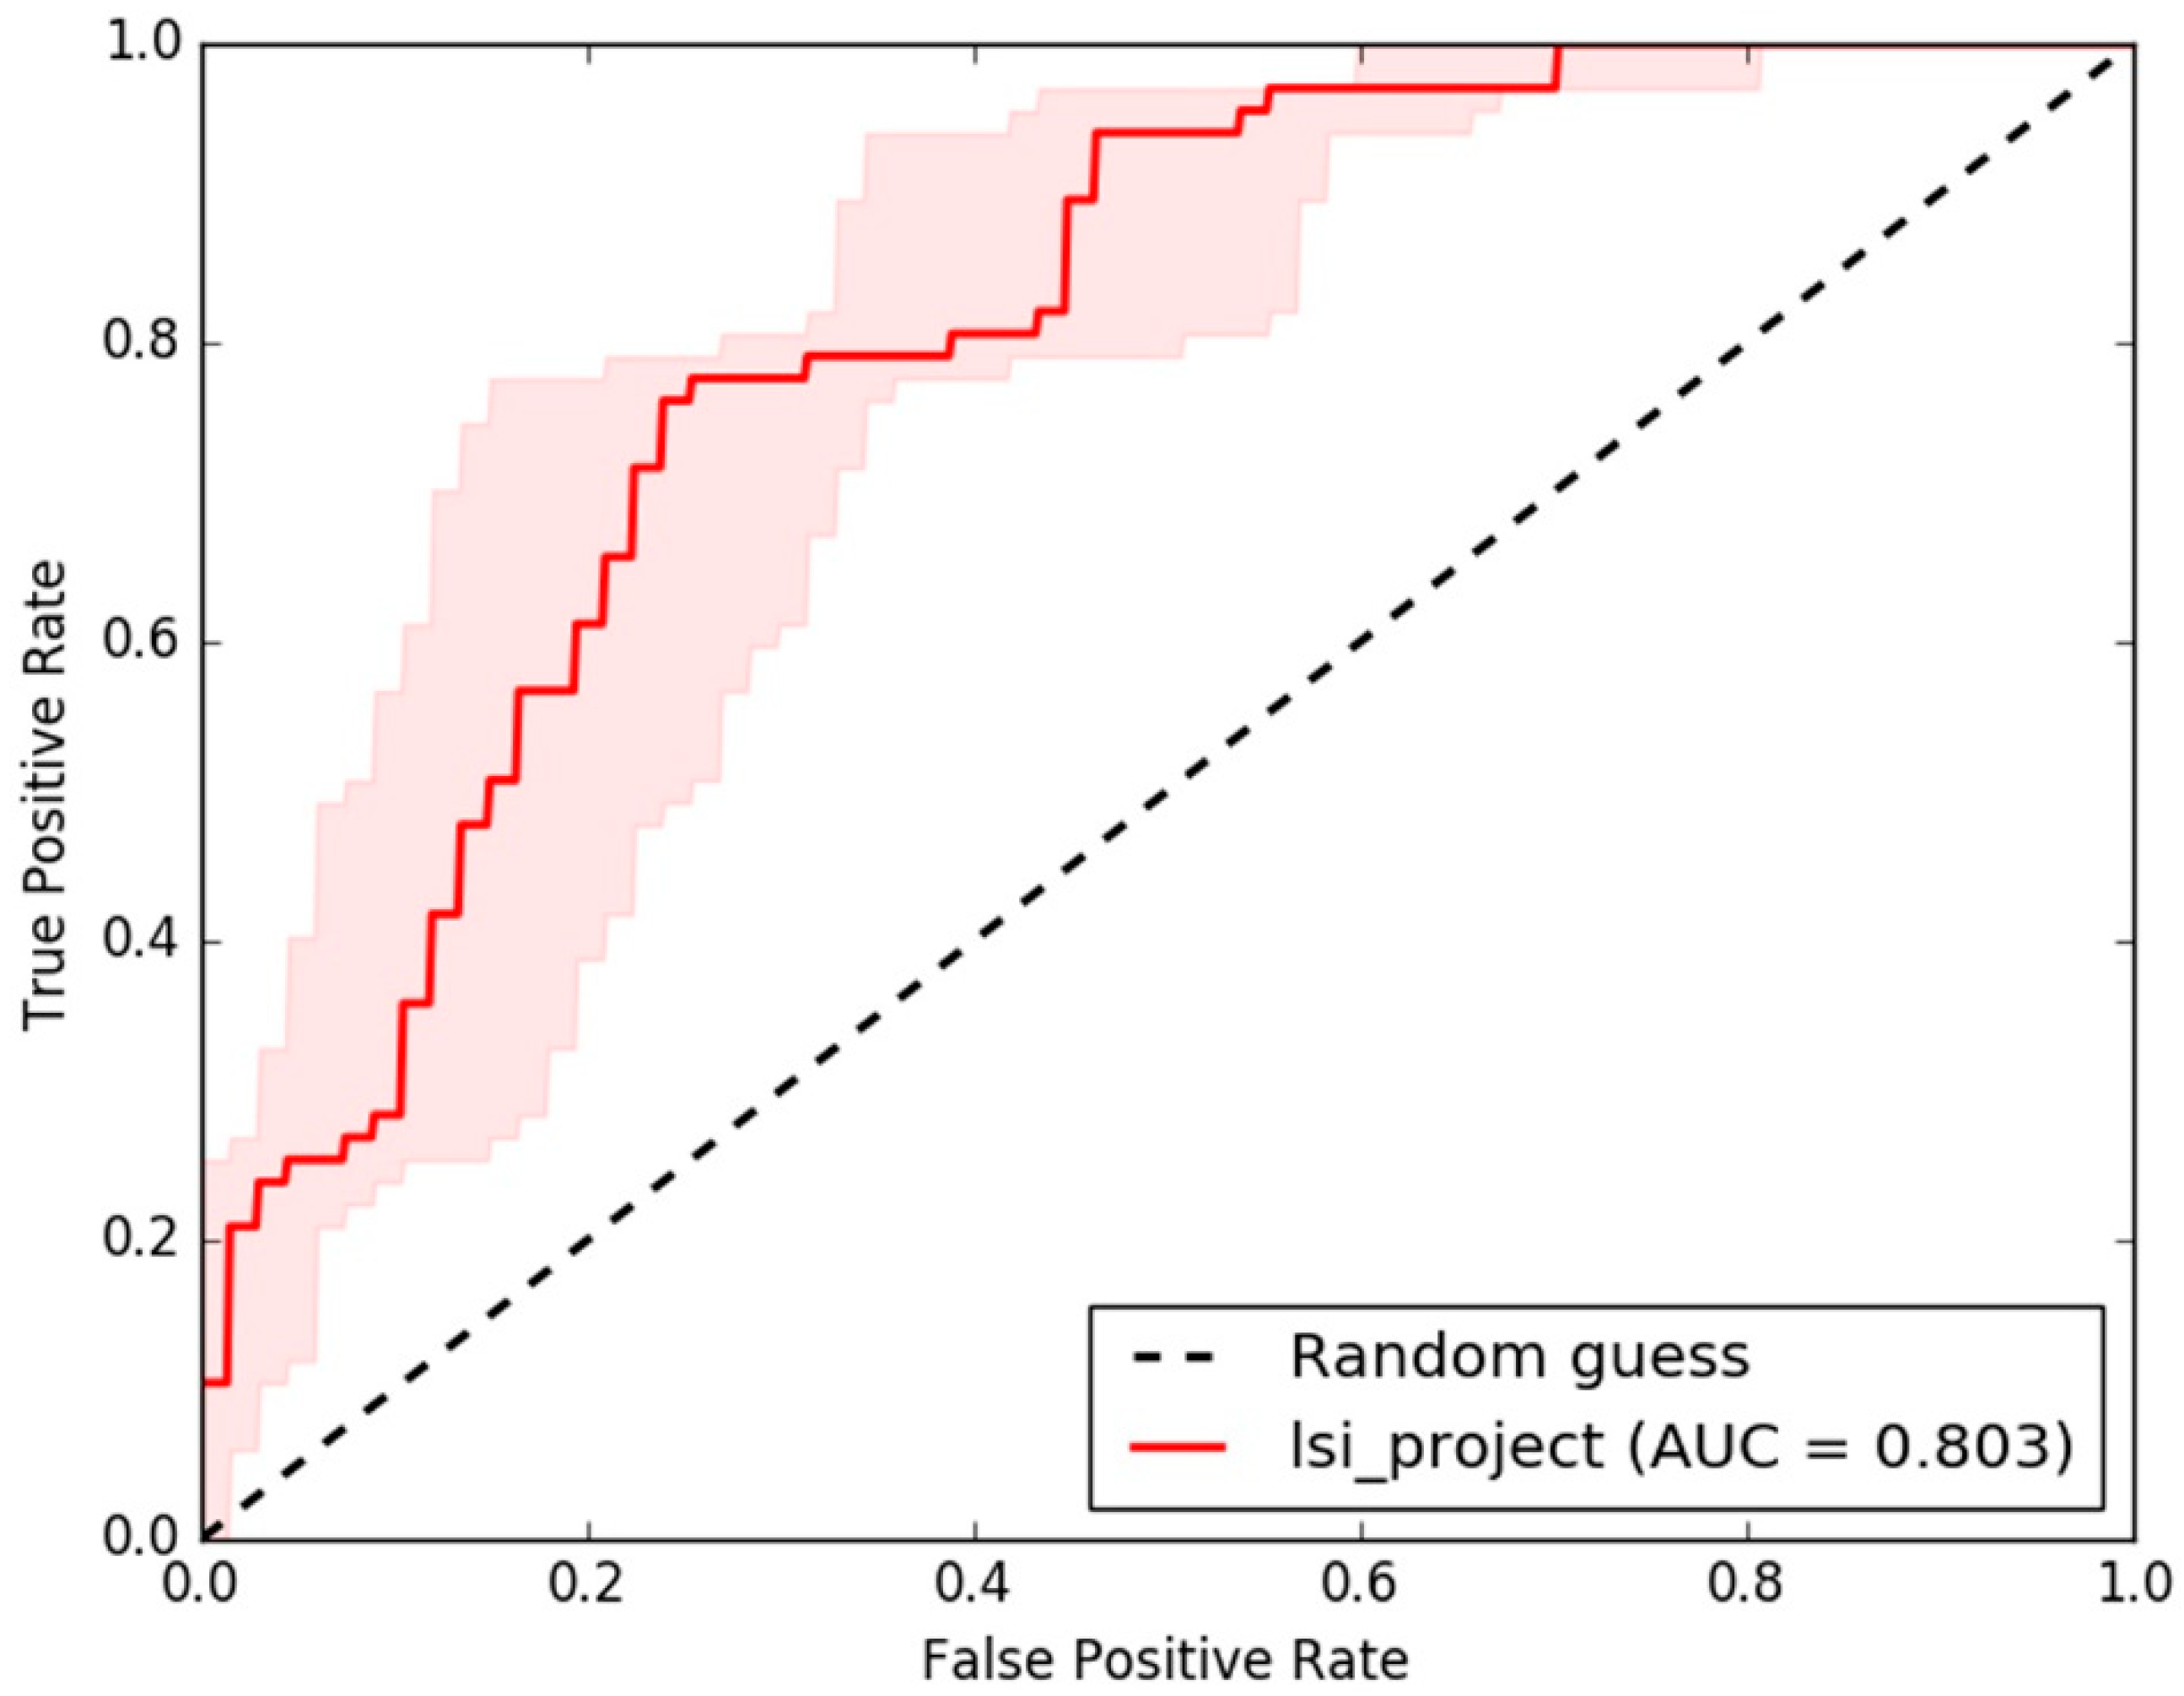
4.2. Validation of the Model
5. Discussion
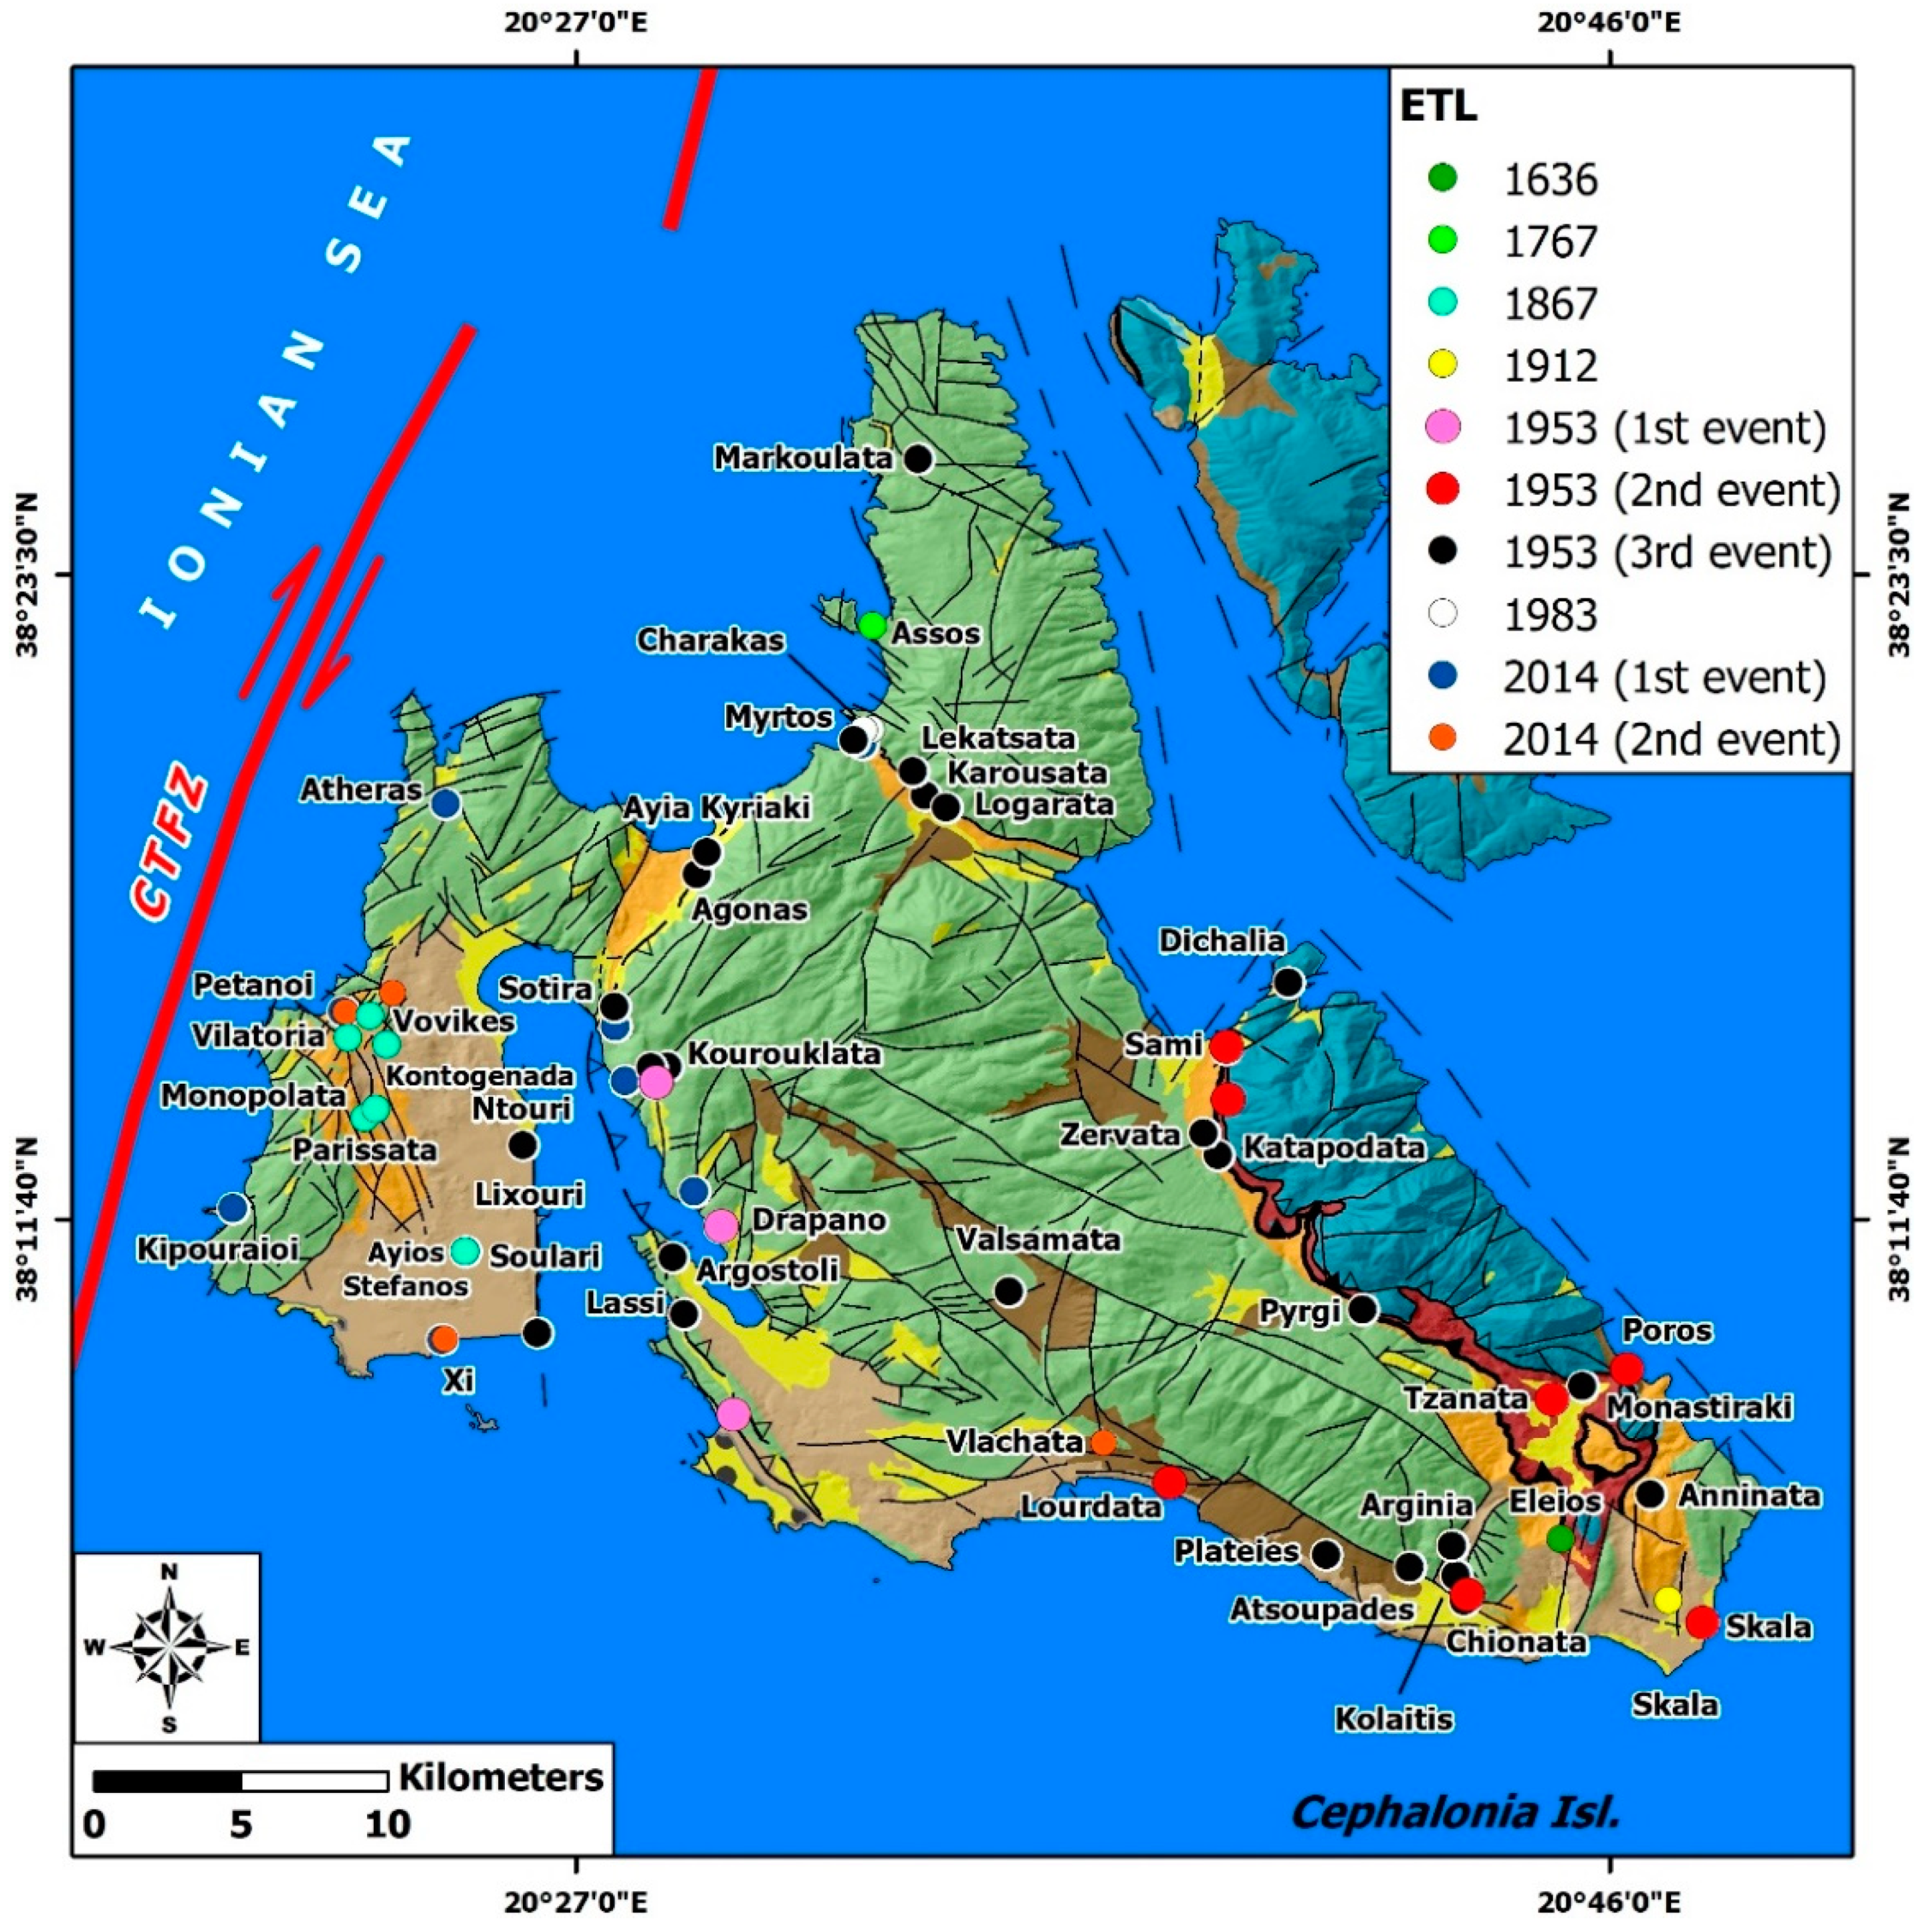
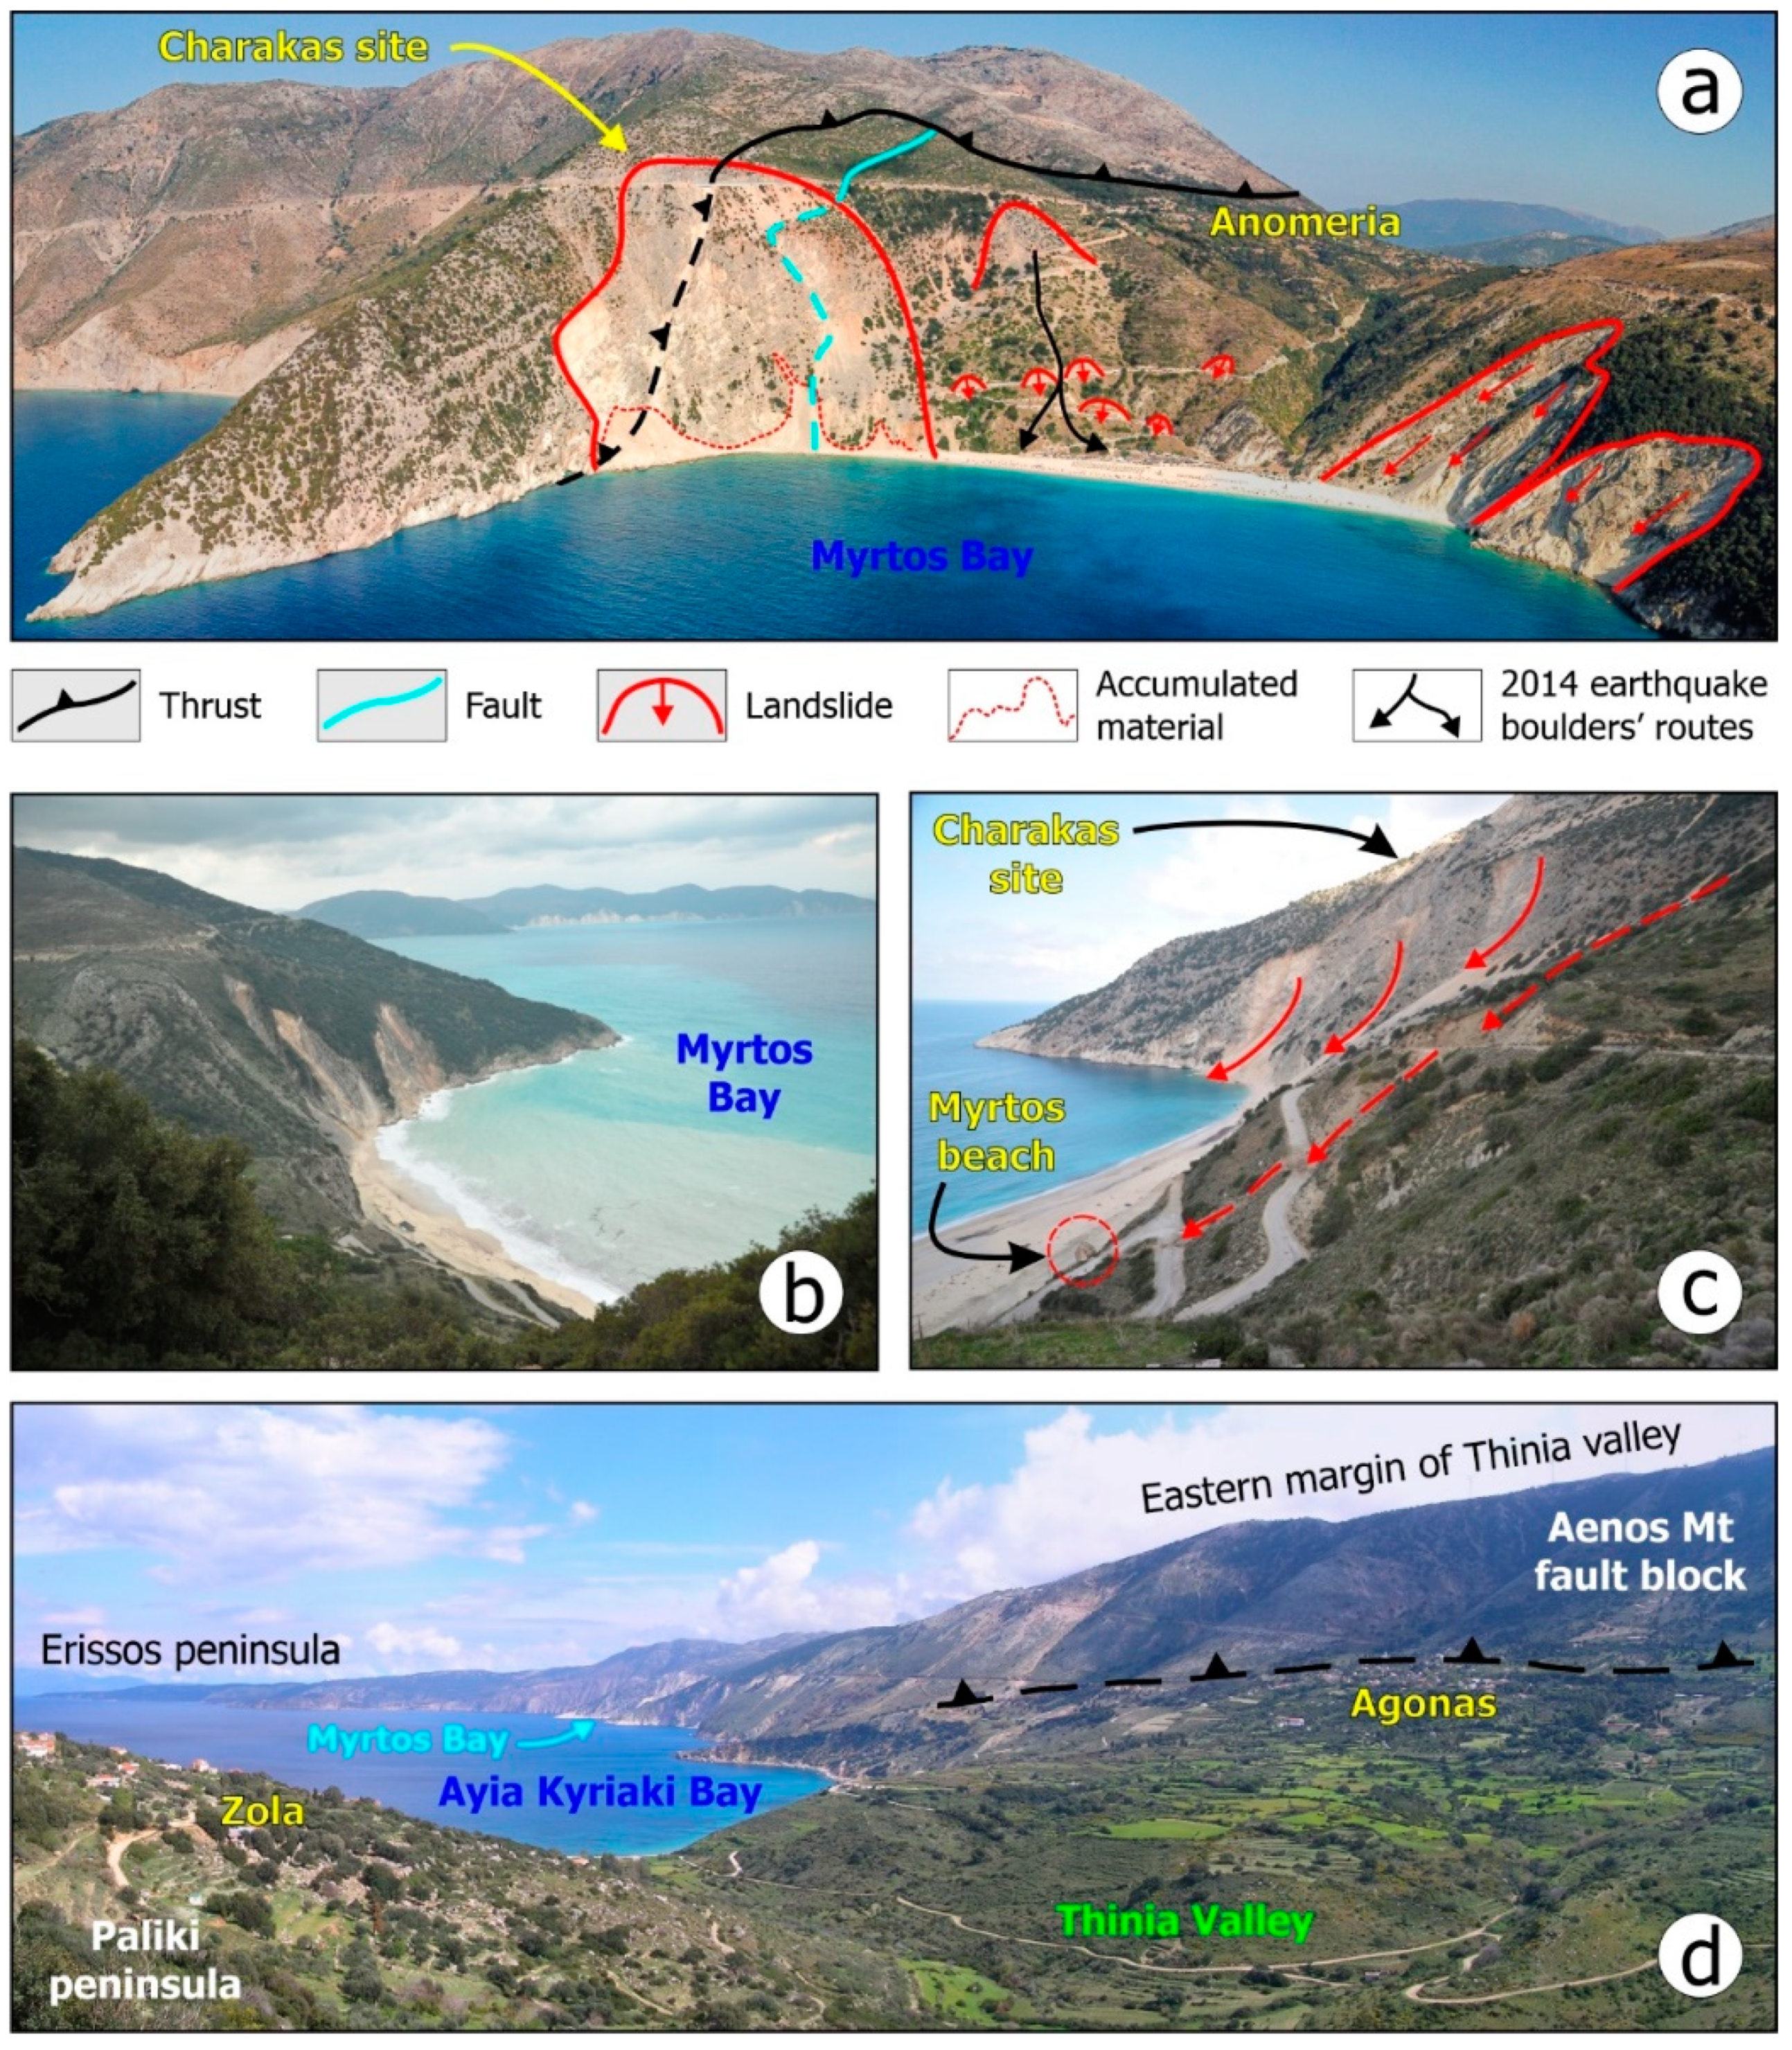
- The northern margins of Pylaros valley, located between Kalon Mt to the north and Ayia Dynati to the south, constitutes one for the most susceptible zones. Along the southern slopes of Kalon Mt, the Ayia Efimia oblique slip reverse fault occurs, which has formed a highly fractured and deformed rock mass, susceptible to slope failure from earthquakes. This situation is highlighted not only by the slope failures generated during the 1953 earthquakes at Lekatsata, Logarata and Karousata villages (Figure 4), but also by similar impressive effects that have taken place further west, in the coastal area of Myrtos bay during the occurrence of the devastating earthquakes of 1953, 1983 and 2014 [10,62,64], which resulted in damage and destruction of adjacent sections of the road network and temporary traffic disruption. It is important to mention that the coastal area of Myrtos is particularly prone to slope failures, caused not only by earthquakes, but also during extreme hydro-meteorological events. A typical example for the later events is the case of the “Ianos” Mediterranean cyclone (medicane) in mid-September 2020, which affected several areas in Greece and especially Lefkada, Cephalonia, Ithaki and Zakynthos Islands, causing flooding, mudflows and debris flows with severe impacts on networks and infrastructure of Cephalonia (Assos area in the Erissos peninsula, and Myrtos and Ayia Efimia areas at the western and eastern ends of the Pylaros valley, respectively; [149,150]).
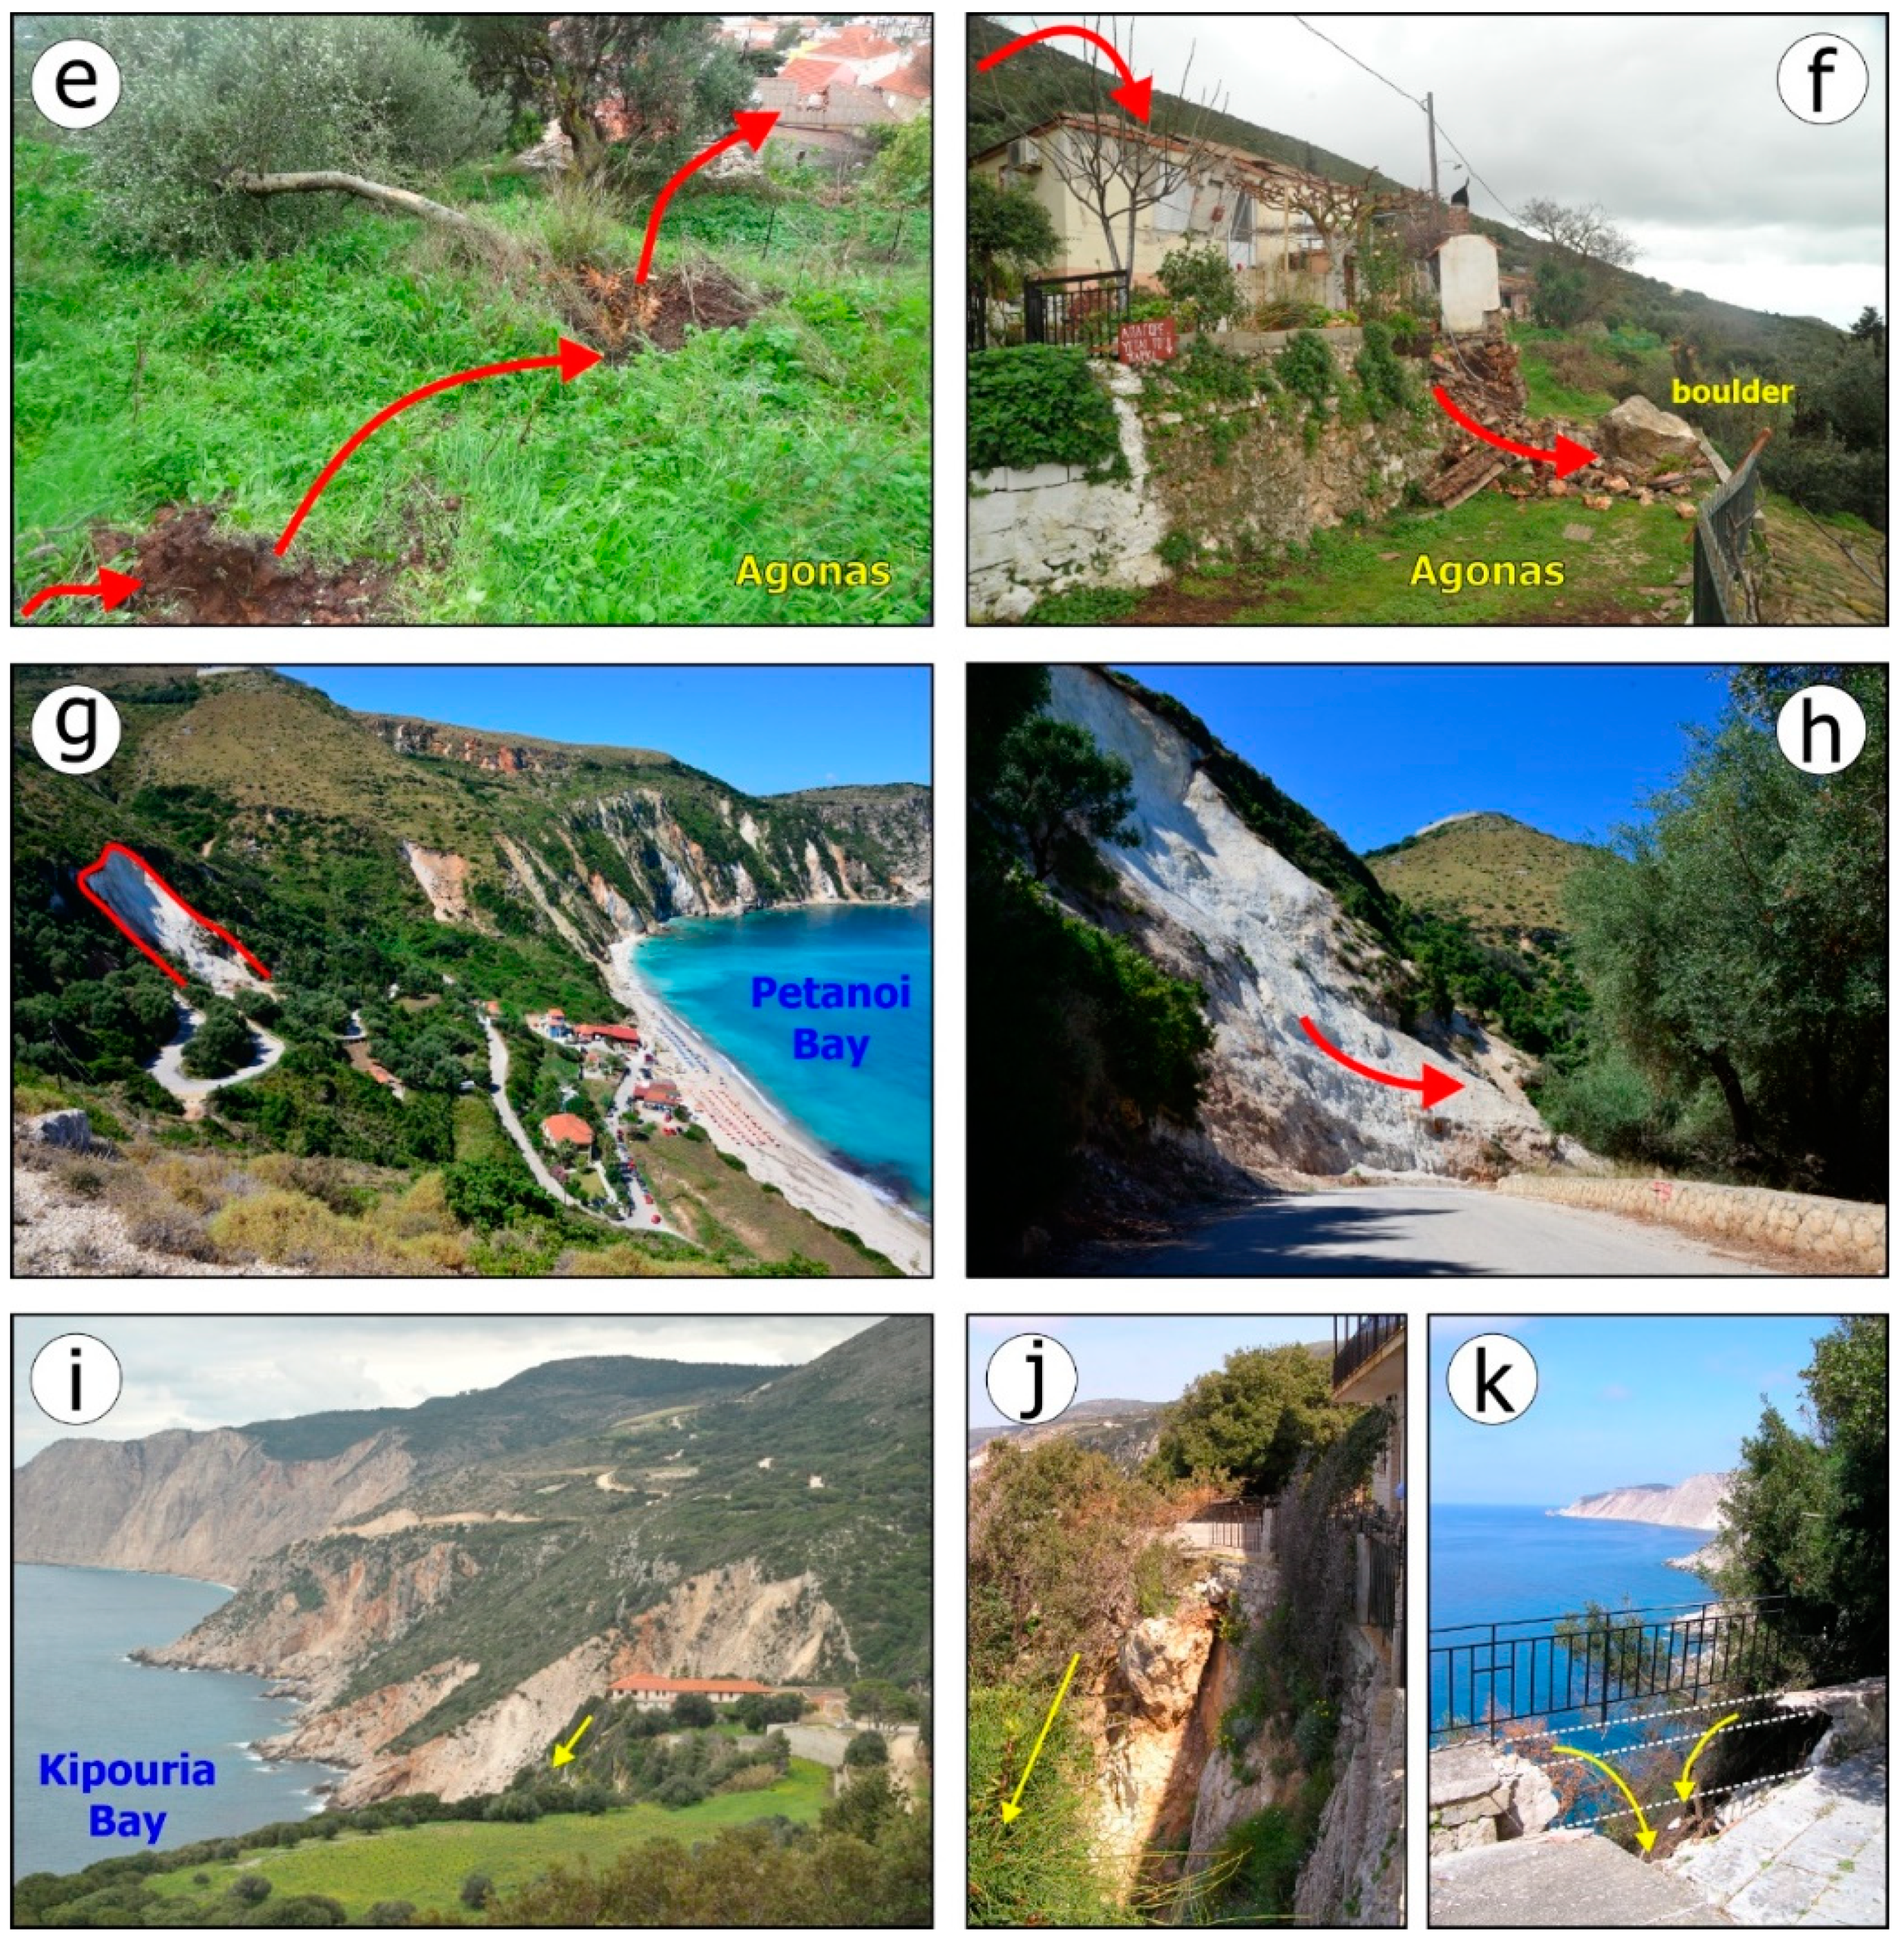
- The eastern margins of Thinia valley, where the Kontogourata–Agonas oblique slip reverse fault occurs, is also among the most earthquake-triggered landslide-susceptible zones in Cephalonia. This fault places the northwestern part of Aenos Mt on the northeastern part of Paliki peninsula and is responsible for the rugged morphology, dense discontinuities and the decreased cohesion in the area. Along this susceptible zone, landslides were induced by the 1953 and 2014 earthquakes.
- The high steep mountain slopes in the western, eastern and southern parts of Aenos Mt fault block are characterized by high to critically high susceptibility, strongly related to the eponymous fault zone, which bounds the mountain to its south and west. As a result of the presence and activity of the zone, extensive outcrops of scree and talus cones as well as fragmented limestone of the Paxi unit participated in the geological setting and led to the generation of landslides during the 1636, 1912 and August 1953 earthquakes. In particular, the slope failures of 1953 had considerable impact on settlements in the area, which were founded on the above-mentioned formations, resulting in their partial destruction and human losses.
- Another zone susceptible to ETL is the western coastal part of the Paliki peninsula. This coastal zone has been formed and evolves under the influence of the offshore Cephalonia strike-slip fault and many smaller onshore faults. Their combined action results in the creation of extensive fault scarps and steep slopes, the majority of which are almost vertical and composed by highly fractured, brecciated and almost powdered carbonate formations.
- An important contribution to the susceptibility of Cephalonia to landslides from earthquakes is also made by certain large inactive structures and in particular the thrust of the Ionian unit over the Paxi unit. However, the formations occurring at the front of the thrust appear particularly deformed, a fact that increases the susceptibility of both the overlying Ionian unit and the underlying Paxi unit to failure. Characteristic of this zone is the occurrence of landslides in the wider area of Sami during the 1953 earthquake sequence, with impact on adjacent settlements and parts of the road network.
- The southern part of the Paliki peninsula is locally characterized by high susceptibility, mainly along slopes, which are made up of not very compact mineral deposits. Typical cases of landslides have occurred along slopes in the southern and eastern coastal areas near the town of Lixouri.
6. Conclusions
Author Contributions
Funding
Institutional Review Board Statement
Informed Consent Statement
Data Availability Statement
Conflicts of Interest
References
- Michetti, A.M.; Esposito, E.; Guerrieri, L.; Porfido, S.; Serva, L.; Tatevossian, R.; Vittori, E.; Audemard, F.; Azuma, T.; Clague, J.; et al. Environmental Seismic Intensity Scale 2007—ESI 2007; Memorie Descrittive Della Carta Geologica d’Italia; Guerrieri, L., Vittori, E., Eds.; Agenzia per la Protezione dell’Ambiente e per i Servizi Tecnici (APAT): Roma, Italy, 2007; pp. 1–41. [Google Scholar]
- Marano, K.D.; Wald, D.J.; Allen, T.I. Global earthquake casualties due to secondary effects: A quantitative analysis for improving rapid loss analyses. Nat. Hazards 2010, 52, 319–328. [Google Scholar] [CrossRef]
- Petley, D. Global patterns of loss of life from landslides. Geology 2012, 40, 927–930. [Google Scholar] [CrossRef]
- Kennedy, I.T.R.; Petley, D.N.; Williams, R.; Murray, V. A Systematic Review of the Health Impacts of Mass Earth Movements (Landslides). PLoS Curr. 2015, 30, 7. [Google Scholar] [CrossRef] [PubMed]
- Nowicki Jessee, M.A.; Hamburger, M.W.; Allstadt, K.; Wald, D.J.; Robeson, S.M.; Tanyas, H.; Hearne, M.; Thompson, E.M. A global empirical model for near-real-time assessment of seismically induced landslides. J. Geophys. Res. Earth Surf. 2018, 123, 1835–1859. [Google Scholar] [CrossRef] [Green Version]
- Bird, J.F.; Bommer, J.J. Earthquake losses due to ground failure. Eng. Geol. 2014, 75, 147–179. [Google Scholar] [CrossRef]
- Keefer, D.K. Landslides caused by earthquakes. Geol. Soc. Am. 1984, 95, 406–421. [Google Scholar] [CrossRef]
- Marui, H.; Nadim, F. Landslides and Multi-Hazards. In Landslides—Disaster Risk Reduction; Sassa, K., Canuti, P., Eds.; Springer: Berlin/Heidelberg, Germany; pp. 435–450.
- Shieh, C.-L.; Wang, C.-M.; Lai, W.-C.; Tsang, Y.-C.; Lee, S.P. The composite hazard resulted from Typhoon Morakot in Taiwan. J. JSECE 2009, 62, 61–65. [Google Scholar] [CrossRef]
- Mavroulis, S.; Lekkas, E. Revisiting the Most Destructive Earthquake Sequence in the Recent History of Greece: Environmental Effects Induced by the 9, 11 and 12 August 1953 Ionian Sea Earthquakes. Appl. Sci. 2021, 11, 8429. [Google Scholar] [CrossRef]
- Hansen, A.; Franks, C.A.M. Characterization and mapping of earthquake triggered landslides for seismic zonation. State-of-the-art Paper. In Proceedings of the Fourth International Conference on Seismic Zonation, Stanford, CA, USA, 26–29 August 1991; Volume 1, pp. 149–195. [Google Scholar]
- Keefer, D.K. Landslides generated by earthquakes: Immediate and long-term effects. In Treatise on Geomorphology; Shroder, J., Owen, L.A., Eds.; Academic Press: San Diego, CA, USA, 2013; Volume 5, pp. 250–266. [Google Scholar]
- Rodriguez, C.; Bommer, J.; Chandler, R. Earthquake-induced landslides: 1980–1997. Soil Dyn. Earthq. Eng. 1999, 18, 325–346. [Google Scholar] [CrossRef]
- Hancox, G.T.; Perrin, N.D.; Dellow, G.D. Earthquake-Induced Landsliding in New Zealand and Implications for MM Intensity and Seismic Hazard Assessment; Institute of Geological & Nuclear Sciences Client Report 43601 B; Lower Hutt: Wellington, New Zealand, 1997. [Google Scholar]
- Hancox, G.T.; Perrin, N.D.; Dellow, G. Recent studies of historical earthquake-induced landsliding, ground damage, and MM intensity in New Zealand. Bull. N. Z. Soc. Earthq. Eng. 2002, 35, 59–95. [Google Scholar] [CrossRef] [Green Version]
- Rosser, B.; Dellow, S.; Haubrock, S.; Glassey, P. New Zealand’s National Landslide Database. Landslides 2017, 14, 1949–1959. [Google Scholar] [CrossRef] [Green Version]
- Papadopoulos, G.A.; Plessa, A. Magnitude–distance relations for earthquake-induced landslides in Greece. Eng. Geol. 2000, 58, 377–386. [Google Scholar] [CrossRef]
- Prestininzi, A.; Romeo, R. Earthquake-induced ground failures in Italy. Eng. Geol. 2000, 58, 387–397. [Google Scholar] [CrossRef]
- Martino, S.; Prestininzi, A.; Romeo, R.W. Earthquake-induced ground failures in Italy from a reviewed database. Nat. Hazards Earth Syst. Sci. 2014, 14, 799–814. [Google Scholar] [CrossRef] [Green Version]
- Rondoyanni, T.; Sakellariou, M.; Baskoutas, J.; Christodoulou, N. Evaluation of active faulting and earthquake secondary effects in Lefkada Island, Ionian Sea, Greece: An overview. Nat. Hazards 2012, 61, 843–860. [Google Scholar] [CrossRef]
- Mavroulis, S.; Stanota, E.-S.; Lekkas, E. Evaluation of environmental seismic intensities of all known historical and recent earthquakes felt in Zakynthos Island, Greece using the Environmental Seismic Intensity (ESI 2007) scale. Quat. Int. 2019, 532, 1–22. [Google Scholar] [CrossRef]
- EAK. Greek Seismic Code; Earthquake Planning & Protection Organization: Athens, Greece, 2003; Volume 72, p. 7. [Google Scholar]
- Sakkas, G.; Kouskouna, V.; Makropoulos, K. Seismic hazard analysis in the Ionian Islands using macroseismic intensities. Hell. J. Geosci. 2010, 45, 239–247. [Google Scholar]
- Carrara, A.; Cardinali, M.; Detti, R.; Guzzetti, F.; Pasqui, V.; Reichenbach, P. GIS techniques and statistical models in evaluating landslide hazard. Earth Surf. Proc. Land. 1991, 16, 427–445. [Google Scholar] [CrossRef]
- Renz, C. Die Vorneogene Stratigraphie der Normal-Sedimentaren Formationen Griechenlands; Institute for Geology and Subsurface Research: Athens, Greece, 1955; p. 637. [Google Scholar]
- Aubouin, J. Contribution a l’ étude géologique de la Grèce septentrionale, les confins de l’ Epire et de la Thessalie. Ann. Géol. Pays Hellén. 1959, 10, 1–525. [Google Scholar]
- Aubouin, J.; Dercourt, J. Zone preapulienne, zone ionienne et zone du Gavrovo en Peloponncse occidentale. Bull. Soc. Géol. Fr. 1962, 4, 785–794. [Google Scholar] [CrossRef]
- Georgiadou-Dikaioulia, E. The Neogene of Kephallinia. Ph.D. Thesis, University of Athens, Athens, Greece, 1967. [Google Scholar]
- BP Co. The Geological Results of Petroleum Exploration in Western Greece; Institute of Geology and Subsurface Research: Athens, Greece, 1971. [Google Scholar]
- BP Co.; University of Munich; Migiros, G. Geological Map of Greece, “Cephalonia Island (Northern and Southern Part)”, 1:50,000 Scale; Institute of Geology and Mineral Exploration: Athens, Greece, 1985. [Google Scholar]
- Underhill, J.R. Triassic evaporites and Plio-Quaternary diapirism in western Greece. J. Geol. Soc. 1988, 145, 269–282. [Google Scholar] [CrossRef]
- Lekkas, E. “Cephalonia—Ithaki” Sheet; Scale 1:100,000, Neotectonic Map of Greece; National and Kapodistrian University of Athens: Athens, Greece, 1996. [Google Scholar]
- Lekkas, E.; Danamos, G.; Mavrikas, G. Geological Structure and Evolution of Kefallonia and Ithaki Islands. Bull. Geol. Soc. Greece 2001, 34, 11–17. [Google Scholar] [CrossRef]
- Sorel, D. Etude Néotectonique des Î;les Ioniennes de Céphalonie et de Zante et de l’ Elide Occidentale (Gréce). Ph.D. Thesis, Orsay, Université Paris Sud, Paris, France, 1976; p. 200. [Google Scholar]
- Lagios, E.; Sakkas, V.; Papadimitriou, P.; Damiata, B.N.; Parcharidis, I.; Chousianitis, K.; Vassilopoulou, S. Crustal deformation in the Central Ionian Islands (Greece): Results from DGPS and DInSAR analyses (1995–2006). Tectonophysics 2007, 444, 119–145. [Google Scholar] [CrossRef]
- Hollenstein, C.H.; Müller, M.D.; Geiger, A.; Kahle, H.-G. Crustal motion and deformation in Greece from a decade of GPS measurements 1993–2003. Tectonophysics 2008, 449, 17–40. [Google Scholar] [CrossRef]
- Scordilis, E.M.; Karakaisis, G.F.; Karacostas, B.G.; Panagiotopoulos, D.G.; Comninakis, P.E.; Papazachos, B.C. Evidence for transform faulting in the Ionian sea: The Cephalonia island earthquake sequence of 1983. Pure Appl. Geophys. PAGEOPH 1985, 123, 388–397. [Google Scholar] [CrossRef]
- Louvari, E.; Kiratzi, A.; Papazachos, B. The Cephalonia Transform Fault and its extension to western Lefkada Island (Greece). Tectonophysics 1999, 308, 223–236. [Google Scholar] [CrossRef]
- Sachpazi, M.; Hirn, A.; Clément, C.; Haslinger, F.; Laigle, M.; Kissling, E.; Charvis, P.; Hello, Y.; Lépine, J.-C.; Sapin, M.; et al. Western Hellenic subduction and Cephalonia Transform: Local earthquakes and plate transport and strain. Tectonophysics 2000, 319, 301–319. [Google Scholar] [CrossRef]
- Makropoulos, K.; Kaviris, G.; Kouskouna, V. An updated and extended earthquake catalogue for Greece and adjacent areas since 1900. Nat. Hazards Earth Syst. Sci. 2012, 12, 1425–1430. [Google Scholar] [CrossRef] [Green Version]
- Papazachos, B.; Papazachou, K. The Earthquakes of Greece; Ziti Publications: Thessaloniki, Greece, 2003; p. 286. [Google Scholar]
- Ambraseys, N. Earthquakes in the Mediterranean and Middle East, a Multidisciplinary Study of Seismicity up to 1900; Cambridge University Press: Cambridge, UK, 2009; p. 970. [Google Scholar] [CrossRef]
- Papadimitriou, E.E. Mode of Strong Earthquake Recurrence in the Central Ionian Islands (Greece): Possible Triggering due to Coulomb Stress Changes Generated by the Occurrence of Previous Strong Shocks. Bull. Seism. Soc. Am. 2002, 92, 3293–3308. [Google Scholar] [CrossRef]
- Bonatis, P.; Akinci, A.; Karakostas, V.; Papadimitriou, E.; Kaviris, G. Near-fault broadband ground motion simulation applications at the Central Ionian Islands, Greece. Pure Appl. Geophys. 2021, 20, 10. [Google Scholar] [CrossRef]
- Koukis, G.; Ziourkas, C. Slope instability phenomena in Greece: A statistical analysis. Bull. Int. Assoc. Eng. Geol. 1991, 43, 47–60. [Google Scholar] [CrossRef]
- Koukis, G.; Tsiambaos, G.; Sabatakakis, N. Slope movements in Greek territory: A statistical approach. In Proceedings of the 7th International Congress of IAEG, Lisboa, Portugal, 5–9 September 1994; Oliveira, R., Rodrigues, L.F., Coelho, A.G., Cunha, A.P., Eds.; A. A. Balkema: Rotterdam, The Netherlands, 1994; pp. 4621–4628. [Google Scholar]
- Koukis, G.; Tsiambaos, G.; Sabatakakis, N. Landslides movements in Greece: Engineering geological characteristics and environmental consequences. In Proceedings of the International Symposium of Engineering Geology and Environment, Athens, Greece, 23–27 June 1997; A. A. Balkema: Rotterdam, The Netherlands, 1997; Volume 1, pp. 789–792. [Google Scholar]
- Koukis, G.; Sabatakakis, N.; Nikolau, N.; Loupasakis, C. Landslide Hazard Zonation in Greece. In Landslides; Sassa, K., Fukuoka, H., Wang, F., Wang, G., Eds.; Springer: Berlin/Heidelberg, Germany, 2005. [Google Scholar] [CrossRef]
- Sabatakakis, N.; Koukis, G.; Vassiliades, E.; Lainas, S. Landslide susceptibility zonation in Greece. Nat. Hazards 2013, 65, 523–543. [Google Scholar] [CrossRef]
- Koukis, G.; Andronopoulos, V.; Rozos, D.; Kinigalaki, M.; Tzitziras, A.; Pogiatzi, E.; Garivaldi, A. Geotechnical Map of Greece, Scale 1:500,000; Institute of Geology and Mineral Exploration: Athens, Greece, 1993. [Google Scholar]
- Centre for Research on the Epidemiology of Disasters (CRED). EM-DAT—The International Disaster Database. Available online: https://public.emdat.be/ (accessed on 15 November 2021).
- Guzzetti, F.; Mondini, A.C.; Cardinali, M.; Fiorucci, F.; Santangelo, M.; Chang, K.T. Landslide inventory maps: New tools for an old problem. Earth-Sci. Rev. 2012, 112, 42–66. [Google Scholar] [CrossRef] [Green Version]
- Reichenbach, P.; Rossi, M.; Malamud, B.D.; Mihir, M.; Guzzetti, F. A review of statistically-based landslide susceptibility models. Earth-Sci. Rev. 2018, 180, 60–91. [Google Scholar] [CrossRef]
- Stucchi, M.; Rovida, A.; Gomez Capera, A.A.; Alexandre, P.; Camelbeeck, T.; Demircioglu, M.B.; Gasperini, P.; Kouskouna, V.; Musson, R.M.W.; Radulian, M.; et al. The SHARE European earthquake catalogue (SHEEC) 1000–1899. J. Seismol. 2013, 17, 523–544. [Google Scholar] [CrossRef] [Green Version]
- Institute of Geology and Underground Research (IGUR). The Devastating Earthquakes of the Ionian Islands in August 1953: Proposals for the Reconstruction of Cities, Towns and Villages of the Earthquake-Affected Islands; Monograph; Institute of Geology and Underground Research: Athens, Greece, 1954; p. 76. [Google Scholar]
- The Press Museum of the Peloponnese—Epirus—Islands Daily Newspaper Editors Association. Available online: http://www.mouseiotipou.gr/arxeion-xml/pages/esiepi/internet/intro (accessed on 10 January 2020).
- The Digital Historical Archive of the Lambrakis Press Group. Available online: http://premiumarchives.alteregomedia.org/Login.aspx (accessed on 20 January 2020).
- The Digital Library of Newspapers and Magazines of the National Library of Greece. Available online: http://efimeris.nlg.gr/ns/main.html (accessed on 5 February 2020).
- The Digital Library of the Greek Parliament. Available online: https://library.parliament.gr/Portals/6/pdf/digitalmicrofilms.pdf (accessed on 10 February 2020).
- Pentogalou, V.G. The destructive earthquake of 1867 in Paliki and its similarities with the earthquakes of January—February of 2014. I Kefalonitiki Prood. 2014, 10, 11–14. [Google Scholar]
- Petratos, P. The earthquakes of 1953—Argostoli Prison. The forgotten offer of political prisoners. Kefalonitiki Prood. 2013, 8, 10–14. [Google Scholar]
- Lekkas, E.L.; Mavroulis, S.D. Earthquake environmental effects and ESI 2007 seismic intensities of the early 2014 Cephalonia (Ionian Sea, Western Greece) earthquakes (January 26 and February 3, Mw 6.0). Nat. Hazards 2015, 78, 1517–1544. [Google Scholar] [CrossRef]
- Lekkas, E.L.; Mavroulis, S.D. Fault zones ruptured during the early 2014 Cephalonia Island (Ionian Sea, Western Greece) earthquakes (January 26 and February 3, Mw 6.0) based on the associated co-seismic surface ruptures. J. Seismol. 2016, 20, 63–78. [Google Scholar] [CrossRef]
- Eleftheriou, A.; Mouyiaris, N. Macroseismic Reconnaissance in the Area of Cephalonia-Zakynthos (Earthquakes 17 & 19-1-83); Monograph; Institute of Geological and Mineral Research: Athens, Greece, 1983. [Google Scholar]
- Sakkas, V.; Kapetanidis, V.; Kaviris, G.; Spingos, I.; Mavroulis, S.; Diakakis, M.; Alexopoulos, J.D.; Kazantzidou-Firtinidou, D.; Kassaras, I.; Dilalos, S.; et al. Seismological and Ground Deformation Study of the Ionian Islands (w. Greece) during 2014–2018, a Period of Intense Seismic Activity. Appl. Sci. 2022, 12, 2331. [Google Scholar] [CrossRef]
- Mavroulis, S.; Alexoudi, V.; Grambas, A.; Lekkas, E.; Carydis, P. The January-February 2014 Cephalonia (Ionian Sea, western Greece) earthquake sequence: Damage pattern on buildings. In Proceedings of the 16th World Conference of Earthquake Engineering, Santiago, Chile, 9–13 January 2017; WCEE Online Proceedings; Paper No 414. National Information Centre of Earthquake Engineering, IIT Kanpur: Kanpur, India, 2017. [Google Scholar]
- Schmidt, J. Study about the Kefalonia Earthquake of 23 January 1867; Ethniko Typogr.: Athens, Greece, 1867; 30p. [Google Scholar]
- Partsch, J. Kephallenia und Ithaka; Eine Geographische Monographie: Gotha, Germany, 1890; p. 108. [Google Scholar]
- Tsitselis, H.A. Kefalliniaka Symmikta; Argostoli: Cephalonia, Greece, 1904. [Google Scholar]
- Kouskouna, V.; Makropoulos, K.C.; Tsiknakis, K. Contribution of historical information to a realistic seismicity and hazard assessment of an area. The Ionian Islands earthquakes of 1767 and 1769: Historical investigation. In Materials of CEC Project “Review of Historical Seismicity in Europe”; Albini, P., Moroni, A., Eds.; CNR, Istituto di Ricerca sul Rischio Sismico: Milano, Italy, 1992; Volume 1, pp. 195–206. [Google Scholar]
- Makropoulos, K.C.; Kouskouna, V. The Ionian Islands earthquakes of 1767 and 1769: Seismological aspects. Contribution of historical information to a realistic seismicity and hazard assessment of an area. In Materials of CEC Project “Review of Historical Seismicity in Europe”; Albini, P., Moroni, A., Eds.; CNR, Istituto di Ricerca sul Rischio Sismico: Milano, Italy, 1994; Volume 2, pp. 27–36. [Google Scholar]
- Scrofani, X. Voyage en Gréce Fait en 1794 et 1795; Treuttel et Würtz: Paris-Strasburg, France, 1801; Volume 3. [Google Scholar]
- Vergotis, P. The 23 January 1867 Earthquake; Typography of Kefallinia: Argostoli, Greece, 1867; 15p. [Google Scholar]
- Katramis, N. Philological Analects of Zakinthos; Avgi Publications: Zakynthos, Greece, 1880. [Google Scholar]
- Albini, P.; Ambraseys, N.N.; Monachesi, G. Material for the Investigation of the seismicity of the Ionian Islands between 1704 and 1766. In Historical Investigation of European Earthquakes; Albini, P., Moroni, A., Eds.; CNR, Istituto di Ricerca sul Rischio Sismico: Milano, Italy, 1994; Volume 2, pp. 11–26. [Google Scholar]
- Papathanassiou, G.; Valkaniotis, S.; Ganas, A. Evaluation of the macroseismic intensities triggered by the January/February 2014 Cephalonia, (Greece) earthquakes based on ESI-07 scale and their comparison to 1867 historical event. Quat. Int. 2017, 451, 234–247. [Google Scholar] [CrossRef]
- Papadimitriou, P.; Voulgaris, N.; Kouskouna, V.; Kassaras, I.; Kaviris, G.; Pavlou, K.; Karakonstantis, A.; Bozionelos, G.; Kapetanidis, V. The Kefallinia Island earthquake sequence January–February 2014. In Proceedings of the Second European Conference on Earthquake Engineering and Seismology (2ECEES), Istanbul, Turkey, 24–29 August 2014. [Google Scholar]
- Kapetanidis, V. Spatiotemporal Patterns of Microseismicity for the Identification of Active Fault Structures using Seismic Waveform Cross-Correlation and Double-Difference Relocation. Ph.D. Thesis, Department of Geophysics-Geothermics, Faculty of Geology and Geoenvironment, National and Kapodistrian University of Athens, Athens, Greece, 2017. [Google Scholar]
- Taylor, D.W. Fundamentals of Soil Mechanics; John Wiley & Son: New York, NY, USA, 1948; p. 700. [Google Scholar]
- Wu, W.; Sidle, R.C. A distributed slope stability model for steep forested basins. Water Resour. Res. 1995, 31, 2097–2110. [Google Scholar] [CrossRef]
- Bliona, M. Development of a Database of Landslides in Greece. Master’s Thesis, Engineering Geology Lab, Faculty of Applied Geology and Geophysics, Department of Geology, University of Patras, Patras, Greece, 2008. [Google Scholar]
- Fabbri, A.G.; Chung, C.-J.F.; Cendrero, A.; Remondo, J. Is prediction of future landslides possible with a GIS? Nat. Hazards 2003, 30, 487–503. [Google Scholar] [CrossRef]
- Budimir, M.E.A.; Atkinson, P.M.; Lewis, H.G. A systematic review of landslide probability mapping using logistic regression. Landslides 2015, 12, 419–436. [Google Scholar] [CrossRef] [Green Version]
- Qiu, C.; Su, L.; Zou, Q.; Geng, X. A hybrid machine-learning model to map glacier-related debris flow susceptibility along Gyirong Zangbo watershed under the changing climate. Sci. Total Environ. 2022, 818, 151752. [Google Scholar] [CrossRef] [PubMed]
- Marchesini, I.; Ardizzone, F.; Alvioli, M.; Rossi, M.; Guzzetti, F. Non-susceptible landslide areas in Italy and in the Mediterranean region. Nat. Hazards Earth Syst. Sci. 2014, 14, 2215–2231. [Google Scholar] [CrossRef] [Green Version]
- Guzzetti, F.; Peruccacci, S.; Rossi, M.; Stark, C.P. Rainfall thresholds for the initiation of landslides in central and southern Europe. Meteorol. Atmos. Phys. 2007, 98, 239–267. [Google Scholar] [CrossRef]
- Guzzetti, F.; Peruccacci, S.; Rossi, M.; Stark, C.P. The rainfall intensity–duration control of shallow landslides and debris flows: An update. Landslides 2008, 5, 3–17. [Google Scholar] [CrossRef]
- Hellenic National Meteorological Service. The Climate Atlas of Greece (1971–2000): Precipitation; Hellenic National Meteorological Service (HNMS): Athens, Greece, 2021; Available online: http://climatlas.hnms.gr/ (accessed on 5 January 2022).
- Hellenic Military Geographical Service. Topographic Map “Atheras” Sheet, 1:50,000 Scale; HMGS: Athens, Greece, 1973. [Google Scholar]
- Hellenic Military Geographical Service. Topographic Map “Argostolion” Sheet, 1:50,000 Scale; HMGS: Athens, Greece, 1973. [Google Scholar]
- Hellenic Military Geographical Service. Topographic Map “Ag. Eirini” Sheet, 1:50,000 Scale; HMGS: Athens, Greece, 1973. [Google Scholar]
- Hellenic Military Geographical Service. Topographic Map “Ithaki” Sheet, 1:50,000 Scale; HMGS: Athens, Greece, 1976. [Google Scholar]
- OpenStreetMap. Available online: https://www.openstreetmap.org/ (accessed on 5 January 2022).
- Esch, T.; Taubenböck, H.; Roth, A.; Heldens, W.; Felbier, A.; Schmidt, M.; Mueller, A.; Thiel, M.; Dech, S. TanDEM-X mission-new perspectives for the inventory and monitoring of global settlement patterns. J. Appl. Remote Sens. 2012, 6, 061702. [Google Scholar] [CrossRef]
- Krieger, G.; Moreira, A.; Fiedler, H.; Hajnsek, I.; Werner, M.; Younis, M.; Zink, M. TanDEM-X: A Satellite Formation for High-Resolution SAR Interferometry. IEEE Trans. Geosci. Remote Sens. 2007, 45, 3317–3341. [Google Scholar] [CrossRef] [Green Version]
- Krieger, G.; Zink, M.; Bachmann, M.; Bräutigam, B.; Schulze, D.; Martone, M.; Rizzoli, P.; Steinbrecher, U.; Antony, W.J.; De Zan, F.; et al. TanDEM-X: A radar interferometer with two formation-flying satellites. Acta Astronaut. 2013, 89, 83–98. [Google Scholar] [CrossRef] [Green Version]
- Wessel, B.; Huber, M.; Wohlfart, C.; Marschalk, U.; Kosmann, D.; Roth, A. Accuracy assessment of the global TanDEM-X Digital Elevation Model with GPS data. ISPRS J. Photogramm. Remote Sens. 2018, 139, 171–182. [Google Scholar] [CrossRef]
- Huber, M.; Osterkamp, N.; Marschalk, U.; Tubbesing, R.; Wendleder, A.; Wessel, B.; Roth, A. Shaping the Global High-Resolution TanDEM-X Digital Elevation Model. IEEE J. Sel. Top. Appl. Earth Obs. Remote Sens. 2021, 14, 7198–7212. [Google Scholar] [CrossRef]
- Pertiwi, A.P.; Roth, A.; Schaffhauser, T.; Bhola, P.K.; Reuß, F.; Stettner, S.; Kuenzer, C.; Disse, M. Monitoring the Spring Flood in Lena Delta with Hydrodynamic Modeling Based on SAR Satellite Products. Remote Sens. 2021, 13, 4695. [Google Scholar] [CrossRef]
- Clerici, A.; Perego, S.; Tellini, C.; Vescovi, P.A. procedure for landslide susceptibility zonation by the conditional analysis method. Geomorphology 2002, 48, 349–364. [Google Scholar] [CrossRef]
- Ruff, M.; Czurda, K. Landslide susceptibility analysis with a heuristic approach in the Eastern Alps (Vorarlberg, Austria). Geomorphology 2008, 94, 314–324. [Google Scholar] [CrossRef]
- Gökceoglu, C.; Aksoy, H. Landslide susceptibility mapping of the slopes in the residual soils of the Mengen region (Turkey) by deterministic stability analyses and image processing techniques. Eng. Geol. 1996, 44, 147–161. [Google Scholar] [CrossRef]
- Saha, A.K.; Gupta, R.P.; Sarkar, I.; Arora, M.K.; Csaplovics, E. An approach for GIS based statistical landslide susceptibility zonation—with a case study in the Himalayas. Landslides 2005, 2, 61–69. [Google Scholar] [CrossRef]
- Ladas, I.; Fountoulis, I.; Mariolakos, I. Using GIS and Multicriteria decision analysis in landslide susceptibility mapping—A case study in Messinia prefecture area (SW Peloponnesus, Greece). Bull. Geol. Soc. Greece 2007, 40, 1973–1985. [Google Scholar] [CrossRef]
- Ladas, I.; Fountoulis, I.; Mariolakos, I. Large scale landslide susceptibility mapping using GIS-based weighted linear combination and multicriteria decision analysis—A case study in Northern Messinia (SW Peloponnesus, Greece). In Proceedings of the 8th Congress of the Hellenic Geographical Society, Athens, Greece, 4–7 October 2007; Hellenic Geographical Society: Athens, Greece, 2007; pp. 93–102. [Google Scholar]
- He, Y.; Beighley, R.E. GIS-based regional landslide susceptibility mapping: A case study in southern California. Earth Surf. Proc. Land. 2008, 33, 380–393. [Google Scholar] [CrossRef]
- Neuhäuser, B.; Terhorst, B. Landslide susceptibility assessment using “weights-ofevidence” applied to a study area at the Jurassic escarpment (SW-Germany). Geomorphology 2007, 86, 12–24. [Google Scholar] [CrossRef]
- Binaghi, E.; Luzi, L.; Madella, P.; Pergalani, F.; Rampini, A. Slope instability zonation: A comparison between certainty factor and fuzzy Dempster–Shafer approaches. Nat. Hazards 1998, 17, 77–97. [Google Scholar] [CrossRef]
- Süzen, M.L.; Doyuran, V. Data driven bivariate landslide susceptibility assessment using geographical information systems: A method and application to Asarsuyu catchment, Turkey. Eng. Geol. 2004, 71, 303–321. [Google Scholar] [CrossRef]
- Sakkas, G.; Misailidis, I.; Sakellariou, N.; Kouskouna, V.; Kaviris, G. Modeling landslide susceptibility in Greece: A weighted linear combination approach using analytic hierarchical process, validated with spatial and statistical analysis. Nat. Hazards 2016, 84, 1873–1904. [Google Scholar] [CrossRef]
- Karpouza, M.; Chousianitis, K.; Bathrellos, G.D.; Skilodimou, H.D.; Kaviris, G.; Antonarakou, A. Hazard zonation mapping of earthquake-induced secondary effects using spatial multi-criteria analysis. Nat. Hazards 2021, 109, 637–669. [Google Scholar] [CrossRef]
- Li, F.; Torgoev, I.; Zaredinov, D.; Li, M.; Talipov, B.; Belousova, A.; Kunze, C.; Schneider, P. Influence of Earthquakes on Landslide Susceptibility in a Seismic Prone Catchment in Central Asia. Appl. Sci. 2021, 11, 3768. [Google Scholar] [CrossRef]
- Newmark, N.M. Effects of earthquake on dams and embankments. Geotechnique 1965, 15, 139–160. [Google Scholar] [CrossRef] [Green Version]
- Ambraseys, N.N.; Menu, J.M. Earthquake-induced ground displacements. Earthq. Eng. Struct. Dyn. 1988, 16, 985–1006. [Google Scholar] [CrossRef]
- Ambraseys, N.; Srbulov, M. Attenuation of earthquake-induced ground displacements. Earthq. Eng. Struct. Dyn. 1994, 23, 467–487. [Google Scholar] [CrossRef]
- Cornell, C.A. Engineering Seismic Risk Analysis. Bull. Seismol. Soc. Am. 1968, 58, 1583–1606. [Google Scholar] [CrossRef]
- McGuire, R.K. FORTRAN Computer Program for Seismic Risk Analysis. Open-File Report 76-67; U.S. Department of the Interior, U.S. Geological Survey: Reston, VA, USA, 1976. [Google Scholar] [CrossRef]
- Giardini, D.; Wössner, J.; Danciu, L. Mapping Europe’s Seismic Hazard. EOS 2014, 95, 261–262. [Google Scholar] [CrossRef] [Green Version]
- Woessner, J.; Danciu, L.; Giardini, D.; Crowley, H.; Cotton, F.; Grünthal, G.; Valensise, G.; Arvidsson, R.; Basili, R.; Demircioglu, M.B.; et al. The 2013 European Seismic Hazard Model: Key components and results. Bull. Earthq. Eng. 2015, 13, 3553–3596. [Google Scholar] [CrossRef] [Green Version]
- Cornell, C.A.; Vanmarke, E.H. The major influences on seismic risk. In Proceedings of the 3rd World Conference on Earthquake Engineering, Santiago, Chile, 13–18 January 1969. [Google Scholar]
- Sornette, D.; Sornette, A. General theory of the modified Gutenberg-Richter law for large seismic moments. Bull. Seismol. Soc. Am. 1999, 89, 1121–1130. [Google Scholar] [CrossRef]
- Danciu, L.; Tselentis, G.-A. Engineering Ground-Motion Parameters Attenuation Relationships for Greece. Bull. Seismol. Soc. Am. 2007, 97, 162–183. [Google Scholar] [CrossRef]
- Tselentis, G.-A.; Danciu, L. Probabilistic seismic hazard assessment in Greece-Part 1: Engineering ground motion parameters. Nat. Hazards Earth Syst. Sci. 2010, 10, 25–39. [Google Scholar] [CrossRef]
- Pavlou, K.; Kaviris, G.; Kouskouna, V.; Sakkas, G.; Zymvragakis, A.; Sakkas, V.; Drakatos, G. Minor seismic hazard changes in the broader area of Pournari artificial lake after the first filling (W. Greece). Results Geophys. Sci. 2021, 7, 100025. [Google Scholar] [CrossRef]
- Kaviris, G.; Zymvragakis, A.; Bonatis, P.; Sakkas, G.; Kouskouna, V.; Voulgaris, N. Probabilistic seismic hazard assessment for the broader Messinia (SW Greece) region. Pure Appl. Geophys. 2022, 179, 551–567. [Google Scholar] [CrossRef]
- Ordaz, M.; Salgado-Gálvez, M.A.; Giraldo, S. R-CRISIS: 35 years of continuous developments and improvements for probabilistic seismic hazard analysis. Bull. Earthq. Eng. 2021, 19, 2797–2816. [Google Scholar] [CrossRef]
- Lee, C.-T.; Huang, C.-C.; Lee, J.-F.; Pan, K.-L.; Lin, M.-L.; Dong, J.-J. Statistical approach to storm event-induced landslides susceptibility. Nat. Hazards Earth Syst. Sci. 2008, 8, 941–960. [Google Scholar] [CrossRef] [Green Version]
- Mondini, A.C.; Guzzetti, F.; Reichenbach, P.; Rossi, M.; Cardinali, M.; Ardizzone, F. Semi-automatic recognition and mapping of rainfall induced shallow landslides using satellite optical images. Remote Sens. Environ. 2011, 115, 1743–1757. [Google Scholar] [CrossRef]
- Pontius Jr, R.G.; Schneider, L. Land-cover change model validation by a ROC method for the Ipswich watershed, Massachusetts, USA. Agric. Ecosyst. Environ. 2001, 85, 239–248. [Google Scholar] [CrossRef]
- Glade, T. Landslide occurrence as a response to land use change: A review of evidence from New Zealand. Catena 2003, 51, 297–314. [Google Scholar] [CrossRef] [Green Version]
- Pontius, R.G., Jr.; Hao, C. GEOMOD Modeling; Clark University: Worcester, MA, USA, 2006; Available online: https://www2.clarku.edu/~rpontius/pontius_chen_2006_idrisi.pdf (accessed on 10 January 2022).
- Reichenbach, P.; Busca, C.; Mondini, A.C.; Rossi, M. The influence of land use change on landslide susceptibility zonation: The Briga catchment test site (Messina, Italy). Environ. Manag. 2014, 54, 1372–1384. [Google Scholar] [CrossRef] [PubMed] [Green Version]
- United States Geological Survey. NDVI, the Foundation for Remote Sensing Phenology. Available online: https://www.usgs.gov/special-topics/remote-sensing-phenology (accessed on 15 January 2021).
- Tucker, C.J. Red and photographic infrared linear combinations for monitoring vegetation. Remote Sens. Environ. 1979, 8, 127–150. [Google Scholar] [CrossRef] [Green Version]
- Irigaray, C.; Lamas, F.; El Hamdouni, R.; Fernández, T.; Chacón, J. The importance of the precipitation and the susceptibility of the slopes for the triggering of landslides along the roads. Nat. Hazards 2000, 21, 65–81. [Google Scholar] [CrossRef]
- Saaty, T.L. The Analytic Hierarchy Process; McGraw-Hill: New York, NY, USA, 1980. [Google Scholar]
- SpiceLogic Inc. Analytic Hierarchy Process Software (Trial Version 3.4.5). Available online: https://www.spicelogic.com/Products/ahp-software-30/ (accessed on 15 January 2022).
- ESRI. ArcGIS 10.7. Available online: https://desktop.arcgis.com/en/arcmap/10.7/get-started/setup/arcgis-desktop-quick-start-guide.htm (accessed on 15 January 2022).
- Jenks, G.F. Generalization in Statistical Mapping. Ann. Assoc. Am. Geogr. 1963, 53, 15–26. [Google Scholar] [CrossRef]
- Semlali, I.; Ouadif, L.; Bahi, L. Landslide susceptibility mapping using the analytical hierarchy process and GIS. Curr. Sci. 2019, 116, 773–779. [Google Scholar] [CrossRef]
- Boroumandi, M.; Khamehchiyan, M.; Nikoudel, M.R. Using of Analytic Hierarchy Process for Landslide Hazard Zonation in Zanjan Province, Iran. In Engineering Geology for Society and Territory—Volume 2; Lollino, G., Giordan, D., Crosta, G.B., Corominas, J., Azzam, R., Wasowski, J., Sciarra, N., Eds.; Springer International Publishing: Cham, Switzerland, 2015. [Google Scholar] [CrossRef]
- Cignetti, M.; Godone, D.; Giordan, D. Shallow landslide susceptibility, Rupinaro catchment, Liguria (northwestern Italy). J. Maps 2019, 15, 333–345. [Google Scholar] [CrossRef] [Green Version]
- Gárcía-Rodriguez, M.J.; Malpica, J.A.; Benito, B.; Díaz, M. Susceptibility assessment of earthquake triggered landslides in El Salvador using logistic regression. Geomorphology 2008, 95, 172–191. [Google Scholar] [CrossRef] [Green Version]
- Ozdemir, A.; Altural, T. A comparative study of frequency ratio, weights of evidence and logistic regression methods for landslide susceptibility mapping: Sultan Mountains, SW Turkey. J. Asian Earth Sci. 2013, 64, 180–197. [Google Scholar] [CrossRef]
- Wu, X.; Niu, R.; Ren, F.; Peng, L. Landslide susceptibility mapping using rough sets and back-propagation neural networks in the Three Gorges, China. Environ. Earth Sci. 2013, 70, 1307–1318. [Google Scholar] [CrossRef]
- Chung, C.J.F.; Fabbri, A.G. Validation of spatial prediction models for landslide hazard mapping. Nat. Hazards 2003, 30, 451–472. [Google Scholar] [CrossRef]
- Fawcett, T. An introduction to ROC analysis. Pattern Recognit. Lett. 2006, 27, 861–874. [Google Scholar] [CrossRef]
- Nandi, A.; Shakoor, A. A GIS-based landslide susceptibility evaluation using bivariate and multivariate statistical analyses. Eng. Geol. 2010, 110, 11–20. [Google Scholar] [CrossRef]
- Lekkas, E.; Nastos, P.; Cartalis, C.; Diakakis, M.; Gogou, M.; Mavroulis, S.; Spyrou, N.-I.; Kotsi, E.; Vassilakis, E.; Katsetsiadou, K.-N.; et al. Impact of Medicane “IANOS” (September 2020). Newsl. Environ. Disaster Cris. Manag. Strateg. 2020, 20, 1–140. [Google Scholar] [CrossRef]
- Vassilakis, E.; Konsolaki, A.; Petrakis, S.; Kotsi, Ε.; Fillis, C.; Lozios, S.; Lekkas, E. Quantification of Mass Movements with Structure-from-Motion Techniques. The Case of Myrtos Beach in Cephalonia, after Ianos Medicane (September 2020). Bull. Geol. Soc. Greece Spec. Publ. 2021, 8, 16–20. [Google Scholar]


| Archives | Newspapers | Studied Period |
|---|---|---|
| The Press Museum of the Peloponnese—Epirus—Ionian Islands Daily Newspaper Editors Association [56] | ETHNIKOS KIRIX | 10–24 August 1953 |
| I IMERA | 11–29 August 1953 | |
| NEOLOGOS PATRON | 11–29 August 1953 | |
| PELOPONNISOS | 11–29 August 1953 | |
| The Digital Historical Archive of the Lambrakis Press Group [57] | TO VIMA | 10–25 August 1953 |
| TA NEA | 10–25 August 1953 | |
| The Digital Library of Newspapers and Magazines of the National Library of Greece [58] | ANAMORFOSIS | 4 February 1867 |
| AVGI | 4 February 1867 | |
| MERIMNA | 4 February 1867 | |
| ELEFTHERIA | 11–28 August 1953 | |
| EMPROS | 11–23 August 1953 | |
| The Digital Library of the Greek Parliament [59] | ΖΙΖAΝΙOΝ | 24 January 1912 |
| TAXYDROMOS | 12–30 August 1953 |
| Lat | Lon | Year | Month | Day | Mw | Io | Fatalities | Injured | Sources 1 |
|---|---|---|---|---|---|---|---|---|---|
| 37.928 | 20.885 | 1636 | 9 | 30 | 6.62 | IX | 520 | 1500 | [41,54] |
| 38.2 | 20.42 | 1658 | 8 | 24 | 6.7 | IX | 20 | - | [41,54] |
| 38.268 | 20.464 | 1767 | 7 | 22 | 6.65 | X | 330 | - | [41,54] |
| 38.233 | 20.424 | 1867 | 2 | 4 | 7.15 | X | 224 | - | [41,54] |
| 38.10 | 20.50 | 1912 | 1 | 24 | 6.1 | X | 8 | - | [40,54] |
| 38.24 | 20.80 | 1953 | 8 | 9 | 5.9 | - | 455 | 2412 | [40,54] |
| 38.35 | 20.74 | 1953 | 8 | 11 | 6.6 | - | [40,54] | ||
| 38.13 | 20.74 | 1953 | 8 | 12 | 7.0 | X+ | [40,54] | ||
| 38.07 | 20.25 | 1983 | 1 | 17 | 6.7 | VI | - | - | [40,54] |
| 38.2113 | 20.4425 | 2014 | 1 | 26 | 6.1 | VII | - | - | [65,66] |
| 38.2716 | 20.4198 | 2014 | 2 | 3 | 5.9 | VIII | - | - | [65,66] |
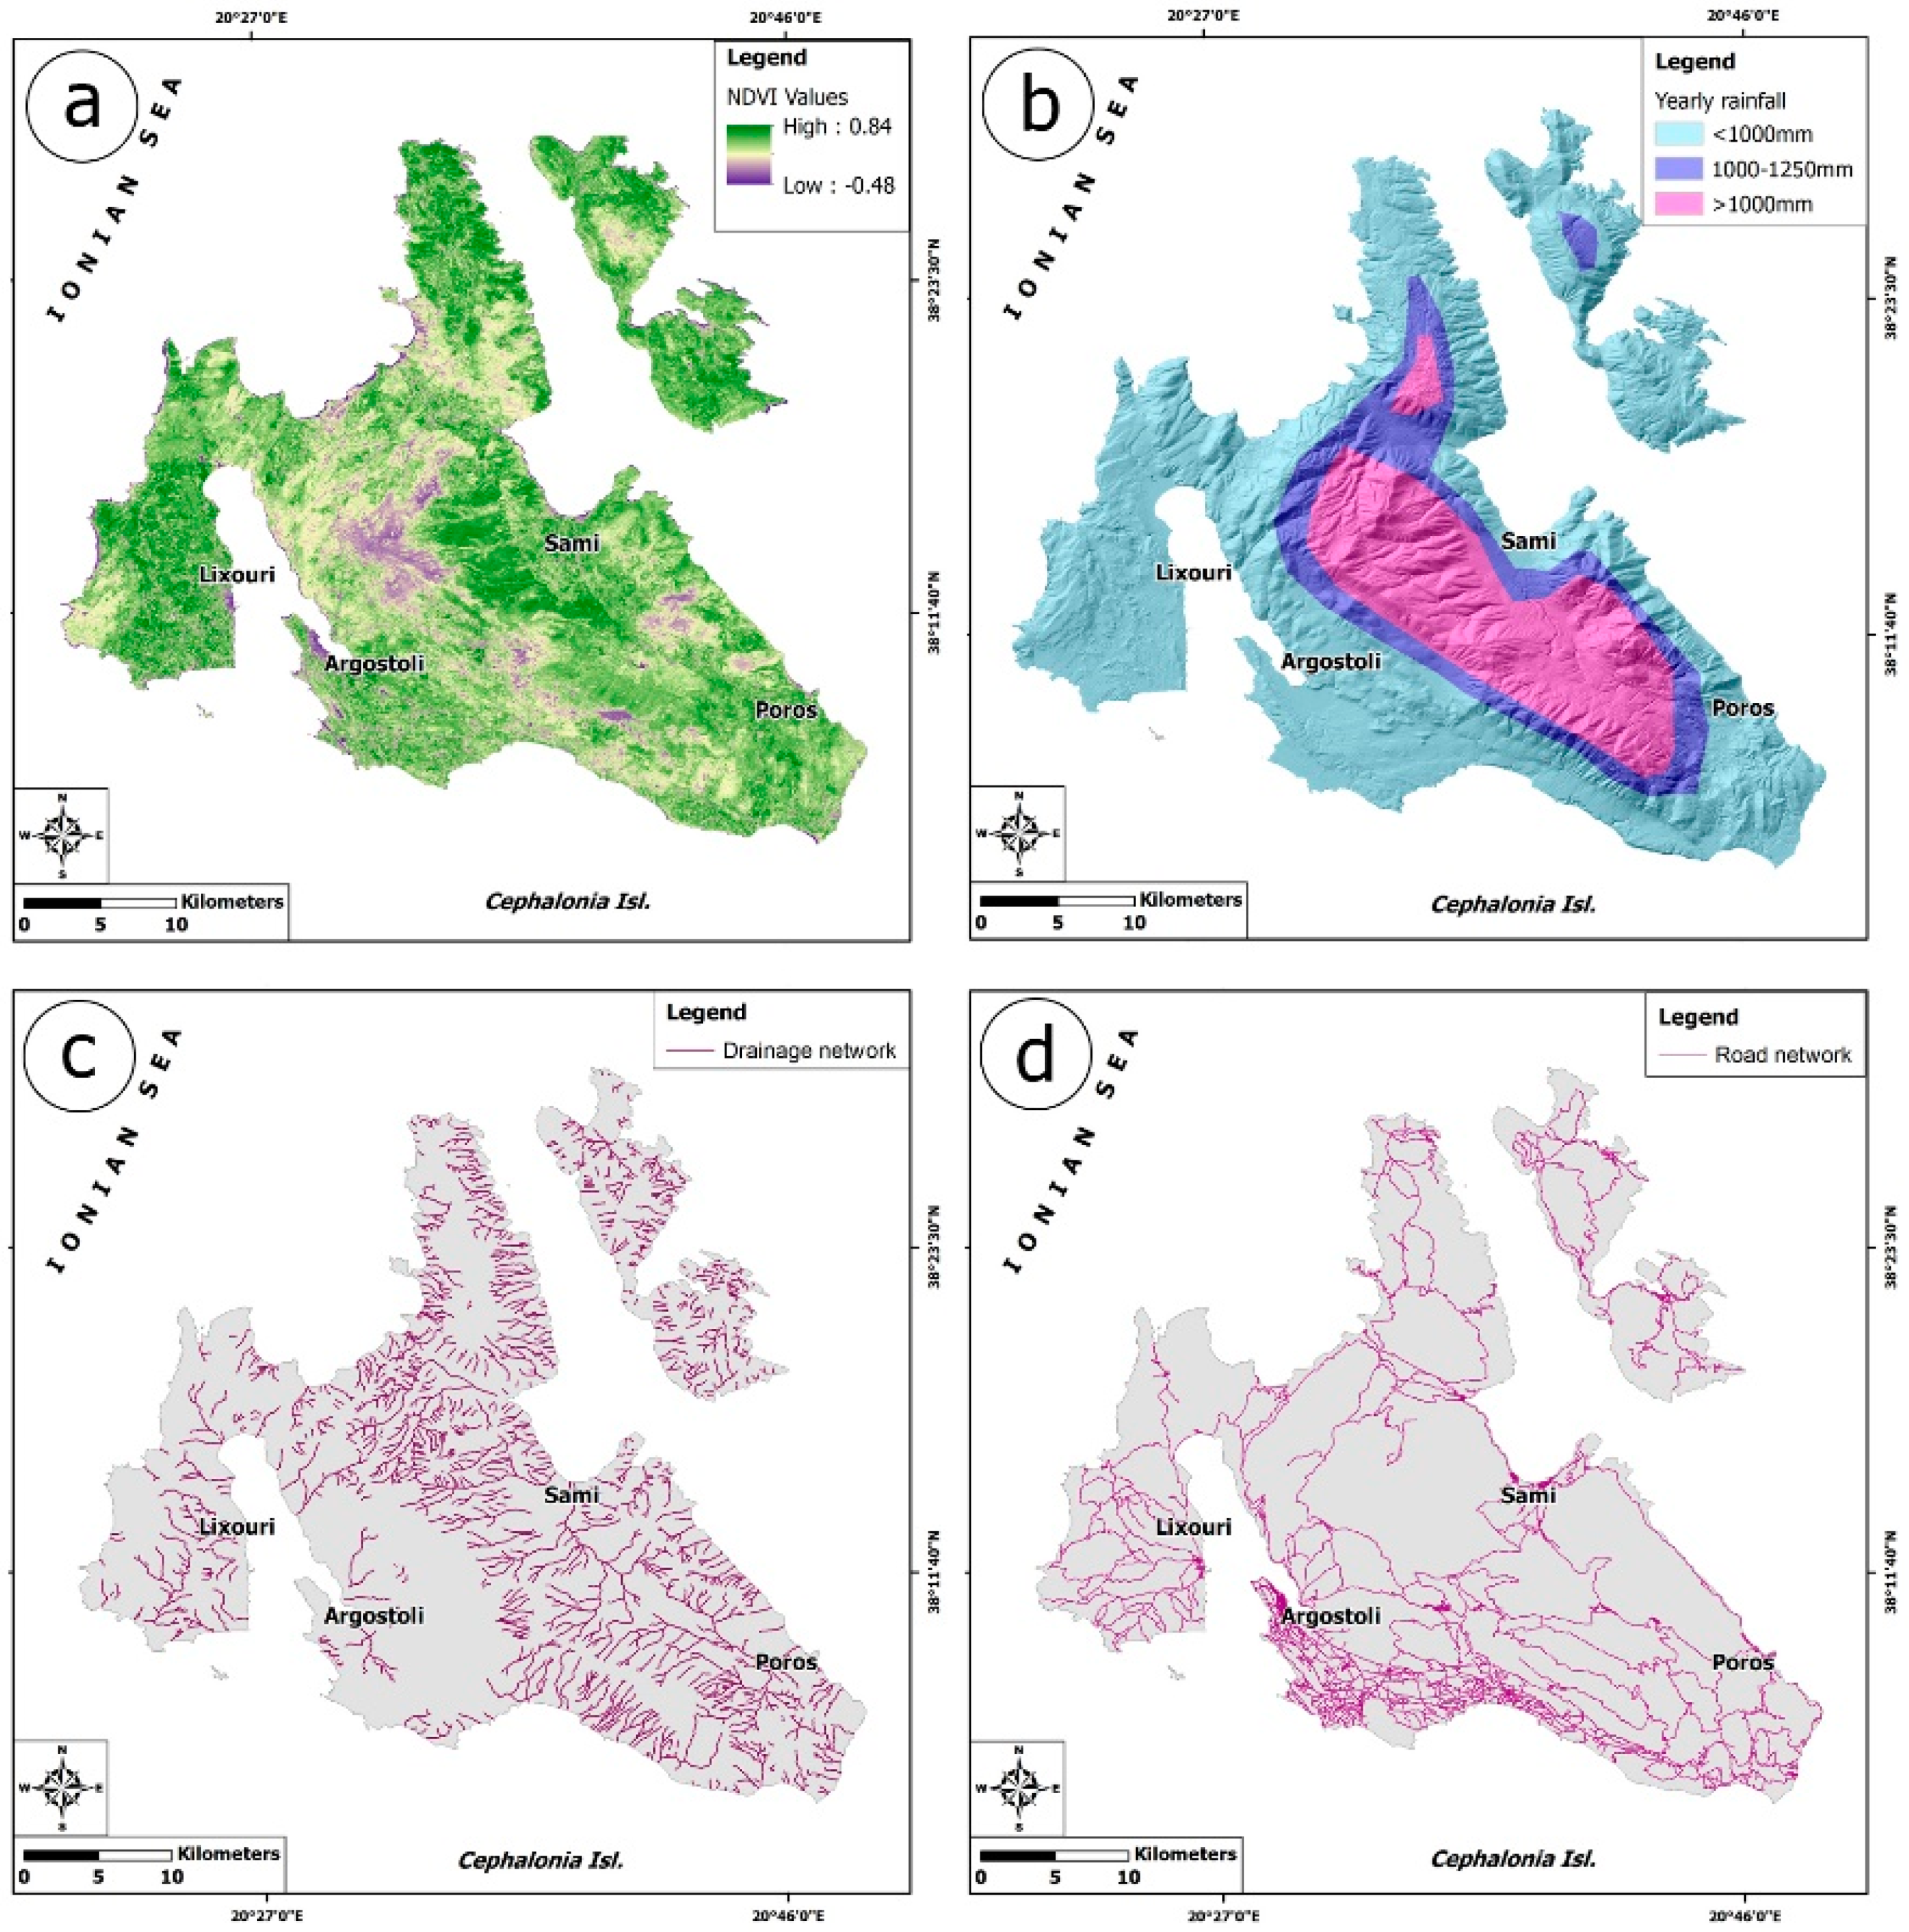
| Layer | Data Type | Data Source |
|---|---|---|
| Slope | Grid | DEM of Cephalonia resulted from the TanDEM-X digital data |
| Aspect | Grid | |
| Curvature | Grid | |
| Lithology | Polygon | Neotectonic Map of Gephalonia by Lekkas [32] |
| Tectonic Structures | Line | Neotectonic Map of Gephalonia by Lekkas [32] |
| NDVI | Grid | Sentinel (acquisition date 21.04.11) |
| PGA | Grid | Sakkas et al. [65] |
| Rainfall | Grid | The Climate Atlas of Greece by the Hellenic National Meteorological Service [88] |
| Rivers | Line | Topographic maps by the Hellenic Military Geographical Service [89,90,91,92] |
| Roads | Line | Topographic maps by the Hellenic Military Geographical Service [89,90,91,92] OpenStreetMap [93] |
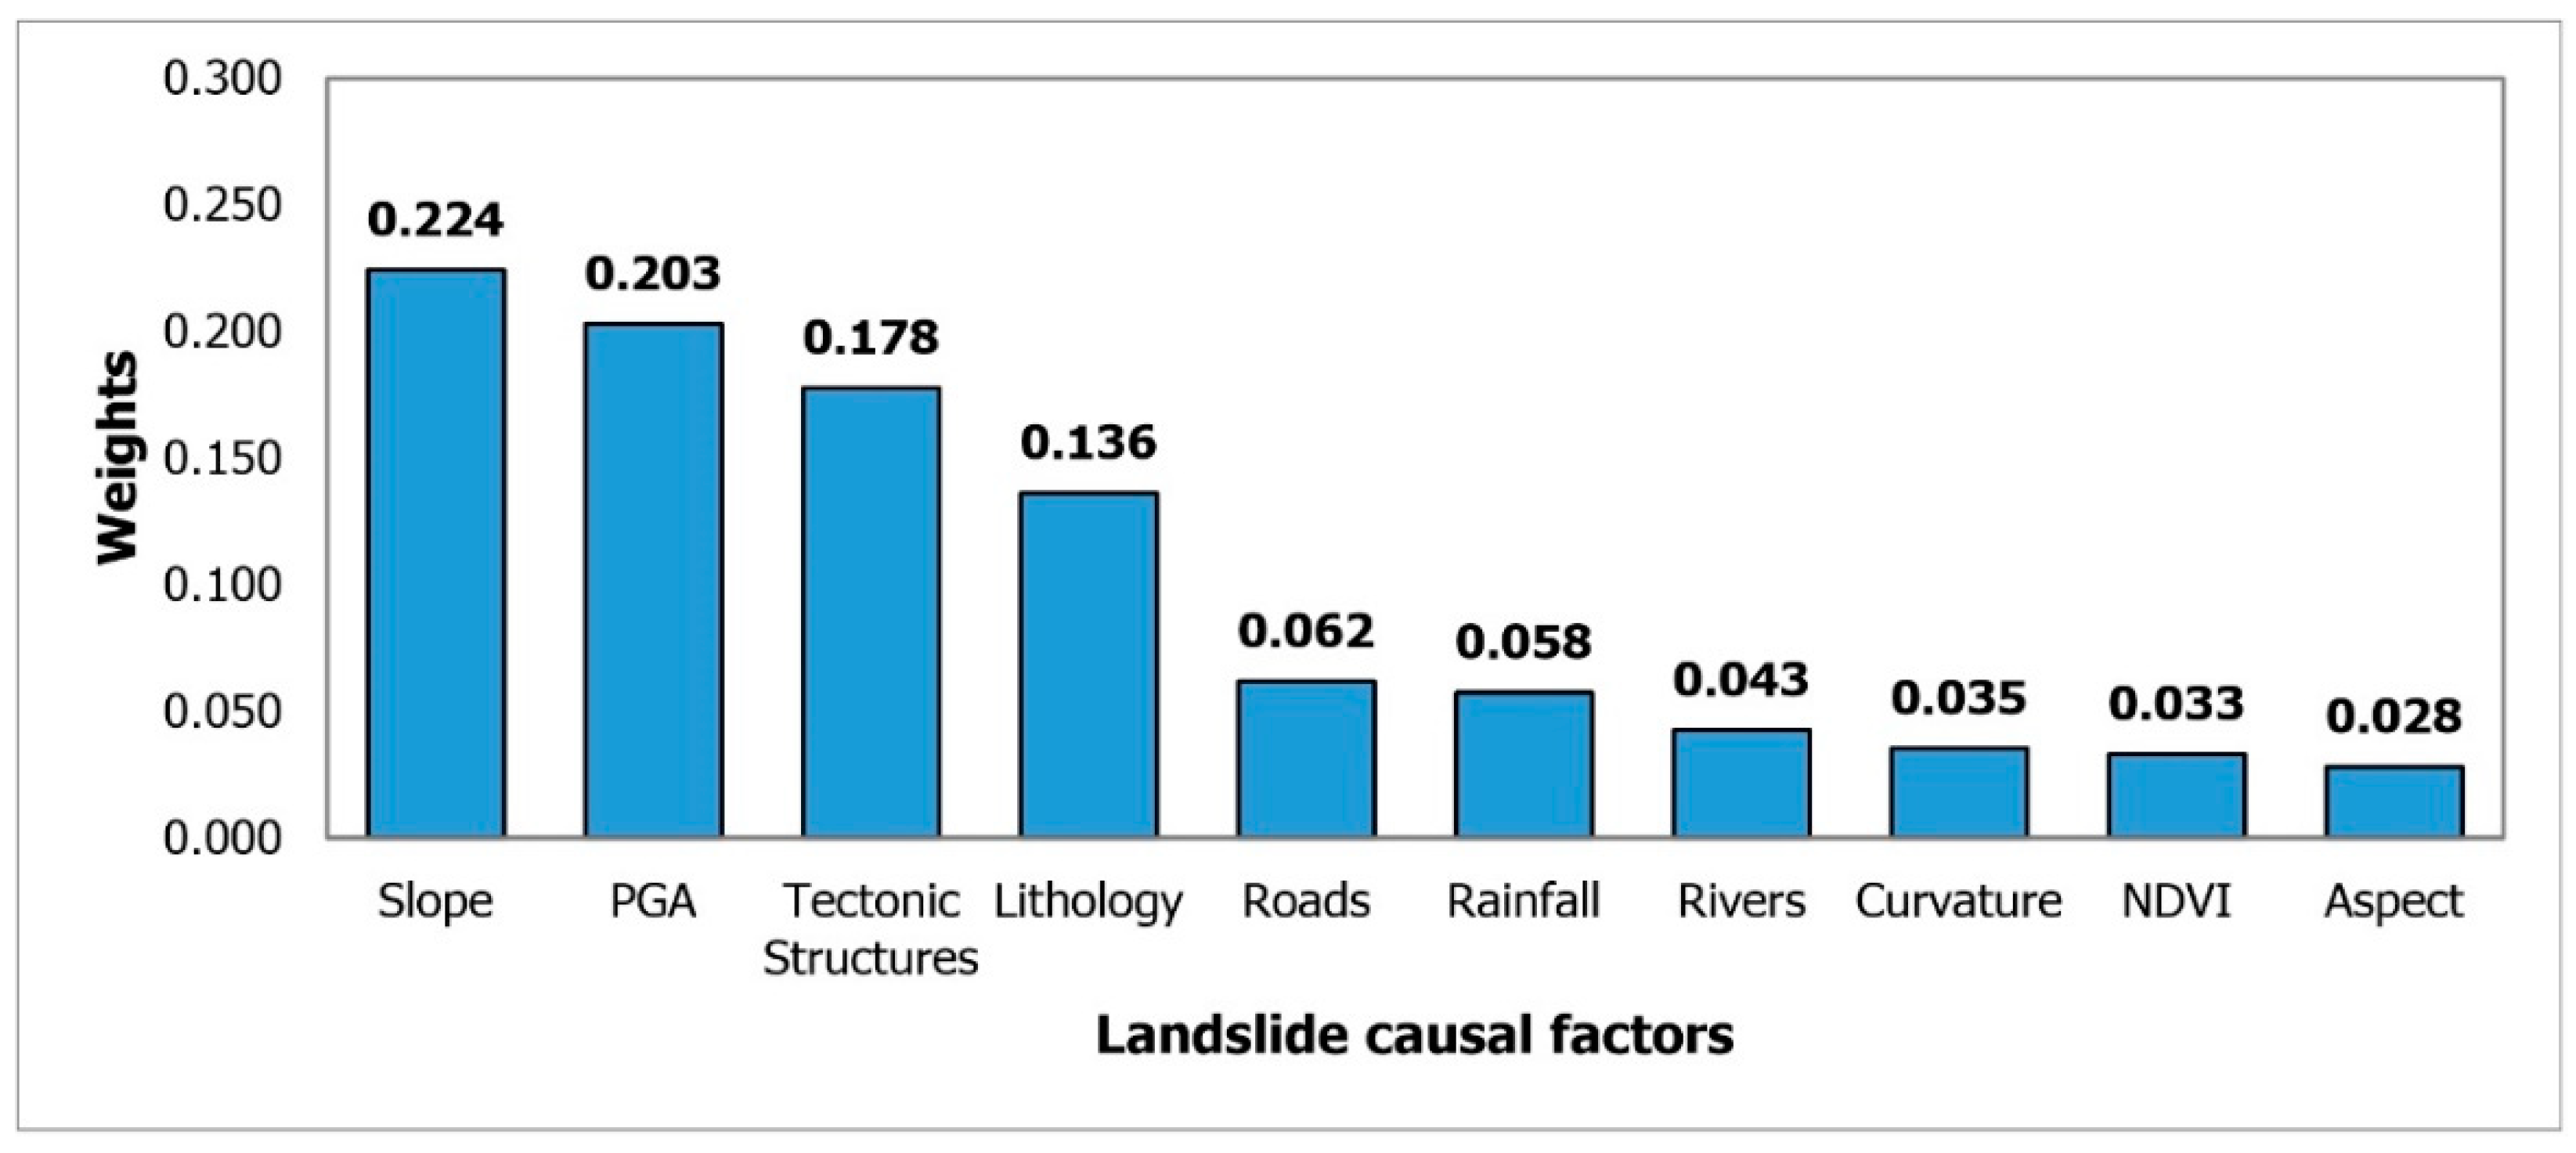
| Causal Factors | Classes | Rank Values | Standardized Ratings | Weights |
|---|---|---|---|---|
| Slope | Escarpments, >35° | 5 | 100 | 0.224 |
| Steep slopes, 25–35° | 4 | 80 | ||
| Moderately steep slopes, 15–25° | 3 | 60 | ||
| Gentle slopes, 5–15° | 2 | 40 | ||
| Very gentle slopes, <50° | 1 | 20 | ||
| PGA | >530 cm/s2 | 3 | 100 | 0.203 |
| 470–530 cm/s2 | 2 | 67 | ||
| <470 cm/s2 | 1 | 33 | ||
| Tectonic Structures | <150 m from thrusts and fault zones | 3 | 100 | 0.178 |
| 150–300 m from thrusts and fault zones | 2 | 67 | ||
| <50 m from minor faults | 1 | 33 | ||
| All other areas | 0 | 0 | ||
| Lithology | Scree and talus cones | 6 | 100 | 0.136 |
| Flysch and flysch-type formations | 5 | 83 | ||
| Series with several lithologies | 4 | 97 | ||
| Evaporites | 3 | 50 | ||
| Marine calcarenites | 2 | 33 | ||
| Limestones | 1 | 17 | ||
| Alluvial deposits | 0 | 0 | ||
| Roads | <50 m | 1 | 100 | 0.062 |
| >50 m | 0 | 0 | ||
| Rainfall | >1250 mm | 3 | 100 | 0.058 |
| 1000–1250 mm | 2 | 67 | ||
| <1000 mm | 1 | 33 | ||
| Rivers | <50 m | 1 | 100 | 0.043 |
| >50 m | 0 | 0 | ||
| Curvature | <−1.5 | 4 | 100 | 0.035 |
| −1.5–−0.5 | 3 | 75 | ||
| −0.5–0 | 2 | 50 | ||
| >0 | 1 | 25 | ||
| NDVI | <0 | 3 | 100 | 0.033 |
| 0–0.1 | 2 | 67 | ||
| >0.1 | 1 | 33 | ||
| Aspect | N and NW facing slopes | 3 | 100 | 0.028 |
| W and SW facing slopes | 2 | 67 | ||
| all other directions | 1 | 33 | ||
| Flats | 0 | 0 |
| Slope | Aspect | Curvature | Lithology | Tectonic Structures | NDVI | PGA | Rainfall | Rivers | Roads | Weights | |
|---|---|---|---|---|---|---|---|---|---|---|---|
| Slope | 1 | 4 | 4 | 4 | 2 | 4 | 2 | 5 | 5 | 3 | 0.224 |
| Aspect | 0.25 | 1 | 1 | 0.2 | 0.2 | 0.5 | 0.2 | 0.2 | 0.5 | 0.333 | 0.028 |
| Curvature | 0.25 | 1 | 1 | 0.2 | 0.2 | 2 | 0.2 | 0.5 | 0.5 | 0.5 | 0.035 |
| Lithology | 0.25 | 5 | 5 | 1 | 0.333 | 5 | 0.333 | 5 | 5 | 4 | 0.136 |
| Tectonic Structures | 0.5 | 5 | 5 | 3 | 1 | 5 | 0.5 | 5 | 5 | 5 | 0.178 |
| NDVI | 0.25 | 2 | 0.5 | 0.2 | 0.2 | 1 | 0.2 | 0.5 | 0.5 | 0.5 | 0.033 |
| PGA | 0.5 | 5 | 5 | 3 | 2 | 5 | 1 | 5 | 5 | 5 | 0.203 |
| Rainfall | 0.2 | 5 | 2 | 0.2 | 0.2 | 2 | 0.2 | 1 | 2 | 0.5 | 0.058 |
| Rivers | 0.2 | 2 | 2 | 0.2 | 0.2 | 2 | 0.2 | 0.5 | 1 | 0.5 | 0.043 |
| Roads | 0.333 | 3 | 2 | 0.25 | 0.2 | 2 | 0.2 | 2 | 2 | 1 | 0.062 |
| LSI Class | Area (km2) | Percentage (%) |
|---|---|---|
| No susceptible | 86.40 | 8.46 |
| Very low | 210.26 | 20.60 |
| Low | 236.42 | 23.16 |
| Moderate | 199.82 | 19.57 |
| High | 152.78 | 14.97 |
| Very high | 99.68 | 9.76 |
| Critically high | 35.52 | 3.48 |
| Total | 1020.87 | 100 |
| Landslide Susceptibility | ETL | Percentage (%) |
|---|---|---|
| No | 0 | 0.00 |
| Very low | 0 | 0.00 |
| Low | 3 | 4.48 |
| Moderate | 9 | 13.43 |
| High | 24 | 35.82 |
| Very high | 16 | 23.88 |
| Critically high | 15 | 22.39 |
| Total | 67 | 100.00 |
Publisher’s Note: MDPI stays neutral with regard to jurisdictional claims in published maps and institutional affiliations. |
© 2022 by the authors. Licensee MDPI, Basel, Switzerland. This article is an open access article distributed under the terms and conditions of the Creative Commons Attribution (CC BY) license (https://creativecommons.org/licenses/by/4.0/).
Share and Cite
Mavroulis, S.; Diakakis, M.; Kranis, H.; Vassilakis, E.; Kapetanidis, V.; Spingos, I.; Kaviris, G.; Skourtsos, E.; Voulgaris, N.; Lekkas, E. Inventory of Historical and Recent Earthquake-Triggered Landslides and Assessment of Related Susceptibility by GIS-Based Analytic Hierarchy Process: The Case of Cephalonia (Ionian Islands, Western Greece). Appl. Sci. 2022, 12, 2895. https://doi.org/10.3390/app12062895
Mavroulis S, Diakakis M, Kranis H, Vassilakis E, Kapetanidis V, Spingos I, Kaviris G, Skourtsos E, Voulgaris N, Lekkas E. Inventory of Historical and Recent Earthquake-Triggered Landslides and Assessment of Related Susceptibility by GIS-Based Analytic Hierarchy Process: The Case of Cephalonia (Ionian Islands, Western Greece). Applied Sciences. 2022; 12(6):2895. https://doi.org/10.3390/app12062895
Chicago/Turabian StyleMavroulis, Spyridon, Michalis Diakakis, Haralambos Kranis, Emmanuel Vassilakis, Vasilis Kapetanidis, Ioannis Spingos, George Kaviris, Emmanuel Skourtsos, Nicholas Voulgaris, and Efthymis Lekkas. 2022. "Inventory of Historical and Recent Earthquake-Triggered Landslides and Assessment of Related Susceptibility by GIS-Based Analytic Hierarchy Process: The Case of Cephalonia (Ionian Islands, Western Greece)" Applied Sciences 12, no. 6: 2895. https://doi.org/10.3390/app12062895