
Digitalizing Maritime Containers Shipping Companies: Impacts on Their Processes


Escuela Técnica Superior de Ingenieros Navales, Universidad Politécnica de Madrid (UPM), Av. Arco de la Victoria, 4, 28040 Madrid, Spain
*
Author to whom correspondence should be addressed.
Appl. Sci. 2022, 12(5), 2532; https://doi.org/10.3390/app12052532
Submission received: 4 February 2022
/
Revised: 24 February 2022
/
Accepted: 26 February 2022
/
Published: 28 February 2022
(This article belongs to the Special Issue Future Transportation)
Abstract
:Key analysts are emphasizing the importance of the digitalization especially of the supply chain. This work aims to improve maritime shipping companies by introducing digitalization in their operations. This objective is achieved analyzing the impact of maritime container shipping companies’ digitalization. This analysis requires as input the Business Process Model (BPMo) and an inventory of digital applications to verify how the BPMo changes when deploying the applications, define the prerequisites necessary for this deployment, and identify the key performance indicators (KPIs) to track it. The impact of the deployment of the applications has been quantified by using four performance dimensions: Costs, Time, Quality, and Flexibility. The results show that the impacts are different per application, with changes in the processes, the addition of new ones, and the decommissioning of others. The impact of digitalization is high when trying to deploy all the applications at the same time. Companies can leverage this work, which requires reviewing the documented impacts in their processes and the applications’ prerequisites as well as updating their existing balanced scorecard, incorporating the application’s KPIs. A list of 10 applications has been identified as “quick wins”; then, applications can be the starting point for digitalizing a company.
1. Introduction
Maritime transportation defied the COVID-19 disruption, laying the foundations for a transformation in global supply chains [1]. Maritime shipping companies form the backbone of maritime transportation; therefore, they have been forced to changes to follow the global chain changes.
In this context, the key analysts are emphasizing the importance of the digitalization especially of the supply chain, with high investments in artificial intelligence, real-time transportation visibility, etc. [2]. Given its relevance and their intermodal global operations, maritime transportation industry digitalization is key for the supply chain’s digitalization.
Digitalization in the maritime transportation industry is being studied these days following different streams: Munim et al. focused on big data and artificial intelligence [3]; Plaza-Hernández studied the integration of IoT technologies in the industry [4]; Kapidani et al. looked at the industry digitalization from a sustainability point of view [5]; Kapnissis et al. investigated blockchain adoption in the industry [6]; Tijan et al. reviewed the drivers, success factors, and barriers to digital transformation in the maritime transport sector [7]. These articles are just a few examples that illustrate the relevance of digitalization research in the maritime transportation industry.
The research from the team of the present paper published in 2019 in Sensors (ISSN 1424-8220) showed that when looking at the three different industrial sectors that compose the maritime transportation industry (ship design and shipbuilding; shipping; and ports), its digitalization is moving at different speeds in the different domains and industrial sectors defined in the aforementioned Sensors paper:
- Autonomous vehicles and robotics (hereafter, robotics).
- Artificial intelligence (AI).
- Big data.
- Virtual, augmented, and mixed reality (VR).
- The internet of things (IoT).
- Cloud and edge computing (hereafter, the cloud).
- Digital security.
- Three-dimensional (3D) printing and additive engineering (3DP).
The size of the maritime transportation industry makes it necessary to focus on one of their industrial sectors; therefore, this work is limited to shipping.
Any change to the operations of maritime shipping companies requires understanding of how they operate. Business Process Management (BPM) is the science that monitors how work is performed in an organization in order to ensure consistent outcomes and to take advantage of opportunities for improvement [8]; this makes BPM an optimal technique for understanding maritime shipping companies’ operations.
Few published works make use of BPM for analyzing the maritime transportation sector. Lyridis et al. [9] made use of BPM to optimize operations of a shipping company for one specific route. Elbert et al. [10] resorted to BPM for ports optimization, thereby analyzing the chains taking place at ports when ships arrive or depart and the interactions with ground organizations. Cimino et al. [11] also relied on BPM for analyzing the impact of Information and Communication Technology (ICT) for ports optimization. Finally, Nikitakos et al. [12] partially used BPM in part to evaluate ICTs in the Greek-owned shipping sector.
The research being presented in this article aims to improve maritime shipping companies by introducing digitalization in their operations while being aware that the implementation of a successful business process model does not automatically bring about the same benefits for all companies [13] but rather is a starting point for understanding the problems. Given the importance of maritime container shipping companies for the maritime transportation industry, this research focuses on these companies. Since there are different types of maritime container shipping companies, those used in this study are companies that have their own fleet of vessels used both nautically and commercially by the company.
The contributions of this work are as follows:
- To contribute to the digitalization of the industry via the analysis of the impacts of digitalizing the aforementioned process model;
- To generate the key performance indicators (KPIs) that will allow a phased approach for the deployment of the processes’ digitalization;
- To identify a list of “quick wins”: applications that given their optimal results on the analysis could be considered as the starting point for digitalizing a company.
This work is divided into the following sections: Section 2 describes the methodology used in the study; Section 3 includes the results of the impact of maritime container shipping companies processes’ digitalization as well as its analysis and discussion; and finally, Section 4, summarizes the conclusions.
2. Approach and Methodology
Since the hypothesis that needs to be proved is that the impacts of maritime containers shipping companies’ digitalization is different per application and that these applications can be grouped or clustered according to their impact in the company’s operations, the first step was performing an impact analysis. The impact analysis performed in this work required two inputs: the maritime containers shipping companies’ Business Process Model (BPMo) and the digital applications used for digitalizing the BPMo.
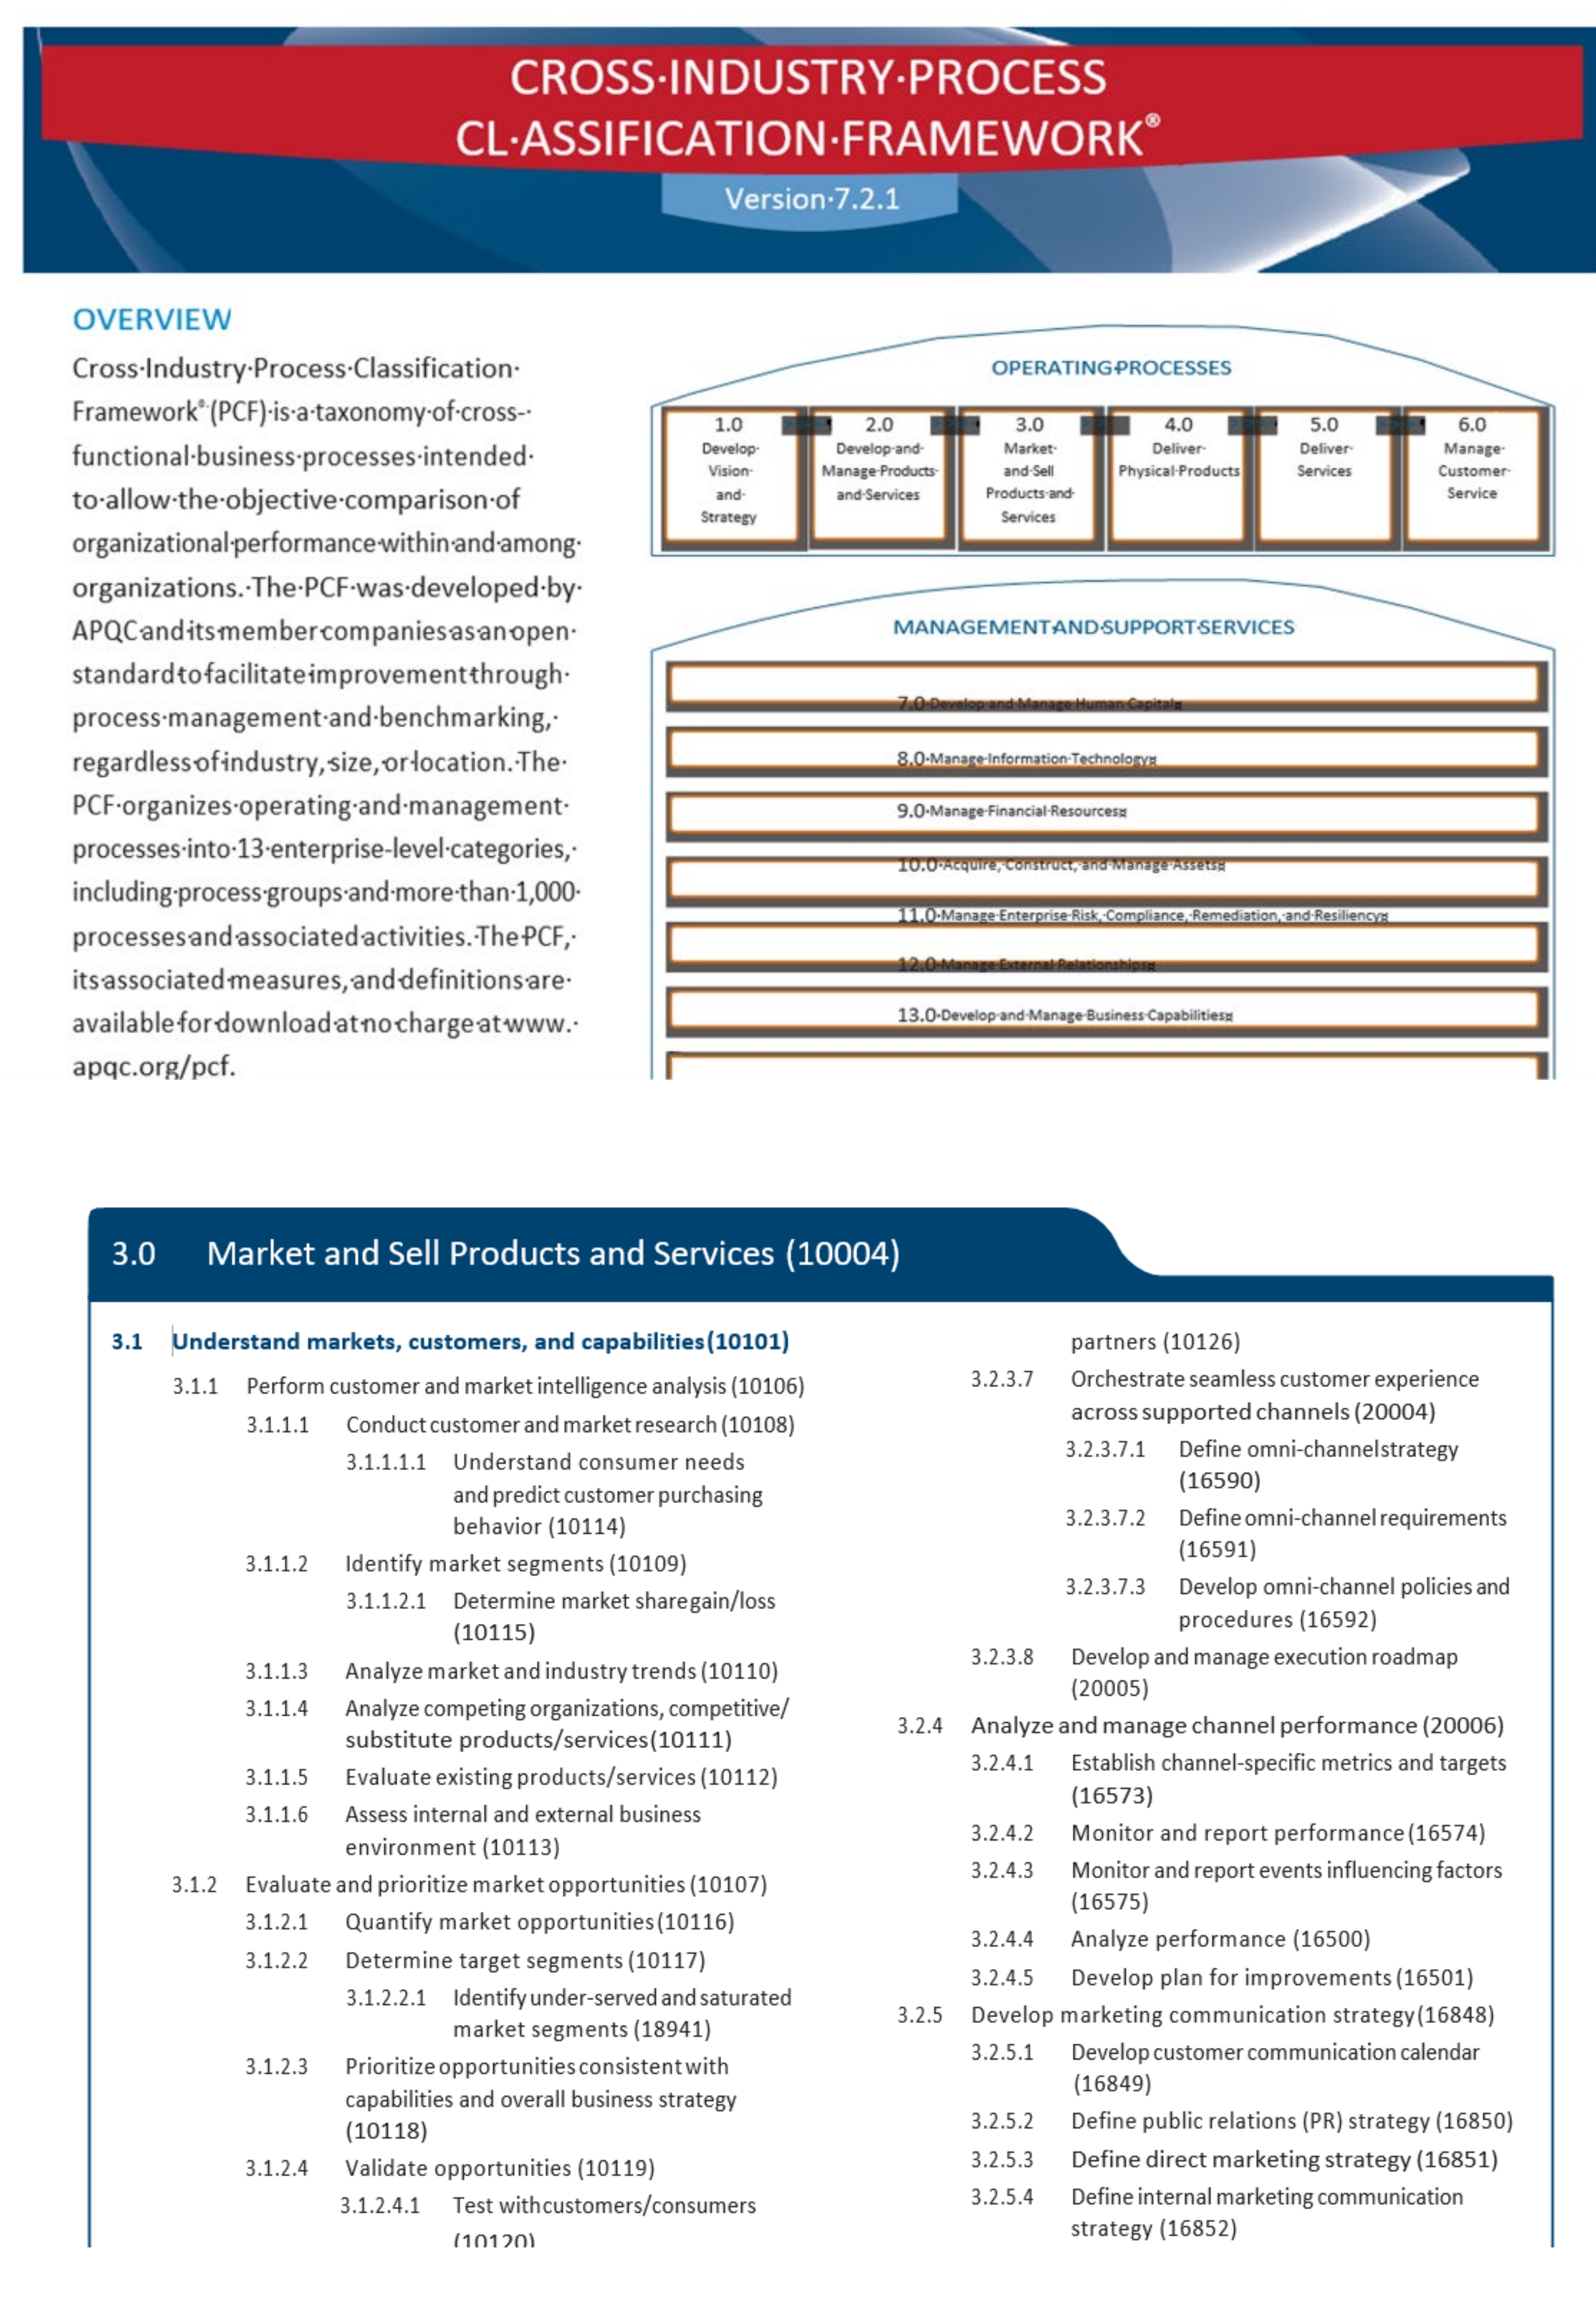
The lack of published process models for the companies that are the object of this research has required the development of a BPMo. The developed BPMo departed from the Cross-Industry version of the Process Classification Framework© [14,15] from the American Productivity & Quality Centre (APQC) since there is no version for maritime shipping companies. Figure 1 has the “look and feel” from the APQC, which was used as a starting process model.
A first version of the business processes for maritime container shipping companies has been generated by tailoring these cross-industry business processes, taking advantage of the following assets:
- The UN Convention on International Multimodal Transport [19].
The content validation of this model was performed by using an inter-judge validation process. The experts that participated in this validation were:
- Three Spanish Maritime Transportation Shipping Companies, including the participation of C-level executives and vice-presidents from these companies.
- A Spanish logistics management company.
- An expert in the sector from Universidad Politécnica de Madrid (UPM).
The content validation of this business process model was performed by using an inter-judge validation process. This method has been extensively used specially for validating survey questions. This work makes use of it, extending the concept of content validation beyond the one related with questions from a survey. The quantification of the agreement was calculated using the content validity ratio (CVR) developed by Lawshe [20]:
where ne = number of judges indicating the question as “essential” (in this research, ne = number of judges indicating the modification of the BPMo as “essential”); and N = total number of judges (in this work, N = 5).
𝐶𝑉𝑅 = (𝑛𝑒 − 𝑁/2)⁄(𝑁/2)
Lawshe considered the values of CVR included in Table 1 as the ones necessary for item validation.
Therefore, the method required the agreement amongst judges on the validity and clarity of the model.
The next step was building the list of digital application; three sources have been used for building such a list:
- Applications coming from academic research. These are the ones coming from the aforementioned Sensors paper from the team of this research.
- Applications that are already available in the market. This list has been built using the newsletter from the market. Some of them are: www.maritime-executive.com, www.vpoglobal.com, www.thedigitalship.com, www.dnv.com, www.shippingandfrieghtresource.com, and www.wartsila.com. It includes not only market-available applications but also others that are inspired by market-available ones. The range of dates for this analysis has been between March 2018 and September 2021.
- Applications coming from other industries. The search for these applications was completed via the internet between June 2021 and September 2021.
The list of applications was confronted to the aforementioned BPMo for maritime container shipping companies in order to qualify the impact on each process, the requirements for the implementation of the app, and the Key Performance Indicators (KPIs) that will measure the impact of the implementation.
The digitalization of the processes implies their redesign. The tool for quantifying the impact of this redesign is the devil’s quadrangle [21]. This framework evaluates the impact using the four performance dimensions for processes: costs, time, quality, and flexibility. In this research, the impact has been quantified using the following criteria:
- Costs: this performance dimension is broken down into two sub-dimensions:
- ◦
- Implementation costs, which accounts the costs for deploying the application in the company. It has these values:
- ▪
- Low (equal to 2) for applications that require a low investment for their deployment.
- ▪
- Medium (equal to 1) for applications that require a medium investment for their deployment.
- ▪
- High (equal to 0) for applications that require a high investment for their deployment.
The aforementioned values are comparatively weighted (i.e., the values low, medium, and high are relative to the rest of the applications). The comparative analysis situated the applications in one of the three aforementioned tertiles (i.e., low, medium, and high).
- ◦
- Execution cost, which evaluates the return of investment (ROI). It has these values:
- ▪
- Low (equal to 2) for applications with an ROI in less than 2 months.
- ▪
- Medium (equal to 1) for applications with an ROI in 2–12 months.
- ▪
- High (equal to 0) for applications that need more than 12 months for their ROI.
The final value of the performance indicator is obtained by arithmetic media of the two sub-dimensions.
- Time is also broken down into two sub-dimensions:
- ◦
- Implementation time, which accounts the time needed for deploying the application in the company. It has these values:
- ◦
- Low (equal to 2) for applications that can be deployed in less than 6 months.
- ◦
- Medium (equal to 1) for applications that can be deployed in 6–18 months.
- ◦
- High (equal to 0) for applications that need more than 18 months for their deployment.
- ◦
- Execution time, which evaluates the savings in time for the processes’ execution. It has these values:
- ▪
- High (equal to 2) for applications with a high decrease on processes’ execution time.
- ▪
- Medium (equal to 1) for applications with a medium decrease on processes’ execution time.
- ▪
- Low (equal to 0) for applications with a small decrease on processes’ execution time.
The aforementioned values are comparatively weighted (i.e., the values’ categorization as low, medium, or high is relative to the rest of the applications). The final value of the performance indicator is obtained by arithmetic media of the two sub-dimensions.
- Quality, that evaluates the reliability added to the processes by the application. It has the following values:
- ◦
- High (equal to 2) for applications with a high increase on the processes’ reliability.
- ◦
- Medium (equal to 1) for applications with a medium increase on the processes’ reliability.
- ◦
- Low (equal to 0) for applications with a small increase on the processes’ reliability.
The aforementioned values are comparatively weighted (i.e., the values’ categorization as low, medium, or high is relative to the rest of the applications).
- Flexibility, the performance indicator that evaluates the flexibility that the application has on the company’s processes. It has the following values:
- ◦
- High (equal to 2) for applications with a high increase on the processes’ flexibility.
- ◦
- Medium (equal to 1) for applications with a medium increase on the processes’ flexibility.
- ◦
- Low (equal to 0) for applications a small increase on the processes’ flexibility.
The aforementioned values are comparatively weighted (i.e., the values’ categorization as low, medium, is high is relative to the rest of the applications).
The “ideal” application is the one that maximizes the four performance indicators, and therefore, the impact on the company is considered positive. That application will achieve a total score of 8 (i.e., a score of 2 in each of the four performance dimensions for processes).
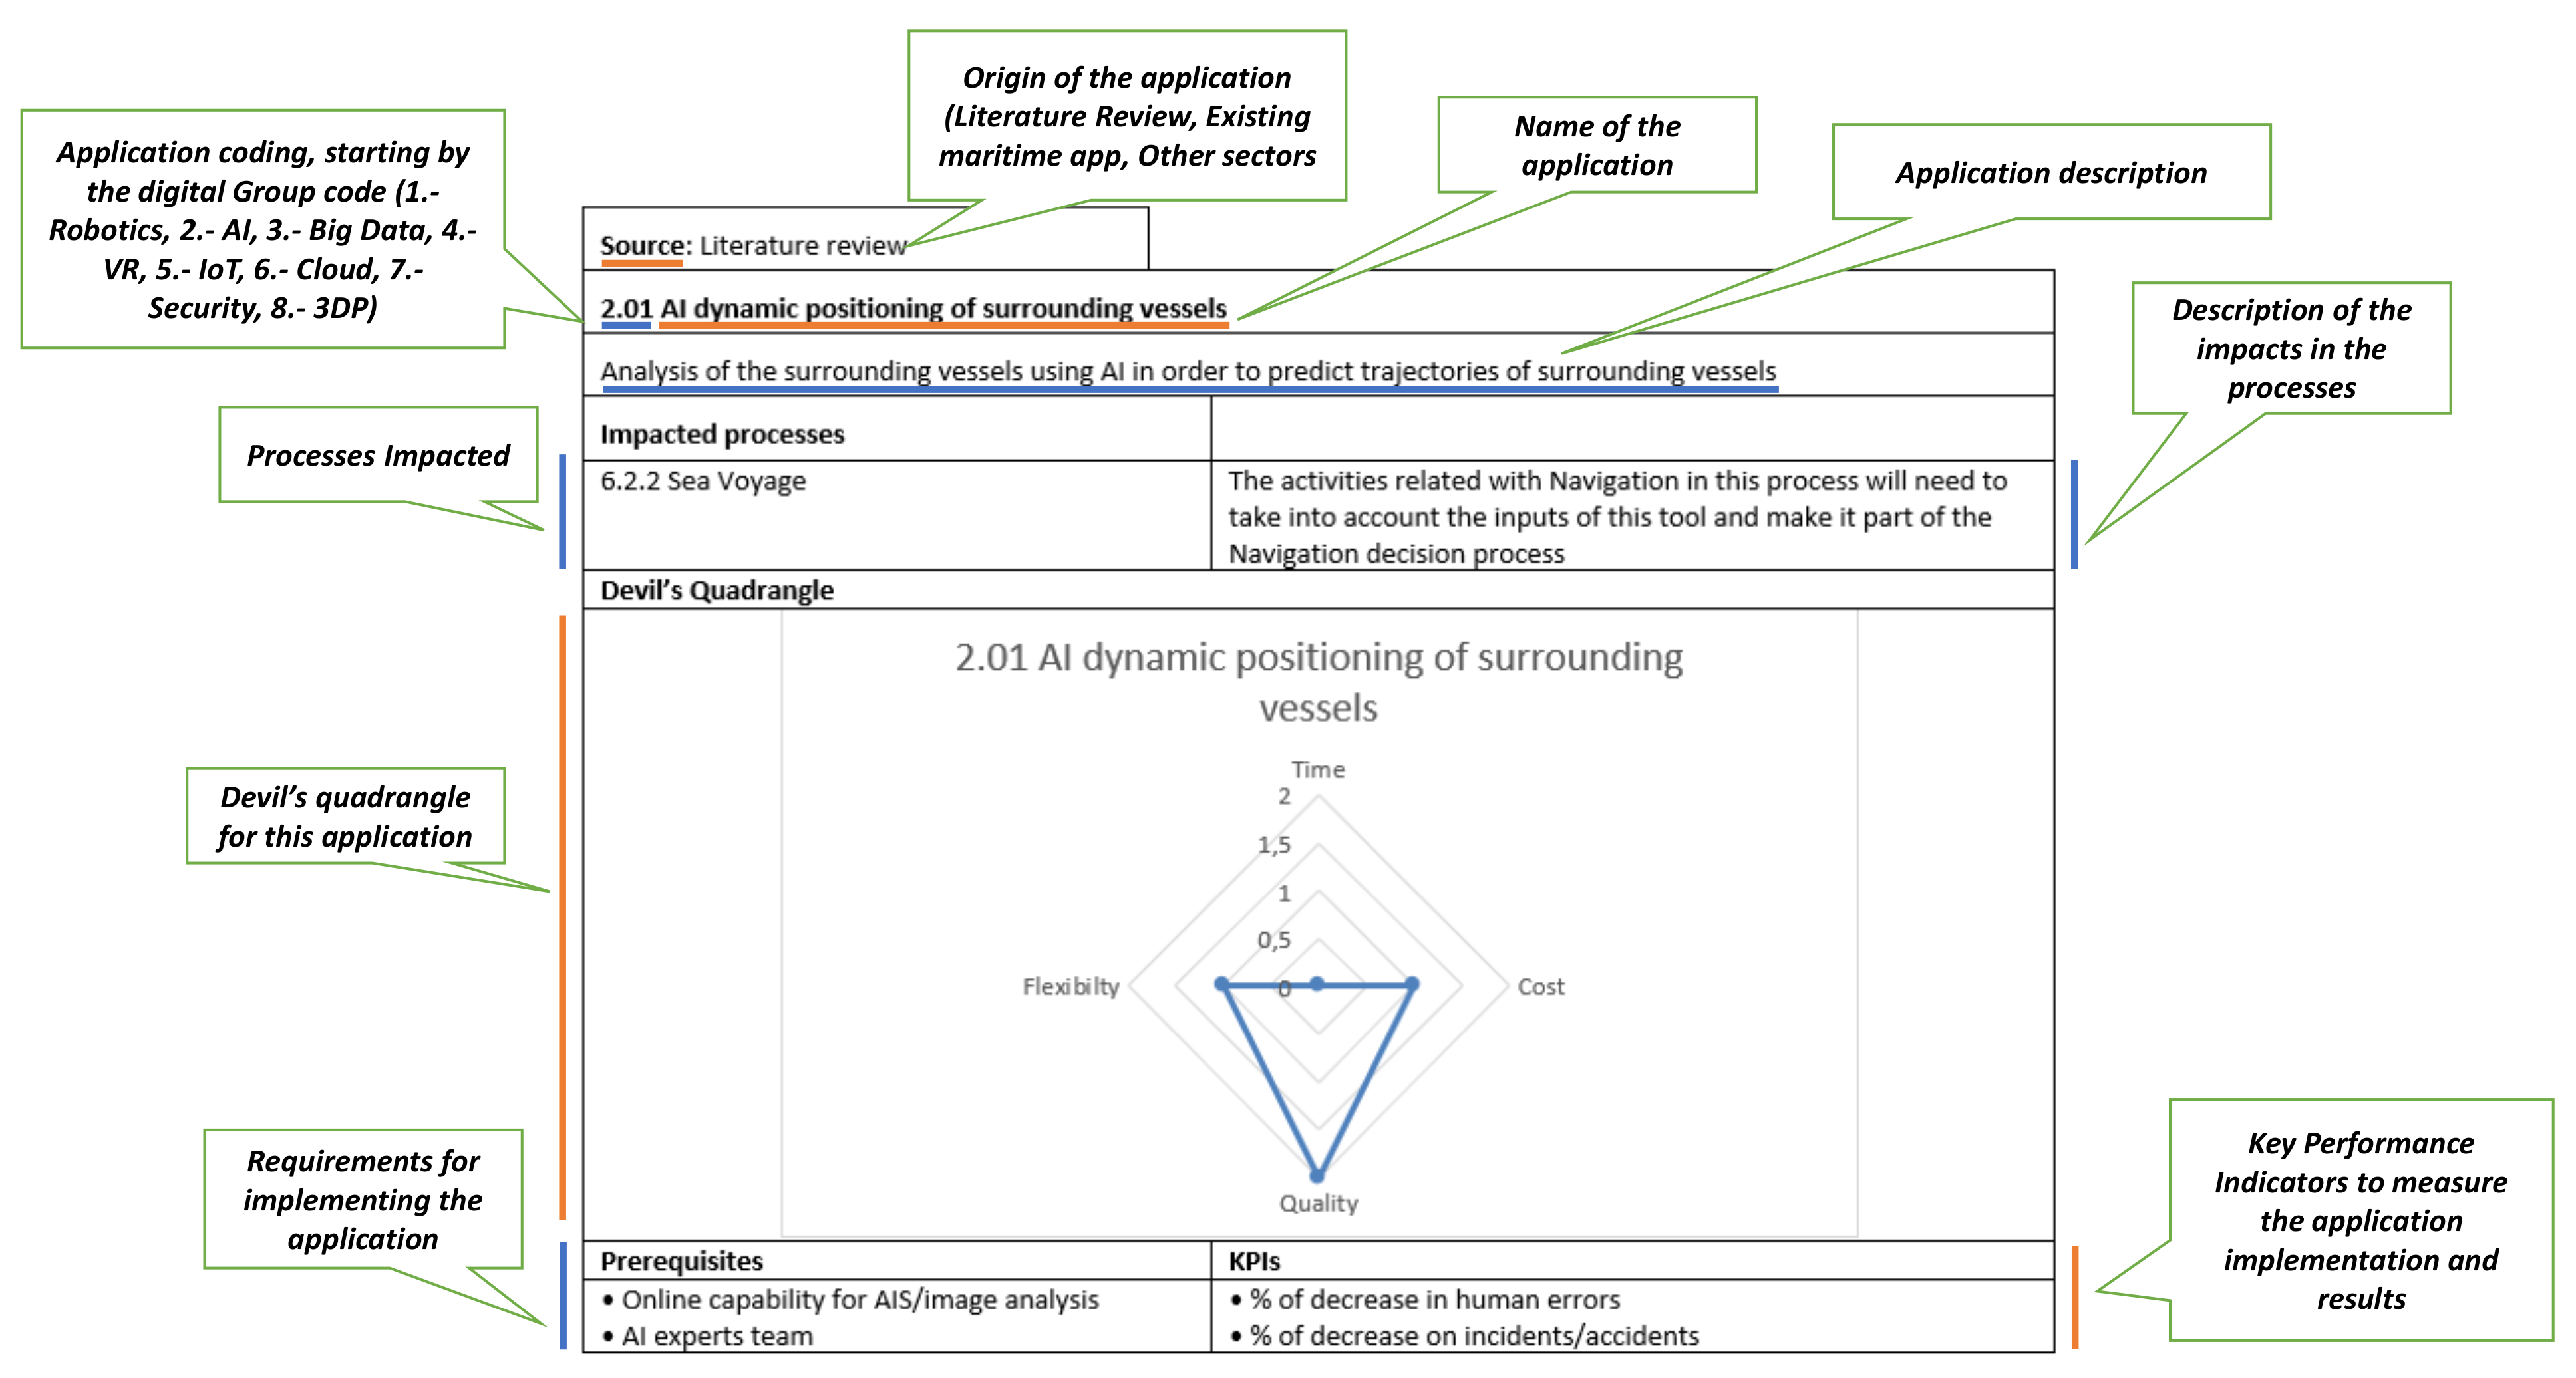
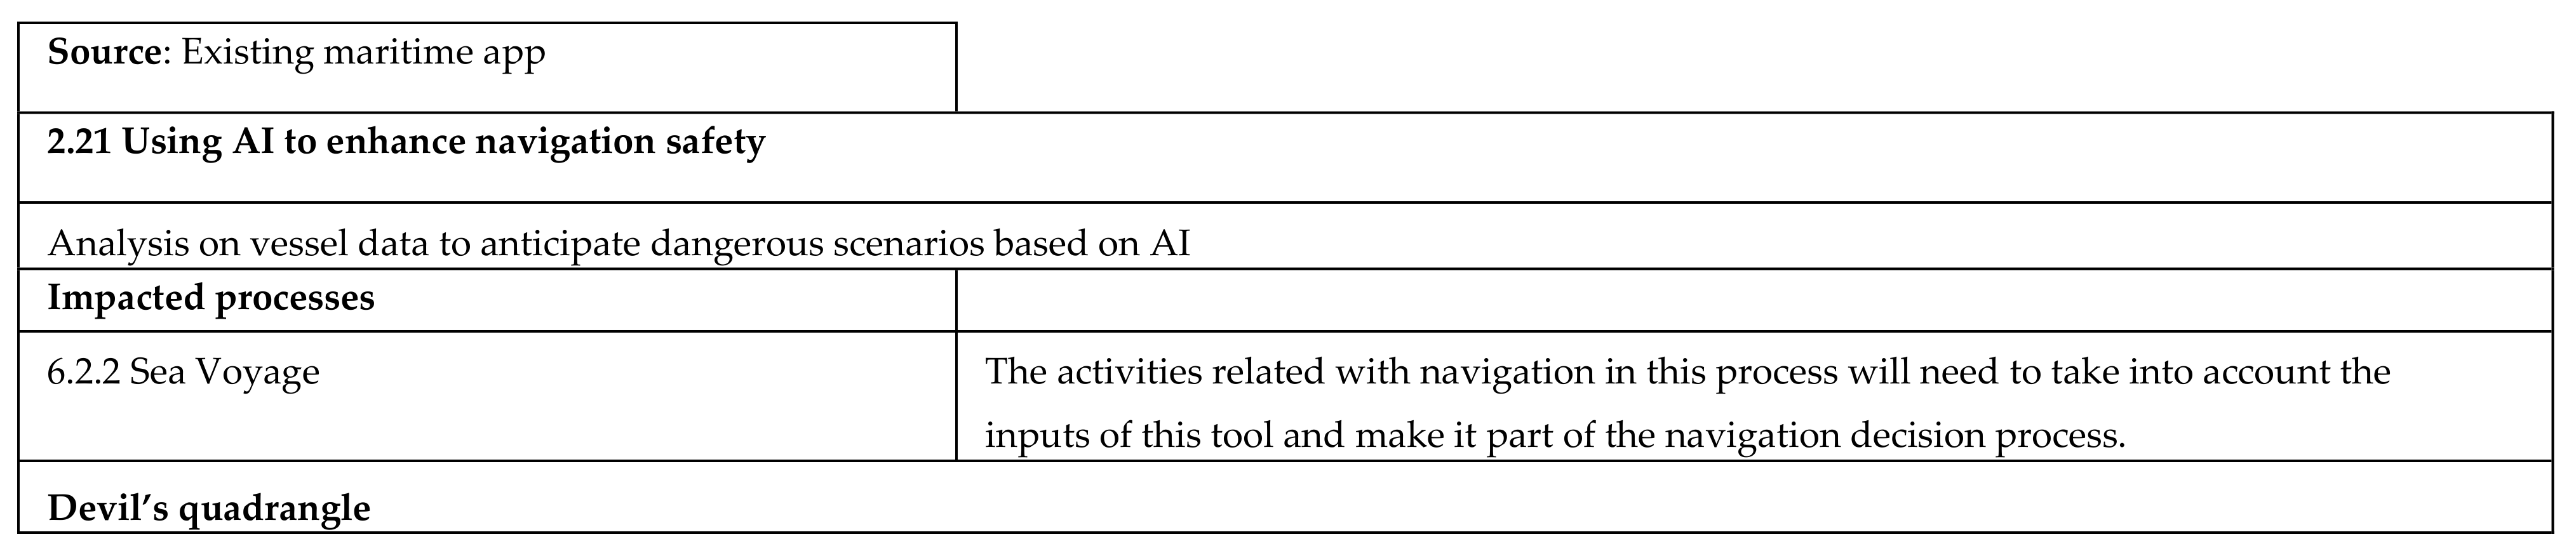
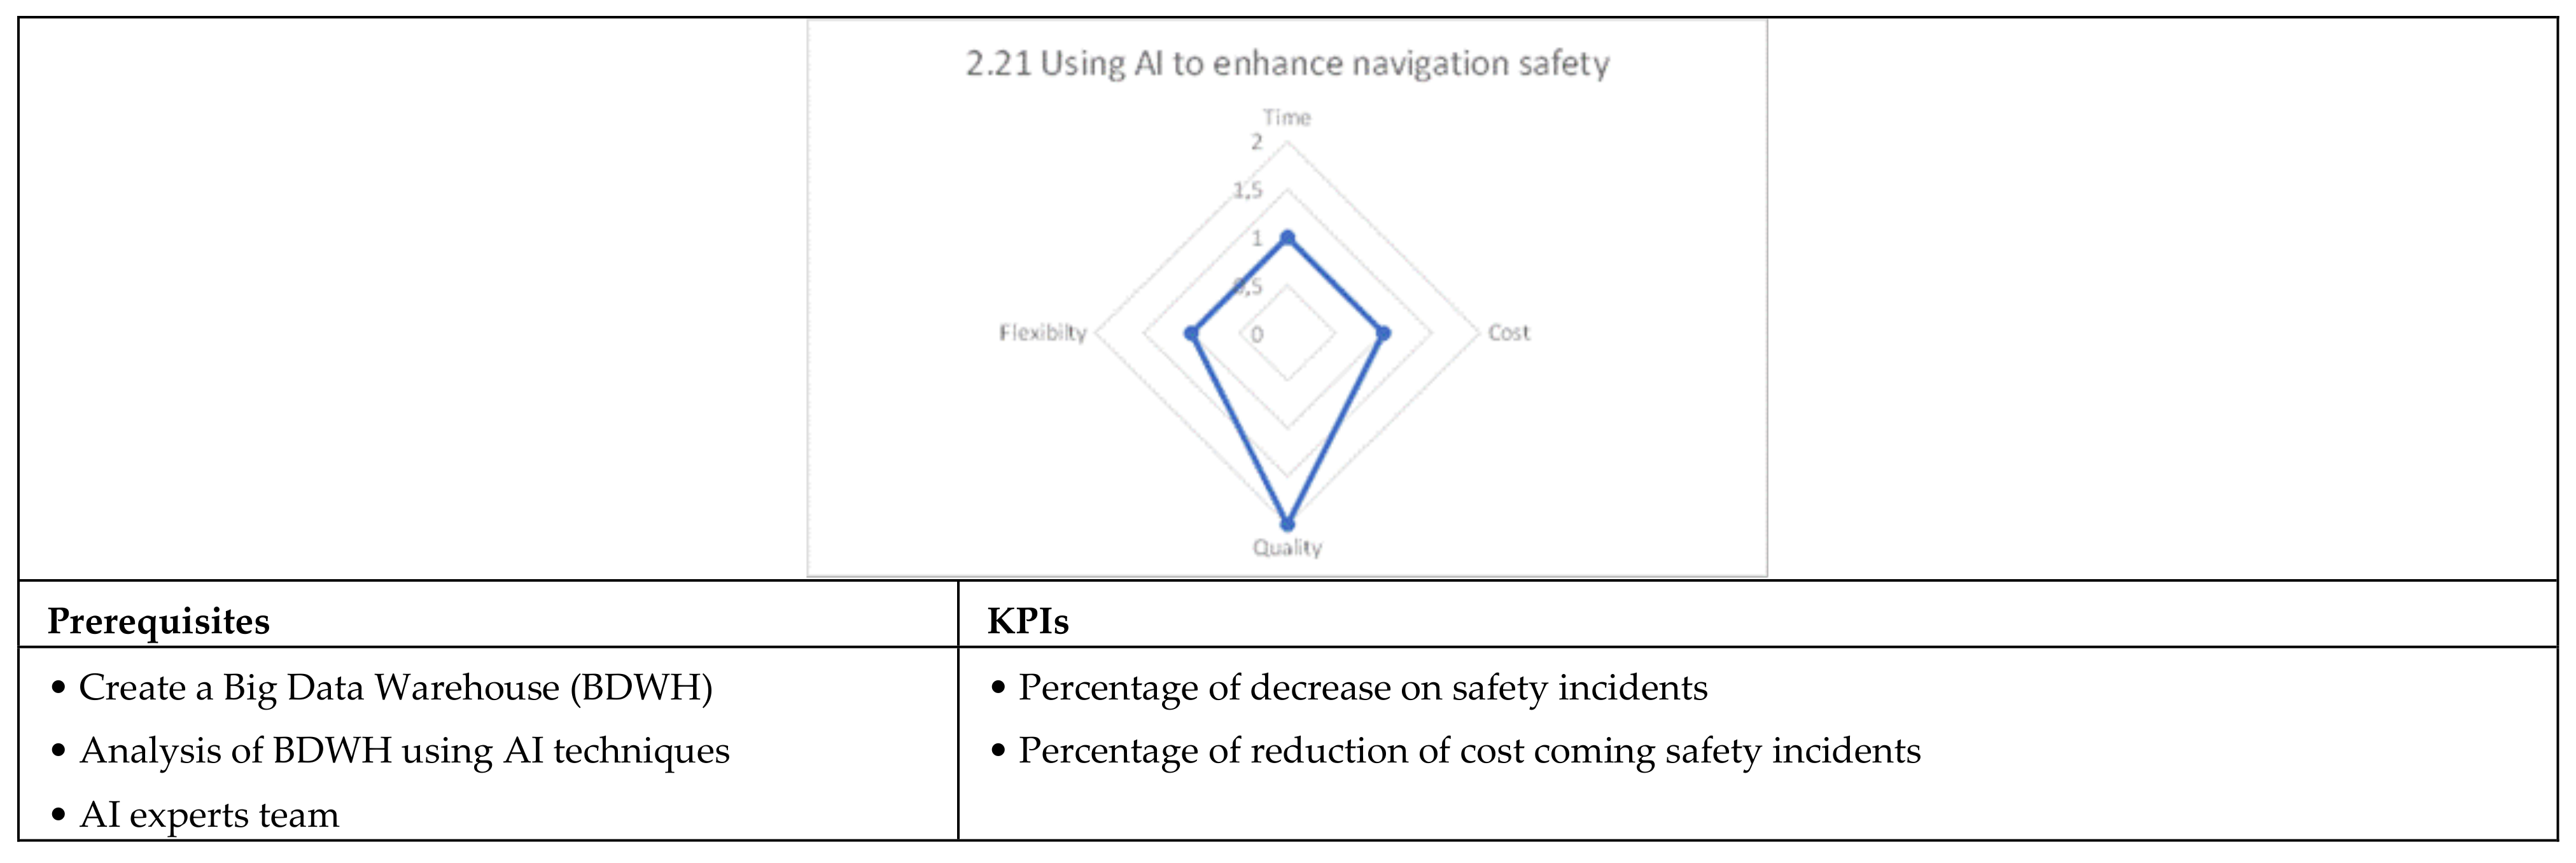
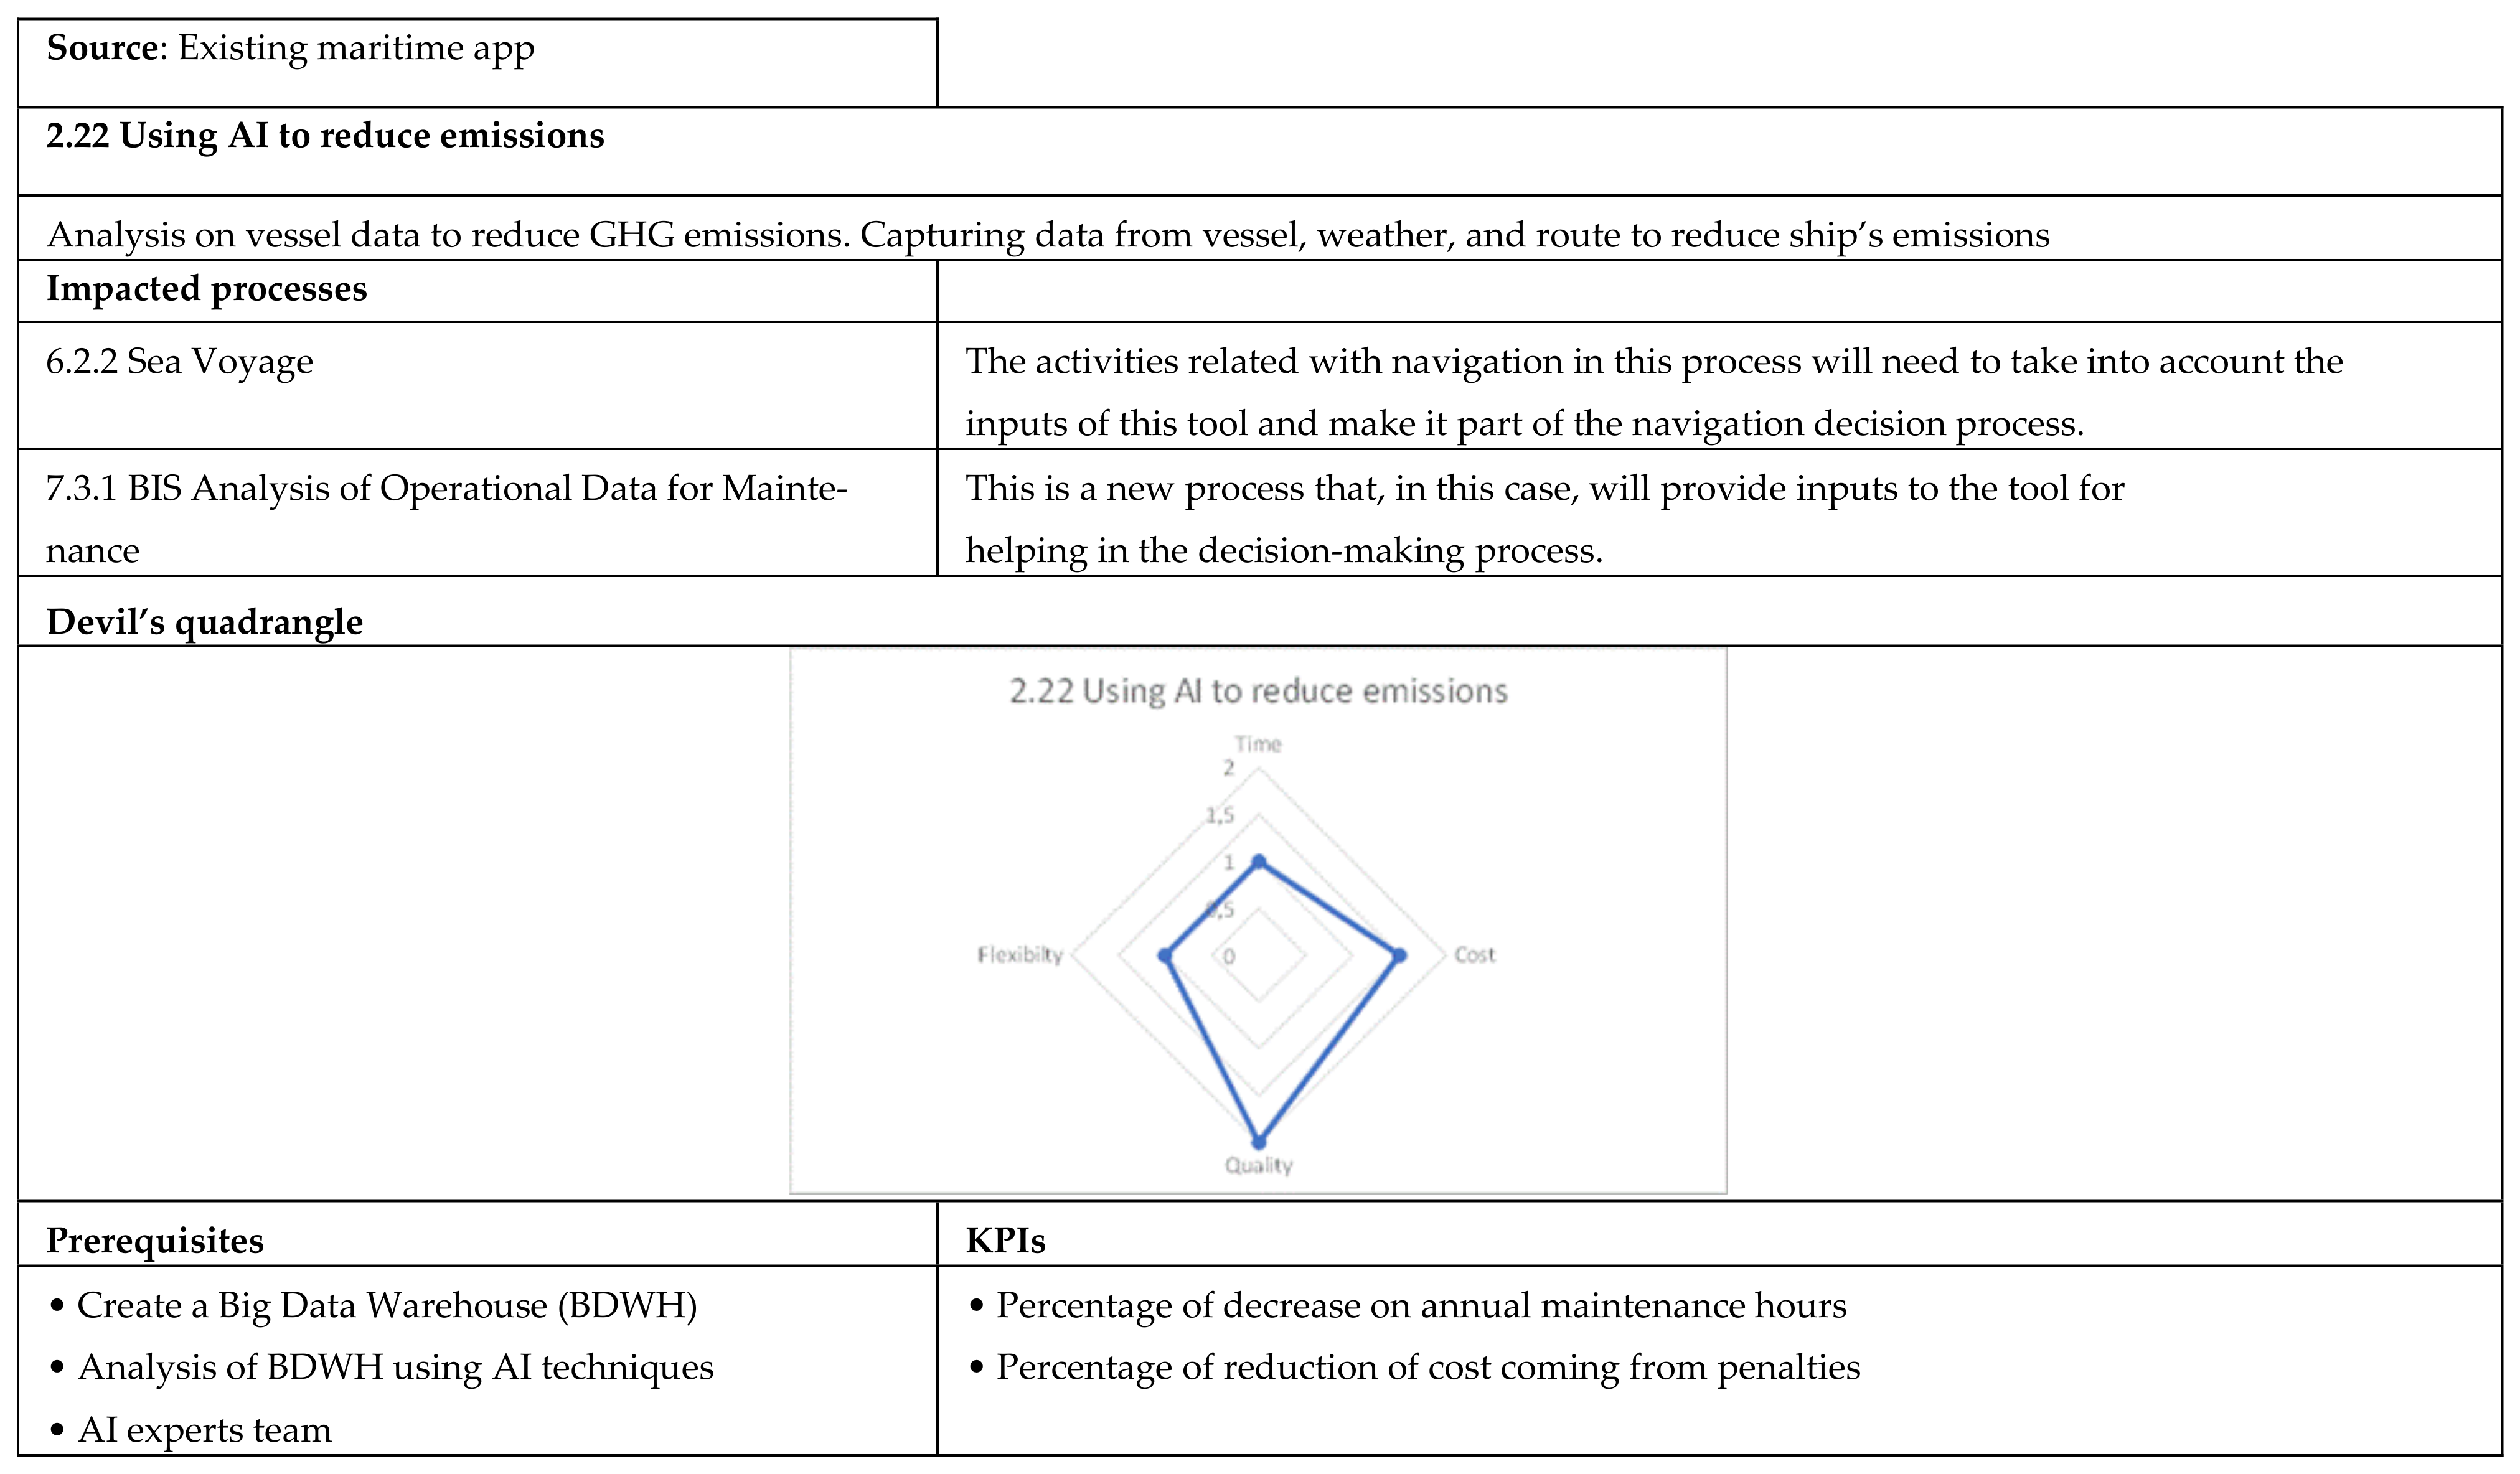
A data sheet was developed for each of these applications, which has the information from Figure 2.
The impacts on the processes have been analyzed assuming that the application considered is the only one that has been deployed, i.e., that it has been deployed stand alone. The combined deployment of several applications will require a review on the impacts. This same consideration applies to the KPIs: in case of deployment of several applications, the KPIs should be reviewed and confirmed.
3. Results and Discussion
The validated BPMo for maritime container shipping companies can be found as additional material of this paper. The application of the methodology from Section 3 resulted in a total of 46 application data sheets that contain the results of the research. These results are the applications data sheets, they have the impacts in the BPMo, and they can be found in Appendix A of the present work.
Regarding the impacts on the processes, a total of 147 impacts have been found. The processes highly impacted by different applications are shown in Table 2.
The processes with higher impacts are within the operations process categories domain. The reason is that these processes are the ones that produce the wealth of the company, so these are the ones subject to higher investments.
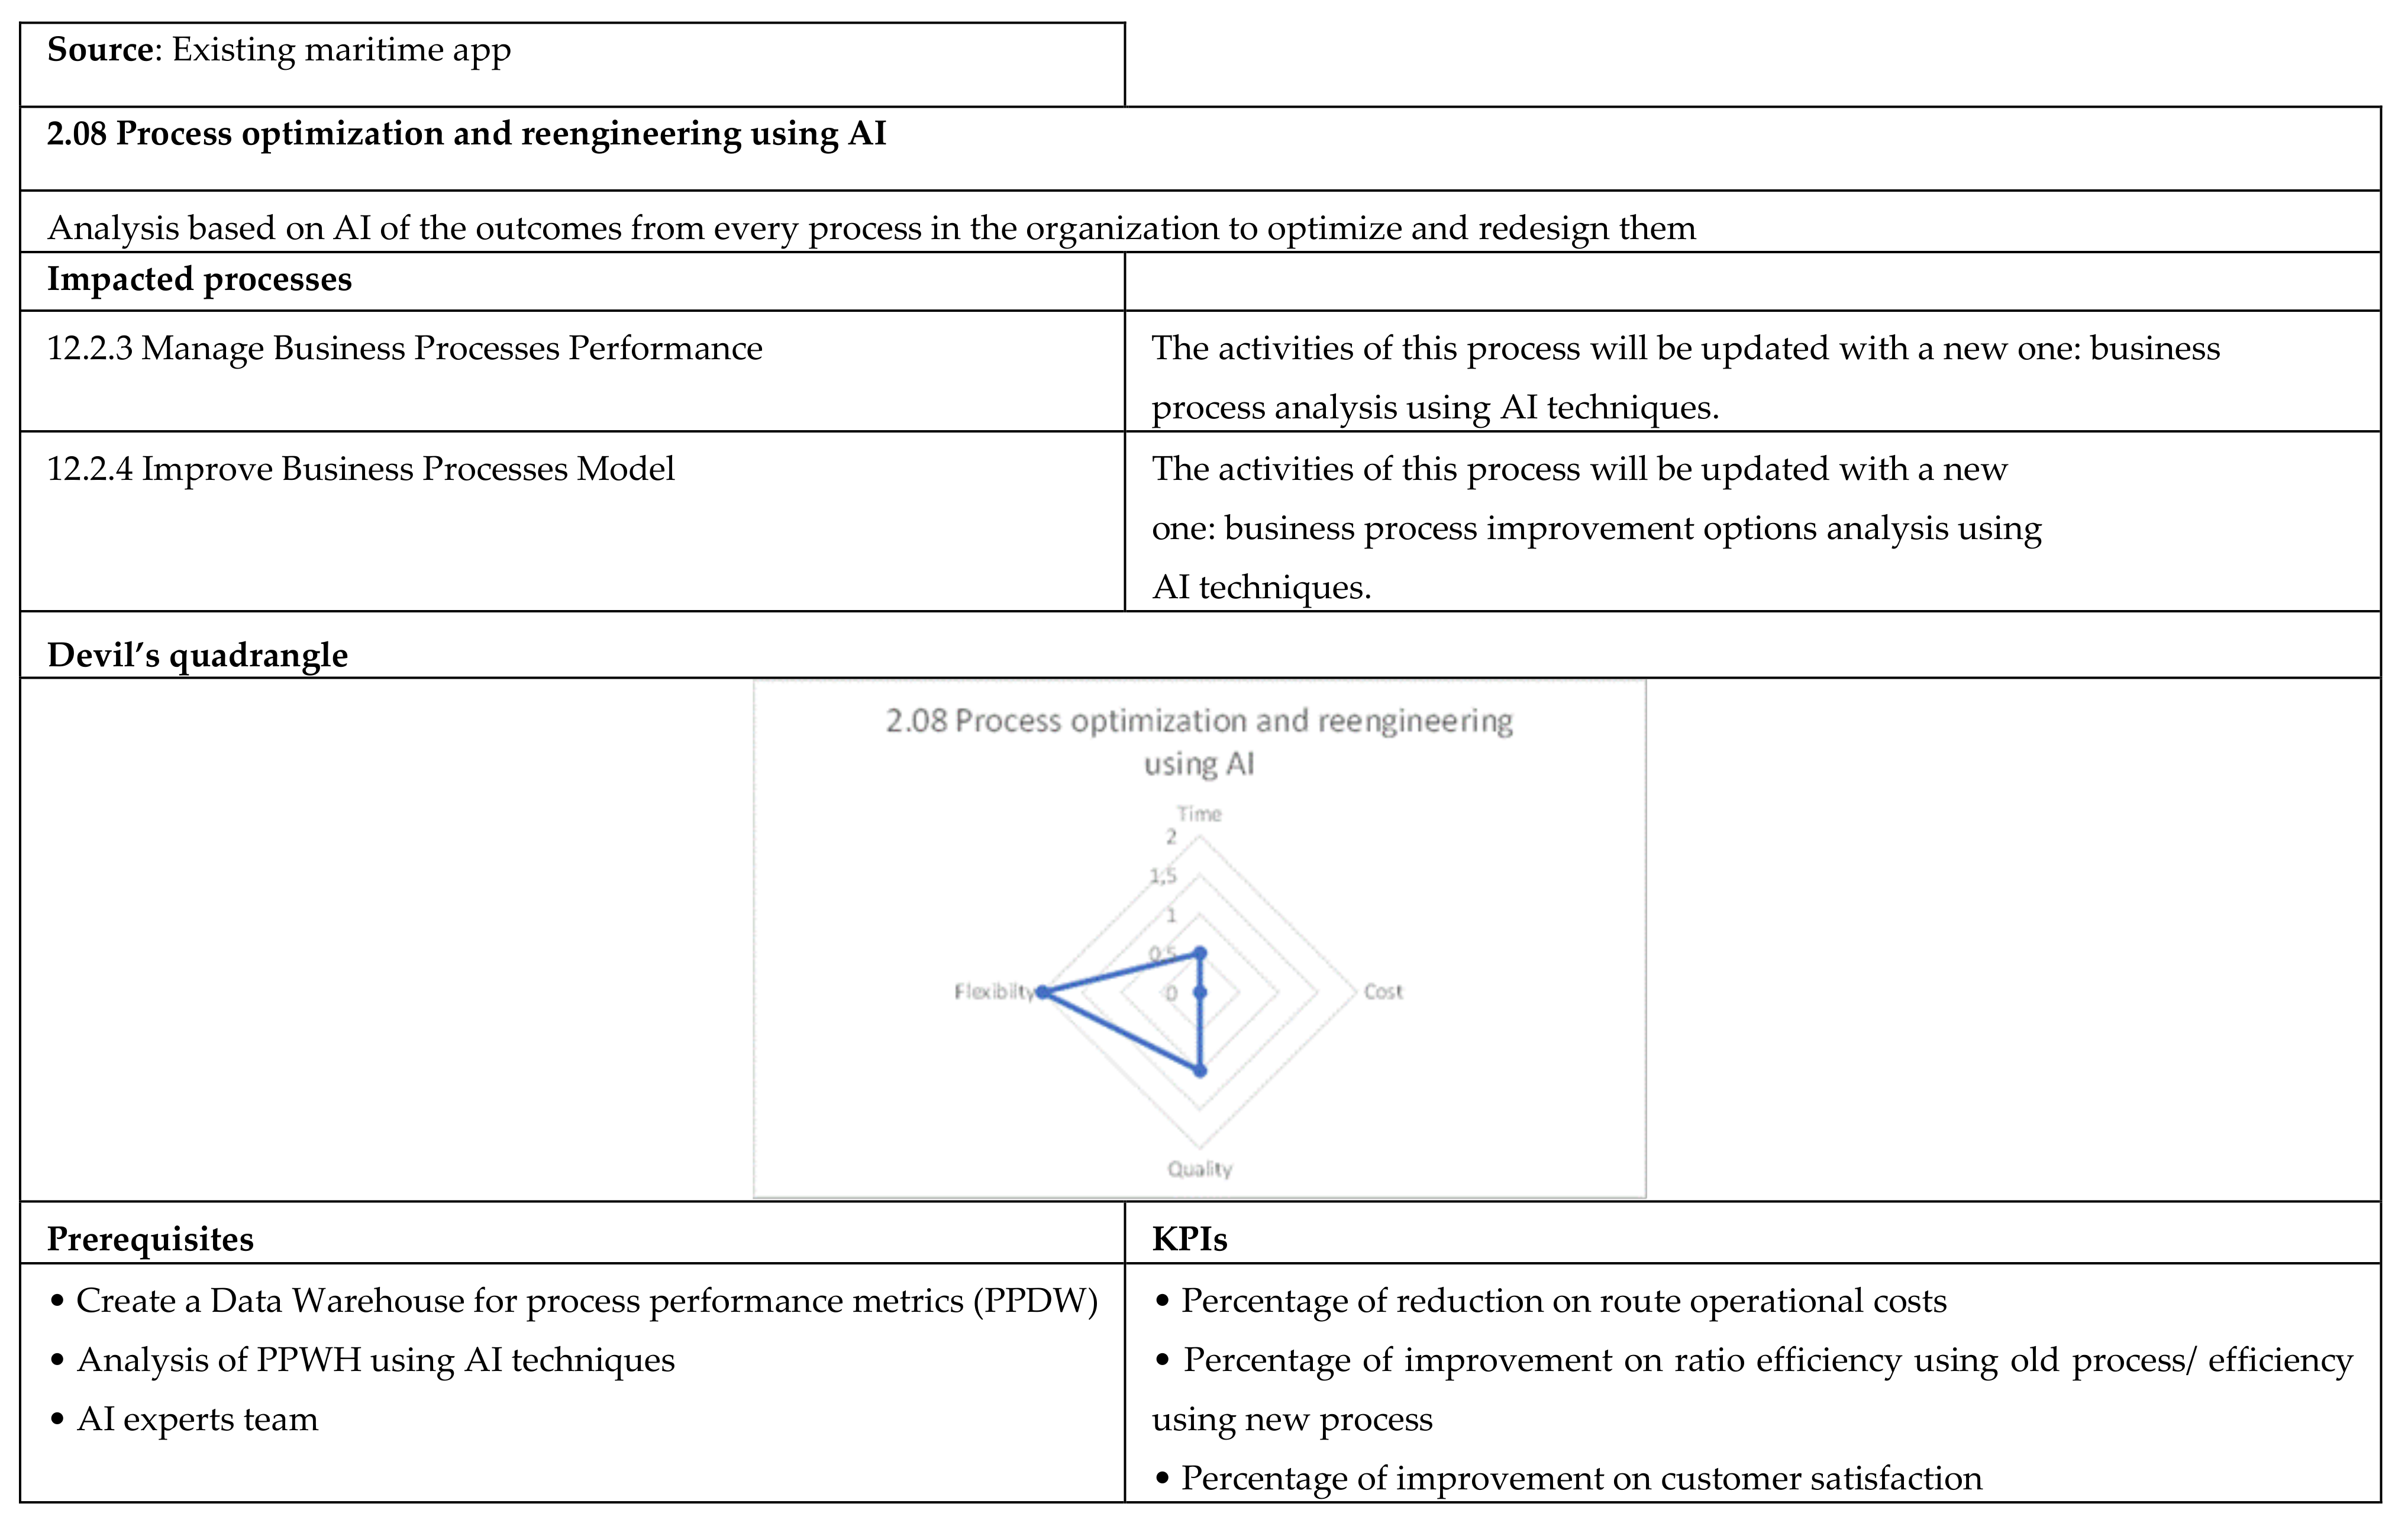
There are six new processes that need to be added to the business process model for different applications:
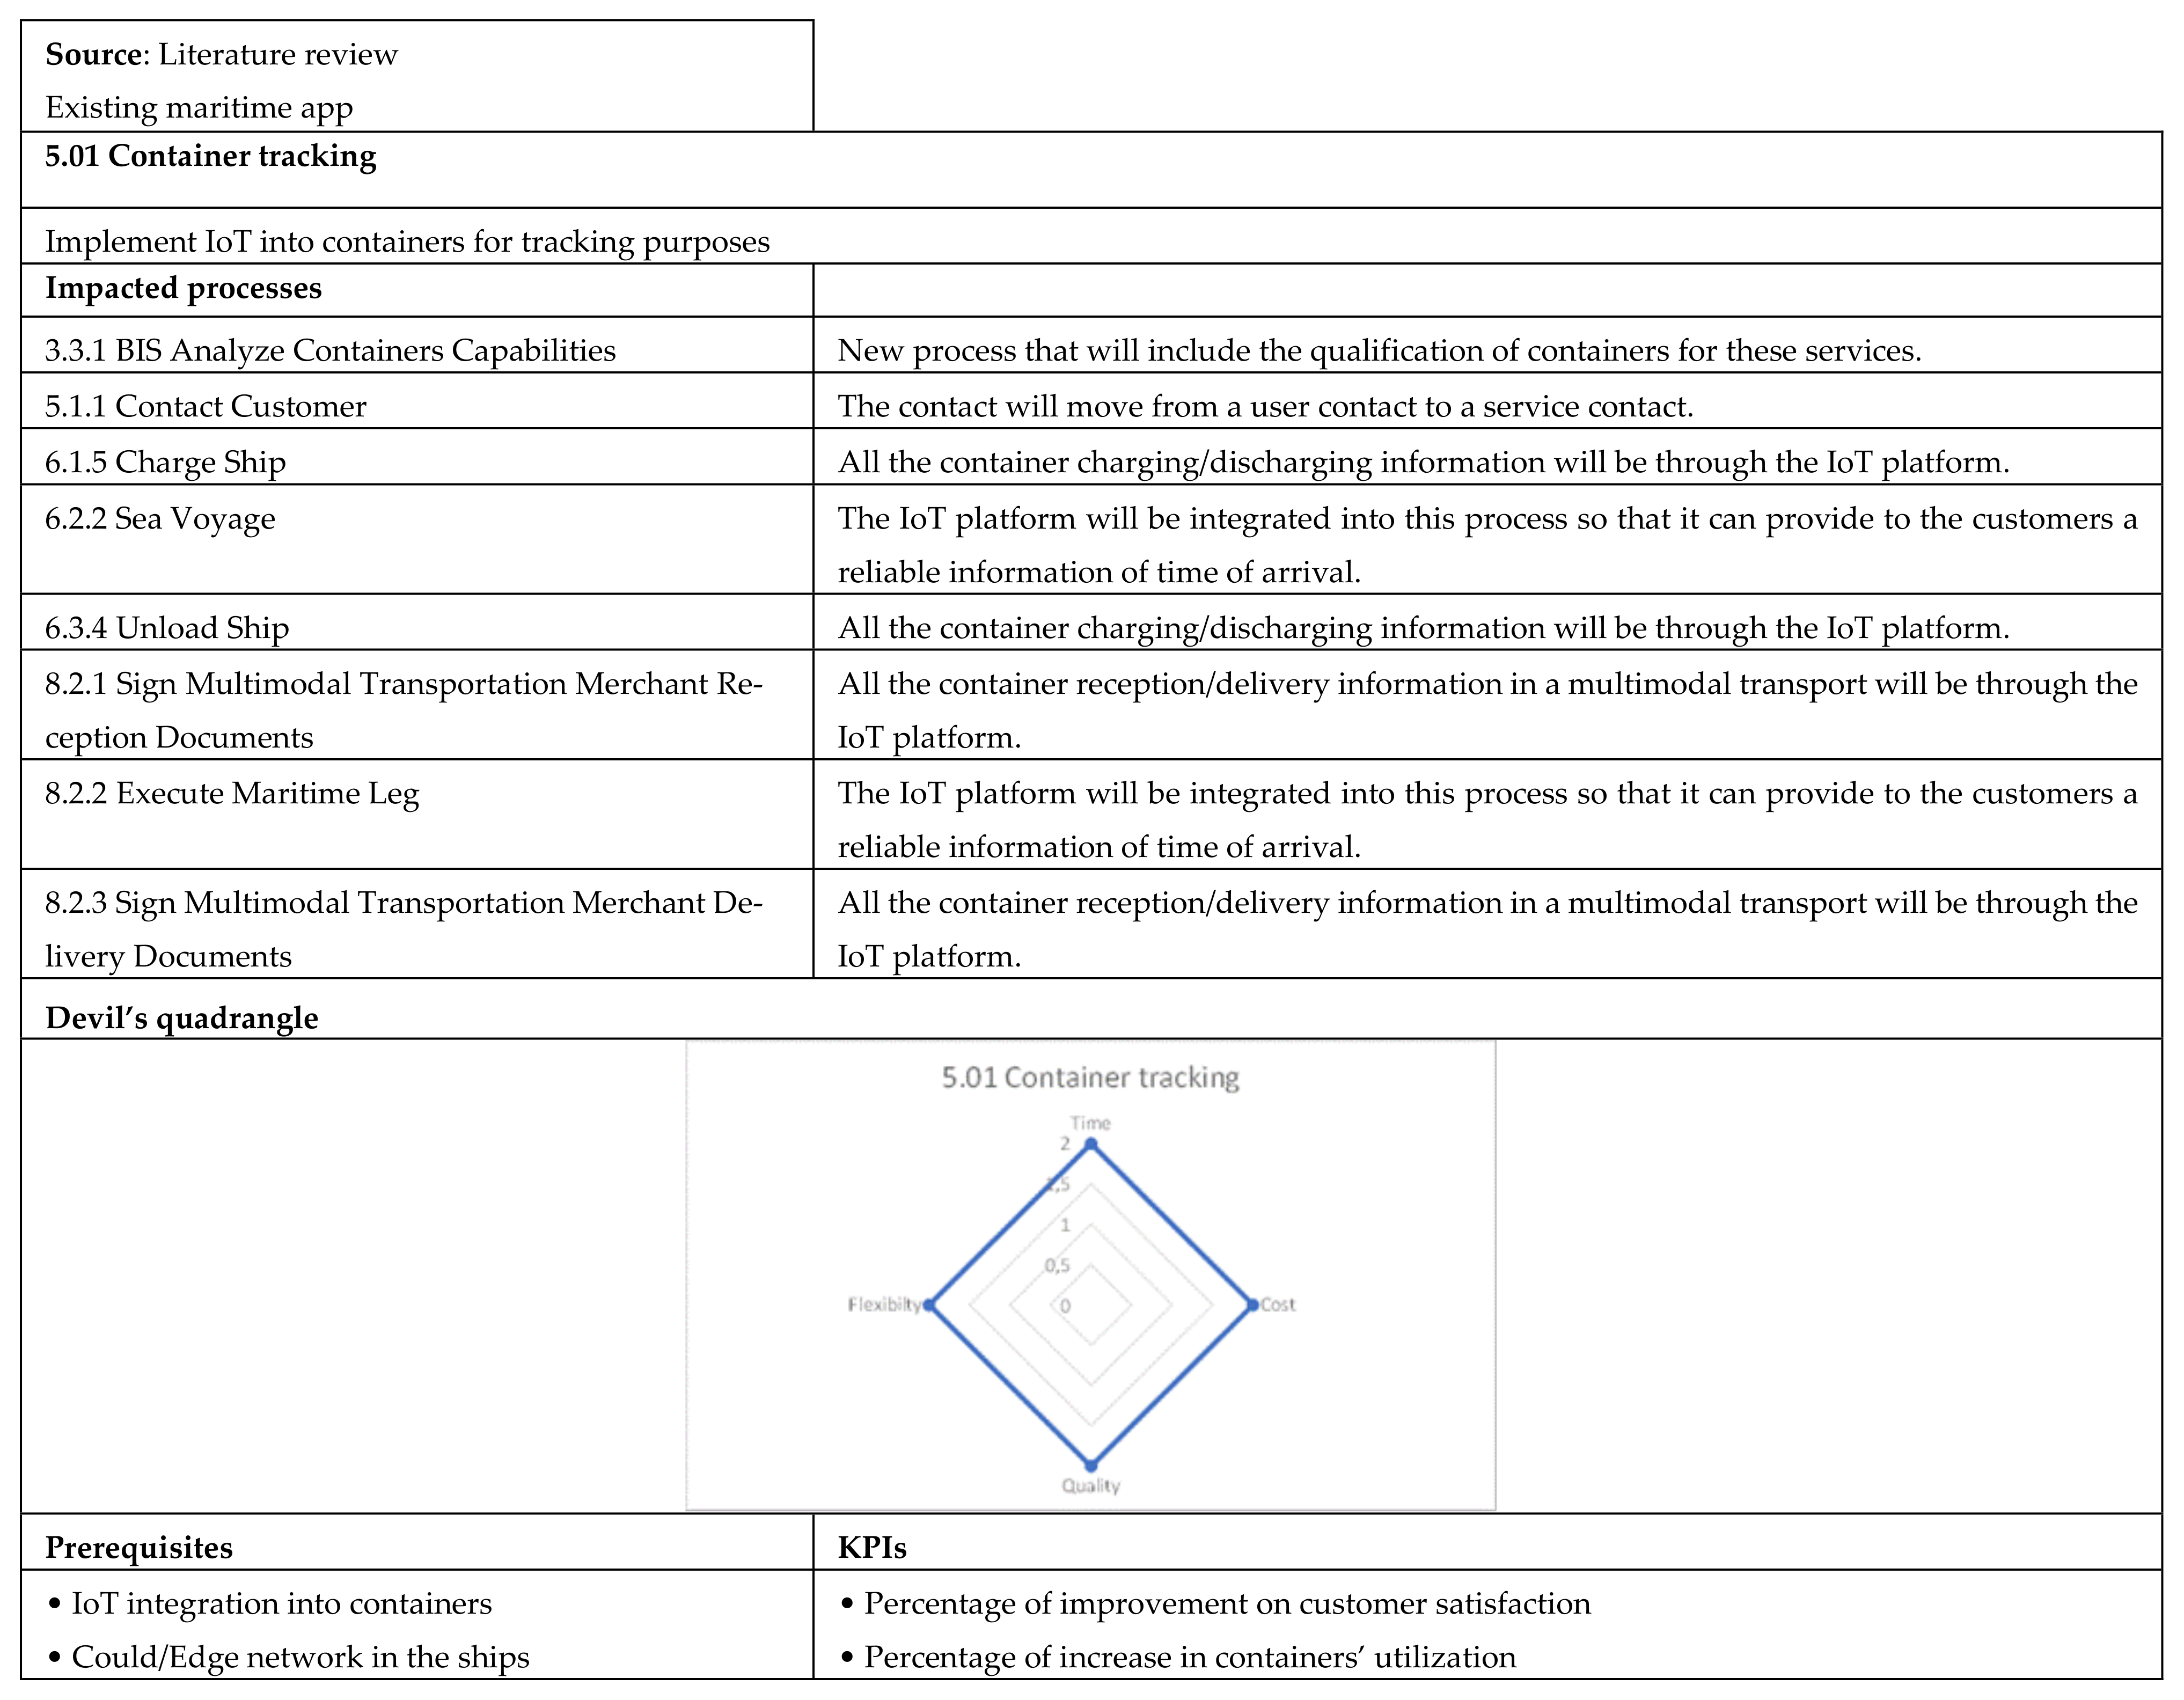
- 3.3.1 BIS analysis of containers’ capabilities. This process is added to the process group “3.3 Acquire/Rent Containers” for application “5.01 Container tracking”. The introduction of this application recommends a process to group the tasks and activities related with the different use of a container and the technological capabilities from it in an IoT environment.
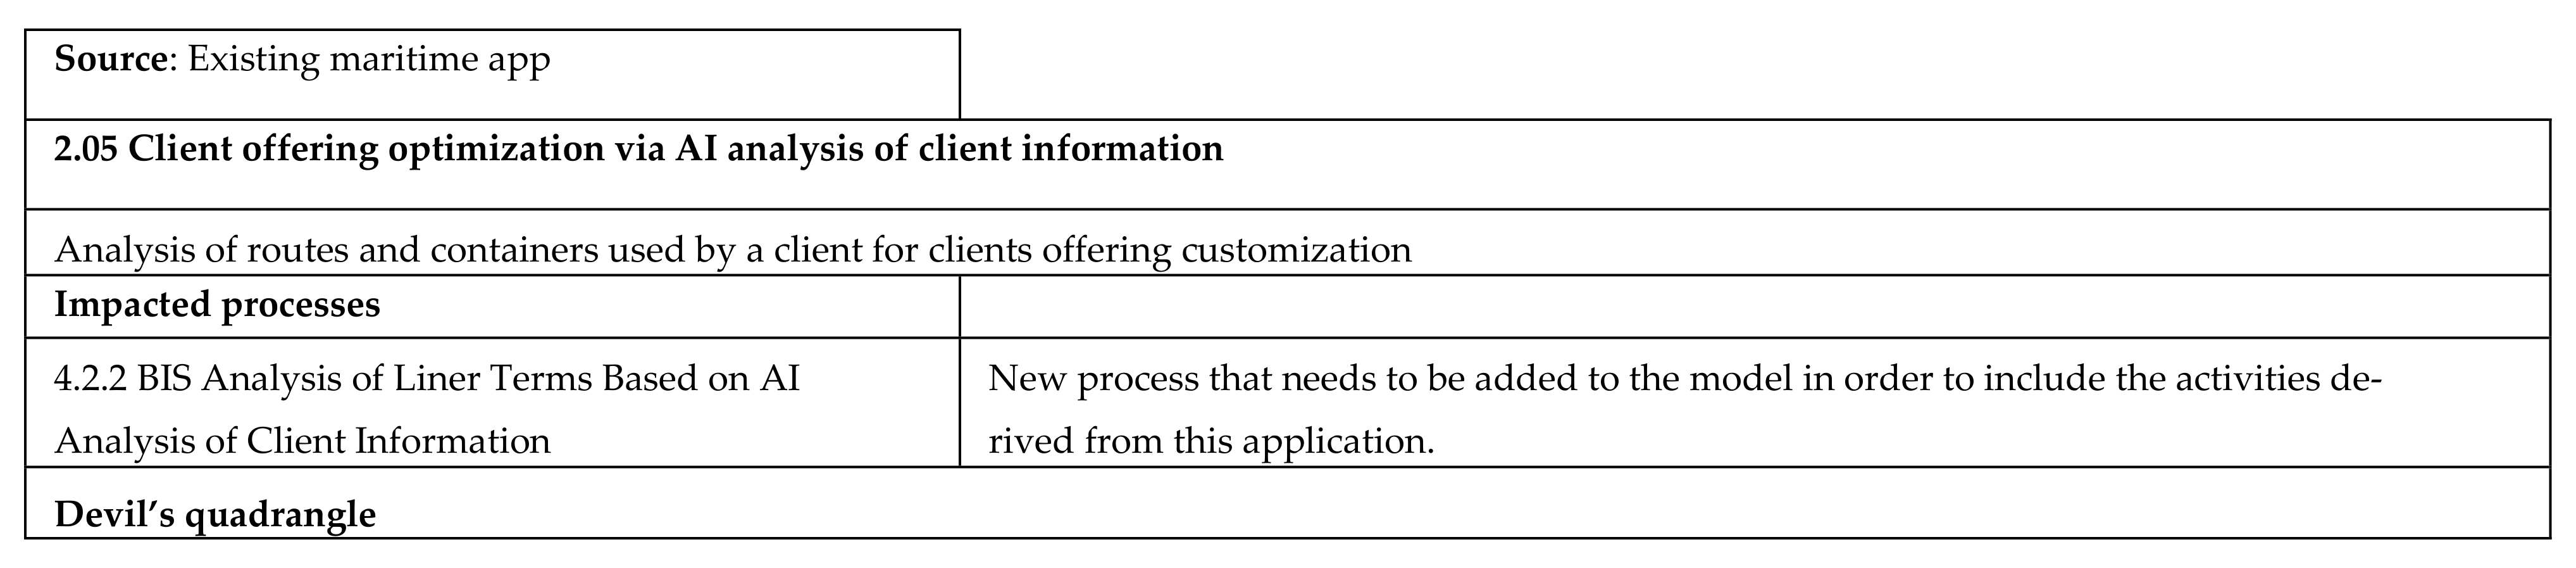
- 4.2.2 BIS analysis of liner terms based on AI analysis of client information. This process is added to process group “4.2 Analyze and Define Liner Terms” for application “2.05 Client offering optimization via AI analysis of client information”.
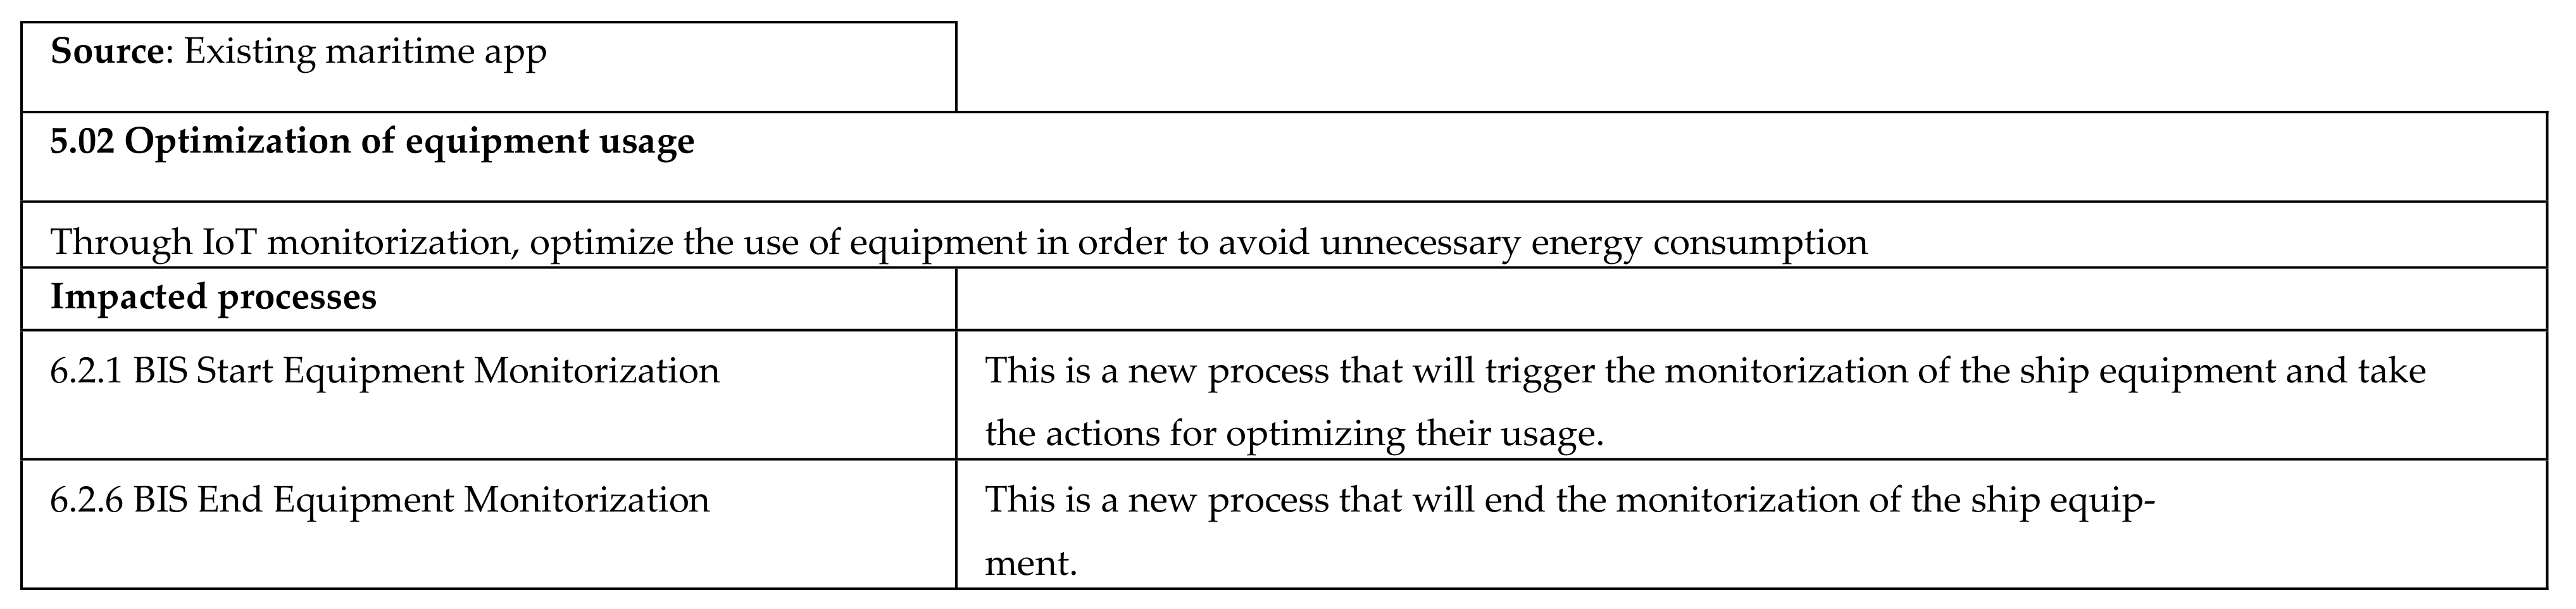
- 6.2.1 BIS start equipment monitorization. This process is added to process group “6.2 Depart, Sea Voyage and Berth” for application “5.02 Optimization of equipment usage”.
- 6.2.6 BIS end equipment monitorization. This process is also added to process group “6.2 Depart, Sea Voyage and Berth” for the same reason, the application “5.02 Optimization of equipment usage”.
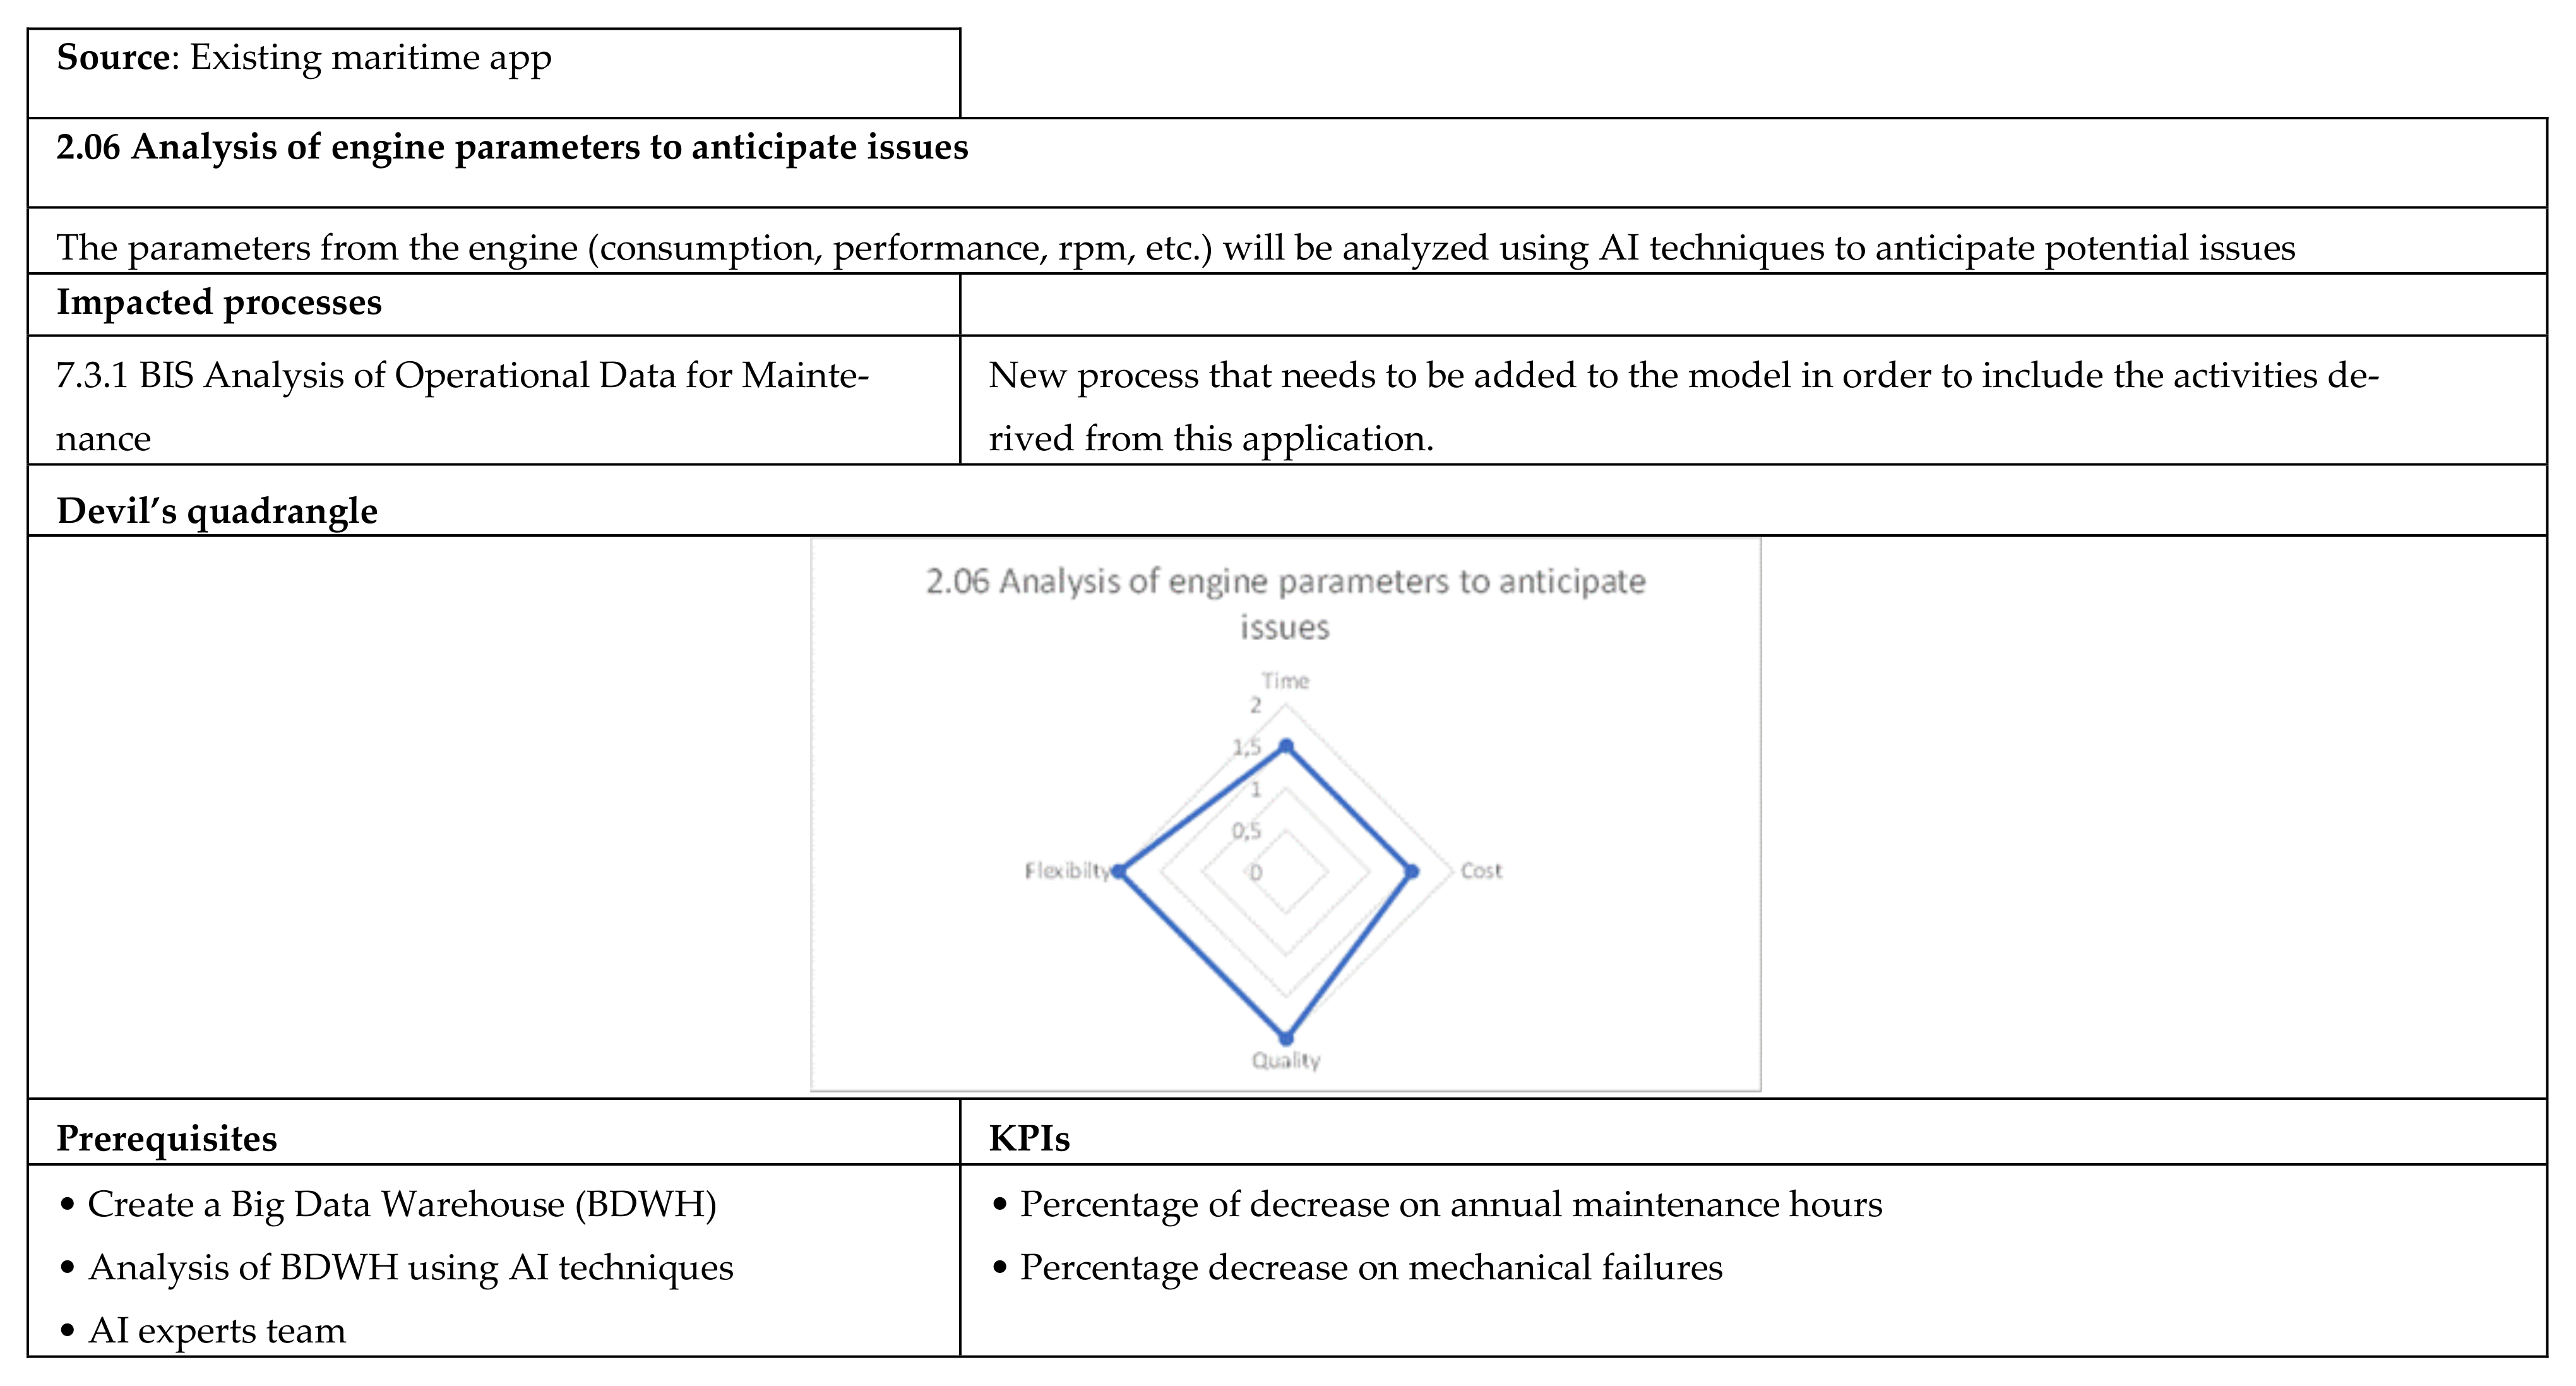
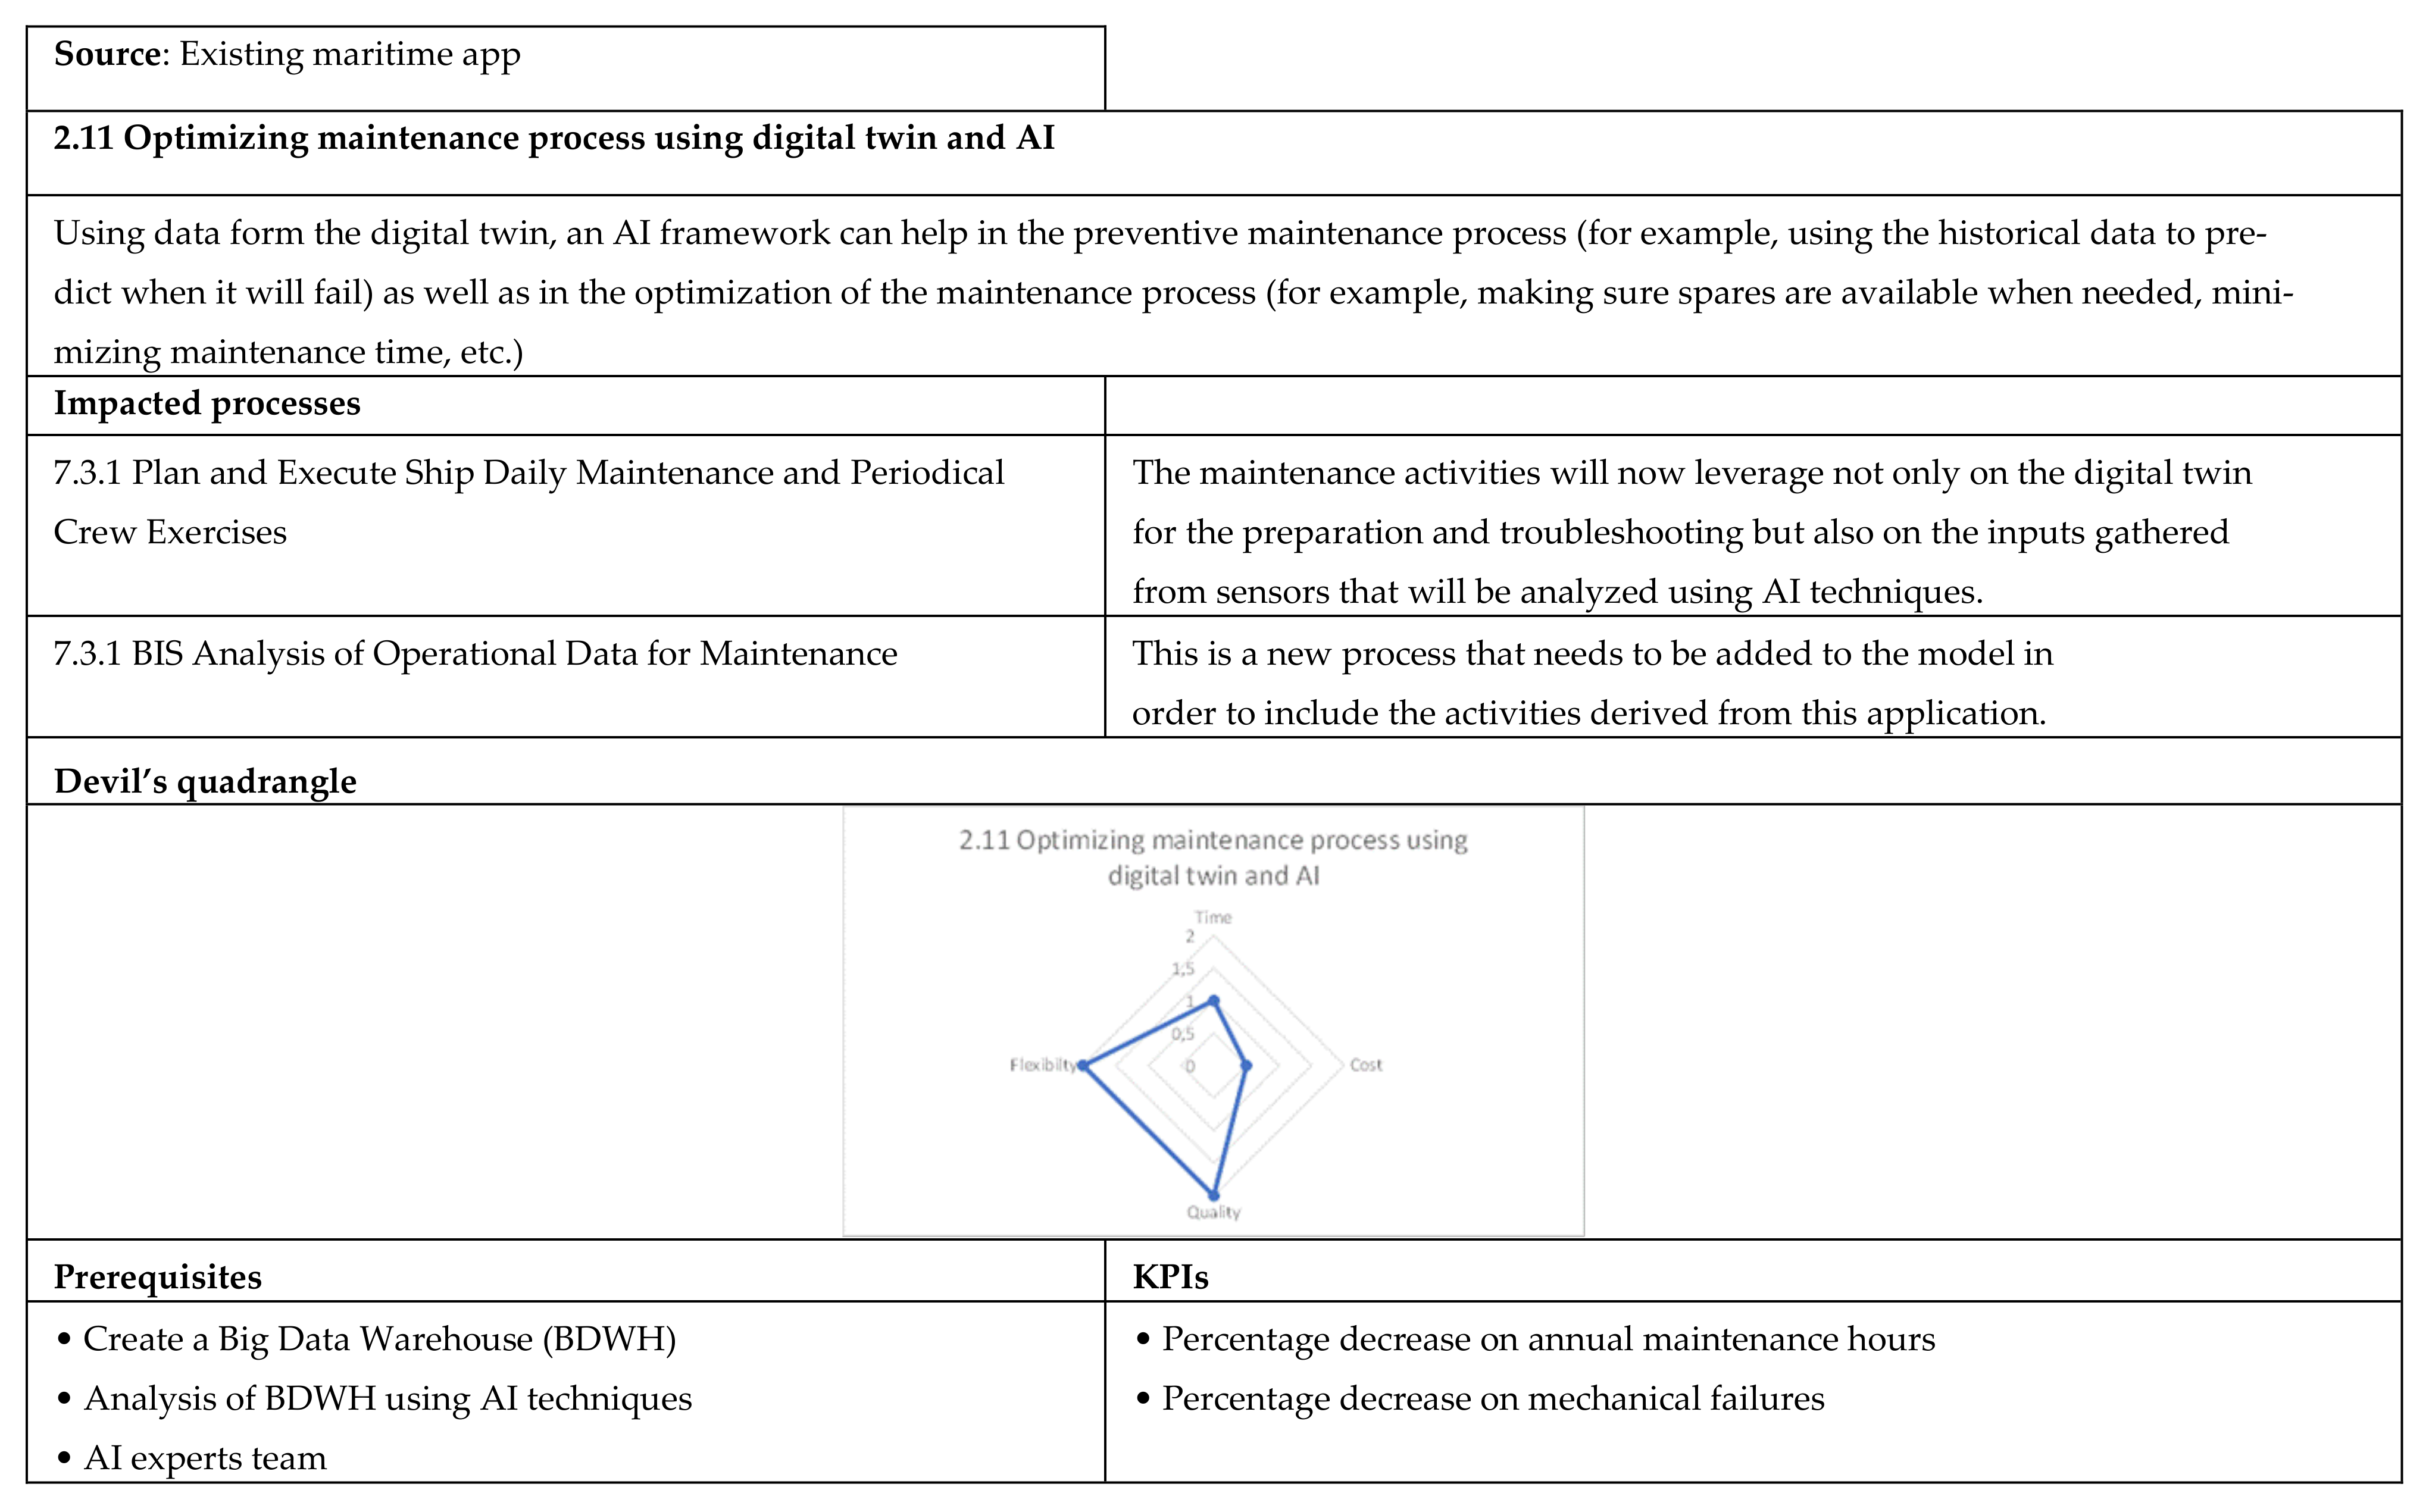
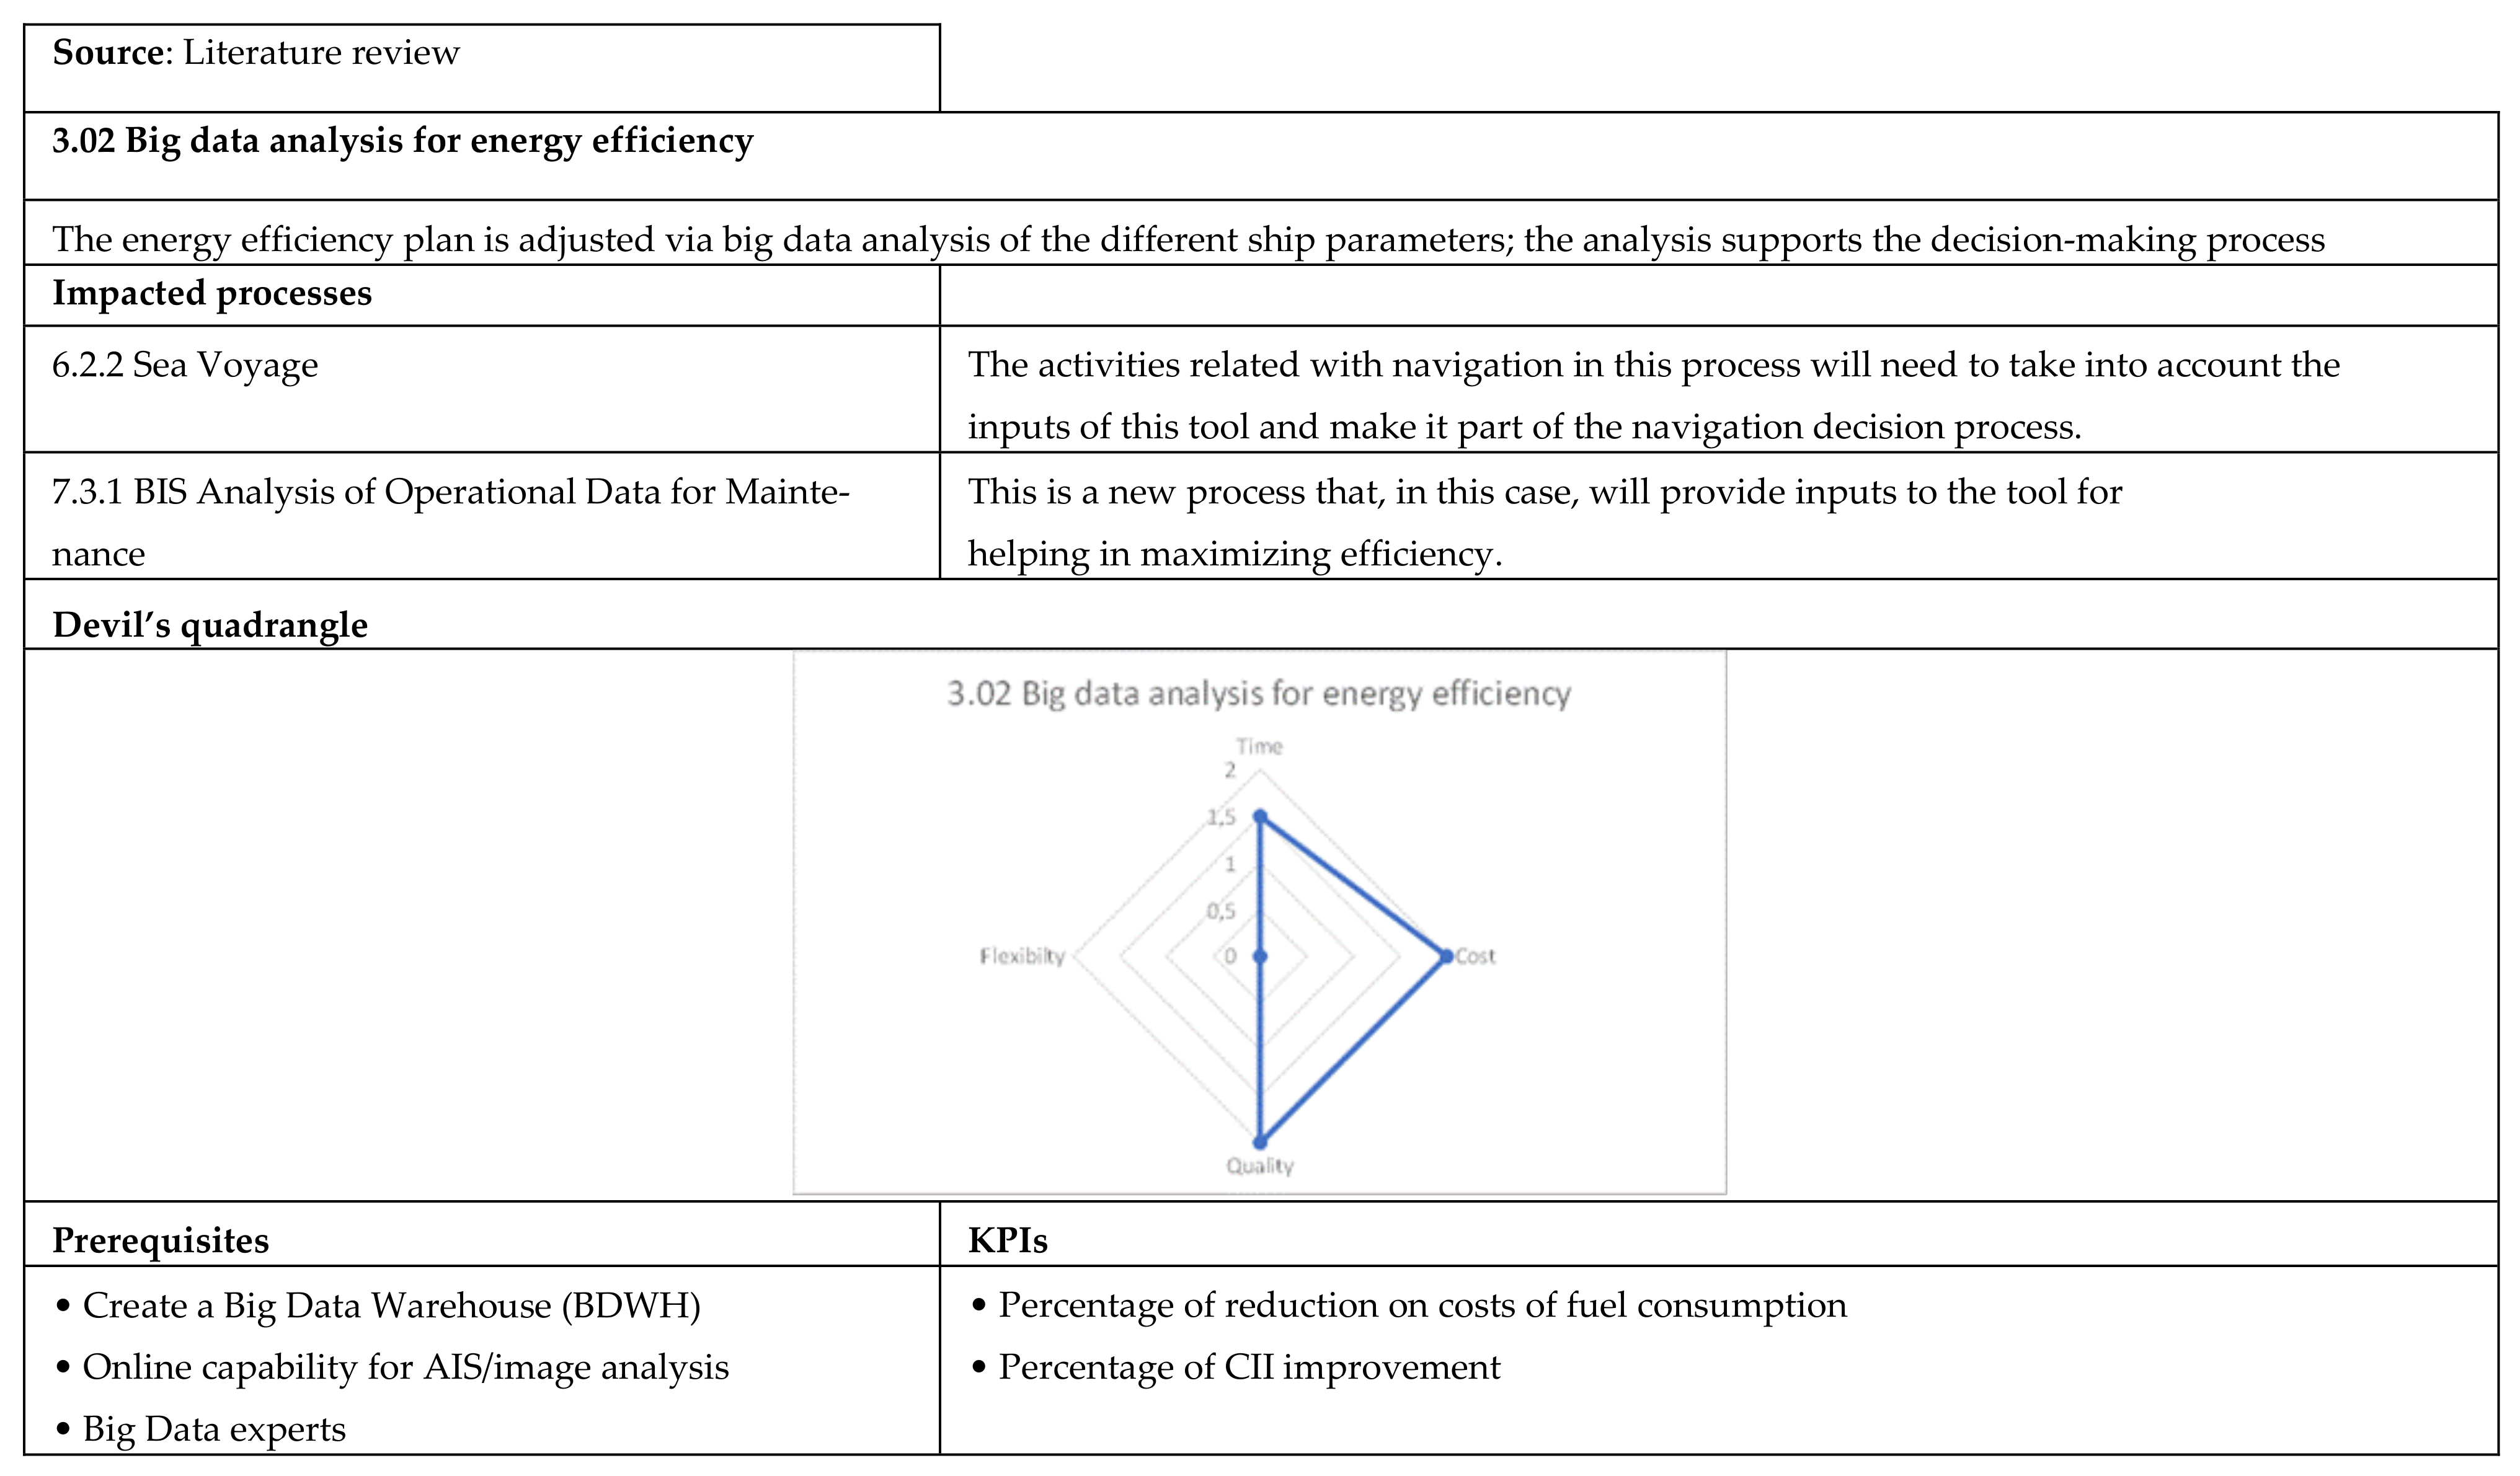
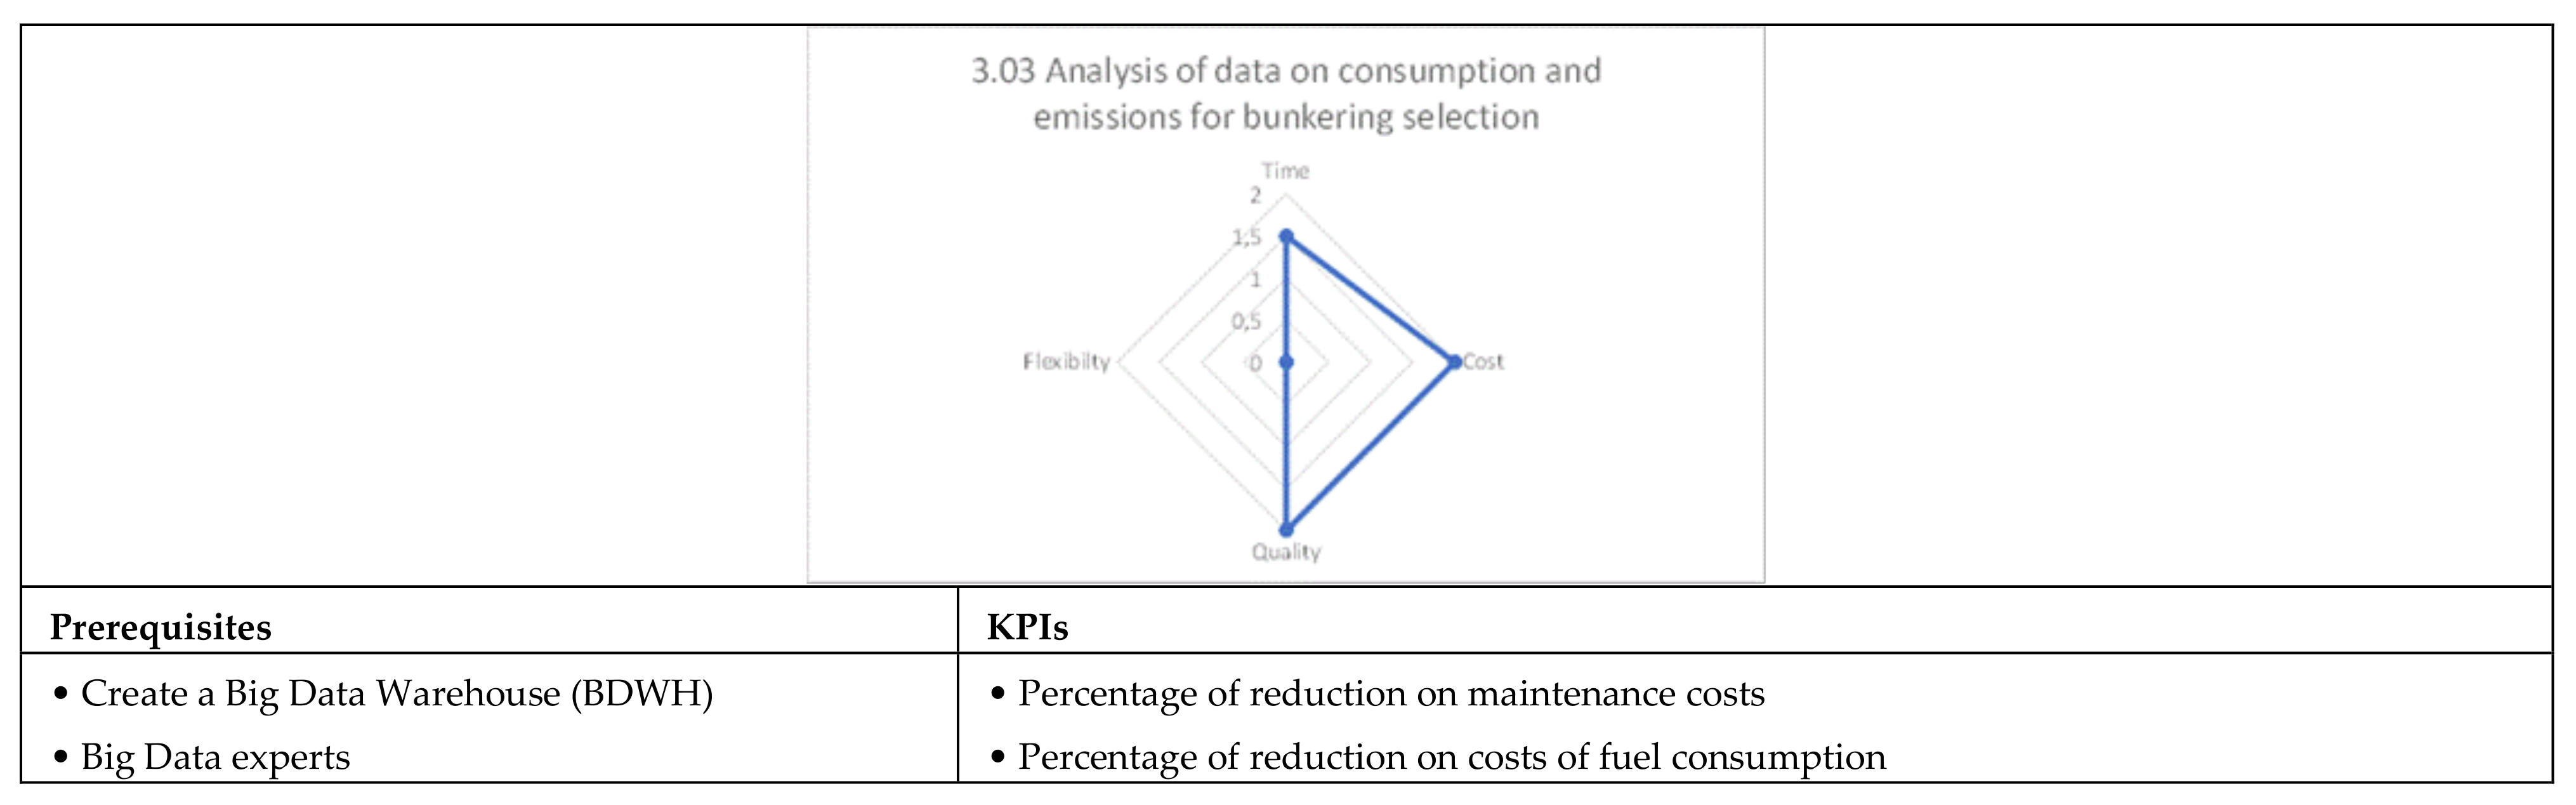
- 7.3.1 BIS analysis of operational data for maintenance. This process is also added to process group “7.3 Ship Maintenance” for applications “2.06 Analysis of engine parameters to anticipate issues”, “2.11 Optimizing maintenance process using digital twin and AI”, “2.22 Using AI to reduce emissions”, “3.02 Big data analysis for energy efficiency”, and “3.03 Analysis of data on consumption and emissions for bunkering selection”.
- 7.3.1 BIS capture and analysis of ship structure image. This process is added to process group “7.3 Ship Maintenance” for application “2.13 Analysis of ship structure images to anticipate issues”.
On the opposite side, there are three processes that will need to be decommissioned due to the introduction of different applications:
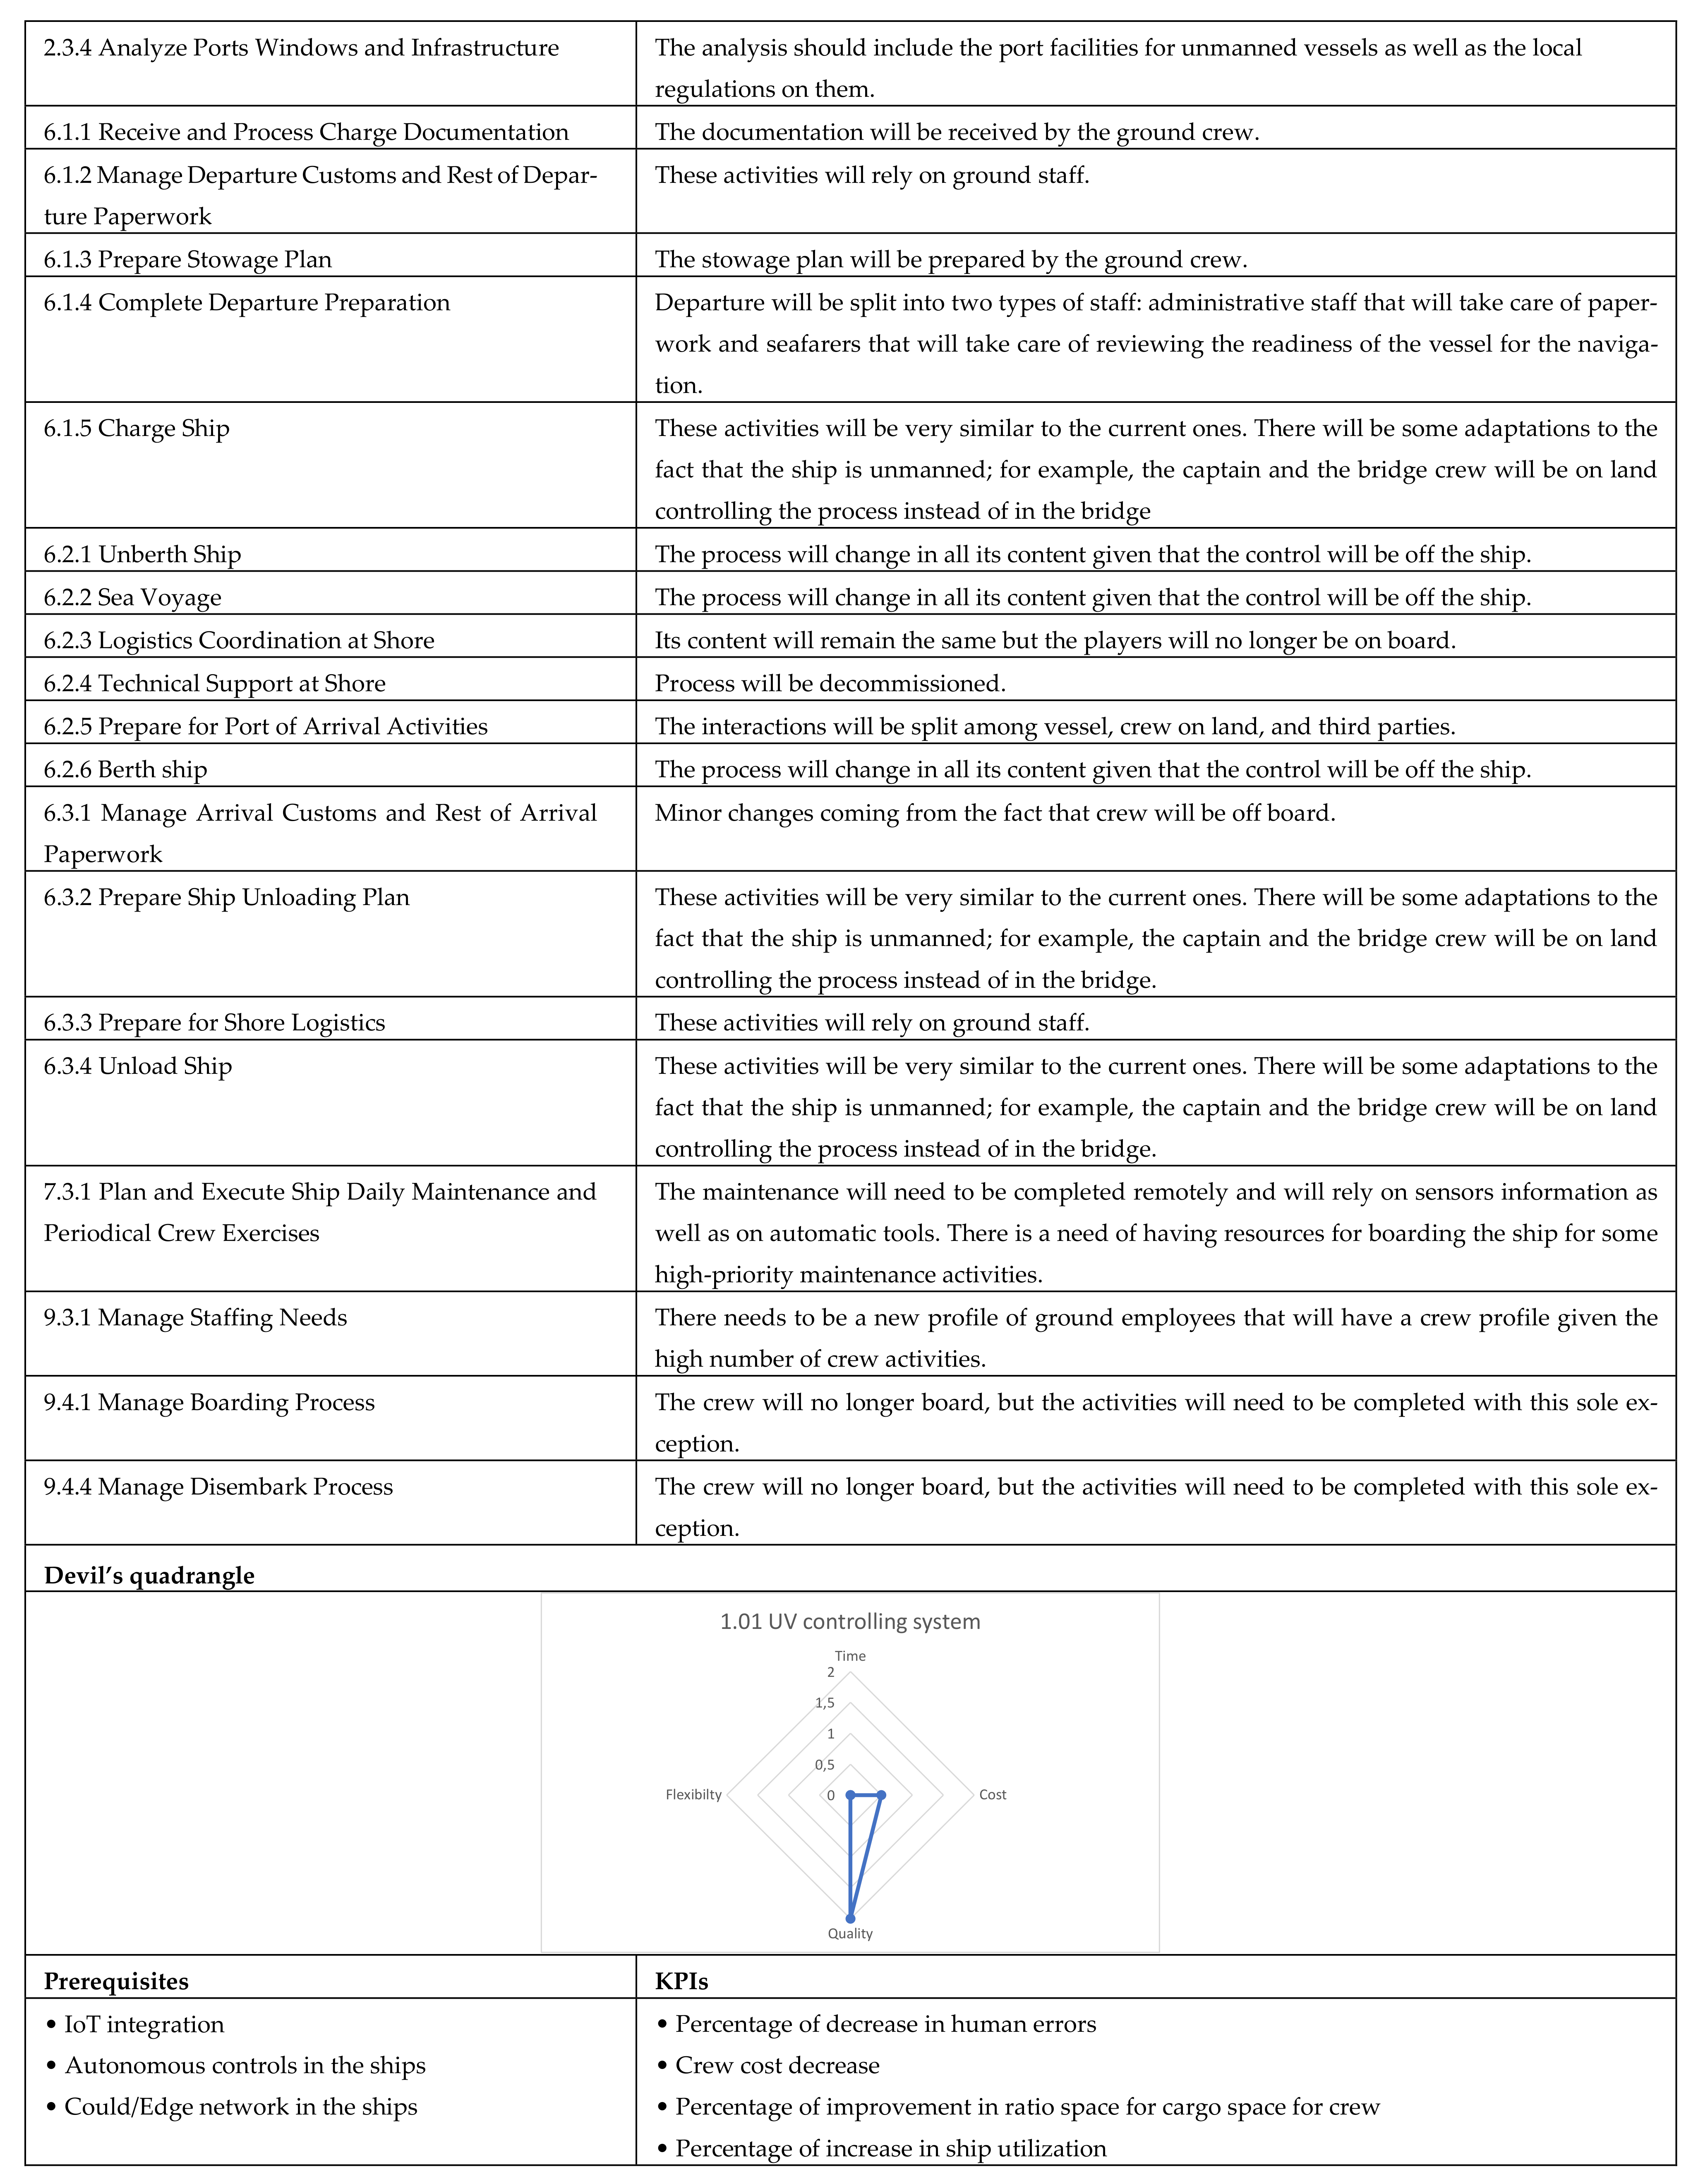
- 6.2.4 Technical support at shore; the introduction of applications “1.01 UV-controlling system” or “1.02 Autonomous vessels” makes it unnecessary.
- 11.5.2 Define development plan; the introduction of application “6.02 Use of SaaS via cloud” makes it unnecessary.
- 11.5.3 Develop and test solution for the same reason mentioned when talking of decommissioning process 11.5.2.
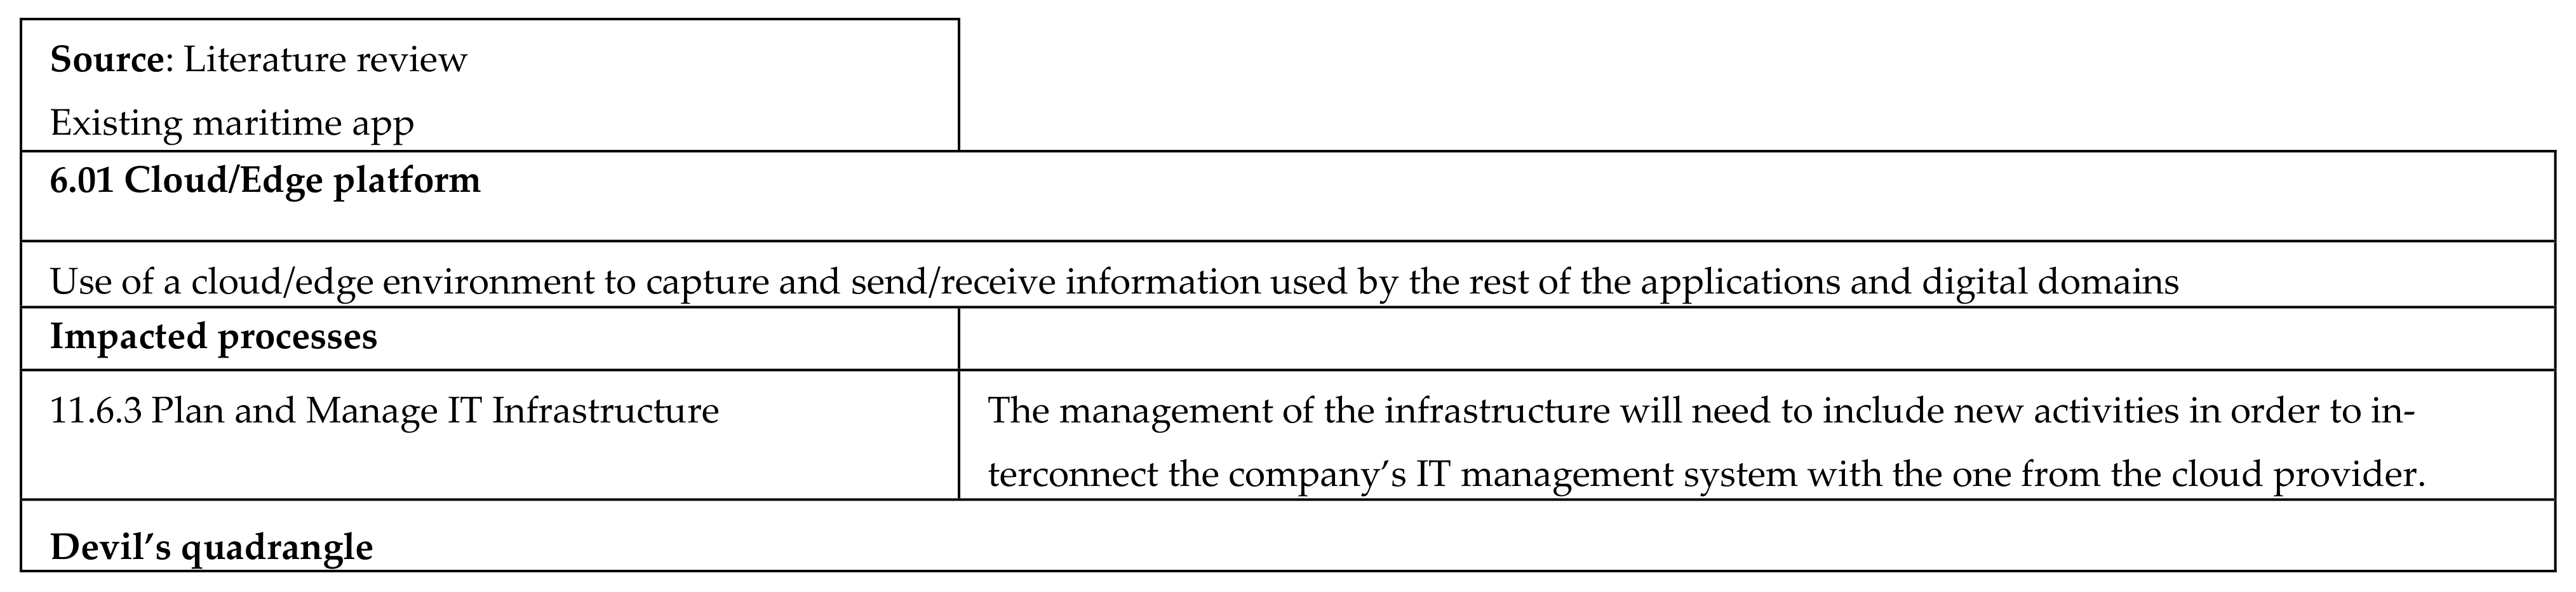
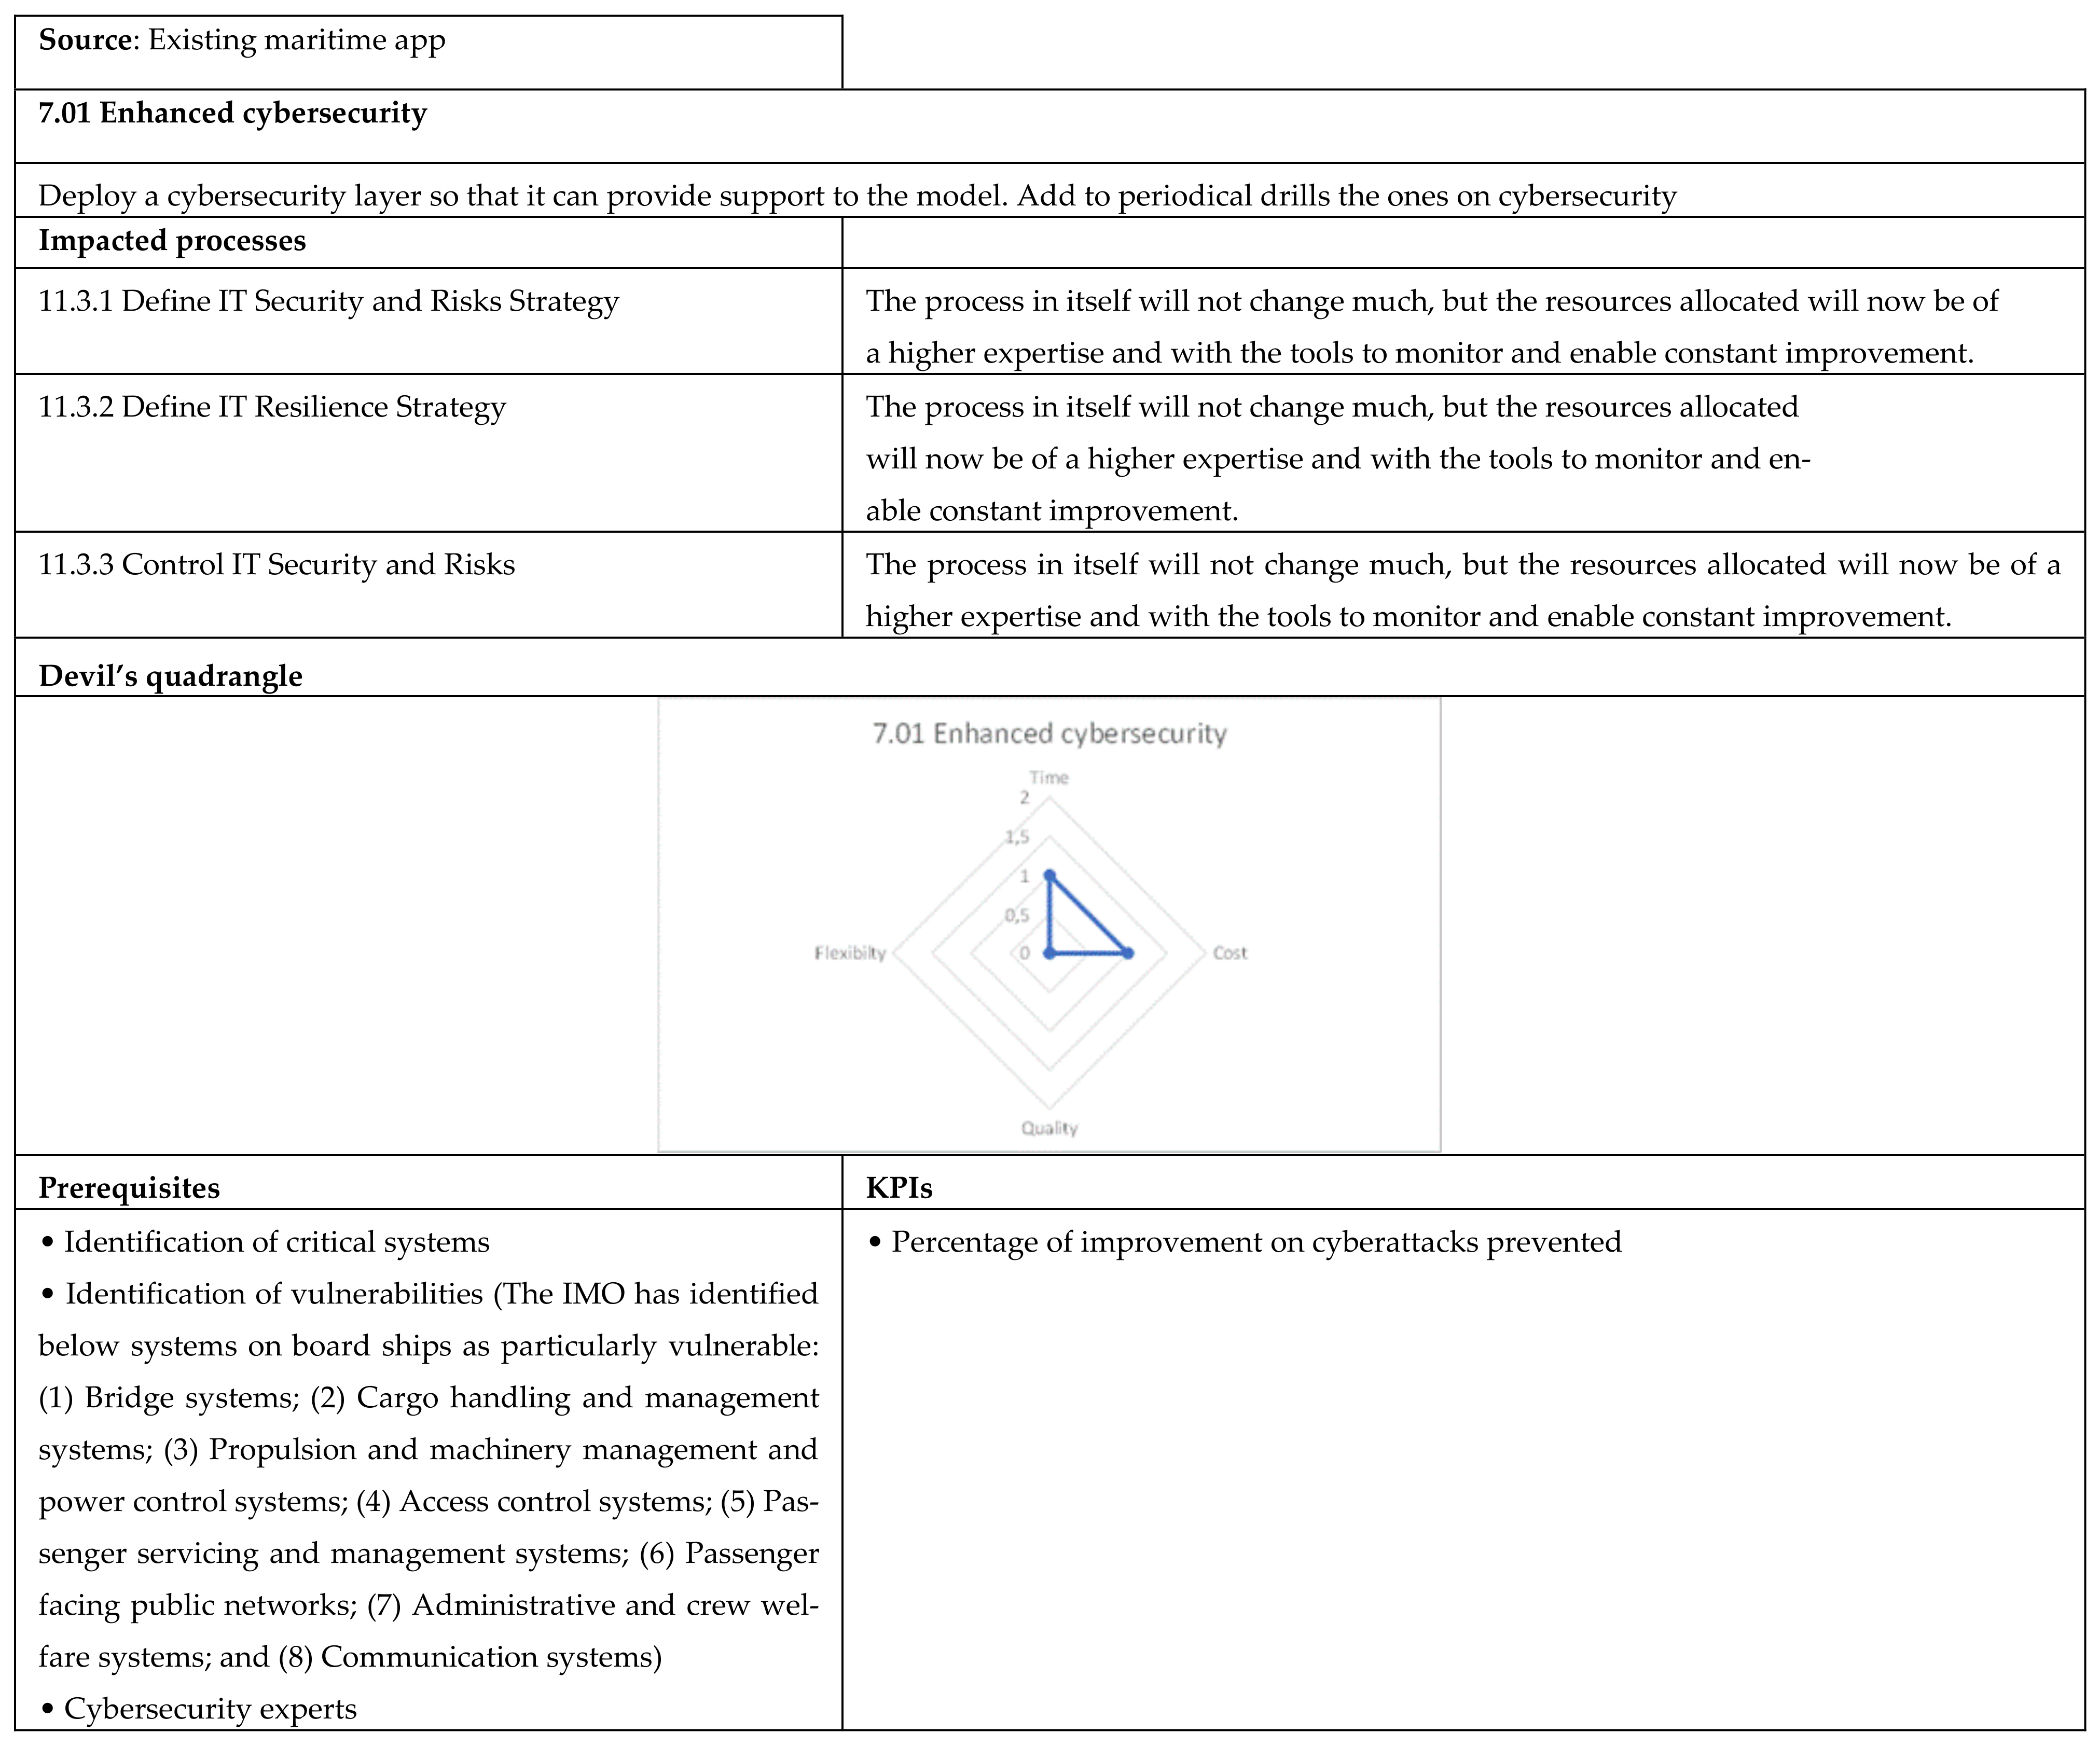
The total number of KPIs used is 51. These KPIs measure the performance of the introduction of the 46 digital applications; this means that on average, there is more than one KPI needed for measuring the performance of the introduction of one application, which is reasonable. Actually, there are only two applications that require only one KPI for tracking their performance: “6.01 Cloud/edge platform” and “7.01 Enhanced cybersecurity” can be measured using KPIs “Percentage of reduction of operational cost” and “Percentage of improvement on cyberattacks prevented”, respectively. These two applications tracked only with one KPI are the only ones that are service platforms for the entire company.
It has just been said that the majority of the applications are measured using more than one KPI; actually, the 46 applications required a total of 105 KPIs to measure their performance. Since the number of unique KPIs is 51, not 105, this means that many of them are used in more than one application. A total of 11 KPIs are used more than twice; they are used 53 times out of the mentioned 105 (Table 3), so 11 KPIs can measure more than 50% of what needs to be measured to quantify applications’ performance, which is a good number since with this relatively small number of KPIs, a company can track most of their improvements coming from all the digital applications.
Section 2 explained how the impact of the introduction of any of these applications in the BPMo has been quantified using the four performance dimensions for processes: Costs, Time, Quality, and Flexibility. Applications have been grouped into three tertiles in order to analyze the results of this quantified impact. The three tertiles are not always equal in size, since being strict on the balance between the three tertiles would have forced the separation in different tertiles of applications that have the same value on a performance dimension. This happens since there are performance dimensions such as costs or time that are made of two sub-dimensions (see Section 2); and the consolidated impact score is calculated from the four performance dimensions.
Table 4 contains the applications that are in the top tertile applying that evaluation.
Not surprisingly, application “5.01 Container tracking” is leading the score given the following:
- Regarding costs, it is not too expensive to implement, and the return of investment is high, since it enhances containers’ delivery process.
- Looking at time, it is also optimal in terms of implementation time (there are many market applications for a quick implementation), and it saves considerable time for tracking the containers.
- The quality of the process increases as the applications are error-prone compared with the manual process.
- The flexibility of the affected processes increases considerably compared to the manual tracking.
On the other side of the list in Table 5, the applications that are in the bottom tertile can be found.
The applications from Table 5 do not necessarily fall into applications that should not be implemented or that should be discarded. What these 15 applications from Table 5 have in common is that they are the lowest when compared with the 46 applications; this should not prevent companies from the implementation of any of them, it is just that they need to know these have more costs or require more time for their deployment and for benefits realization. Actually, there are two of them that are service platforms for the rest: “6.01 Cloud/Edge platform” and “7.01 Enhanced cybersecurity”.
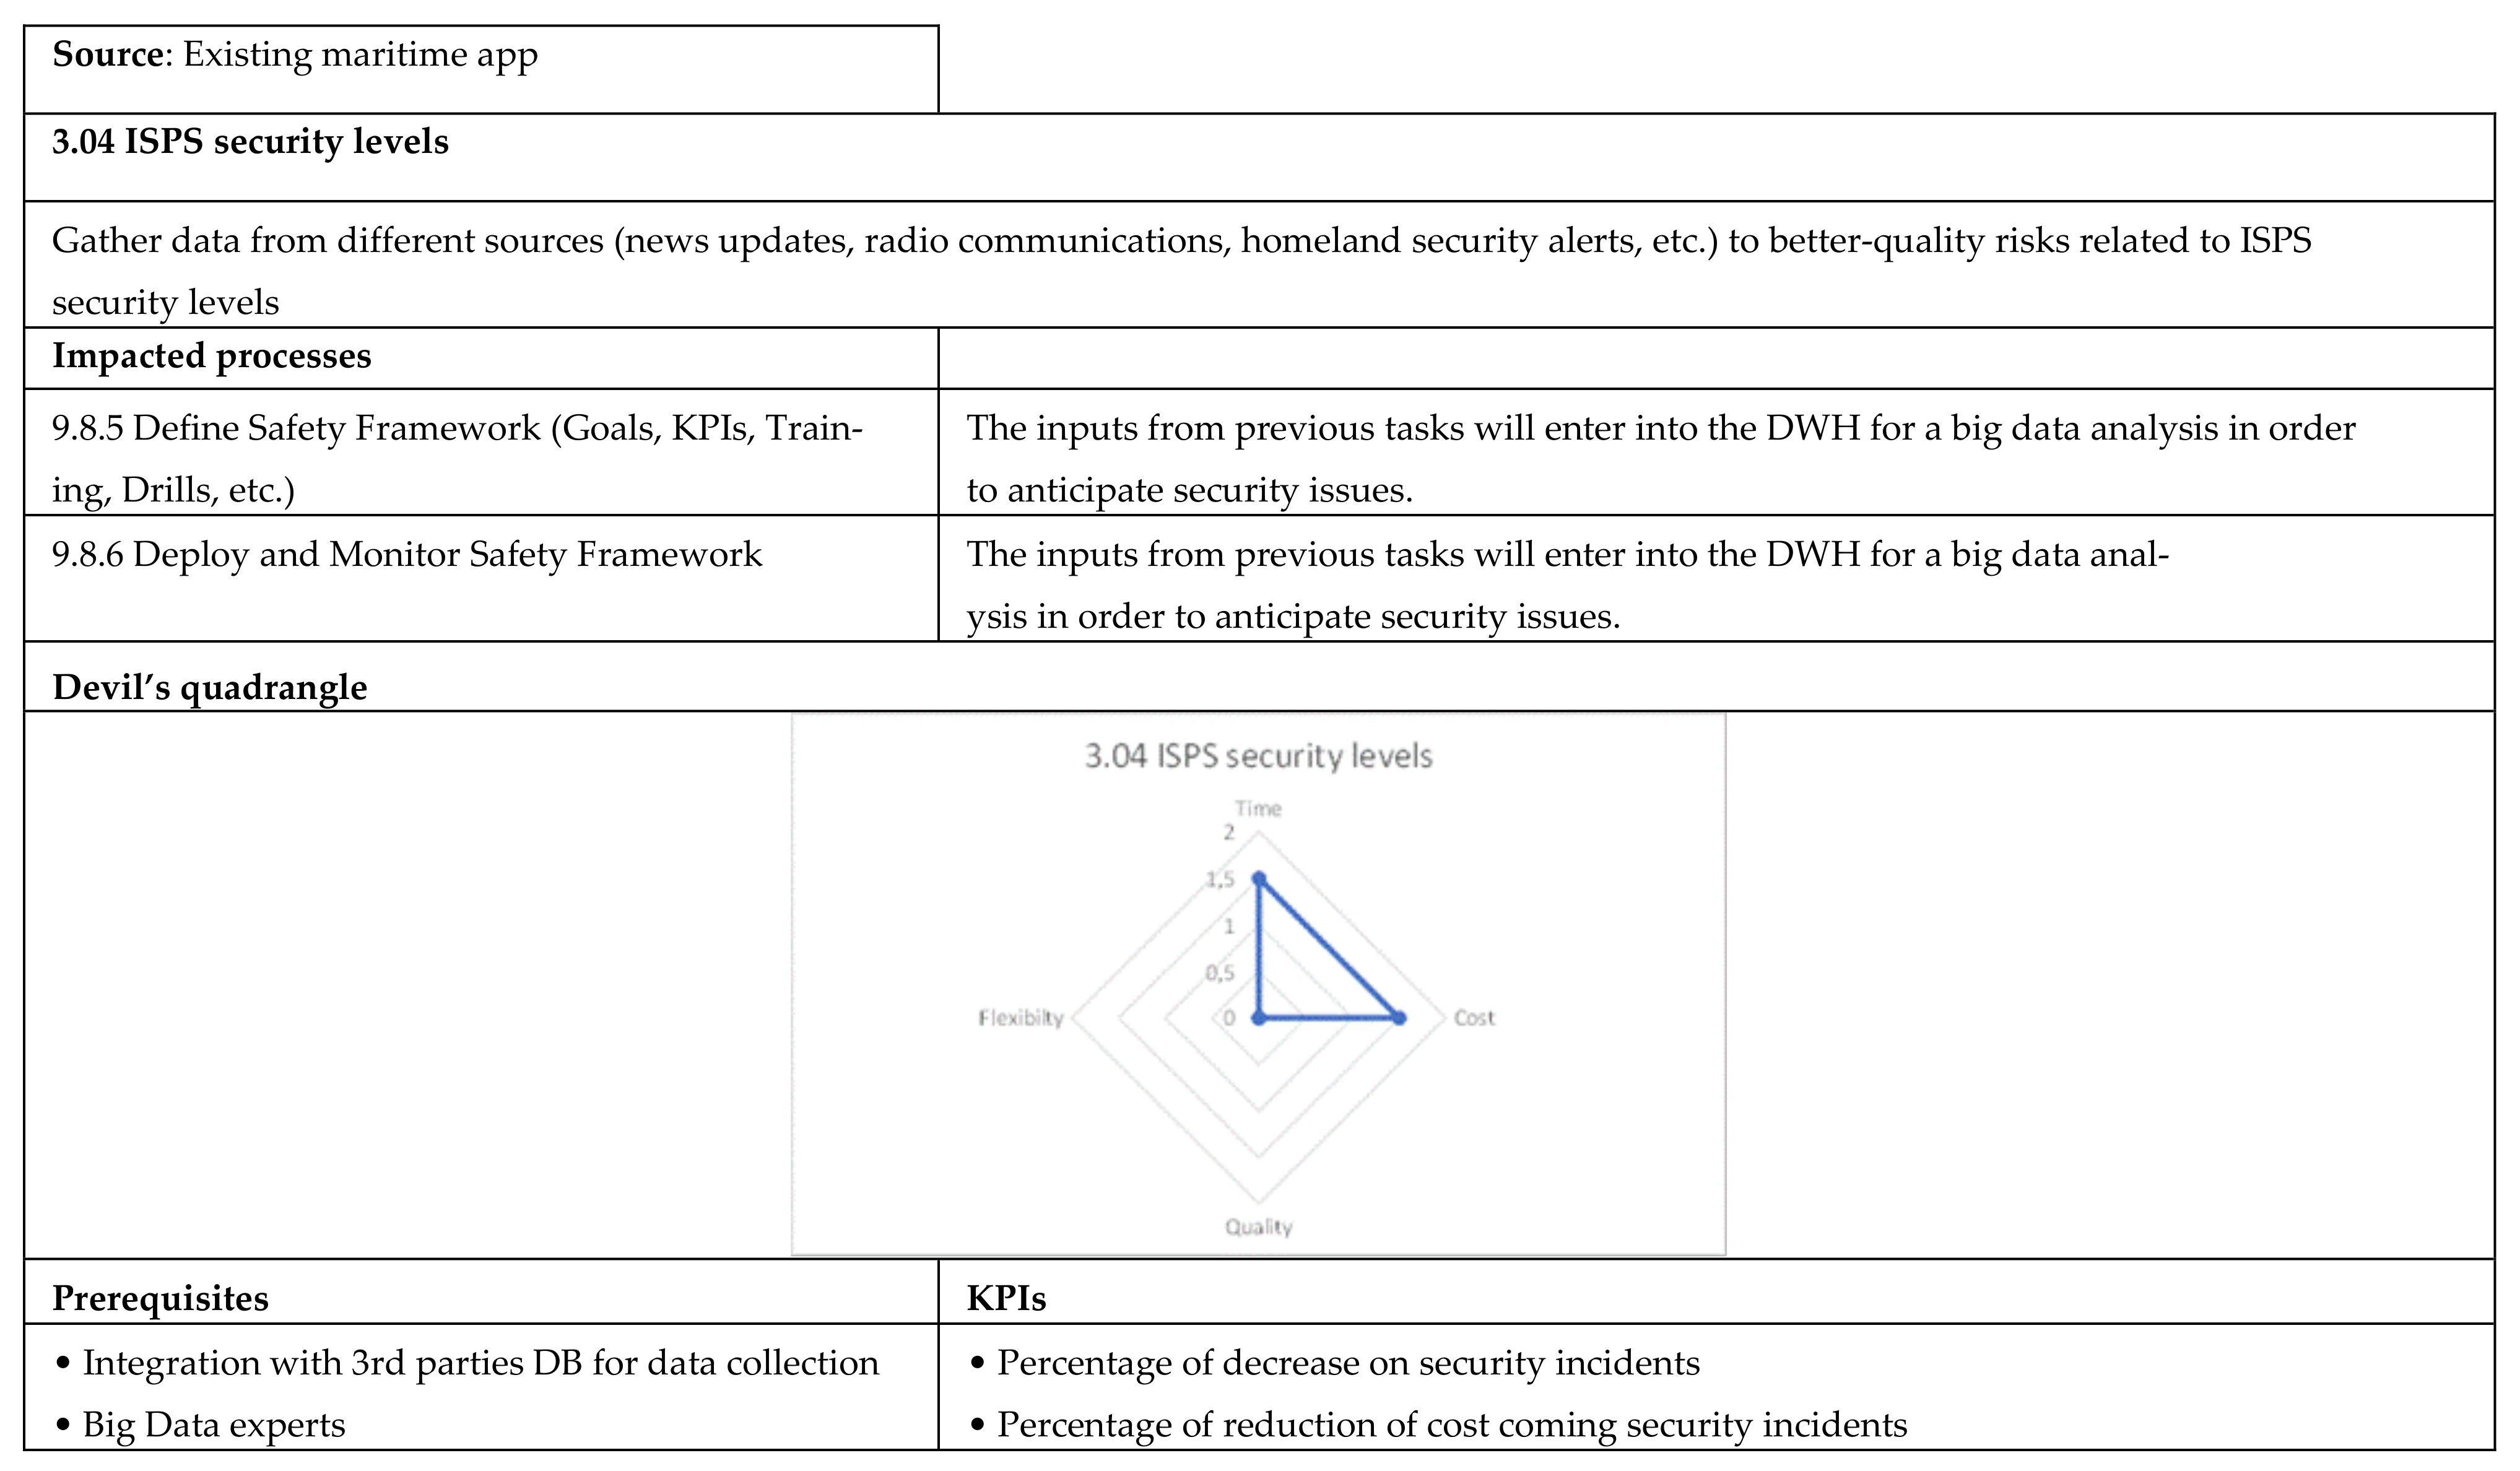
The analysis can be taken to a level below the ones conducted so far by looking at the results obtained in each performance dimension. When looking at the list of top applications on time performance dimension (Table 6), there is one application that is top when looking at time performance but is not only not included in the top list for consolidated impact but is in the bottom side, so it is included in Table 5: it is “3.04 ISPS security levels”. The reason is that this application does not increase substantially the flexibility or the quality of the affected processes compared with the rest of the 46 applications.
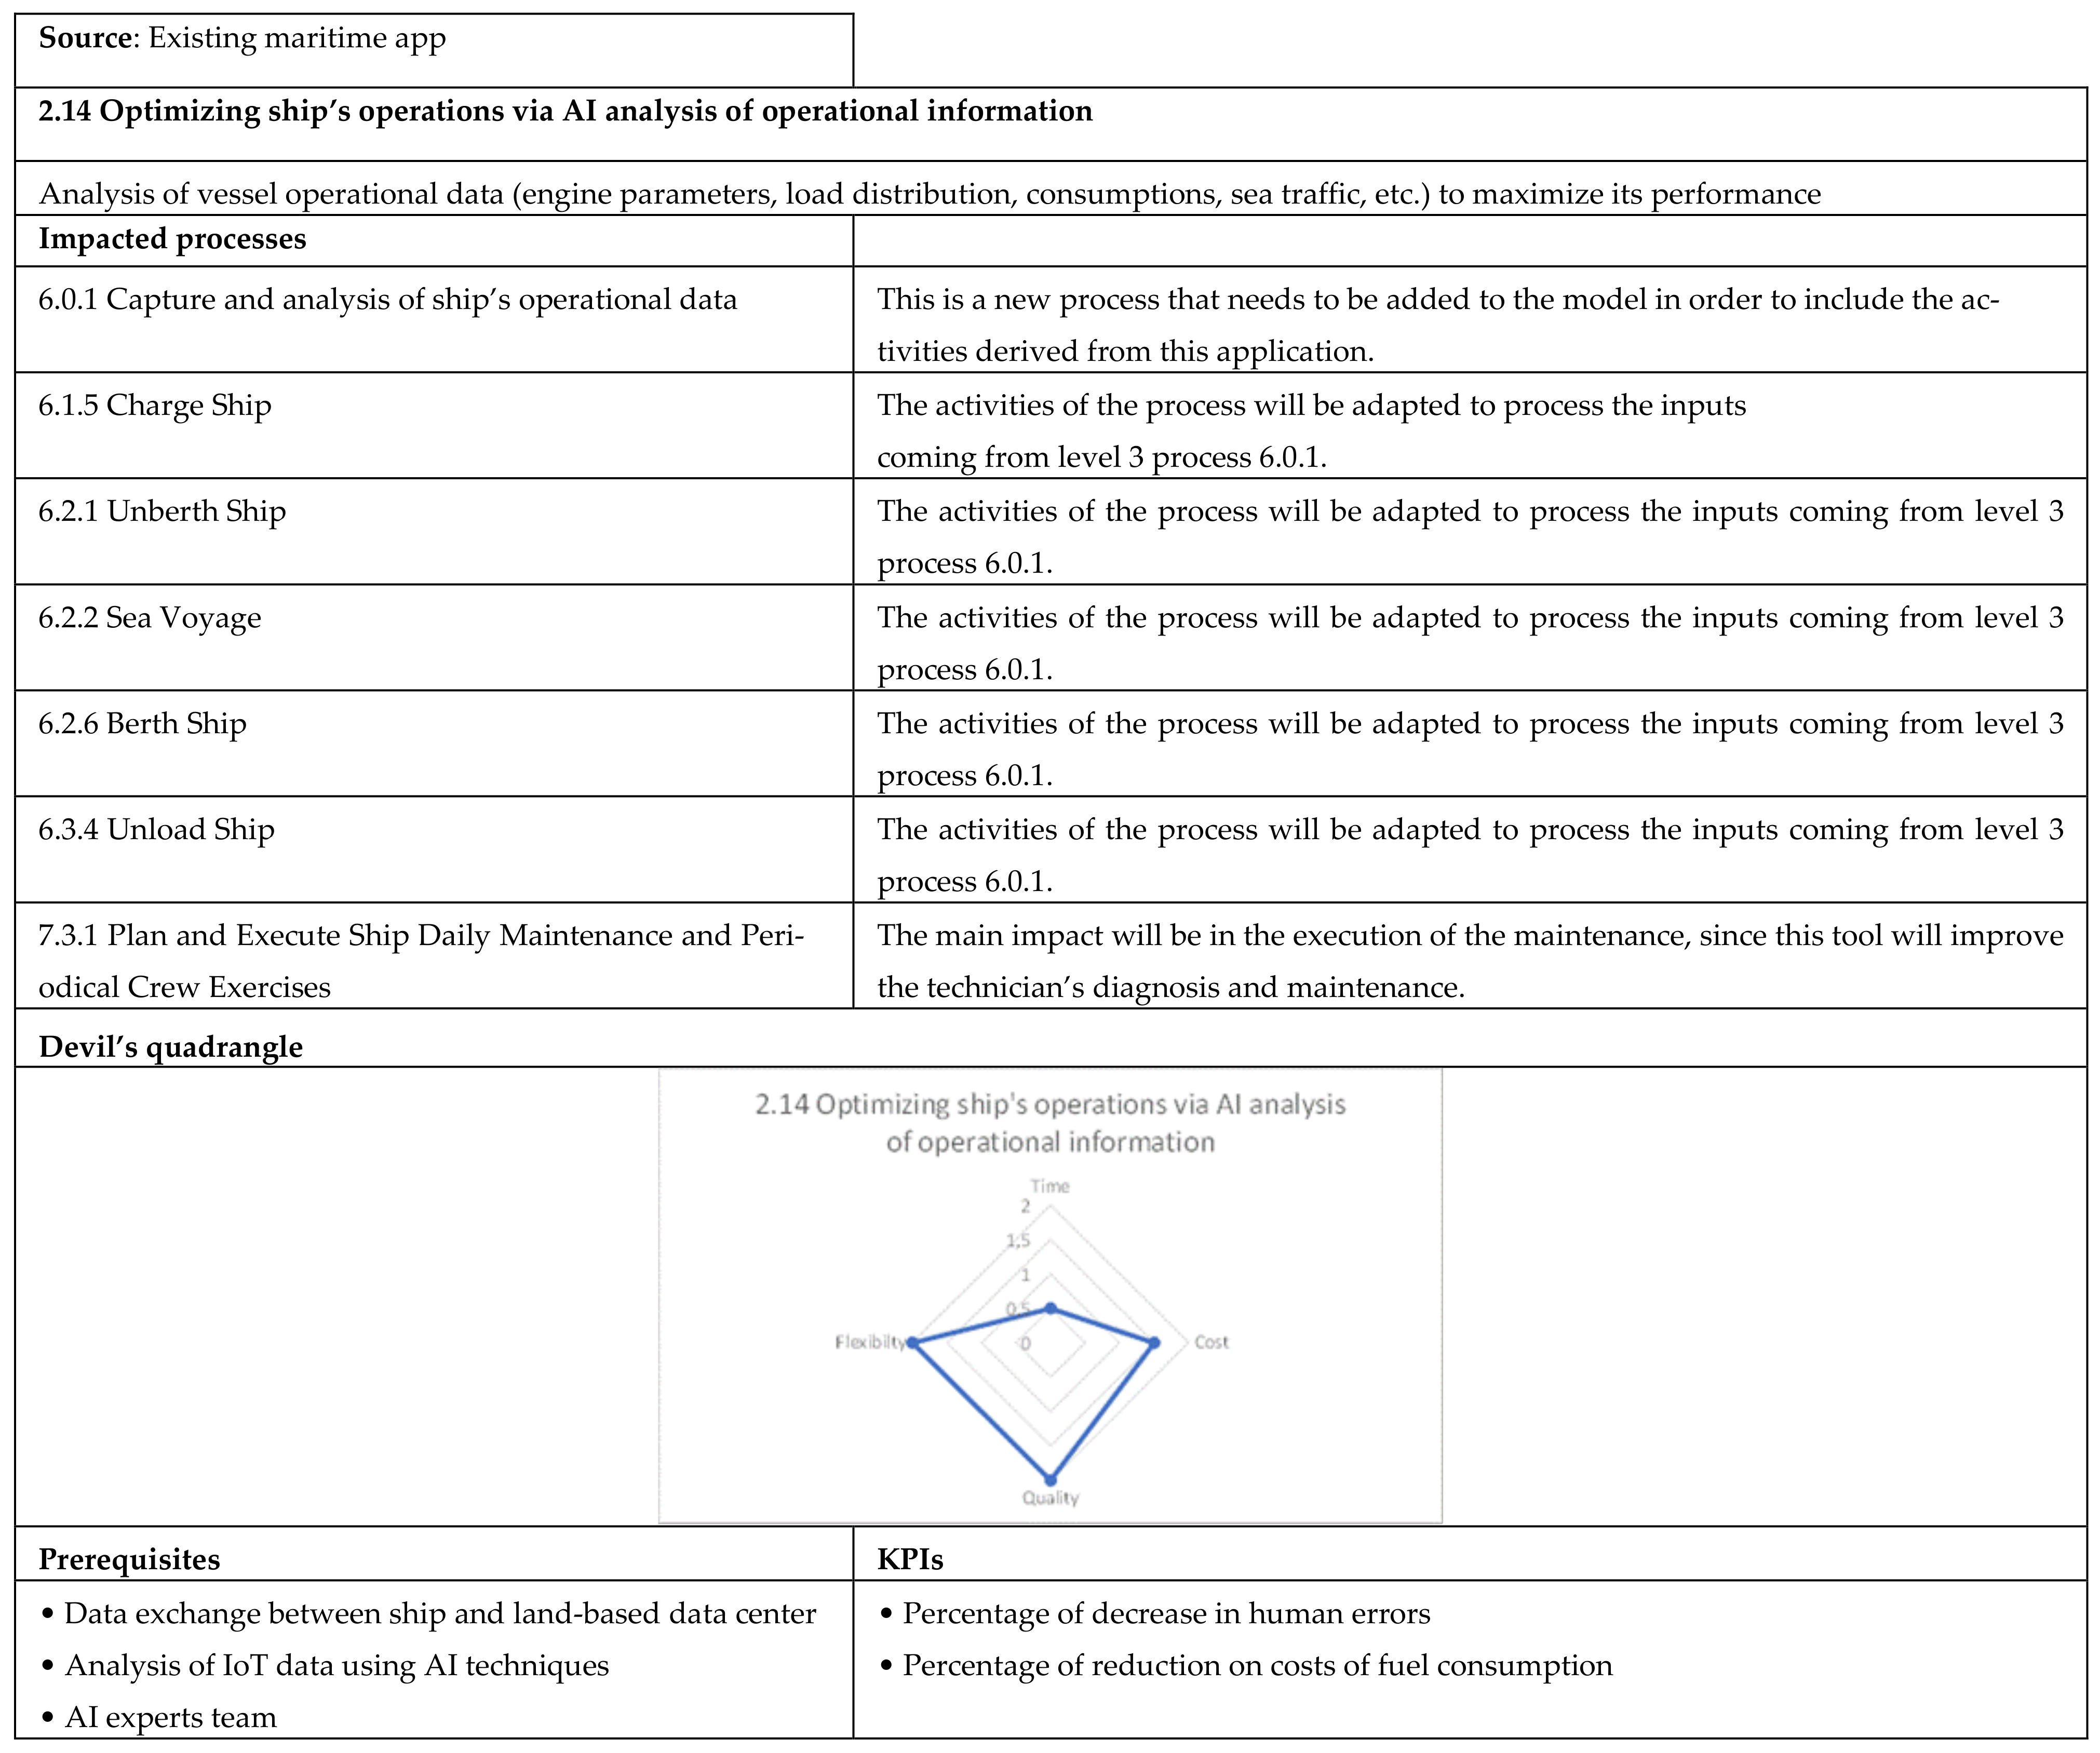
One application is found in the opposite situation: being in the list of top performers when looking at the consolidated (Table 4); it is at the bottom side when looking at the time performance dimension (Table 7). This is the case of “2.14 Optimizing ship’s operations via AI analysis of operational information”. This application scores 6/8 in the consolidated impact score given it is outstanding when compared to others in the Flexibility and Quality provided to the affected processes, and its availability in the current market makes it almost optimal when looking at Costs.
Moving to Costs, two applications are at the top for this performance dimension (Table 8) and at the bottom when looking at the consolidated score (Table 5). These are “3.04 ISPS security levels” and “5.02 Optimization of equipment usage”. The first one was found in the same situation when looking at Time, and the reason is the same: it does not increase substantially the flexibility or the quality of the affected processes compared with the rest of the 46 applications. Regarding “5.02 Optimization of equipment usage”, it does not increase flexibility or quality, and it is also low when looking at Time, since it is not available on the market yet.
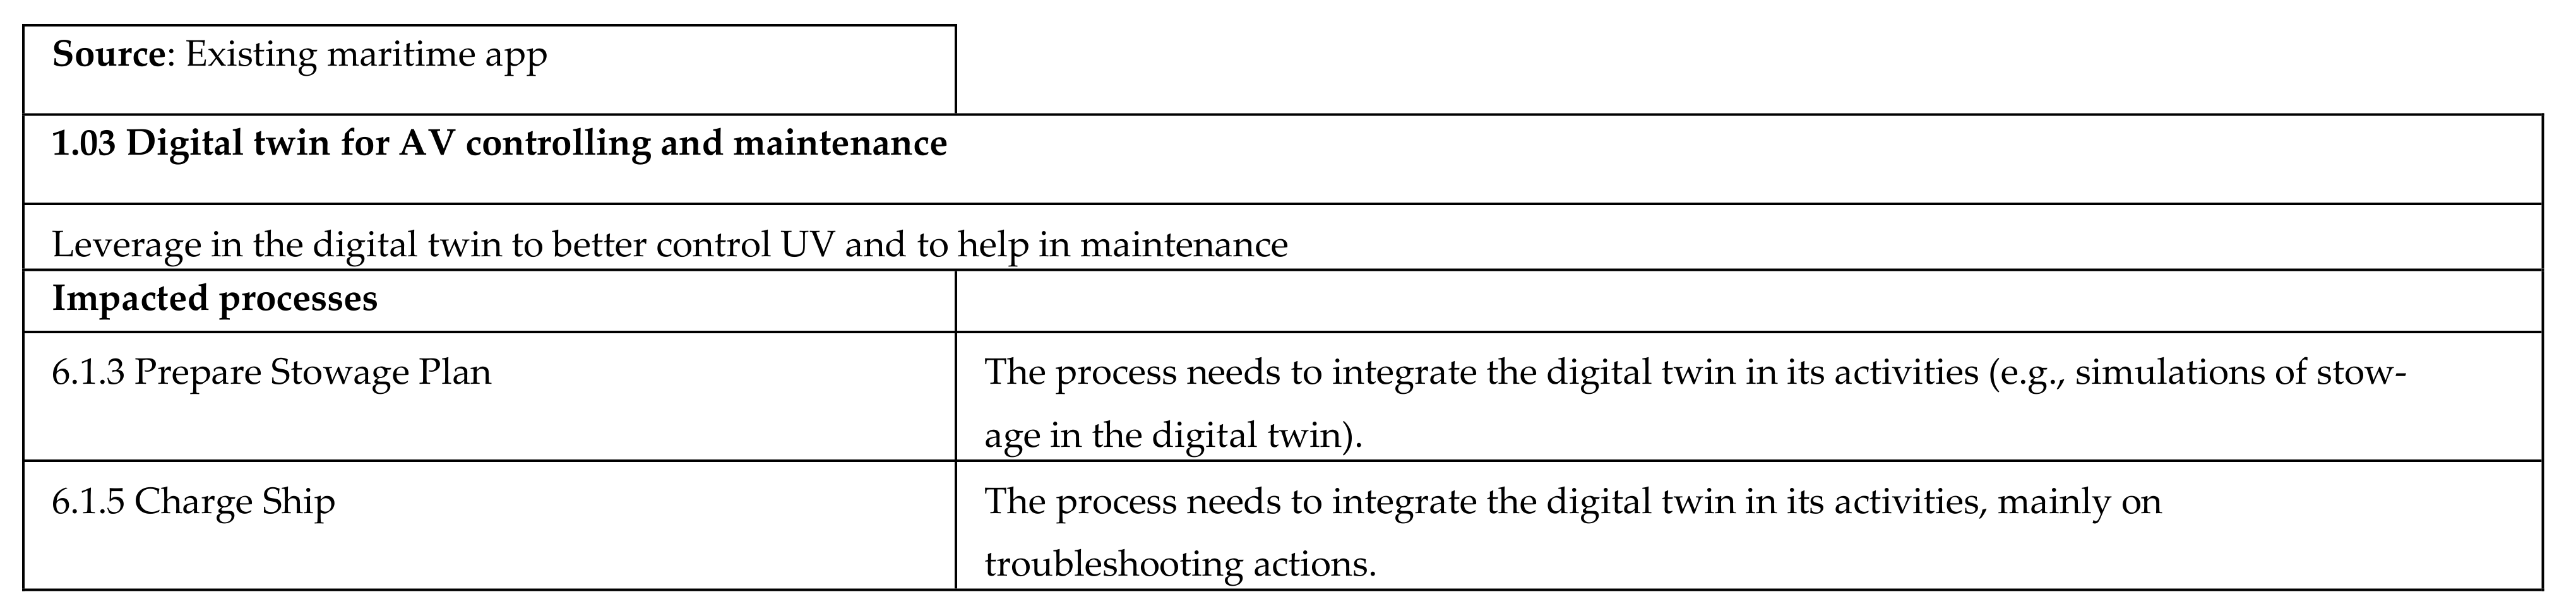
As it happened when analyzing Time, one application is found in the bottom list from Costs (Table 9) and at the top when looking at the consolidated score (Table 4); this is “2.11 Optimizing maintenance process using digital twin and AI” given it is outstanding when compared to others in the Flexibility and Quality provided to the affected processes, but the cost of a digital twin makes it go down in the list when looking only at this performance dimension.
The next performance dimension to be looked into is Quality. In it, there are two applications that are in the top for this performance dimension (Table 10), whereas they are part of the list of bottom applications in the consolidated score (Table 5). These are “1.01 UV controlling system” and “1.02 Autonomous vessels”, which have a very high impact on quality improvement for the affected processes but perform very low in the rest of the variables (high costs, high time of ROI and implementation, and without a substantial impact in flexibility compared to the others).
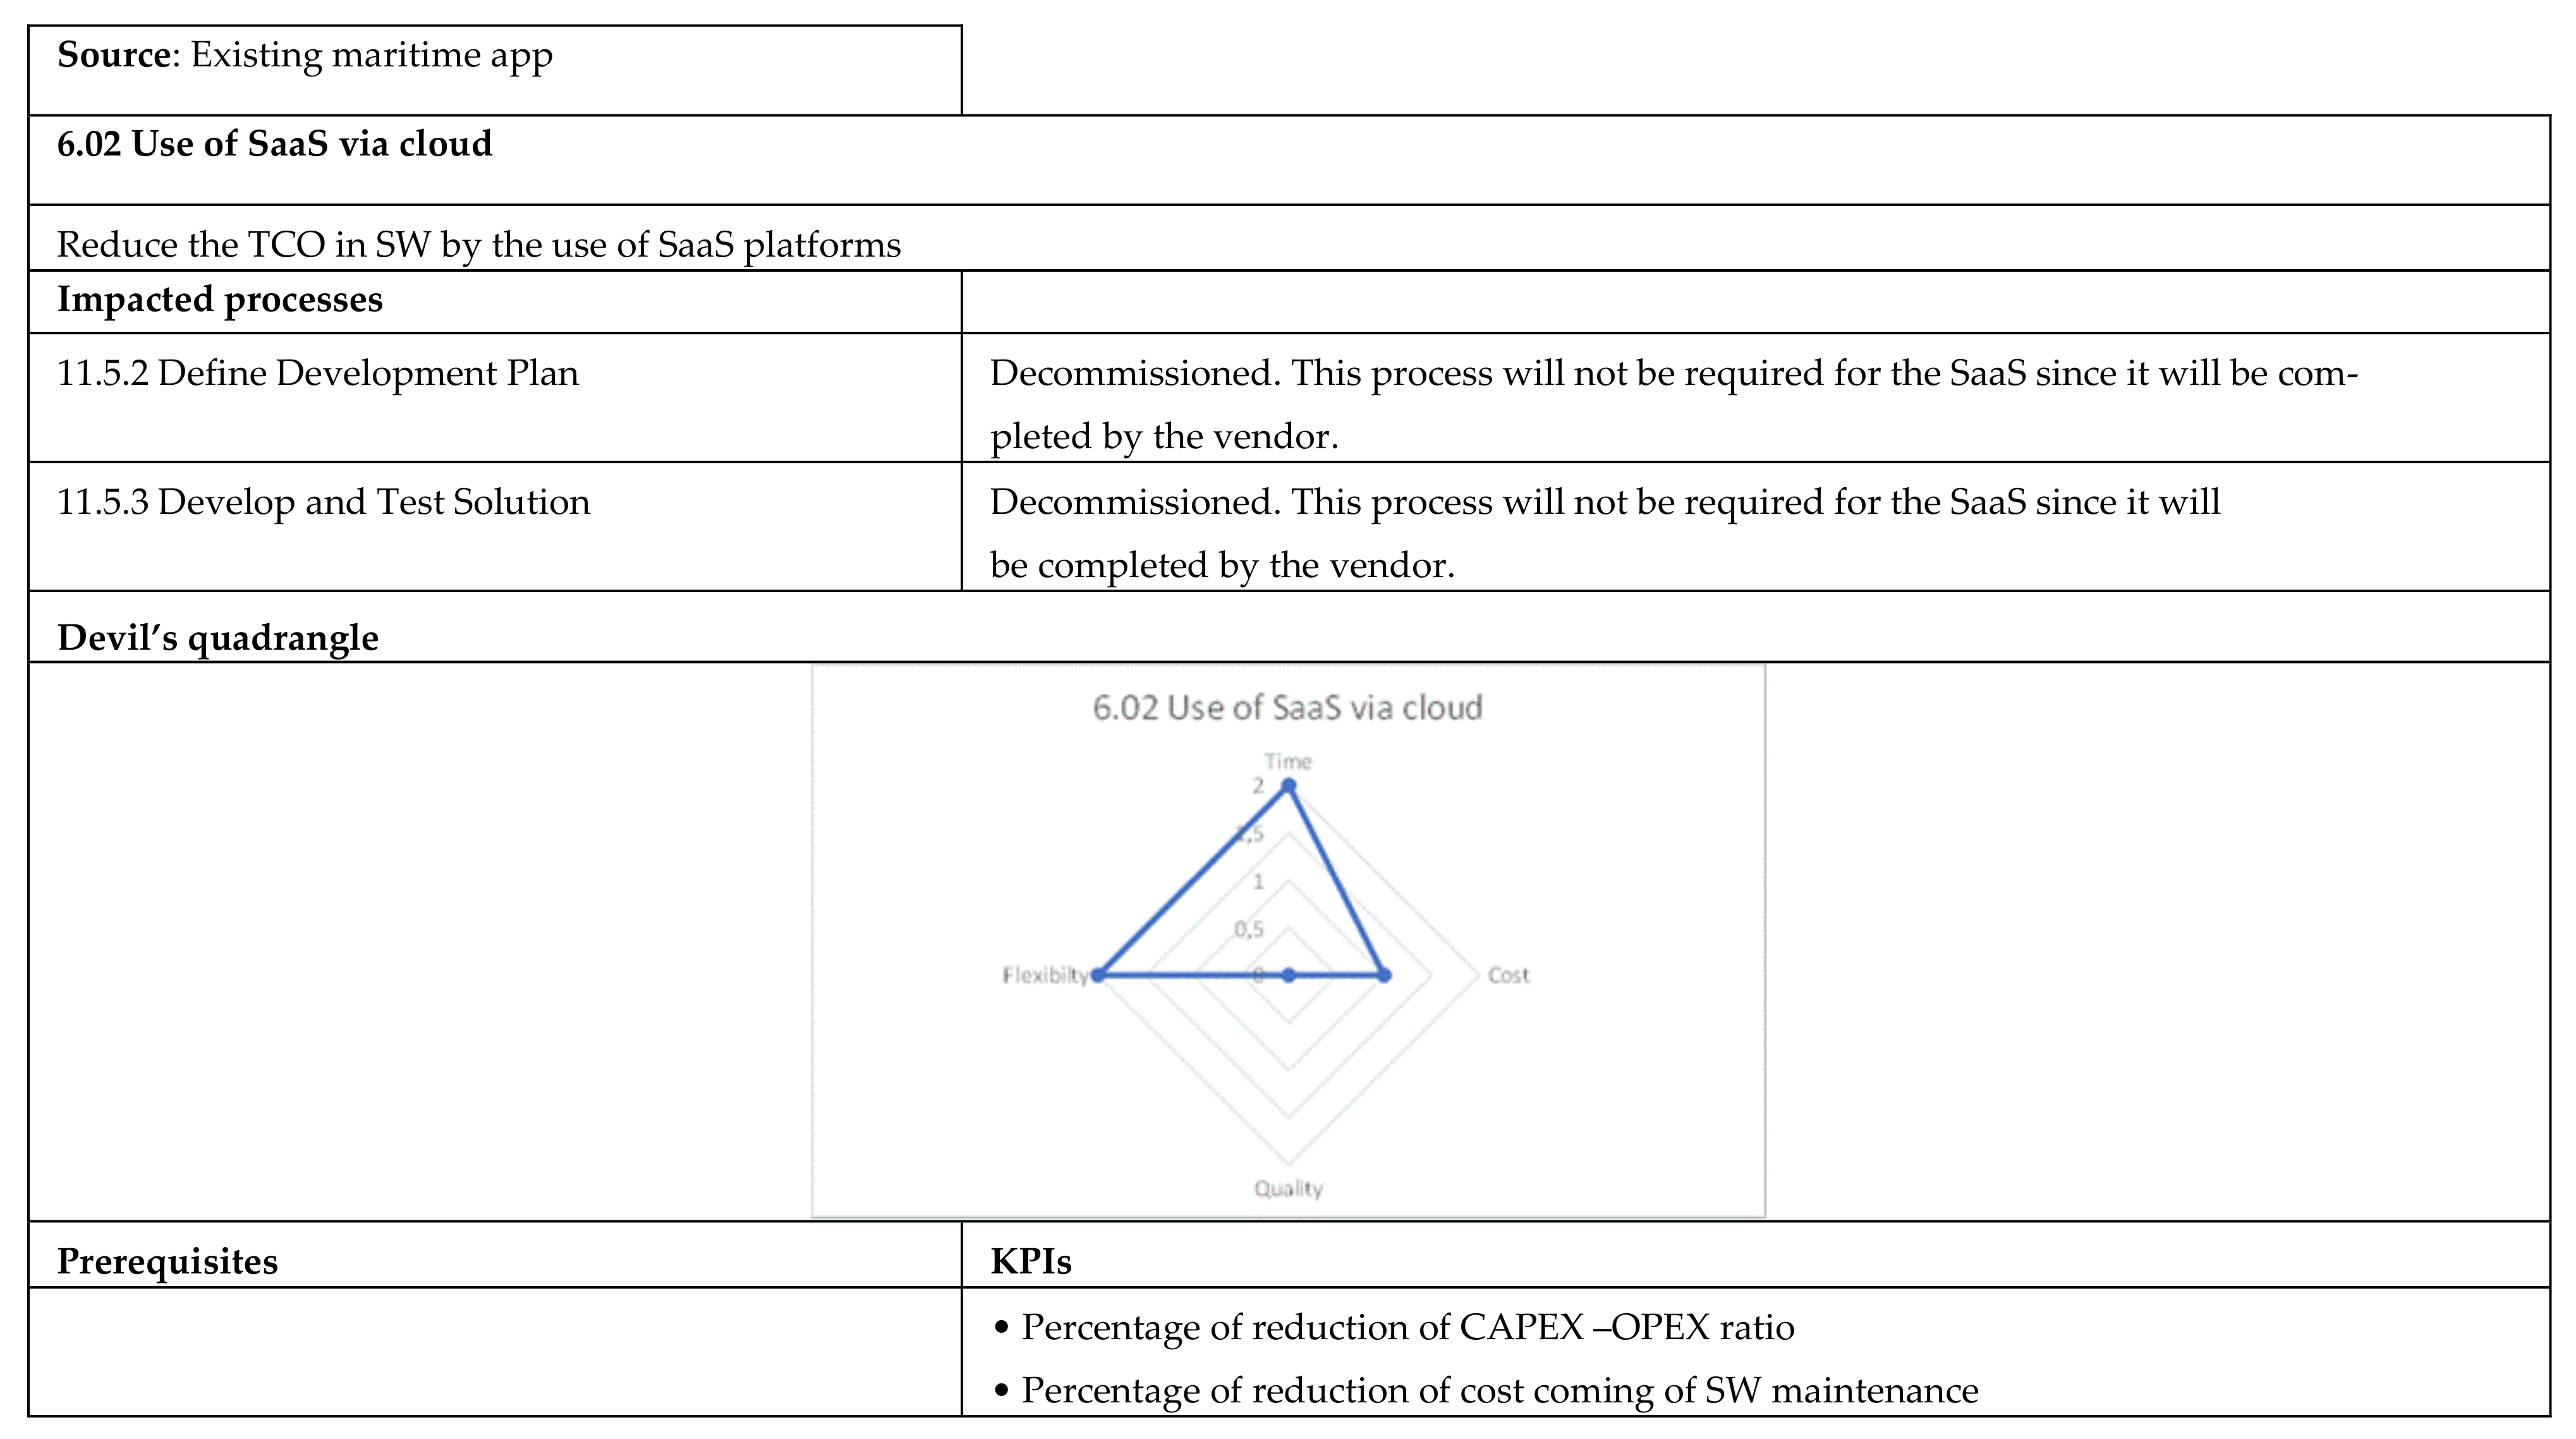
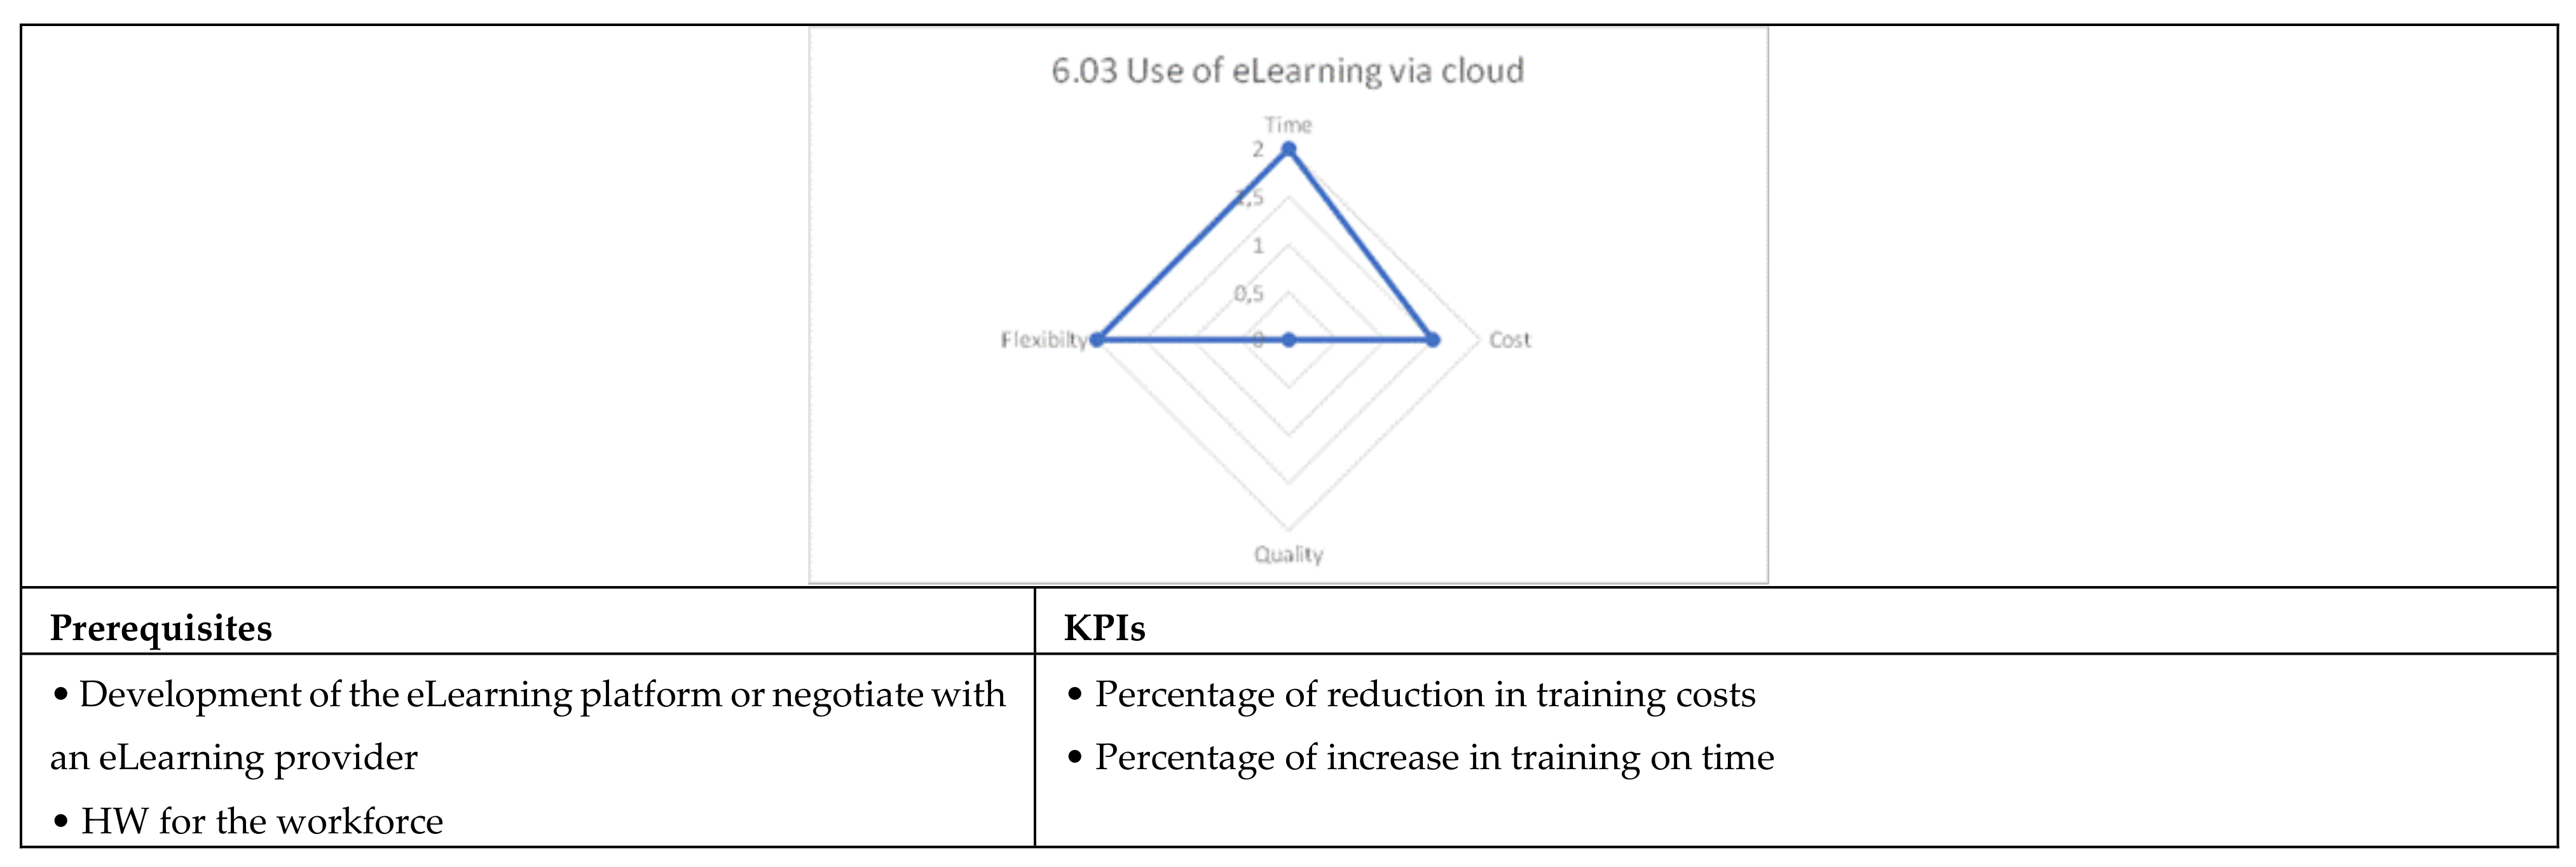
Comparing Table 11 (bottom applications for Quality performance dimension) and Table 4 (top consolidated score), applications “6.02 Use of SaaS via cloud”, “6.03 Use of eLearning via cloud” and “8.01 Spare parts using 3DP” are in both lists due to the same reason: they do not increase substantially the quality of the affected processes when compared to others, whereas they perform well on the rest of the performance dimensions.
Moving to the last performance dimension, Flexibility, comparing Table 12 (top performers in Flexibility) and Table 5 (bottom in consolidated score), there is no application in both lists.
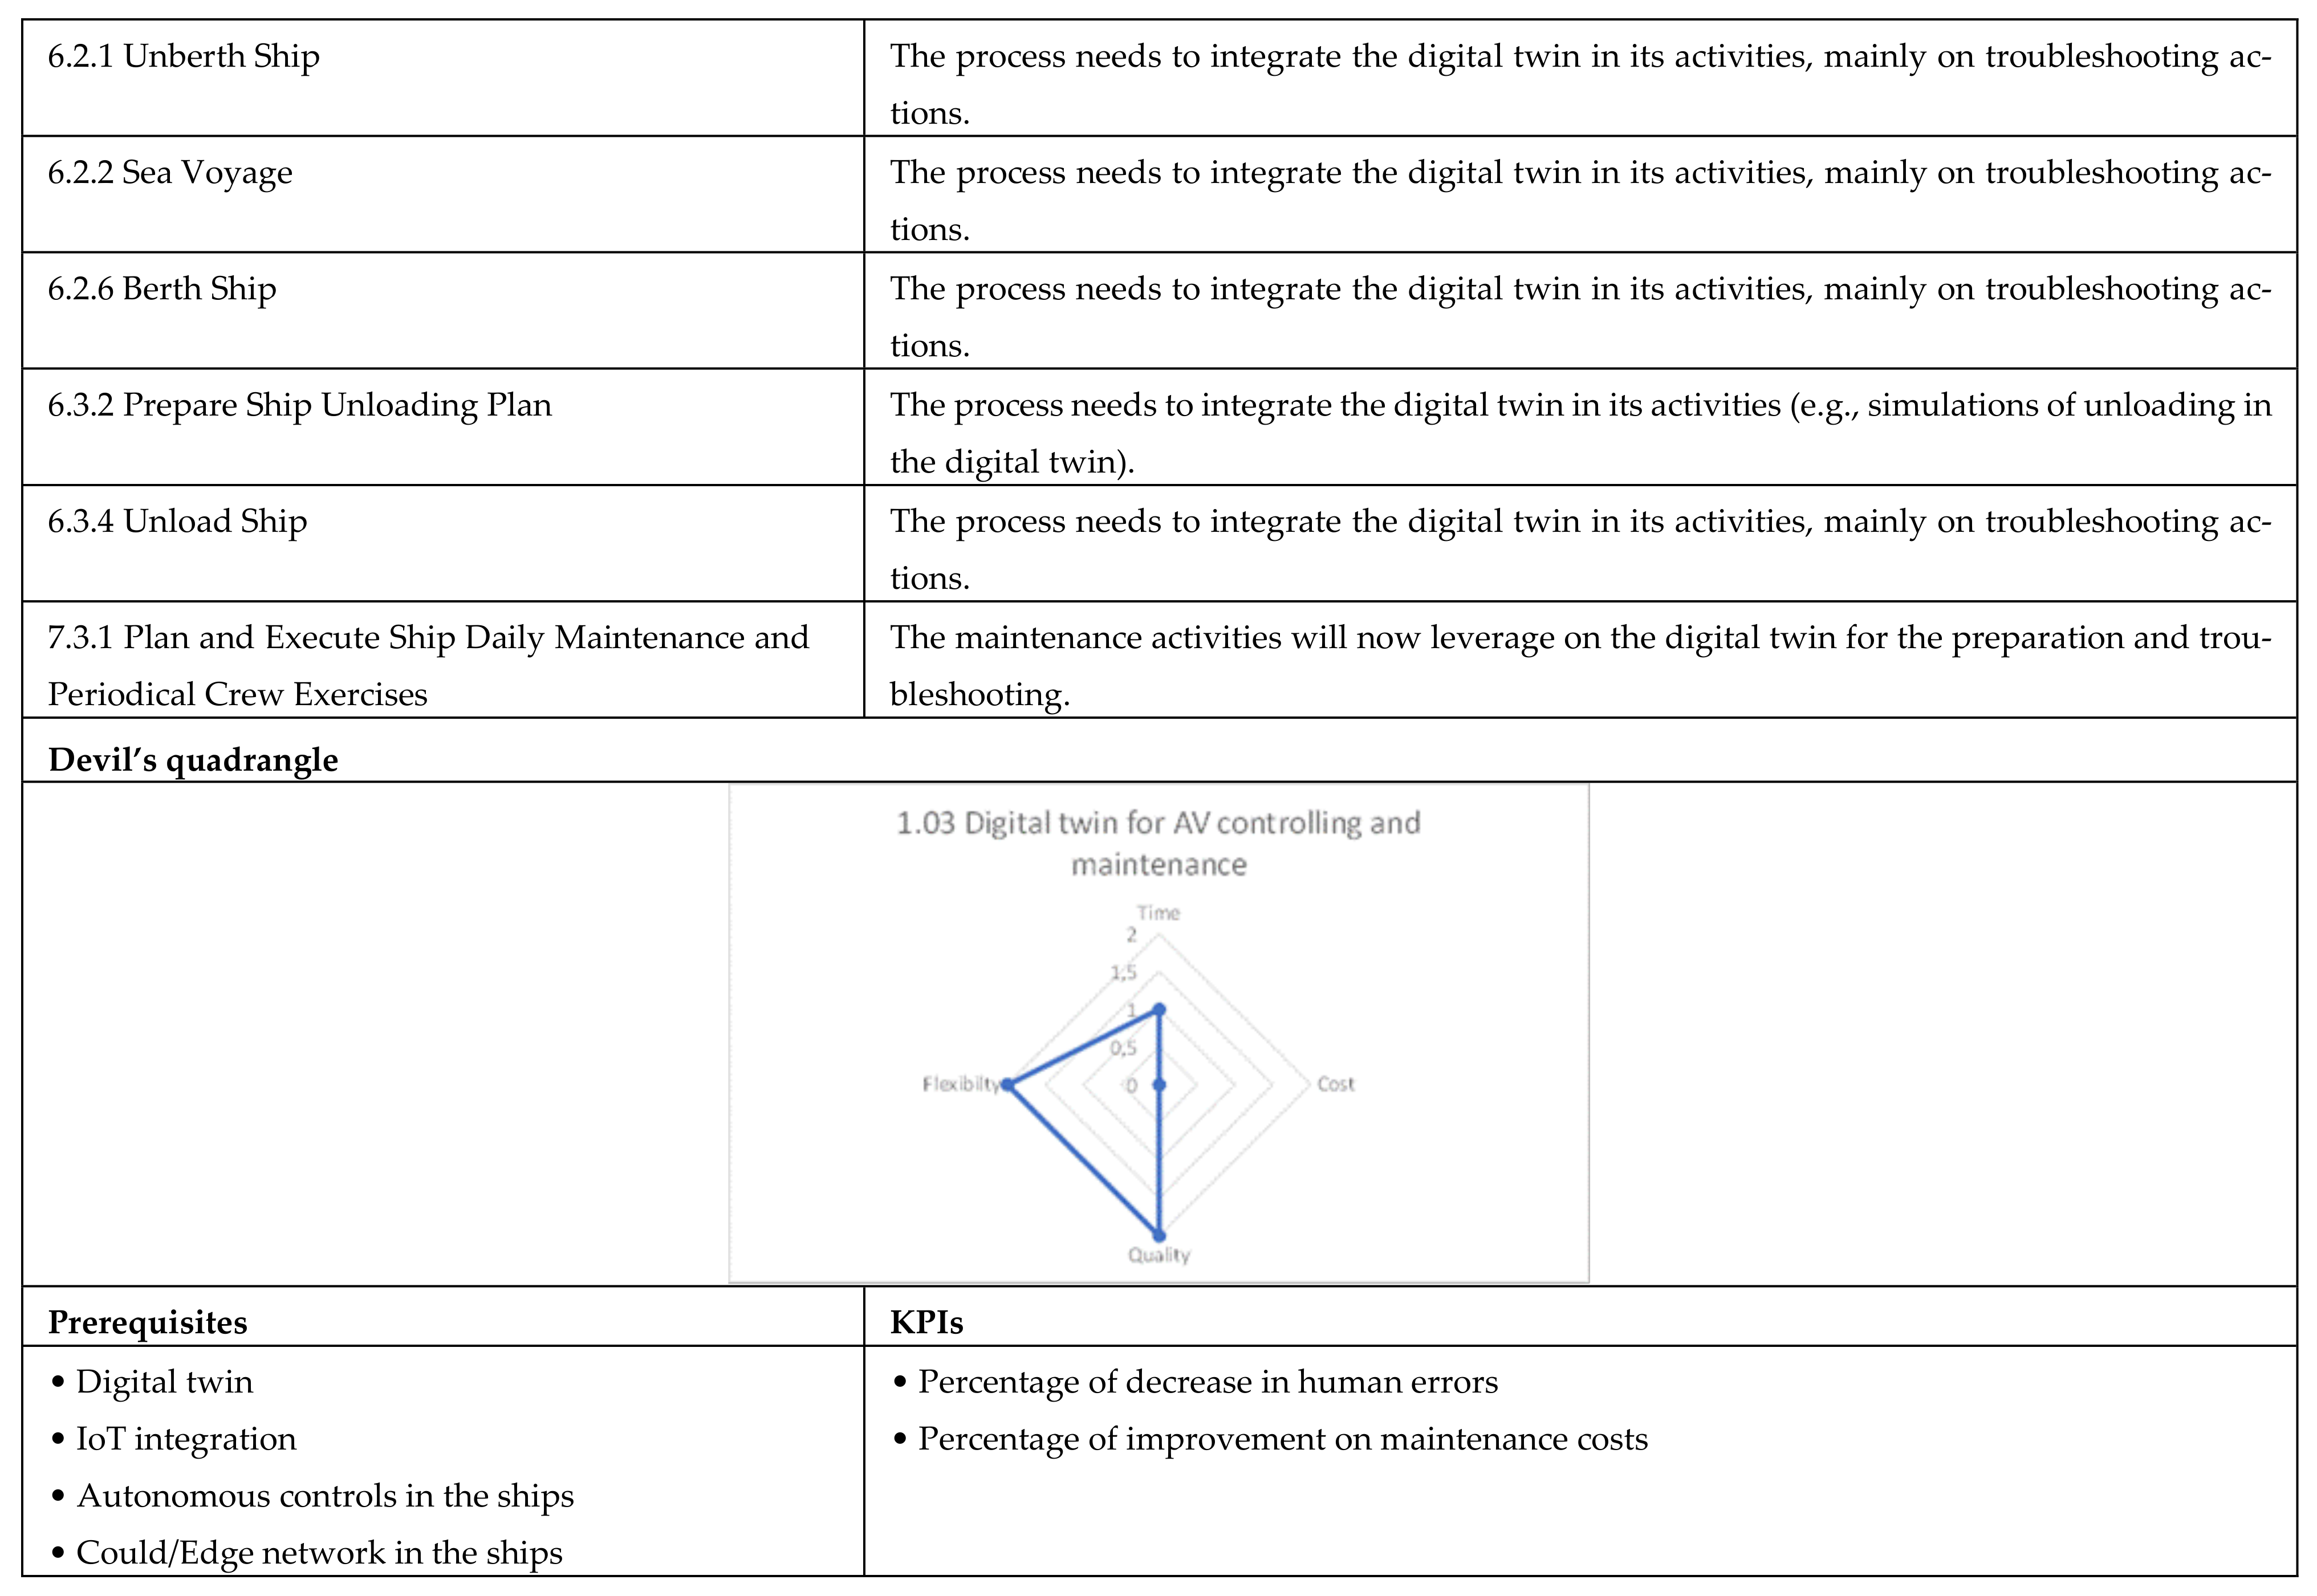
However, doing the same exercise with bottom applications in Flexibility (Table 13) and top performers in consolidated score (Table 4), there are three applications in both lists: “1.04 Use of robots in complex/hazardous tasks”, “3.02 Big data analysis for energy efficiency”, and “3.03 Analysis of data on consumption and emissions for bunkering selection”, all of them outperforming in the rest of the performance dimensions.
To finalize the analysis of results, we identified the 10 applications that can be named as “quick wins”. These are applications that, given their optimal results on the Time performance dimension and good results on the Costs performance dimension, could be considered as the starting point for digitalizing a company. A company starting its digitalization with these could obtain a sense of what digitalization is and learn lessons of the implementation project, which will be value for going to the next step.
The list has been obtained by sorting the results of the score of the devil’s quadrant first by those performing better on Time, then on Costs, and finally on consolidated global score. The list is in Table 14.
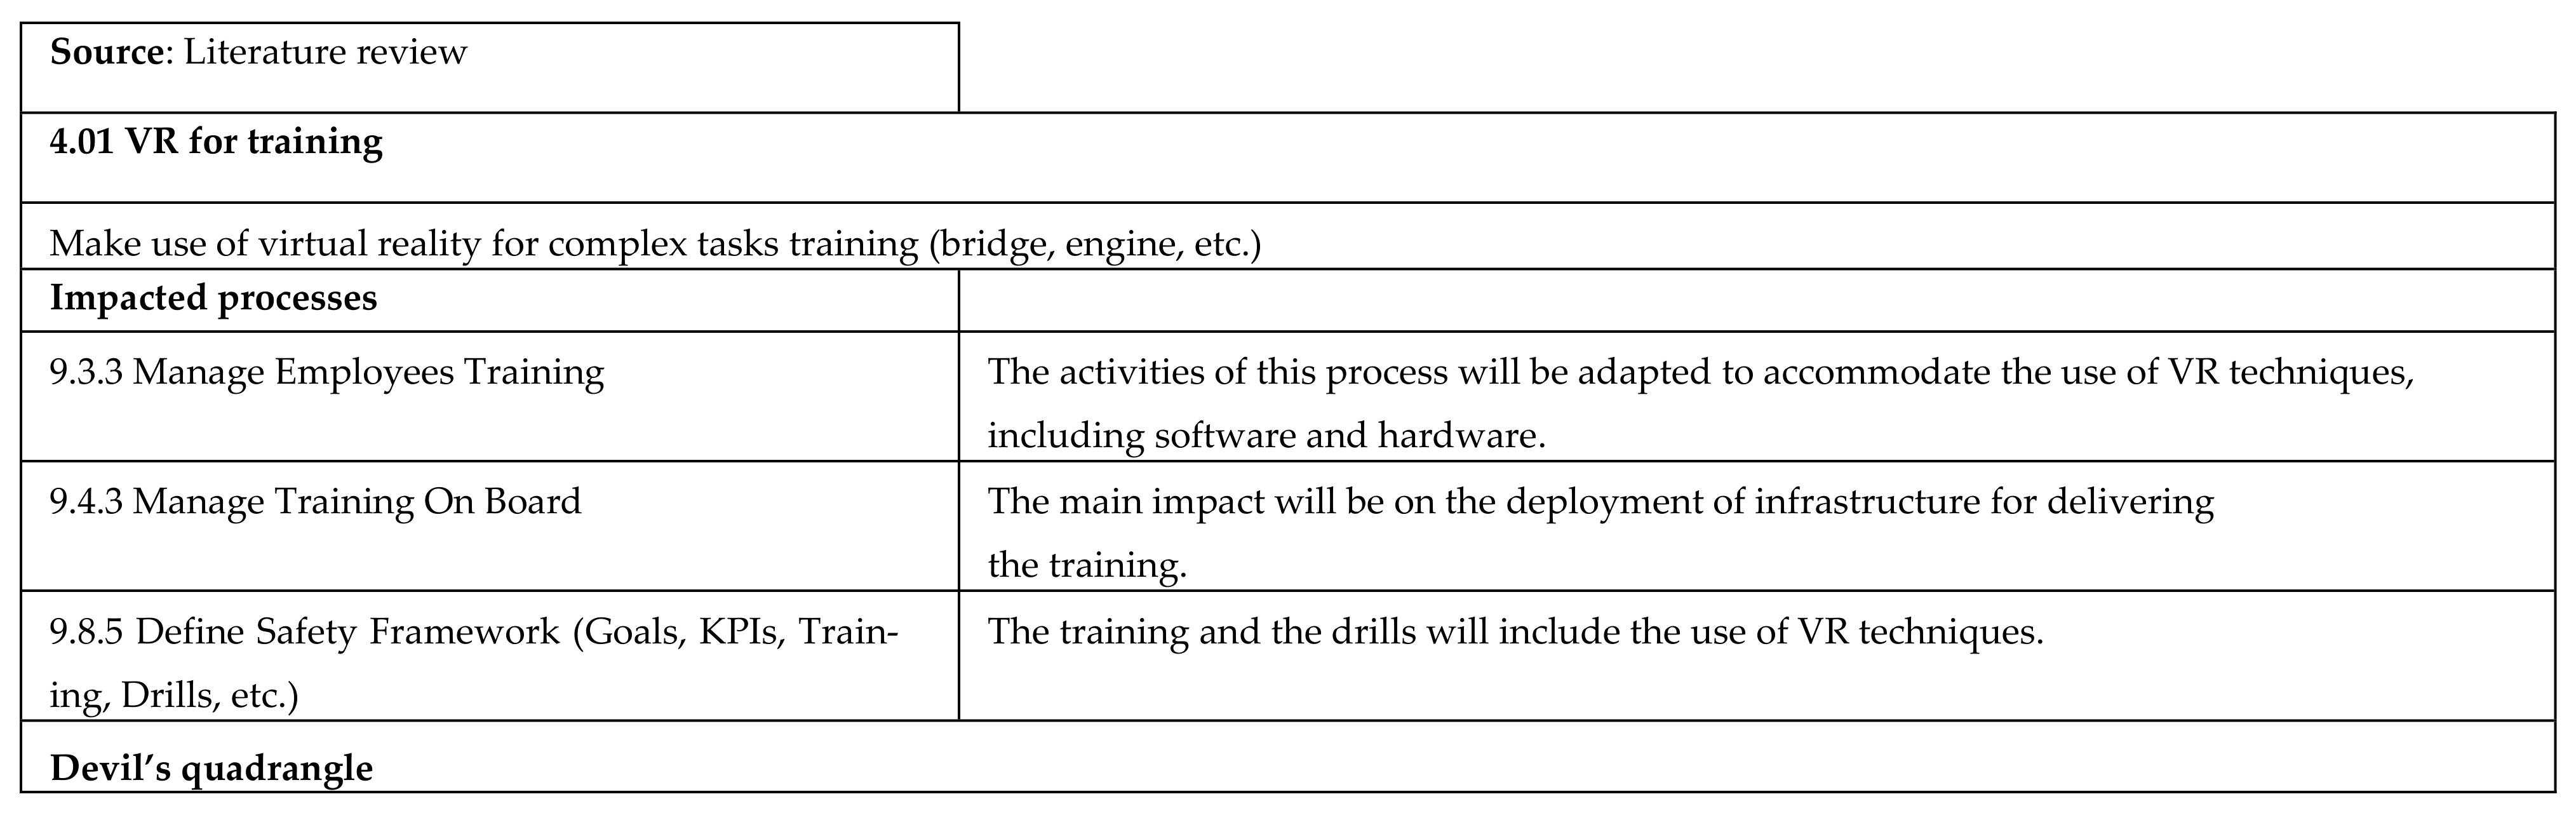
The majority of these are in Table 4 (List of applications with higher consolidated impact score); they are applications that are top performers in the consolidated impact score. The exceptions are “7.04 Electronic logbook” and “4.01 VR for training”. These two do not score as high as others when looking at the consolidated score but can be good candidates for testing the benefits of digitalization in one company, given their ease of implementation.
Summing up the analysis of the results, the main outcomes are as follows:
- The processes with higher impacts are within the Operations process categories domain. The reason is that these processes are the ones that produce the wealth of the company, so these are the ones subject to higher investments. The one more frequently impacted is “6.2.2 Sea Voyage”; this will be impacted by 32.6% of the applications.
- There are six new processes that will be necessary when implementing some applications from AI or IoT domains. These processes are from the Strategy, Infrastructure & Products and from the Operations process categories domains.
- On the other side, there are three processes that will need to be decommissioned when implementing two applications (one from the Cloud digital domain and one from the Robotics one). They are within the Operations and the Enterprise Management process categories domains.
- The KPIs needed for measuring the performance of the digitalization of the BPMo are 51, though 11 of them can measure more than 50% of what is necessary for tracking the outcomes of the digitalization.
- The quantification of the impacts performed with the devil’s quadrant gives a perspective on how the digitalization can benefit a company for implementing an application, but it does not necessary imply that applications in the bottom of the list should not be implemented; the decision of going for one application or another should be made by the company looking at its priorities and needs. There are some conclusions though coming from the results of this analysis:
- ◦
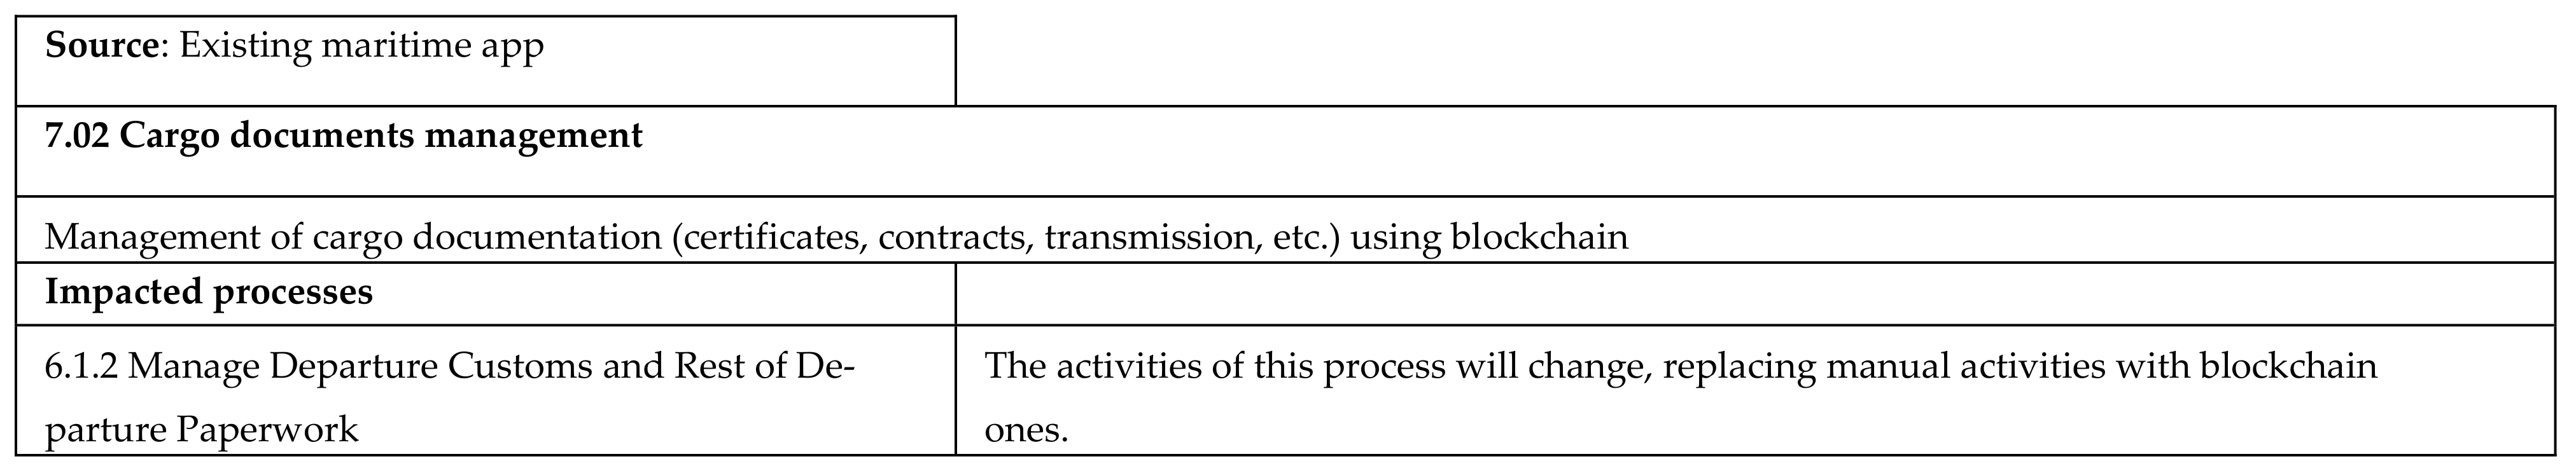
- Applications “5.01 Container tracking”, “2.06 Analysis of engine parameters to anticipate issues”, and “7.02 Cargo documents management” are at the top of the list of the consolidated impact score. These applications are market available which, together with the nature of the application, makes the Time and Costs performance dimensions better when compared to others. They are also in the top of the list in Quality.
- ◦
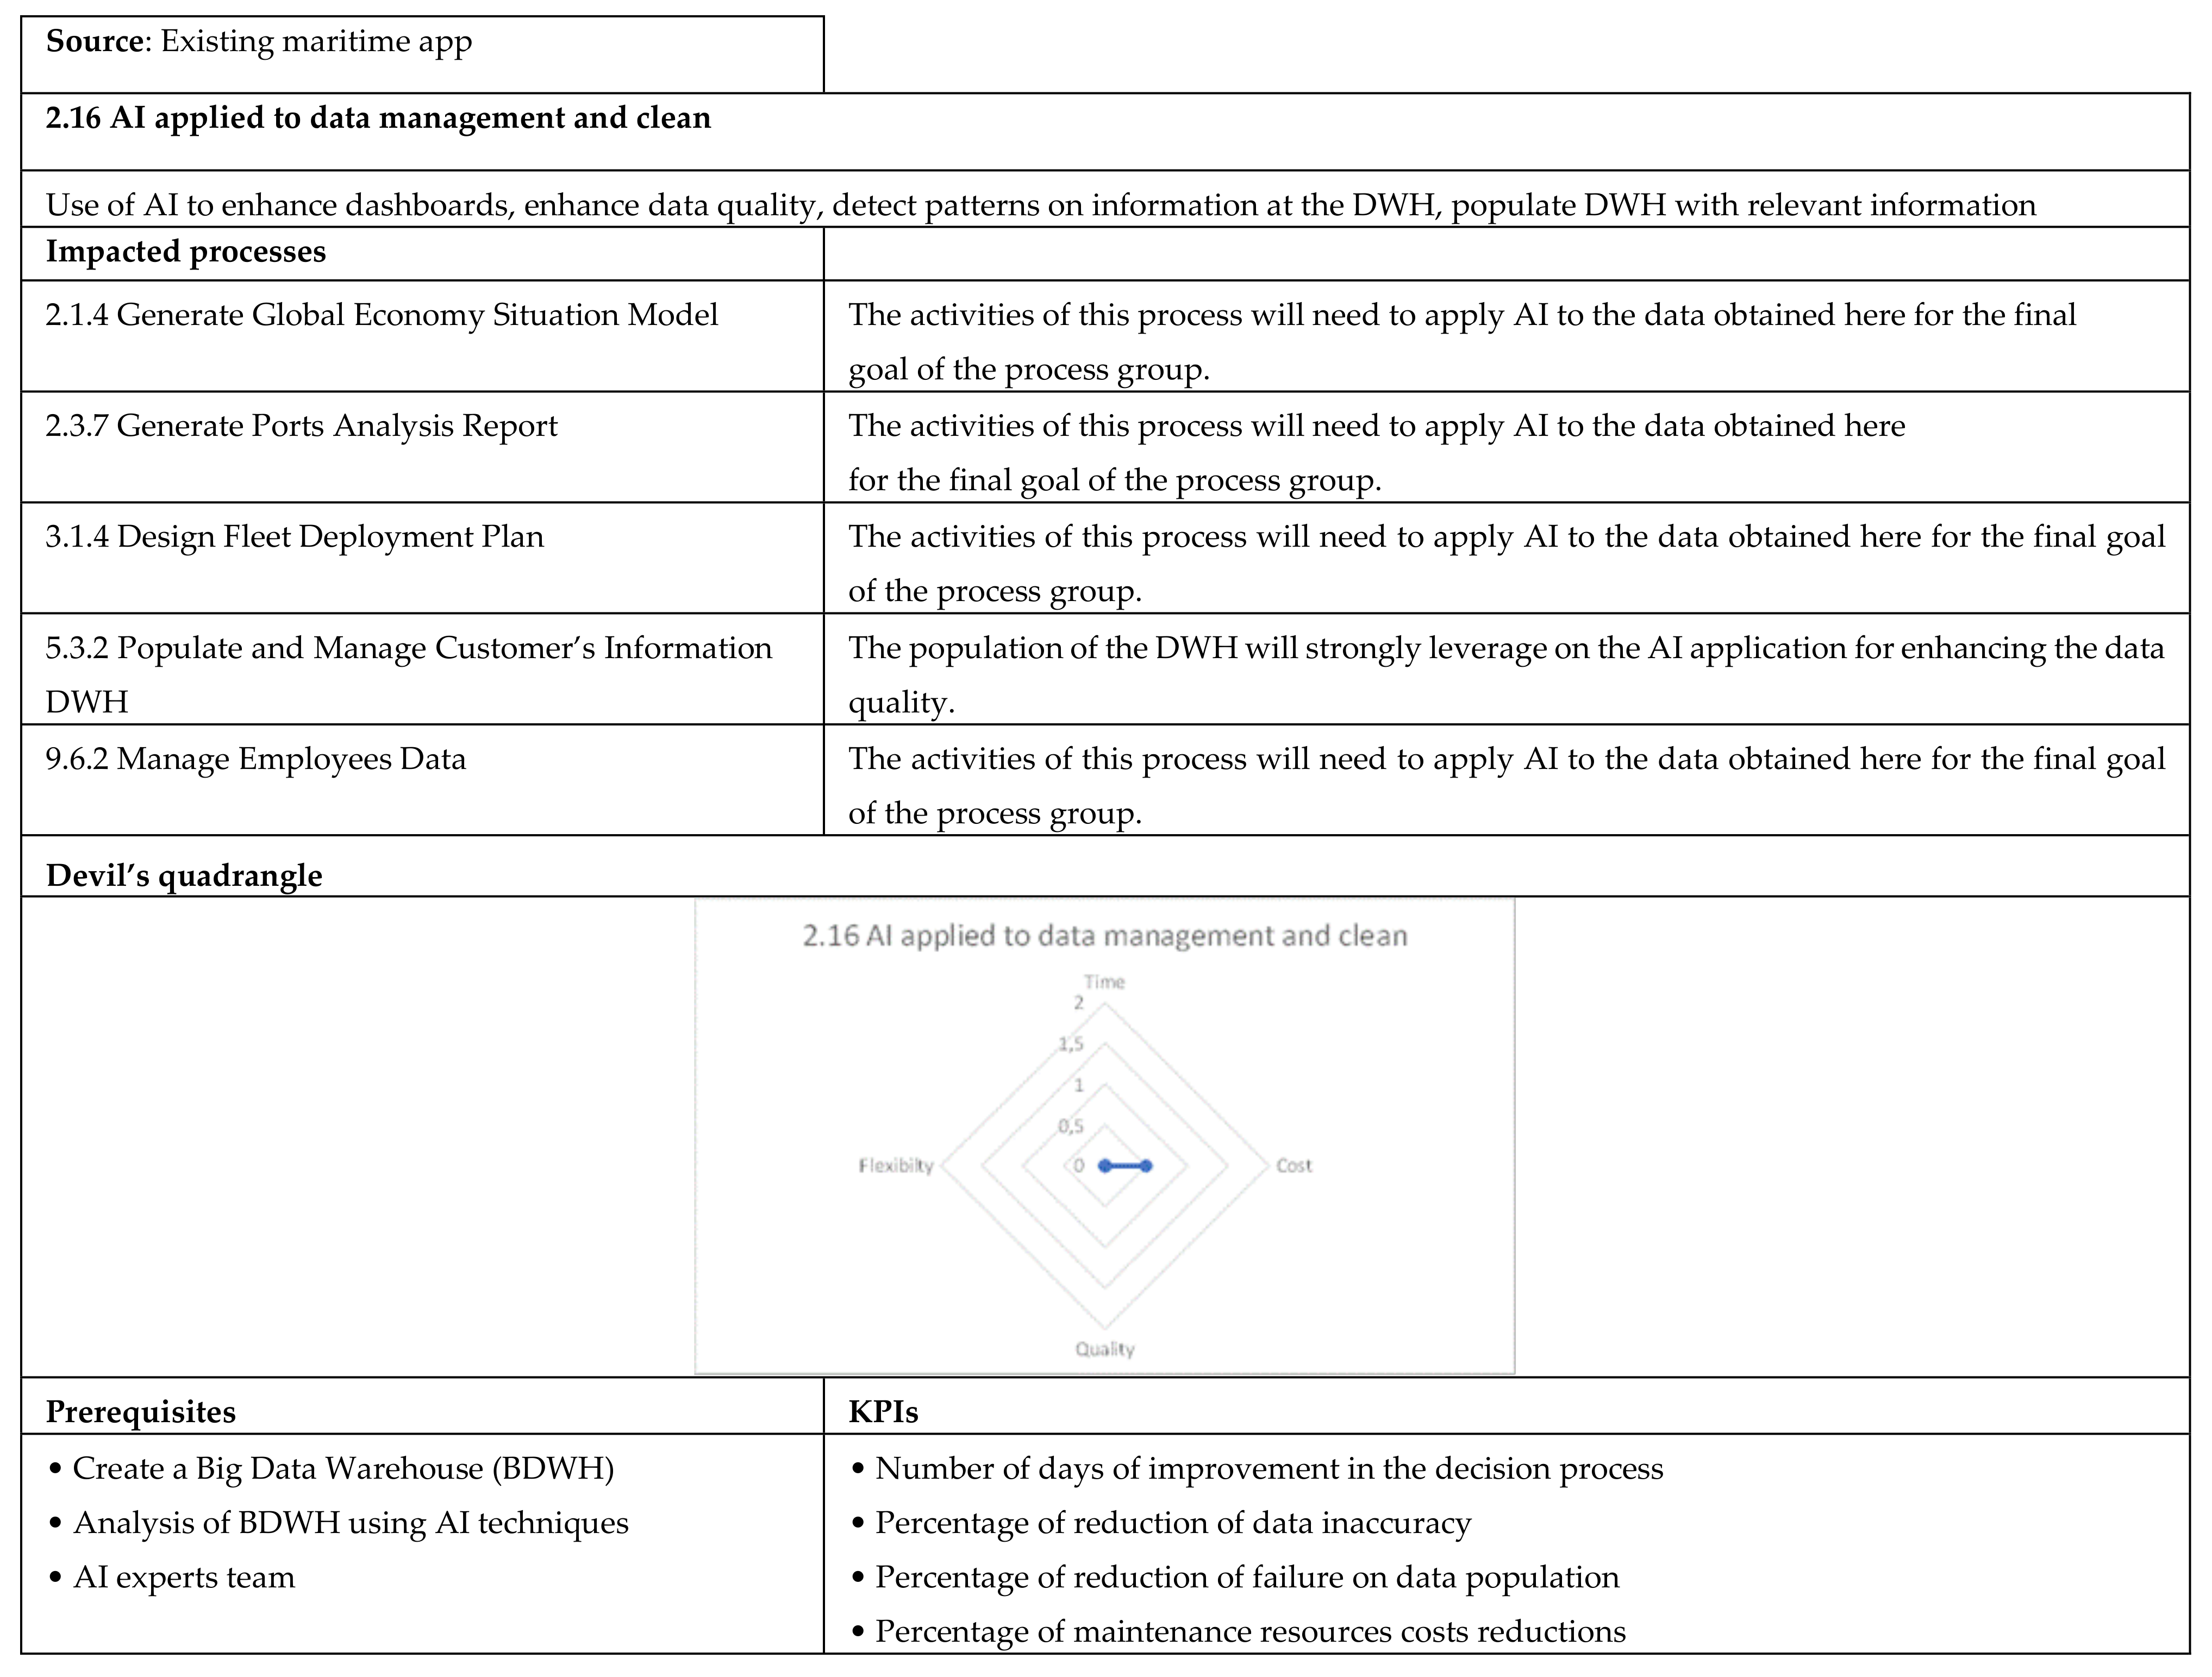
- Applications “2.16 AI applied to data management and clean” and “6.01 Cloud/Edge platform” are at the bottom of the list, though especially the last one is necessary for others to work (i.e., it is a prerequisite for implementing a number of other applications).
- ◦
- There are applications that are at the top when looking at the consolidated score but at the bottom when looking at one performance dimension. This is the case for “2.14 Optimizing ship’s operations via AI analysis of operational information” (bottom in Time but top in Flexibility and Quality and almost optimal in Costs), and it is also the case for “2.11 Optimizing maintenance process using digital twin and AI” (bottom in Costs but top in Flexibility and Quality and average in Time). This happens also with “6.02 Use of SaaS via cloud”, “6.03 Use of eLearning via cloud”, and “8.01 Spare parts using 3DP” (low in Quality but much better in the rest of performance dimensions), and with “1.04 Use of robots in complex/hazardous tasks”, “3.02 Big data analysis for energy efficiency”, and “3.03 Analysis of data on consumption and emissions for bunkering selection” (same situation just described but with Flexibility rather than Quality.
- ◦
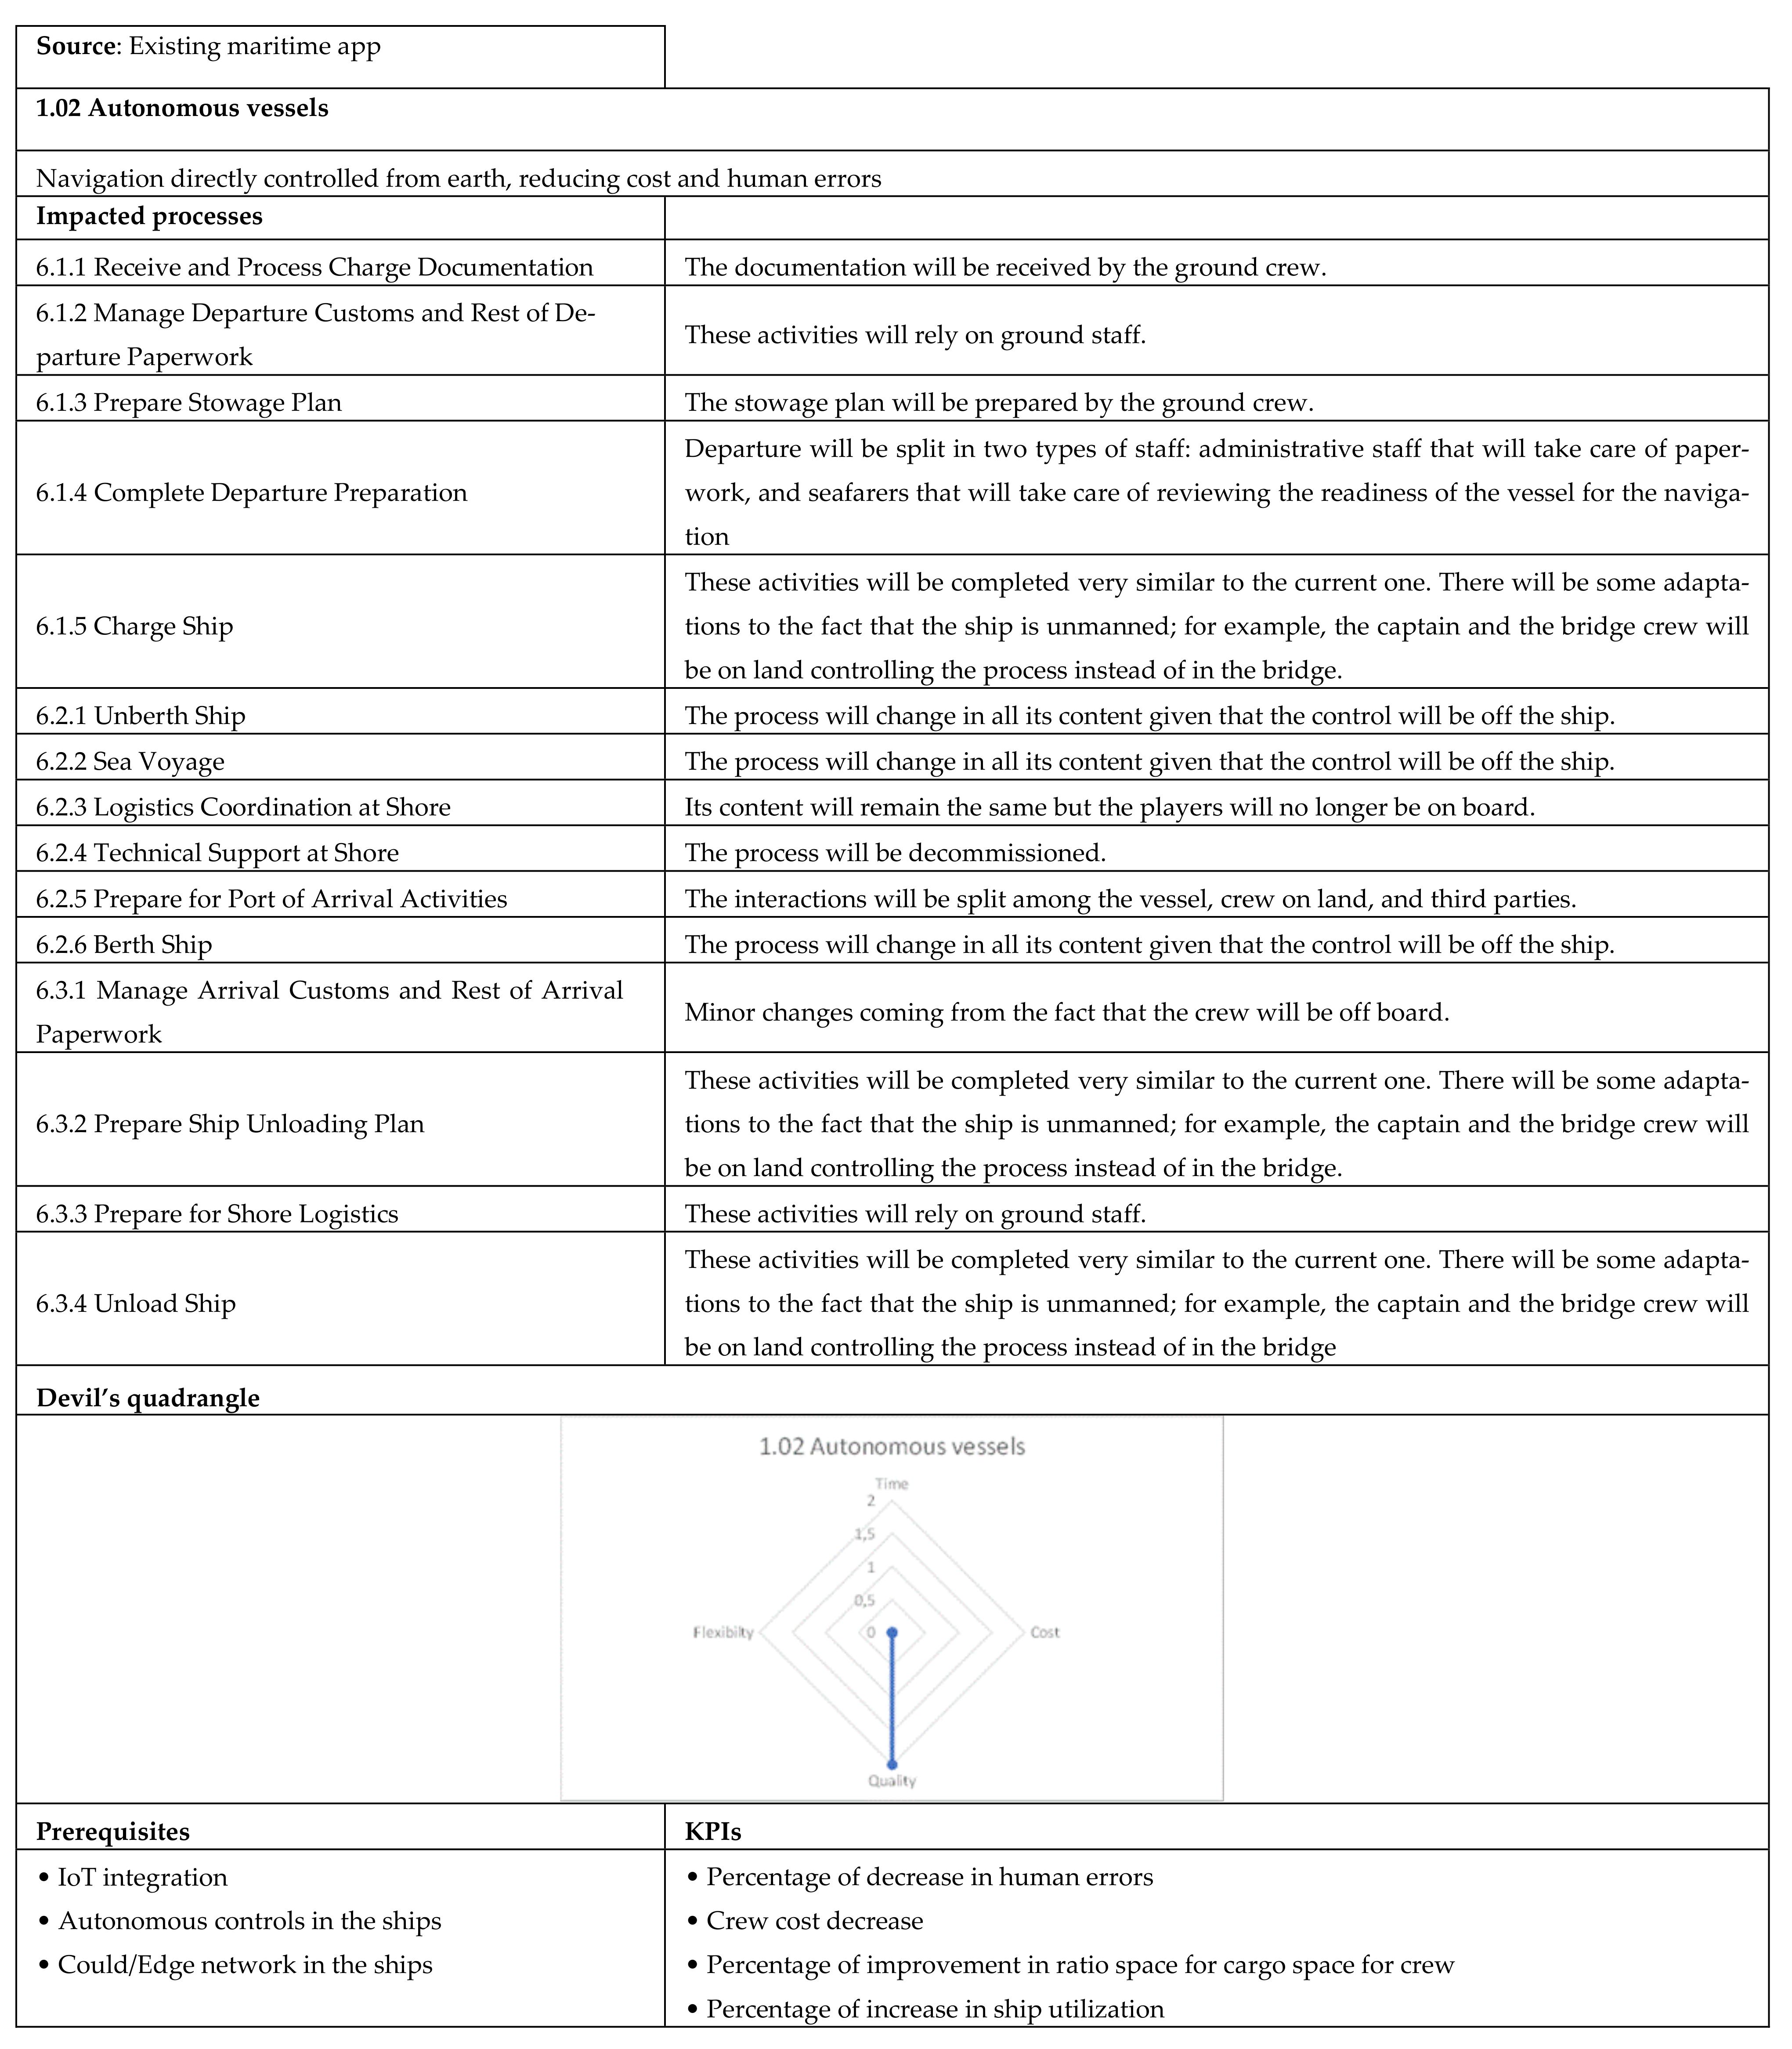
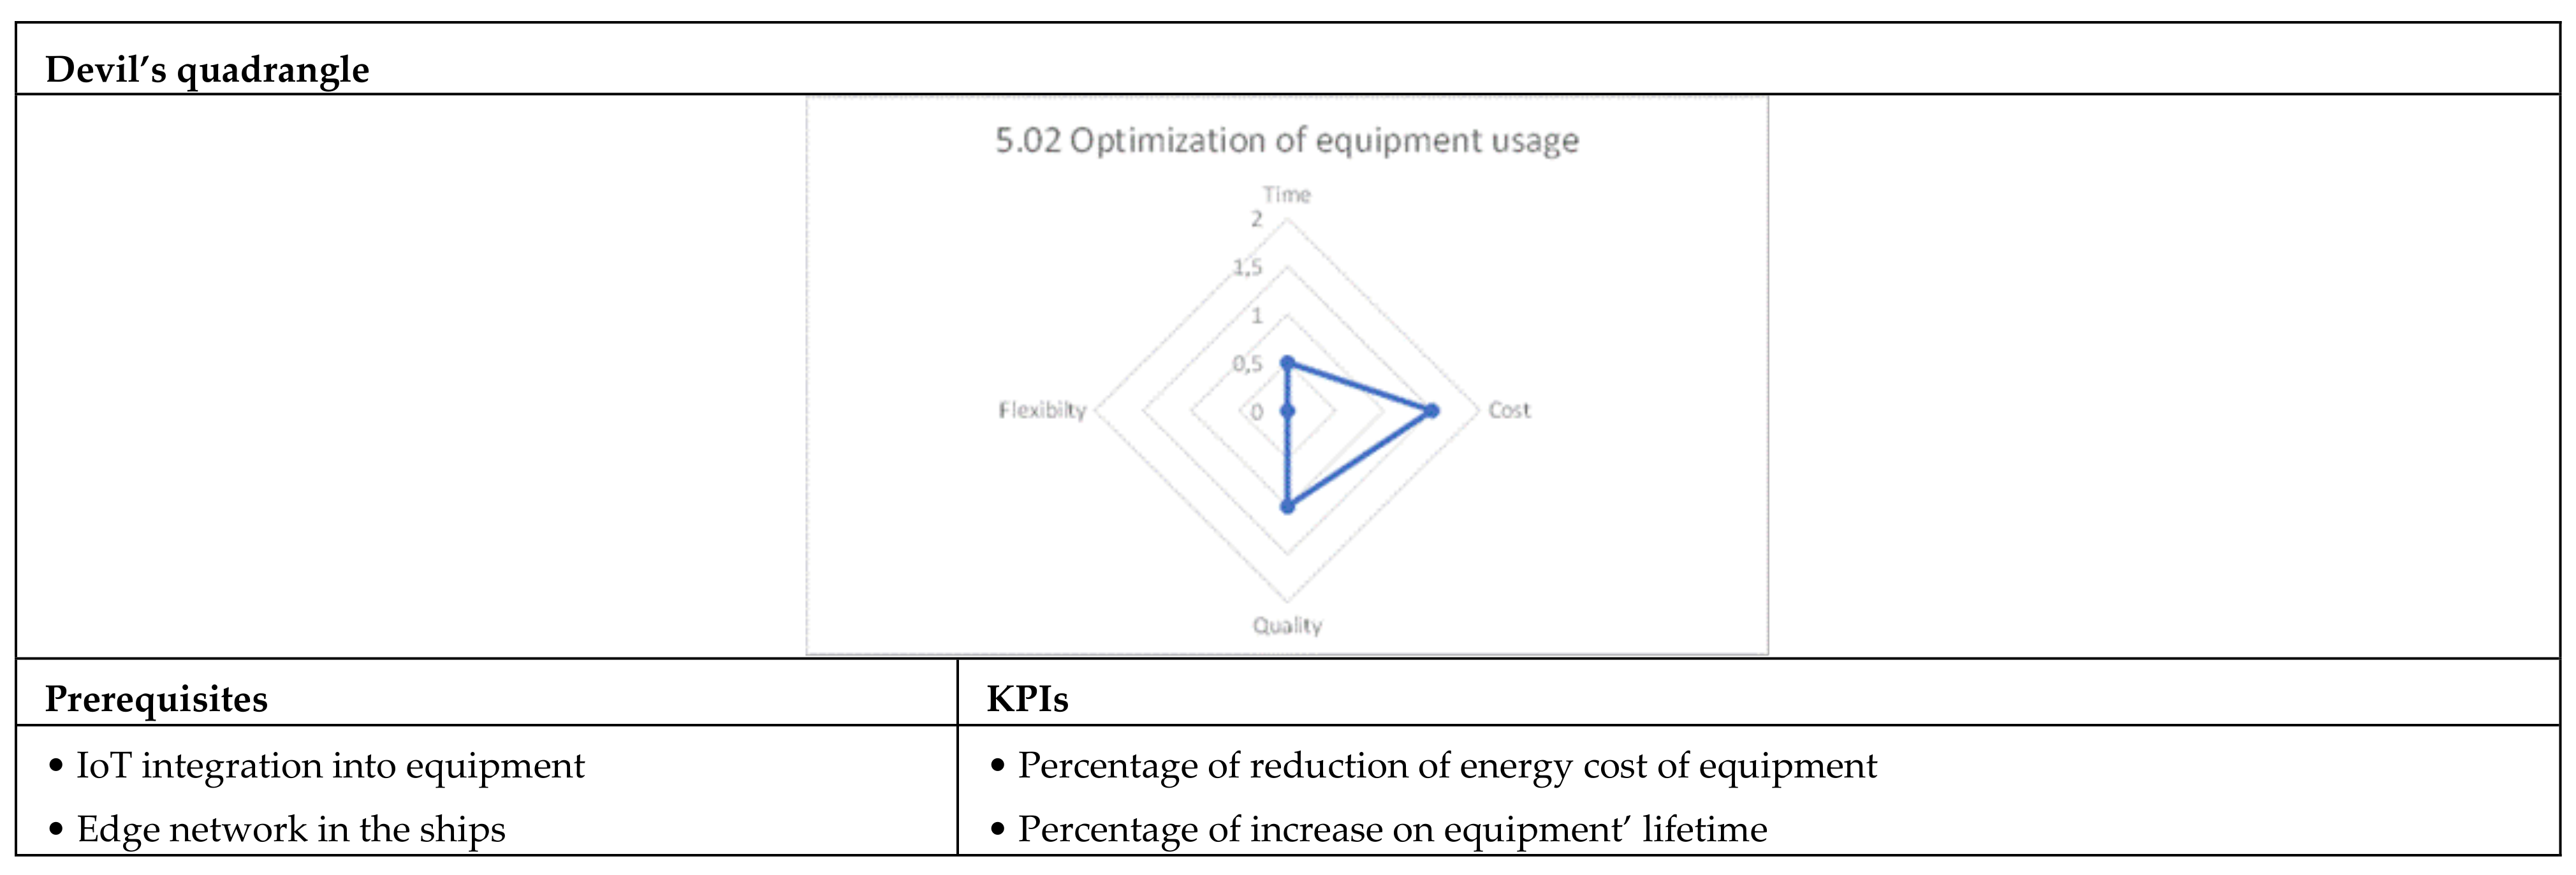
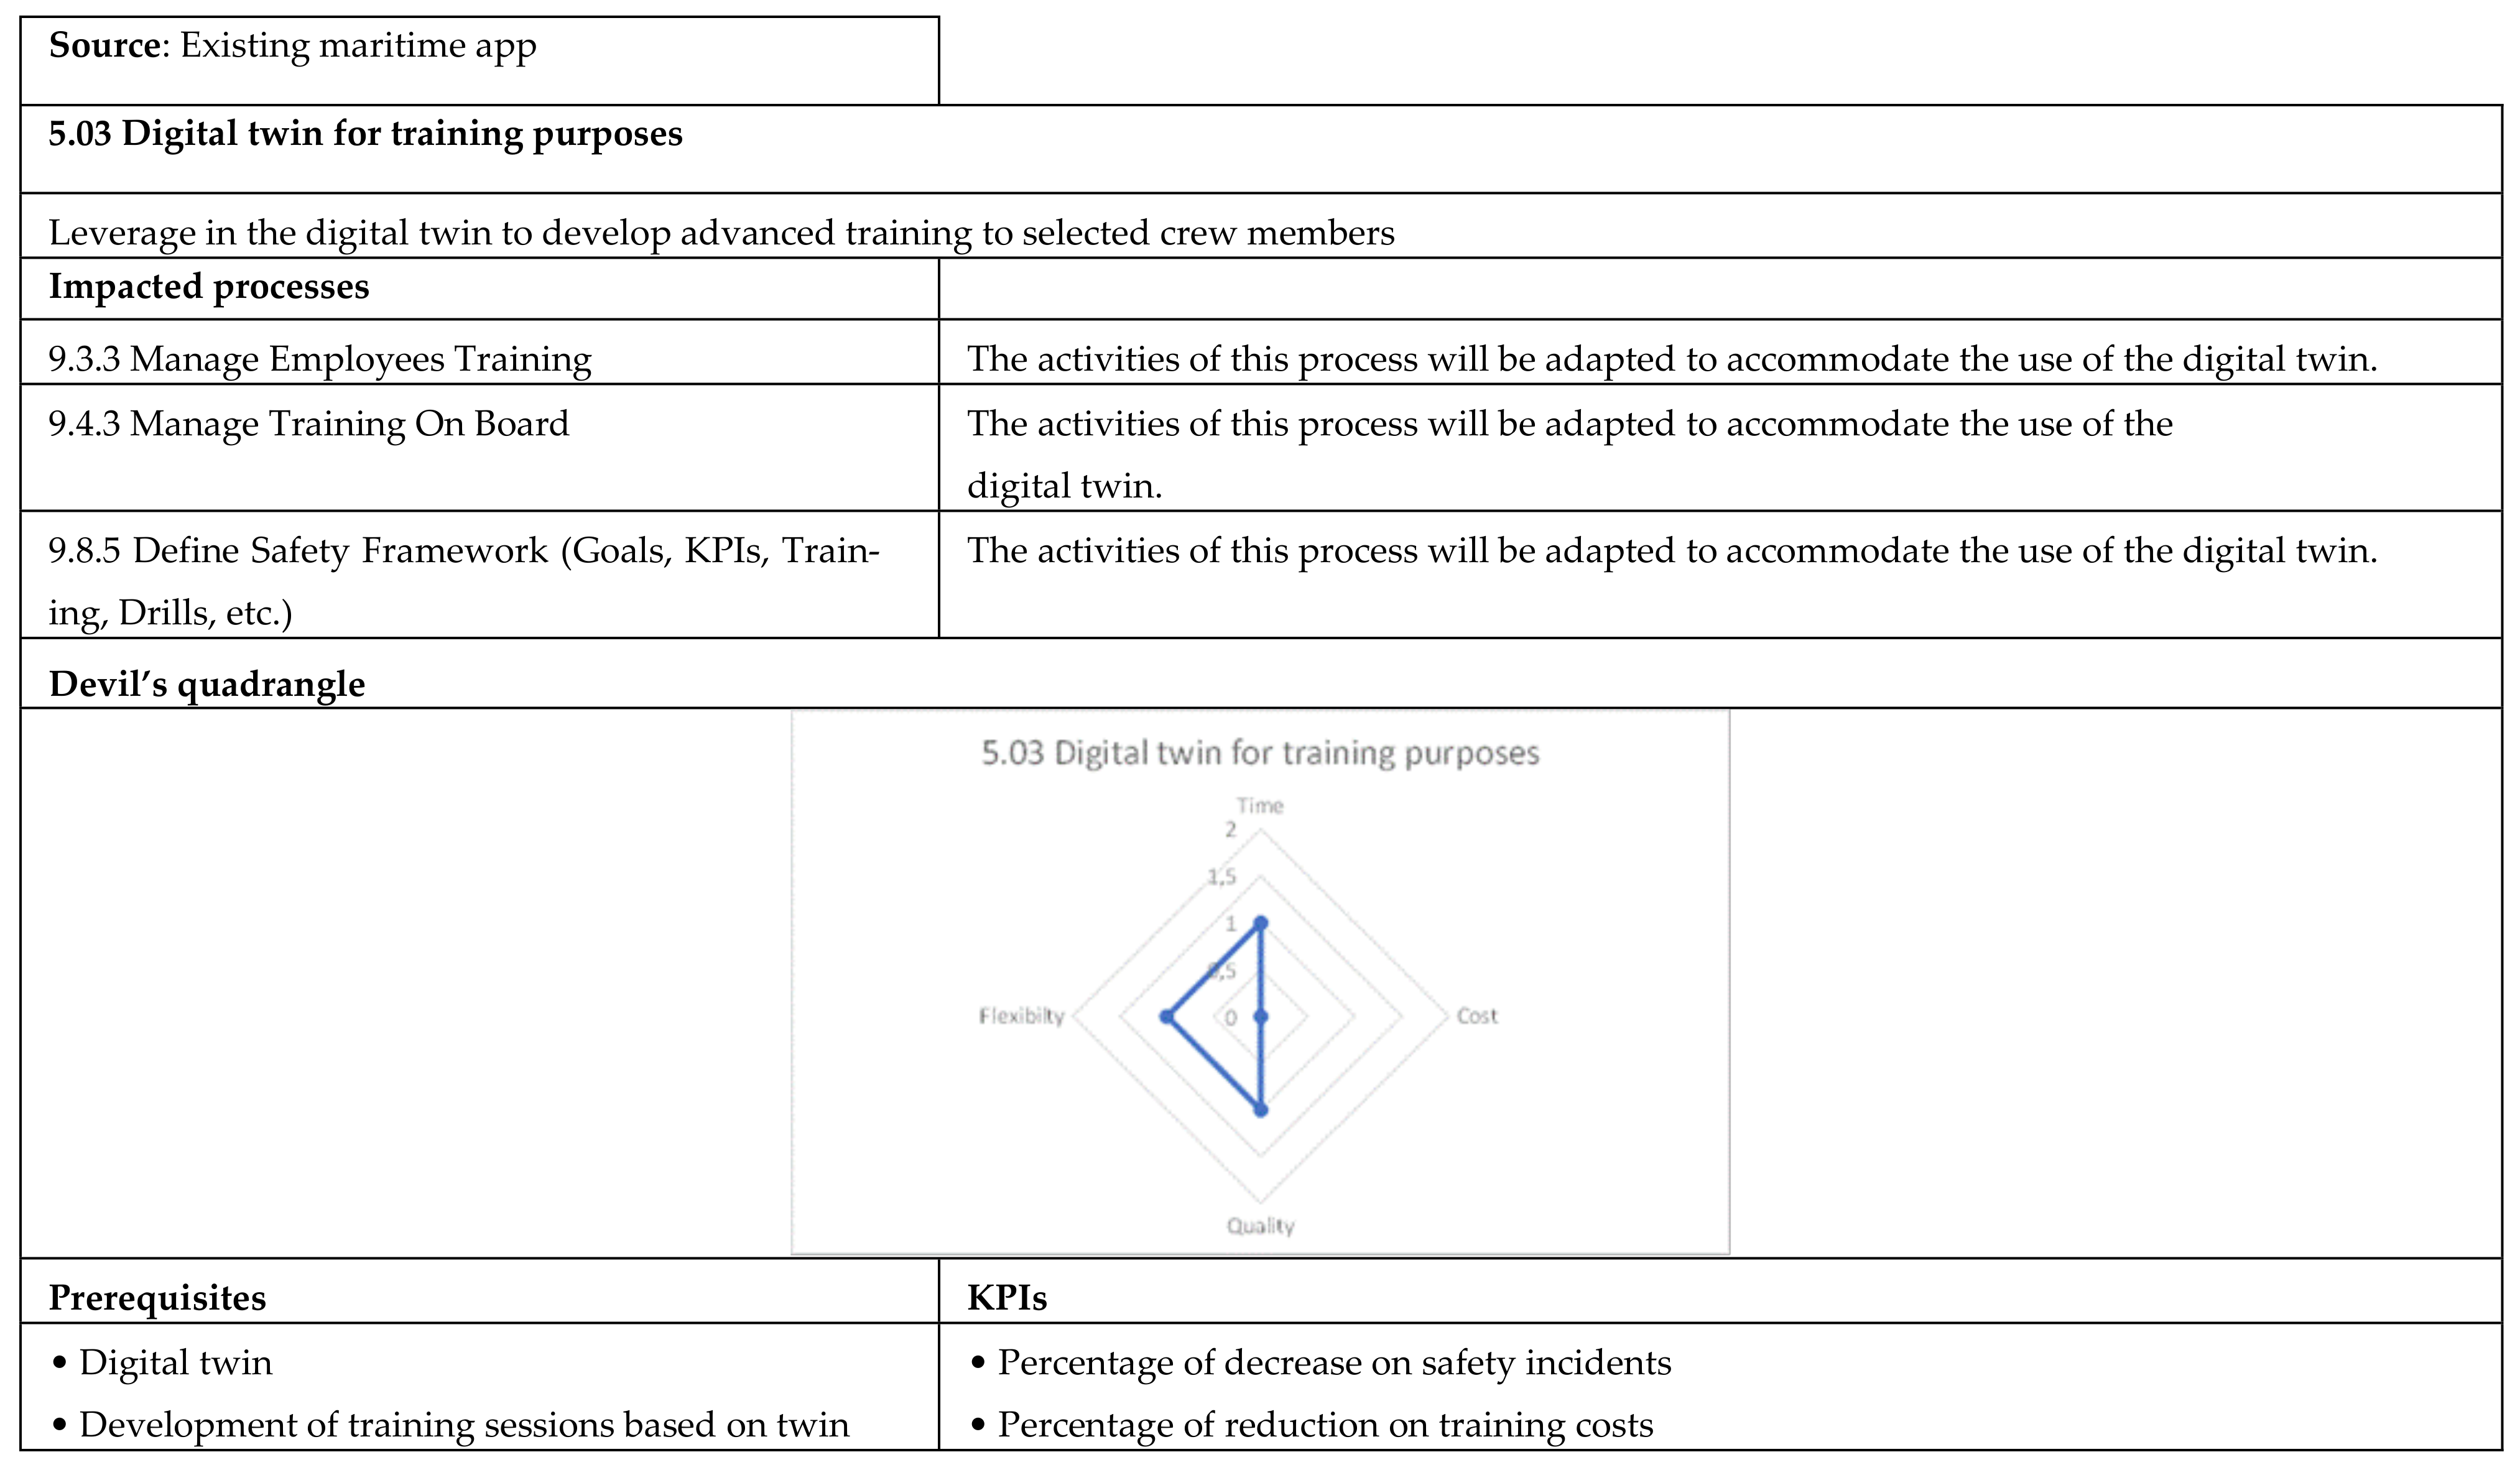
- The opposite also happens: applications that are at the bottom when looking at consolidated score are at the top for one performance dimension. This is the case of “3.04 ISPS security levels” (top in Time and Costs but bottom in Flexibility and Quality), “5.02 Optimization of equipment usage” (top in Costs but bottom or almost at the bottom in the rest). This happens also with “1.01 UV controlling system” and “1.02 Autonomous vessels” (top in Quality and low in the rest).
- ◦
- A list of 10 applications has been identified as “quick wins” applications that can be the starting point for digitalizing a company given their optimal results on the Time performance dimension and good results on the Costs performance dimension.
4. Conclusions
This work analyzes the impact of digitalization in a part of the maritime transport industry, the maritime containers shipping companies. This research has been conducted in order to help the digitalization of this industry, in particular in the aforementioned companies: digitalization in today’s world is required for remaining competitive.
The analysis of the introduction of digital applications in the Business Process Model of maritime containers shipping companies shows that digitalization is feasible for these companies and can be completed at different paces. Each company should make a specific and detailed plan for digitalization, according to their needs and environment. They can leverage the work presented here on the applications and the KPIs that should measure the implementation of any of these applications.
Companies can also benefit from the identification of the applications named in this work as “quick wins”; these applications can be a sandbox that can be used to test the benefits of digitalization and learn how to best execute the deployment customized to the needs of the company. Application “5.01 Container tracking” is in the top of the list of these “quick wins” given its optimal behavior when looking at the four performance dimensions for processes (Time, Costs, Quality, and Flexibility).
The impact of digitalization is high when trying to deploy all the applications at the same time in a big bang approach. Such an approach is not advisable not only given the high investment it requires but also due to the risks that such a huge effort poses for a company. Companies should consider the impacts in their processes and the applications’ prerequisites documented for each application in Section 3 of this work. They should also review their existing balanced scorecard incorporating the application’s KPIs documented in the aforementioned section. The KPIs defined are 51, but with 11 of them, a company can track the majority of the impacts of an application deployment.
A relevant outcome of the analysis of the results of the impacts in processes is that the Operational process categories domain is the one with higher impacts. This is a consequence of the applications trying to impact the processes that generate the company’s incomes. Looking at the rest of the process categories domains, there is one process that stands out from the rest, “Analyze Competitors Routes”. This process from the Strategy, Infrastructure, and Products process categories domain is impacted by four different applications given the importance that the market and the research is given to a company’s strategy.
Digitalizing a company imposes changes in their processes and the definition of new processes as well as the decommissioning of others. In other words, digitalization will change the way a company operates. This is something that must be taken into account when defining the deployment plan of the applications, educating their personnel in the new way of doing things and the benefits that this will bring.
Digitalization has many impacts in the company’s operations but a plan well defined, in which the impacts and prerequisites are detailed and where a number of KPIs is included to track the deployment’s performance, is the key for success. This work covers these aspects in order to allow a successful digitalization.
Author Contributions
P.-L.S.-G. designed the methodology and applied it to obtain the results; D.D.-G. and L.R.N.-R. analyzed the results and provided feedback on the reporting; P.-L.S.-G. wrote the work. All authors have read and agreed to the published version of the manuscript.
Funding
This research is under consideration for funding by Fundación Marqués de Suanzes and by Soermar Chair from Universidad Politécnica de Madrid.
Institutional Review Board Statement
Not applicable.
Informed Consent Statement
Not applicable.
Conflicts of Interest
The authors declare no conflict of interest.
Appendix A. Application Data Sheets
Figure A1.
UV controlling system data sheet.


Figure A2.
Autonomous vessels data sheet.

Figure A3.
Digital twin for AV controlling and maintenance data sheet.


Figure A4.
Use of robots in complex/hazardous tasks data sheet.

Figure A5.
AI dynamic positioning of surrounding vessels data sheet.

Figure A6.
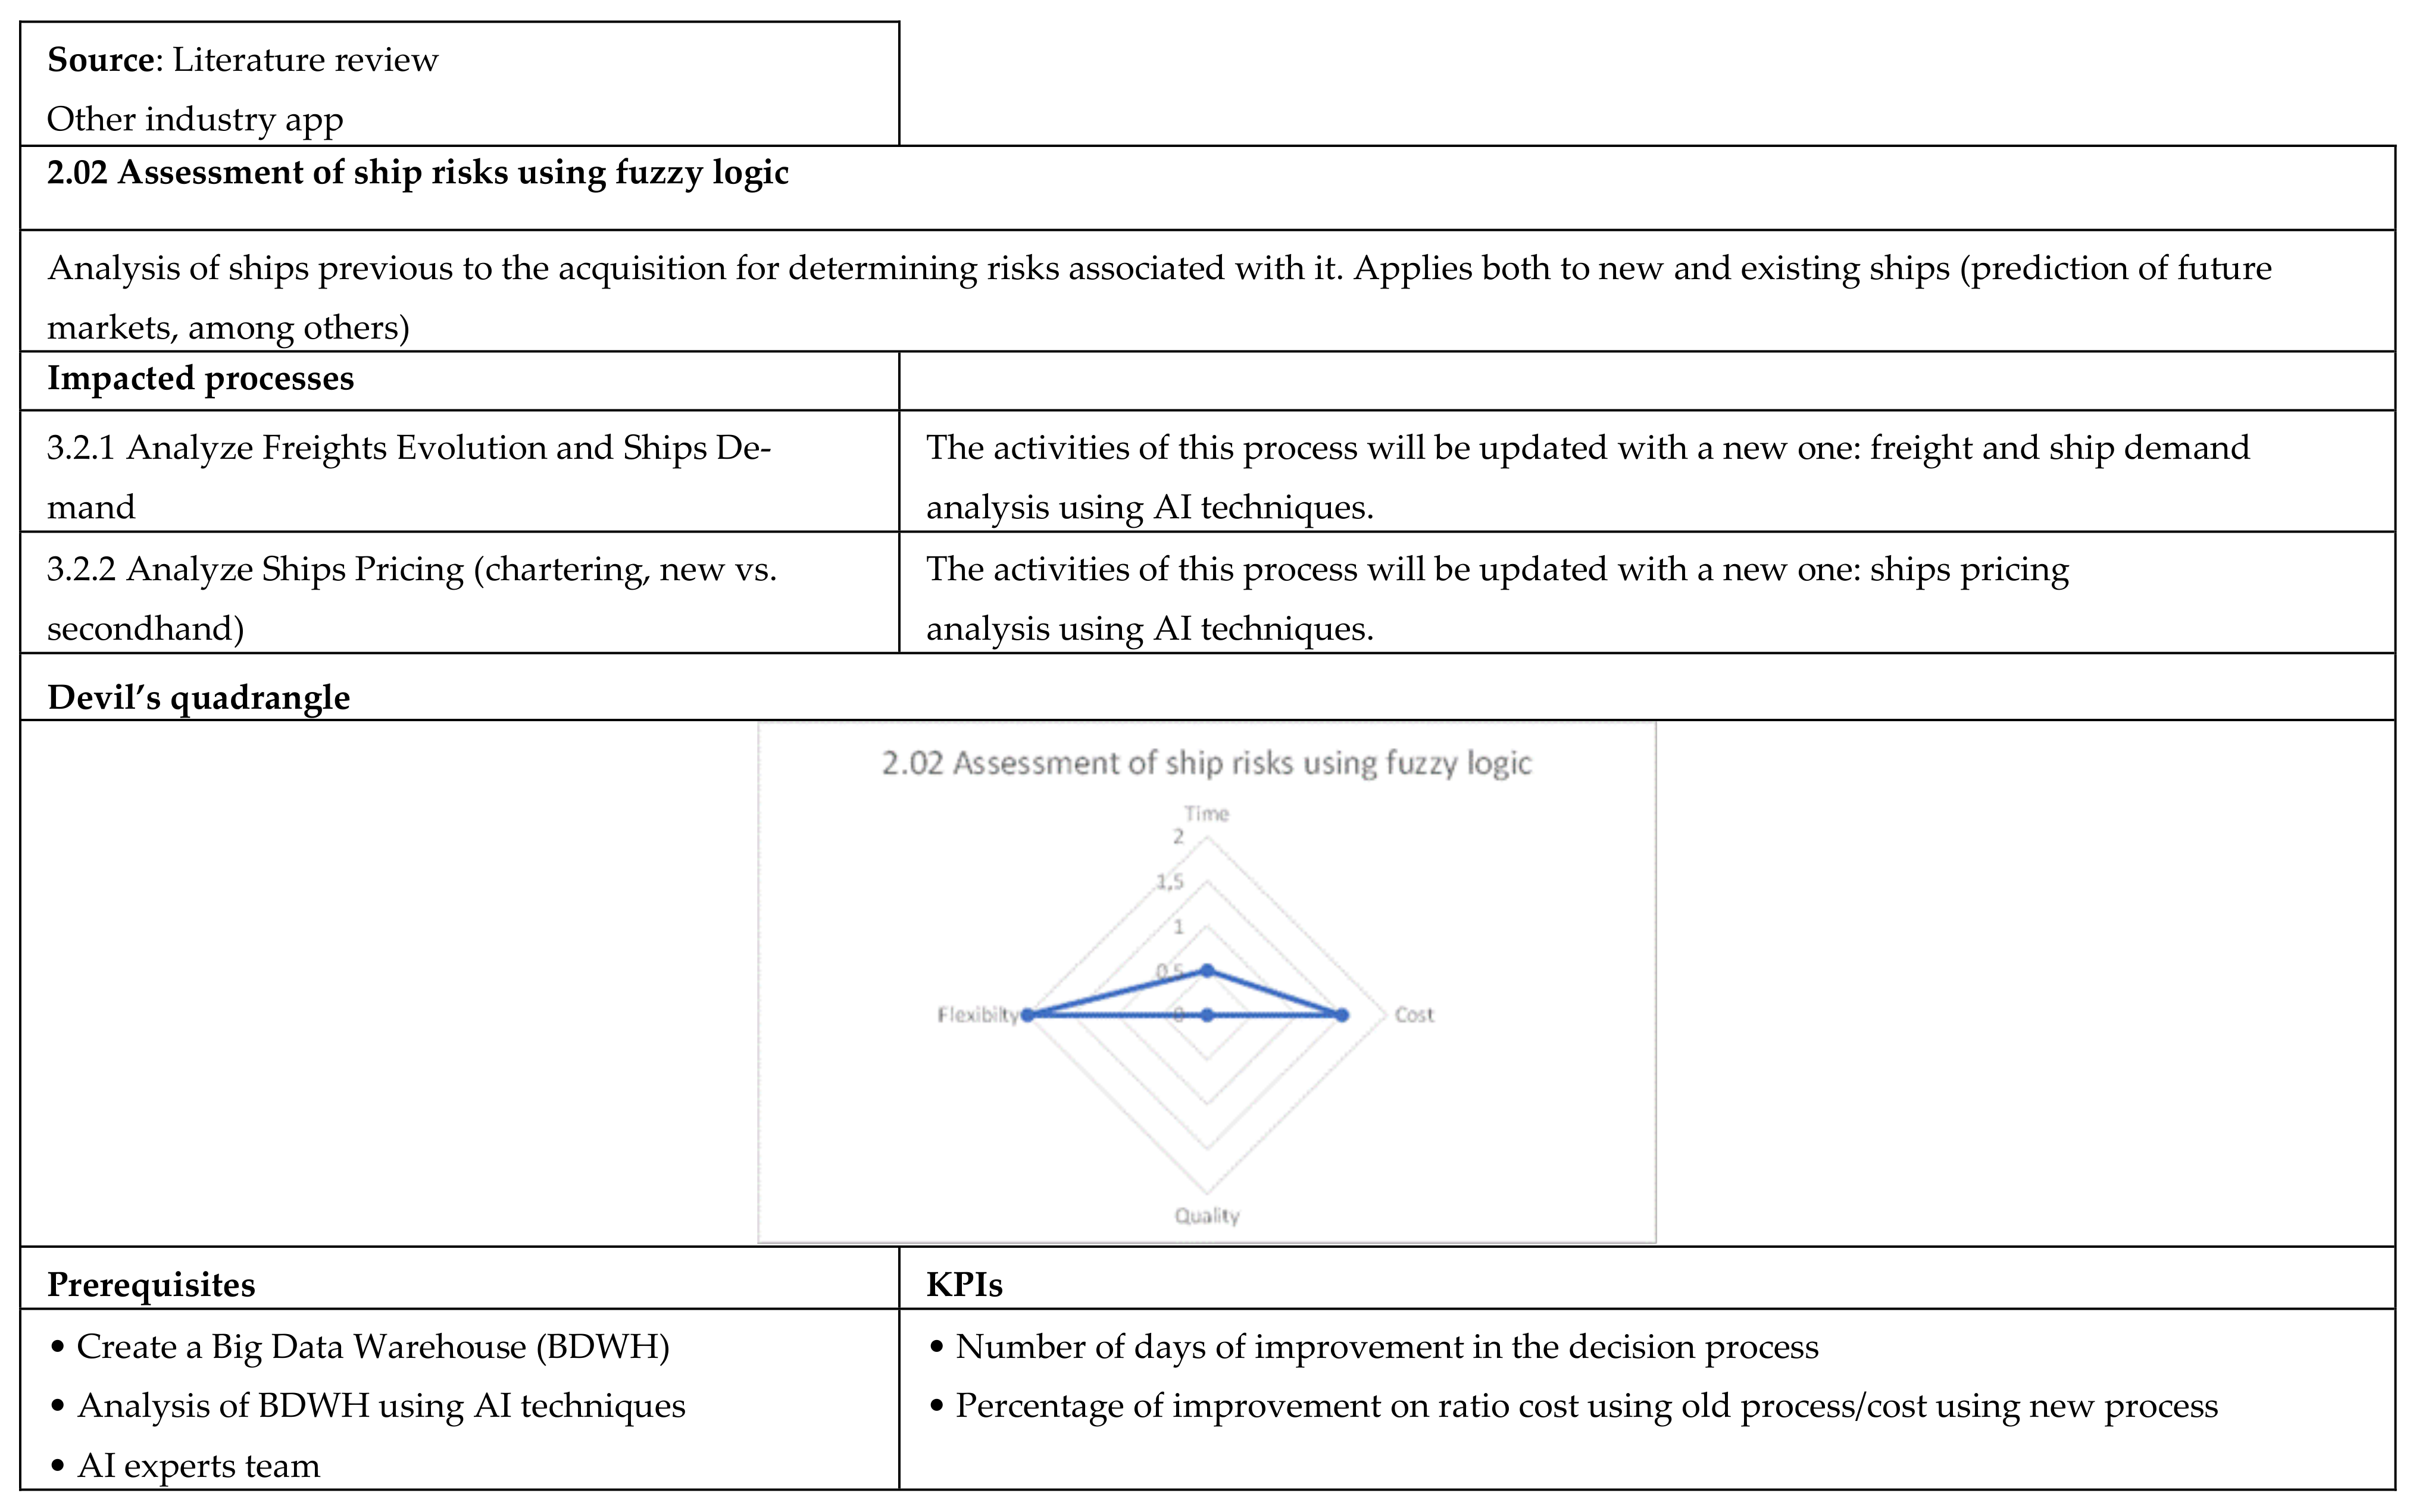
Assessment of ship risks using fuzzy logic data sheet.

Figure A7.
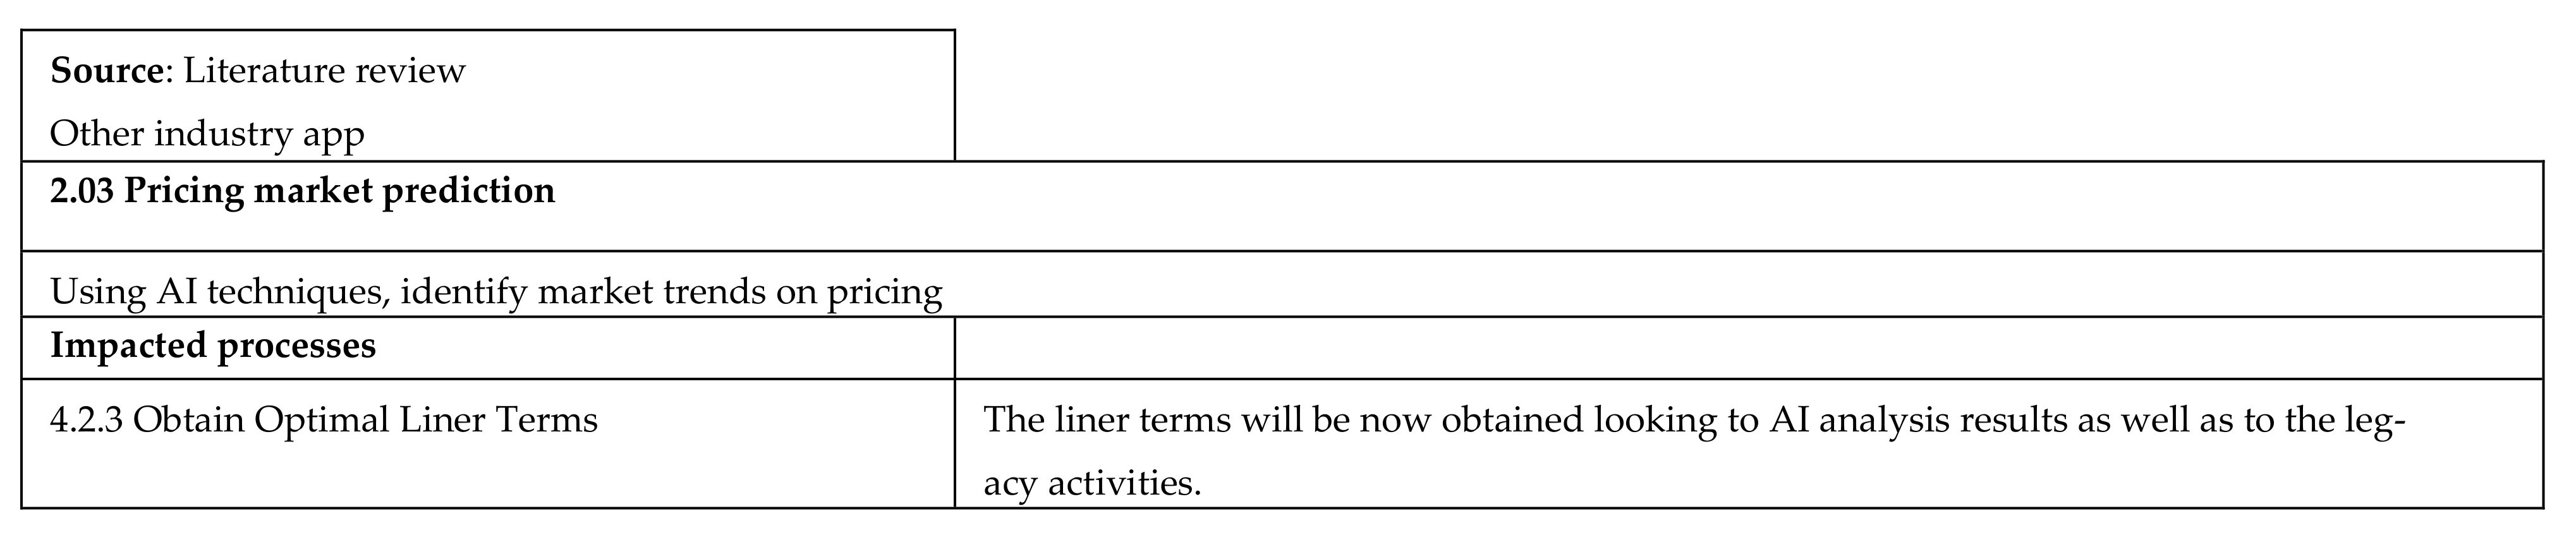
Pricing market prediction data sheet.


Figure A8.
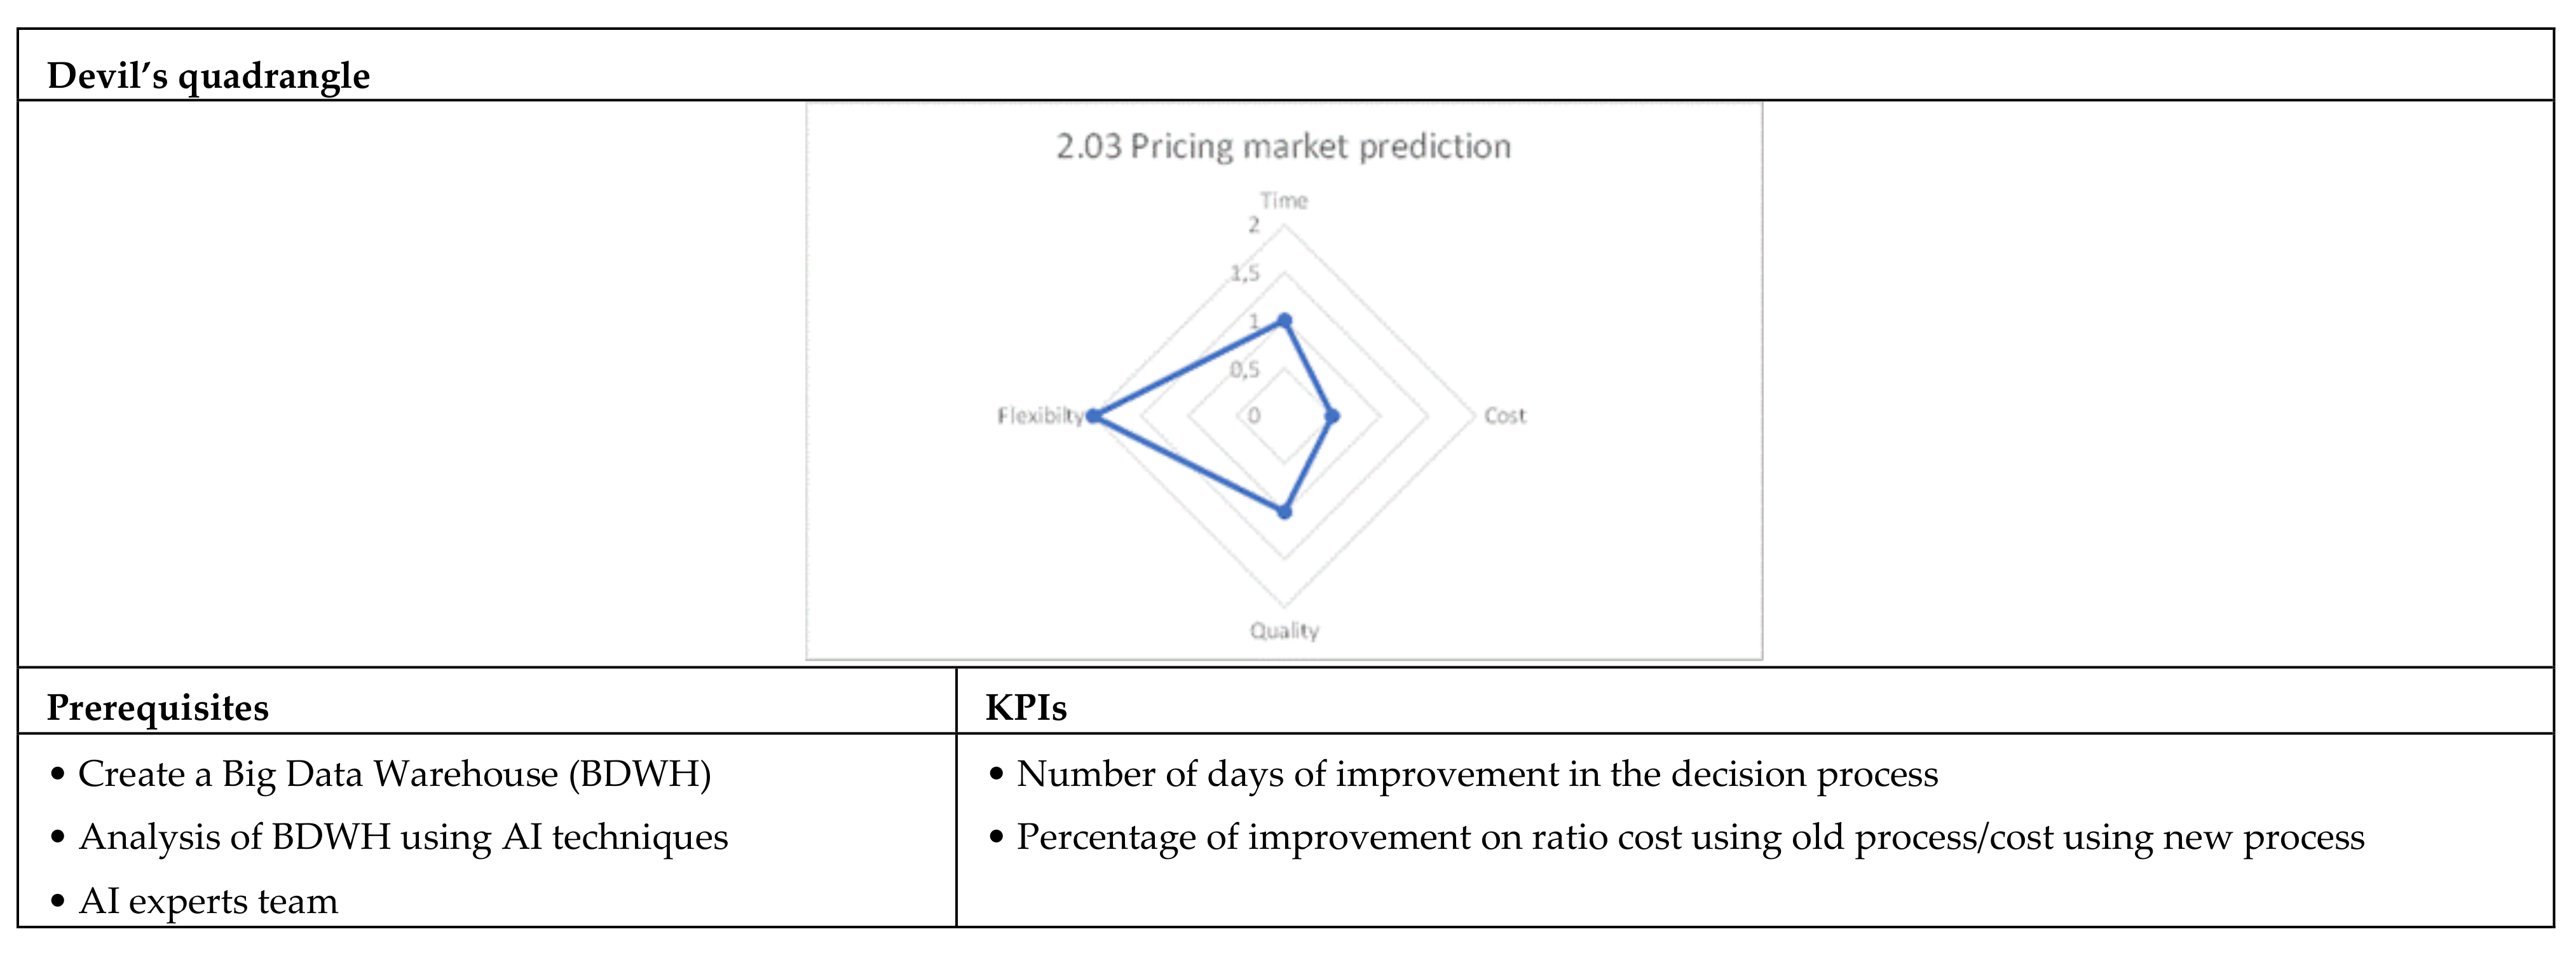
Route optimization via AI analysis of client information data sheet.

Figure A9.
Client offering optimization via AI analysis of client information data sheet.


Figure A10.
Analysis of engine parameters to anticipate issues data sheet.

Figure A11.
Route optimization via AI analysis of operational information data sheet.


Figure A12.
Process optimization and reengineering using AI data sheet.

Figure A13.
Freight rate optimization data sheet.

Figure A14.
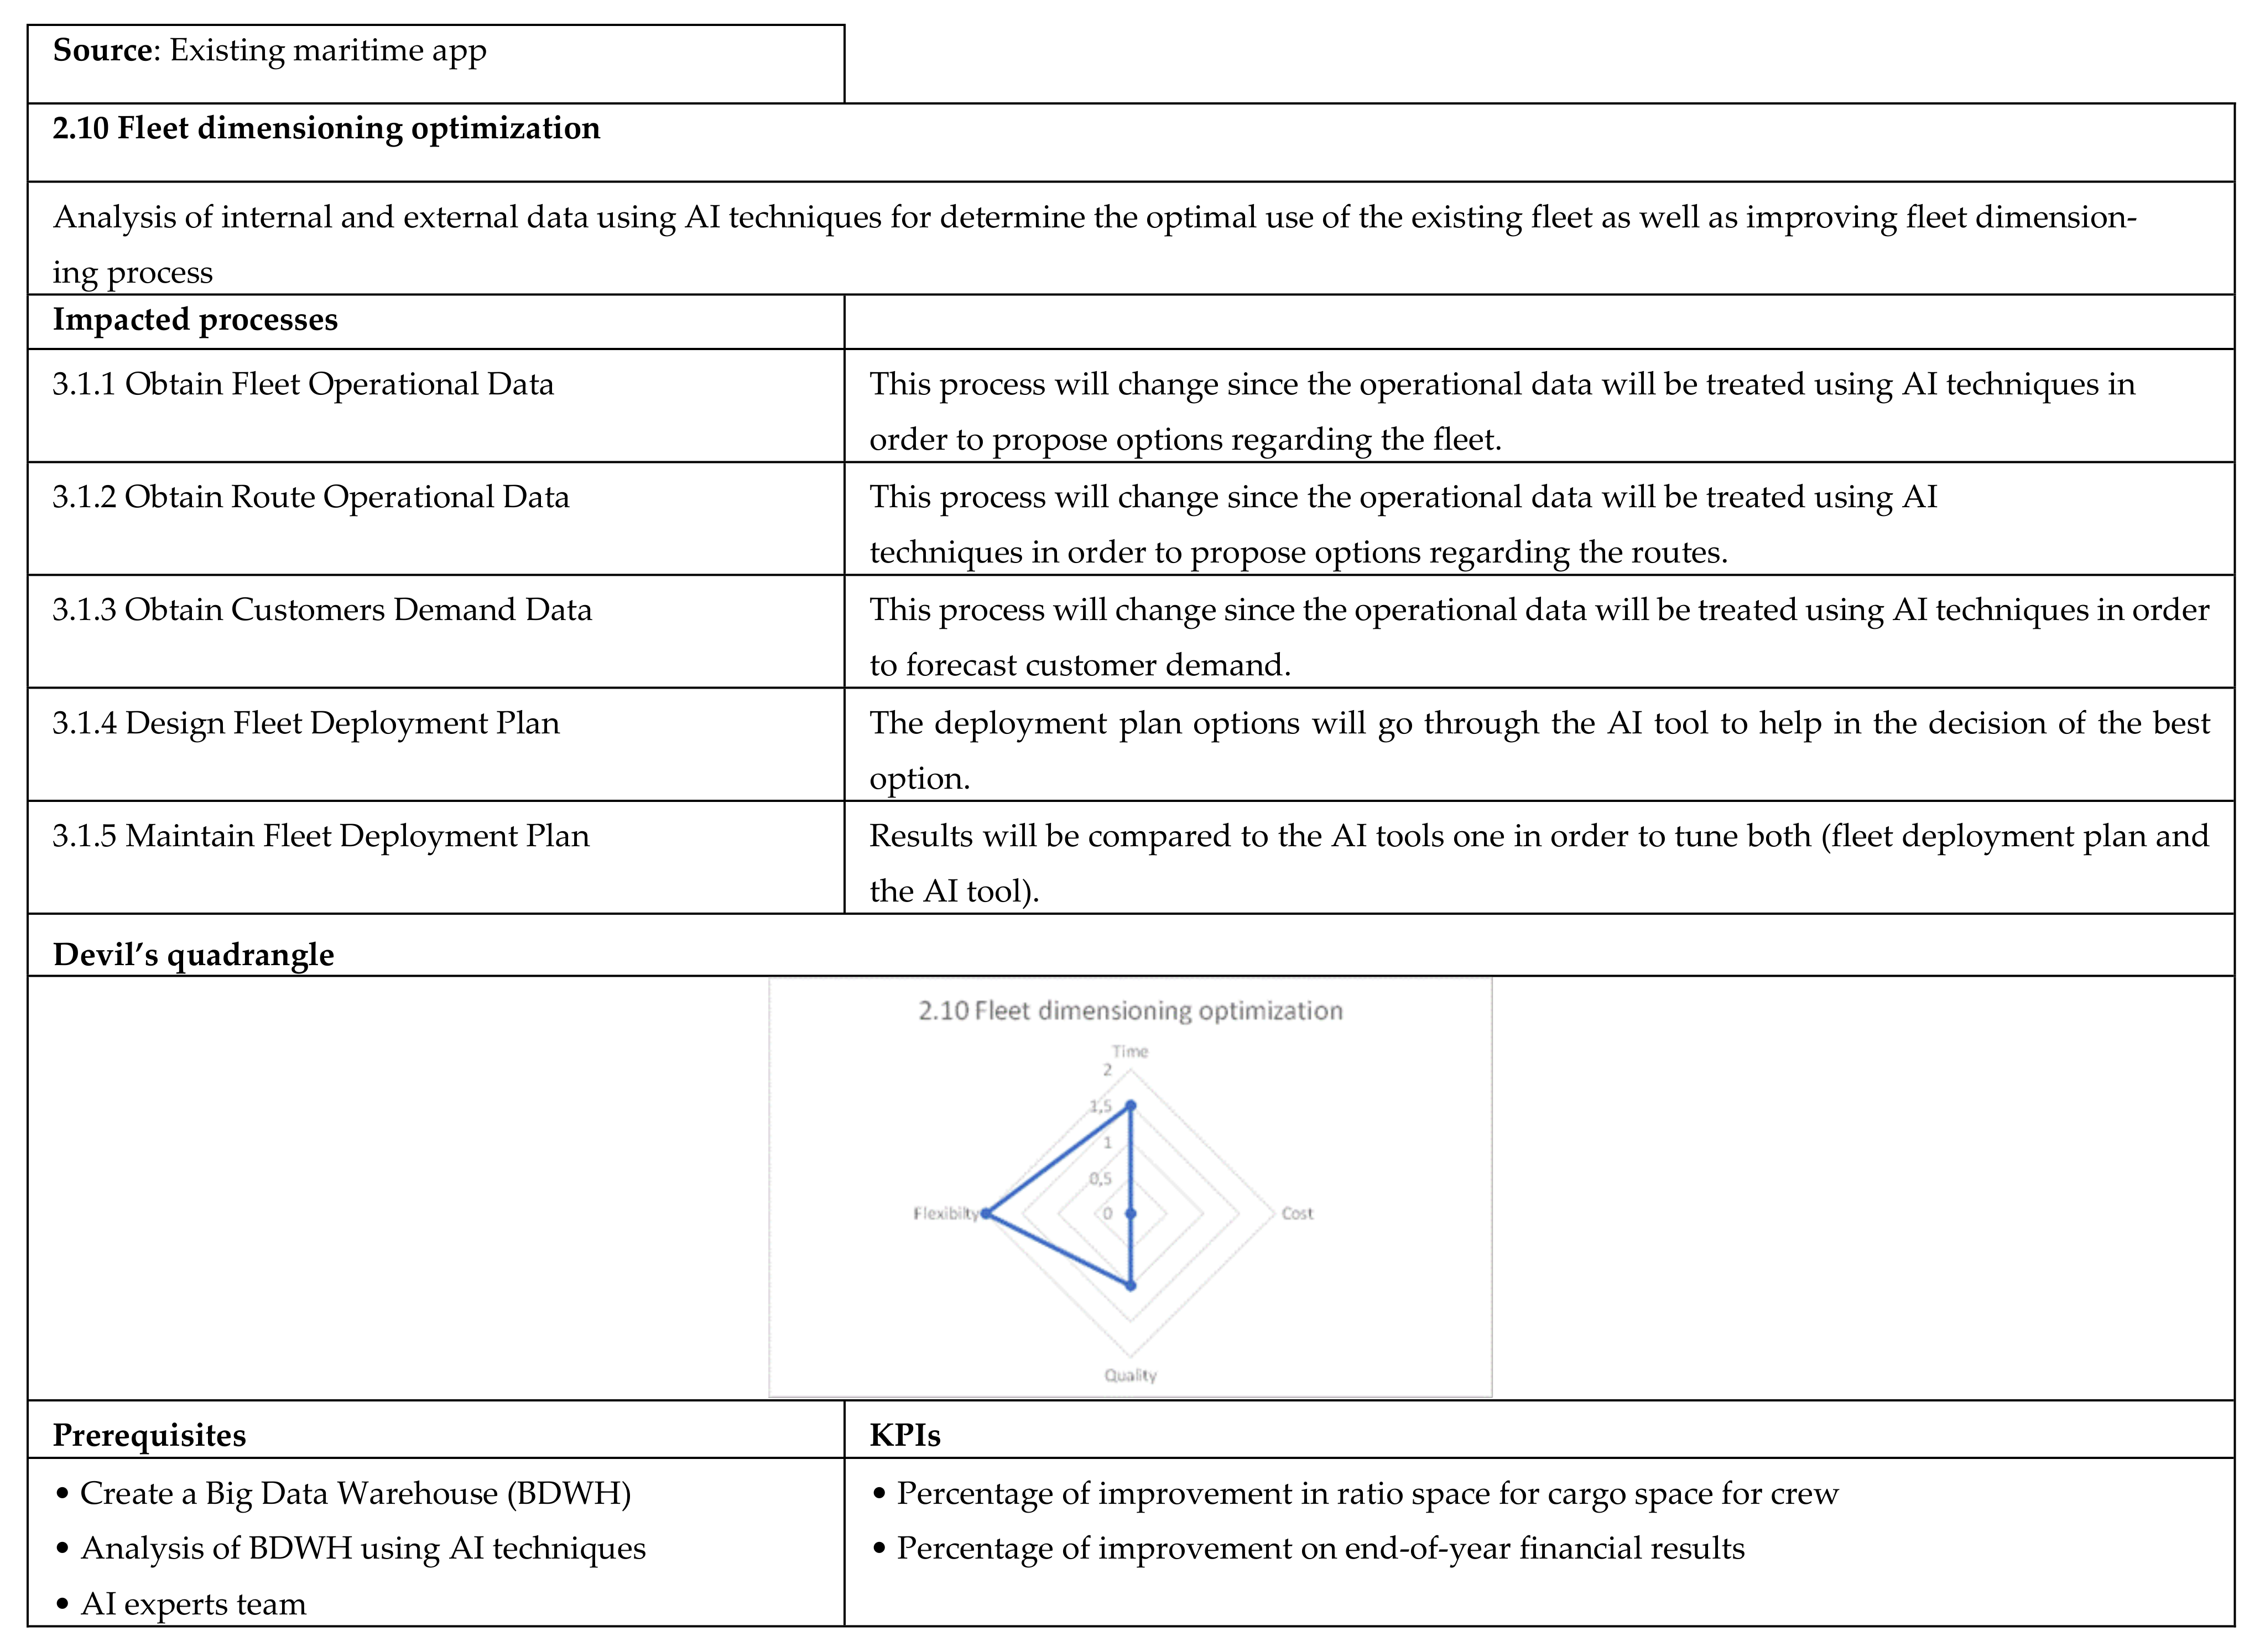
Fleet dimensioning optimization data sheet.

Figure A15.
Optimizing maintenance process using digital twin and AI data sheet.

Figure A16.
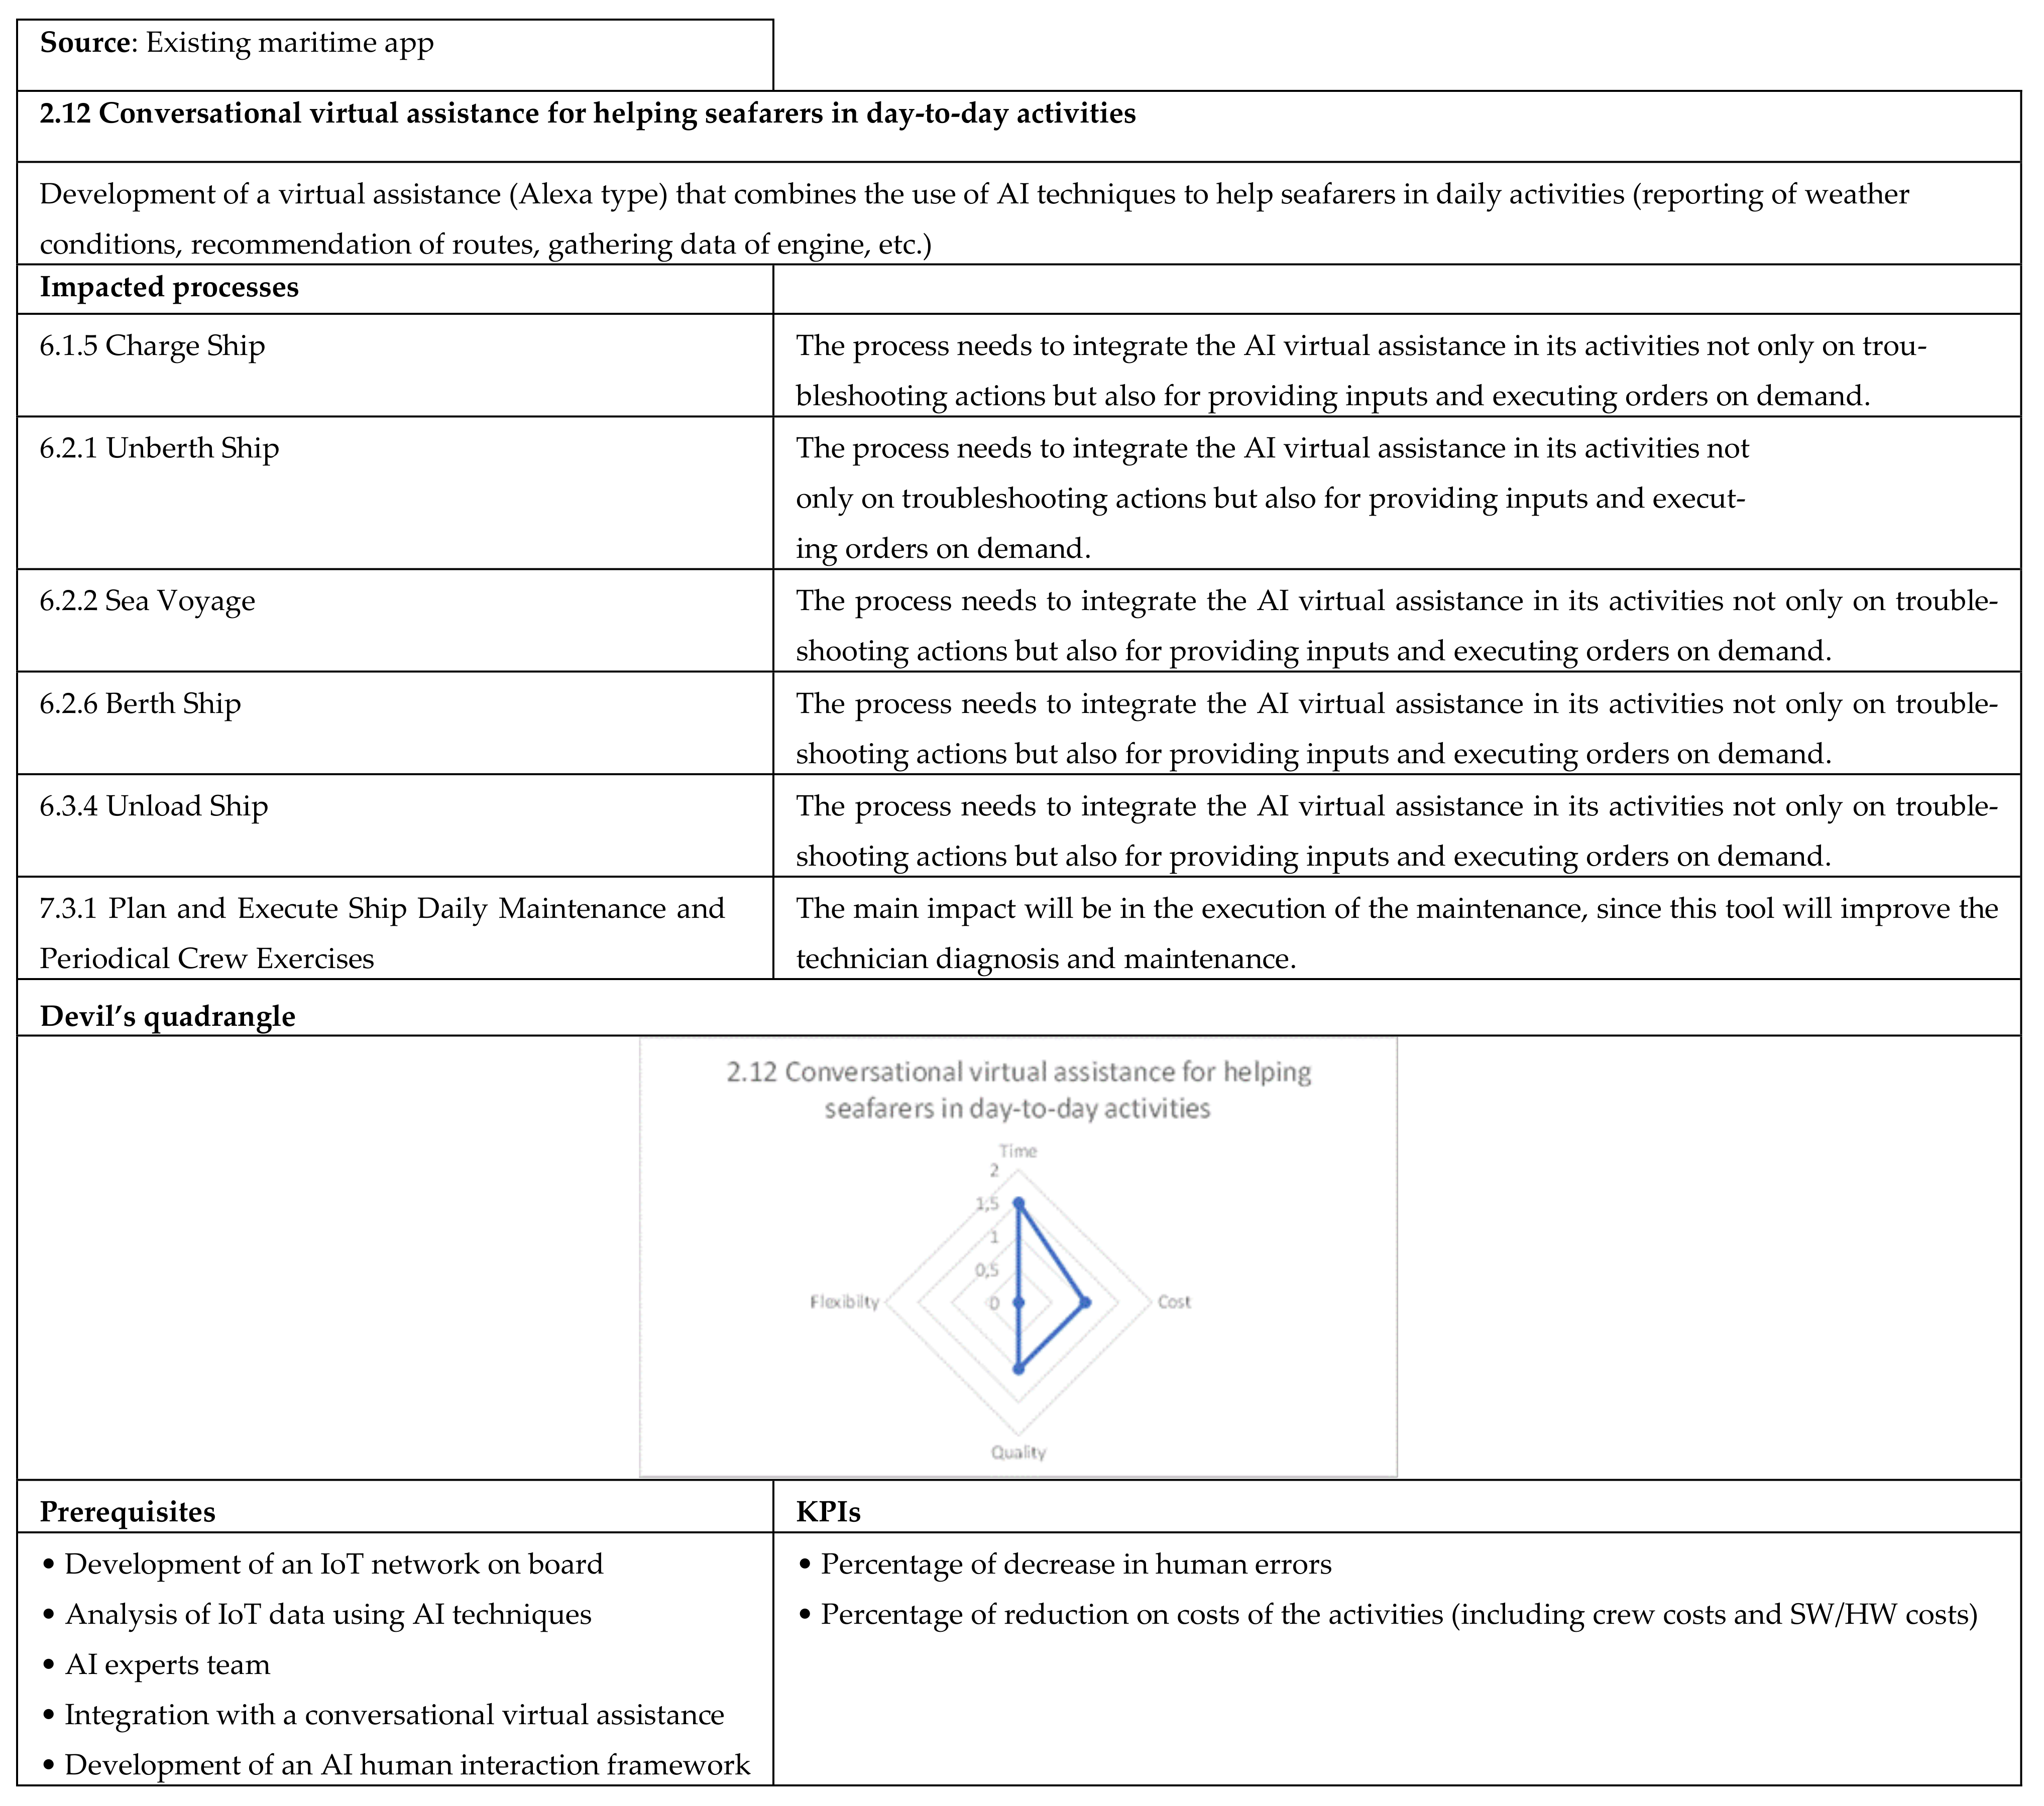
Conversational virtual assistance for helping seafarers in day-to-day activities data sheet.
Figure A16.
Conversational virtual assistance for helping seafarers in day-to-day activities data sheet.

Figure A17.
Analysis of ship structure images to anticipate issues data sheet.


Figure A18.
Optimizing ship’s operations via AI analysis of operational information data sheet.

Figure A19.
AI applied to cybersecurity data sheet.


Figure A20.
AI applied to data management and clean data sheet.

Figure A21.
AI applied to competitors tracking and monitoring data sheet.

Figure A22.
AI applied to business partners tracking and monitoring data sheet.

Figure A23.
AI applied to providers tracking and monitoring data sheet.

Figure A24.
AI applied to 3 parties route prediction data sheet.

Figure A25.
Using AI to enhance navigation safety data sheet.


Figure A26.
Using AI to reduce emissions data sheet.

Figure A27.
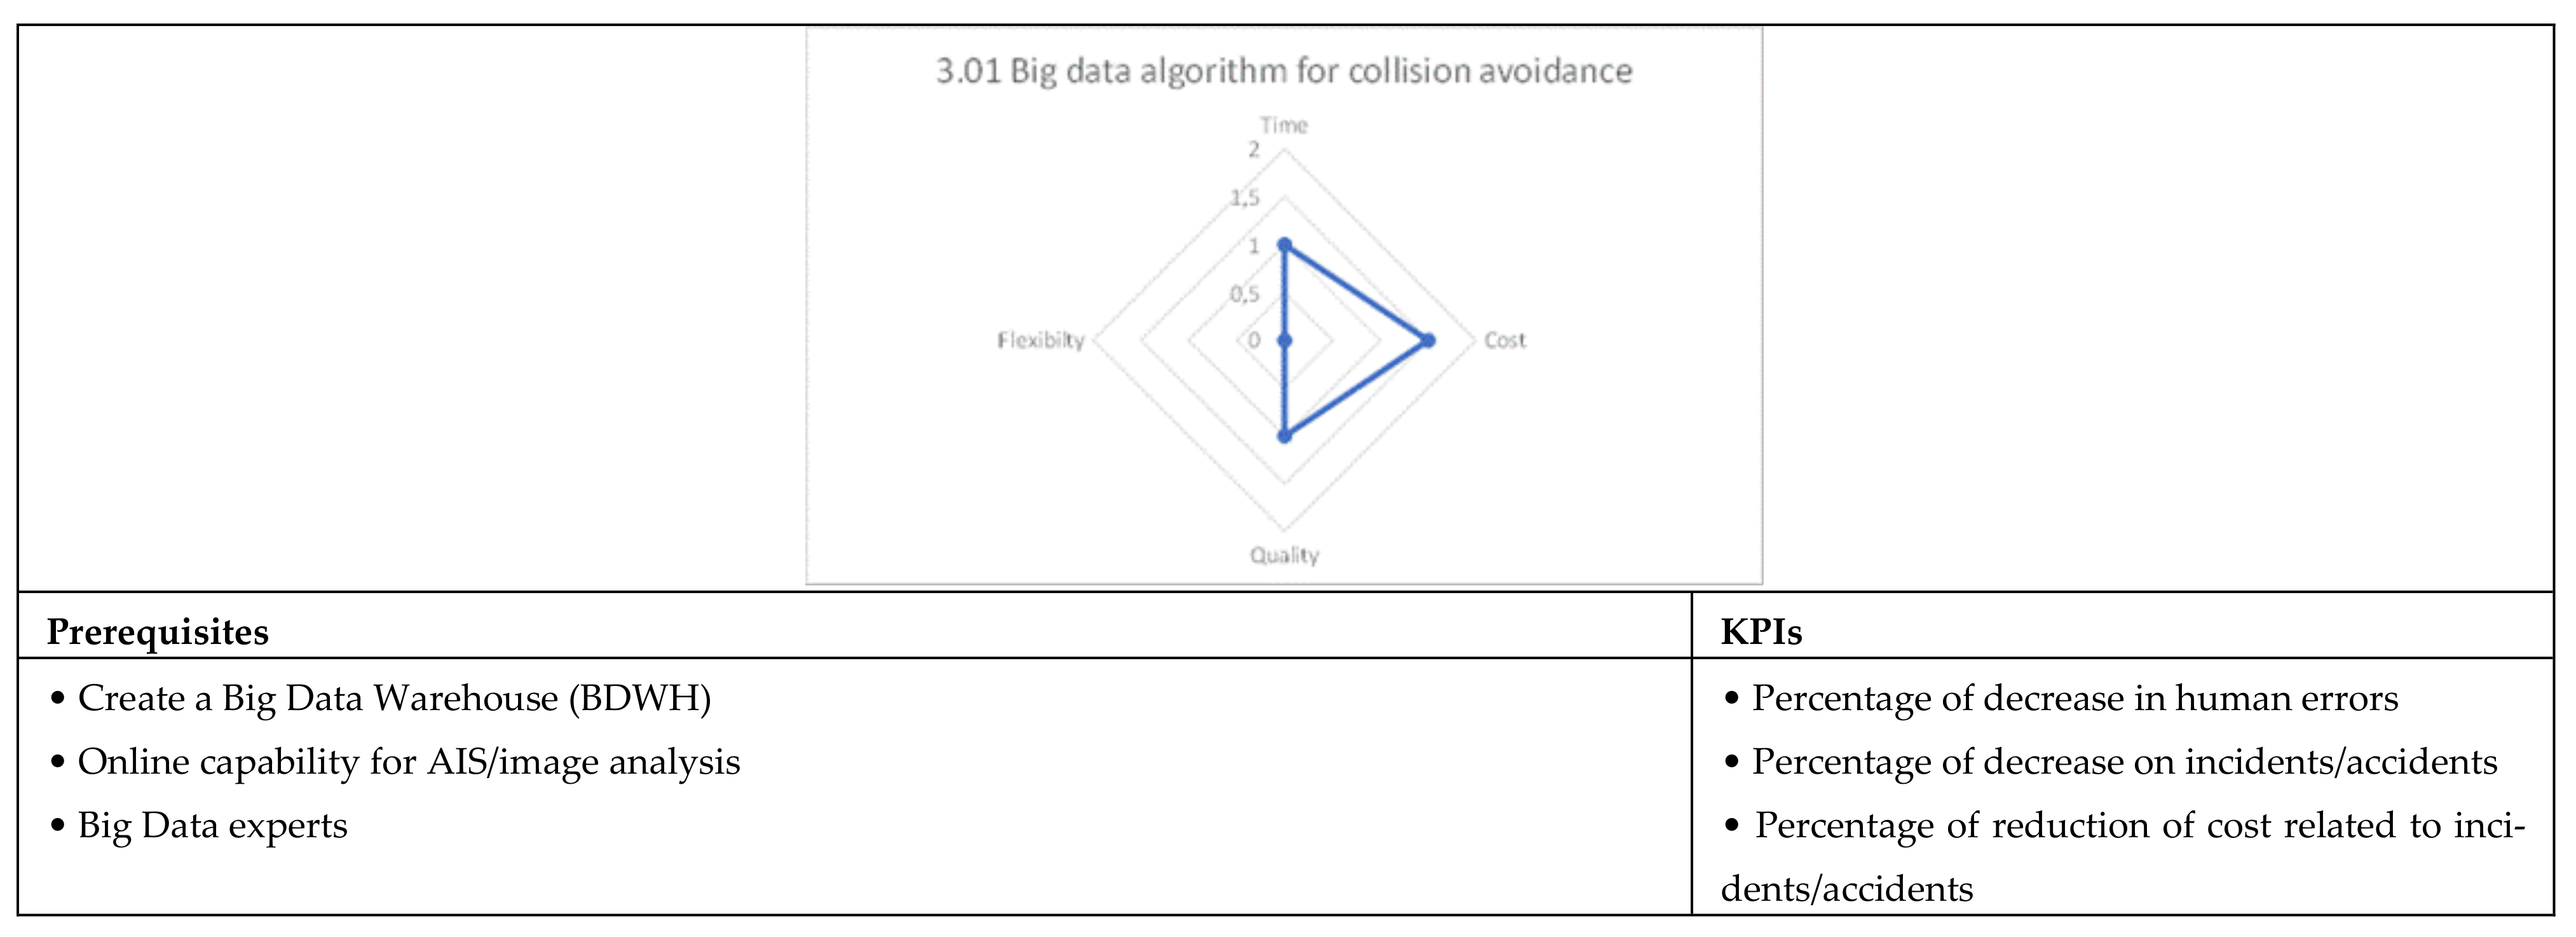
Big data algorithm for collision avoidance data sheet.


Figure A28.
Big data analysis for energy-efficiency data sheet.

Figure A29.
Analysis of data on consumption and emissions for bunkering selection data sheet.


Figure A30.
ISPS security levels data sheet.

Figure A31.
Big data for ship renewal data sheet.


Figure A32.
Big data for ship speed controlling data sheet.

Figure A33.
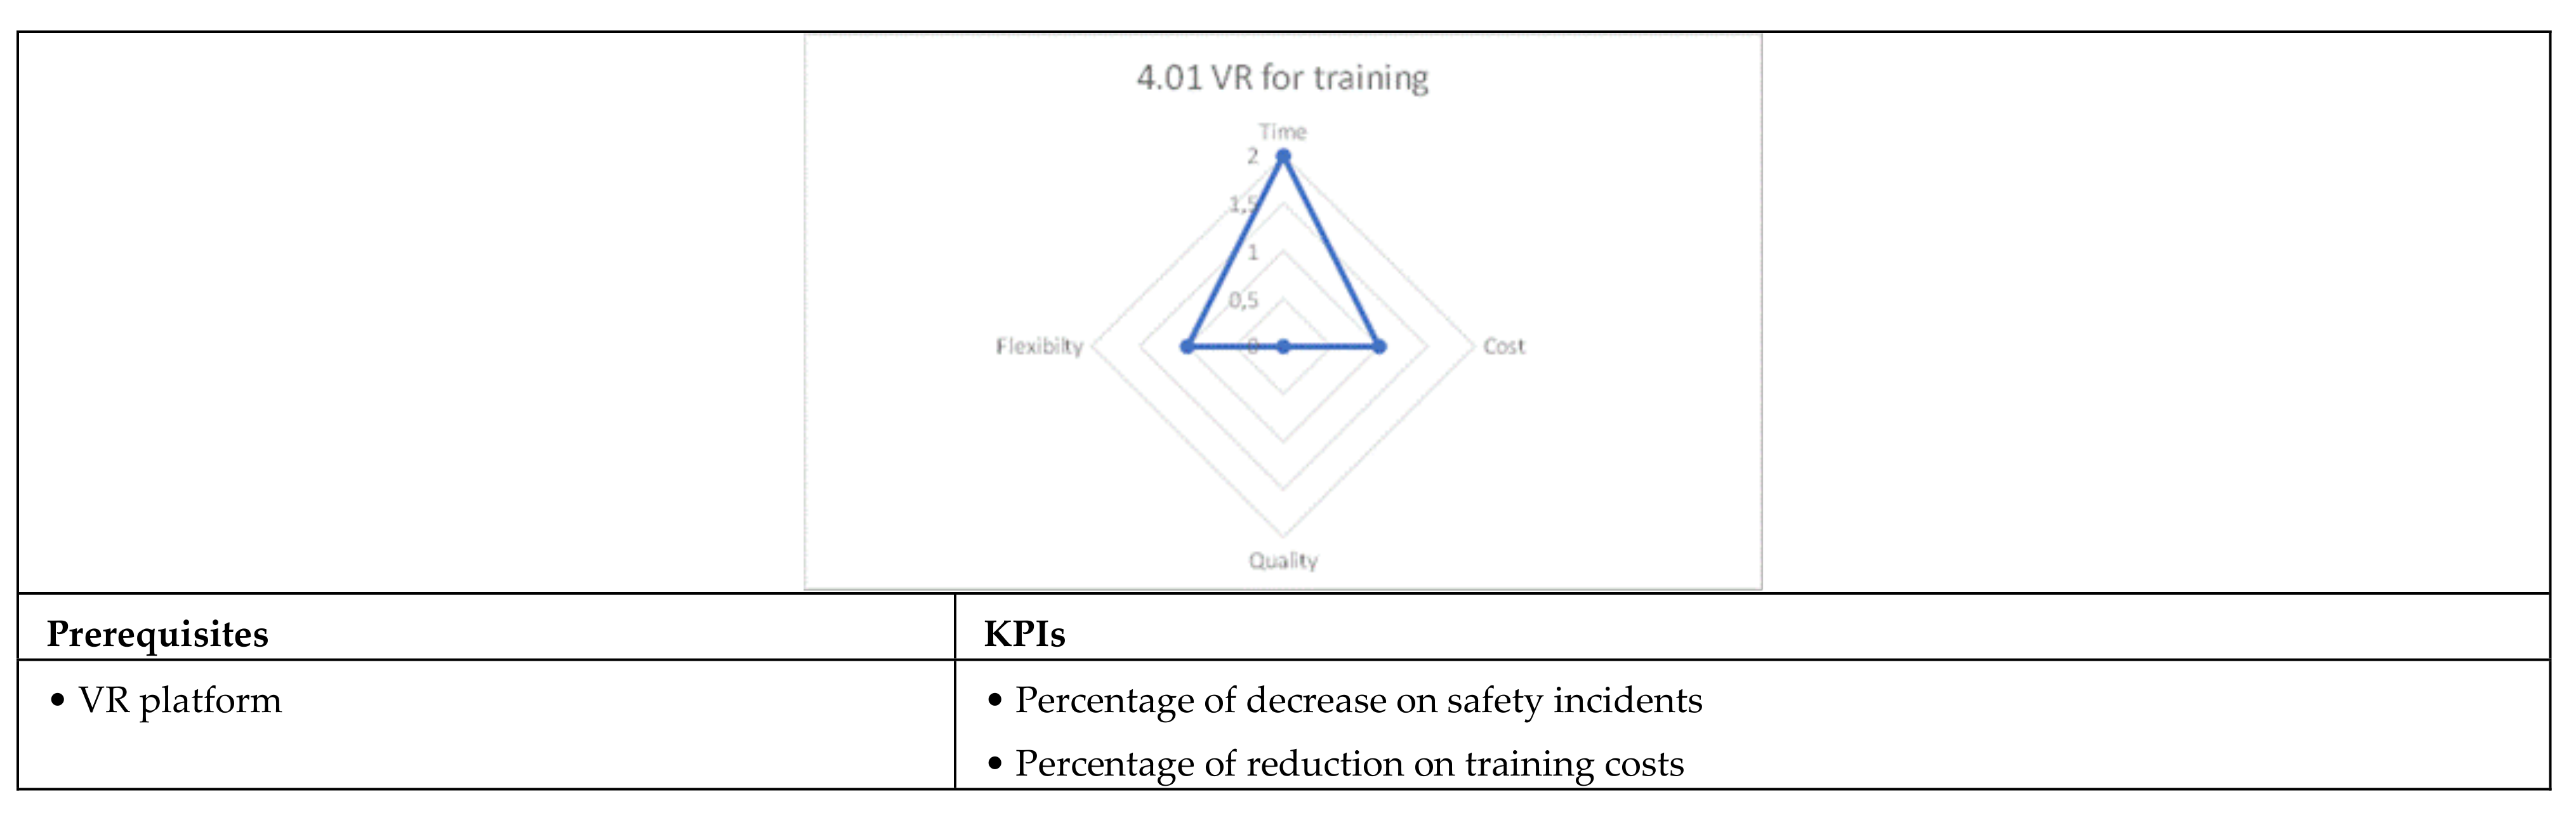
VR for training data sheet.


Figure A34.
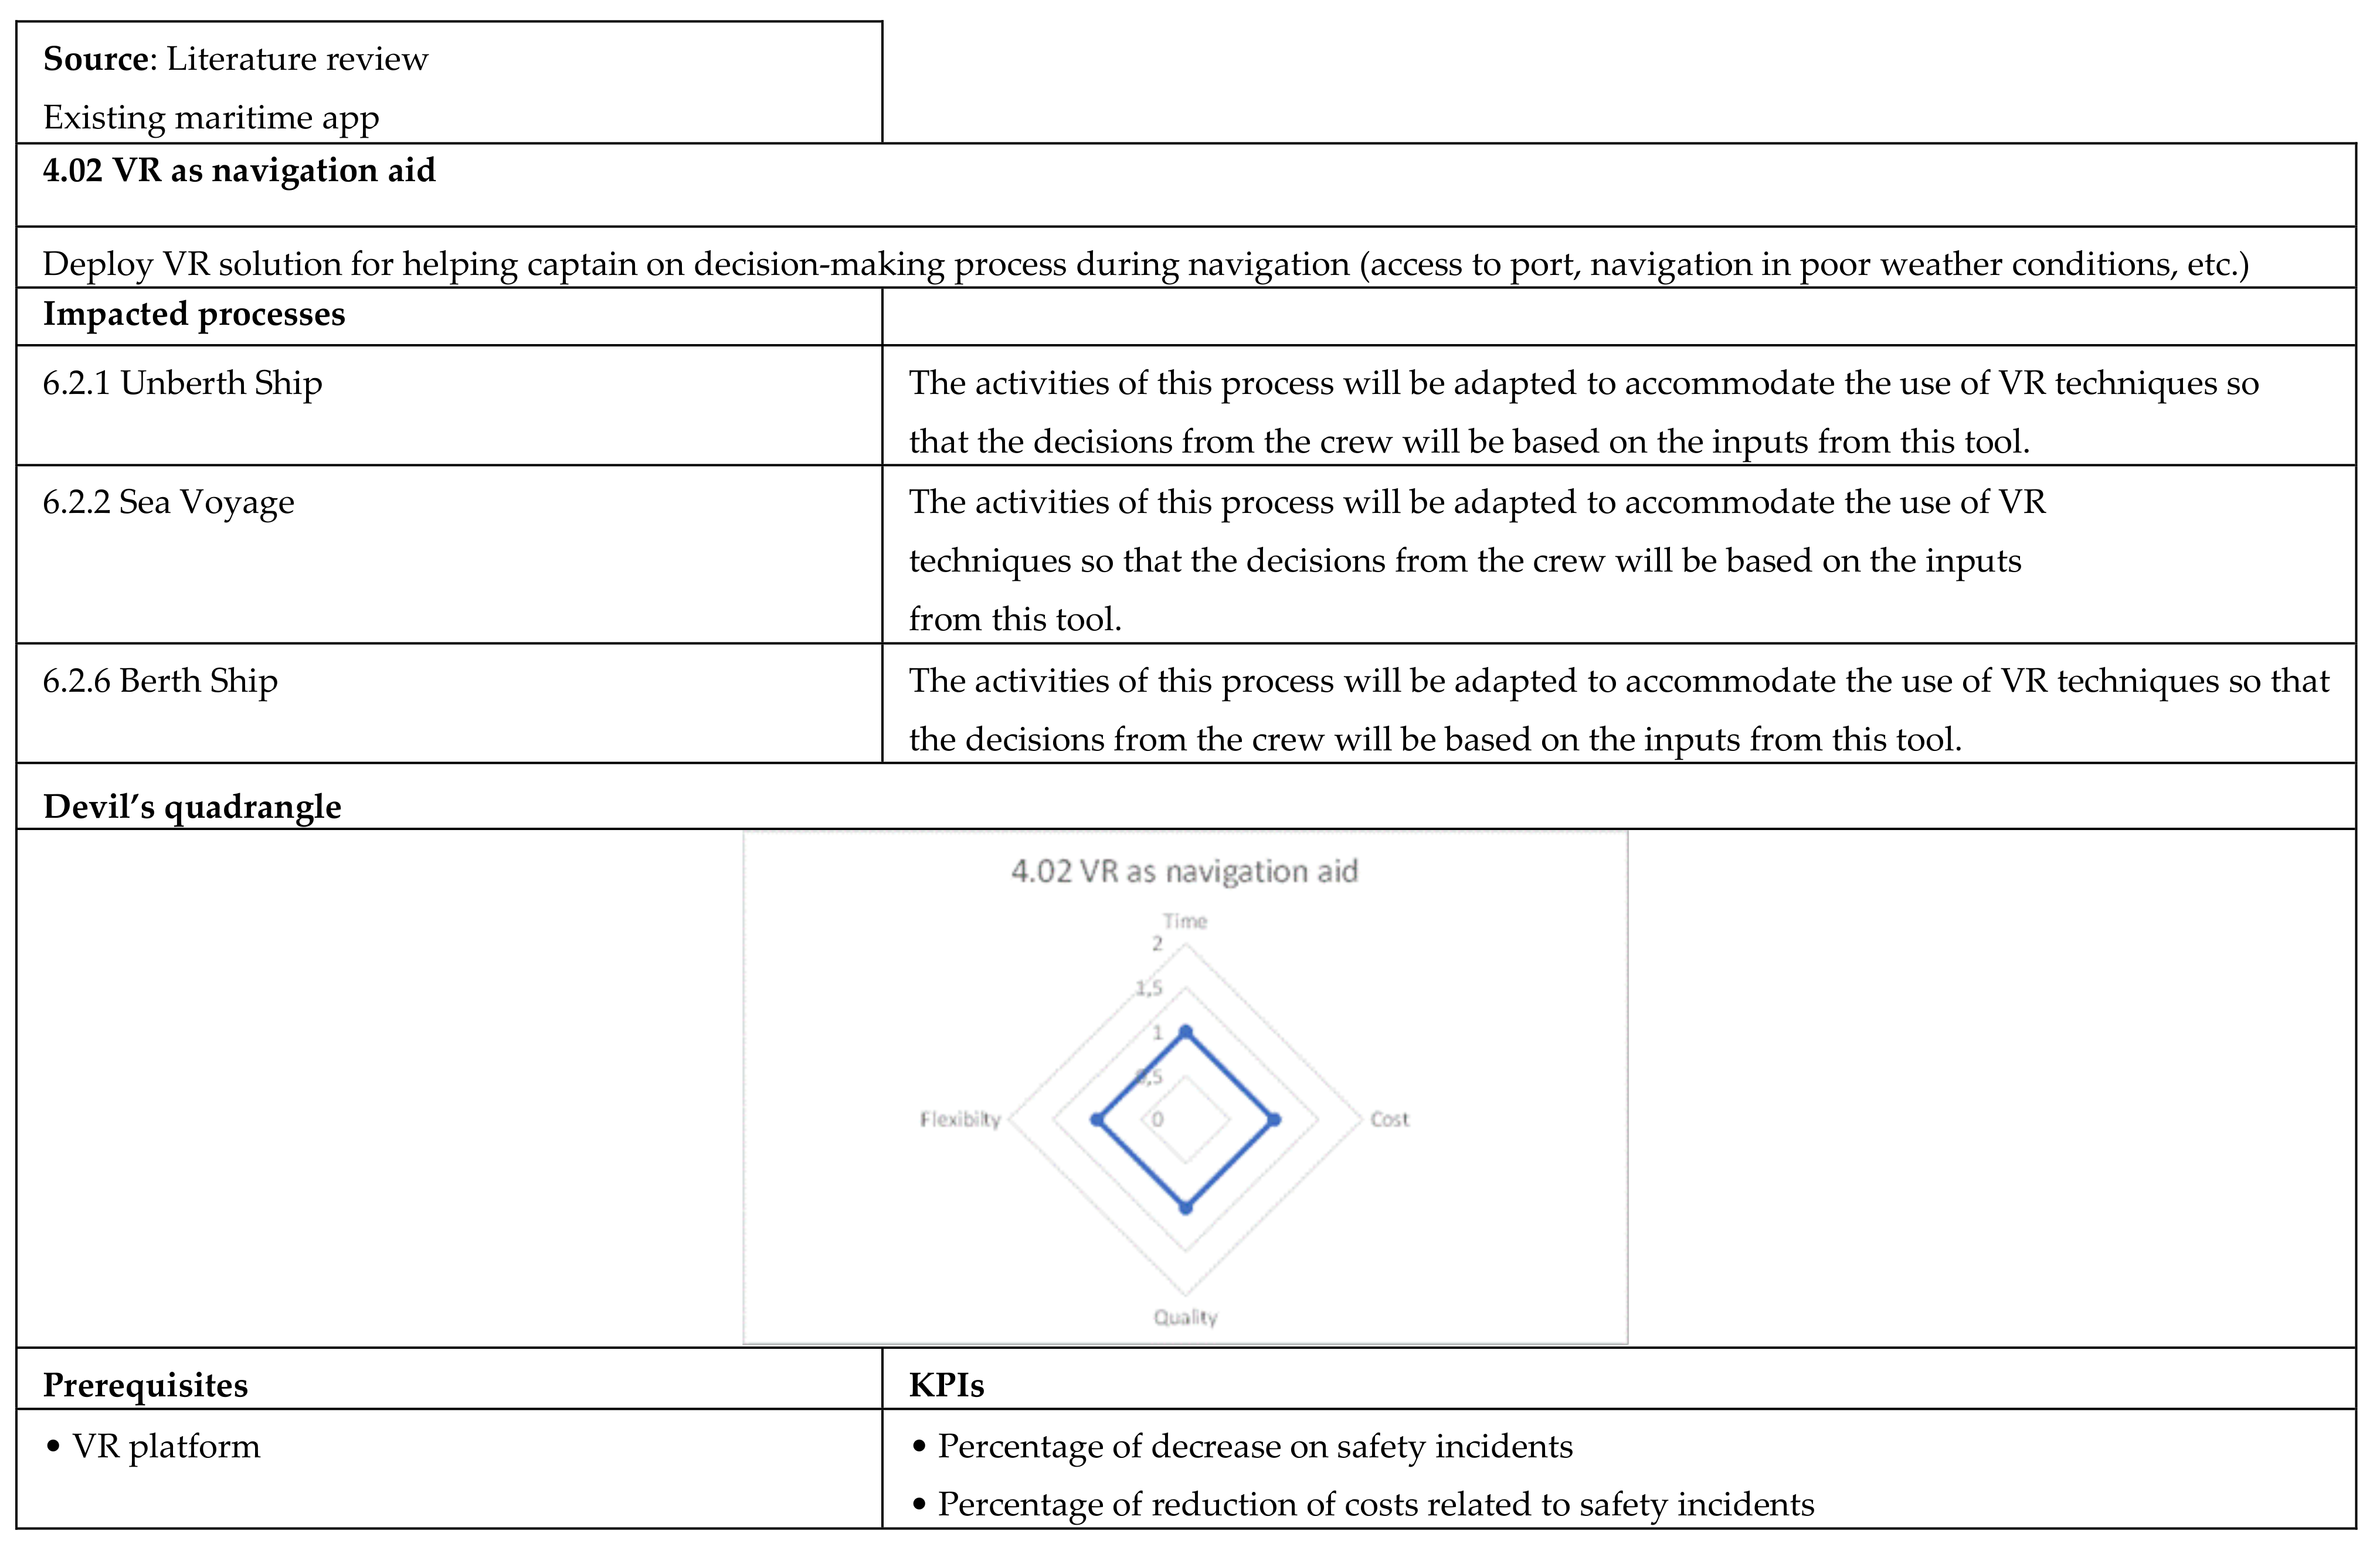
VR as navigation aid data sheet.

Figure A35.
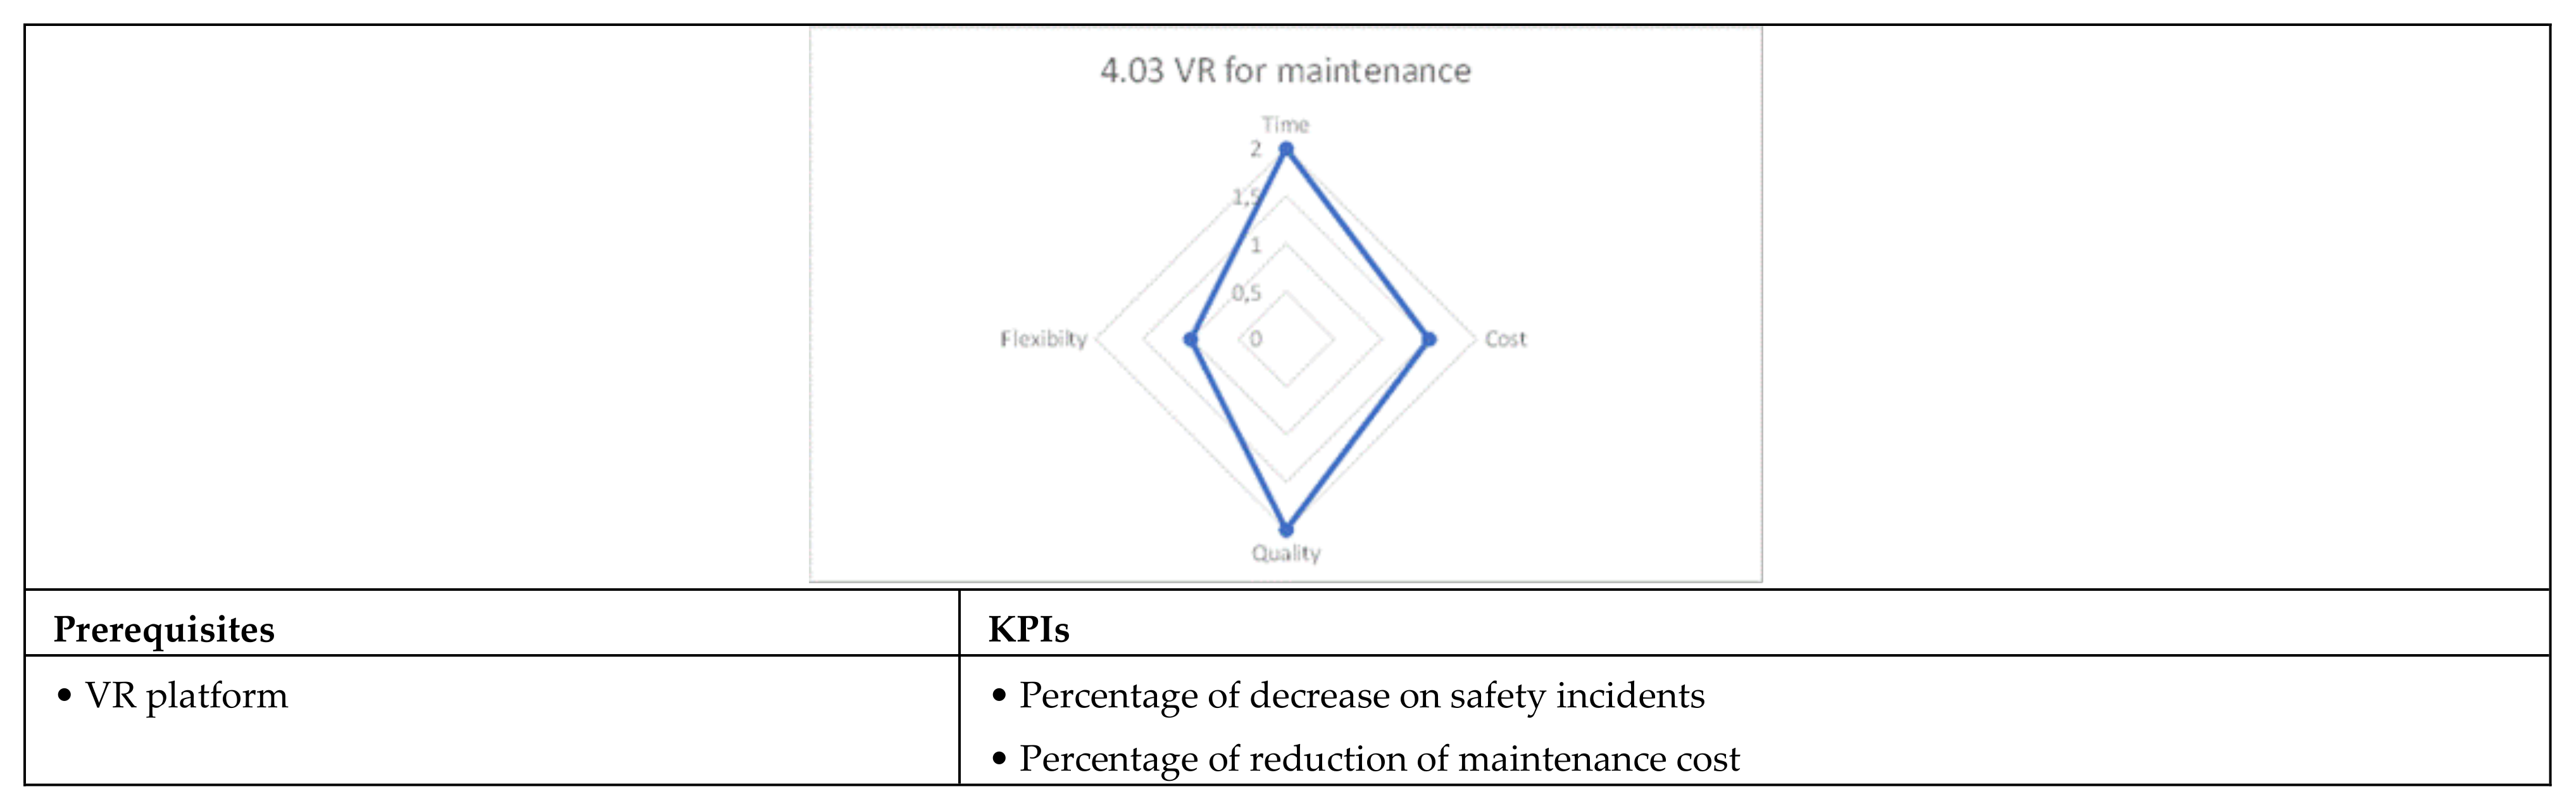
VR for maintenance data sheet.


Figure A36.
Container tracking data sheet.

Figure A37.
Optimization of equipment data sheet.


Figure A38.
Digital twin for training purposes data sheet.

Figure A39.
Cloud/Edge platform data sheet.


Figure A40.
Use of SaaS via cloud data sheet.

Figure A41.
Use of eLearning via cloud data sheet.


Figure A42.
Enhanced cybersecurity data sheet.

Figure A43.
Cargo documents management data sheet.


Figure A44.
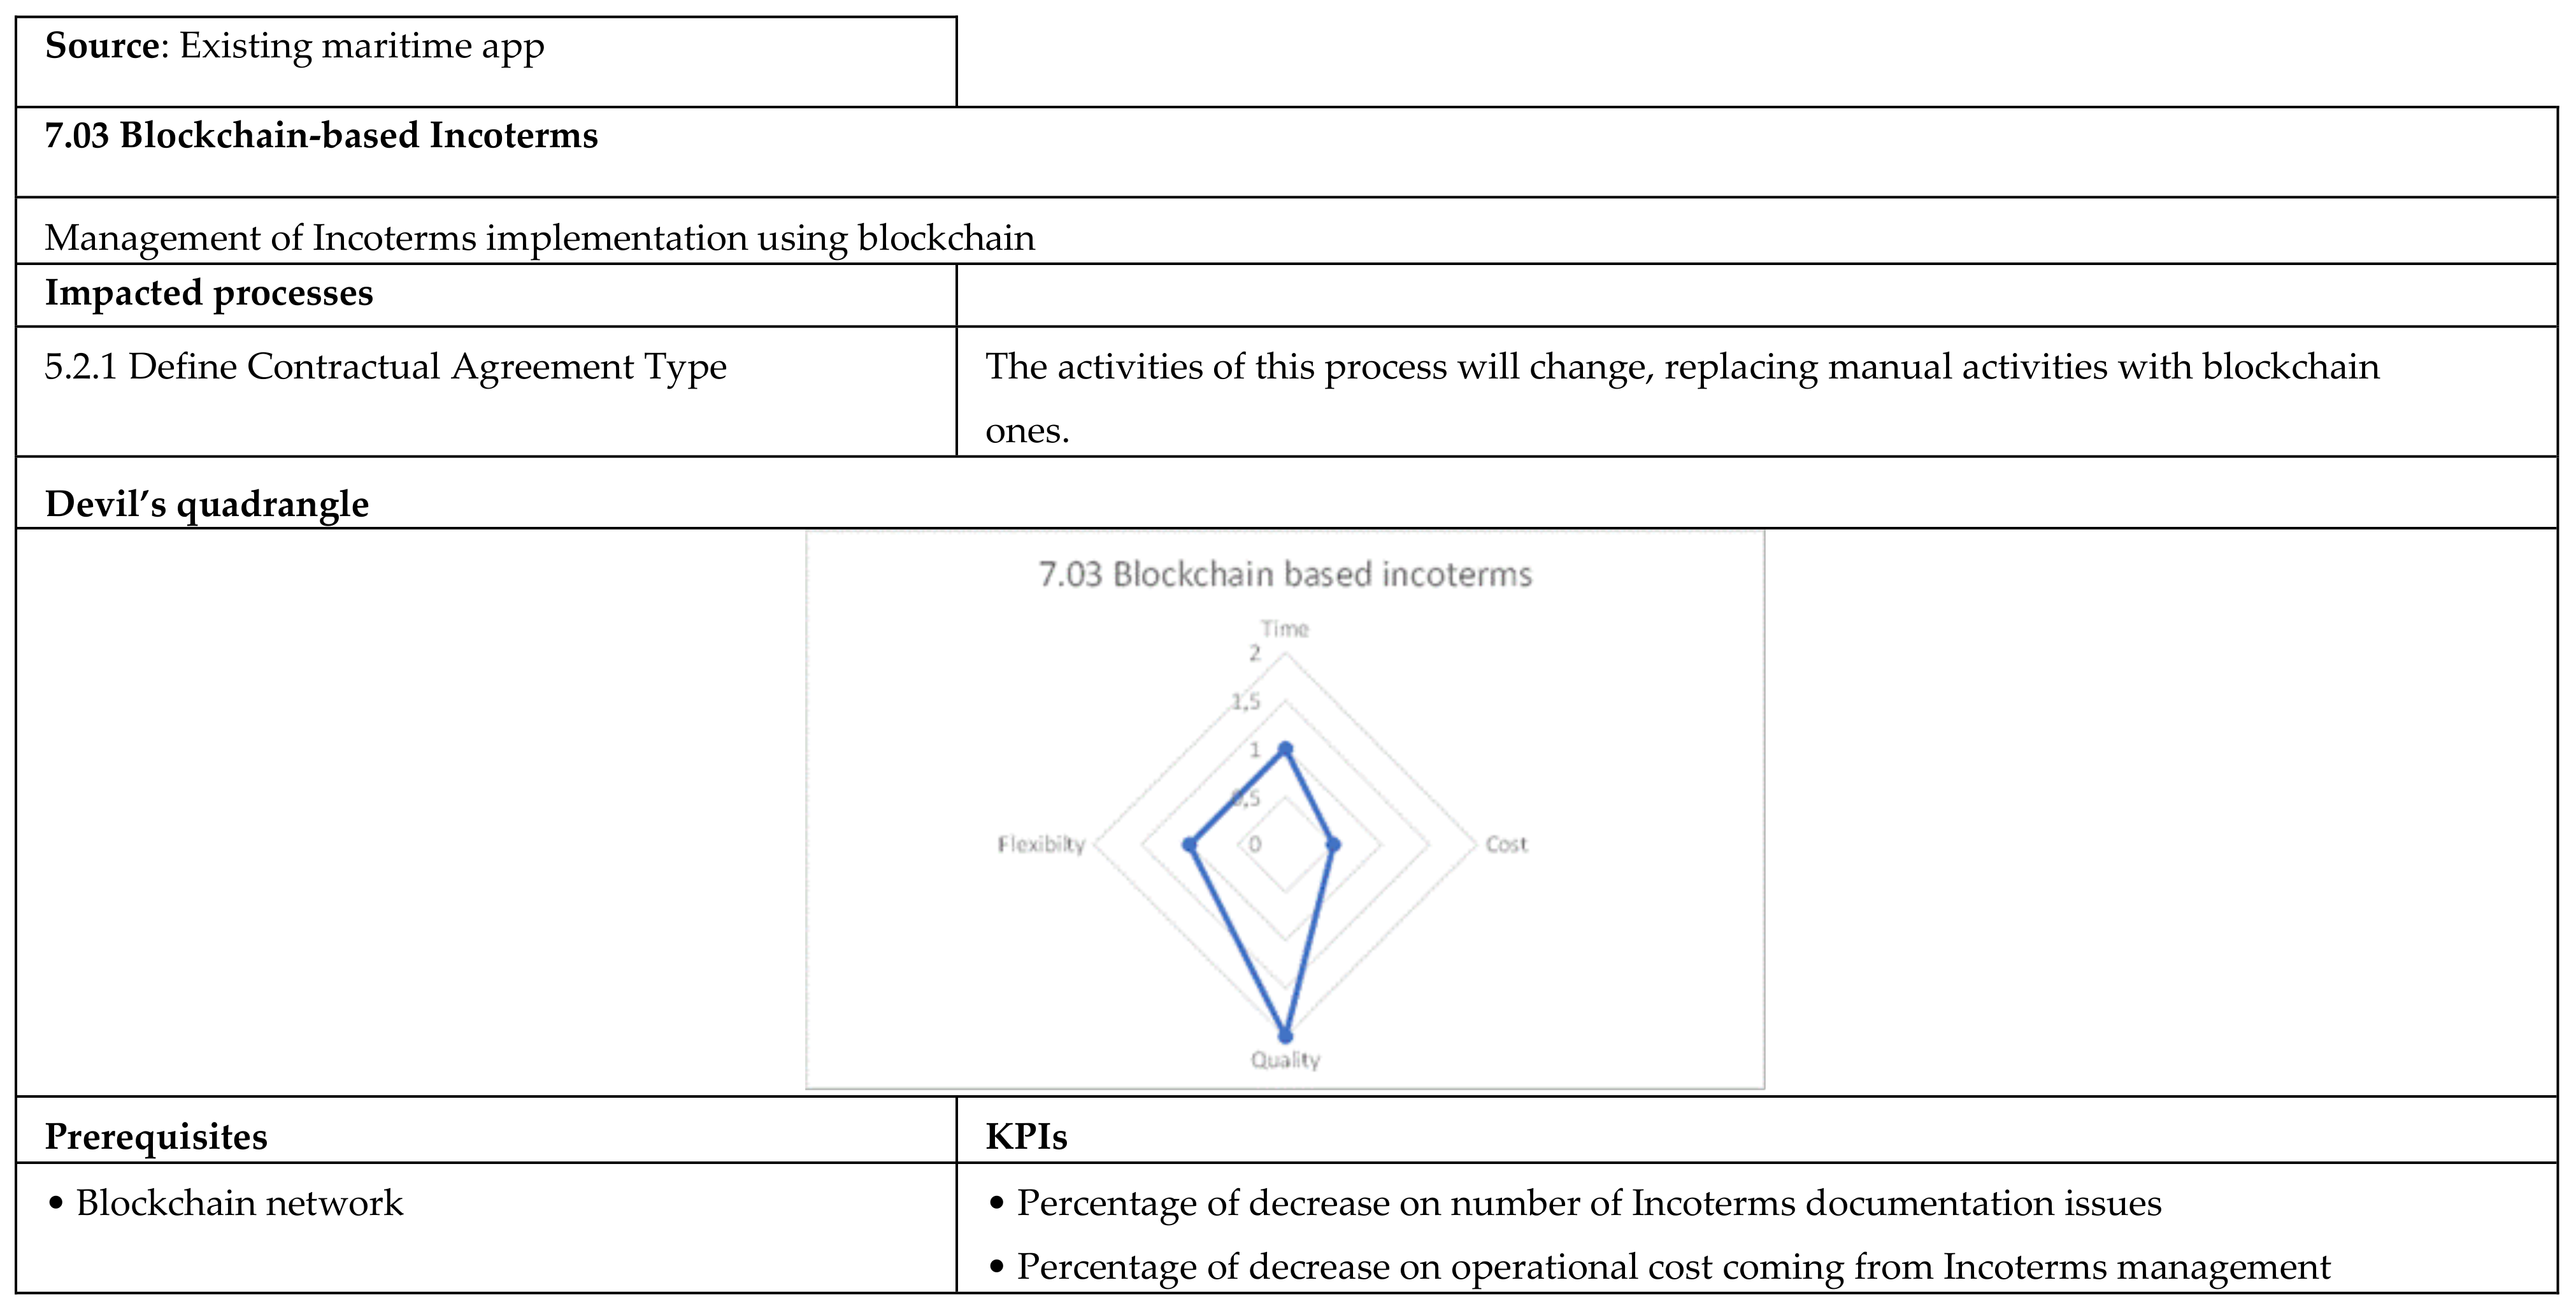
Blockchain-based Incoterms data sheet.

Figure A45.
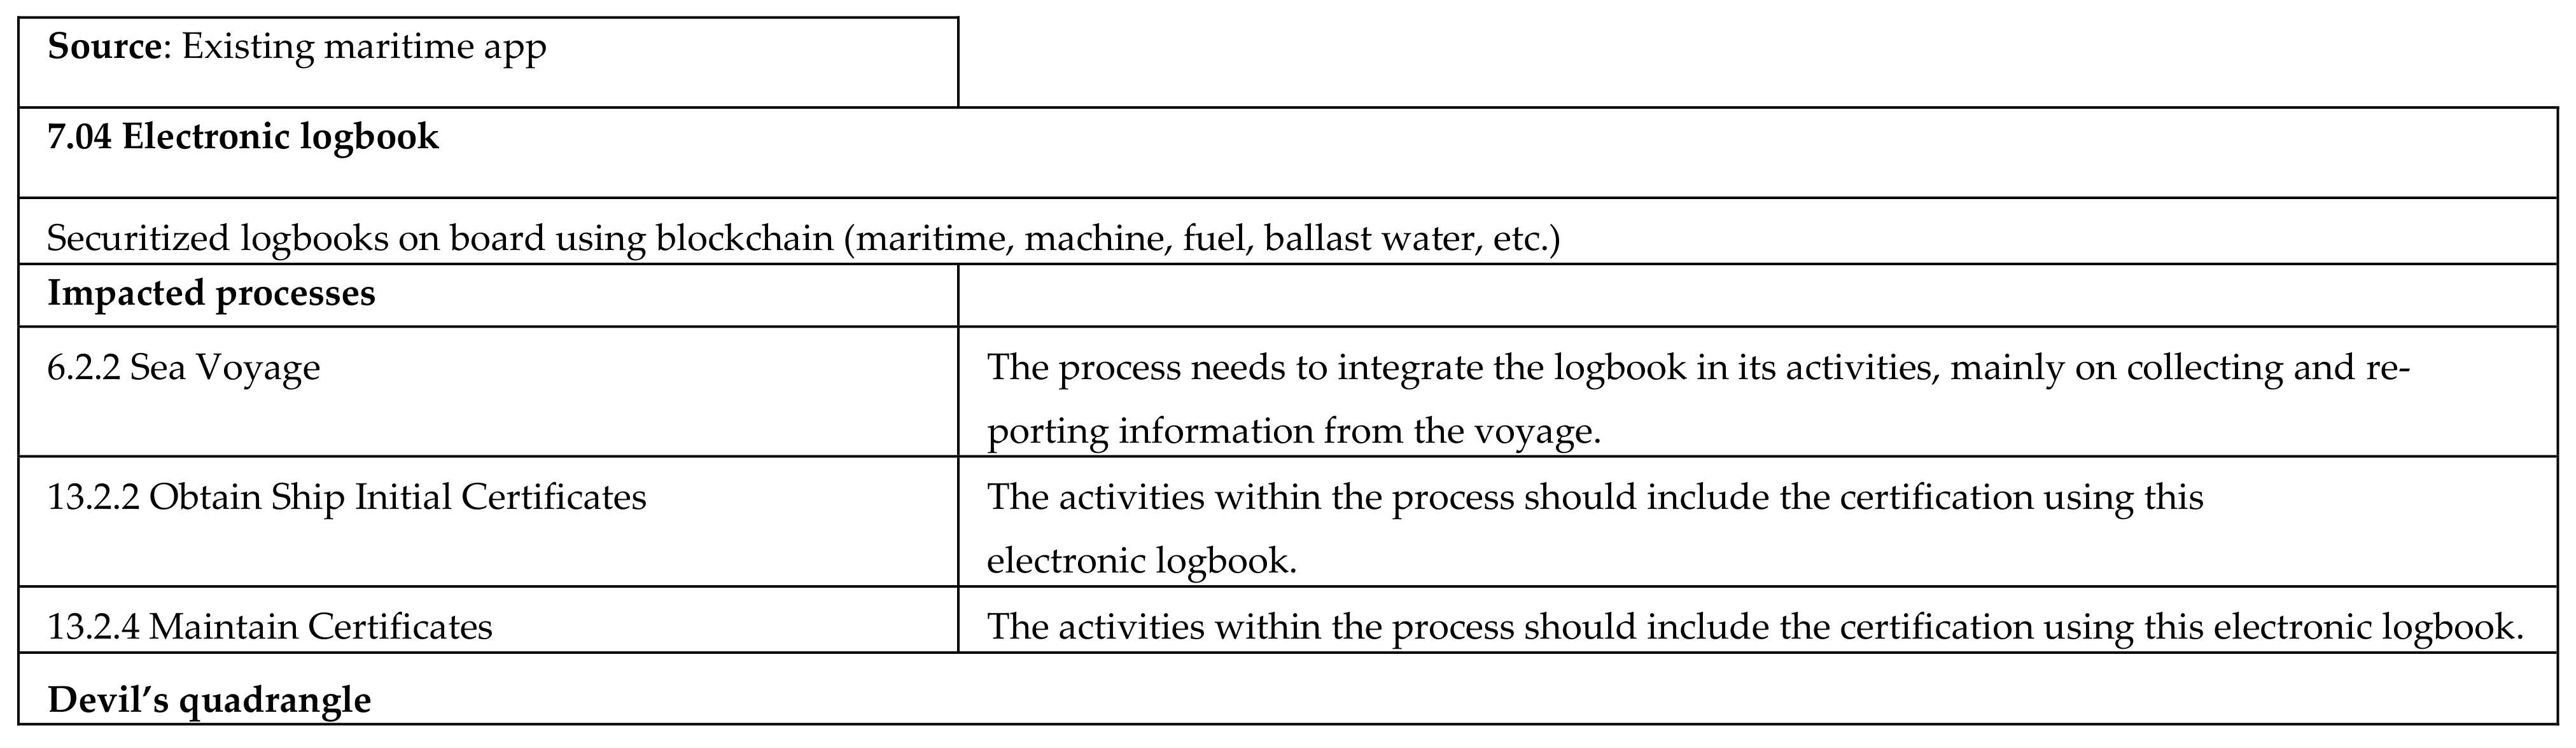
Electronic logbook data sheet.


Figure A46.
Spare parts using 3DP data sheet.

References
- United Nations Conference on Trade and Development. Review of Maritime Transport 2021. UNCTAD/RMT/2021. Available online: https://unctad.org/system/files/official-document/rmt2021_en_0.pdf (accessed on 2 February 2022).
- Gartner Group. Gartner Predicts the Future of Supply Chain Technology. Available online: https://www.gartner.com/smarterwithgartner/gartner-predicts-the-future-of-supply-chain-technology (accessed on 2 February 2022).
- Munim, Z.H.; Dushenko, M.; Jaramillo Jimenez, V.; Shakil, M.H.; Imset, M. Big data and artificial intelligence in the maritime industry: A bibliometric review and future research directions. Marit. Policy Manag. 2020, 47, 577–597. [Google Scholar] [CrossRef]
- Plaza-Hernández, M.; Gil-González, A.B.; Rodríguez-González, S.; Prieto-Tejedor, J.; Corchado-Rodríguez, J.M. Integration of IoT Technologies in the Maritime Industry. In Proceedings of the International Symposium on Distributed Computing and Artificial Intelligence, L’Aquila, Italy, 16–19 June 2020; Volume 1242. [Google Scholar] [CrossRef]
- Kapidani, N.; Bauk, S.; Davidson, I.E. Digitalization in Developing Maritime Business Environments towards Ensuring Sustainability. Sustainability 2020, 12, 9235. [Google Scholar] [CrossRef]
- Kapnissis, G.; Leligou, E.-E.; Vaggelas, G. Blockchain Challenges in Maritime Industry: An Empirical Investigation of the Willingness and the Main Drivers of Adoption from the Hellenic Shipping Industry. Open J. Appl. Sci. 2020, 10, 779–790. [Google Scholar] [CrossRef]
- Tijan, E.; Jovic, M.; Aksentijevic, S.; Pucihar, A. Digital transformation in the maritime transport sector. Technol. Forecast. Soc. Change 2021, 170, 120879. [Google Scholar] [CrossRef]
- Dumas, M.; La Rosa, M.; Mandling, J.; Reijers, H.A. Introduction to Business Process Management. In Fundamentals of Business Process Management; Springer: Berlin/Heidelberg, Germany, 2013; pp. 1–31. [Google Scholar]
- Lyridis, D.V.; Fyrvik, T.; Kapetanis, G.N.; Ventikos, N.; Anaxagorou, P.; Uthaug, E.; Psaraftis, H.N. Optimizing shipping company operations using business process modelling. Marit. Policy Manag. 2006, 32:4, 403–420. [Google Scholar] [CrossRef]
- Elbert, R.; Pontow, H.; Benlain, A. The role of inter-organizational information systems in maritime transport chains. Electron. Mark. 2017, 27, 157–173. [Google Scholar] [CrossRef]
- Cimino, M.G.C.A.; Palumbo, F.; Vaglini, G.; Ferro, E.; Celandroni, N.; La Rosa, D. Evaluating the impact of smart technologies in harbor’s logistics via BPMN modeling and simulation. Inf. Technol. Manag. 2017, 18, 223–239. [Google Scholar] [CrossRef]
- Nikitakos, N.; Lambrou, M.A. Chapter 12 Digital Shipping: The Greek Experience. Res. Transp. Econ. 2007, 21, 383–417. [Google Scholar] [CrossRef]
- Trkman, P. The critical success factors of business process management. Int. J. Inf. Manag. 2010, 30, 125–134. [Google Scholar] [CrossRef]
- American Productivity & Quality Centre. APQC Process Classification Framework (PCF)—Cross Industry—PDF Version 7.2.1. 2018. Available online: https://www.apqc.org/resource-library/resource-listing/apqc-process-classification-framework-pcf-cross-industry-pdf-8 (accessed on 30 January 2020).
- American Productivity & Quality Centre. APQC Process Classification Framework (PCF)—Cross Industry—Excel Version 7.2.1. 2019. Available online: https://www.apqc.org/resource-library/resource-listing/apqc-process-classification-framework-pcf-cross-industry-excel-7 (accessed on 30 January 2020).
- Stopford, M. Maritime Economics; Routledge: Oxon, UK, 2009. [Google Scholar]
- Song, D.W.; Panayides, P.M. Maritime Logistics; Kogan Page Limited: London, UK, 2015. [Google Scholar]
- Tran, N.K.; Haasis, H.-D.; Buer, T. Container shipping route design incorporating the costs of shipping, inland/feeder transport, inventory and CO2 emission. Marit. Econ. Logist. 2016, 19, 667–694. [Google Scholar] [CrossRef]
- United Nations Conference on Trade and Development. United Nations Conference on a Convention on International Multimodal Transport. UNCTAD 1981. Available online: https://unctad.org/en/PublicationsLibrary/tdmtconf17_en.pdf (accessed on 30 January 2020).
- Lawshe, C.H. A quantitative approach to content validation. Pers. Psychol. 1975, 28, 563–575. [Google Scholar] [CrossRef]
- Dumas, M.; La Rosa, M.; Mandling, J.; Reijers, H.A. Process Redesign. In Fundamentals of Business Process Management; Springer: Berlin/Heidelberg, Germany, 2013; pp. 253–296. [Google Scholar]
Figure 1.
APQC cross-industry process classification framework.

Figure 2.
Application data sheet sample.


Table 1.
Minimum values of CVR.
| Number of Judges | CVR Min. Value |
|---|---|
| 5–7 | 0.99 |
| 8 | 0.85 |
| 9 | 0.78 |
| 10 | 0.62 |
| 11 | 0.59 |
| 12 | 0.56 |
| 13 | 0.54 |
| 14 | 0.51 |
| 15 | 0.49 |
| 20 | 0.42 |
| 25 | 0.337 |
| 30 | 0.33 |
| 35 | 0.31 |
| 40 | 0.29 |
Table 2.
Processes with more than two impacts.
| Process | Number of Impacts |
|---|---|
| 6.2.2 Sea Voyage | 15 |
| 7.3.1 Plan and Execute Ship Daily Maintenance and Periodical Crew Exercises | 9 |
| 6.1.5 Charge Ship | 7 |
| 6.3.4 Unload Ship | 7 |
| 6.2.1 Unberth Ship | 6 |
| 6.2.6 Berth Ship | 6 |
| 7.3.1 BIS Analysis of Operational Data for Maintenance | 5 |
| 2.2.1 Analyze Competitors’ Routes | 4 |
| 6.1.3 Prepare Stowage Plan | 4 |
| 6.3.2 Prepare Ship Unloading Plan | 4 |
| 9.8.5 Define Safety Framework (Goals, KPIs, Training, Drills, etc.) | 4 |
| 6.1.2 Manage Departure Customs and Rest of Departure Paperwork | 3 |
| 6.3.1 Manage Arrival Customs and Rest of Arrival Paperwork | 3 |
| 9.3.3 Manage Employees Training | 3 |
| 9.4.3 Manage Training on Board | 3 |
Table 3.
KPIs used more than twice for measuring application performance.
| KPI | Number of Applications that Use This KPI to Measure Their Performance |
|---|---|
| % improvement on ratio cost using old process/cost using new process | 8 |
| % of decrease in human errors | 8 |
| Number of days of improvement in the decision process | 8 |
| % decrease on annual maintenance hours | 5 |
| % of decrease on safety incidents | 5 |
| % of reduction on costs of fuel consumption | 4 |
| % decrease on mechanical failures | 3 |
| % of decrease on incidents/accidents | 3 |
| % of improvement on customer satisfaction | 3 |
| % of improvement on end-of-year financial results | 3 |
| % of reduction on training costs | 3 |
| TOTAL | 53 |
Table 4.
List of applications with higher consolidated impact score.
| Application | Impact Score |
|---|---|
| 5.01 Container tracking | 8 |
| 2.06 Analysis of engine parameters to anticipate issues | 7 |
| 7.02 Cargo documents management | 7 |
| 2.04 Route optimization via AI analysis of client information | 6.5 |
| 4.03 VR for maintenance | 6.5 |
| 2.07 Route optimization via AI analysis of operational information | 6 |
| 2.14 Optimizing ship’s operations via AI analysis of operational information | 6 |
| 2.11 Optimizing maintenance process using digital twin and AI | 5.5 |
| 2.22 Using AI to reduce emissions | 5.5 |
| 3.02 Big data analysis for energy efficiency | 5.5 |
| 3.03 Analysis of data on consumption and emissions for bunkering selection | 5.5 |
| 6.03 Use of eLearning via cloud | 5.5 |
| 8.01 Spare parts using 3DP | 5.5 |
| 1.03 Digital twin for AV controlling and maintenance | 5 |
| 1.04 Use of robots in complex/hazardous tasks | 5 |
| 2.13 Analysis of ship structure images to anticipate issues | 5 |
| 2.21 Using AI to enhance navigation safety | 5 |
| 3.06 Big data for ship speed controlling | 5 |
| 6.02 Use of SaaS via cloud | 5 |
Table 5.
List of applications with lower consolidated impact score.
| Application | Impact Score |
|---|---|
| 2.01 AI dynamic positioning of surrounding vessels | 3 |
| 3.04 ISPS security levels | 3 |
| 5.02 Optimization of equipment usage | 3 |
| 5.03 Digital twin for training purposes | 3 |
| 1.01 UV controlling system | 2.5 |
| 1.02 Autonomous vessels | 2 |
| 3.05 Big data for ship renewal | 2 |
| 7.01 Enhanced cybersecurity | 2 |
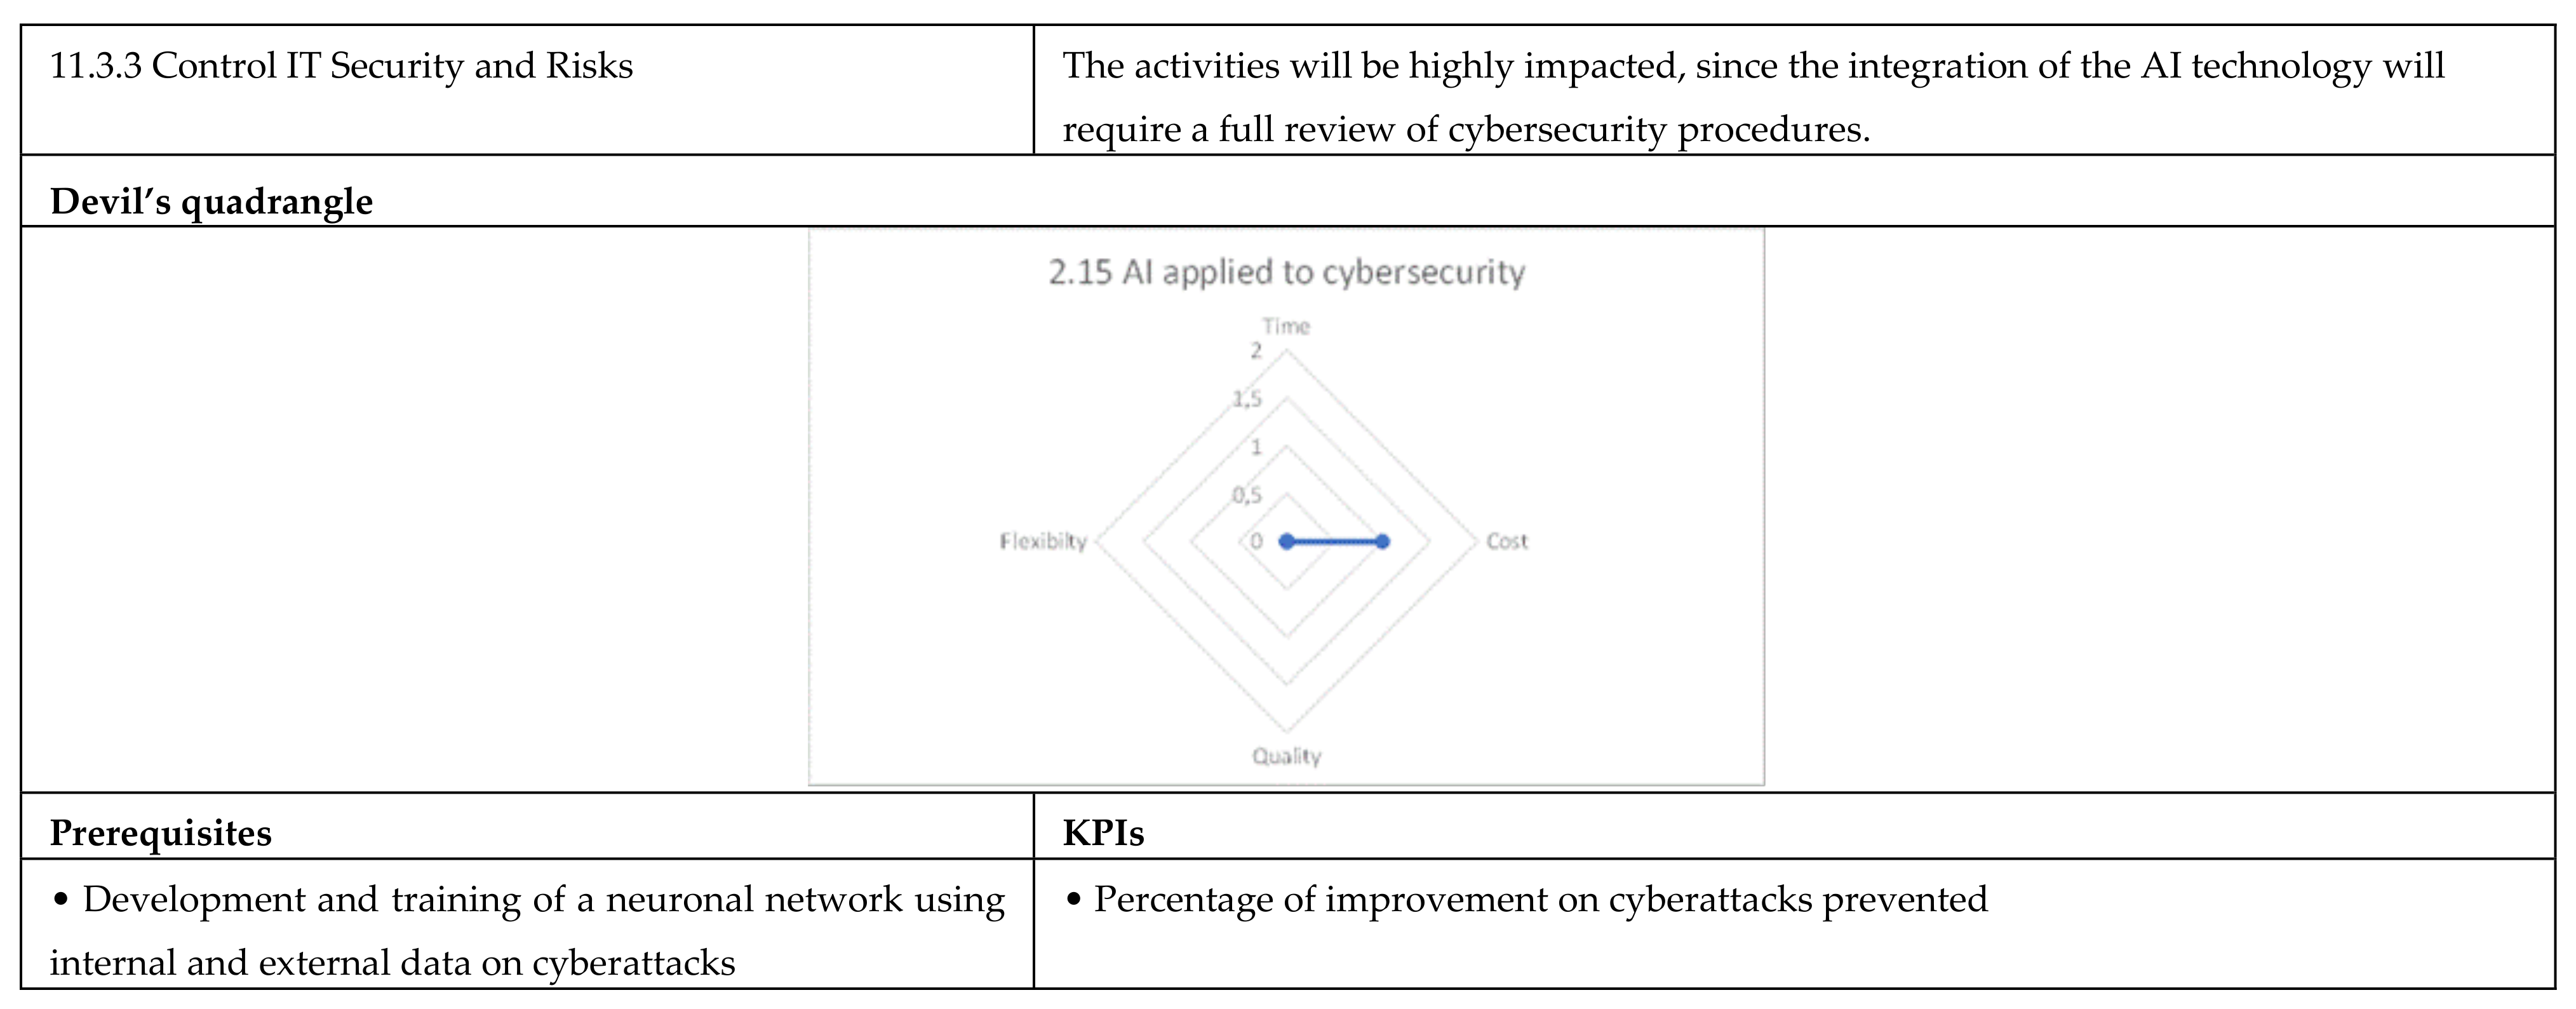
| 2.15 AI applied to cybersecurity | 1 |
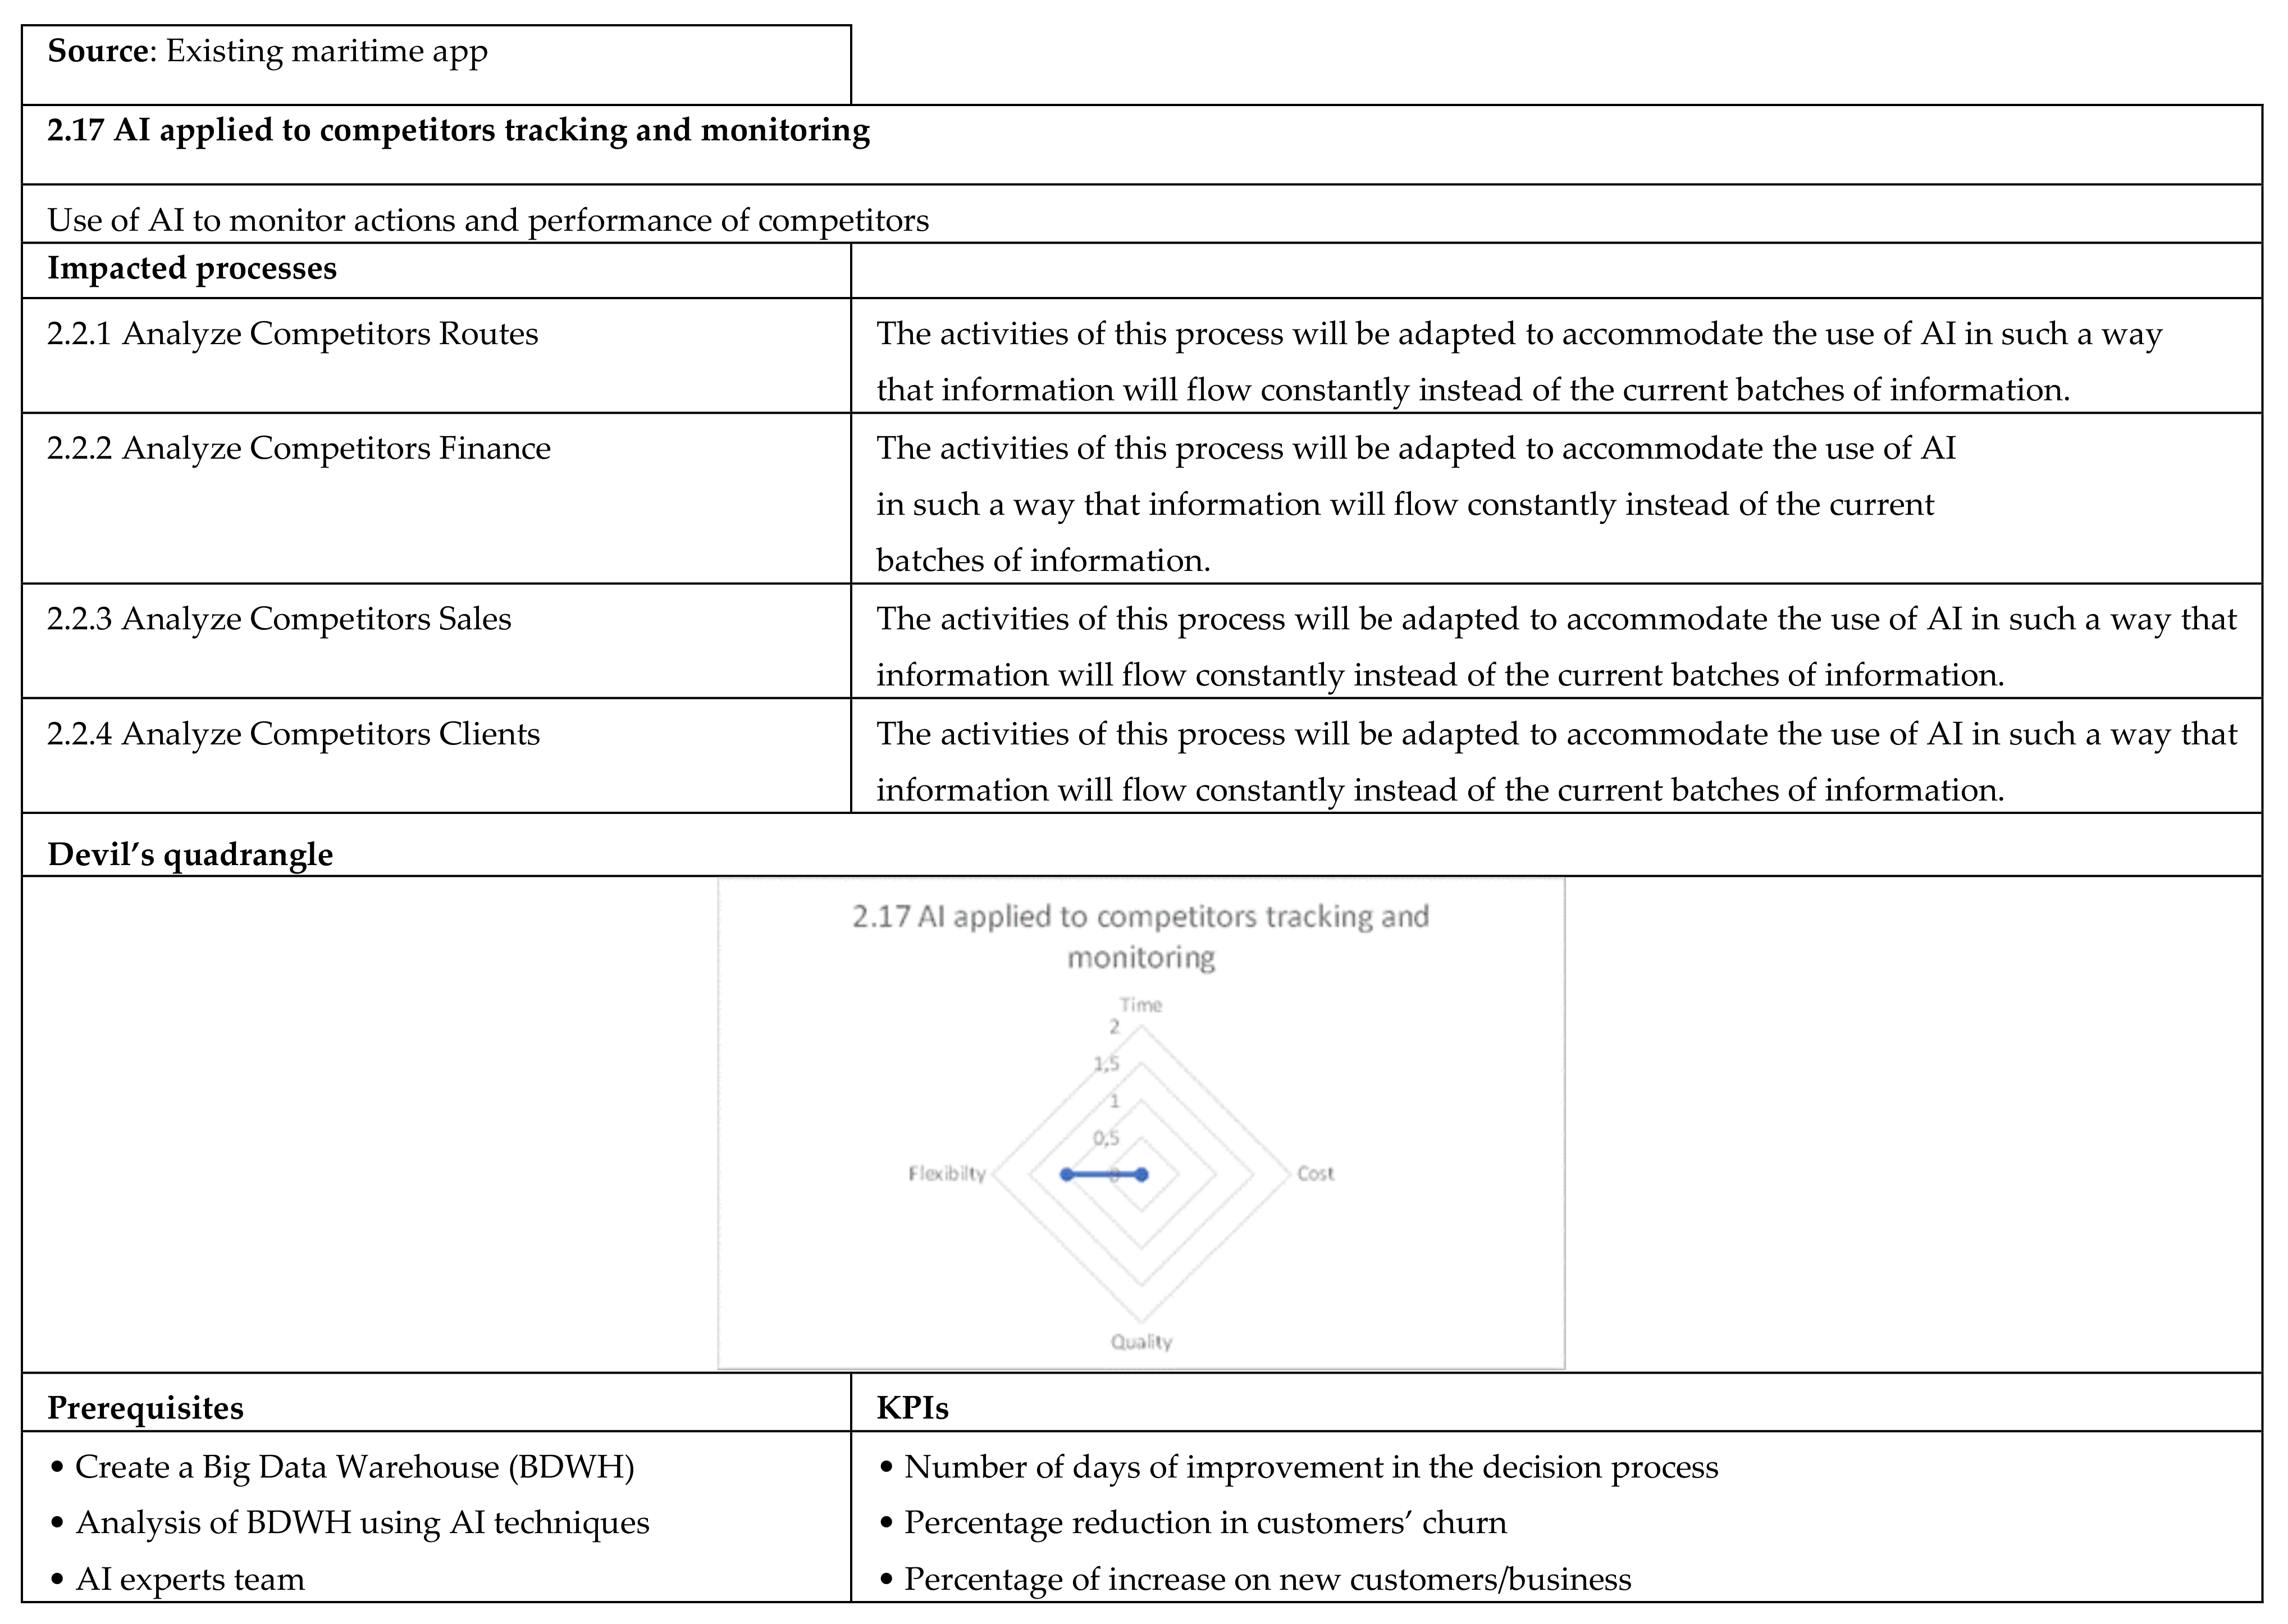
| 2.17 AI applied to competitors tracking and monitoring | 1 |
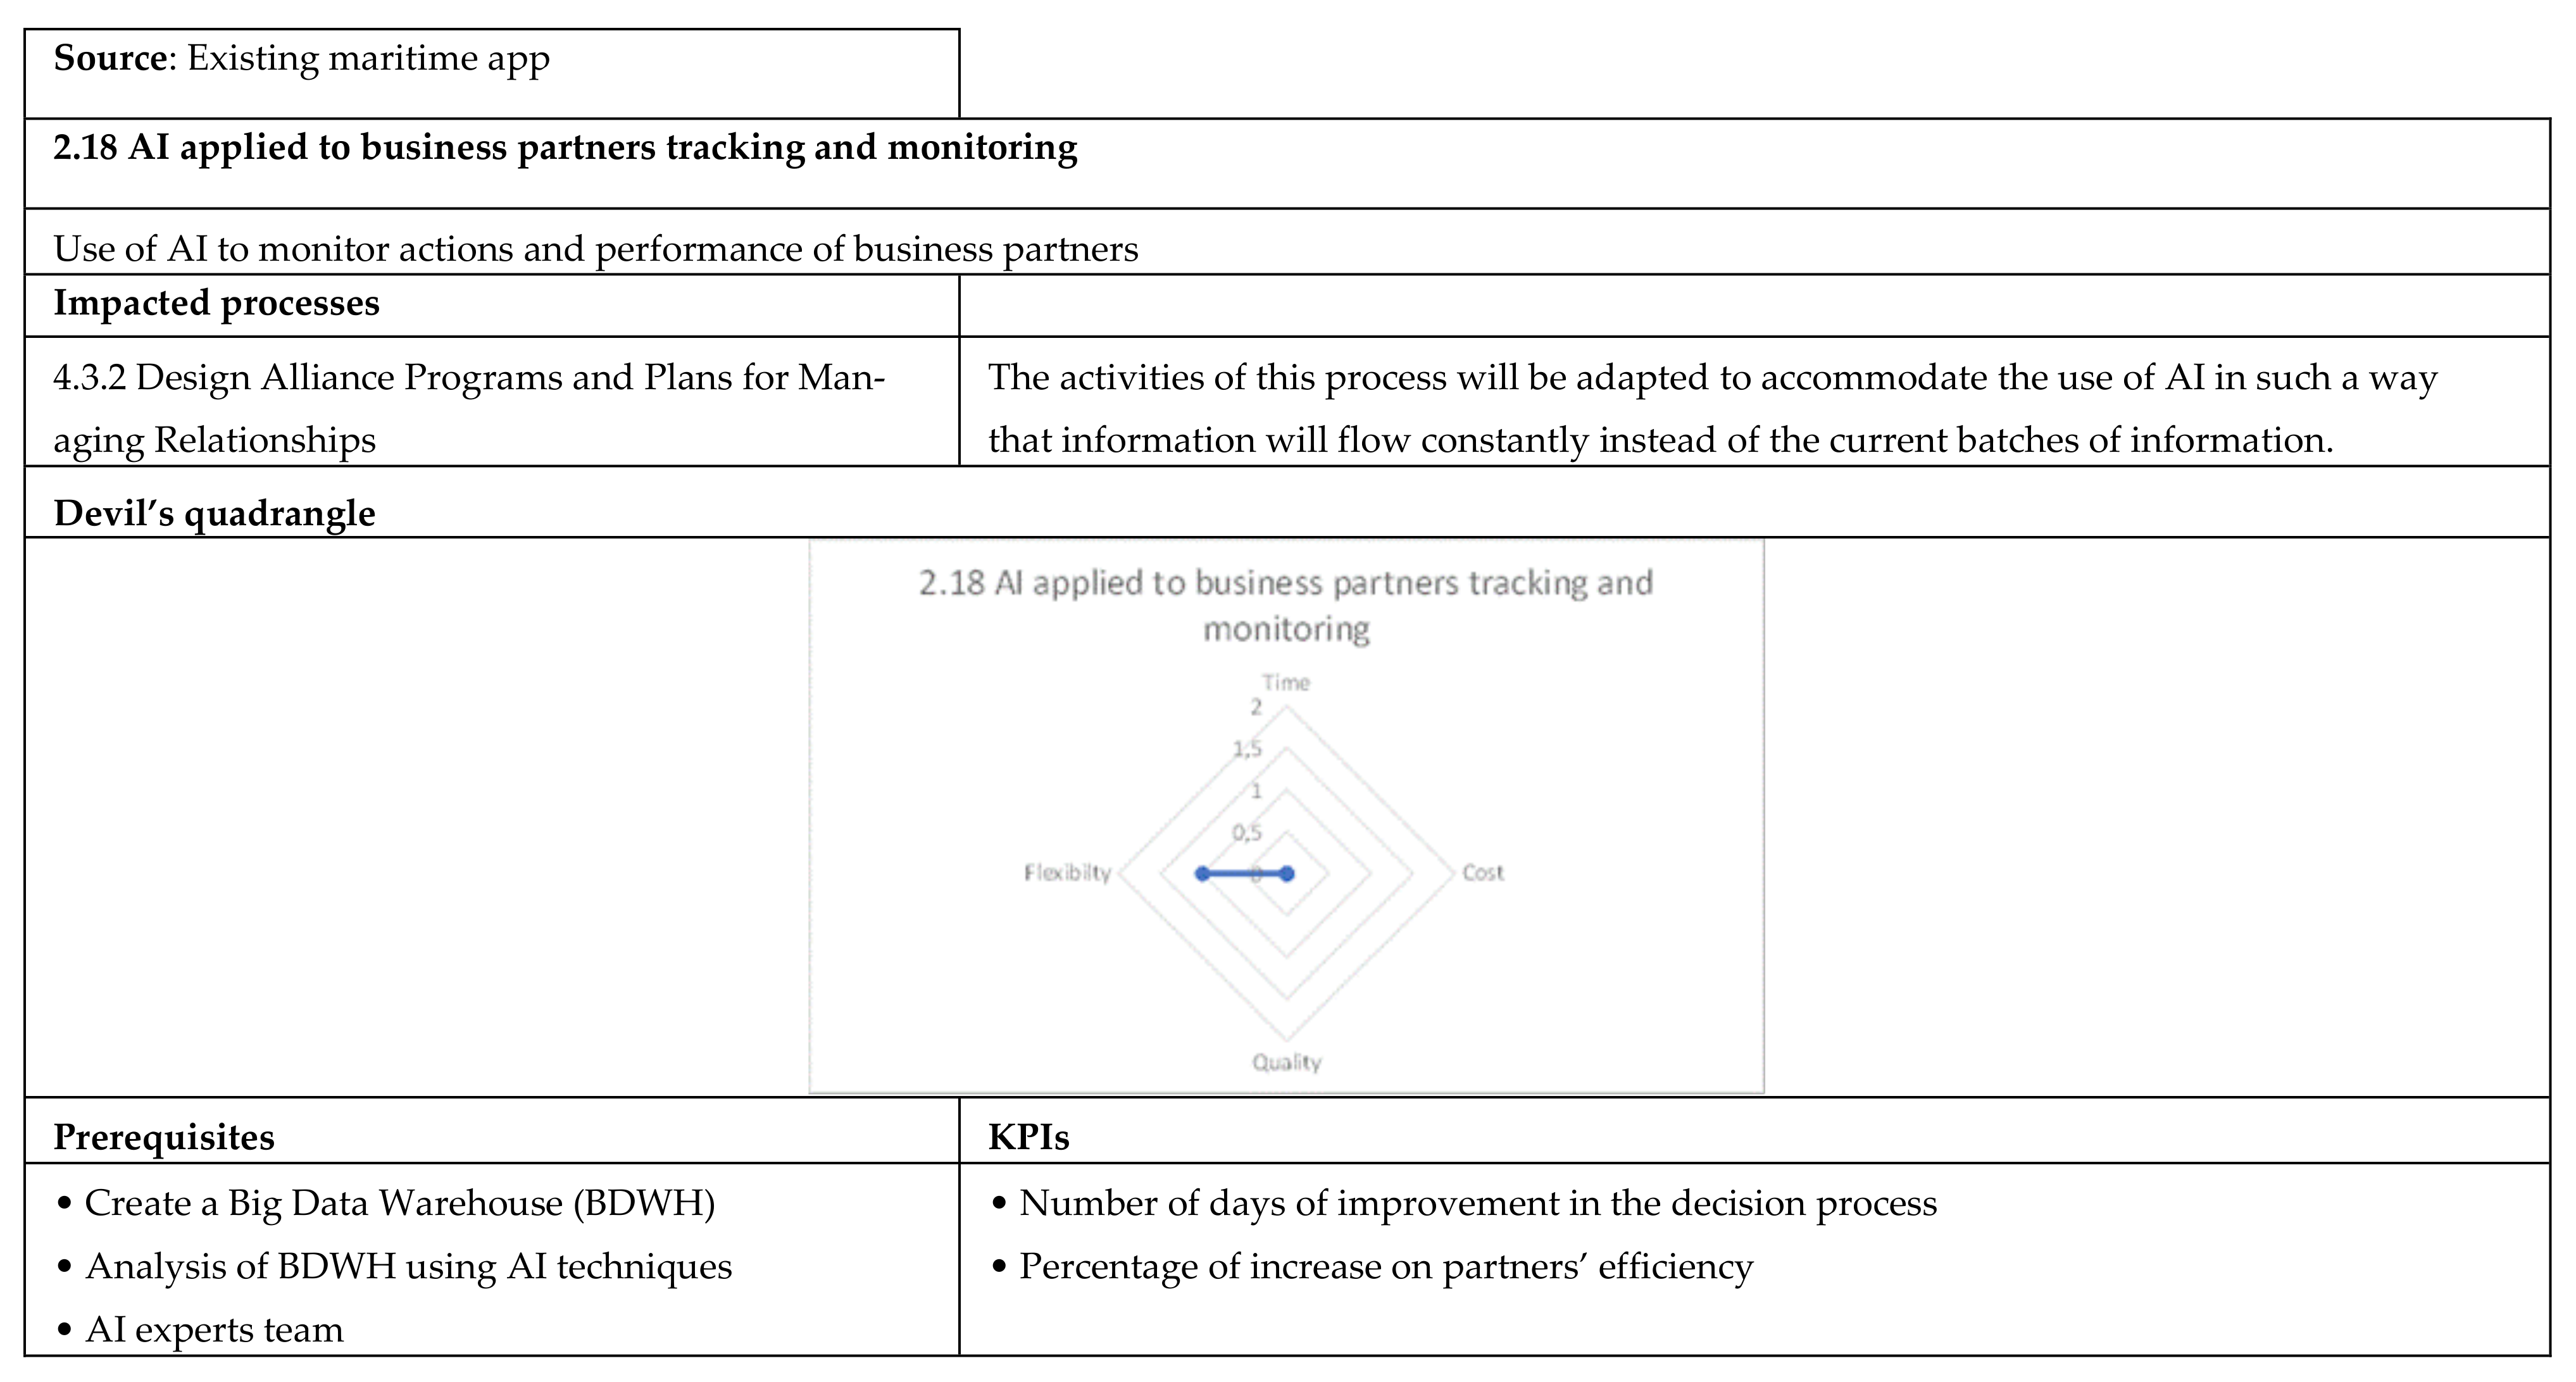
| 2.18 AI applied to business partners tracking and monitoring | 1 |
| 2.19 AI applied to providers tracking and monitoring | 1 |
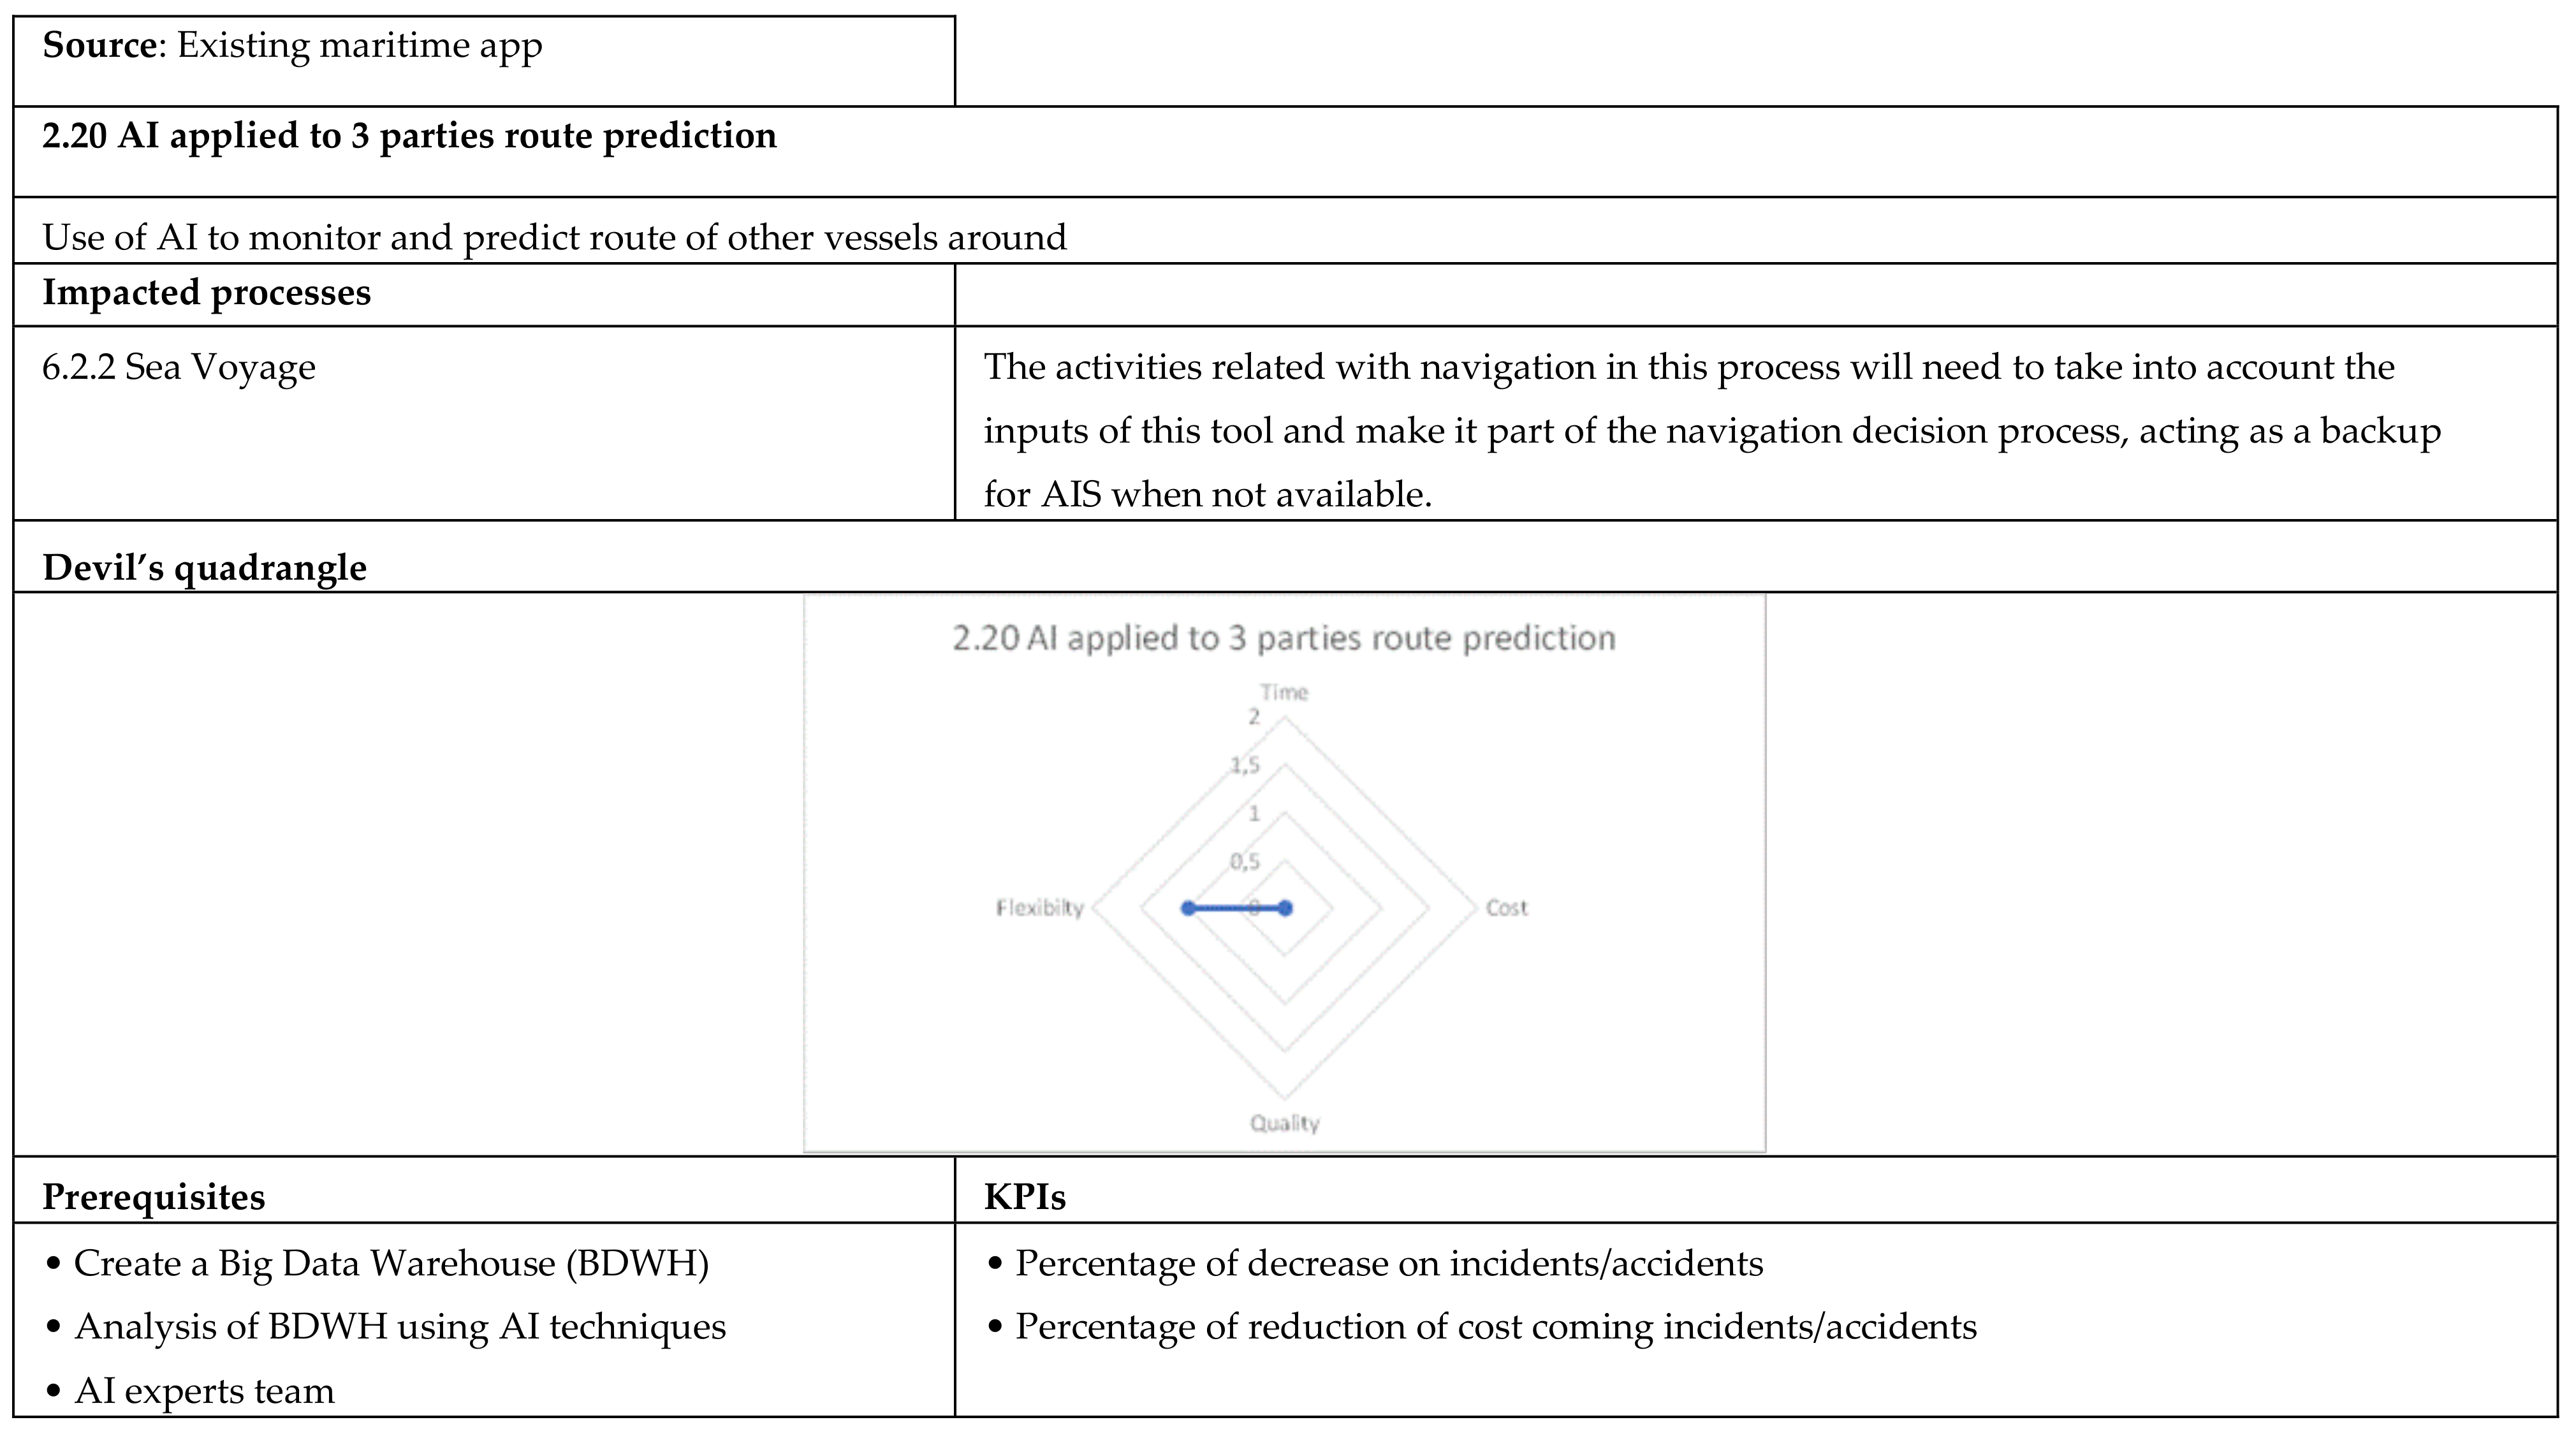
| 2.20 AI applied to three parties route prediction | 1 |
| 2.16 AI applied to data management and clean | 0.5 |
| 6.01 Cloud/Edge platform | 0.5 |
Table 6.
Top applications on Time performance dimension.
| Application | Impact Score |
|---|---|
| 4.01 VR for training | 2 |
| 4.03 VR for maintenance | 2 |
| 5.01 Container tracking | 2 |
| 6.02 Use of SaaS via cloud | 2 |
| 6.03 Use of eLearning via cloud | 2 |
| 7.02 Cargo documents management | 2 |
| 7.04 Electronic logbook | 2 |
| 1.04 Use of robots in complex/hazardous tasks | 1.5 |
| 2.04 Route optimization via AI analysis of client information | 1.5 |
| 2.06 Analysis of engine parameters to anticipate issues | 1.5 |
| 2.07 Route optimization via AI analysis of operational information | 1.5 |
| 2.10 Fleet dimensioning optimization | 1.5 |
| 2.12 Conversational virtual assistance for helping seafarers in day-to-day activities | 1.5 |
| 2.13 Analysis of ship structure images to anticipate issues | 1.5 |
| 3.02 Big data analysis for energy efficiency | 1.5 |
| 3.03 Analysis of data on consumption and emissions for bunkering selection | 1.5 |
| 3.04 ISPS security levels | 1.5 |
| 3.06 Big data for ship speed controlling | 1.5 |
| 8.01 Spare parts using 3DP | 1.5 |
Table 7.
Bottom applications on Time performance dimension.
| Application | Impact Score |
|---|---|
| 2.02 Assessment of ship risks using fuzzy logic | 0.5 |
| 2.08 Process optimization and reengineering using AI | 0.5 |
| 2.09 Freight rate optimization | 0.5 |
| 2.14 Optimizing ship’s operations via AI analysis of operational information | 0.5 |
| 5.02 Optimization of equipment usage | 0.5 |
| 1.01 UV controlling system | 0 |
| 1.02 Autonomous vessels | 0 |
| 2.01 AI dynamic positioning of surrounding vessels | 0 |
| 2.15 AI applied to cybersecurity | 0 |
| 2.16 AI applied to data management and clean | 0 |
| 2.17 AI applied to competitors tracking and monitoring | 0 |
| 2.18 AI applied to business partners tracking and monitoring | 0 |
| 2.19 AI applied to providers tracking and monitoring | 0 |
| 2.20 AI applied to 3 parties route prediction | 0 |
| 6.01 Cloud/Edge platform | 0 |
Table 8.
Top applications on Cost performance dimension.
| Application | Impact Score |
|---|---|
| 2.04 Route optimization via AI analysis of client information | 2 |
| 3.02 Big data analysis for energy efficiency | 2 |
| 3.03 Analysis of data on consumption and emissions for bunkering selection | 2 |
| 5.01 Container tracking | 2 |
| 7.02 Cargo documents management | 2 |
| 7.04 Electronic logbook | 2 |
| 8.01 Spare parts using 3DP | 2 |
| 1.04 Use of robots in complex/hazardous tasks | 1.5 |
| 2.02 Assessment of ship risks using fuzzy logic | 1.5 |
| 2.06 Analysis of engine parameters to anticipate issues | 1.5 |
| 2.07 Route optimization via AI analysis of operational information | 1.5 |
| 2.13 Analysis of ship structure images to anticipate issues | 1.5 |
| 2.14 Optimizing ship’s operations via AI analysis of operational information | 1.5 |
| 2.22 Using AI to reduce emissions | 1.5 |
| 3.01 Big data algorithm for collision avoidance | 1.5 |
| 3.04 ISPS security levels | 1.5 |
| 3.06 Big data for ship speed controlling | 1.5 |
| 4.03 VR for maintenance | 1.5 |
| 5.02 Optimization of equipment usage | 1.5 |
| 6.03 Use of eLearning via cloud | 1.5 |
Table 9.
Bottom applications on Cost performance dimension.
| Application | Impact Score |
|---|---|
| 1.01 UV controlling system | 0.5 |
| 2.03 Pricing market prediction | 0.5 |
| 2.05 Client offering optimization via AI analysis of client information | 0.5 |
| 2.11 Optimizing maintenance process using digital twin and AI | 0.5 |
| 2.16 AI applied to data management and clean | 0.5 |
| 6.01 Cloud/Edge platform | 0.5 |
| 7.03 Blockchain-based Incoterms | 0.5 |
| 1.02 Autonomous vessels | 0 |
| 1.03 Digital twin for AV controlling and maintenance | 0 |
| 2.08 Process optimization and reengineering using AI | 0 |
| 2.10 Fleet dimensioning optimization | 0 |
| 2.17 AI applied to competitors tracking and monitoring | 0 |
| 2.18 AI applied to business partners tracking and monitoring | 0 |
| 2.19 AI applied to providers tracking and monitoring | 0 |
| 2.20 AI applied to 3 parties route prediction | 0 |
| 3.05 Big data for ship renewal | 0 |
| 5.03 Digital twin for training purposes | 0 |
Table 10.
Top applications on Quality performance dimension.
| Application | Impact Score |
|---|---|
| 1.01 UV controlling system | 2 |
| 1.02 Autonomous vessels | 2 |
| 1.03 Digital twin for AV controlling and maintenance | 2 |
| 1.04 Use of robots in complex/hazardous tasks | 2 |
| 2.06 Analysis of engine parameters to anticipate issues | 2 |
| 2.11 Optimizing maintenance process using digital twin and AI | 2 |
| 2.14 Optimizing ship’s operations via AI analysis of operational information | 2 |
| 2.21 Using AI to enhance navigation safety | 2 |
| 2.22 Using AI to reduce emissions | 2 |
| 3.02 Big data analysis for energy efficiency | 2 |
| 3.03 Analysis of data on consumption and emissions for bunkering selection | 2 |
| 4.03 VR for maintenance | 2 |
| 5.01 Container tracking | 2 |
| 7.02 Cargo documents management | 2 |
| 7.03 Blockchain-based Incoterms | 2 |
Table 11.
Bottom applications on Quality performance dimension.
| Application | Impact Score |
|---|---|
| 2.02 Assessment of ship risks using fuzzy logic | 0 |
| 2.15 AI applied to cybersecurity | 0 |
| 2.16 AI applied to data management and clean | 0 |
| 2.17 AI applied to competitors tracking and monitoring | 0 |
| 2.18 AI applied to business partners tracking and monitoring | 0 |
| 2.19 AI applied to providers tracking and monitoring | 0 |
| 2.20 AI applied to 3 parties route prediction | 0 |
| 3.04 ISPS security levels | 0 |
| 4.01 VR for training | 0 |
| 6.01 Cloud/Edge platform | 0 |
| 6.02 Use of SaaS via cloud | 0 |
| 6.03 Use of eLearning via cloud | 0 |
| 7.01 Enhanced cybersecurity | 0 |
| 7.04 Electronic logbook | 0 |
| 8.01 Spare parts using 3DP | 0 |
Table 12.
Top applications on Flexibility performance dimension.
| Application | Impact Score |
|---|---|
| 1.03 Digital twin for AV controlling and maintenance | 2 |
| 2.02 Assessment of ship risks using fuzzy logic | 2 |
| 2.03 Pricing market prediction | 2 |
| 2.04 Route optimization via AI analysis of client information | 2 |
| 2.05 Client offering optimization via AI analysis of client information | 2 |
| 2.06 Analysis of engine parameters to anticipate issues | 2 |
| 2.07 Route optimization via AI analysis of operational information | 2 |
| 2.08 Process optimization and reengineering using AI | 2 |
| 2.09 Freight rate optimization | 2 |
| 2.10 Fleet dimensioning optimization | 2 |
| 2.11 Optimizing maintenance process using digital twin and AI | 2 |
| 2.14 Optimizing ship’s operations via AI analysis of operational information | 2 |
| 5.01 Container tracking | 2 |
| 6.02 Use of SaaS via cloud | 2 |
| 6.03 Use of eLearning via cloud | 2 |
| 8.01 Spare parts using 3DP | 2 |
Table 13.
Bottom applications on Flexibility performance dimension.
| Application | Impact Score |
|---|---|
| 1.01 UV controlling system | 0 |
| 1.02 Autonomous vessels | 0 |
| 1.04 Use of robots in complex/hazardous tasks | 0 |
| 2.12 Conversational virtual assistance for helping seafarers in day-to-day activities | 0 |
| 2.15 AI applied to cybersecurity | 0 |
| 2.16 AI applied to data management and clean | 0 |
| 3.01 Big data algorithm for collision avoidance | 0 |
| 3.02 Big data analysis for energy efficiency | 0 |
| 3.03 Analysis of data on consumption and emissions for bunkering selection | 0 |
| 3.04 ISPS security levels | 0 |
| 3.05 Big data for ship Renewal | 0 |
| 5.02 Optimization of equipment usage | 0 |
| 6.01 Cloud/Edge platform | 0 |
| 7.01 Enhanced cybersecurity | 0 |
| 7.04 Electronic logbook | 0 |
Table 14.
Quick-win applications.
| Application | Time | Costs | Global Impact |
|---|---|---|---|
| 5.01 Container tracking | 2 | 2 | 8 |
| 7.02 Cargo documents management | 2 | 2 | 7 |
| 7.04 Electronic logbook | 2 | 2 | 4 |
| 4.03 VR for maintenance | 2 | 1.5 | 6.5 |
| 6.03 Use of eLearning via cloud | 2 | 1.5 | 5.5 |
| 6.02 Use of SaaS via cloud | 2 | 1 | 5 |
| 4.01 VR for training | 2 | 1 | 4 |
| 2.04 Route optimization via AI analysis of client information | 1.5 | 2 | 6.5 |
| 3.02 Big data analysis for energy efficiency | 1.5 | 2 | 5.5 |
| 3.03 Analysis of data on consumption and emissions for bunkering selection | 1.5 | 2 | 5.5 |
Publisher’s Note: MDPI stays neutral with regard to jurisdictional claims in published maps and institutional affiliations. |
© 2022 by the authors. Licensee MDPI, Basel, Switzerland. This article is an open access article distributed under the terms and conditions of the Creative Commons Attribution (CC BY) license (https://creativecommons.org/licenses/by/4.0/).
Share and Cite
MDPI and ACS Style
Sanchez-Gonzalez, P.-L.; Díaz-Gutiérrez, D.; Núñez-Rivas, L.R. Digitalizing Maritime Containers Shipping Companies: Impacts on Their Processes. Appl. Sci. 2022, 12, 2532. https://doi.org/10.3390/app12052532
AMA Style
Sanchez-Gonzalez P-L, Díaz-Gutiérrez D, Núñez-Rivas LR. Digitalizing Maritime Containers Shipping Companies: Impacts on Their Processes. Applied Sciences. 2022; 12(5):2532. https://doi.org/10.3390/app12052532
Chicago/Turabian StyleSanchez-Gonzalez, Pedro-Luis, David Díaz-Gutiérrez, and Luis R. Núñez-Rivas. 2022. "Digitalizing Maritime Containers Shipping Companies: Impacts on Their Processes" Applied Sciences 12, no. 5: 2532. https://doi.org/10.3390/app12052532
Note that from the first issue of 2016, this journal uses article numbers instead of page numbers. See further details here.