Article

Investigating Particulate and Nitrogen Oxides Emissions of a Plug-In Hybrid Electric Vehicle for a Real-World Driving Scenario

1
Institute of Vehicle Concepts, German Aerospace Center, 70569 Stuttgart, Germany
2
Institute of Combustion Technology, German Aerospace Center, 70569 Stuttgart, Germany
*
Author to whom correspondence should be addressed.
Appl. Sci. 2022, 12(3), 1404; https://doi.org/10.3390/app12031404
Submission received: 7 December 2021 / Revised: 14 January 2022 / Accepted: 26 January 2022 / Published: 28 January 2022
(This article belongs to the Special Issue The Effect of Vehicle Emissions on Secondary Aerosol and Air Quality)

Abstract

:
Plug-in hybrid electric vehicles (PHEVs) show a high pollutant emission variability that strongly depends on the operating conditions of the internal combustion engine. Additionally, studies indicate that driving situations outside of the real driving emissions boundary conditions can lead to substantial pollutant emission increases. The objective of this study is to measure and analyze the particulate number (PN) and nitrogen oxides (NOx) emissions of a Euro 6 PHEV for a selected real-world driving test route in the Stuttgart metropolitan area. For this purpose, the vehicle is set out with multiple measurement devices to monitor vehicle internal and external parameters. Particle distribution results show an overall uniform pattern, which allows a comparative analysis of the different test scenarios on the basis of the PN concentration. While the trip-average PN emissions are in good agreement, transient effects during highway driving can substantially increase emissions, whereas the fuel consumption does not necessarily increase in such situations. PN measurements including ultrafine particles (UFP) show a significant increase in urban emissions due to higher cold start emission peaks. Additionally, low ambient temperatures raise the uncertainty of NOx and PN cold start emissions. With regard to future emission regulations, which claim that vehicles need to be as clean as possible in all driving situations, PHEV emission investigations for further situations outside of the current legislations are required.

1. Introduction

Emissions from passenger car transport play a major role in air quality and climate change. Various publications from recent years have shown that there are in some cases considerable variances in emissions in dependence of external criteria such as driving cycles or test route characteristics such as altitudes, traffic congestion and operating or outside temperatures [1,2,3]. Therefore, uncertainties remain, as current emission inventories and databases do not capture all these variances and thus do not represent the actual emissions of all vehicles models or driving situations. This raises the importance of on-road real driving emissions (RDE) testing with portable emissions measurement systems (PEMS) in order to collect more accurate data for real-world driving conditions of road vehicles. Ref [4] found within their PEMS measurement campaign that the speed-dependent COPERT emission factors underestimate emissions of Euro 6b vehicles by overlooking acceleration events that cause high emission peaks. Laboratory and on-road PEMS measurements of 13 conventional gasoline and diesel Euro 6b vehicles [5] indicate that even for the same fuel type, high deviations of emissions can occur. As an example, the NOx emission factors of diesel vehicles vary by a factor of 50 and the gasoline direct injection (GDI) vehicles show eight times higher NOx emissions than the port fuel injection ones.
In particular, an ecological assessment based on emission factors of plug-in hybrid electric vehicles (PHEVs) is challenging, since various driving modes affecting operating strategy of the vehicle have a significant influence on emissions [6]. While fuel consumption of a PHEV is strongly correlated to the battery state of charge (SOC), pollutant emissions such as carbon monoxide (CO) and nitrogen oxides (NOx) depend on the driving mode and the driving situation in which the internal combustion engine (ICE) start occurs. One influencing factor is, for example, that driving in electric mode can lead to peak CO and NOx emissions in motorway driving situations due to cold start of ICE in relation to not sufficient temperature of the catalyst [7]. Furthermore, vehicle tests which are performed outside of the RDE boundary conditions indicate new emission issues by showing that certain driving conditions can lead to substantial pollutant emission increases [8]. In terms of particle emissions, dynamometer tests have shown that particle concentrations below 23 nm exceed the regulation limits in some situations which indicates the need to consider sub-23 nm particle size in future emission regulations [9].
Regarding the particle measurement accuracy, [10] found that the sub-23 nm particle number (PN) measurement differences between various PEMS devices are at the same level as the differences between laboratory systems. Further, the repeatability of >10 nm PN measurements is at least the same as for >23 nm measurements for both at the dilution tunnel and at the tailpipe. The uncertainty, however, is increased by the loss of small particles in the volatile particle remover (VPR) systems. Here, the use of catalytic strippers (CS) has shown a high potential to measure tailpipe emissions down to 10 nm [11]. Direct, size-resolved measurements, e.g., with an engine exhaust particle sizer (EEPS), usually require a feasible aerosol dilution to prevent nucleation and water artifacts [12].
Still, due to the complexity of PHEV operation modes and emission test conditions, there is a lack of representative information on emission factors of this vehicle type and especially of data on ultrafine particles (UFP) emissions and particle characterization. In view of an upcoming EURO 7 regulation, understanding the patterns of emission formation gets more important, as new pollutants such as sub-23 nm particles and emissions outside the RDE boundaries, e.g., at lower temperatures or aggressive driving, are planned to be considered for passenger car type approval [13].
In this study, we aim at evaluating the influence of different test situations on the formation of NOx and particle emissions in real-world driving situations of a PHEV. The aim is to combine complementary measurement techniques in order to assess the test results in terms of reproducibility and variability in different road types. PN is analyzed as well as particle mass distribution. The tests are performed on a close to RDE criteria compliant route in the city of Stuttgart and cover urban driving as well as rural and motorway sections. As we focus on the emission formation in different driving situations and the influence of the hybridization of the drive-train, we evaluate only tests in the hybrid and sport driving modes that basically skip the electric driving period during charge depletion.

2. Materials and Methods

2.1. Test Route

The basis of the study is the measurement and analysis of the fuel consumption and the tailpipe emissions of a PHEV representing real-world driving conditions in the Stuttgart metropolitan area. Stuttgart is known for its highly congested roads and, in this context, for air quality issues by frequently exceeding air pollutant limit values in previous years [14]. Thus, a test route is selected that includes several traffic hotspots such as the Neckarpark Dreieck, the Hauptstätter Straße and the federal motorway A8 [15]. The selected test route contains vehicle speed-dependent urban, rural and motorway parts and has a distance of approx. 55 km. Figure 1 gives an overview of the test route, starting in the southwestern area of Stuttgart (Vaihingen) with the major urban parts of the test route leading across the city, following by the main rural sections and ending with the motorway parts. Colors indicate the vehicle speed ranges of the test route for one exemplary test run.
Another point to highlight is that the boundary conditions of the RDE test procedure are considered as a baseline for the selection of the test route with the prioritization to include the local circumstances of the Stuttgart metropolitan area. Therefore, the selected test route is not fully RDE-compliant. Table 1 presents the characteristics of the selected Stuttgart route in comparison to the respective RDE trip requirements.
The classification of an RDE trip into the urban, rural and motorway distance sections is conducted according to the vehicle speed. The urban part includes distances driven with less or equal to 60 km/h, the rural part covers distances driven with a vehicle speed of 60–90 km/h and the motorway part comprises distances driven above 90 km/h of vehicle speed. A total number of 11 real-world driving emissions tests have been performed during a period of approx. 20 weeks. As the boundary conditions such as weather, congestion, roadworks, etc. vary within this period, the shares of the vehicle speed groups also differ. Hence, Table 1 presents the ranges of the Stuttgart test route specifications for the entire test series. The comparison shows that the Stuttgart route has a relatively high share of urban and rural parts, while the motorway distance share is relatively low. Additionally, the total trip duration is below the RDE range of 90–120 min. The Stuttgart route is furthermore characterised by an area featuring a rather variable topography with height differences of approx. 300 m. The cumulative positive elevation gain of the entire test route is approx. 100 m below the limit of the RDE test conditions while the cumulative positive elevation gain for the urban part of the test route is about 1600 m/100 km and therefore exceeds the limit of 1200 m/100 km.

2.2. Vehicle and Fuel

The selected test vehicle is a Euro 6b PHEV with a 110 kW direct-injection spark ignition engine and a 75 kW electric machine. The system power is 150 kW and the traction battery has a capacity of 8.7 kWh, which corresponds to an electric range of 50 km in the New European Driving Cycle (NEDC). The odometer reading at the beginning of the test series is 12,500 km and at the end 14,500 km. The vehicle is refueled with certified E5 gasoline considering the entire test series [16].

2.3. Testing Equipment and Measurement Parameters

The emission of non-volatile PN is monitored with an on-board PEMS (MAHA-AIP GmbH & Co. KG, Haldenwang, Germany). Before each test drive, the obligatory leak check of the condensation particle counter (CPC) is performed in the form of a particle zero check with the use of a high-efficiency particulate air (HEPA) filter. The zero check of CPC systems should be at least nearly 0 #/cm3 [17]. Regarding the measurement accuracy, the study from [10] includes a PEMS device from the same manufacturer and reveals that the accuracy for measuring sub-23 nm PN is within ±20–40%. This is a promising level of accuracy as the differences of the reference laboratory systems themselves can reach up to 30% (ibid.).
Additionally, an exhaust flow meter (EFM) is mounted to the vehicle hitch to measure the exhaust mass flow, so that the emission concentrations can be converted to absolute mass emissions. The built-in CPC of the PEMS features a cut-off diameter at 23 nm.
In addition, an EEPS (TSI Inc., Shoreview, MN, USA) is operated onboard. The EEPS measures the particle size distribution of particles in the range 5.6–560 nm in 16 channels at 10 Hz. The aerosol is dried with a diffusion dryer before entering the instrument. Pre-tests show that a dilution of the aerosol is not necessary. The EEPS is calibrated by the manufacturer before the campaign using an emery oil standard. Before each drive, the electrometer currents are zeroed to assure low-noise conditions.
A CLD700 NOx analyser (range 0–1000 ppm) from Eco Physics AG (Duernten, Switzerland) is used for NOx measurements. The NOx analyzer is calibrated before each drive using a NO2 calibration gas (single point calibration) and nitrogen gas as zero air.
The EEPS, the NOx analyser and the extra battery for the energy demand of the devices account for an additional weight of approx. 100 kg. Further, the vehicle is equipped with a 12 V measurement system that records multiple vehicle internal, electrical, thermal fuel-side and GPS parameters, including 17 temperatures, 8 electric currents, 5 voltages as well as humidity, air pressure and fuel mass flow measurements. Fuel consumption is measured using a flowtronic sensor series S8005 (Gregory Technology GmbH, Mainz, Germany), which is an external sensor. The measuring range is between 0.1 L/h and 250 L/h and the measuring accuracy is ±0.5%. Figure 2 gives an overview on the measurement arrangement and the measured values.
Table 2 summarizes the used measuring systems and the respective measuring parameters, which are relevant for the subsequent data analysis and results presented in this article.

2.4. Testing Protocol

A total of 11 tests are performed, which can be grouped in 3 sections. The first one consists of 5 consecutive testing days during summer time, driving with the hybrid mode. The second section includes 3 tests in the sport driving mode, also during summer time. The remaining 3 tests are performed during autumn time, in the hybrid mode, to include lower ambient temperatures. Table 3 gives a summary of the conducted test series.
Each day, one test is performed around midday. In the morning, the vehicle and the measurement equipment are prepared. Especially the pre-testing of the PEMS and EFM includes several calibration steps and can last up to 2 h. Each test starts with an empty battery (SOC = 0%) and includes the cold start of the ICE. During the test, the measured data is recorded and stored on a laptop computer. Therefore, the recorded raw data can be processed and analyzed afterwards. Immediately after the tests the post-testing of the equipment is conducted to ensure validity of the performed tests. When the tests and post-testing of the instruments are completed, the vehicle is driven in the electric driving mode until the battery SOC is at 0% again, as during the tests the battery is charged in some situations, e.g., high load driving or due to regenerative braking events.

3. Results and Discussion

In the following subchapters, results for fuel consumption, PN emissions and NOx emissions are presented and discussed.
Figure 3 summarises the main measured values for an exemplary test drive.

3.1. Fuel Consumption and Electric Driving Shares

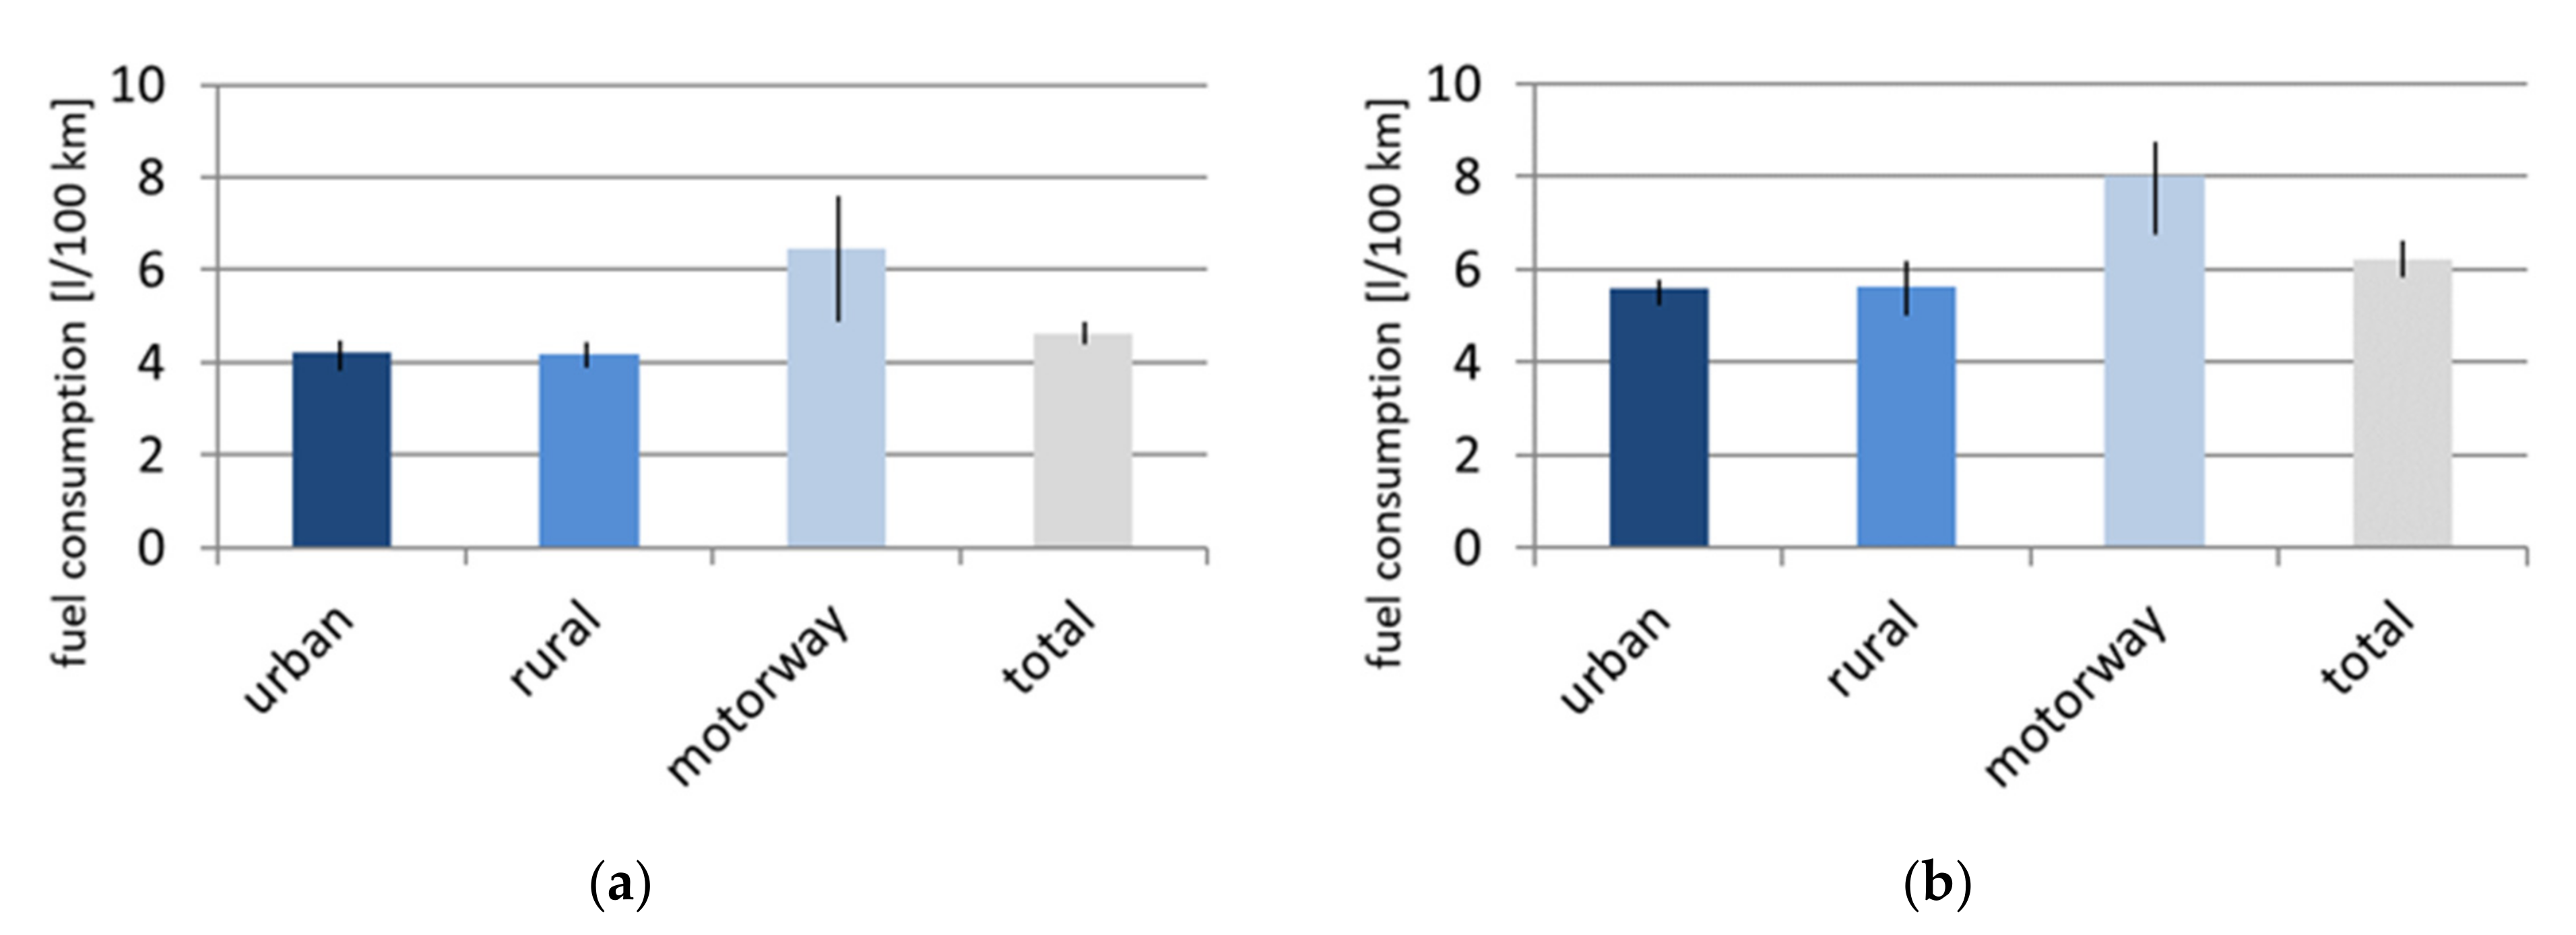
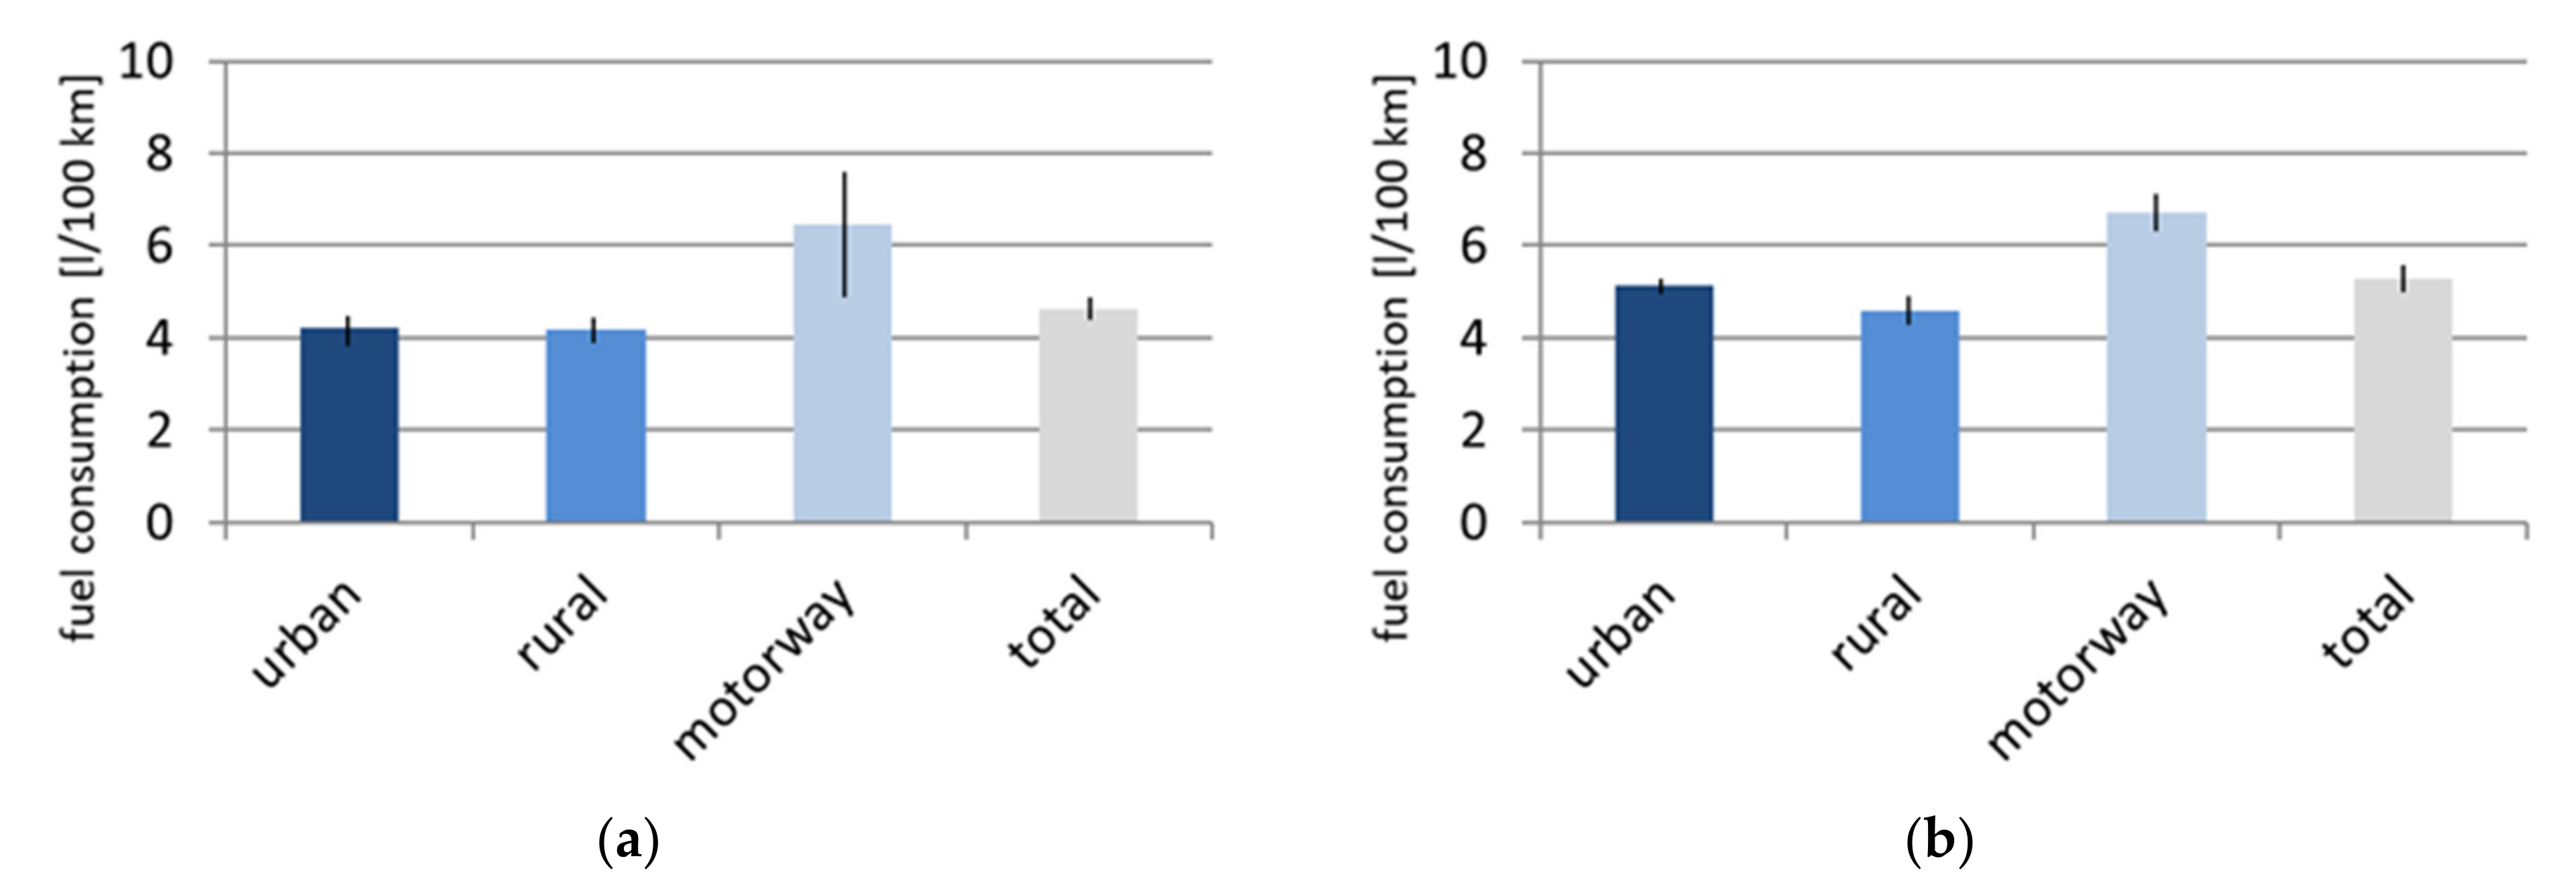
Figure 4 presents a comparison of the real-world fuel consumption of the PHEV under investigation for the hybrid driving mode (Figure 4a) and for the sport driving mode (
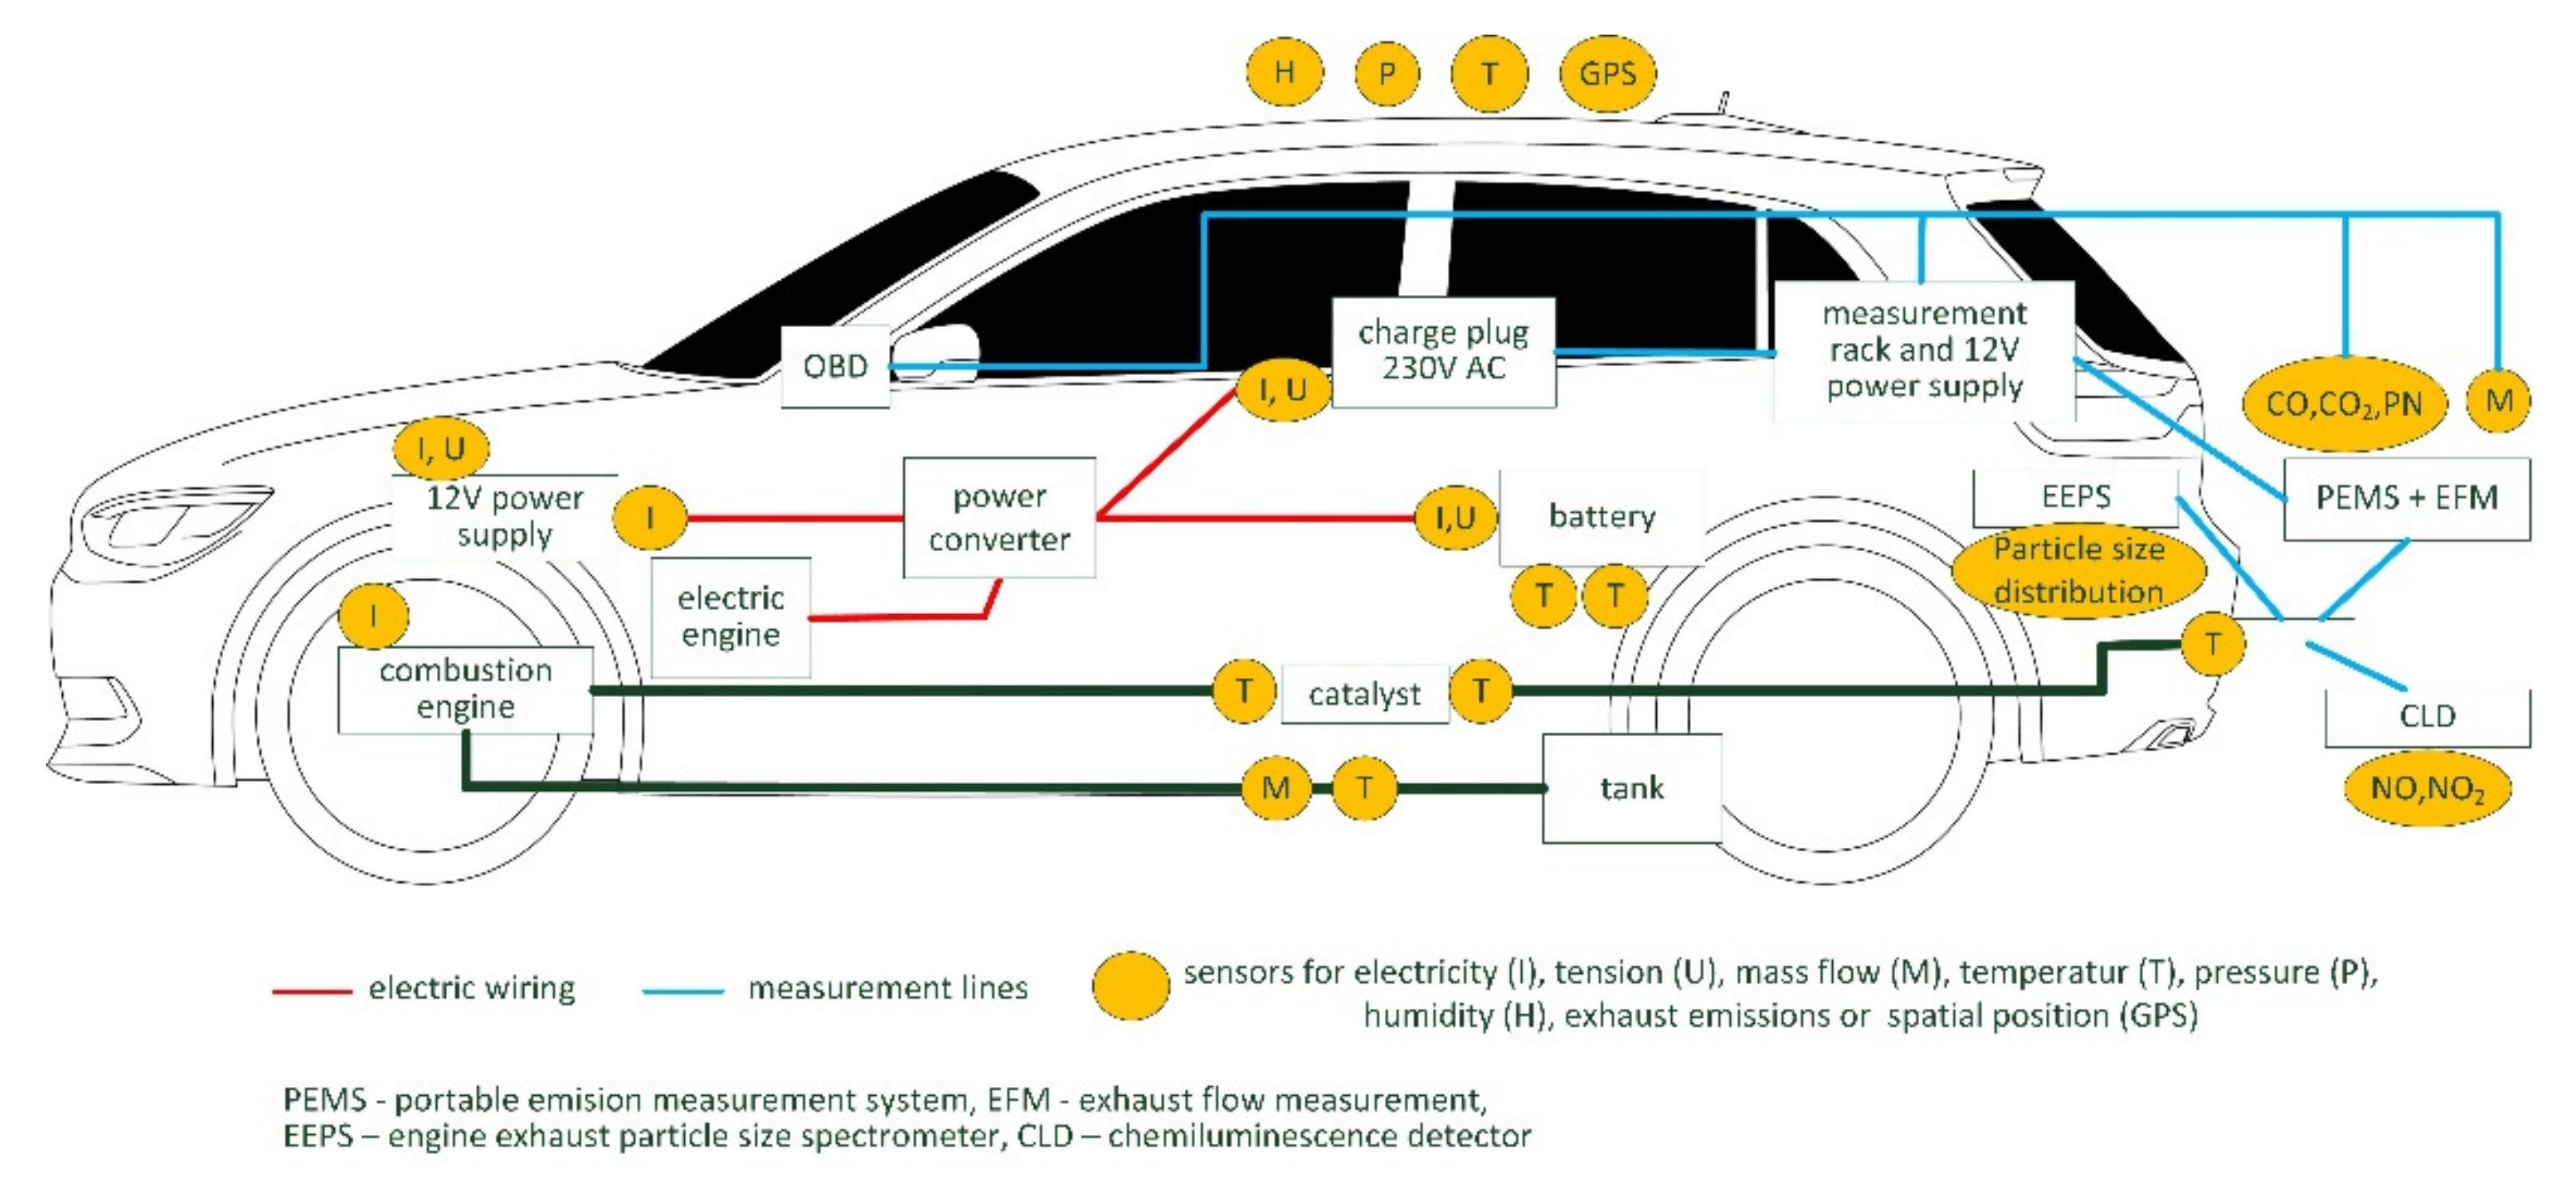
Figure 4b). The boundary conditions such as ambient temperatures between the tests conducted in hybrid driving mode and the sport driving mode tests are similar and both test series are performed within 2 weeks. It should be noted that here the actual fuel consumption related to the ICE is shown, which is measured by a fuel mass flow sensor (cf. Figure 2). The energy consumption of the electric machine is not included.
Table 4 summarizes the electric driving shares of the studied PHEV for each real-world driving test, considering the different vehicle speed categories. The electric driving shares are calculated as the relative distance share at which the ICE is inactivated, and no fuel consumption is measured.
The comparison indicates an average fuel consumption of 4.6 L/100 km for the hybrid driving mode and 6.2 L/100 km for the Sport driving mode concerning the total test route (Figure 4). The fuel consumption values for the respective vehicle speed ranges are also about 20–25% lower for the hybrid driving mode compared to the sport driving mode. This can be explained due to the fact that when the sport driving mode is activated, the PHEV activates the ICE more frequently and follows a more dynamic operating strategy than in case of the hybrid mode.
Regarding the influence of the vehicle speed on fuel consumption, for both the hybrid and the sport driving mode, the values for urban and rural vehicle speed ranges are on a similar level, while the fuel consumption for motorway driving is considerably higher. Especially for the urban driving parts, the vehicle indicates high electric driving shares (Table 4) and therefore low ICE driving shares, which leads to low fuel consumption values. For rural vehicle speed ranges, the ICE is activated more often, but fuel consumption values are relatively low due to more constant (or less dynamic) driving patterns and low driving resistances. At motorway vehicle speeds, the air resistance and hence the fuel consumption rise disproportionately to the vehicle speed increase [18]. As the ICE needs to be activated most of the time to reach the high power demand, the electric driving shares of the PHEV are low.
Figure 5 shows a comparison of the real-world fuel consumption of the studied PHEV for driving in the hybrid mode in summer (Figure 5a) and driving the same mode in autumn (Figure 5b). Besides of the ambient temperature differences, the driving tests in autumn are conducted with winter tires, while summer tires are used for the tests during the warm season (Table 3).
During the summer tests, the average real-world fuel consumption is about 4.6 L/100 km and in autumn it is 5.3 L/100 km, which corresponds to an increase of 15%.
Concerning the fuel consumption for urban vehicle speeds, the average value of the summer tests is 4.2 L/100 km and for the autumn tests the average fuel consumption value is 5.1 L/100 km. For rural vehicle speeds, the average fuel consumption of the summer tests is 4.2 L/100 km and 4.6 L/100 km for the autumn tests. Average motorway fuel consumptions are 6.5 L/100 km (summer tests) and 6.7 L/100 km (autumn tests). The higher variance of the motorway fuel consumption in the summer tests can be explained by the greater fluctuations of the electric driving shares for motorway driving (Table 4). However, the average values are nearly identical. The fuel consumption increases for driving the PHEV in autumn compared to summer are approx. 10% for rural vehicle speeds and 3% for motorway vehicle speeds. Regarding urban vehicle speeds, the average fuel consumption of the autumn tests is about 21% higher than in the summer tests. As the winter tires increase the fuel consumption independently from the vehicle speed, the authors assume that the cold start and warming-up phase of the ICE and the energy demand of auxiliary consumers are the main influencing factors for the significant fuel consumption increase at urban vehicle speeds.

3.2. PN Emissions

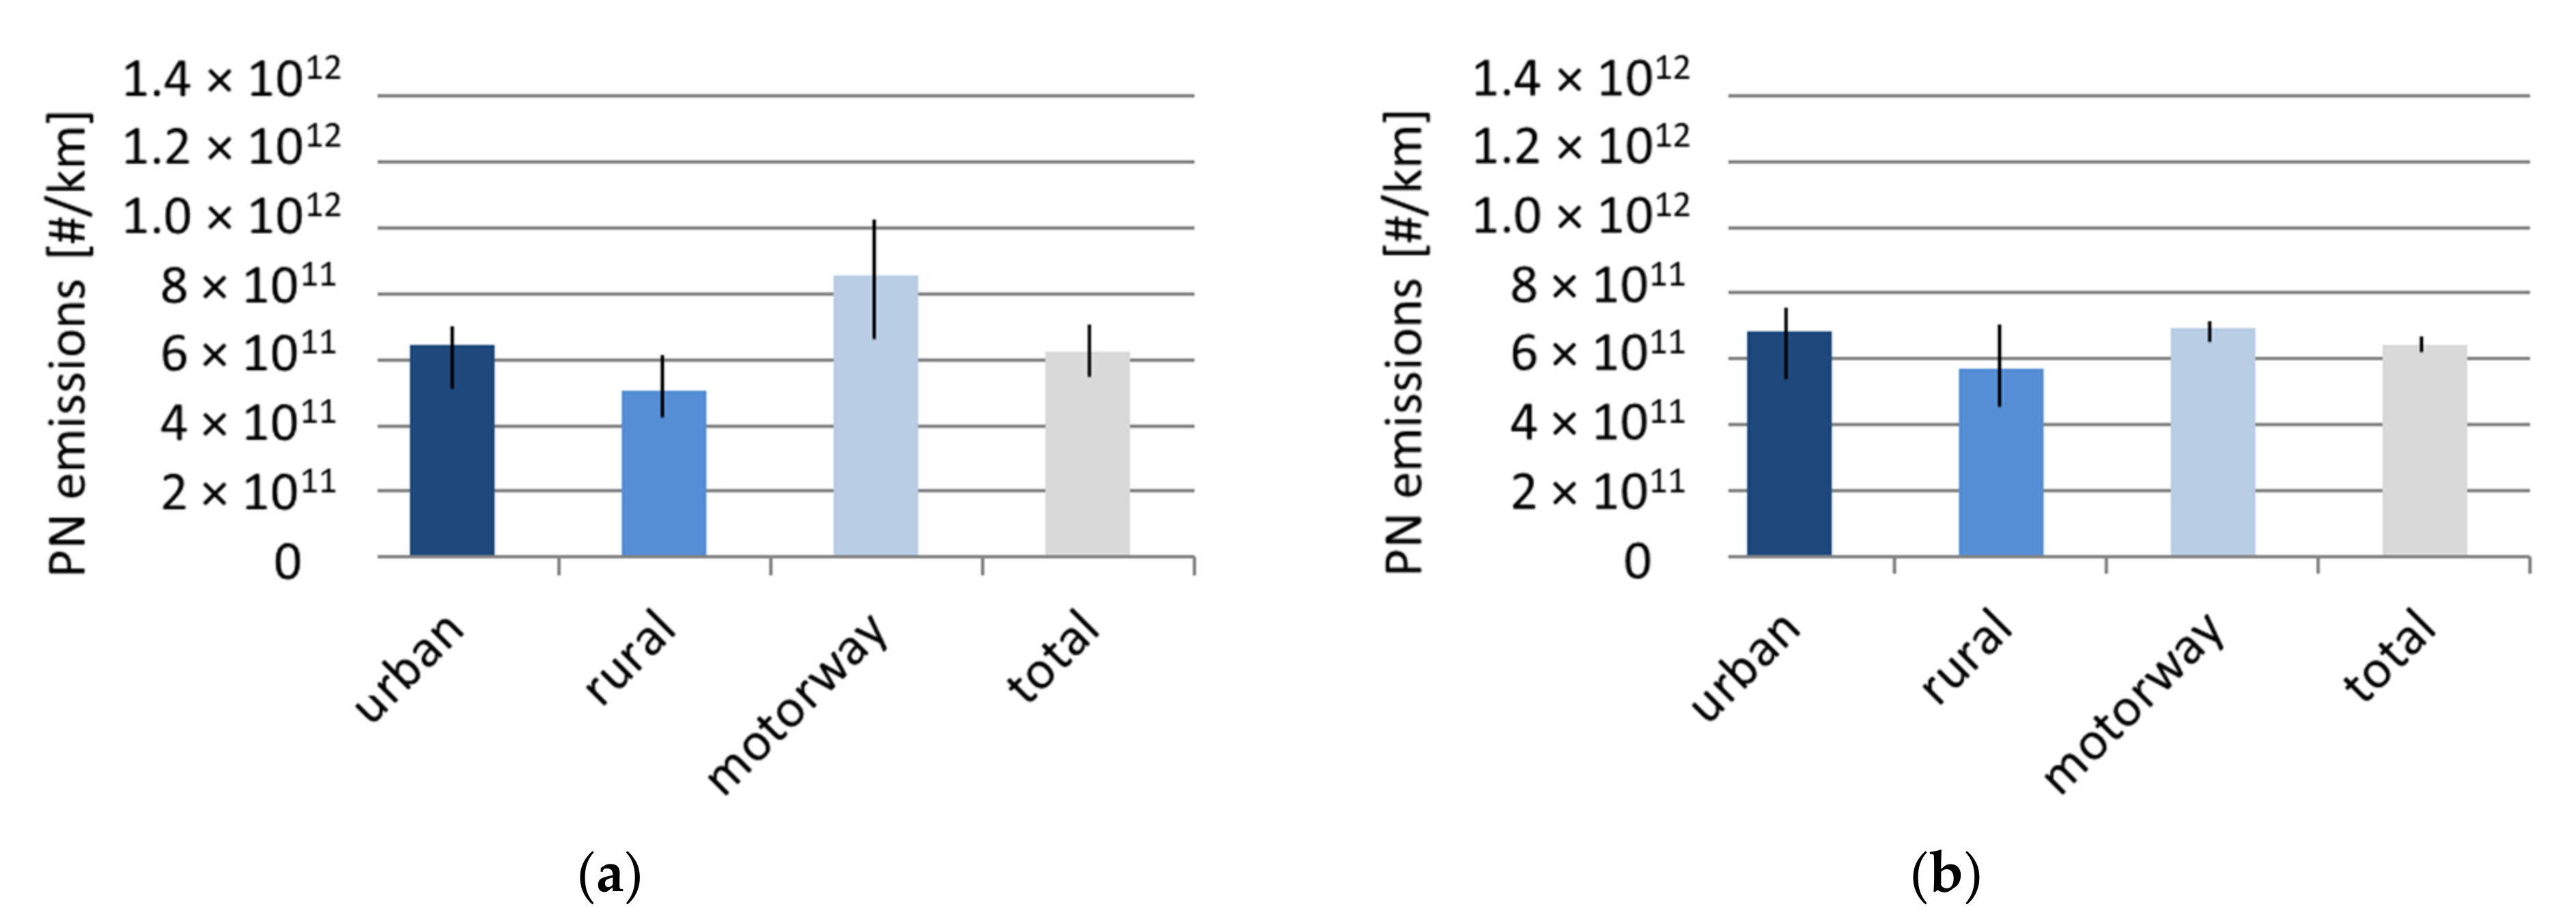
Figure 6 presents a comparison of the average, distance-related PN emission factors of the studied PHEV for real-world driving conditions in the hybrid driving mode (Figure 6a) and in the sport driving mode (Figure 6b). The PN emission factors base on the PEMS raw emission data.
The average PN emission factors of the total test track are similar for both the hybrid driving mode (6.25 × 10¹¹ #/km) and the sport driving mode (6.44 × 10¹¹ #/km), but the variance of the hybrid driving mode values is higher than those of the sport driving mode test results.
Concerning the PN emission factors for urban and rural vehicle speeds, the emission values for sport mode driving are approx. 6% (urban) and 13% (rural) higher than for hybrid mode driving. For both test series, the average emission factors for urban vehicle speeds are higher than those for the rural speed category and the variances are also comparable. The higher PN emissions for urban vehicle speeds relative to rural vehicle speeds—in spite of higher electric driving shares and comparable fuel consumptions (
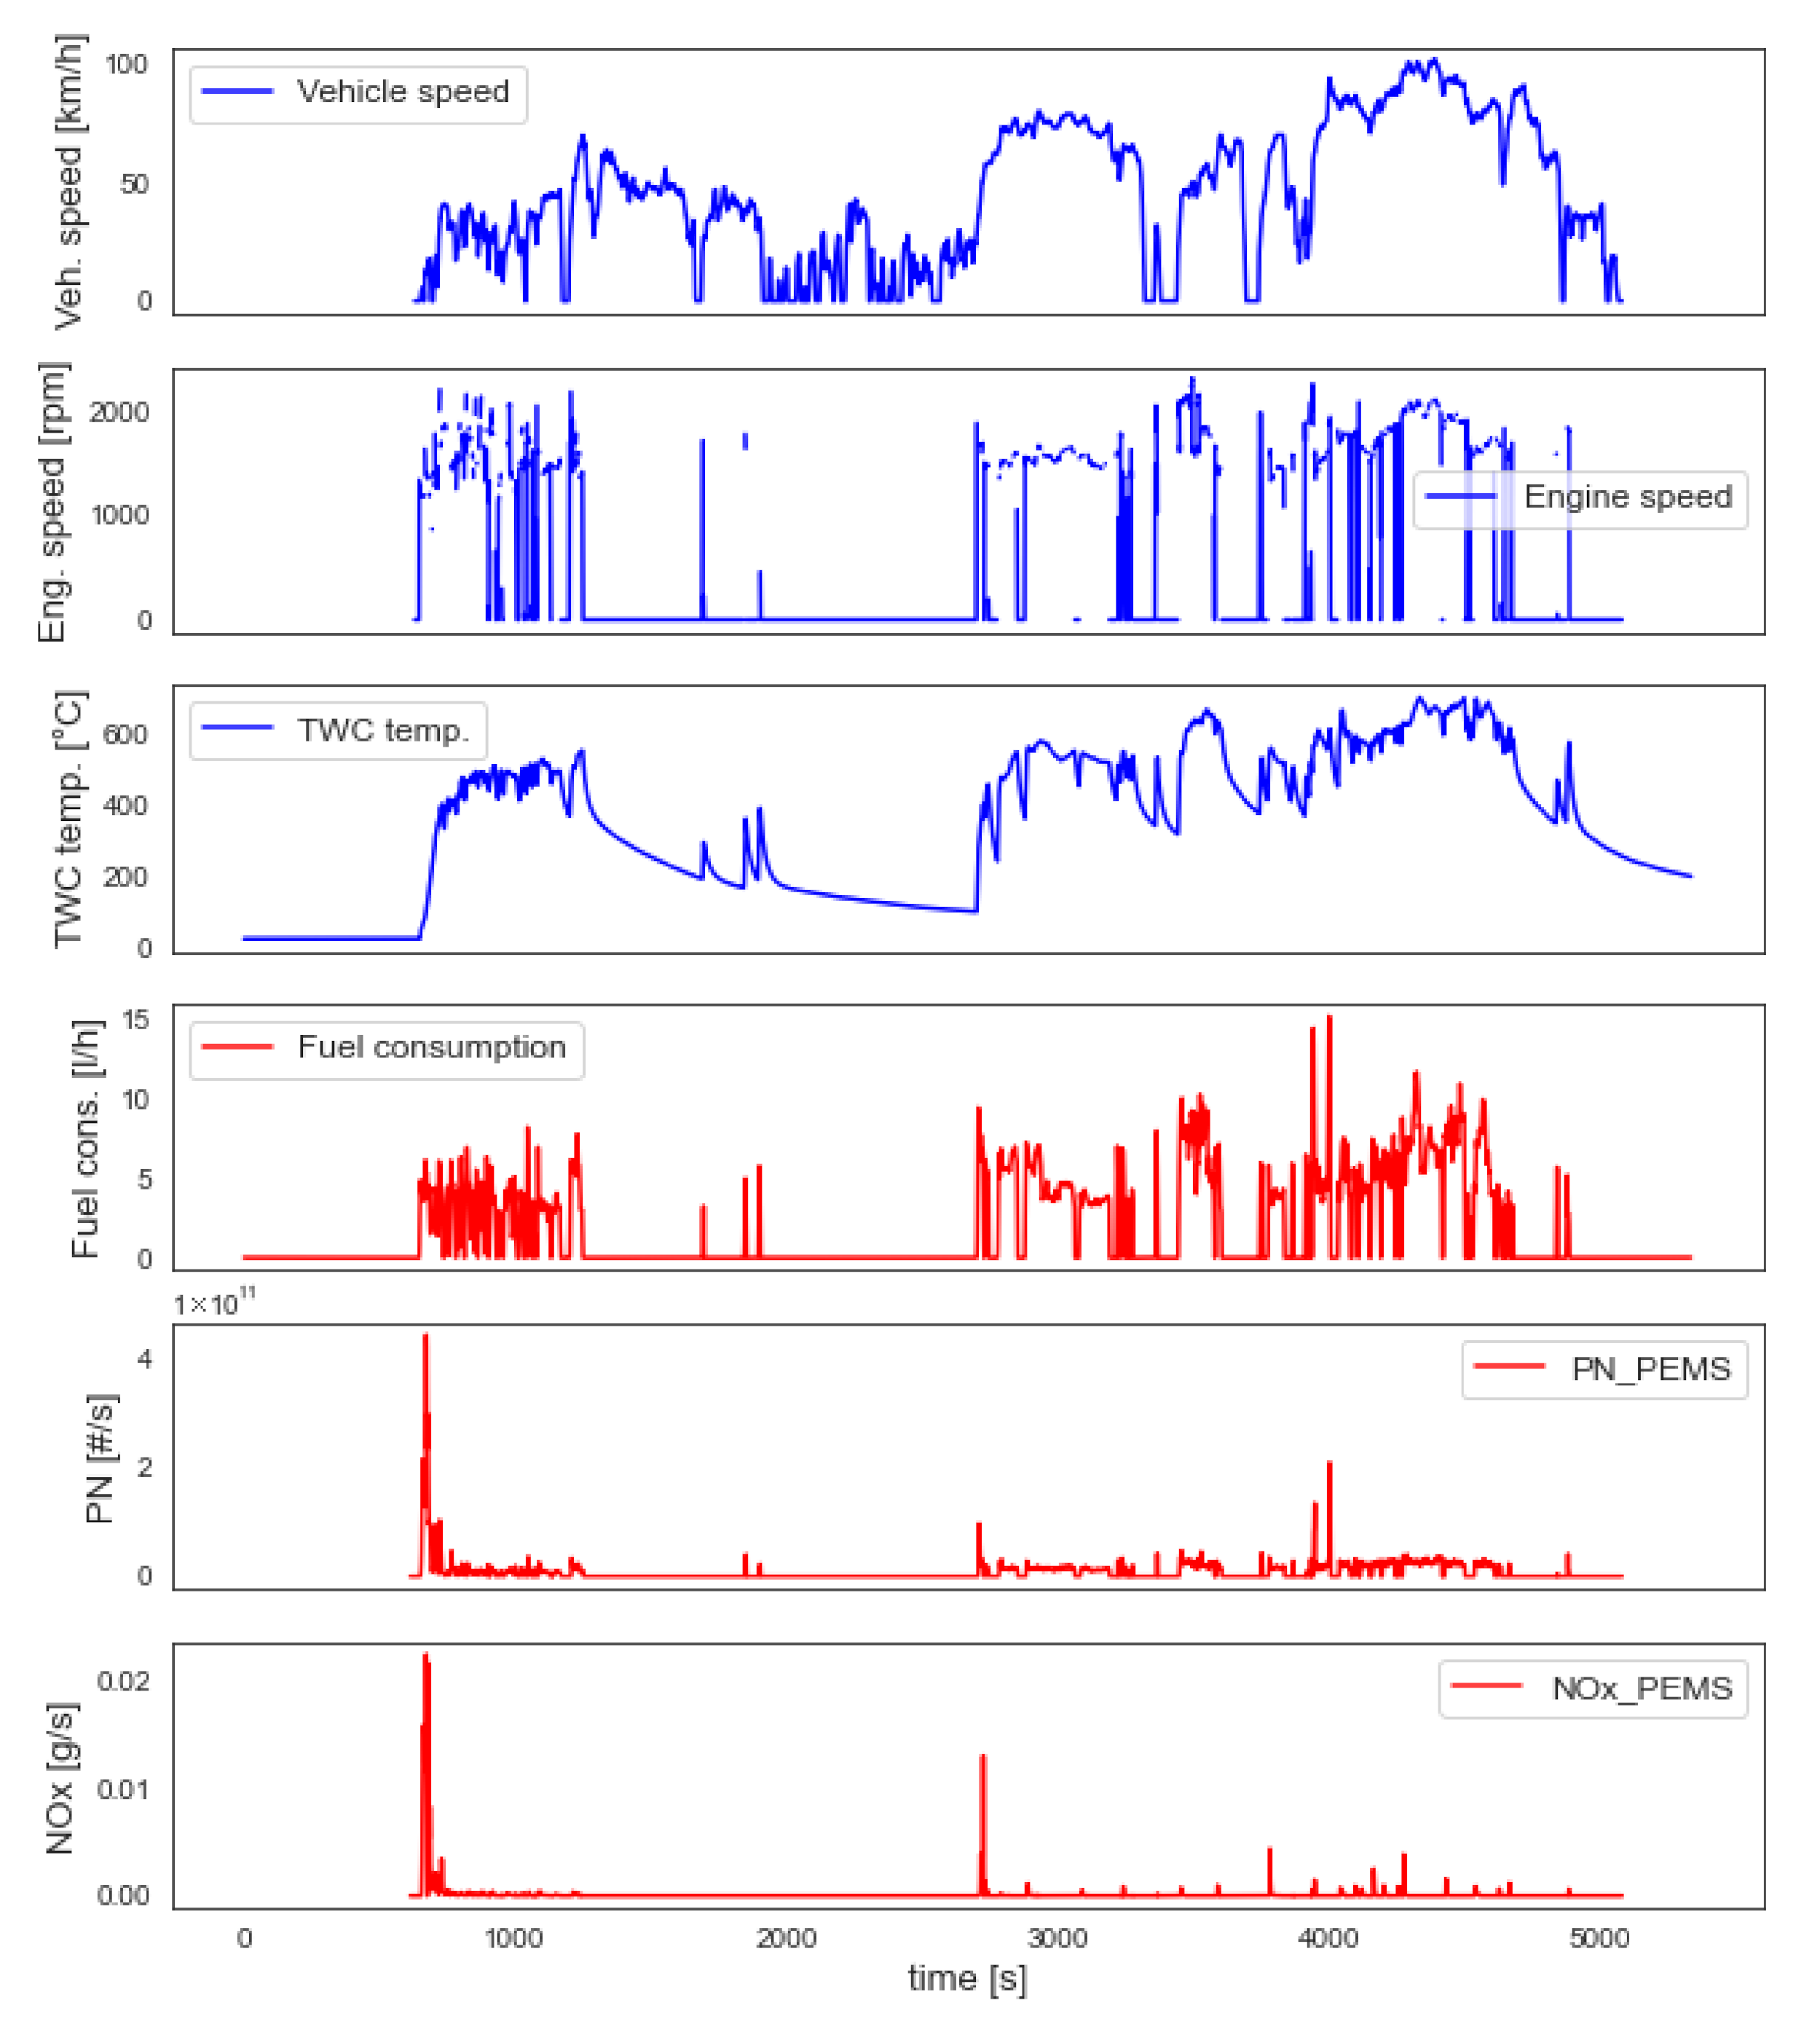
Figure 4)—can be associated with cold start emission peaks, which appear when the ICE is activated the first time (Figure 3). At cold start conditions and during the warming up phase, the fuel consumption can increase. In addition to that, the three-way catalyst (TWC) is not fully warmed up yet during this phase, which leads to high CO and hydrocarbon (HC) emissions. These effects can also favor particle formation. Furthermore, it is important to note that the PHEV under study is not equipped with a gasoline particle filter (GPF).
For motorway vehicle speeds, Figure 6 shows an average emission factor of 8.6 × 10¹¹ #/km for the hybrid driving mode and 6.9 × 10¹¹ #/km for the sport driving mode. Thus, PN emissions are significantly higher (+25%) in the hybrid driving mode compared to the sport driving mode, although lower fuel consumptions and higher electric driving shares are observed within the hybrid driving mode tests (Figure 4 and 
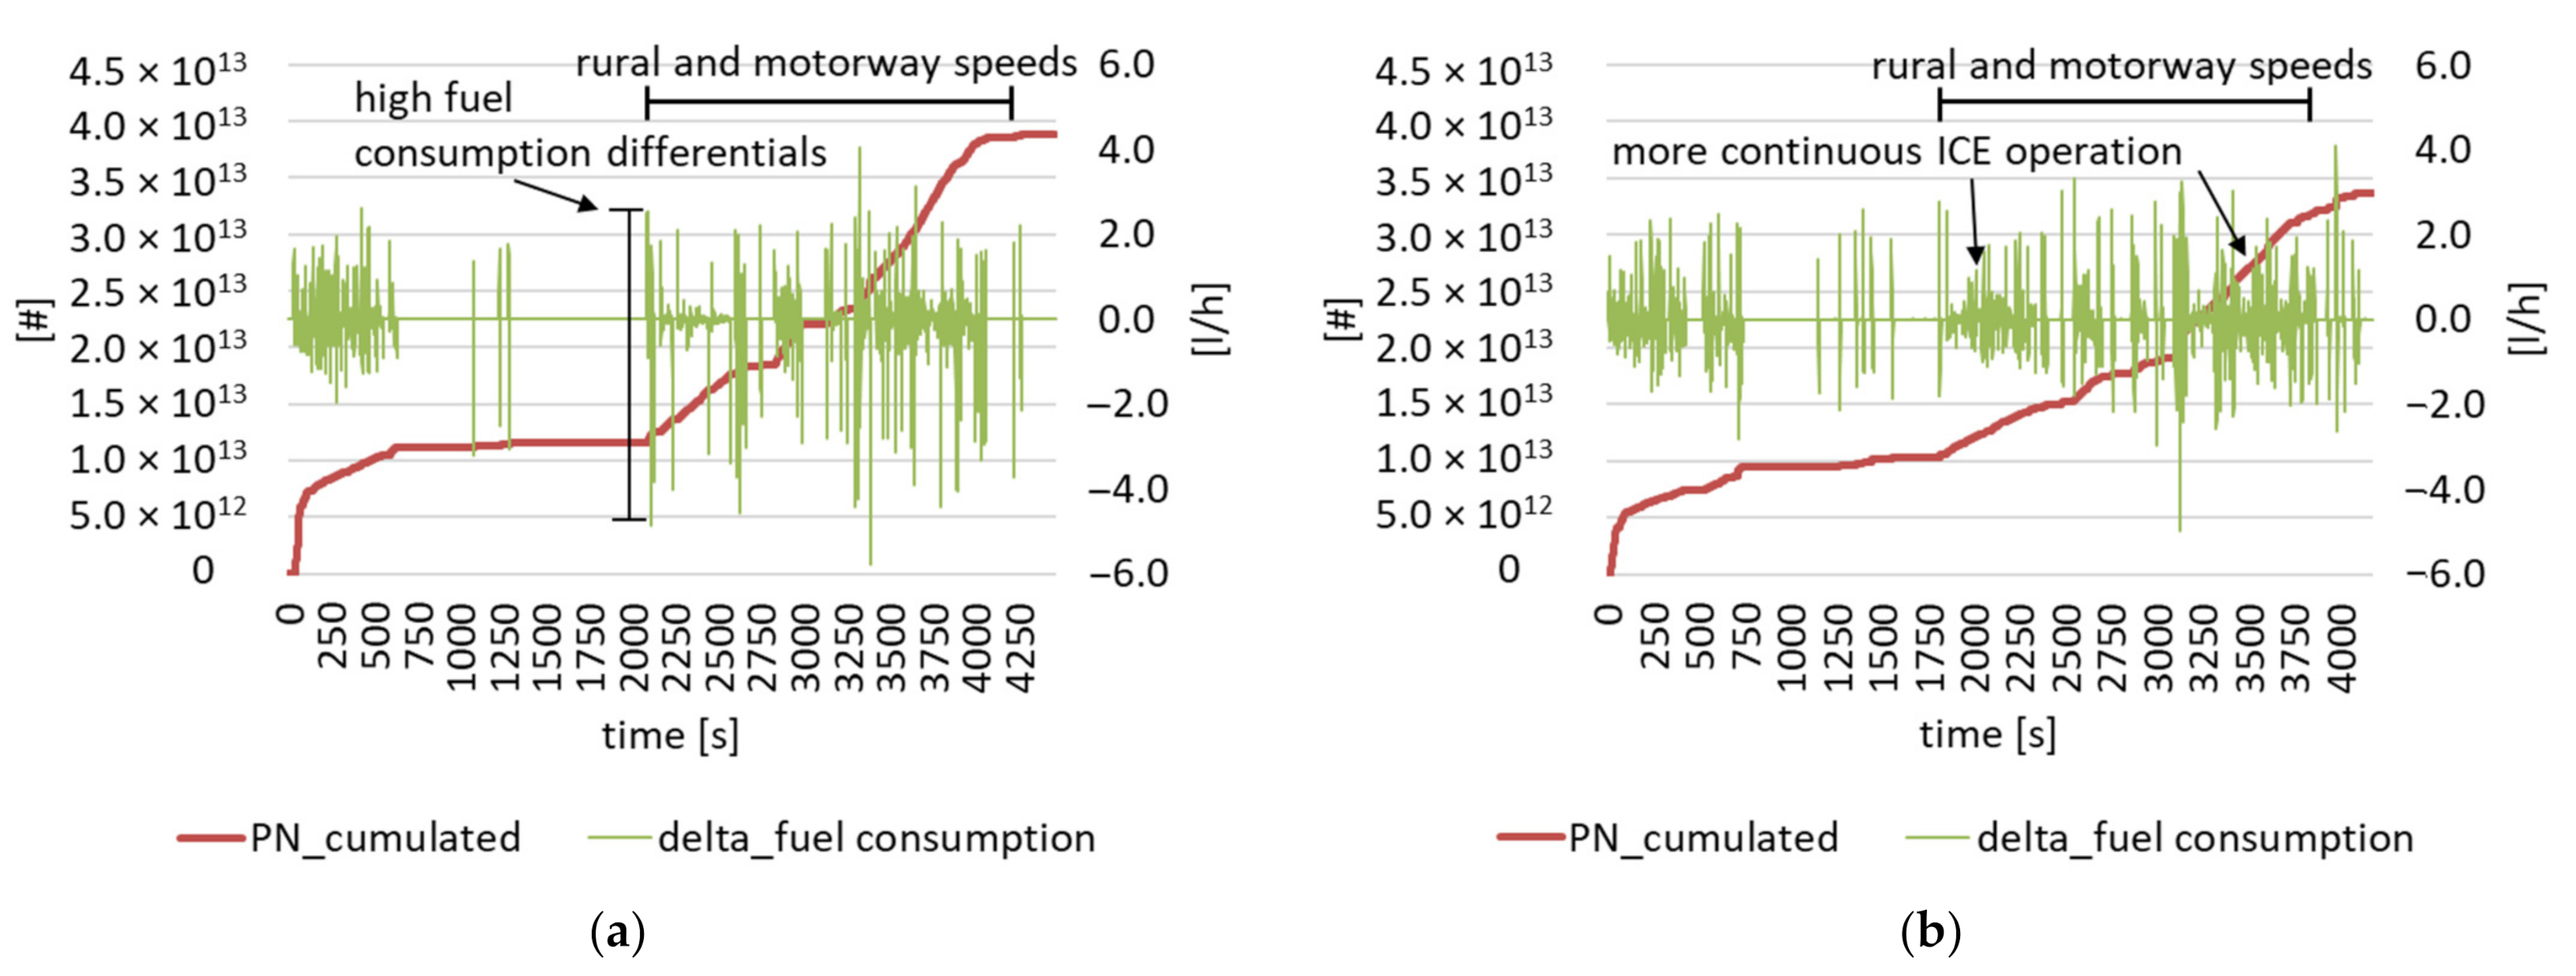
Table 4). In order to identify possible causes for this anomaly, Figure 7 shows a comparison of the cumulative PN emissions over time for a test drive in the hybrid driving mode (Figure 7a) and a test drive in the sport driving mode (Figure 7b). In addition, the differentials of the fuel consumption are presented as an alternative indicator for the activity of the ICE as the engine speed could not have been tracked during the tests in the sport driving mode.
During the first half of the test track, the cumulative PN emissions in the hybrid driving mode test are marginally higher than in the sport driving mode test. In the second half of the test track, which mainly consists of rural and motorway vehicle speed parts, the increase in cumulative particle emissions in the hybrid driving mode test becomes much greater than in the case of the sport driving mode test. The fuel consumption differential curve shows that there are generally less spikes in the hybrid driving mode test which means that the ICE is activated less frequently than in the sport driving mode test. However, the amplitude of the fuel consumption differential spikes is significantly higher for the hybrid driving mode (Figure 7a) than for the sport driving mode (Figure 7b). The authors assume that the observed dynamic operation pattern of the ICE in terms of its regular activation and deactivation causes these higher fuel consumption differentials, which in turn leads to the strong increase in PN emissions during the rural and especially the motorway driving parts. In contrary, the cumulative PN emissions for driving in the sport mode show a lower increase than in the hybrid mode, because the ICE is operated more continuously, which avoids major particle formation, even though the average fuel consumption is higher. Suarez-Bertoa et al. [19] show for a GPF-equipped vehicle that the PN emissions are shaped by accelerations and the engine speed. Similarly, in case of the investigated PHEV of this study, the differentials of the fuel consumption and therefore the engine speed are decisive for PN formation. Furthermore, the observed PN emission increase during motorway driving events is not related to a potential low operating temperature of the PHEV, as in contrast to [7], the test drives are not performed in the electric driving mode. Due to the frequent ICE operation phases in the hybrid and sport driving modes, the operating temperature of the vehicle is sufficiently high during rural and motorway driving. This is proven by the level of the TWC temperatures of +300 °C during the second half of the tests (e.g., Figure 3). Therefore, the authors conclude that the obtained results are representative in spite of the mentioned relatively small motorway share of the test route.
Figure 8 shows a comparison of the average, distance-related PN emission factors of the studied PHEV for driving in the hybrid mode in summer (Figure 8a) and driving the same mode in autumn (Figure 8b). It should be noted that in the test series during summer particle sizes of up to 23 nm are captured, while the test series in autumn include the measurement of UFP with up to 10 nm diameter.
The average total PN emission factor of the autumn test series is 9.34 × 10¹¹ #/km, which is approx. 49% higher than the measured average emission factor in the summer tests. While the differences of PN emission factors for rural and motorway vehicle speeds are smaller (6.67 × 10¹¹ #/km and 5.07 × 10¹¹ #/km for rural driving and 1.00 × 10¹² #/km and 8.58 × 10¹¹ #/km for motorway driving), the average urban PN emission factor of the autumn tests is approx. 79% higher than in the summer tests (Figure 8). One possible cause for this observation could be the influence of the lower ambient temperature in the autumn test series. According to Table 3, the ambient temperature of the autumn test series is 10–14 °C and 24–29 °C during the summer test series. Worldwide harmonized Light vehicles Test Procedure (WLTP) tests of the same vehicle show that for the hybrid driving mode, PN emissions are marginally higher at −7 °C ambient temperature compared to 23 °C ambient temperature and for the case of urban PN emissions, the values can be even lower at the lower ambient temperature [20]. Considering these findings and the fact that within the test series of this study the ambient temperature differences are actually smaller, the authors assume that the influence of ambient temperature differences on PN emissions can be neglected in this comparative case. Hence, the significantly higher PN emission factors of the autumn tests are primarily associated with the UFP share, which is particularly dominant at urban vehicle speeds.

3.3. Particle Size Distribution

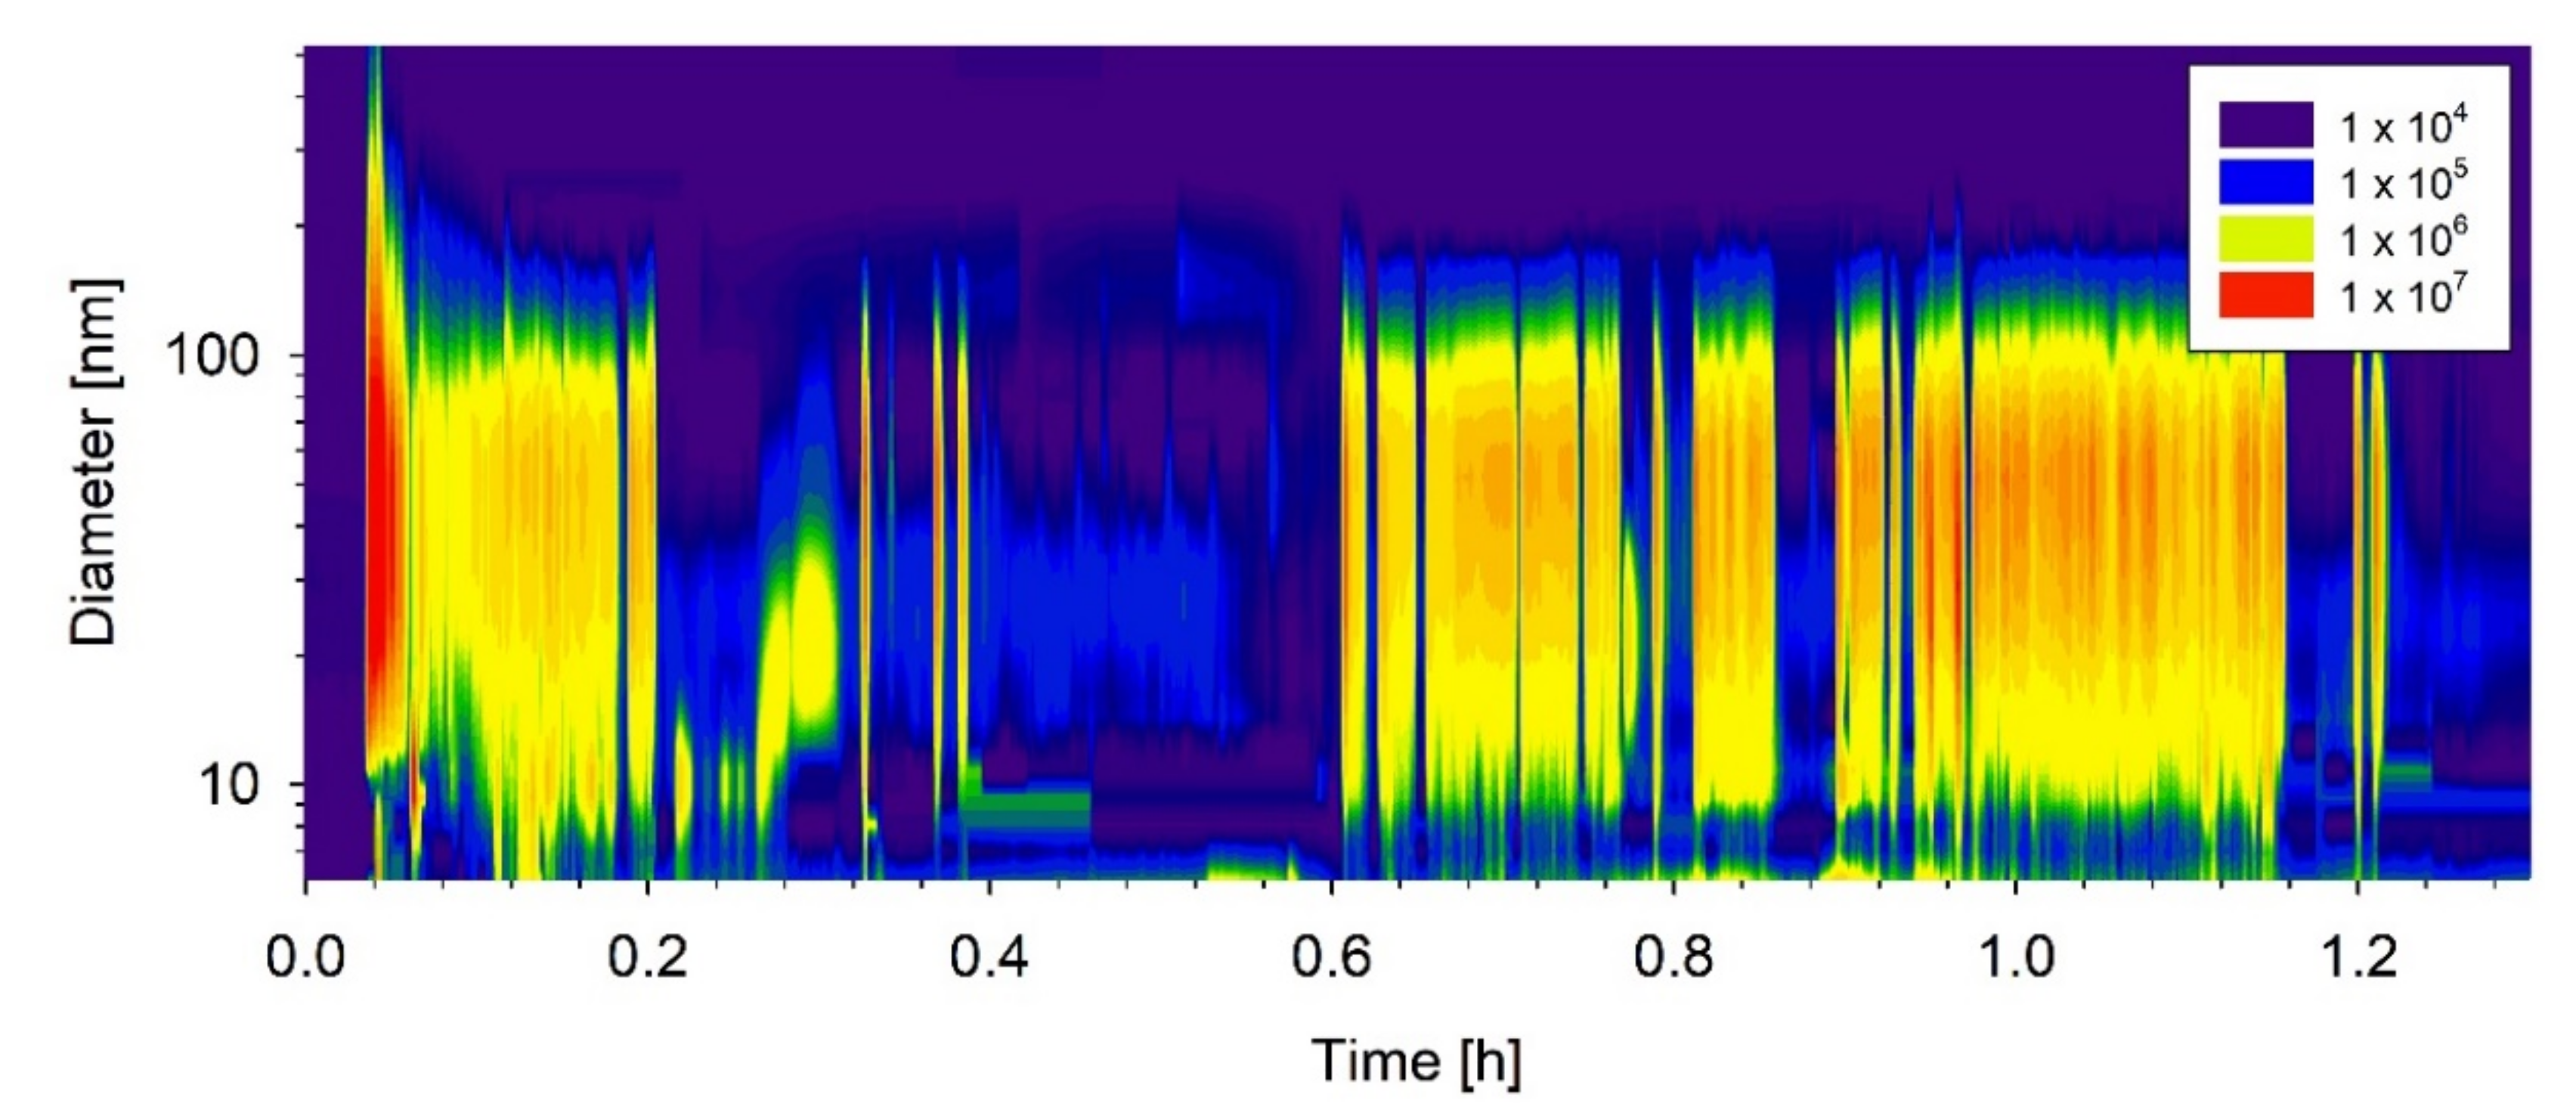
The development of the particle size distribution is shaped by the non-constant operation of the engine (Figure 9). The initial emission peak is broad, ranging from <10 nm to 500 nm. Subsequent engine operation yields a high concentration of particles in the 10 nm range. A second mode can be observed at approx. 50 nm. Since the volatile fraction of particles was not stripped from the aerosol, the sub-23 nm fraction increases the fluctuation in the total particle number concentration. The bimodal size distributions are in good agreement with the results of [12] who analyzed the emissions from a light-duty gasoline vehicle with the EEPS.
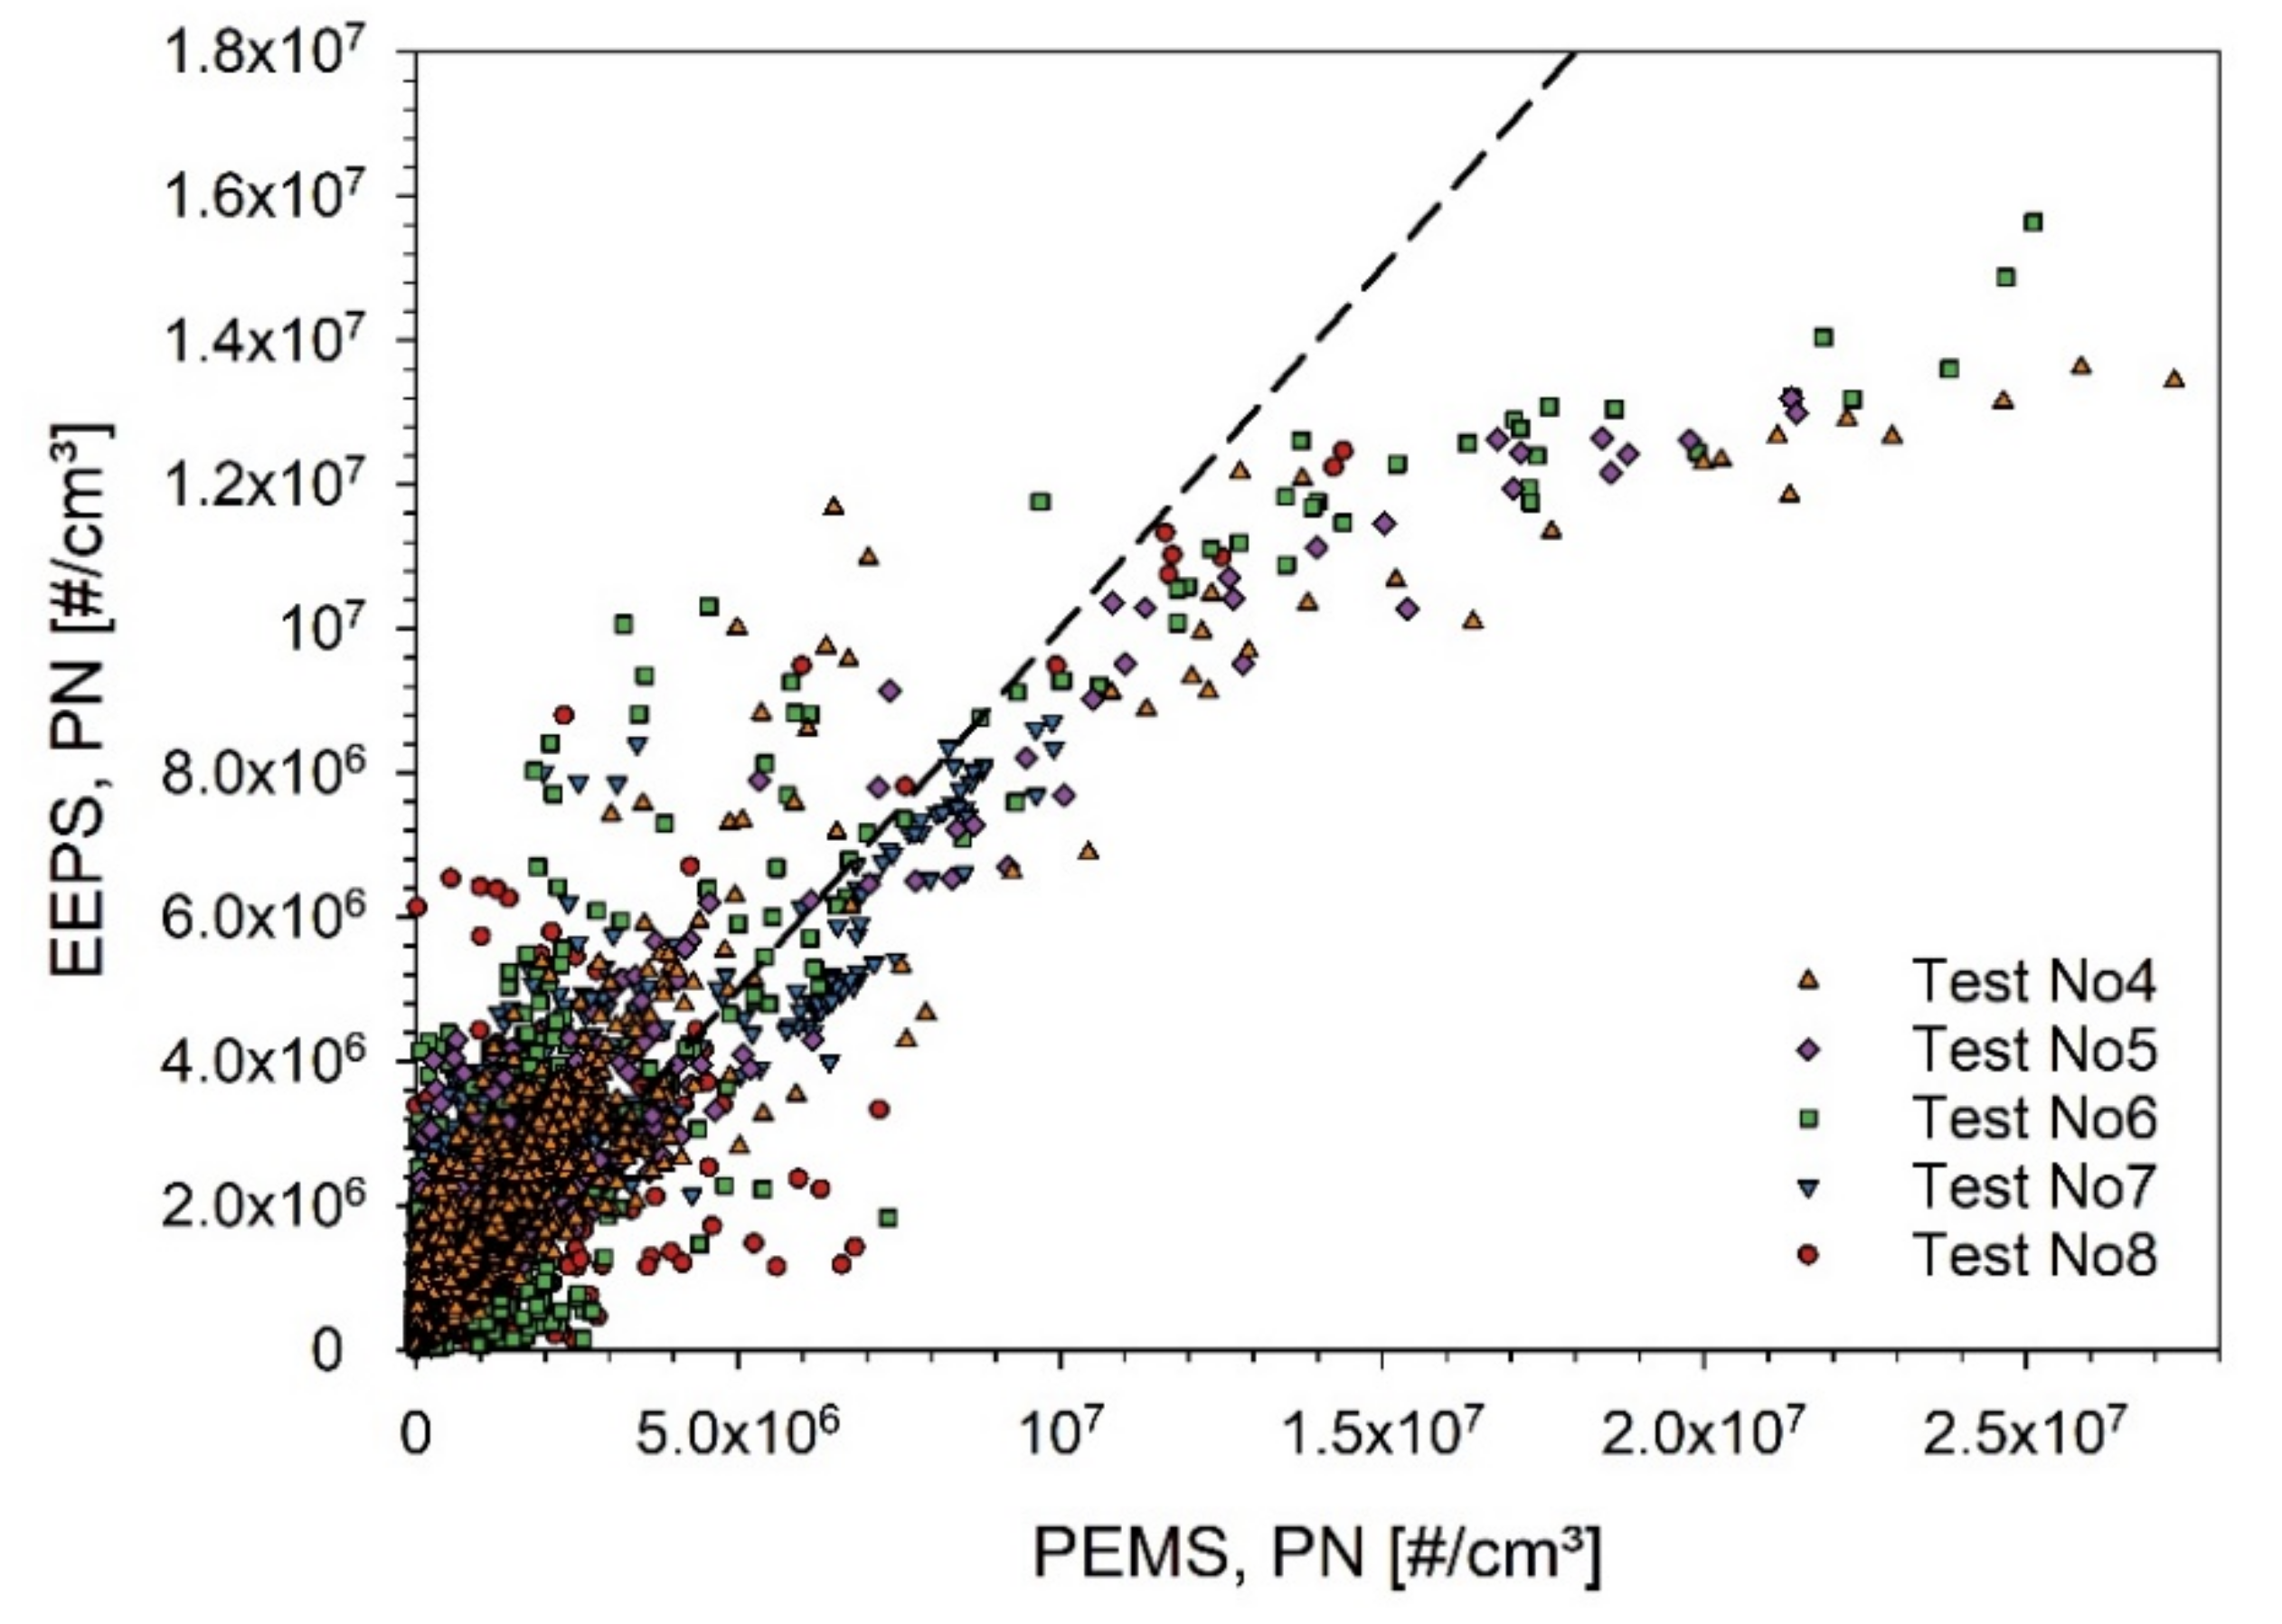
The non-volatile particle number concentration from the PEMS and the total particle number concentration of the EEPS feature an acceptable correlation at concentrations below 1.0 × 10⁷ #/cm3 (Figure 10). Above, the condensation particle counter switches into the photometric mode which lowers the precision of the instrument [21]. It must be noted, however, that the EEPS also operated at the upper concentration limit of the instrument. A dilution of the aerosol would have been advised to prevent electrometer artifacts but could not be realized in the mobile setup. In the present results no significant shifts were observed which could result from the non-constant engine operation.
Overall, a general impact of the different driving scenarios on the particle size distribution could not be observed. In particular, the motorway section shows a well-repeatable size distribution between the different operation phases. At the beginning of the experiment, the variation is slightly higher. This can be attributed to the warm-up of the engine.
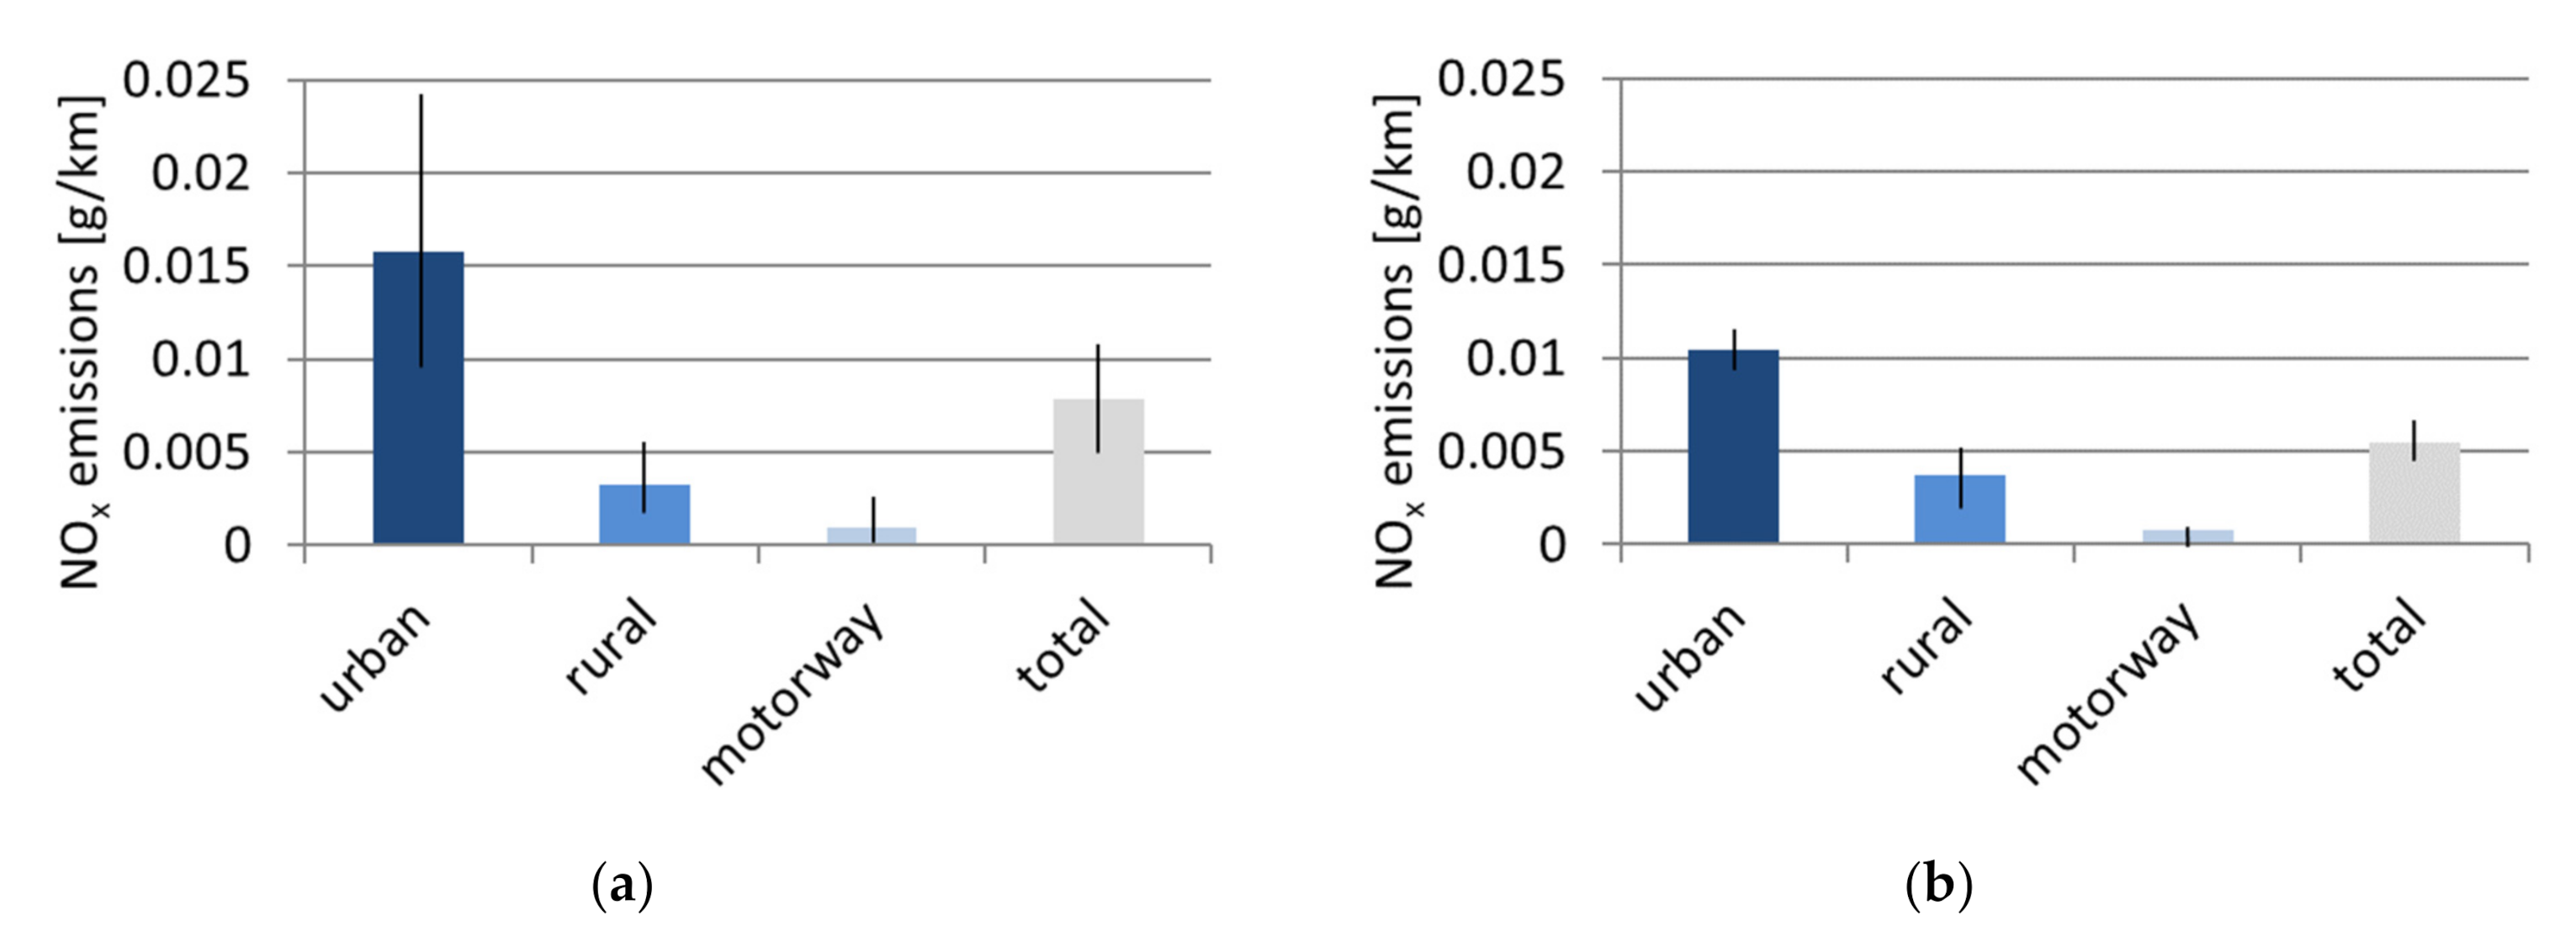
3.4. NOx Emissions

Figure 11 shows a comparison of the average, distance-related real-world NOx emissions of the studied PHEV for driving in the hybrid mode in summer (Figure 11a) and driving the sport mode in summer (Figure 11b).
In total, the average NOx emission factor of the studied PHEV is about 8 mg/km for hybrid driving and almost 6 mg/km for the sport driving mode. While the emissions for rural and motorway vehicle speeds are similar for both driving modes and generally are on a low level, the urban NOx emissions differ significantly. For the sport driving mode, the average urban NOx emission factor is approx. 10 mg/km and the variance within the tests is small (Figure 11b). The average urban NOx emissions for hybrid driving are nearly 16 mg/km, which is 52% higher than for the sport driving mode. Furthermore, the variance of urban NOx emissions is considerably greater within the hybrid driving mode tests, which ranges from approx. 10 mg/km till 24 mg/km (Figure 11a).
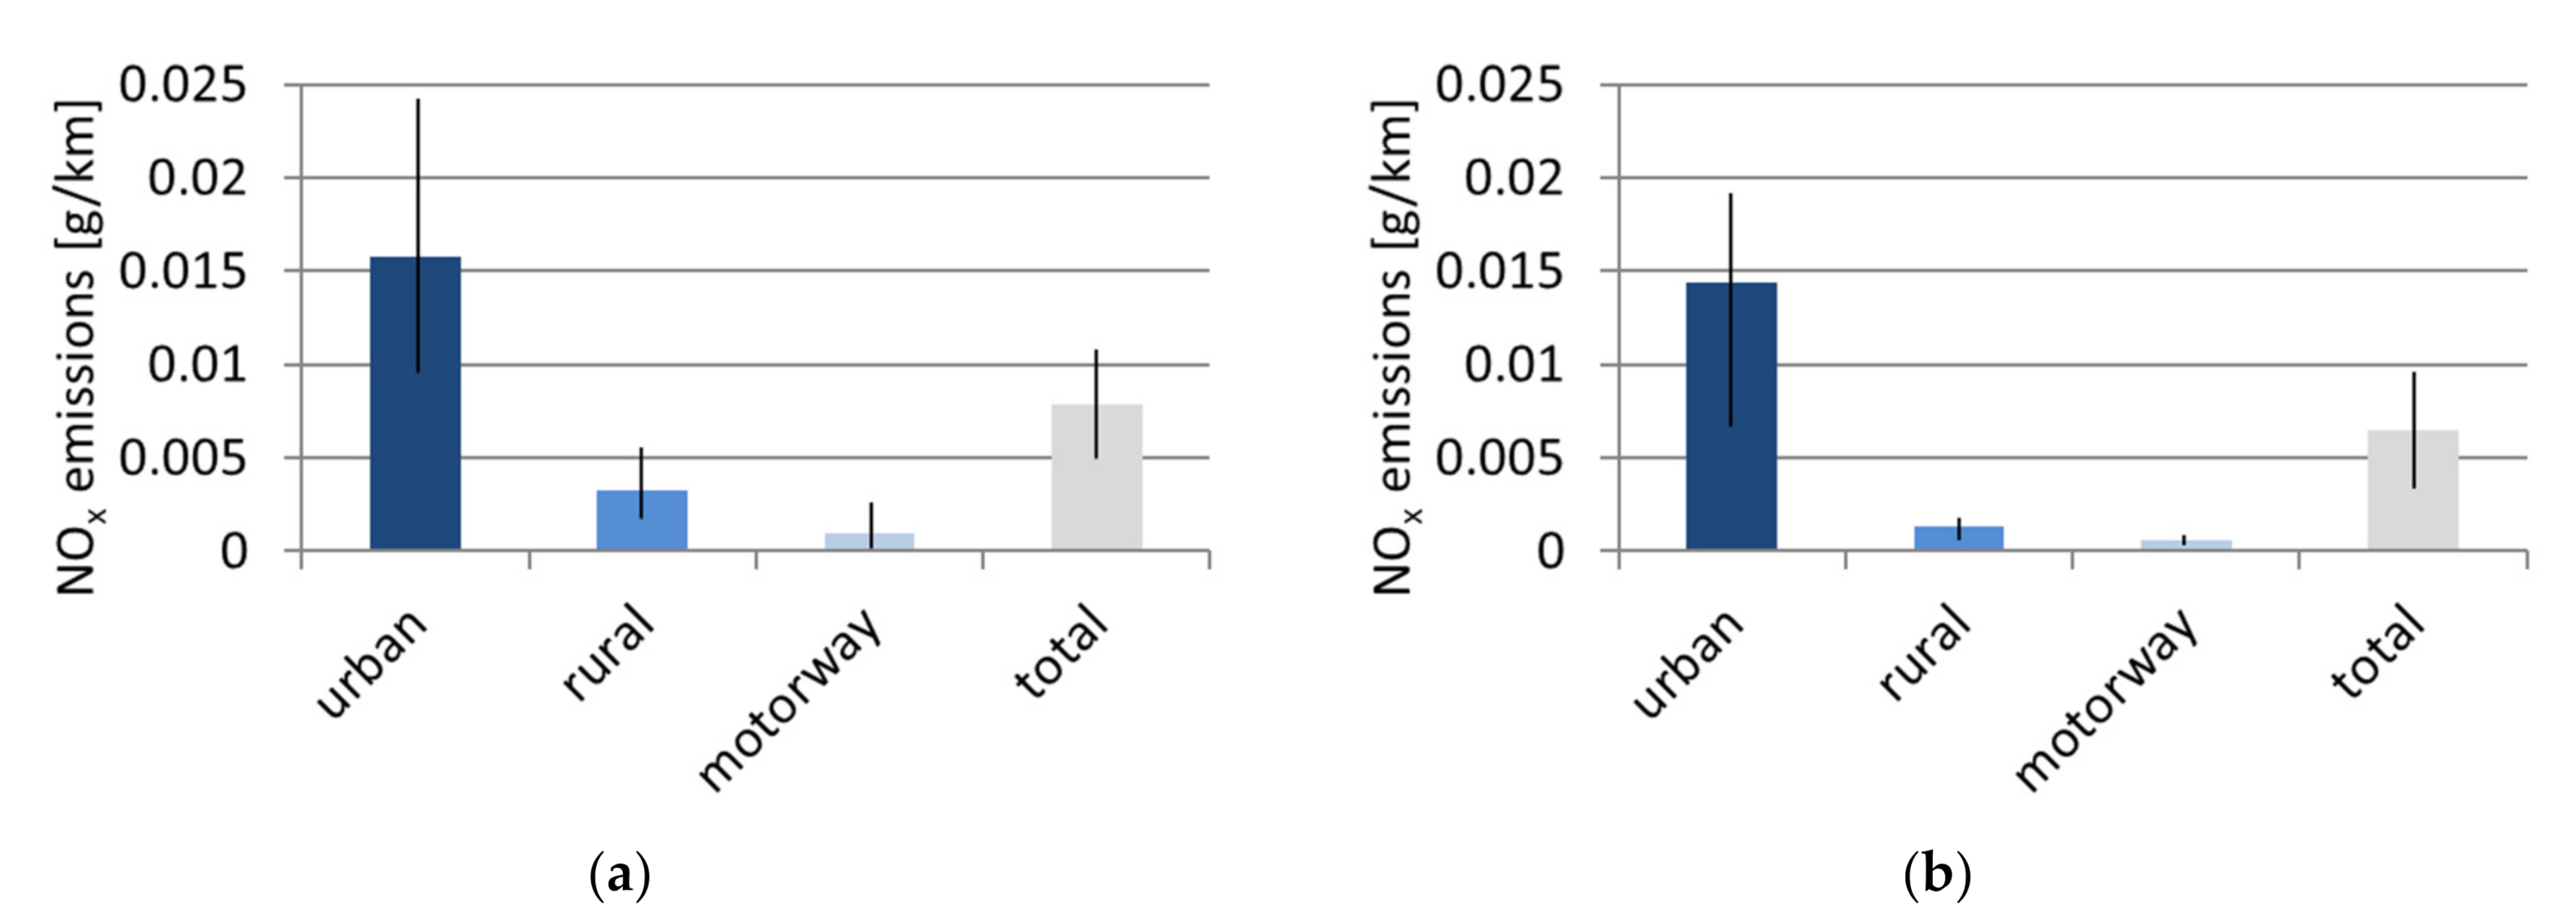
Figure 12 presents the average, distance-related real-world NOx emissions of the studied PHEV for hybrid mode driving in summer (Figure 12a) and in autumn (Figure 12b).
The average NOx emission factor for the total Stuttgart test route is 6.5 mg/km considering the autumn tests, which is about 18% less compared to the summer tests. The variance of the total emissions is very similar between summer and autumn tests. In comparison with the summer test results, NOx emissions during rural and motorway driving are on an even lower, near zero-level in the autumn tests and thus can be neglected. The average urban NOx emission factor of the autumn tests is approx. 14 mg/km, which is 9% lower than for the summer tests. The variance of the test results for urban driving is also similar to the respective bandwidth of the summer test results, ranging from 7 mg/km to 19 mg/km (Figure 12b). As the NOx emissions of the summer tests are generally higher than within the autumn tests considering all vehicle speed classes, the authors conclude that the lower ambient temperatures do not influence NOx emissions in this study. As already discussed regarding the PN emissions, the ambient temperature differences between the summer and autumn tests are small and can be neglected. In contrast, the driving mode seems to be the main influencing factor, as especially for urban vehicle speeds the hybrid driving mode raises the NOx emissions. Similar to PN emissions, the urban NOx emissions are mainly determined by the emission peaks resulting from the activation of the ICE during low TWC temperature situations (Figure 3). Besides the generally higher values of these cold start peak NOx emissions, the greater variances of the urban emissions within the hybrid driving mode tests and sport driving mode tests also prove that the uncertainty regarding the height of these peak emissions increase for hybrid driving.

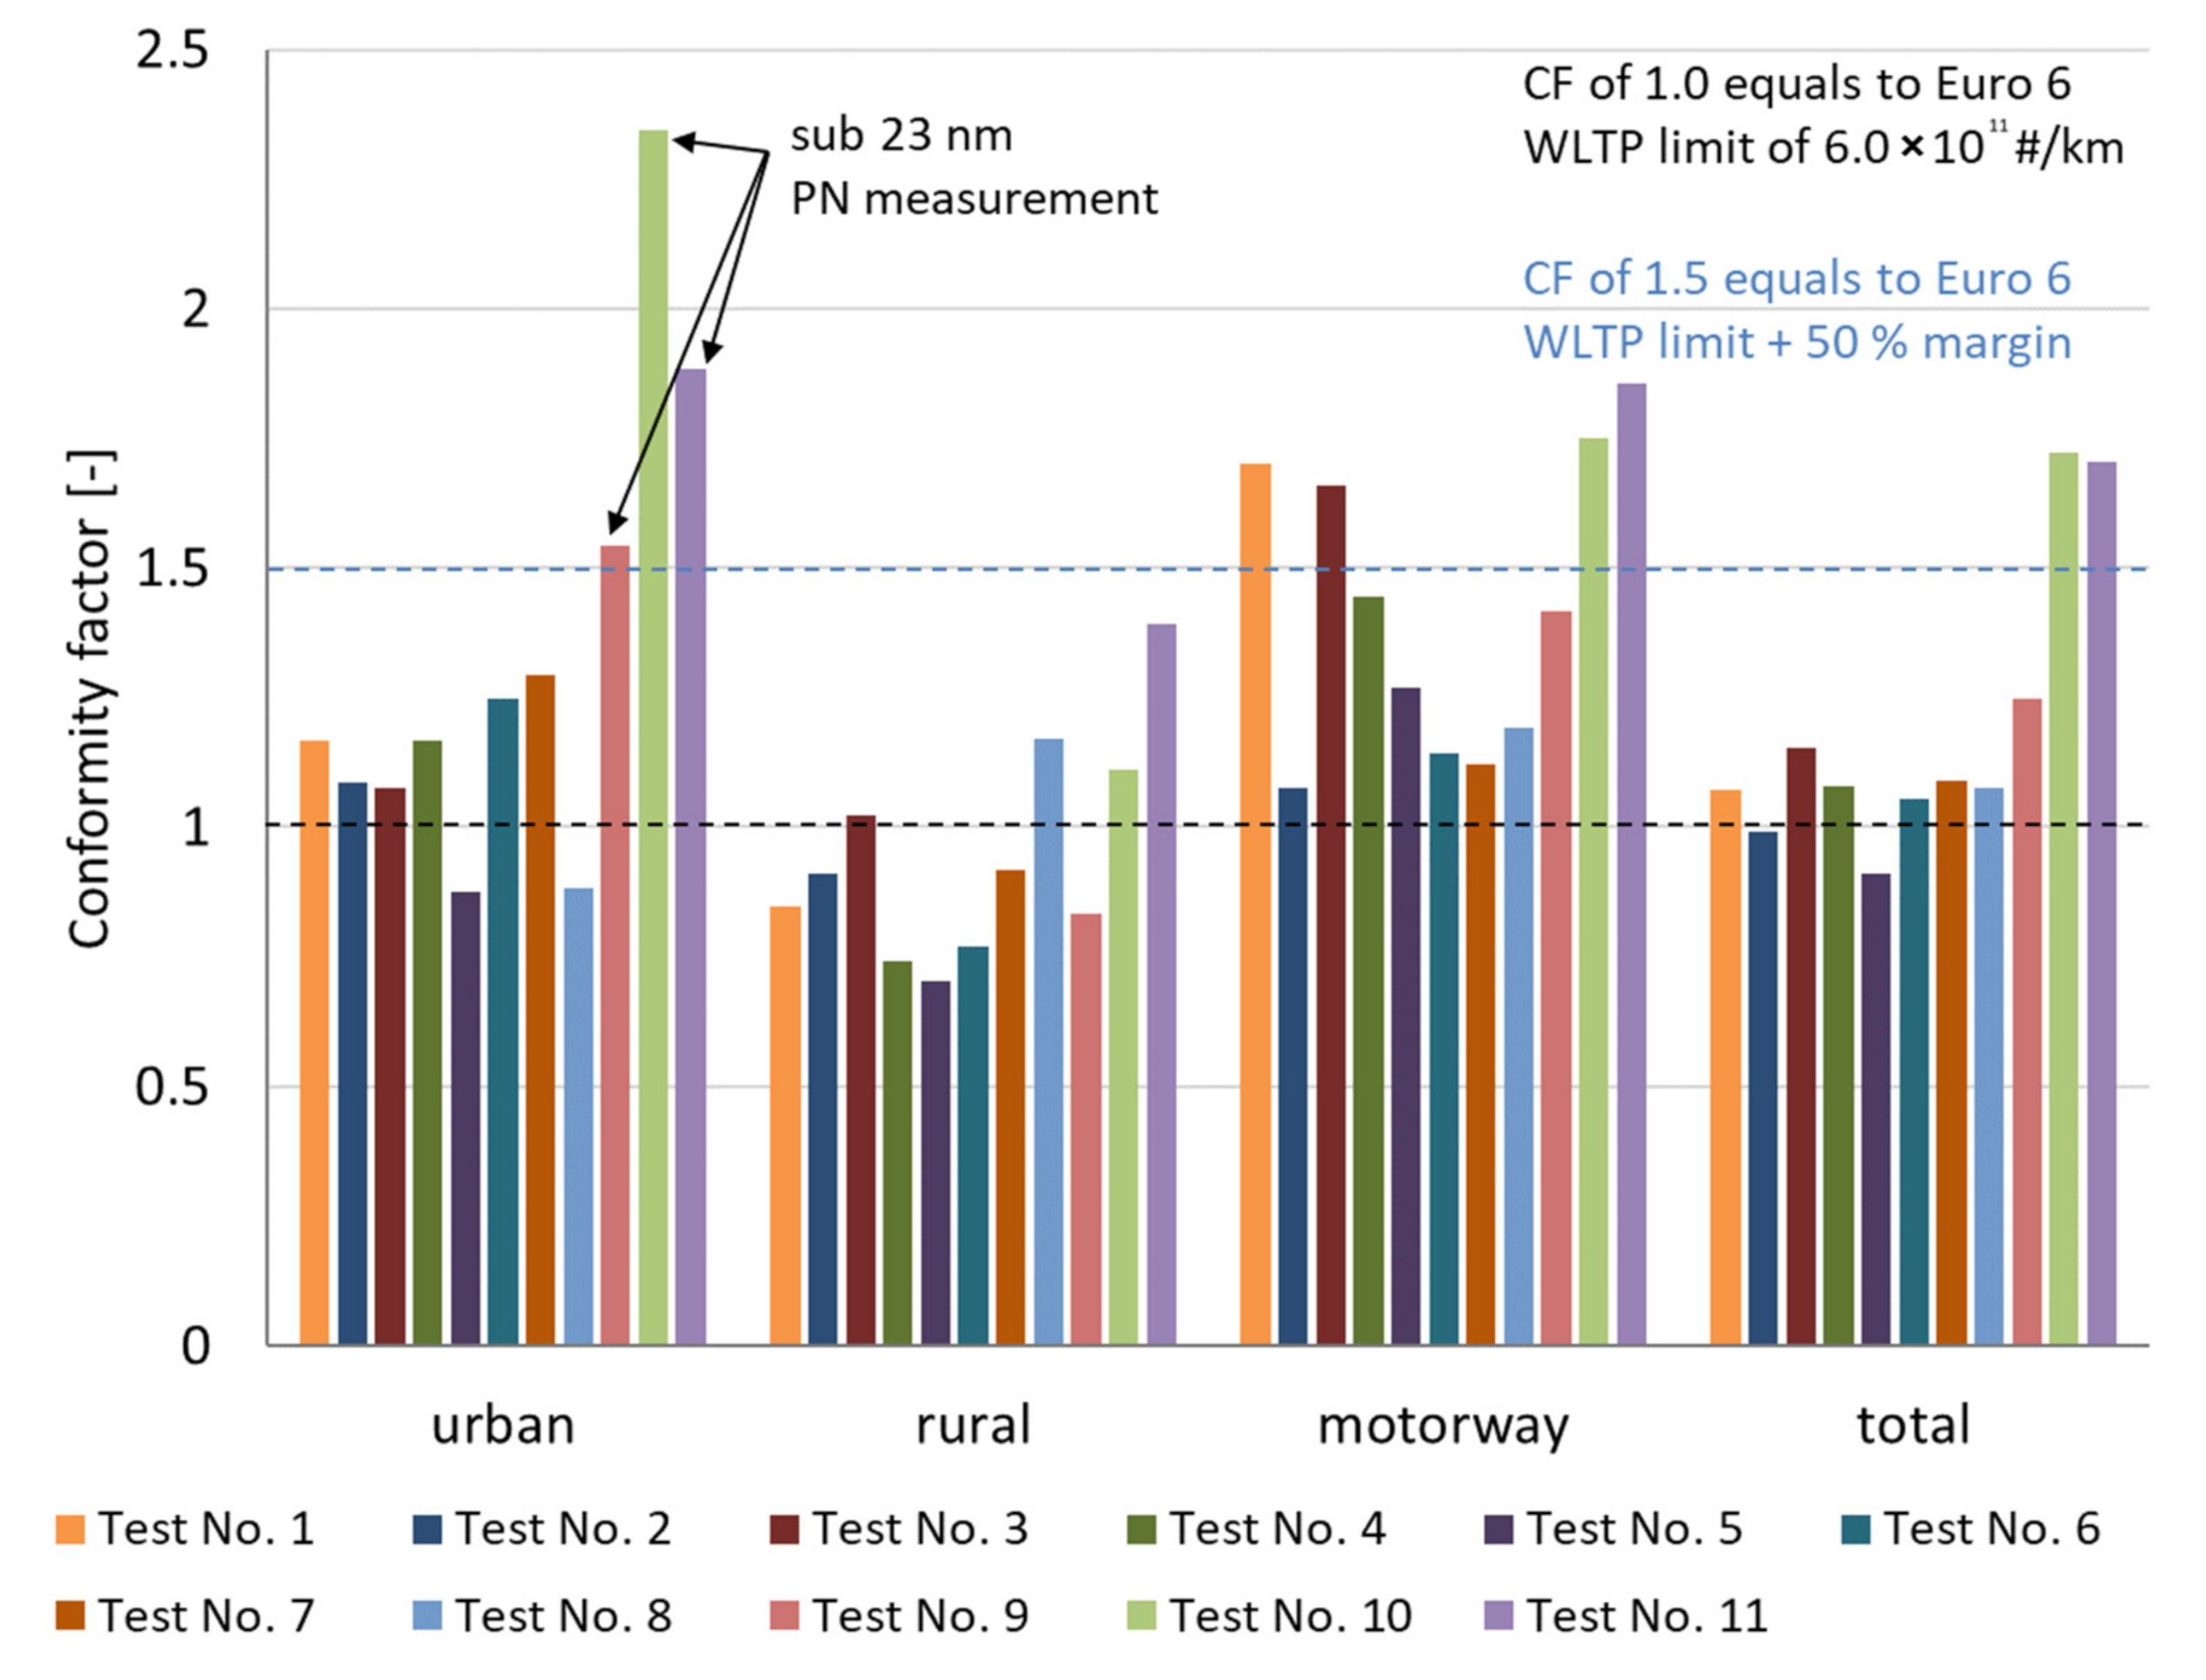
3.5. Conformity Factors

The conformity factor (CF) of 1.0 represents the Euro 6 legal emission limit for vehicle type approval and first registration, which is 6.0 × 10¹¹ #/km for PN emissions and 60 mg/km for NOx emissions regarding vehicles with SI engines. As these values shall apply for laboratory conditions, respectively, the WLTP margins for PN and NOx are introduced to consider the measurement uncertainties of the PEMS for (mobile) RDE tests. Indeed, this study does not evaluate valid RDE tests, but a real-world driving scenario. However, it must be noted that most of the RDE trip requirements are fulfilled by the Stuttgart test route (Table 1).
For PN, the current margin value is 50%, which equals a CF of 1.5 or 9.0 × 10¹¹ #/km [22]. For NOx, the PEMS measurement uncertainty is recently quantified by a margin of 43% [23], corresponding to a CF of 1.43 or approx. 86 mg/km.
Figure 13 presents the CFs for the PN emissions of each performed real-world driving test with the PHEV under investigation, taking also the different driving situations (urban, rural, motorway vehicle speeds) into account.
For the total real-world driving test route, the tests no. 10 and 11 exceed the CF of 1.5 (both tests show CFs of approx. 1.7), while the other tests show CFs between 0.9 and 1.2, partially even achieving the laboratory limit value. It must be noted that the tests no. 9–11 represent sub-23 nm PN emission measurements, and that the current Euro 6 legislation including the RDE margins only consider PN emissions up to 23 nm, but not below. Additionally, as the investigated PHEV is not equipped with a GPF, the UFP fraction might increase significantly. This is furthermore indicated by the sharp increase in PN emissions for urban vehicle speeds considering these tests (CFs between 1.5 and 2.3), which could indicate a significant UFP share in cold start emissions. In the first 8 tests, the urban PN emissions are within the not-to-exceed limit of 1.5. For rural driving conditions, all tests reveal CFs below 1.5 and the majority is even below the laboratory limit value. For the tests no. 1, 3, 10 and 11 the CFs for motorway driving exceed the limit of 1.5. On the one hand, this again highlights that the hybrid driving mode can increase PN emissions significantly at motorway vehicle speeds (Section 3.2). On the other hand, considering tests no. 1 and 3, it shows that this increase is not immediately related to the UFP fraction.
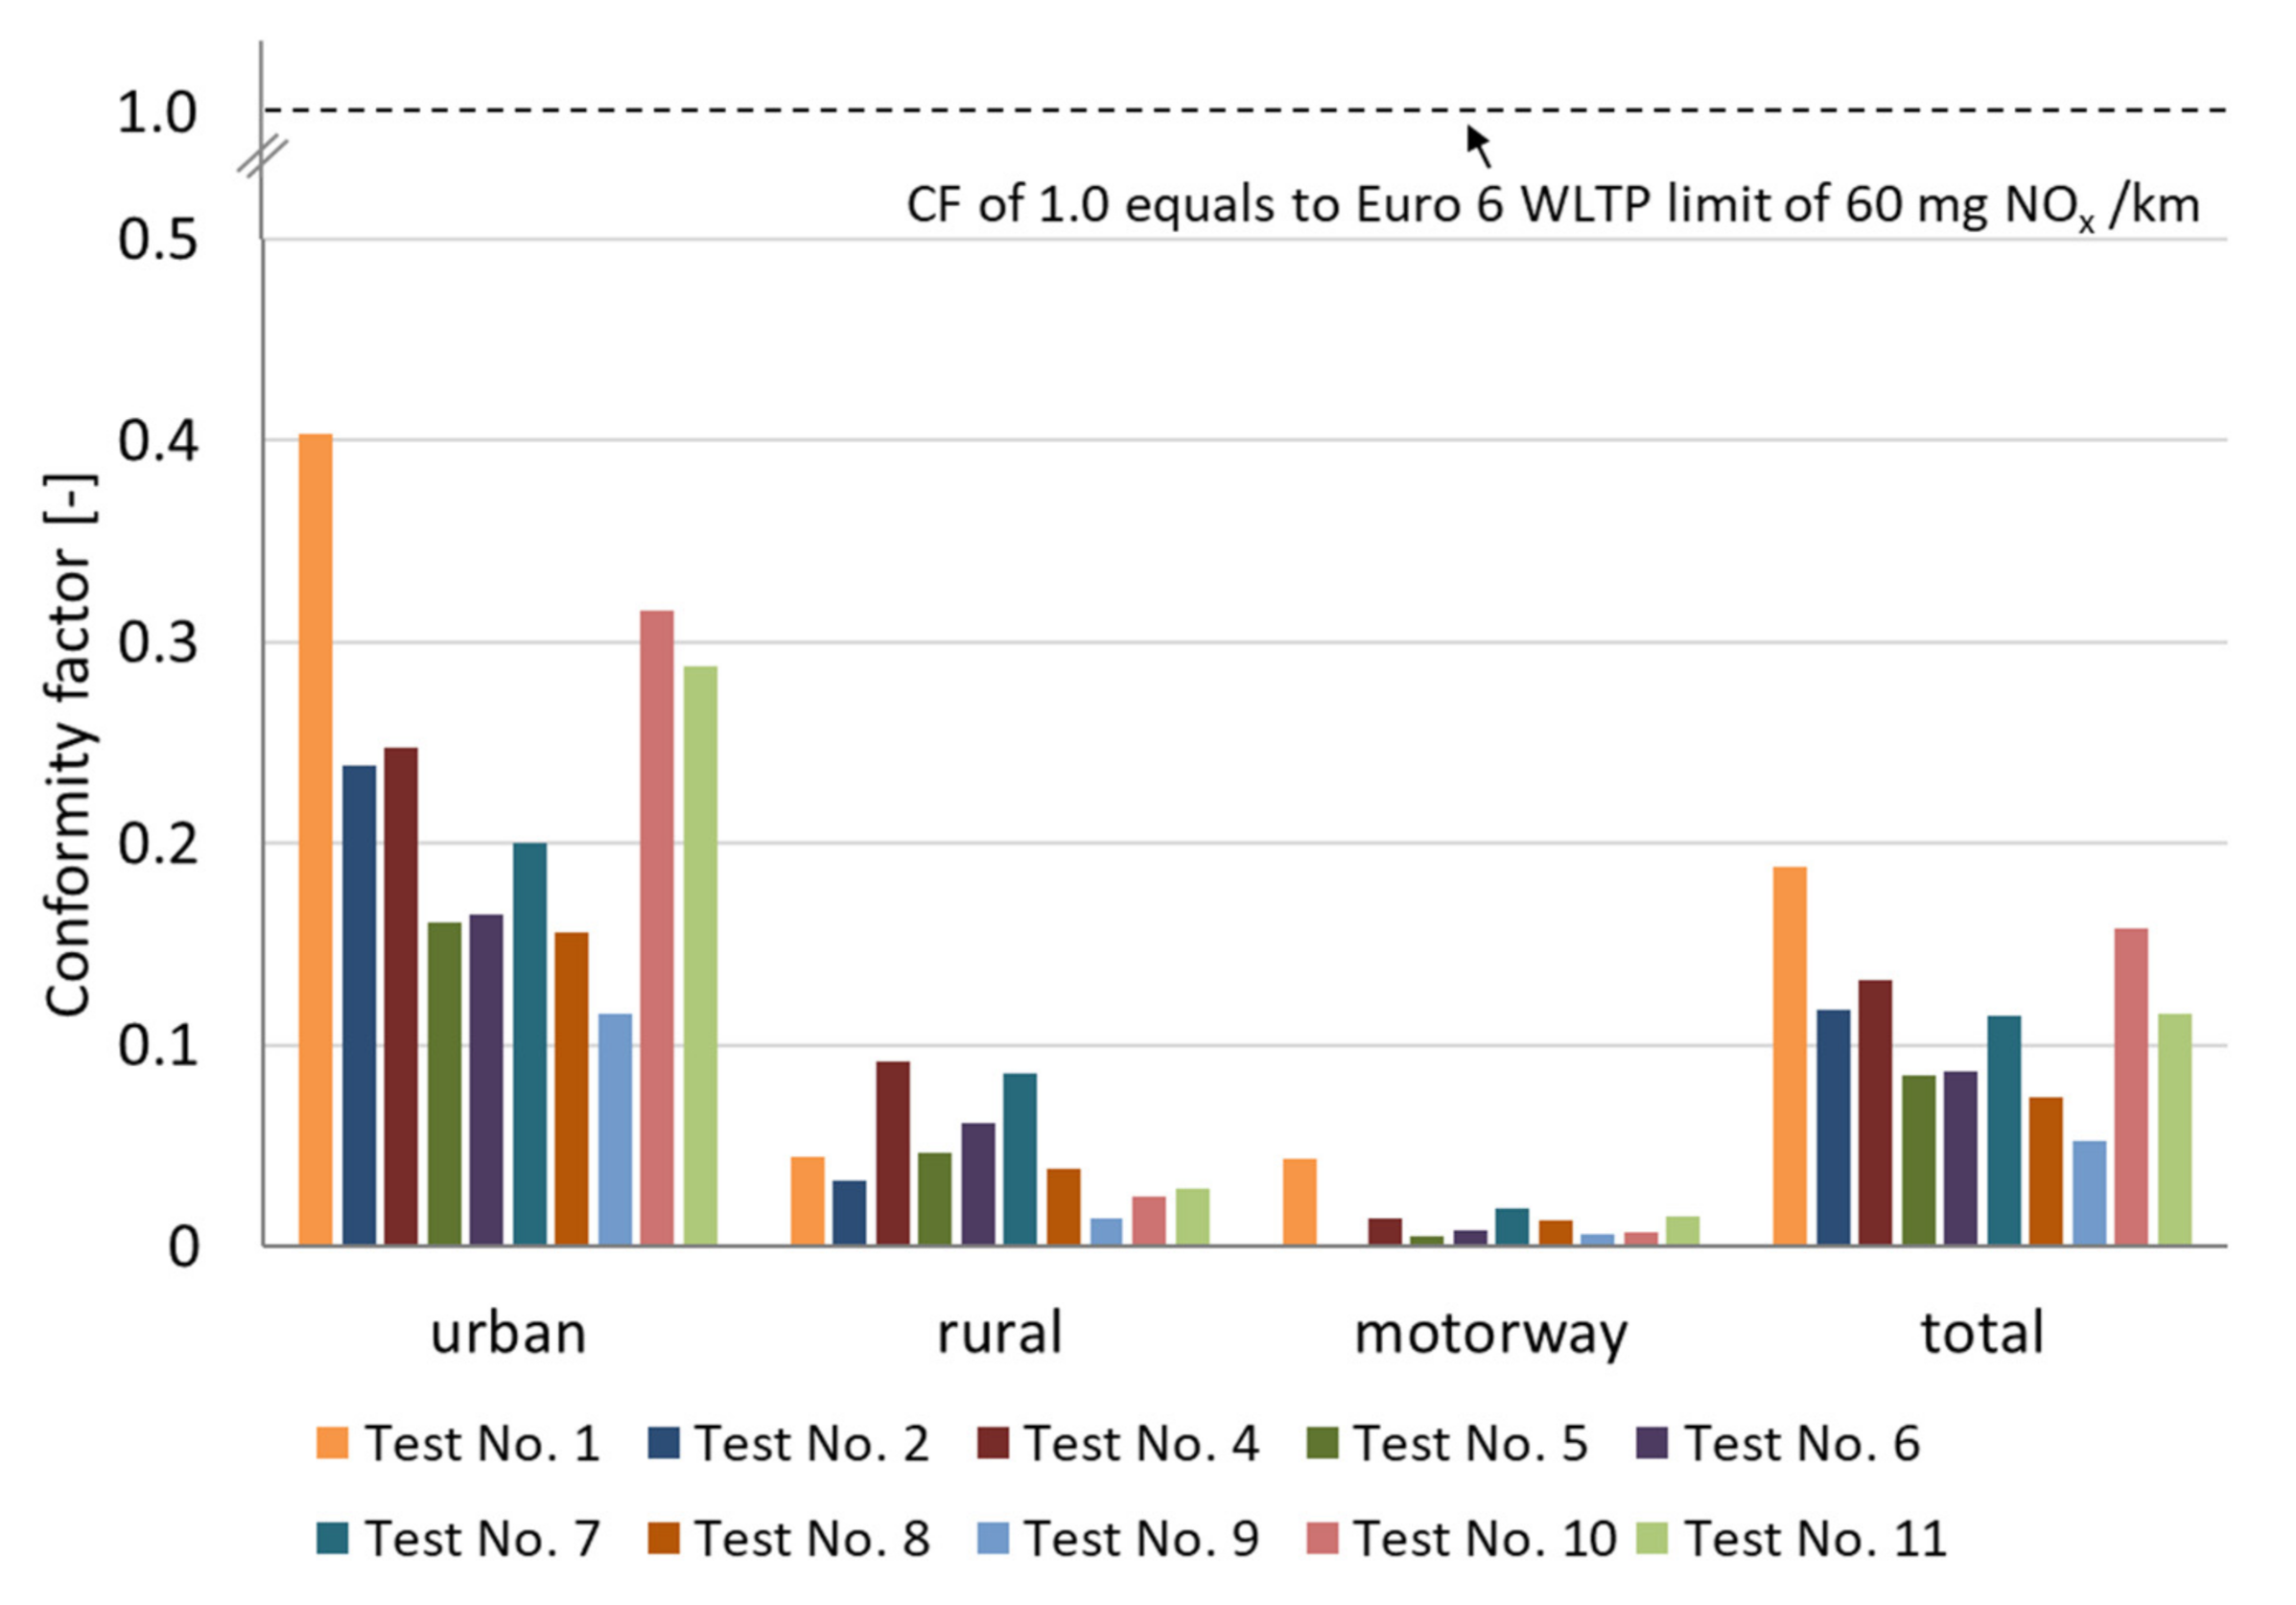
Figure 14 gives an overview of the NOx CFs of each performed real-world driving test with the PHEV under investigation for the different vehicle speed categories.
Even though the current NOx CF for RDE tests is set to 1.43, the y-axis in Figure 14 only ranges to CF 1.0, as in all performed real-world driving tests, the NOx CFs are below 0.4. Regarding the total test route, the NOx emissions are at least 5-times lower than the laboratory limit value. Section 3.4 shows that the main part of NOx emissions is related to the initial emission peak from the first activation of the ICE, which is also indicated by the relatively high urban CFs (Figure 14). In comparison, the CFs for rural and motorway driving are below 0.1, partly on a near-zero level. Even if high relative differences are observed within the NOx CFs, compared to the Euro 6 and the not-to-exceed limits, the NOx emissions are generally on a low absolute level, considering all tests and driving situations.

4. Conclusions

A Euro 6 PHEV is investigated on PN and NOx emissions in multiple test drives with variations in ambient conditions and driving mode on a defined real-world driving test route in the city of Stuttgart. Within each test series, the average fuel consumption and emission factors per driving situation show a good level of reproducibility. This observation is of high relevance since the user’s charge and driving behavior may impact the operation frequency of the combustion engine and, thus, the emission from the vehicle. Therefore, an analysis based on these quantities is reasonable in order to identify the main causes of emission formation for the different PHEV test conditions.
Across all performed tests the real-world NOx emissions of the PHEV are mainly shaped by the cold start emission peak from the first activation of the ICE. The trip-average NOx emission factors are on a negligible level though.
With regard to the particle emissions during a specific test run, the phases of non-constant ICE operation and higher electric driving shares might cause a higher release of UFP due to the reoccurring start phases of the ICE. This was not observed in the present case. Neither the initial peak particle number concentration at the different start phases of the combustion engine nor the particle size distributions show significant deviations to the ICE-dominant operation phases. Therefore, the intermediate shut-down of the combustion engine during the urban part of the trip is a gain with regard to the release of particles into the nearby environment. Since the combustion engine operation phases mainly occur during motorway drives (high power required), the use of PHEVs can reduce the impact of road transport on the local air quality in cities.
However, hybrid mode driving in motorway situations seems to be critical, as the average PN emissions can be higher than driving more ICE-dominant, exceeding the current Euro 6 CFs in some cases. This highlights the complexity of an ecological assessment of PHEVs as higher electric driving shares and lower fuel consumptions do not necessarily lead to decreasing all pollutant emissions. Furthermore, the UFP share can contribute to a 50% increase in cold start PN emissions, also not meeting the current Euro 6 not-to-exceed limits for the urban test parts. This finding needs to be confirmed by other studies, as there are remaining uncertainties regarding the PEMS CPC measurement precision. Further studies with real-world driving tests of modern GPF equipped PHEVs are required to prove if the particle filter efficiently reduces the particle release in the highlighted (motorway and cold start) driving situations. Moreover, future studies should further focus on measuring PN emissions of PHEVs especially including UFP measurements in a wider range of ambient temperatures and real-world driving situations outside of the current RDE legislation.

Author Contributions

Conceptualization, M.F., S.E. and T.S.; formal analysis, M.F. and T.S.; investigation, F.E. and T.G.; writing—original draft preparation, M.F., S.E. and T.S. All authors have read and agreed to the published version of the manuscript.

Funding

This research received no third-party funding.

Institutional Review Board Statement

Not applicable.

Informed Consent Statement

Not applicable.

Data Availability Statement

All data are summarized in the tables.

Acknowledgments

The project “UrMo Digital” was financed via the DLR transport research program. The APC was funded by the DLR publication fund. Furthermore, the authors acknowledge Stephan Schmid and Murat Senzeybek for giving their valuable comments regarding the draft manuscript.

Conflicts of Interest

The authors declare no conflict of interest.

References

  1. Khalfan, A.; Andrews, G.; Li, H. Real World Driving: Emissions in Highly Congested Traffic. In Proceedings of the SAE Technical Paper Series. International Powertrains, Fuels & Lubricants Meeting, 16 October 2017; SAE International400 Commonwealth Drive: Warrendale, PA, USA, 2017. [Google Scholar]
  2. Suarez-Bertoa, R.; Valverde, V.; Pavlovic, J.; Clairotte, M.; Selleri, T.; Franco, V.; Kregar, Z.; Astorga, C. On-road emissions of Euro 6d-TEMP passenger cars on Alpine routes during the winter period. Environ. Sci. Atmos. 2021, 1, 125–139. [Google Scholar] [CrossRef]
  3. Wang, Y.; Feng, X.; Zhao, H.; Hao, C.; Hao, L.; Tan, J.; Wang, X.; Yin, H.; Wang, J.; Ge, Y.; et al. Experimental study of CO2 and pollutant emission at various altitudes: Inconsistent results and reason analysis. Fuel 2022, 307, 121801. [Google Scholar] [CrossRef]
  4. Yang, Z.; Liu, Y.; Wu, L.; Martinet, S.; Zhang, Y.; Andre, M.; Mao, H. Real-world gaseous emission characteristics of Euro 6b light-duty gasoline- and diesel-fueled vehicles. Transp. Res. Part D Transp. Environ. 2020, 78, 102215. [Google Scholar] [CrossRef]
  5. Valverde, V.; Mora, B.; Clairotte, M.; Pavlovic, J.; Suarez-Bertoa, R.; Giechaskiel, B.; Astorga-LLorens, C.; Fontaras, G. Emission Factors Derived from 13 Euro 6b Light-Duty Vehicles Based on Laboratory and On-Road Measurements. Atmosphere 2019, 10, 243. [Google Scholar] [CrossRef] [Green Version]
  6. Lijewski, P.; Kozak, M.; Fuć, P.; Rymaniak, Ł.; Ziółkowski, A. Exhaust emissions generated under actual operating conditions from a hybrid vehicle and an electric one fitted with a range extender. Transp. Res. Part D Transp. Environ. 2020, 78, 102183. [Google Scholar] [CrossRef]
  7. Prati, M.V.; Costagliola, M.A.; Giuzio, R.; Corsetti, C.; Beatrice, C. Emissions and energy consumption of a plug-in hybrid passenger car in Real Driving Emission (RDE) test. Transp. Eng. 2021, 4, 100069. [Google Scholar] [CrossRef]
  8. Suarez-Bertoa, R.; Valverde, V.; Clairotte, M.; Pavlovic, J.; Giechaskiel, B.; Franco, V.; Kregar, Z.; Astorga, C. On-road emissions of passenger cars beyond the boundary conditions of the real-driving emissions test. Environ. Res. 2019, 176, 108572. [Google Scholar] [CrossRef] [PubMed]
  9. Giechaskiel, B.; Lähde, T.; Drossinos, Y. Regulating particle number measurements from the tailpipe of light-duty vehicles: The next step? Environ. Res. 2019, 172, 1–9. [Google Scholar] [CrossRef] [PubMed]
  10. Giechaskiel, B.; Lähde, T.; Gandi, S.; Keller, S.; Kreutziger, P.; Mamakos, A. Assessment of 10-nm Particle Number (PN) Portable Emissions Measurement Systems (PEMS) for Future Regulations. Int. J. Environ. Res. Public Health 2020, 17, 3878. [Google Scholar] [CrossRef] [PubMed]
  11. Melas, A.D.; Koidi, V.; Deloglou, D.; Daskalos, E.; Zarvalis, D.; Papaioannou, E.; Konstandopoulos, A.G. Development and evaluation of a catalytic stripper for the measurement of solid ultrafine particle emissions from internal combustion engines. Aerosol Sci. Technol. 2020, 54, 704–717. [Google Scholar] [CrossRef]
  12. Li, T.; Chen, X.; Yan, Z. Comparison of fine particles emissions of light-duty gasoline vehicles from chassis dynamometer tests and on-road measurements. Atmos. Environ. 2013, 68, 82–91. [Google Scholar] [CrossRef]
  13. Joshi, A. Review of Vehicle Engine Efficiency and Emissions. In Proceedings of the SAE Technical Paper Series. SAE WCX Digital Summit, 13 April 2021; SAE International400 Commonwealth Drive: Warrendale, PA, USA, 2021. [Google Scholar]
  14. Stuttgart, L.; Für Umweltschutz, A.; Stadtklimatologie, A. Current and Past Exceedances of NO2 and PM10 at Stuttgart Monitoring Stations. Available online: https://www.stadtklima-stuttgart.de/index.php?luft_messdaten_ueberschreitungen (accessed on 25 January 2022).
  15. Landmann, J.; Schwarzmann, R.; Thomas, A. Dem Stau auf der Spur: Maßnahmen Gegen den Stau in Stuttgart, Stand Mai 2017; Industrie- und Handelskammer, Region Stuttgart: Stuttgart, Germany, 2017. [Google Scholar]
  16. Coryton Advanced Fuels Ltd. Certificate of Analysis: Fuel Batch No: CAF-W19/4114, Fuel Description: CEC RF-02-08 E5; Coryton Advanced Fuels Ltd.: Essex, UK, 2019. [Google Scholar]
  17. Giechaskiel, B. Real Driving Emissions (RDE): Particle Number (PN) Portable Measurement Systems (PEMS) Calibration, EUR 29036 EN; Publications Office of the European Union: Luxembourg, 2018; ISBN 978-92-79-77482-9. [Google Scholar] [CrossRef]
  18. Braess, H.H.; Seiffert, U. Vieweg Handbuch Kraftfahrzeugtechnik, 7th ed.; Springer Vieweg: Wiesbaden, Germany, 2013; ISBN 978-3-658-01690-6. [Google Scholar]
  19. Suarez-Bertoa, R.; Lähde, T.; Pavlovic, J.; Valverde, V.; Clairotte, M.; Giechaskiel, B. Laboratory and On-Road Evaluation of a GPF-Equipped Gasoline Vehicle. Catalysts 2019, 9, 678. [Google Scholar] [CrossRef] [Green Version]
  20. Ehrenberger, S.I.; Konrad, M.; Philipps, F. Pollutant emissions analysis of three plug-in hybrid electric vehicles using different modes of operation and driving conditions. Atmos. Environ. 2020, 234, 117612. [Google Scholar] [CrossRef]
  21. Gilham, R.J.; Quincey, P.G. Measurement and mitigation of response discontinuities of a widely used condensation particle counter. J. Aerosol Sci. 2009, 40, 633–637. [Google Scholar] [CrossRef]
  22. Clairotte, M.; Valverde, V.; Bonnel, P.; Gruening, C.; Pavlovic, J.; Manara, D. Joint Research Centre 2019 Light-Duty Vehicles Emissions Testing: Contribution to the EU Market Surveillance: Testing Protocols and Vehicle Emissions Performance; JRC Science for Policy Report JRC122035: Luxembourg, 2020. [Google Scholar]
  23. Giechaskiel, B.; Clairotte, M.; Valverde-Morales, V.; Bonnel, P.; Kregar, Z.; Franco, V.; Dilara, P. Framework for the assessment of PEMS (Portable Emissions Measurement Systems) uncertainty. Environ. Res. 2018, 166, 251–260. [Google Scholar] [CrossRef] [PubMed]
Figure 1. Overview of the selected real-world driving test route in the Stuttgart metropolitan area (and an exemplary vehicle speed profile).
Applsci 12 01404 g001
Figure 2. Schematic overview of the measurement arrangement.
Applsci 12 01404 g002
Figure 3. Overview of the main measured values for an exemplary real-world test drive in the Stuttgart metropolitan area.
Applsci 12 01404 g003
Figure 4. Influence of driving mode on the real-world fuel consumption of the studied plug-in hybrid electric vehicle (PHEV) during summer time. (a) Hybrid driving mode; (b) Sport driving mode.
Applsci 12 01404 g004
Figure 5. Seasonal influence on the real-world fuel consumption of the studied PHEV considering hybrid driving mode. (a) Summer time; (b) autumn time.
Applsci 12 01404 g005
Figure 6. Influence of driving mode on the real-world particulate number (PN) emissions of the studied PHEV during summer time. (a) Hybrid driving mode; (b) Sport driving mode.
Applsci 12 01404 g006
Figure 7. Comparison of the cumulative PN emissions and the fuel consumption differentials of a test in the hybrid driving mode (a) and a test in the sport driving mode (b). Both tests are performed during summer time.
Applsci 12 01404 g007
Figure 8. Influence of season and sub-23 nm particle measurement on the real-world PN emissions of the studied PHEV considering hybrid driving mode. (a) Summer time; (b) autumn time, including ultrafine particle (UFP) measurement.
Applsci 12 01404 g008
Figure 9. Development of the particle size distribution during real-drive test no. 1 (EEPS). The concentration is given in #/cm3 and in a log-scale.
Applsci 12 01404 g009
Figure 10. Correlation between the particle counter of the portable emissions measurement system (PEMS) and the engine exhaust particle sizer (EEPS) with a similar cut-off diameter of 23 nm.
Applsci 12 01404 g010
Figure 11. Influence of driving mode on the real-world nitrogen oxides (NOx) emissions of the studied PHEV during summer time. (a) Hybrid driving mode; (b) Sport driving mode.
Applsci 12 01404 g011
Figure 12. Seasonal influence of driving mode on the real-world NOx emissions of the studied PHEV considering hybrid driving mode. (a) Summer time; (b) autumn time.
Applsci 12 01404 g012
Figure 13. Conformity factors (CFs) for PN emissions of the performed real-world driving tests with the studied PHEV.
Applsci 12 01404 g013
Figure 14. CFs for NOx emissions of the performed real-world driving tests with the studied PHEV.
Applsci 12 01404 g014
Table 1. Comparison of the Stuttgart test route characteristics and the real driving emissions (RDE) trip requirements.
RDE Trip RequirementsStuttgart Test Route
Urban driving distance≥16 km20.2–27.3 km
Rural driving distance≥16 km19.1–29.9 km
Motorway driving distance≥16 km2.7–17.5 km
Urban distance share29–44%35–46%
Rural distance share23–44%34–53%
Motorway distance share23–44%5–30%
Total trip duration90–120 min69–87 min
Average vehicle speed-30.3–50.7 km/h
Cumulative positive elevation gain, total<1200 m/100 km1100 m/100 km
Cumulative positive elevation gain, urban<1200 m/100 km1600 m/100 km
Table 2. Overview of the relevant measuring systems and measurement parameters.
Measuring SystemMeasurement ParameterUnit
PEMS/EEPSParticle concentration#/cm3
EFMExhaust mass flowg/s
Exhaust volume flowcm3/s
NOx analyzerNOx concentrationppm
Fuel mass flow sensorFuel consumptionL/h
Vehicle internal OBDEngine speedmin−1
Vehicle speedkm/h
Table 3. Summary of the performed test series.
Ambient TemperatureDriving ModeNumber of TestsTiresRemarks
24–29 °CHybrid5SummerSmall deviations due to roadworks
19–29 °CSport3Summer
10–14 °CHybrid3WinterSub-23 nm PN PEMS measurement included
Table 4. Overview of the PHEVs electric diving shares in the real-world driving tests.
Test No.Driving ModeElectric Driving
Share, Urban [%]
Electric Driving
Share, Rural [%]
Electric Driving
Share, Motorway [%]
Electric Driving
Share, Total [%]
1Hybrid7232357
2Hybrid71353759
3Hybrid69381455
4Hybrid6954858
5Hybrid7739764
6Sport63110.444
7Sport60211347
8Sport6412044
9Hybrid6642654
10Hybrid71192760
11Hybrid64341650
Publisher’s Note: MDPI stays neutral with regard to jurisdictional claims in published maps and institutional affiliations.

