Article

Numerical Study of Near-Infrared Light Propagation in Aqueous Alumina Suspensions Using the Steady-State Radiative Transfer Equation and Dependent Scattering Theory

Division of Mechanical and Space Engineering, Faculty of Engineering, Hokkaido University, Kita 13 Nishi 8, Kita-ku, Sapporo 060-8628, Hokkaido, Japan
*
Author to whom correspondence should be addressed.
Appl. Sci. 2022, 12(3), 1190; https://doi.org/10.3390/app12031190
Submission received: 20 December 2021 / Revised: 2 January 2022 / Accepted: 21 January 2022 / Published: 24 January 2022
(This article belongs to the Special Issue Near-Infrared Optical Tomography)

Abstract

:
Understanding light propagation in liquid phantoms, such as colloidal suspensions, involves fundamental research of near-infrared optical imaging and spectroscopy for biological tissues. Our objective is to numerically investigate light propagation in the alumina colloidal suspensions with the mean alumina particle diameter of 55 nm at the volume fraction range 1–20%. We calculated the light scattering properties using the dependent scattering theory (DST) on a length scale comparable to the optical wavelength. We calculated the steady-state radiative transfer and photon diffusion equations (RTE and PDE) using the DST results based on the finite difference method in a length scale of the mean free path. The DST calculations showed that the scattering and reduced scattering coefficients become more prominent at a higher volume fraction. The anisotropy factor is almost zero at all the volume fractions, meaning the scattering is isotropic. The comparative study of the RTE with the PDE showed that the diffusion approximation holds at the internal region with all the volume fractions and the boundary region with the volume fraction higher than 1%. Our findings suggest the usefulness of the PDE as a light propagation model for the alumina suspensions rather than the RTE, which provides accurate but complicated computation.

1. Introduction

Near-infrared imaging and spectroscopy offer chemical components (e.g., hemoglobin concentration) and structural properties (e.g., cellular density) for biological tissues and agricultural products [1,2]. Among the techniques, near-infrared optical tomography (NIROT), conventionally called diffuse optical tomography, has the potential to image a deep region of tissue volumes [3,4], such as the brain in the human head and the trachea in the human neck. For the development of NIROT, elucidation of light propagation in a target medium is indispensable because NIROT employs a theoretical model to describe light propagation, and image qualities by NIROT depend on the accuracy of the light propagation model [5].
In the near-infrared wavelength range, the scattering process of light propagation is dominant over the absorption process. The radiative transfer theory (RTT) can describe light propagation in a target medium on a length scale of the mean free path between light and the medium. As the RTT, the radiative transfer equation (RTE) and photon diffusion equation (PDE) have been widely used. The RTE can accurately describe light propagation, but it requires complicated computation and high computational loads. The PDE, the diffusion approximation to the RTE, provides fast calculation with a simple numerical treatment but is invalid at several conditions, such as low-scattering medium [5]. A target medium is regarded as a scattering medium (continuous medium) with optical properties on the length scale. The optical properties (e.g., scattering and absorption coefficients) specify the strengths of light scattering and absorption. The optical properties have been evaluated by inverse analysis as parameters for biological tissues and agricultural products [6,7,8]. The inverse analysis optimizes a difference in light intensity between measured and calculated results using the RTT and incorporates multiple computations of light propagation. This fact suggests that an efficient model of light propagation is desirable in addition to accuracy. Because the validation of the results by inverse analysis is quite difficult for biological tissues and agricultural products, the validation test is necessary for tissue phantoms [9].
As liquid tissue phantoms, colloidal suspensions have been widely used. Colloidal particles correspond to scatterers, and the scattering properties vary with the volume fractions of the particles. The electromagnetic theory (EMT) can calculate the scattering properties for colloidal suspensions on a length scale comparable to the optical wavelength. As the EMT, the independent scattering theory (IST) and dependent scattering theory (DST) have been developed. The IST treats no interaction of the electric fields scattered by particles, while the DST treats the interference of the fields in the far-field [10,11]. The scattering properties using the IST agree well with those by the inverse analysis at a lower volume fraction than approximately 5%, while the results using the DST do at a high volume fraction up to approximately 20% [12,13,14]. For a dilute suspension (low volume fraction), it is easy to adjust values of the scattering properties because of the linear dependence of the scattering properties on the volume fraction. Meanwhile, the adjustment is difficult for a dense suspension (high volume fraction) due to a complicated dependence of the scattering properties on the volume fraction. Hence, clarifying the complicated dependence is significant as fundamental research of optical imaging techniques. Many researchers have examined the scattering properties for dense suspensions by the DST [10,13,14,15,16,17,18,19]. Meanwhile, research for the dependence of light propagation on the volume fraction has been less reported to the best of our knowledge. In the research field of microwave remote sensing, Tsang and co-workers have examined radiative transfer for snow layers using the RTE combined with the DST (RTE-DST) [11]. Recently, some authors have examined the near-infrared light propagation by the RTE-DST for dense colloidal suspensions based on the analytical solutions of the time-dependent RTE [19]. However, the dependence of light propagation on the volume fraction has not been fully clarified. In particular, a range of the volume fraction where the diffusion approximation holds, is unclear, although the length and time scales for the diffusion approximation have been extensively discussed [1,20,21,22]. Because the volume fraction is a control parameter for phantom experiments, the information of the volume fraction range is helpful.
In this study, we numerically calculated the steady-state RTE-DST for aqueous alumina suspensions, widely used as a liquid phantom [9], at different volume fractions up to 20%. The numerical schemes for the RTE-DST have been little discussed in previous researches. We investigated the volume fraction range where the diffusion approximation holds by comparing numerical results using the PDE combined with the DST (PDE-DST). The RTE-DST employs the scattering coefficient and phase function calculated from the DST, while the PDE-DST does the reduced scattering coefficient only.

2. Theoretical Models of Light Propagation and Light Scattering

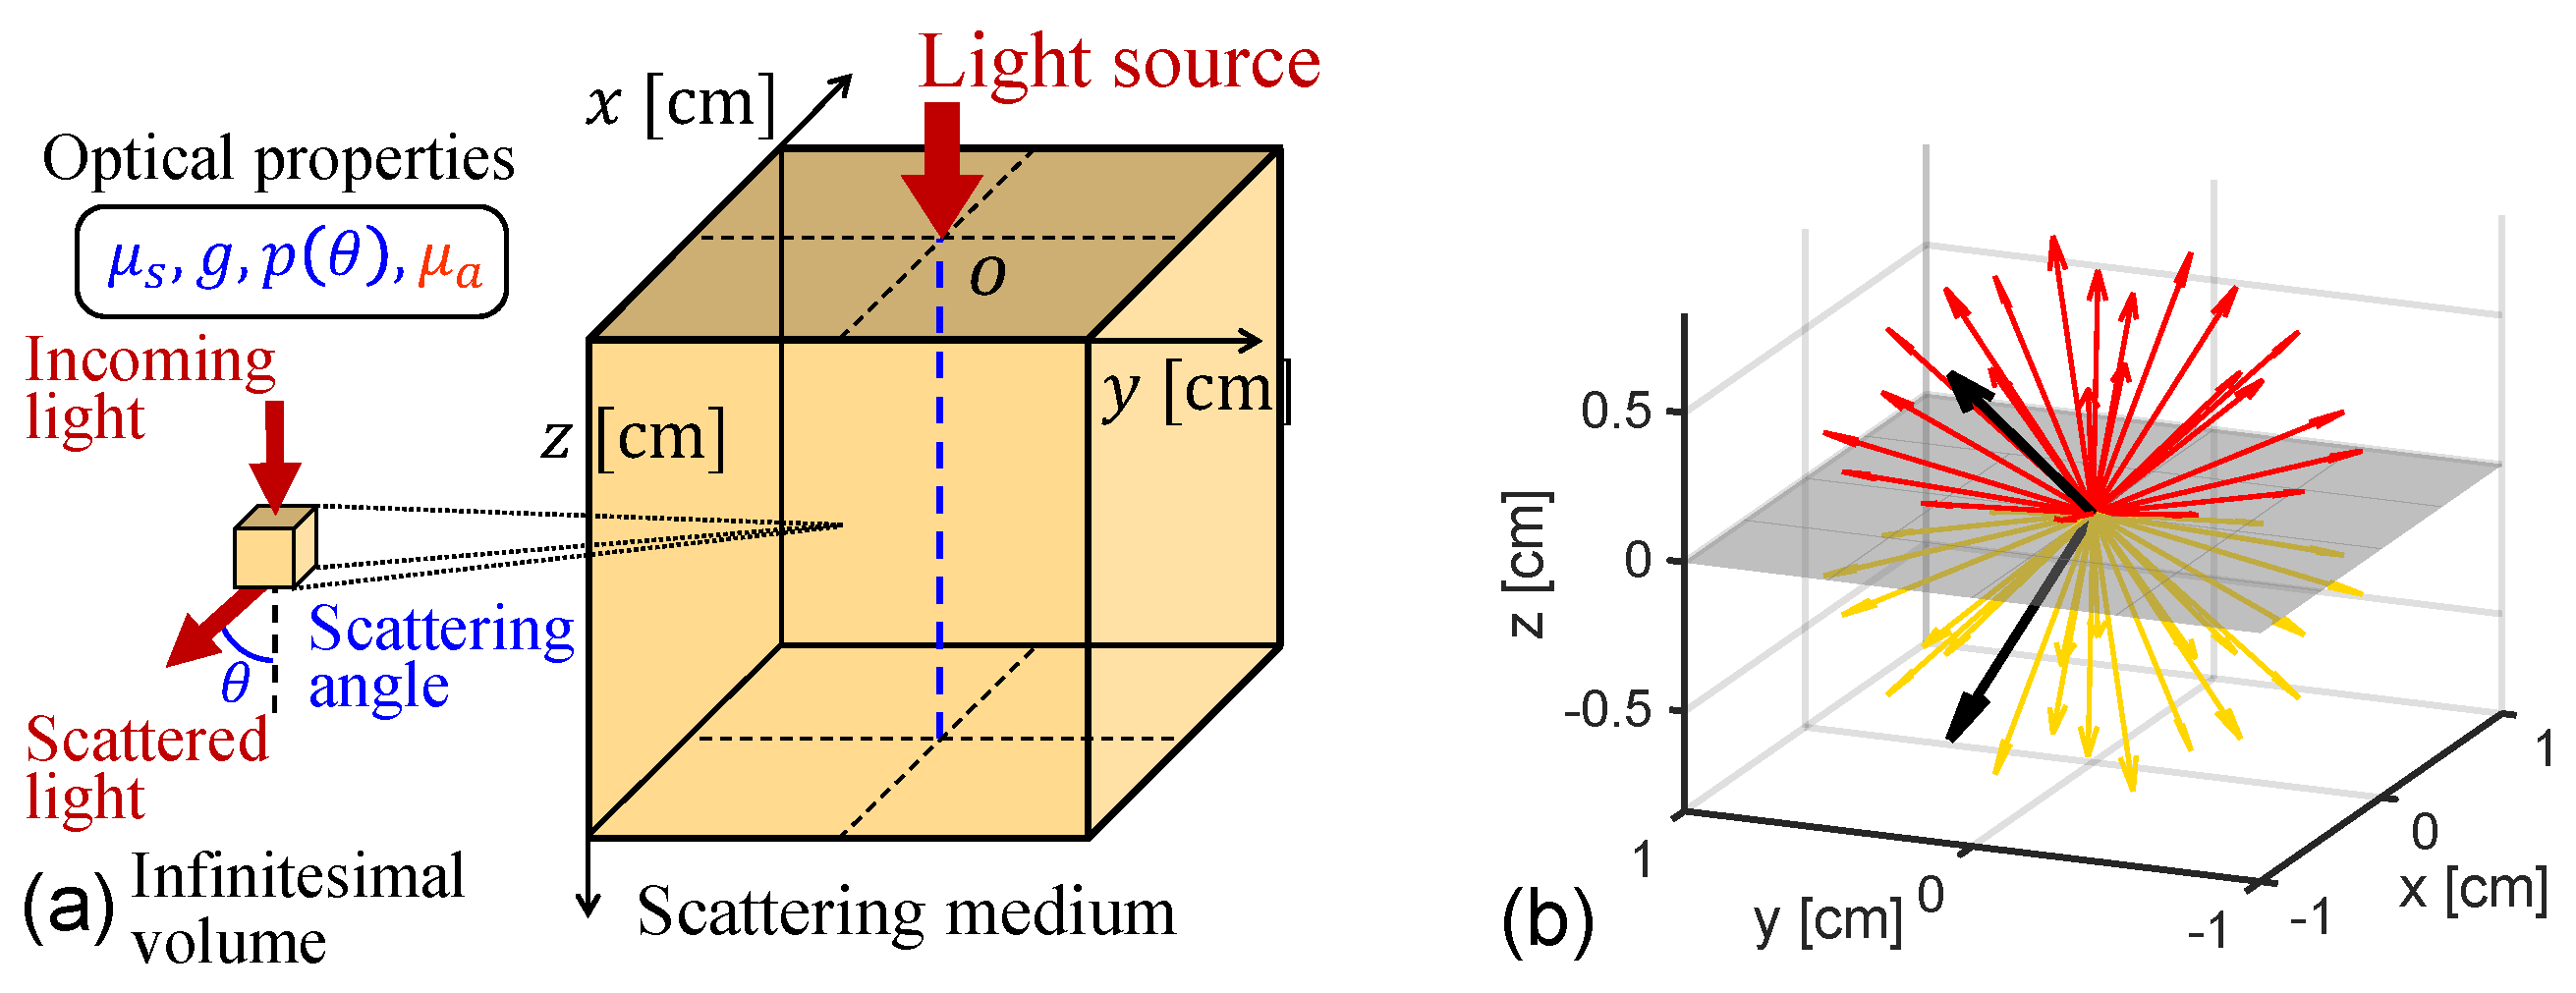
2.1. Radiative Transfer Equation (RTE)

The RTE, a linear Boltzmann equation, can describe light propagation [23] on a length scale of the mean free path between light and a medium. On the length scale, a colloidal suspension is considered as a scattering medium (continuous medium) with the optical properties as shown in Figure 1a. In this study, we considered homogeneous scattering media. For a 3D medium, the steady-state RTE is given by
Ω · + μ a ( r ) + μ s ( r ) I ( r , Ω ) = μ s ( r ) 4 π d Ω p ( Ω · Ω ) I ( r , Ω ) + q ( r , Ω ) ,
where I ( r , Ω ) in J cm 2 str 1 represents the light intensity as a function of spatial position vector r = ( x , y , z ) R 3 in cm ; and angular direction (unit direction vector) Ω = ( Ω x , Ω y , Ω y ) in str. μ a ( r ) and μ s ( r ) in cm 1 are the absorption and scattering coefficients, respectively. p ( Ω · Ω ) in str 1 is the normalized phase with Ω and Ω denoting the incident and scattering directions, respectively; 4 π d Ω represents the integration over the whole solid angle; and q ( r , Ω ) in J cm 3 str 1 is a source function. The anisotropy factor g characterizes the anisotropy of light scattering and is defined as 4 π d Ω p ( Ω · Ω ) cos Ω · Ω . The steady-state light propagation model based on the RTE has been widely discussed in various research fields, including photoacoustic imaging [24,25] and photocatalyst [26,27,28]. The light propagation model based on the RTE has been validated by light reflectance measurements for tissue phantoms [29].
We consider the refractive-index mismatched boundary condition (RMBC) at the boundary [21,29]. The boundary condition treats the light reflection and refraction at a medium-air interface induced by a difference in the refractive indices between the medium and air as shown in Figure 1b. Fresnel’s law and Snell’s law give the reflectivity and transmissivity coefficients.

2.2. Numerical Schemes and Conditions for the RTE

We numerically calculated the RTE based on the finite difference method. We employed the third order upwind scheme for spatial discretization and discrete ordinate method (DOM) for angular discretization [30,31,32]. As discrete angular directions of light intensity, we used the level symmetric even (LSE) quadrature set [33] with the total number of the directions, N Ω = 48 . Several researchers have reported the superiority of the LSE quadrature set [34,35]. The discrete phase function is renormalized by Liu’s method [36] for accurate calculations of the scattering integral (first term in the right-hand side of Equation (1)). Liu’s method works well in the current condition where the anisotropy factor g is small. For details of the upwind scheme and DOM, see references [30,31,32], respectively. Although the references [31,32] focus on a case of highly forward peaked scattering rather than a case of weakly forward peaked scattering, they summarize the DOM with Liu’s method. We numerically solved the discrete forms of the RTE iteratively by Bi-CGSTAB method [37] based on Eigen 3 [38]. We set the tolerance error to 10 16 . We numerically treated the RMBC based on Klose’s procedure [29]; we operated the matrix for the RMBC to the results for the light intensity vector after iterations. We preliminarily confirmed that results when operating the RMBC matrix at each iteration were almost the same as the results in the current procedure. However, this procedure requires more computational time. The spatial step size was uniformly given as Δ r = 0.025 cm. Our preliminary study showed that the RTE results with a smaller Δ r -value were almost the same as those with Δ r = 0.025 cm. Our in-house source code was written in the C++ programming language, and all the matrices were compressed to vectors in the compressed row storage format. We implemented parallel CPU programming with 128 threads work station (AMD EPYC 7452) by OpenMP. The computational time at each volume fraction was approximately 1 h.
We considered a homogeneous cubic medium with a length of 2.5 cm and an isotropic point source at the origin. In the RTE calculations, we employed the DST results for the scattering coefficient μ s and normalized phase function p ( θ ) at each volume fraction. For the refractive index of the alumina suspension, we used the following equation: n c s ( η ) = η n p + ( 1 η ) n w [39], where η is the volume fraction; and n p and n w represent the refractive indices for alumina particles and water, respectively. We referred values of n p and n w as 1.768 and 1.332 , respectively [40], with the optical wavelength of 600 nm. As shown in Figure 2a, the n c s -value increases linearly as the volume fraction increases. According to the change of n c s , the reflectivity coefficient for the RMBC changes with the scattering angle as shown in Figure 2b. For the absorption coefficient, we set it to 0.1 cm 1 because we focus on the scattering process of light propagation.

2.3. Photon Diffusion Equation (PDE)

The steady-state PDE is obtained by the diffusion approximation to the RTE [41]:
· D ( r ) + μ a ( r ) Φ ( r ) = q D E ( r ) ,
where the fluence rate Φ ( r ) is defined by 4 π d Ω I ( r , Ω ) ; the diffusion coefficient D ( r ) is by [ 3 μ s ( r ) ] 1 with the reduced scattering coefficient μ s ( r ) = ( 1 g ) μ s ( r ) ; and the isotropic source q D E ( r ) is by 4 π d Ω q ( r , Ω ) .
We implemented the Robin boundary condition, which is the diffusion approximation of the RMBC [42]:
Φ ( r ) + D ( r ) γ ( n ) e b · Φ ( r ) = 0 ,
where γ ( n ) represents the coefficient for the diffusive reflection [43] and e b represents the outward normal unit vector at the boundary.

2.4. Numerical Schemes and Conditions for the PDE

We numerically calculated the PDE based on the finite difference method. We employed the central difference scheme for spatial discretization. In the PDE calculations, we employed the results of the reduced scattering coefficient μ s using the DST at each volume fraction. The other numerical schemes and conditions were the same as those for the RTE (in-house C++ code, CPU parallel computing, etc.). The computational time at each volume fraction was approximately 20 min.

2.5. Analytical Solutions for the RTE and PDE

We employed analytical solutions of the steady-state RTE and PDE for a 3D infinite slab to verify our numerical results and investigate the diffusion approximation. We considered the slab with two z-planes ( z = 0.0 cm and 2.5 cm with a width d s l a b = 2.5 cm) under the Robin boundary condition (Equation (3)). We focused on calculating points inside the medium on the line perpendicular to the z-planes.
The analytical form of the fluence rate for the PDE is given by [44]
Φ P D E , s l a b ( z , l ) = 1 4 π D s = N s N s 1 r s + e μ e r s + 1 r s e μ e r s ,
where l = ( x , y ) , N s is the number of the summation with s ( s = 0 , ± 1 , ± 2 , , ± N s ); r s + is a distance between the s-th positive source and calculating position ( z , l ); r s is a distance between the s-th negative source and calculating position; and μ e = μ a / D . r s + and r s are given by
r s + = ( z z s + ) 2 + l 2 , r s = ( z z s ) 2 + l 2 , z s + = 2 s ( 2 z b + d s l a b ) + z 0 , z s = 2 s ( 2 z b + d s l a b ) 2 z b z 0 ,
where z b = γ ( n ) D is an extrapolated length and z 0 = min [ Δ r , 1 / μ s ] is a small positive valued.
The analytical solution (Equation (4)) is constructed by summing analytical solutions for an infinite medium over the different distances to treat the boundary condition based on the method of images. We considered the analytical form for the RTE in the same way as that for the PDE
Φ R T E , s l a b ( z , l ) = s = N s N s Φ R T E , i n f ( r s + ) Φ R T E , i n f ( r s ) ,
where Φ R T E , i n f is the analytical solution of the RTE for an infinite medium, derived by Liemert and Kienle [45]. Equation (6) treats the boundary condition under the diffusion approximation, while Φ R T E , i n f is the exact solution of the RTE. We modified the open-source code of Φ R T E , i n f for using the phase function calculated from the DST instead of the Henyey–Greenstein (HG) phase function, originally used.

2.6. Dependent Scattering Theory (DST)

The DST can calculate the scattering properties ( μ s , g, μ s , p ( θ ) ) for dense colloidal suspensions [10,19] on a length scale comparable to the optical wavelength. On the length scale, we considered an aqueous alumina suspension as a system consisting of multi-sized spherical particles in the background medium (water). The system corresponds to the infinitesimal volume of the scattering medium in Figure 1a. The DST is based on the first-order solution of the Foldy–Lax equation [46,47], which is equivalent to the Maxwell equation [11]. The DST describes well the experimental results of the scattering properties [13,14,17].
We denote a particle diameter class by α or β and the total number of the diameter classes by N d . The scattering coefficient μ s , D for the DST is given by
μ s , D = 0 π d θ 0 2 π d ϕ sin θ α = 1 N d β = 1 N d n α n β F α M i e ( θ , ϕ ) · F β M i e * ( θ , ϕ ) S α β ( θ ) ,
where θ is the polar angle and set to the scattering angle cos 1 ( Ω · Ω ) ; ϕ is the azimuthal angle; n α or n β is the number density for the α -class or the β -class ( { α , β } = { 1 , 2 , , N d } ); F α M i e ( θ , ϕ ) is the scattering amplitude vector using the Mie theory [48]; F β M i e * ( θ , ϕ ) is the complex conjugate of F β M i e ( θ , ϕ ) ; and S α β ( θ ) is the partial static structure factor. See the reference [19] for the formulations of the other scattering properties and the numerical schemes.

2.7. Numerical Conditions of the DST

We considered aqueous alumina suspensions as a size-polydisperse colloidal suspension. We used the particle size distribution of an alumina suspension after sonification measured by Mahmoud et al. [49]. Figure 3 shows the fraction of particle size with the mean diameter d m e a n of 55 nm and N d = 10 . We varied volume fractions η [ ] of the alumina particles from 0.01 to 0.20 with the optical wavelength of 600 nm.

3. Numerical Results

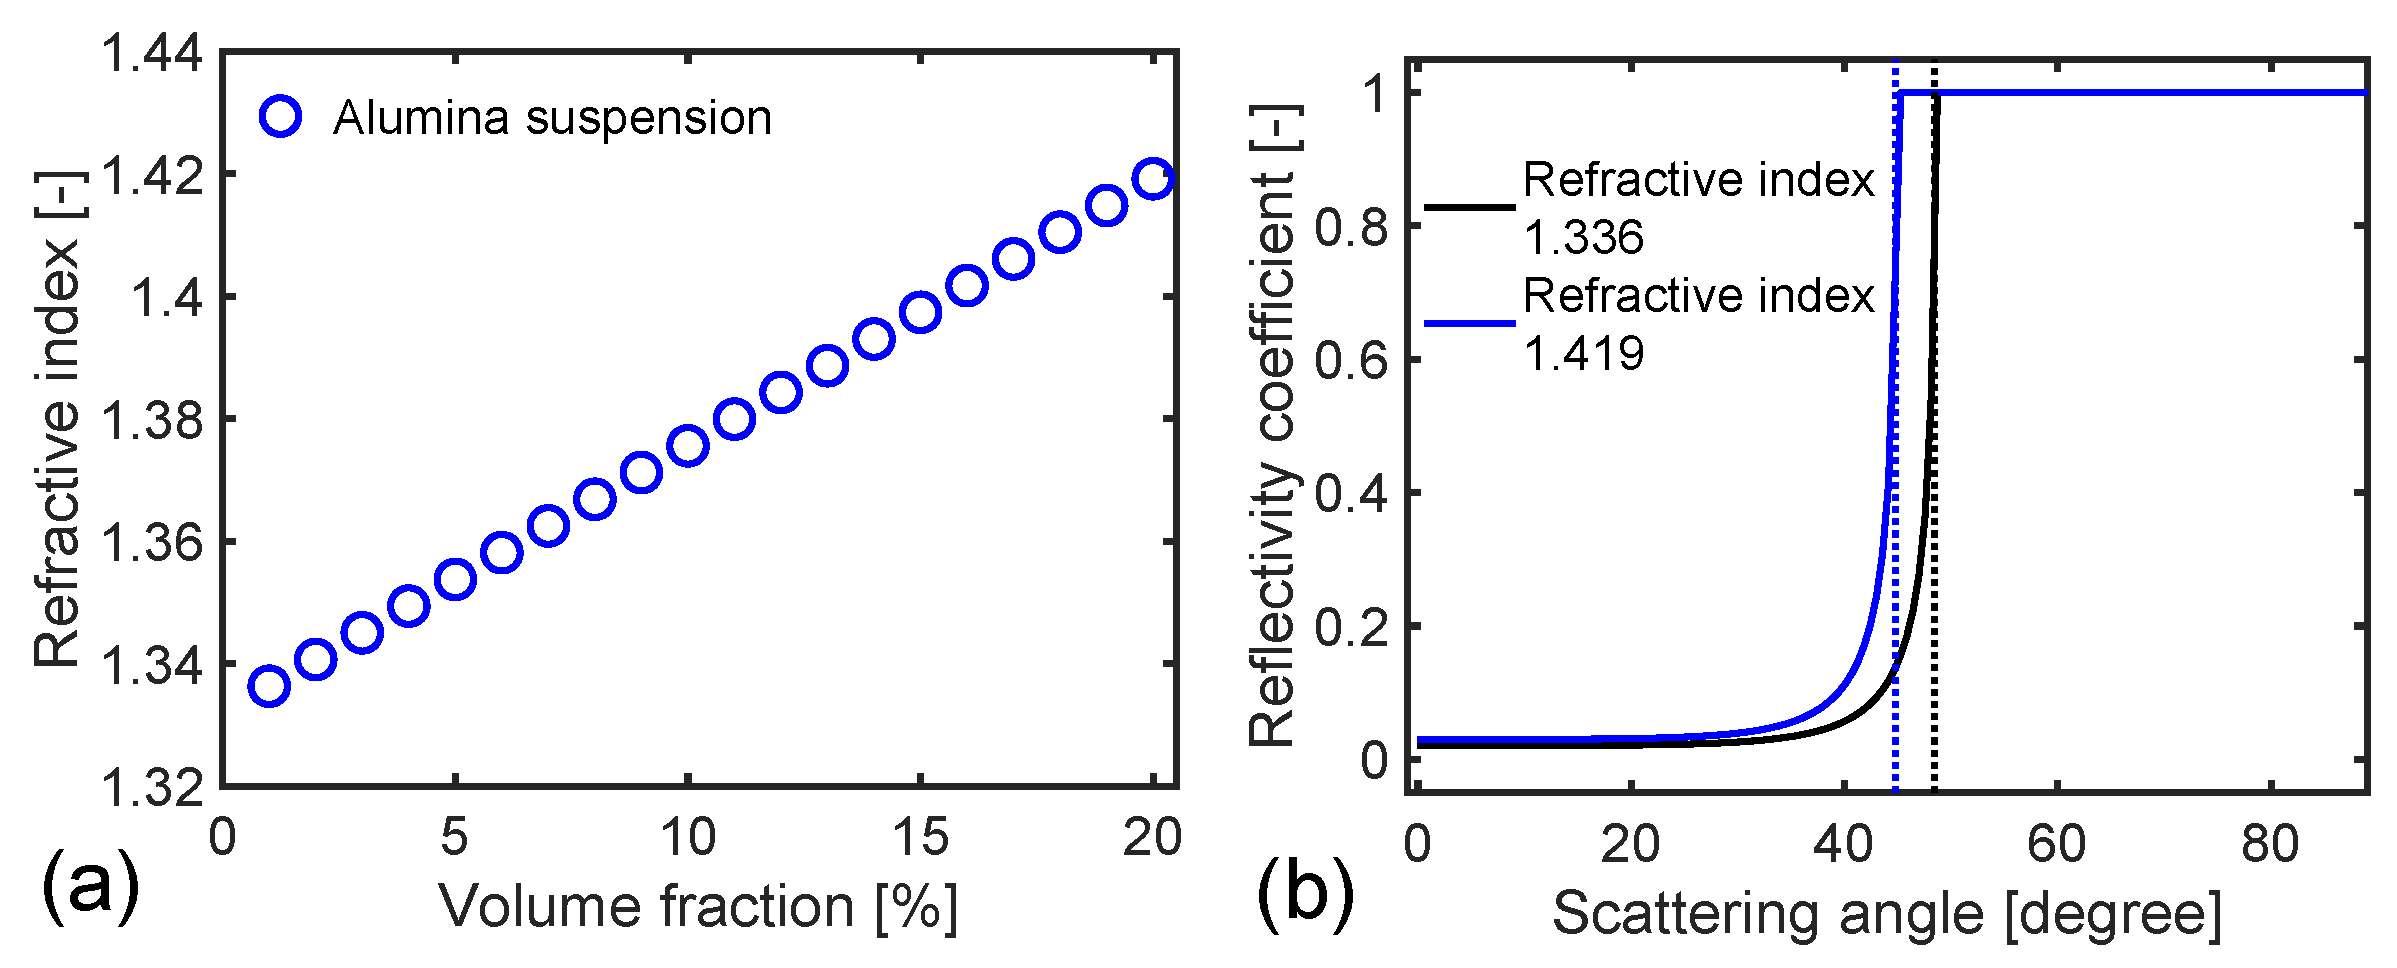
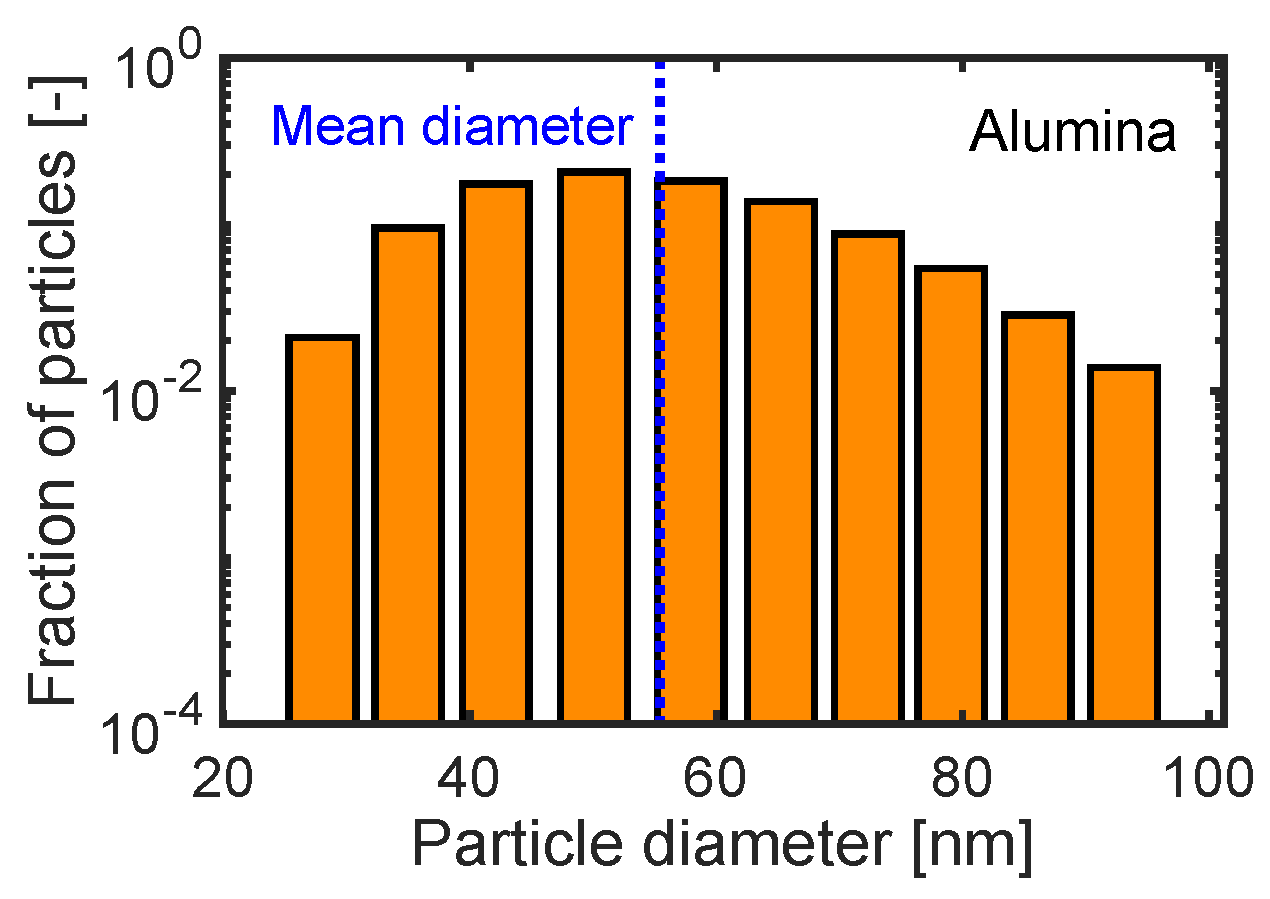
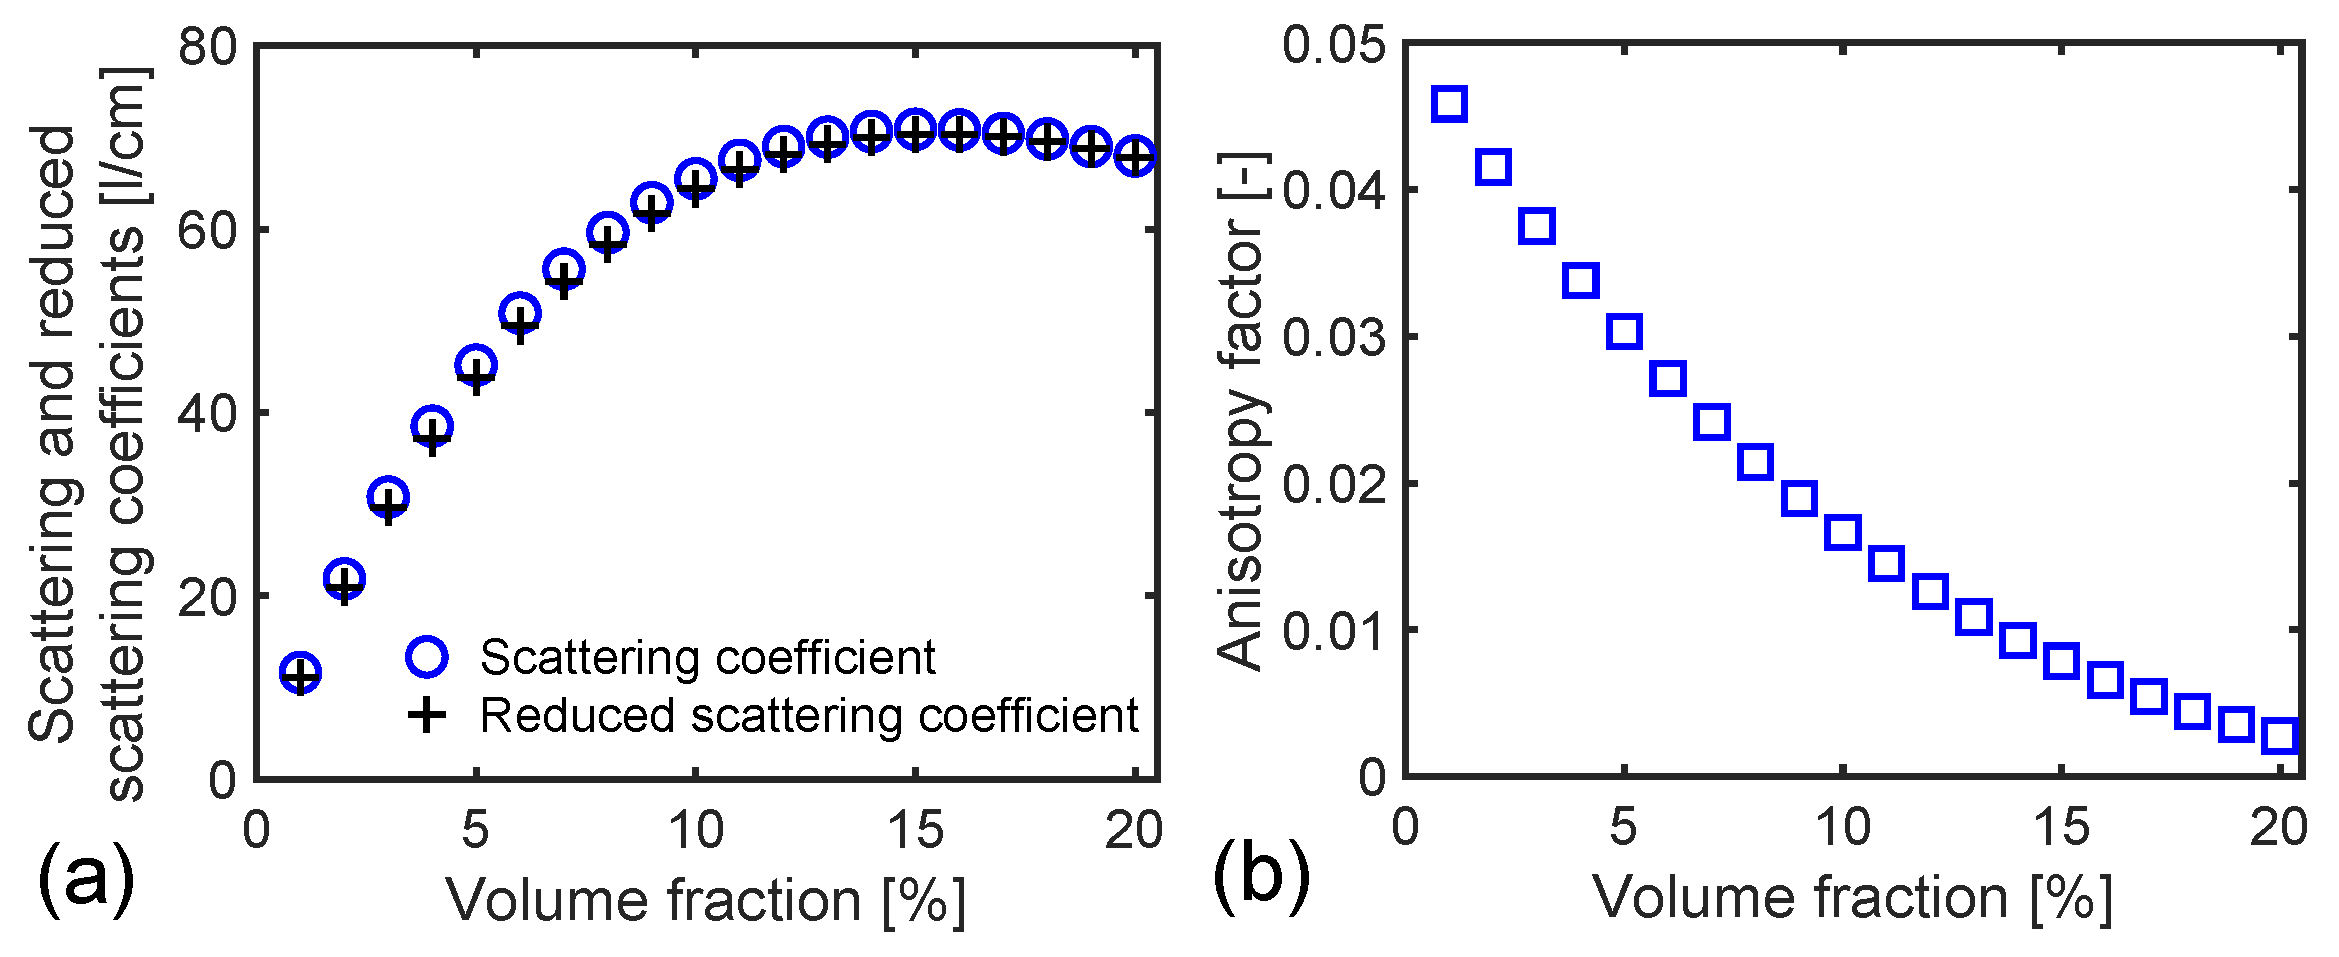
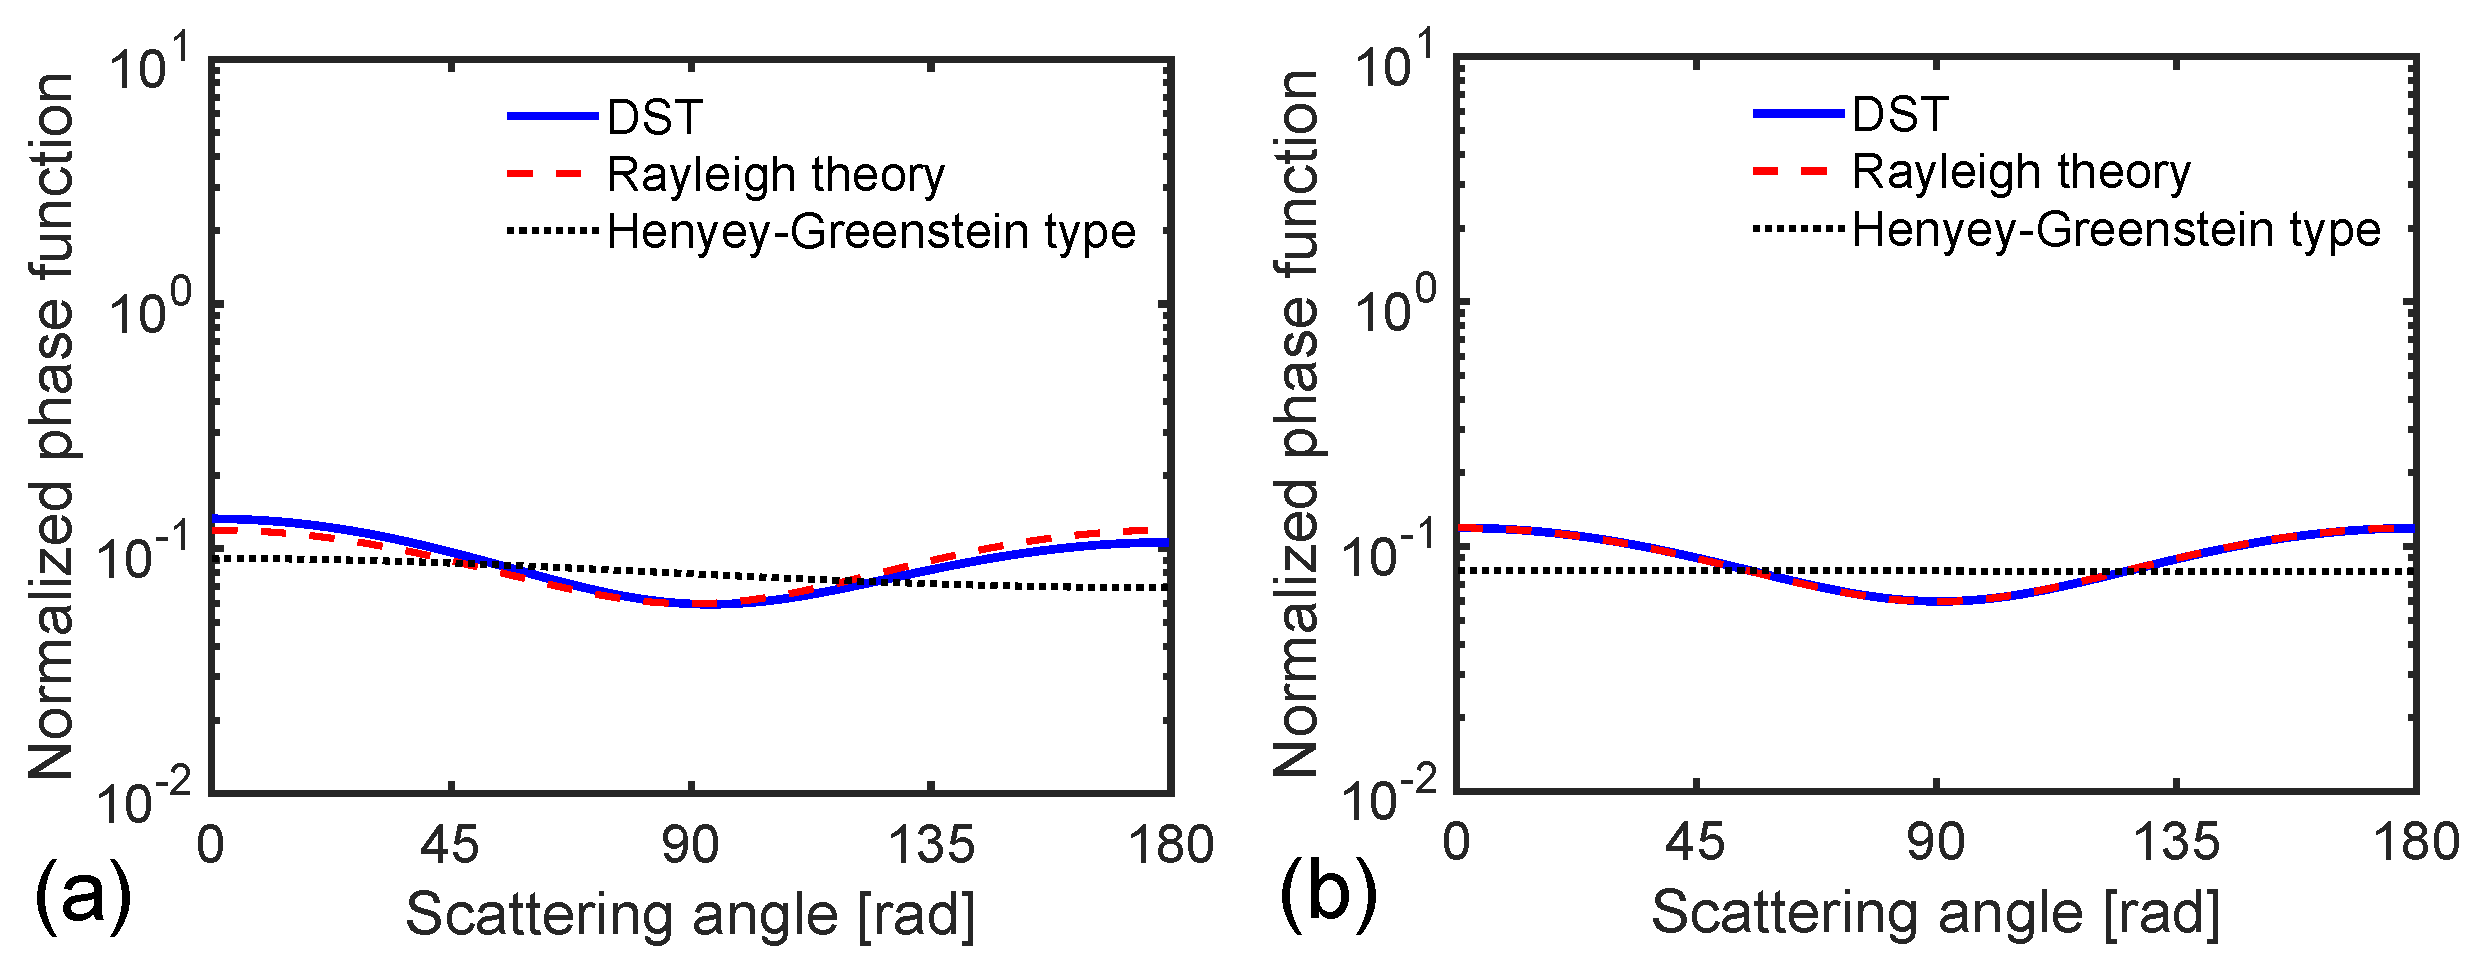
3.1. Scattering Properties
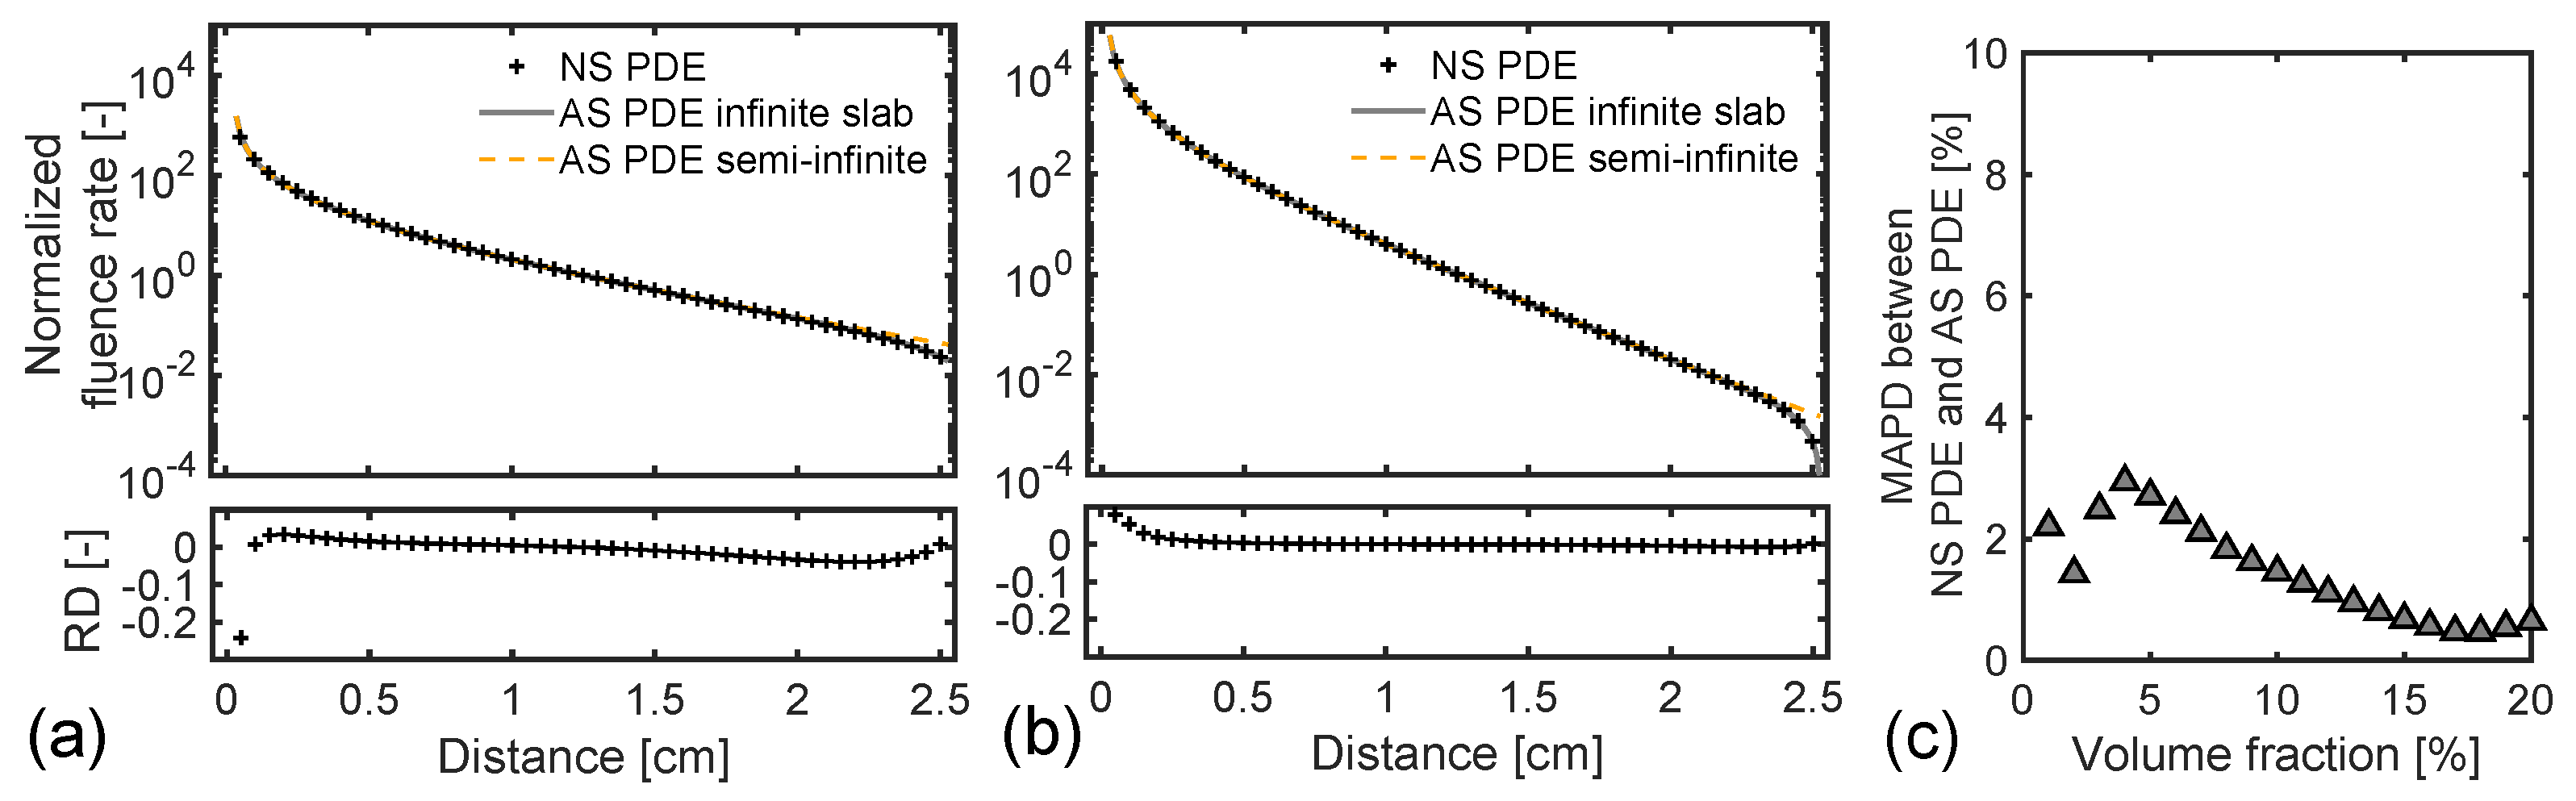
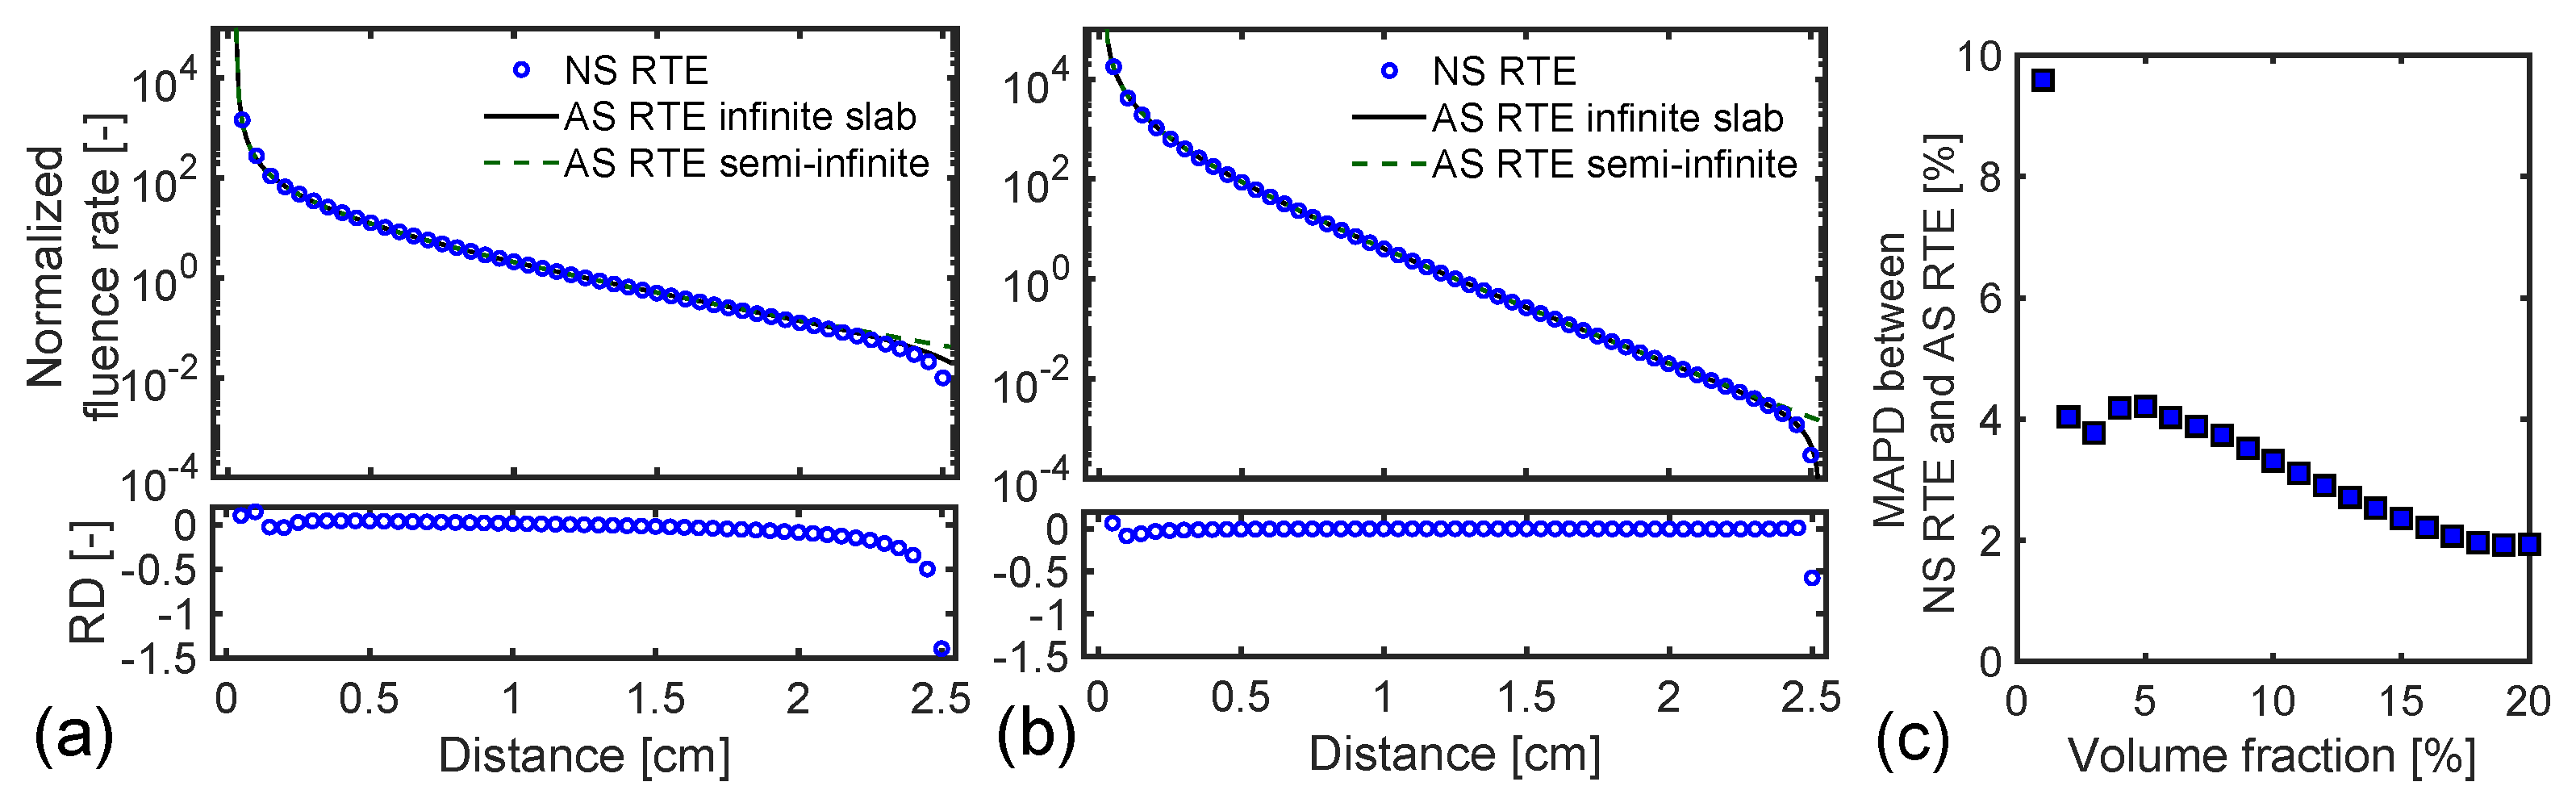
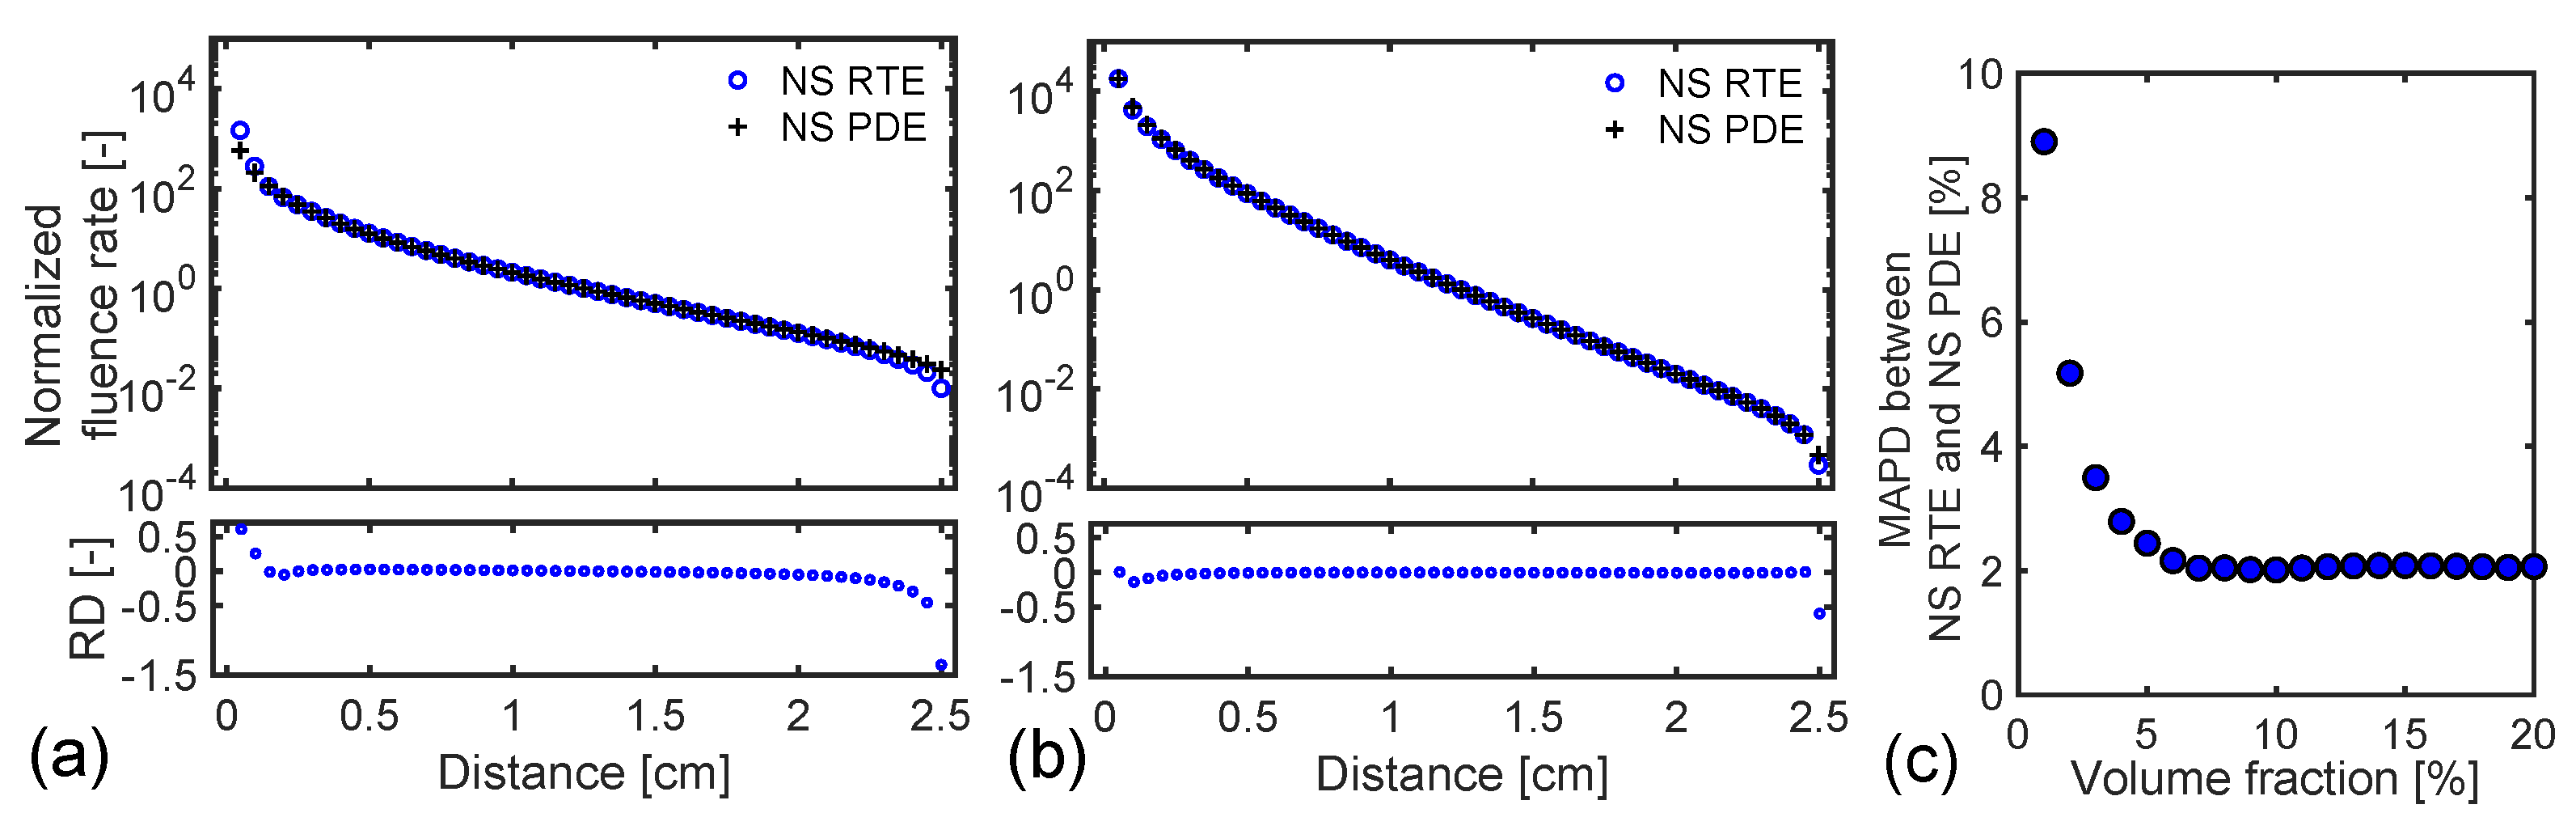
Figure 4 shows the scattering properties ( μ s , μ s , g) calculated from the DST for the aqueous alumina suspensions at different volume fractions. As shown in Figure 4a, at a lower volume fraction less than approximately 5%, the scattering and reduced scattering coefficients depend on the volume fraction linearly. Meanwhile, at a higher volume fraction, the curvilinear dependence of the coefficients is observed. As shown in Figure 4b, the anisotropy factor is almost zero, although the value decreases as the volume fraction increases. The g-result indicates the light scattering is almost isotropic for the suspensions. This is because the particle diameter (mean diameter d m e a n of 55 nm) is much smaller than the optical wavelength λ of 600 nm; i.e., the size parameter x s = 2 π n c s d m e a n / λ is much smaller than unity. This fact suggests that the Rayleigh theory holds. Because of the g-result, the reduced scattering coefficient values are almost the same as those of the scattering coefficient.
In Figure 5, we plot the normalized phase functions p ( θ ) calculated from the DST with the scattering angle θ . The results using the DST almost agree with those using the Rayleigh theory ( 3 [ 1 + cos 2 θ ] / ( 16 π ) ) because of the small x s -value. We also plot the HG phase functions [50] with the same g-values as those using the DST because the function has been widely used. The HG phase functions deviate from the results using the DST, although the deviations are small in the current conditions.

3.2. Fluence Rate

We investigated the fluence rates at different positions on the line parallel to the z-axis with ( x , y ) = ( 0 , 0 ) inside the medium (blue dash line in Figure 1a). Here, the distances between source and calculating positions (SC distances) range from 0.05 to 2.50 cm at equal intervals of 0.05 cm.
Before discussion of the RTE results, we investigated the PDE results. In Figure 6a,b, we compared the numerical solutions (NSs) of the PDE with the analytical solutions (ASs) of the PDE for the infinite slab (Equation (4)) with the boundaries at z = 0.0 cm and 2.5 cm for different volume fractions of 1% and 20%. The results are normalized by the values at the SC distance of 1.25 cm. The numerical results nicely agree with the analytical solutions at all the SC distances, verifying our numerical calculations of the PDE. The agreement suggests that the boundaries except those at z = 0.0 cm and 2.5 cm less influence the numerical results on the line inside the medium, because the NSs are for the cubic medium while the ASs for the infinite slab. In Figure 6a,b, we plot the AS for the semi-infinite medium at the z = 0 boundary, obtained from Equation (4) with s = 0 . We observe differences in the ASs between the infinite slab and semi-infinite medium in the SC distances from 2.3 cm to 2.5 cm due to the boundary effects at z = 2.5 cm. We plot the relative differences (RDs) between the NS and AS for the infinite slab at each figure’s bottom. The small RDs are observed near the boundaries of z = 0.0 cm and 2.5 cm.
We evaluated the differences in the normalized fluence rates between the NS and AS for the infinite slab by the mean absolute percentage difference (MAPD):
D Φ ( N , P ; A , P ) = Mean Φ ^ A S , P D E c Φ ^ N S , P D E c Φ ^ N S , P D E c ,
where Φ ^ A S , P D E c and Φ ^ N S , P D E c represent the AS and NS at the c-th calculating point, respectively. As shown in Figure 6c, the MAPDs are less than 3% at all the volume fractions.
Next, we investigated the diffusion approximation at the boundary by comparing the numerical results for the RTE with the AS (Equation (6)) for the infinite slab at different volume fractions. The AS of the RTE (Equation (6)) is based on the diffusion approximation to the boundary region. Meanwhile, the numerical calculations of the RTE treat the RMBC. As shown in Figure 7a,b, the numerical result nicely agrees with the AS except the boundary region (the SC distances from 2.3 cm to 2.5 cm) at the volume fraction of 1%. The agreements suggest the verification of our numerical calculations of the RTE. The difference at the boundary region ( z = 2.5 cm) in Figure 7a is probably due to the fact that the diffusion approximation is invalid at the volume fraction of 1%. We plot the AS of the RTE for the semi-infinite medium at the z = 0 boundary obtained from Equation (6) with s = 0 . Similar to the AS of the PDE, we observe the difference between the infinite slab and semi-infinite medium in the SC distance region from 2.3 cm to 2.5 cm. As shown in Figure 7c, the MAPDs, D Φ ( N , R ; A , R ) , between the NS of the RTE and AS of the RTE for the infinite slab are less than 5% except for the case for the volume fraction of 1%. The small MAPD-values indicate that the diffusion approximation is valid at the boundary at the volume fraction range higher than 1%.
Finally, we investigated the diffusion approximation inside and at the boundary by comparing the numerical results for the RTE with those for the PDE. Figure 8a shows that at the volume fraction of 1%, the numerical results agree with each other except the boundary regions at z = 0.0 cm and 2.5 cm. The behavers of the RD in the numerical calculations between the RTE and PDE are similar to those between the NS and AS of the RTE (Figure 7a). These results suggest that the diffusion approximation is valid inside the medium even at the lower volume fraction of 1%. As shown in Figure 8b, at the volume fraction of 20%, the numerical results agree well with each other, suggesting the diffusion approximation is valid at all the SC distances. At the z = 2.5 boundary, the RTE results slightly differ from the PDE results at the two-volume fractions, probably because of the difference in the boundary conditions between the RTE and PDE (RMBC and Robin BC). Figure 8c shows the MAPDs, D Φ ( N , R ; N , P ) , between the RTE and PDE are less than approximately 5%, meaning the diffusion approximation holds at all the SC distances with the volume fractions higher than 1%. Constant values of the MAPD (∼2%) in the volume fractions from 7% to 20% are probably because the spatial discretization is the same for the RTE and PDE. From Figure 8a,b, the MAPD-values mostly come from the differences at the boundary regions ( z = 0.0 cm and 2.5 cm).
From the results in Figure 7c and Figure 8c, we conclude the diffusion approximation holds at the internal regions with the whole volume fraction range 1–20% and all the SC distances with the volume fraction higher than 1%.

4. Discussion

The DST results showed the μ s -values range from 11 to 70 cm 1 for the alumina suspension at the volume fraction range 1–20% in Figure 4. These values are within the range for biological tissue volumes [51]. Meanwhile, the g-values are almost zero, different from a typical value of biological tissue volumes ( g 0.8 ) [51]. These results suggest that the alumina suspension is an appropriate tissue phantom modeling the reduced scattering coefficient rather than the scattering coefficient and anisotropy factor. Our comparative study of the RTE calculations with the PDE calculations showed the diffusion approximation holds for light propagation, meaning that μ s primarily characterizes light propagation. This result supports our previous suggestion for the applicability of the alumina suspension.
According to the previous research works of time-dependent light propagation [20,21,22], the characteristic length where the diffusion approximation holds has been evaluated at approximately 10 / μ t with μ t = μ s + μ a . In our current conditions, the characteristic lengths are given as 0.89 cm for the volume fraction of 1% and 0.15 cm for 20%, respectively. As shown in Figure 8a,b, the RTE results agree with the PDE results inside the distance of the characteristic length from the boundaries. Hence, the current results for steady-state light propagation are consistent with those for time-dependent light propagation. Our numerical study suggests that the PDE-DST is useful as a light propagation model for the alumina suspensions rather than the RTE-DST because the diffusion approximation is almost valid and the PDE calculations are faster than the RTE calculations.
The numerical investigation of light propagation in the alumina suspension (liquid phantom) is essential for developing near-infrared spectroscopy and imaging toward their practical application, such as non-invasive cancer detection in the human body. Moreover, the RTE-DST and PDE-DST, developed here in the alumina suspensions, can be applied to other colloidal suspensions and research fields. For example, a titanium dioxide suspension is one of the photocatalytic systems. Because the evaluation of light propagation in a photocatalytic system is significant, the investigation in this paper probably provides valuable information in the research field of photocatalysis.
Based on the following two reasons, we concluded that PDE-DST is beneficial over the RTE-DST in the alumina suspension at the volume fraction range of 1–20%, meaning the diffusion approximation is valid. The other is because the computational loads of the PDE-DST are smaller, and the numerical treatment is simpler. The RTE-DST provides accurate computation of light propagation but requires complicated treatments of the phase function using the DST and RMBC. As shown in Figure 8a,b, the difference between the numerical results mostly comes from the differences at the boundary regions ( z = 0.0 cm and 2.5 cm). Hence, developing an efficient and accurate treatment of RMBC to a boundary condition of the PDE is crucial for future work.
In future work, examining light propagation for the colloidal suspensions with larger particle sizes will be challenging. The scattering properties become larger with an increasing particle size. The large μ s -values indicate the diffusion approximation probably holds at a broader condition, such as the volume fraction compared to the suspension with a smaller particle size. Meanwhile, this result requires a finer spatial step size for the numerical calculation of the RTE-DST. In the suspension with the larger particle size, the g-values become close to unity, meaning highly forward scattering. The g-results prevent the diffusion approximation, where light scattering is isotropic. Moreover, the g-results require accurate and efficient treatments of the highly forward peaked phase function for the numerical calculation of the RTE-DST.

Author Contributions

Conceptualization, H.F. and I.T.; investigation and analysis, H.F., I.T. and T.A.; writing—original draft preparation, H.F.; writing—review and editing, H.F., T.A., Y.I. and H.N.; supervision, K.K. and M.W. All authors have read and agreed to the published version of the manuscript.

Funding

The first author (H.F.) acknowledges support from Grant-in-Aid for Scientific Research (20H02076 and 21H05577) of the Japan Society for the Promotion of Science, KAKENHI.

Institutional Review Board Statement

Not applicable.

Informed Consent Statement

Not applicable.

Data Availability Statement

Data underlying the results presented in this paper are not publicly available at this time but may be obtained from the authors upon reasonable request.

Acknowledgments

The first author (H.F.) would like to thank A. Yamamoto, T. Endo, T. Amano, G. Chiba, and R. Shimizu for the fruitful discussions on the RTE calculations.

Conflicts of Interest

The authors declare no conflict of interest. The funders had no role in the design of the study; in the collection, analyses, or interpretation of data; in the writing of the manuscript, or in the decision to publish the results.

Abbreviations

The following abbreviations are used in this manuscript:
RTTradiative transfer theory
RTEradiative transfer equation
RMBCrefractive index mismatched boundary condition
DOMdiscrete ordinate method
LSE quadrature setLevel symmetric even quadrature set
PDEphoton diffusion equation
DSTdependent scattering theory
HG functionHenyey–Greenstein function
SC distancesource-calculating points distance
NSnumerical solution
ASanalytical solution
RDrelative difference
MAPDmean absolute percentage difference

References

  1. Ntziachristos, V. Going deeper than microscopy: The optical imaging frontier in biology. Nat. Methods 2010, 7, 603–614. [Google Scholar] [CrossRef] [PubMed]
  2. Qin, J.; Lu, R. Measurement of the optical properties of fruits and vegetables using spatially resolved hyperspectral diffuse reflectance imaging technique. Postharvest Biol. Technol. 2008, 49, 355–365. [Google Scholar] [CrossRef]
  3. Hoshi, Y.; Yamada, Y. Overview of diffuse optical tomography and its clinical applications. J. Biomed. Opt. 2016, 21, 091312. [Google Scholar] [CrossRef] [PubMed] [Green Version]
  4. Okawa, S.; Hoshi, Y.; Yamada, Y. Improvement of image quality of time domain diffuse optical tomography with lp sparsity regularization. Biomed. Opt. Express 2011, 2, 3334–3348. [Google Scholar] [CrossRef] [PubMed] [Green Version]
  5. Yamada, Y.; Suzuki, H.; Yamashita, Y. Time-Domain Near-Infrared Spectroscopy and Imaging: A Review. Appl. Sci. 2019, 9, 1127. [Google Scholar] [CrossRef] [Green Version]
  6. Hoshi, Y.; Tanikawa, Y.; Okada, E.; Kawaguchi, H.; Nemoto, M.; Shimizu, K.; Kodama, T.; Watanabe, M. In situ estimation of optical properties of rat and monkey brains using femtosecond time-resolved measurements. Sci. Rep. 2019, 9, 9165. [Google Scholar] [CrossRef] [Green Version]
  7. Bashkatov, A.N.; Genina, E.A.; Tuchin, V.V. Optical Properties of Skin, Subcutaneous, and Muscle Tissues: A Review. J. Innov. Opt. Health Sci. 2011, 4, 9–38. [Google Scholar] [CrossRef]
  8. Friebel, M.; Roggan, A.; Müller, G.; Meinke, M. Determination of optical properties of human blood in the spectral range 250 to 1100 nm using Monte Carlo simulations with hematocrit-dependent effective scattering phase functions. J. Biomed. Opt. 2006, 11, 034021. [Google Scholar] [CrossRef]
  9. Pogue, B.W.; Patterson, M.S. Review of tissue simulating phantoms for optical spectroscopy, imaging and dosimetry. J. Biomed. Opt. 2006, 11, 041102. [Google Scholar] [CrossRef]
  10. Cartigny, J.D.; Yamada, Y.; Tien, C.L. Radiative transfer with dependent scattering by particles: Part 1—Theoretical investigation. J. Heat Transf. 1986, 108, 608–613. [Google Scholar] [CrossRef]
  11. Tsang, L.; Kong, J.A.; Ding, K.H.; Ao, C.O. Scattering of Electromagnetic Waves: Numerical Simulations; John Wiley & Sons, Ltd.: Hoboken, NJ, USA, 2001. [Google Scholar]
  12. Staveren, H.J.V.; Moes, C.J.M.; Marie, J.V.; Prahl, S.A.; Gemert, M.J.C.V. Light scattering in Intralipid-10% in the wavelength range of 400–1100 nm. Appl. Opt. 1991, 30, 4507–4514. [Google Scholar] [CrossRef] [PubMed] [Green Version]
  13. Yamada, Y.; Cartigny, J.D.; Tien, C.L. Radiative transfer with dependent scattering by particles: Part 2—Experimental investigation. J. Heat Transf. 1986, 108, 614–618. [Google Scholar] [CrossRef]
  14. Nguyen, V.D.; Faber, D.J.; van der Pol, E.; van Leeuwen, T.G.; Kalkman, J. Dependent and multiple scattering in transmission and backscattering optical coherence tomography. Opt. Express 2013, 21, 29145–29156. [Google Scholar] [CrossRef] [PubMed]
  15. Tsang, L.; Kong, J.A. Scattering of Electromagnetic Waves from a Dense Medium Consisting of Correlated Mie Scatterers with Size Distributions and Applications to Dry Snow. J. Electromag. Waves Appl. 1992, 6, 265–286. [Google Scholar] [CrossRef]
  16. Zaccanti, G.; Bianco, S.D.; Martelli, F. Measurements of optical properties of high-density media. Appl. Opt. 2003, 42, 4023–4030. [Google Scholar] [CrossRef] [PubMed]
  17. Bressel, L.; Hass, R.; Reich, O. Particle sizing in highly turbid dispersions by Photon Density Wave spectroscopy. J. Quant. Spectrosc. Radiat. Transf. 2013, 126, 122–129. [Google Scholar] [CrossRef]
  18. Chang, W.; Ding, K.H.; Tsang, L.; Xu, X. Microwave Scattering and Medium Characterization for Terrestrial Snow with QCA-Mie and Bicontinuous Models: Comparison Studies. IEEE Trans. Geosci. Remote Sens. 2016, 54, 3637–3648. [Google Scholar] [CrossRef]
  19. Fujii, H.; Tsang, L.; Zhu, J.; Nomura, K.; Kobayashi, K.; Watanabe, M. Photon transport model for dense polydisperse colloidal suspensions using the radiative transfer equation combined with the dependent scattering theory. Opt. Express 2020, 28, 22962–22977. [Google Scholar] [CrossRef] [PubMed]
  20. Yoo, K.M.; Liu, F.; Alfano, R.R. When does the diffusion approximation fail to describe photon transport in random media? Phys. Rev. Lett. 1990, 64, 2647–2650. [Google Scholar] [CrossRef]
  21. Fujii, H.; Okawa, S.; Yamada, Y.; Hoshi, Y. Hybrid model of light propagation in random media based on the time-dependent radiative transfer and diffusion equations. J. Quant. Spectrosc. Radiat. Transf. 2014, 147, 145–154. [Google Scholar] [CrossRef] [Green Version]
  22. Fujii, H.; Ueno, M.; Kobayashi, K.; Watanabe, M. Characteristic length and time scales of the highly forward scattering of photons in random media. Appl. Sci. 2020, 10, 93. [Google Scholar] [CrossRef] [Green Version]
  23. Chandrasekhar, S. Radiative Transfer; Dover: New York, NY, USA, 1960. [Google Scholar]
  24. Okawa, S.; Hirasawa, T.; Kushibiki, T.; Ishihara, M. Numerical evaluation of linearized image reconstruction based on finite element method for biomedical photoacoustic imaging. Opt. Rev. 2013, 20, 442–451. [Google Scholar] [CrossRef]
  25. Cox, B.; Laufer, J.G.; Arridge, S.R.; Beard, P.C. Quantitative spectroscopic photoacoustic imaging: A review. J. Biomed. Opt. 2012, 17, 061202. [Google Scholar] [CrossRef] [PubMed] [Green Version]
  26. Satuf, M.L.; Brandi, R.J.; Cassano, A.E.; Alfano, O.M. Experimental Method to Evaluate the Optical Properties of Aqueous. Ind. Eng. Chem. Res. 2005, 44, 6643–6649. [Google Scholar] [CrossRef]
  27. Maruga, J.; Grieken, R.V.; Alfano, O.M.; Cassano, A.E. Optical and Physicochemical Properties of Silica-Supported TiO2 Photocatalysts. AIChE J. 2006, 52, 2832–2843. [Google Scholar] [CrossRef]
  28. Fujii, H.; Yamada, Y.; Hoshi, Y.; Okawa, S.; Kobayashi, K.; Watanabe, M. Light propagation model of titanium dioxide suspensions in water using the radiative transfer equation. Reac. Kinet. Mech. Cat. 2018, 123, 439–453. [Google Scholar] [CrossRef] [Green Version]
  29. Klose, A.D.; Netz, U.; Beuthan, J.; Hielscher, A.H. Optical tomography using the time-independent equation of radiative transfer—Part 1: Forward model. J. Quant. Spectrosc. Radiat. Transf. 2002, 72, 691–713. [Google Scholar] [CrossRef]
  30. Fujii, H.; Yamada, Y.; Kobayashi, K.; Watanabe, M.; Hoshi, Y. Modeling of light propagation in the human neck for diagnoses of thyroid cancers by diffuse optical tomography. Int. J. Numer. Meth. Biomed. Eng. 2017, 33, 1–12. [Google Scholar] [CrossRef] [Green Version]
  31. Fujii, H.; Yamada, Y.; Chiba, G.; Hoshi, Y.; Kobayashi, K.; Watanabe, M. Accurate and efficient computation of the 3D radiative transfer equation in highly forward-peaked scattering media using a renormalization approach. J. Comput. Phys. 2018, 374, 591–604. [Google Scholar] [CrossRef]
  32. Fujii, H.; Chiba, G.; Yamada, Y.; Hoshi, Y.; Kobayashi, K.; Watanabe, M. A comparative study of the delta-Eddington and Galerkin quadrature methods for highly forward scattering of photons in random media. J. Comput. Phys. 2020, 423, 109825. [Google Scholar] [CrossRef]
  33. Fiveland, W.A. The selection of discrete ordinate quadrature sets for anisotropic scattering. Fundam. Radiat. Heat Transf. 1991, 160, 89–96. [Google Scholar]
  34. Long, F.; Li, F.; Intes, X.; Kotha, S.P. Radiative transfer equation modeling by streamline diffusion modified continuous Galerkin method. J. Biomed. Opt. 2016, 21, 036003. [Google Scholar] [CrossRef] [PubMed] [Green Version]
  35. Fujii, H.; Okawa, S.; Yamada, Y.; Hoshi, Y.; Watanabe, M. Renormalization of the highly forward-peaked phase function using the double exponential formula for radiative transfer. J. Math. Chem. 2016, 54, 2048–2061. [Google Scholar] [CrossRef] [Green Version]
  36. Liu, L.; Ruan, L.; Tan, H. On the discrete ordinates method for radiative heat transfer in anisotropically scattering media. Int. J. Heat Mass Transf. 2002, 45, 3259–3262. [Google Scholar] [CrossRef]
  37. van der Vorst, H.A. Bi-CGSTAB: A Fast and Smoothly Converging Variant of Bi-CG for the Solution of Nonsymmetric Linear Systems. SIAM J. Sci. Stat. Comput. 1992, 13, 631–644. [Google Scholar] [CrossRef]
  38. Guennebaud, G.; Jacob, B.; Avery, P.; Bachrach, A.; Barthelemy, S.; Becker, C.; Benjamin, D.; Berger, C.; Berres, A.; Borgerding, M.; et al. Eigen v3. 2010. Available online: http://eigen.tuxfamily.org (accessed on 20 December 2021).
  39. Tuchin, V.V. Tissue Optics: Light Scattering Methods and Instruments for Medical Diagnosis; SPIE Press: Bellingham, WA, USA, 2015. [Google Scholar]
  40. Said, Z.; Saidur, R.; Rahim, N.A. Optical properties of metal oxides based nanofluids. Int. Commun. Heat Mass Transf. 2014, 59, 46–54. [Google Scholar] [CrossRef]
  41. Furutsu, K.; Yamada, Y. Diffusion approximation for a dissipative random medium and the applications. Phys. Rev. E 1994, 50, 3634–3640. [Google Scholar] [CrossRef]
  42. Martelli, F.; Bianco, S.D.; Ismaelli, A.; Zaccanti, G. Light Propagation through Biological Tissue and Other Diffusive Media: Theory, Solutions, and Software; SPIE: Bellingham, WA, USA, 2009. [Google Scholar]
  43. Egan, W.G.; Hilgeman, T.W. Optical Properties of Inhomogeneous Materials; Academic: New York, NY, USA, 1979. [Google Scholar]
  44. Patterson, M.S.; Chance, B.; Wilson, B.C. Time resolved reflectance and transmittance for the noninvasive measurement of tissue optical properties. Appl. Opt. 1989, 28, 2331–2336. [Google Scholar] [CrossRef]
  45. Liemert, A.; Kienle, A. Analytical solution of the radiative transfer equation for infinite-space fluence. Phys. Rev. A 2011, 83, 1–4. [Google Scholar] [CrossRef] [Green Version]
  46. Foldy, L.L. The Multiple Scattering of Waves. I. General Theory of Isotropic Scattering by Randomly Distributed Scatterers. Phys. Rev. 1945, 67, 107–119. [Google Scholar] [CrossRef]
  47. Lax, M. Multiple Scattering of Waves. II. The Effective Field in Dense Systems. Phys. Rev. 1952, 85, 621–629. [Google Scholar] [CrossRef]
  48. Bohren, C.F.; Huffman, D.R. Absorption and Scattering of Light by Small Particles; John Wiley & Sons: Hoboken, NJ, USA, 1983. [Google Scholar]
  49. Mahmoud, B.; Rice, H.P.; Mortimer, L.; Fairweather, M.; Harbottle, D. Acoustic Method for Determination of the Thermal Properties of Nanofluids. Ind. Eng. Chem. Res. 2019, 58, 19719–19731. [Google Scholar] [CrossRef]
  50. Henyey, L.G.; Greenstein, L.J. Diffuse radiation in the galaxy. Astrophys. J. 1941, 93, 70–83. [Google Scholar] [CrossRef]
  51. Cheong, W.F.; Prahl, S.A.; Welch, A.J. A review of the optical properties of biological tissue. IEEE J. Quantum Electron. 1990, 26, 2166–2185. [Google Scholar] [CrossRef] [Green Version]
Figure 1. (a) Scattering medium, which models the alumina suspension for the RTT. The optical properties are defined in an infinitesimal volume of the medium. The light source (the red arrow) is incident on the origin. The blue dotted line represents positions where the fluence rates are calculated. (b) Outward and reflected directions (red and yellow arrows) at z = 0 surface (gray color) based on the LSE quadrature set. Black arrows denote outward, and corresponding reflected directions.
Applsci 12 01190 g001
Figure 2. (a) Refractive indices of the alumina suspension at different volume fractions from 1% to 20%. (b) Reflectance as a function of the scattering angle at different refractive indices of 1.336 ( η = 0.01 ) and 1.419 ( η = 0.20 ) with the critical angles of 48.4 and 44.8 .
Applsci 12 01190 g002
Figure 3. Fraction of the alumina particle size based on the reference [49].
Applsci 12 01190 g003
Figure 4. Scattering properties calculated from the DST for aqueous alumina suspensions at different volume fractions. (a) Scattering and reduced scattering coefficients and (b) anisotropy factor.
Applsci 12 01190 g004
Figure 5. Normalized phase functions calculated from the DST with the scattering angle at different volume fractions of (a) 1% ( g = 0.046 ) and (b) 20% ( g = 0.003 ). The results using the Rayleigh theory and the Henyey–Greenstein type are compared.
Applsci 12 01190 g005
Figure 6. (a,b) Fluence rates calculated from the PDE at different positions for the volume fractions of (a) 1% and (b) 20%. The analytical solutions (ASs) of the PDE (Equation (4)) for the infinite slab and semi–infinite medium are compared with the numerical solutions (NSs). The results are normalized by the values at the SC distance of 1.25 cm ( ( z , l ) = ( 1.25 , 0 ) ). The relative differences (RDs) between the NS and AS for the infinite slab are plotted in the each figure’s bottom. (c) Mean absolute percentage difference (MAPD), D Φ ( N , P ; A , P ) (Equation (8)), at different volume fractions.
Applsci 12 01190 g006
Figure 7. (a,b) Fluence rates calculated from the RTE at different positions for the volume fractions of (a) 1% ( g = 0.046 ) and (b) 20% ( g = 0.003 ). The AS of the RTE (Equation (6)) for the infinite slab and semi–infinite medium are compared. (c) MAPD, D Φ ( N , R ; A , R ) , between NS and AS for the RTE at different volume fractions. The other details are the same as Figure 6.
Applsci 12 01190 g007
Figure 8. (a,b) Fluence rates calculated from the RTE and PDE at different positions. The RDs in the numerical results between the RTE and PDE are plotted in each figure’s bottom. (c) MAPD, D Φ ( N , R ; N , P ) , between the RTE and PDE at different volume fractions. The other details are the same as Figure 6.
Applsci 12 01190 g008
Publisher’s Note: MDPI stays neutral with regard to jurisdictional claims in published maps and institutional affiliations.

