
A Grade Identification Method of Critical Node in Urban Road Network Based on Multi-Attribute Evaluation Correction


1
School of Civil and Transportation Engineering, Hebei University of Technology, Tianjin 300401, China
2
Key Laboratory of Earthquake Engineering and Engineering Vibration, Institute of Engineering Mechanics, China Earthquake Administration, Harbin 150080, China
3
Institute of Earthquake Resistances and Disaster Reduction, Beijing University of Technology, Beijing 100124, China
*
Author to whom correspondence should be addressed.
Appl. Sci. 2022, 12(2), 813; https://doi.org/10.3390/app12020813
Submission received: 1 November 2021
/
Revised: 5 January 2022
/
Accepted: 11 January 2022
/
Published: 13 January 2022
(This article belongs to the Topic Intelligent Transportation Systems)
Abstract
:Accurately identifying the key nodes of the road network and focusing on its management and control is an important means to improve the robustness and invulnerability of the road network. In this paper, a classification and identification method of key nodes in urban road networks based on multi-attribute evaluation and modification was proposed. Firstly, the emergency function guarantee grade of road network nodes was divided by comprehensively considering the importance of road network nodes, the consequences of failure, and the degree of difficulty of recovery. The evaluation indexes were selected according to the local attributes, global attributes, and functional attributes of the road network topology. The spatial distribution patterns of the evaluation indexes of the nodes were analyzed. The dynamic classification method was used to cluster the attributes of the road network nodes, and the TOPSIS method was used to comprehensively evaluate the importance ranking of the road network nodes. Attribute clustering of road network nodes by dynamic classification method (DT) and the TOPSIS method was used to comprehensively evaluate the ranking of the importance of road network nodes. Then, combined with the modification of the comprehensive evaluation and ranking of the importance of the road network nodes, the emergency function support classification results of the road network nodes were obtained. Finally, the method was applied to the road network within the second Ring Road of Beijing. It was compared with the clustering method of self-organizing competitive neural networks. The results show that this method can identify the key nodes of the road network more accurately. The first-grade key nodes are all located at the more important intersections on expressways and trunk roads. The spatial distribution pattern shows a “center-edge” pattern, and the important traffic corridors of the road network show a “five vertical and five horizontal” pattern.
1. Introduction
An urban road network is a complex network composed of a large number of nodes (intersections) and road segments. It not only ensures the daily life of residents and visitors and industrial production but also supports key issues such as post-event rescue and evacuation, material allocation, and so on. However, the components of the road network are closely related, and the overall distribution range is wide. It is easily affected by unexpected events such as natural events, man-made events, traffic accidents, etc., which lead to the degradation of some key node functions, the decline of local road capacity or congestion, and even the paralysis of the road network due to the effect of cascade failure [1,2]. Previous studies show that as long as 5% or 10% of the important nodes fail at the same time, the whole network will be paralyzed [3]. Therefore, the research on the identification and classification of the key nodes in the urban road network is of great significance to the management and control of the key nodes of the road network, the layout of emergency resources, improving the invulnerability and reliability of the road network, and ensuring the safe and effective operation of the road network after the events.
At present, scholars at home and abroad have done a lot of research on the identification of key nodes of road networks from different angles, and their methods are basically derived from graph theory and data mining based on graph theory. The difference of nodes is reflected by mining the important attribute information of nodes [4,5]. For example, node connectivity [6,7], betweenness [8,9], aggregation coefficient [10], eigenvector [11,12], and so on are all measures of network topology attributes [13]. But the traffic dynamics characteristics of the nodes in the road network are not reflected with these indicators. Therefore, some scholars have proposed to use node peak-hour traffic flow (the traffic volume in the hour of the day when the traffic volume is at its peak) [14], traffic load degree (the ratio of the actual traffic density of the road to the density under the maximum capacity) [15], flow ratio (the ratio of traffic flow to planning and design traffic flow at a certain time), and saturation (ratio of maximum traffic volume to maximum capacity) [1,2] to characterize the traffic operation characteristics of the road network. Because it is difficult for a single index to accurately reflect the importance of road network nodes as a whole [16,17], a multi-index comprehensive identification method has gradually emerged to reflect the importance of road network nodes from different angles [14,15,16,17,18], but too many indicators will also increase the complexity of calculation. Some methods need to determine the classification parameters in advance, and seldom consider the correlation between indicators, which affects the rationality and credibility of the results. For example, the FCM clustering method [14], self-organizing competition neural network clustering method [15], and adaptive clustering method [19] are all divided by a certain clustering function according to the characteristics of the data field. These methods are suitable for large-grained network cluster structures. The network of core and periphery structures can only be roughly divided, and there may be one-sidedness according to a certain clustering function [19]. In addition, some multi-index comprehensive evaluation methods, such as grey relationship method (GRA) [20], principal component analysis (PCA) [21], cosine similarity method (CSM) [22], TOPSIS method [17,18], and so on, take into account the correlation information between indicators, and only the order of node importance can be given. However, they require an artificial hierarchy of importance. The classification and grading results are highly subjective. The problems such as spatial heterogeneity of road networks are not taken into account. A detailed description of these methods is shown in Table 1.
Furthermore, reliable traffic measurements and traffic monitoring to prevent network congestion and to prevent the depletion of the capacity of nodes in the transport network are very important. Some scholars have proposed traffic flow monitoring or prediction methods for road network nodes under emergencies [23,24,25,26]. In addition, many scholars have carried out research on traffic emergency disposal measures and methods under urban road network emergencies [27,28,29,30]. Therefore, given the above problems, this paper comprehensively considered the structural characteristics and traffic functional characteristics of the urban road network and constructed the attribute index of complex road network node recognition from three aspects: local attribute, global attribute, and functional attribute. The classification and identification model of key nodes in the operation period of the urban road network was constructed by combining TOPSIS (approximate ideal solution sorting method) and DT (dynamic classification method). A grade identification method of the critical node in an urban road network is proposed based on multi-attribute evaluation correction. That is, using the multi-attribute assessment method to modify dynamic clustering results. And then the final node grade is obtained based on the corrected classification results. Finally, a road network example was analyzed and verified.
2. Materials and Methods
2.1. Attribute Analysis and Quantitative Index of Road Network Node
The urban road network is composed of intersections and road segments. If the intersection is abstracted as a node and the road is abstracted as the edge of the connecting node, the road network can be abstracted as a complex network. Previous research shows that the urban road traffic network is a scale-free network, and it has the characteristics of a small world [31]. Therefore, the urban complex road network model based on complex network theory can express the connection between roads more accurately, which is helpful to analyze the structure and functional characteristics of road networks [32].
2.1.1. Characteristic Index of Complex Road Networks
To comprehensively reveal the characteristics of the complex network structure of urban roads, the evaluation indexes of nodes are selected from the local attributes and global attributes of the network, and the importance of nodes in the network is comprehensively evaluated. The local attribute of the node focuses on the evaluation of the local connection attribute of the node, and mainly analyzes the direct connection state between the nodes, so the degree of the node is selected as the evaluation index; The global attribute of the node focuses on the global topology evaluation, which reflects the importance of the node in the whole network, so the betweenness of the node is selected as the evaluation index.
- Local attribute—degree index
The node degree is the number of edges connected to the node in the road network topology. It indicates the ability of a node to establish direct contact with neighboring nodes in the network or the complexity of the connection in the network [32]. The node degree is only a local feature of the network, so the index is one-sided. Although some important “core nodes” do not have a large degree of connectivity, they play an important connecting role in the whole road network. Therefore, from the local properties of the network, the higher the degree index, the more important the node. But from a global point of view, the importance of nodes with the same degree index is not necessarily the same [17]. It can be seen that there are limitations in evaluating the importance of road network nodes with a single index.
To reflect the physical information of the connected edges of the road network, the connected edges are weighted according to the road grade. Then the weight of the node is defined as the sum of the edge weights connected to the node [15]. According to the standard of road grade of the urban road network, it is divided into four grades: expressway, trunk road, secondary trunk road, and branch road, with weights of 10, 8, 5, and 3, respectively.
- Global attribute-Intermediate Index
The betweenness of nodes refers to the ratio of the number of shortest paths of a node to the number of all shortest paths, reflecting the importance of nodes in the path selection of the whole network [32]. The betweenness value of any node is defined as
wherein, is the number of shortest paths from node s to t. is the number of shortest paths through node v between pairs of nodes s and t.
2.1.2. Functional Index of Complex Road Networks
The urban road network is a dynamic distribution network with a traffic load, and the key nodes often have obvious flow and path aggregation [14,15]. Considering the traffic flow characteristics, the traffic load of the node can be selected as the evaluation index. Kerner and Rehborn proposed to use three-phase traffic flow theory to analyze the characteristics of traffic flow in the road network, and the real-time traffic flow is divided into three types of phases: free flow, steady flow, and blocking flow [33]. On the other hand, the traffic flow is divided into four operating states in Baidu maps [34]: serious congestion, congestion, slow running, and smooth flow, which are represented by four colors, namely: crimson, light red, yellow, and green, with weights of 2, 1, 0.8, and 0.6, respectively, to represent the traffic load on the road [32].
The traffic flow of a node is determined by the flow of the road connected to it, and the traffic load of the intersection can be characterized by the sum of the traffic load of the road connected to the intersection. There are m nodes connected to node I, (i + a) is the (i + a)th node connected to node i, a = 1, 2, …, m; is the load value of the road between node i and i + a, then the traffic load of any node i is defined as
2.2. Grade Division of Emergency Function of Road Network Nodes
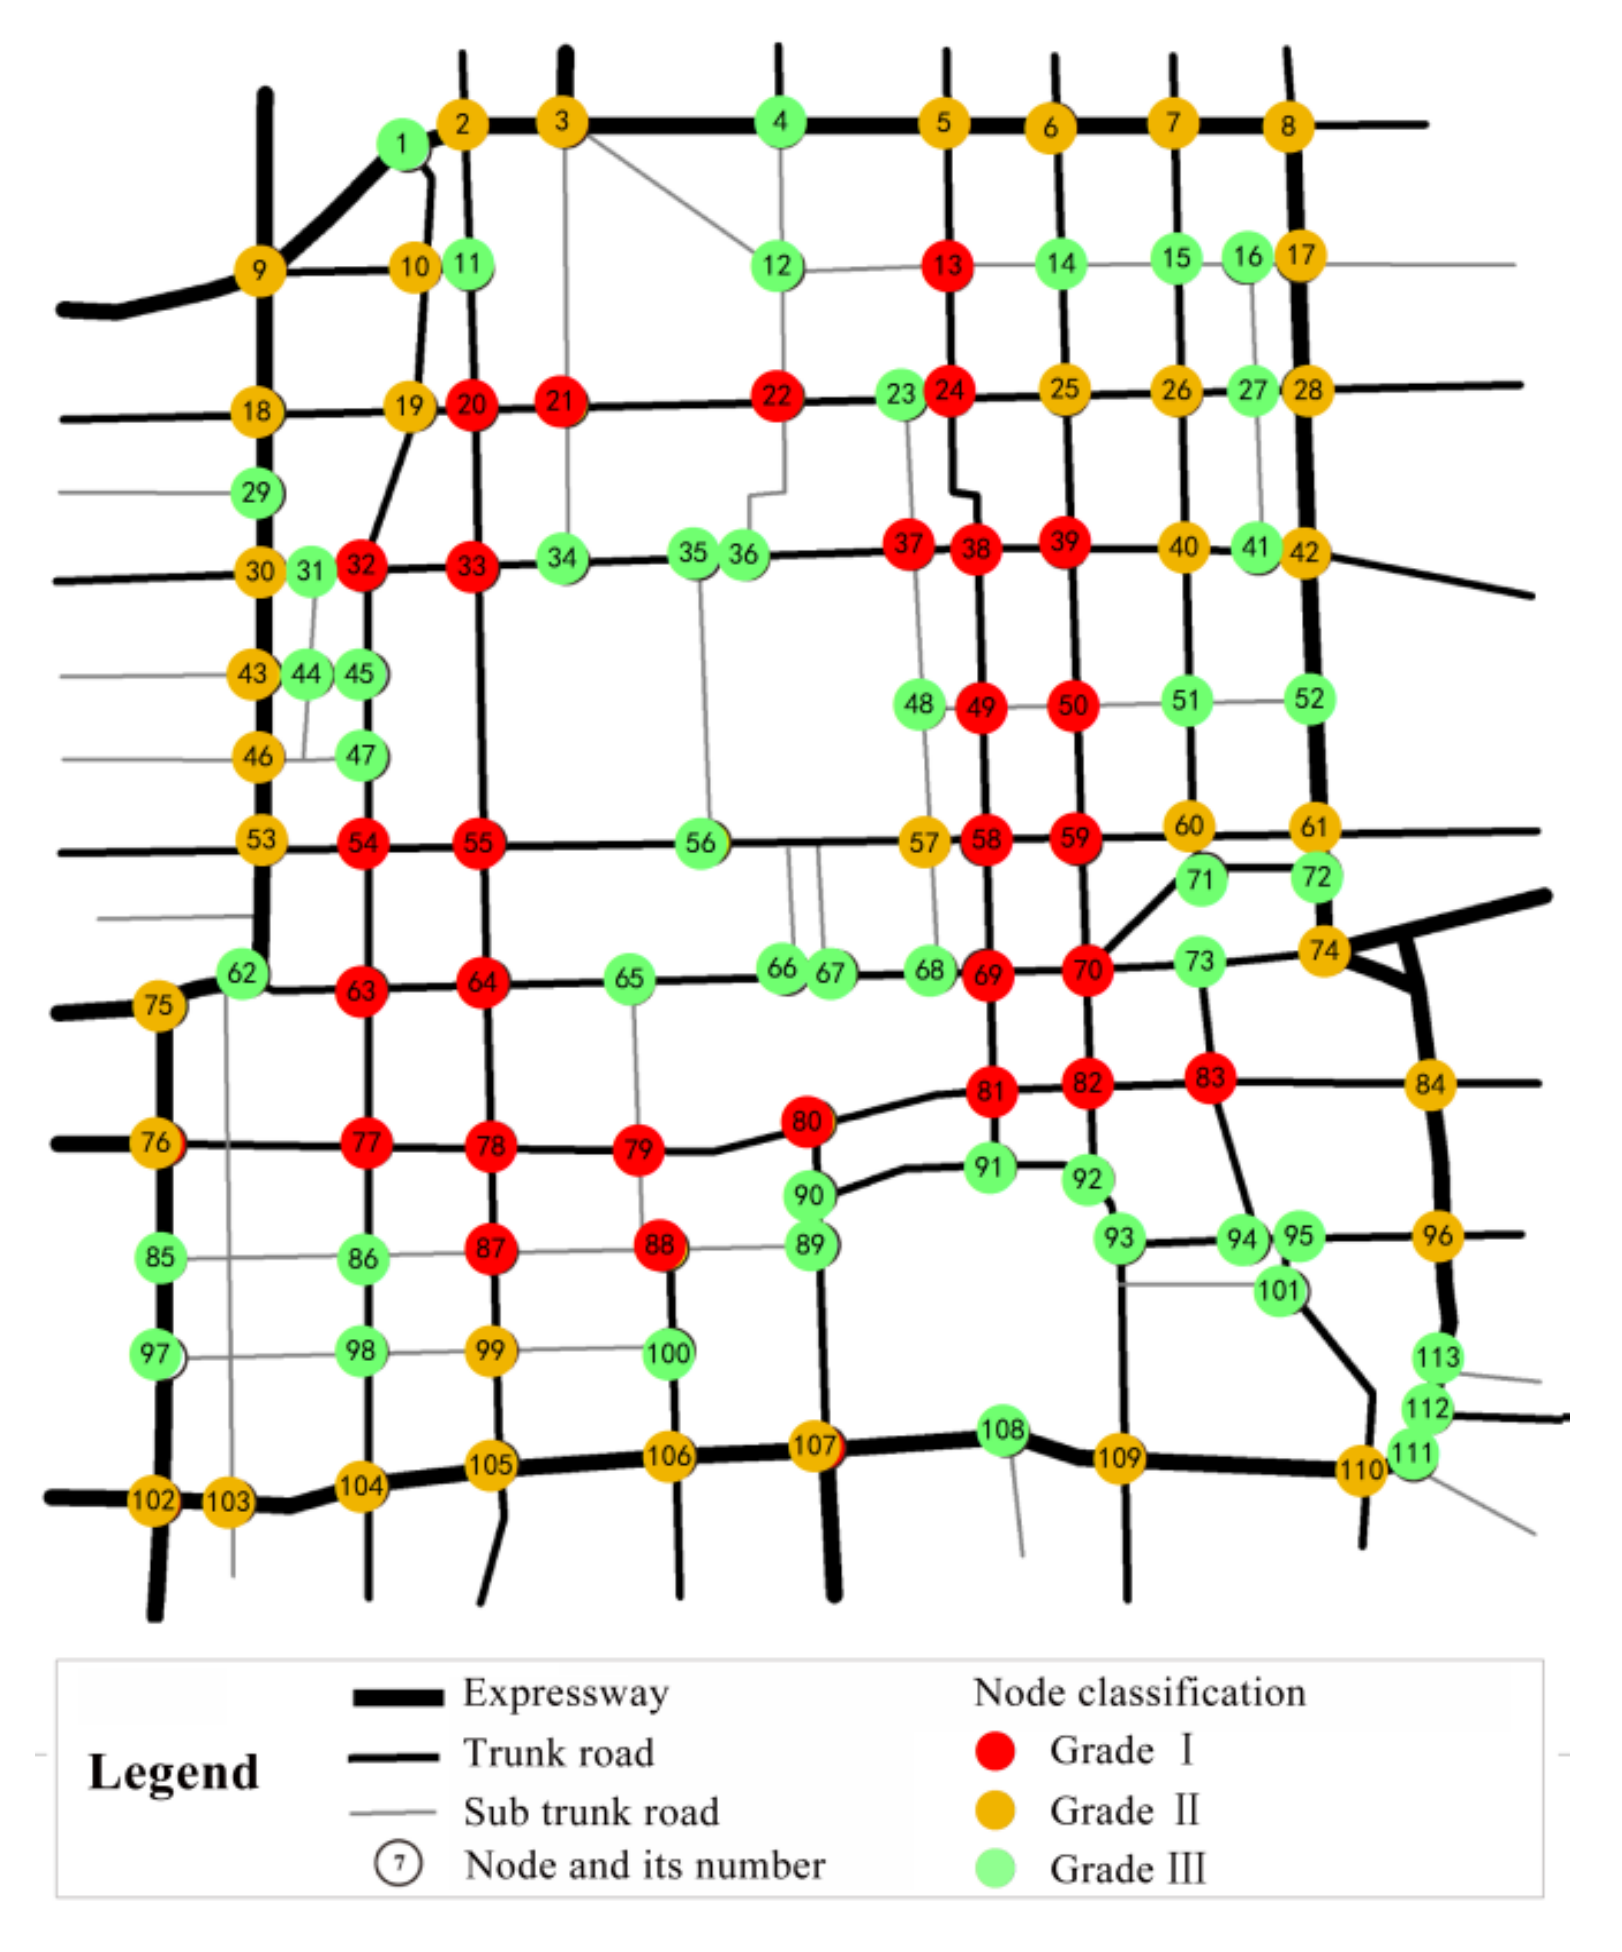
Due to the heterogeneity of urban road network structure, the importance of each node in the road network is different [35]. The interaction between urban land use and traffic is complex, which will also lead to different importance of traffic network nodes [36,37]. Therefore, the status and grade of nodes in the whole road network system are also different. Moreover, after the function failure of different nodes, the scope and scale of influence on the overall situation and the degree of difficulty of self-recovery are different. Therefore, the nodes in the urban road network should be graded and differentiated for emergency management. In this paper, according to the network characteristics, functional characteristics, functional failure consequences, and other factors, the emergency function guarantee grade of nodes in the road network is divided into three grades, that is, Grade I, Grade II, and Grade III. The basic requirements for emergency functions are shown in Table 2.
The comprehensive importance degree of the node is obtained by integrating the multi-attribute indexes of the road network node. Coupled with the DT method, the nodes are dynamically classified. The internal relationship between the road network node and the emergency function guarantee grade is established, and then the emergency guarantee strategies based on different grades of nodes are made.
2.3. Classification and Identification Model of Key Nodes in Road Network
2.3.1. Ranking of Node Comprehensive Importance
A comprehensive evaluation is the use of various evaluation indicators, the use of weight integration method to obtain the comprehensive evaluation value of the evaluation object, and then get the ranking of the evaluation object. The identification of key nodes belongs to the problem of multi-attribute decision-making, which regards each node in the road network as an independent individual and uses multiple evaluation indicators to couple to calculate the node importance, and sorts the nodes according to the node importance value. Therefore, the importance of road network nodes is evaluated by the TOPSIS method [17,18], and the key nodes of the road network are identified.
- (1)
- Construct decision matrix. Suppose there are n nodes in the road network, and each node corresponds to k evaluation indexes. Then the node-set V = {v1, …, vn}, indicator set X = {x1, …, xk}, if the jth index value of node i is marked as vi (xj), then the decision matrix isStandardize the decision matrix, which is recorded as R = (rij)n×k. Herein, rij = vi(xj)/vi(xj)max (For benefit index) or rij = vi(xj)min/vi(xj) (For cost index), vi(xj)max = max{vi(xj)|1 ≤ i ≤ n}, vi(xj)min = min{vi(xj)|1 ≤ I ≤ n}. Based on the standardized decision matrix R, the weight of the jth index of the node in the road network can be obtained by using the objective weighting method of information entropy [38], and expressed as wj(j = 1, …, k; ∑wj = 1). The weighted decision matrix can be obtained based on the weight vector W and decision matrix R.
- (2)
- Determine the ideal solution. The positive ideal decision solution I+ and the negative ideal decision solution I− can be calculated according to Equation (6).
- (3)
- Calculate the closeness degree. The closeness degree of each node Zi to the ideal solutions is calculated according to Equations (7)–(9). The node importance is sorted according to the size of the Zi.wherein, , is the distance from the solution Ii to the positive ideal solution I+ and the negative ideal solution I−.
2.3.2. Dynamic Clustering and Grading of Nodes
There are many nodes in the urban road network, and there are differences in the structure and function of different nodes, but the attributes of many nodes also have strong similarities [14]. Therefore, the similarity of node attributes is used to classify road network nodes. Based on the weighted decision matrix Y (see Equation (5)), the dynamic classification method (DT) [39] is used to analyze the clustering of road network nodes. The dynamic classification and identification of road network nodes are realized. The steps are as follows:
- (1)
- Determine the initial classification. If it is divided into class K, the initial classification of node i is as follows:wherein, TRUNC is the integral function, that is, taking integers for the values computed in the parentheses. , , .
- (2)
- Calculate the center of gravity for each class. The node has k attributes, and then there are k center of gravity values in each category. In class m, the center of gravity of the j attribute of the sample is
- (3)
- Calculate the distance from the center of gravity. Calculate the distance of each node to all kinds of the center of gravity, and update the node classification according to the nearest distance principle, and put the node into the closest class.wherein, is the distance from the node i to the center of gravity of the node-set of type m. is the new class to which the node i belongs.
- (4)
- Output iterative classification results. Iterative step (1)~(3) get the new center of gravity, and compare the difference between the center of gravity. If the accuracy requirement is met, the classification result will be output.
2.3.3. TOPSIS-DT Process
The key nodes of the urban road network are identified and classified by coupling the TOPSIS method and DT method, and the calculation flow is shown in Figure 1. The last step of the method in the flow diagram of the TOPSIS-DT method is the final classification results of nodes by coupling sorting and clustering results. The final results are obtained through the evaluation value and clustering result, and modifying the clustering results according to evaluation value.
3. Case Application and Analysis
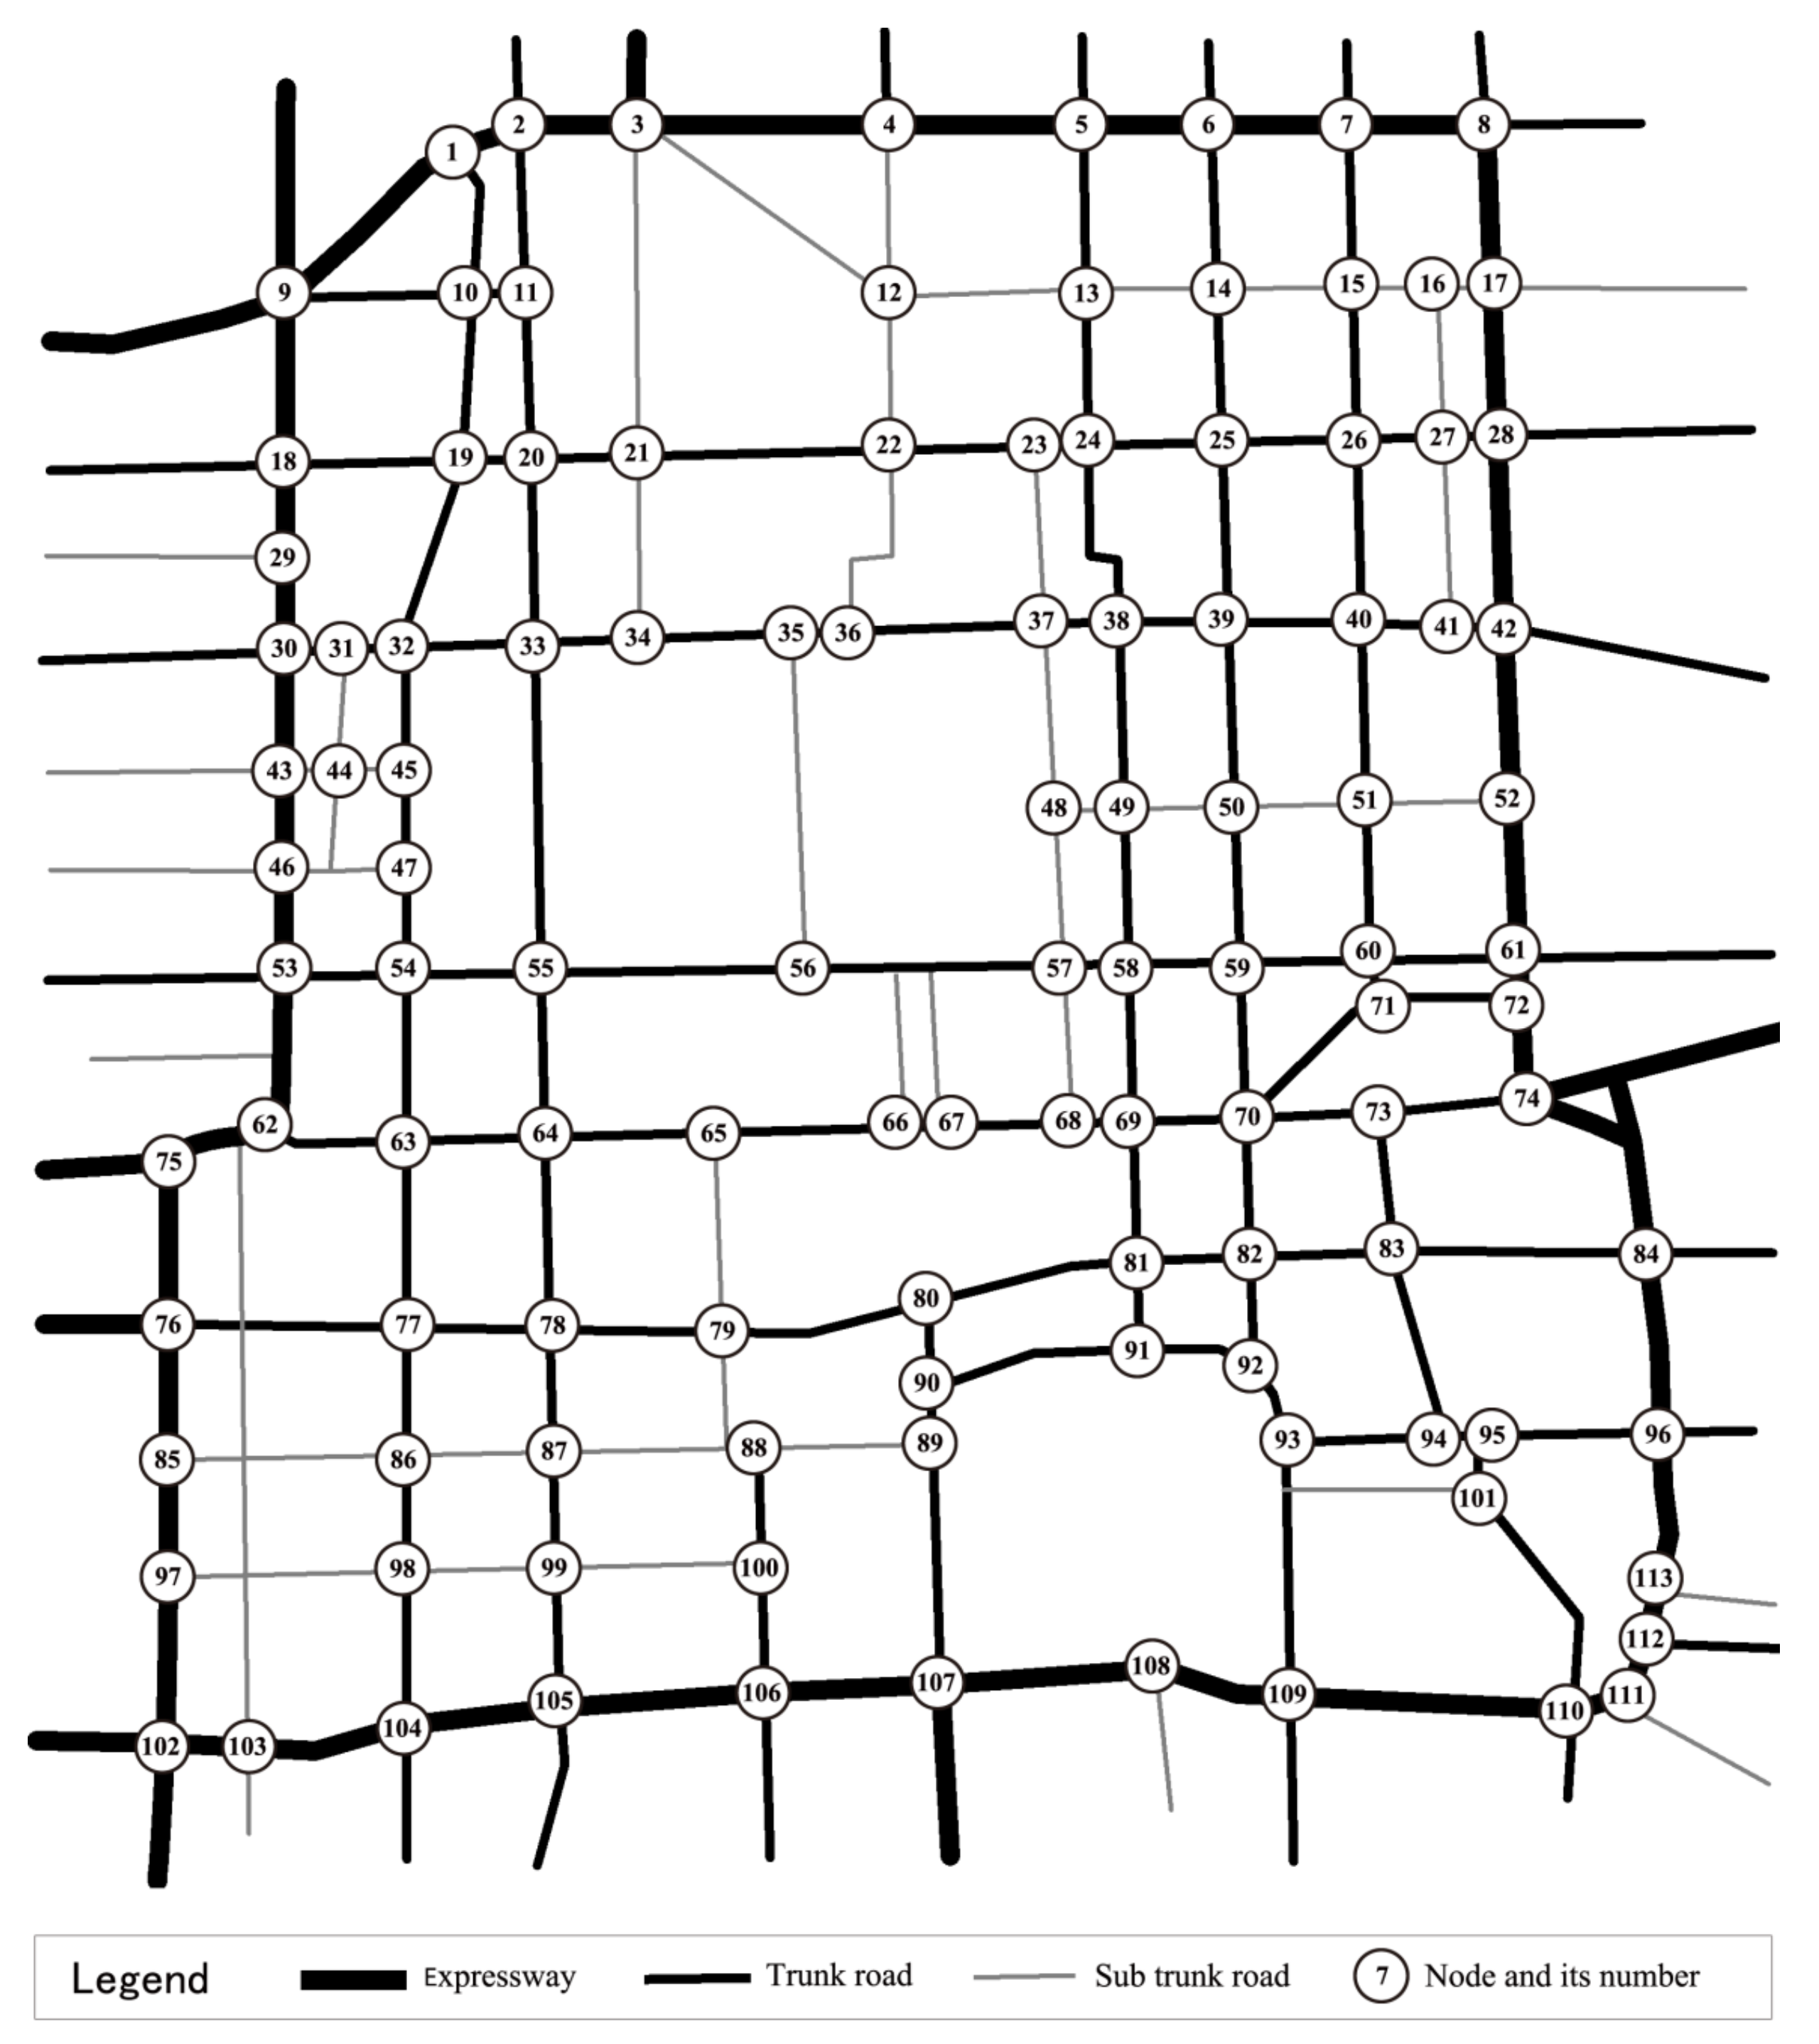
The regional road network in the second Ring Road of Beijing was taken as an example, shown in Figure 2. Road network and nodes outside the second Ring Road were not considered. This model was used to evaluate the importance of 113 nodes in the road network. The classification and sorting of all the nodes were obtained based on the importance of nodes for the hierarchical control of the key nodes in the road network. Figure 3 is the topology diagram of the road network in the study area. The node is the intersection and the edge is the road segment. The roads in the area include expressways, trunk roads, secondary trunk roads, and branch roads.
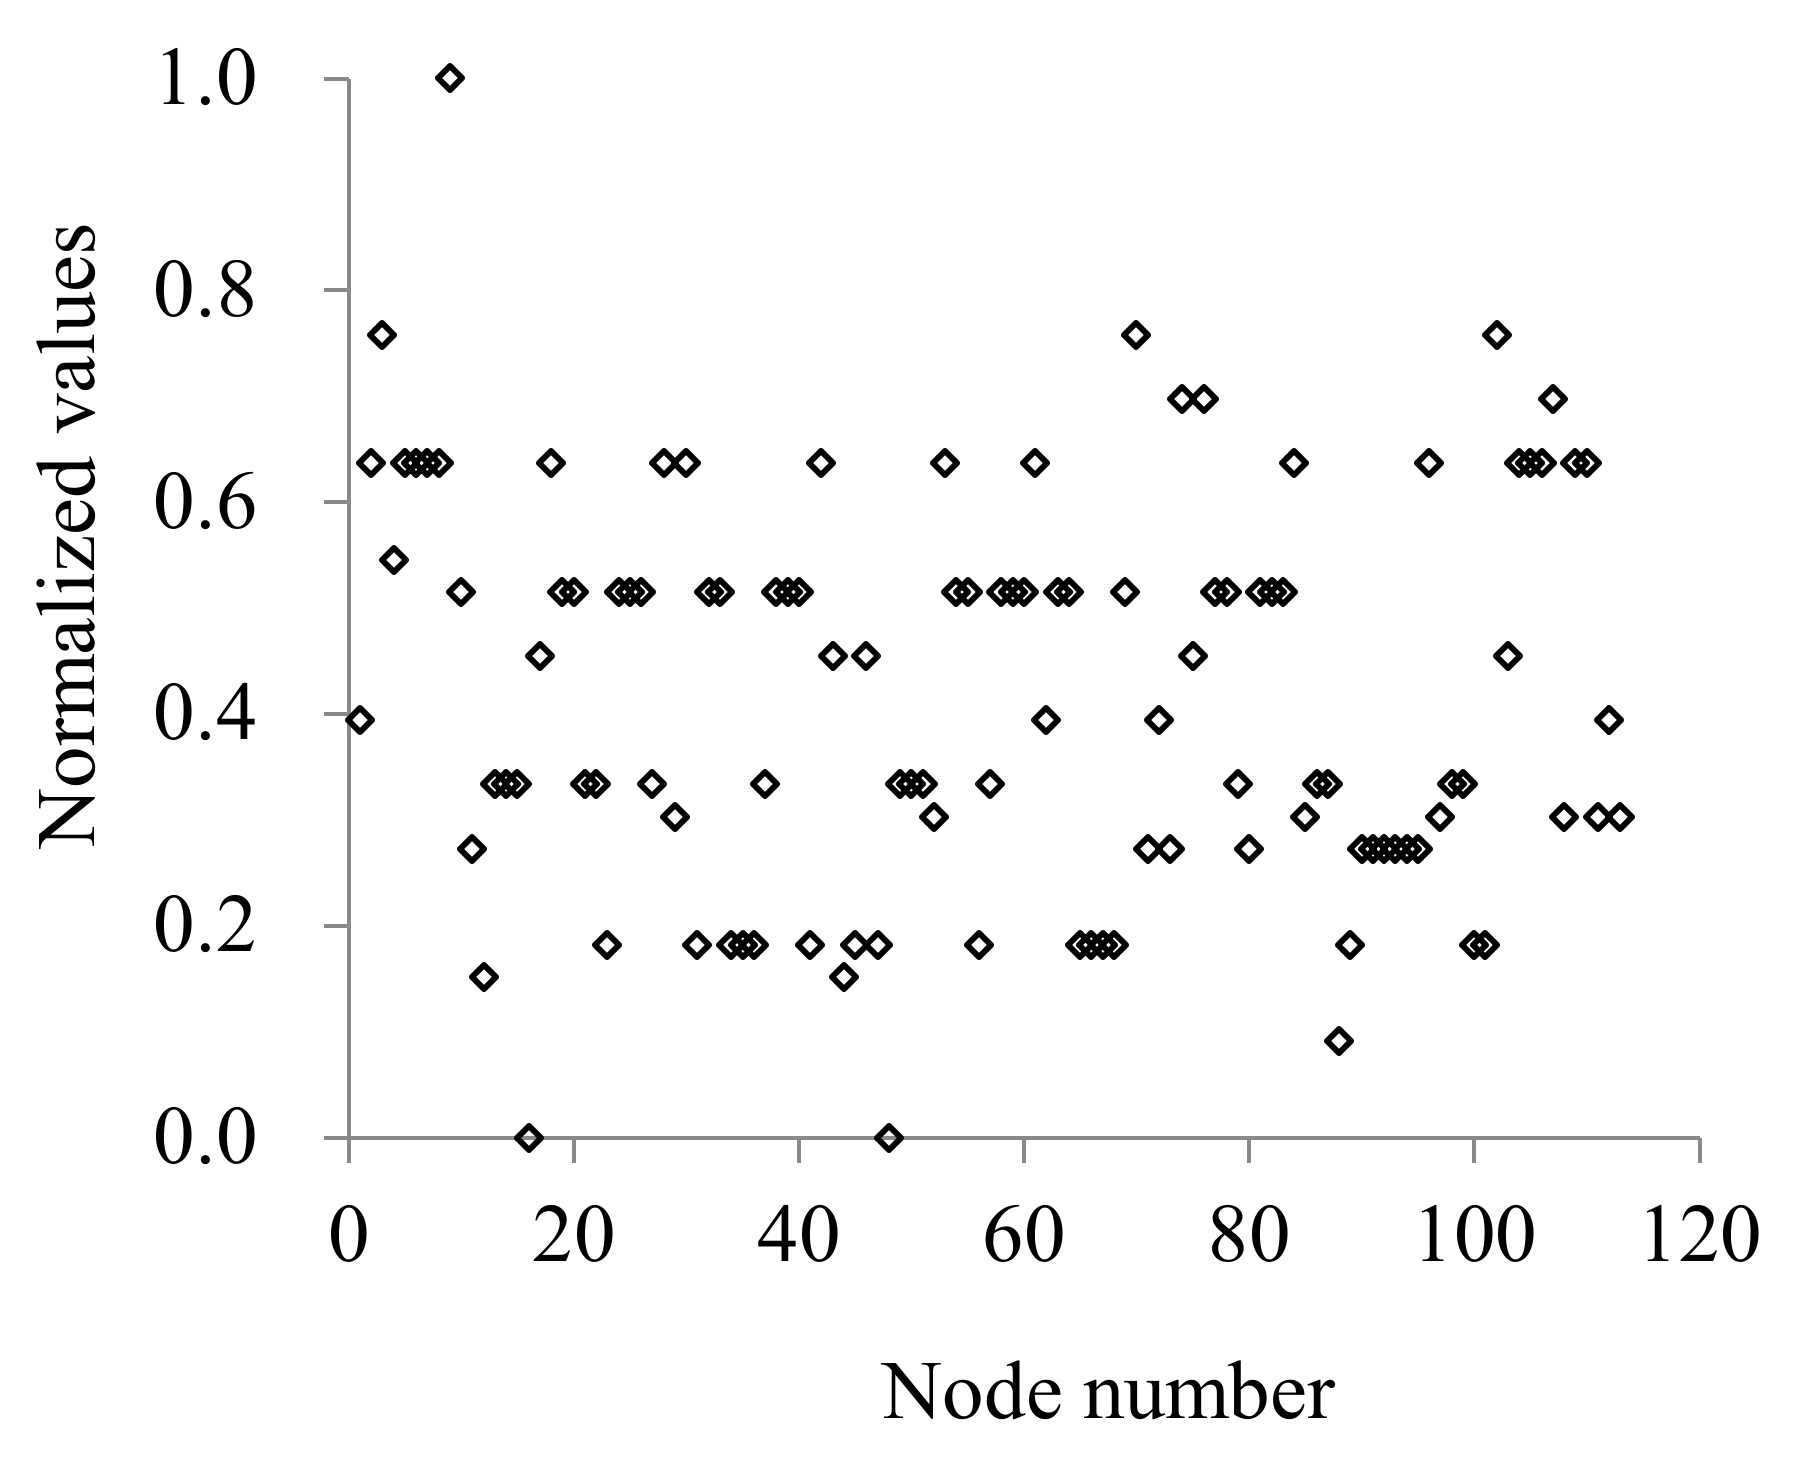
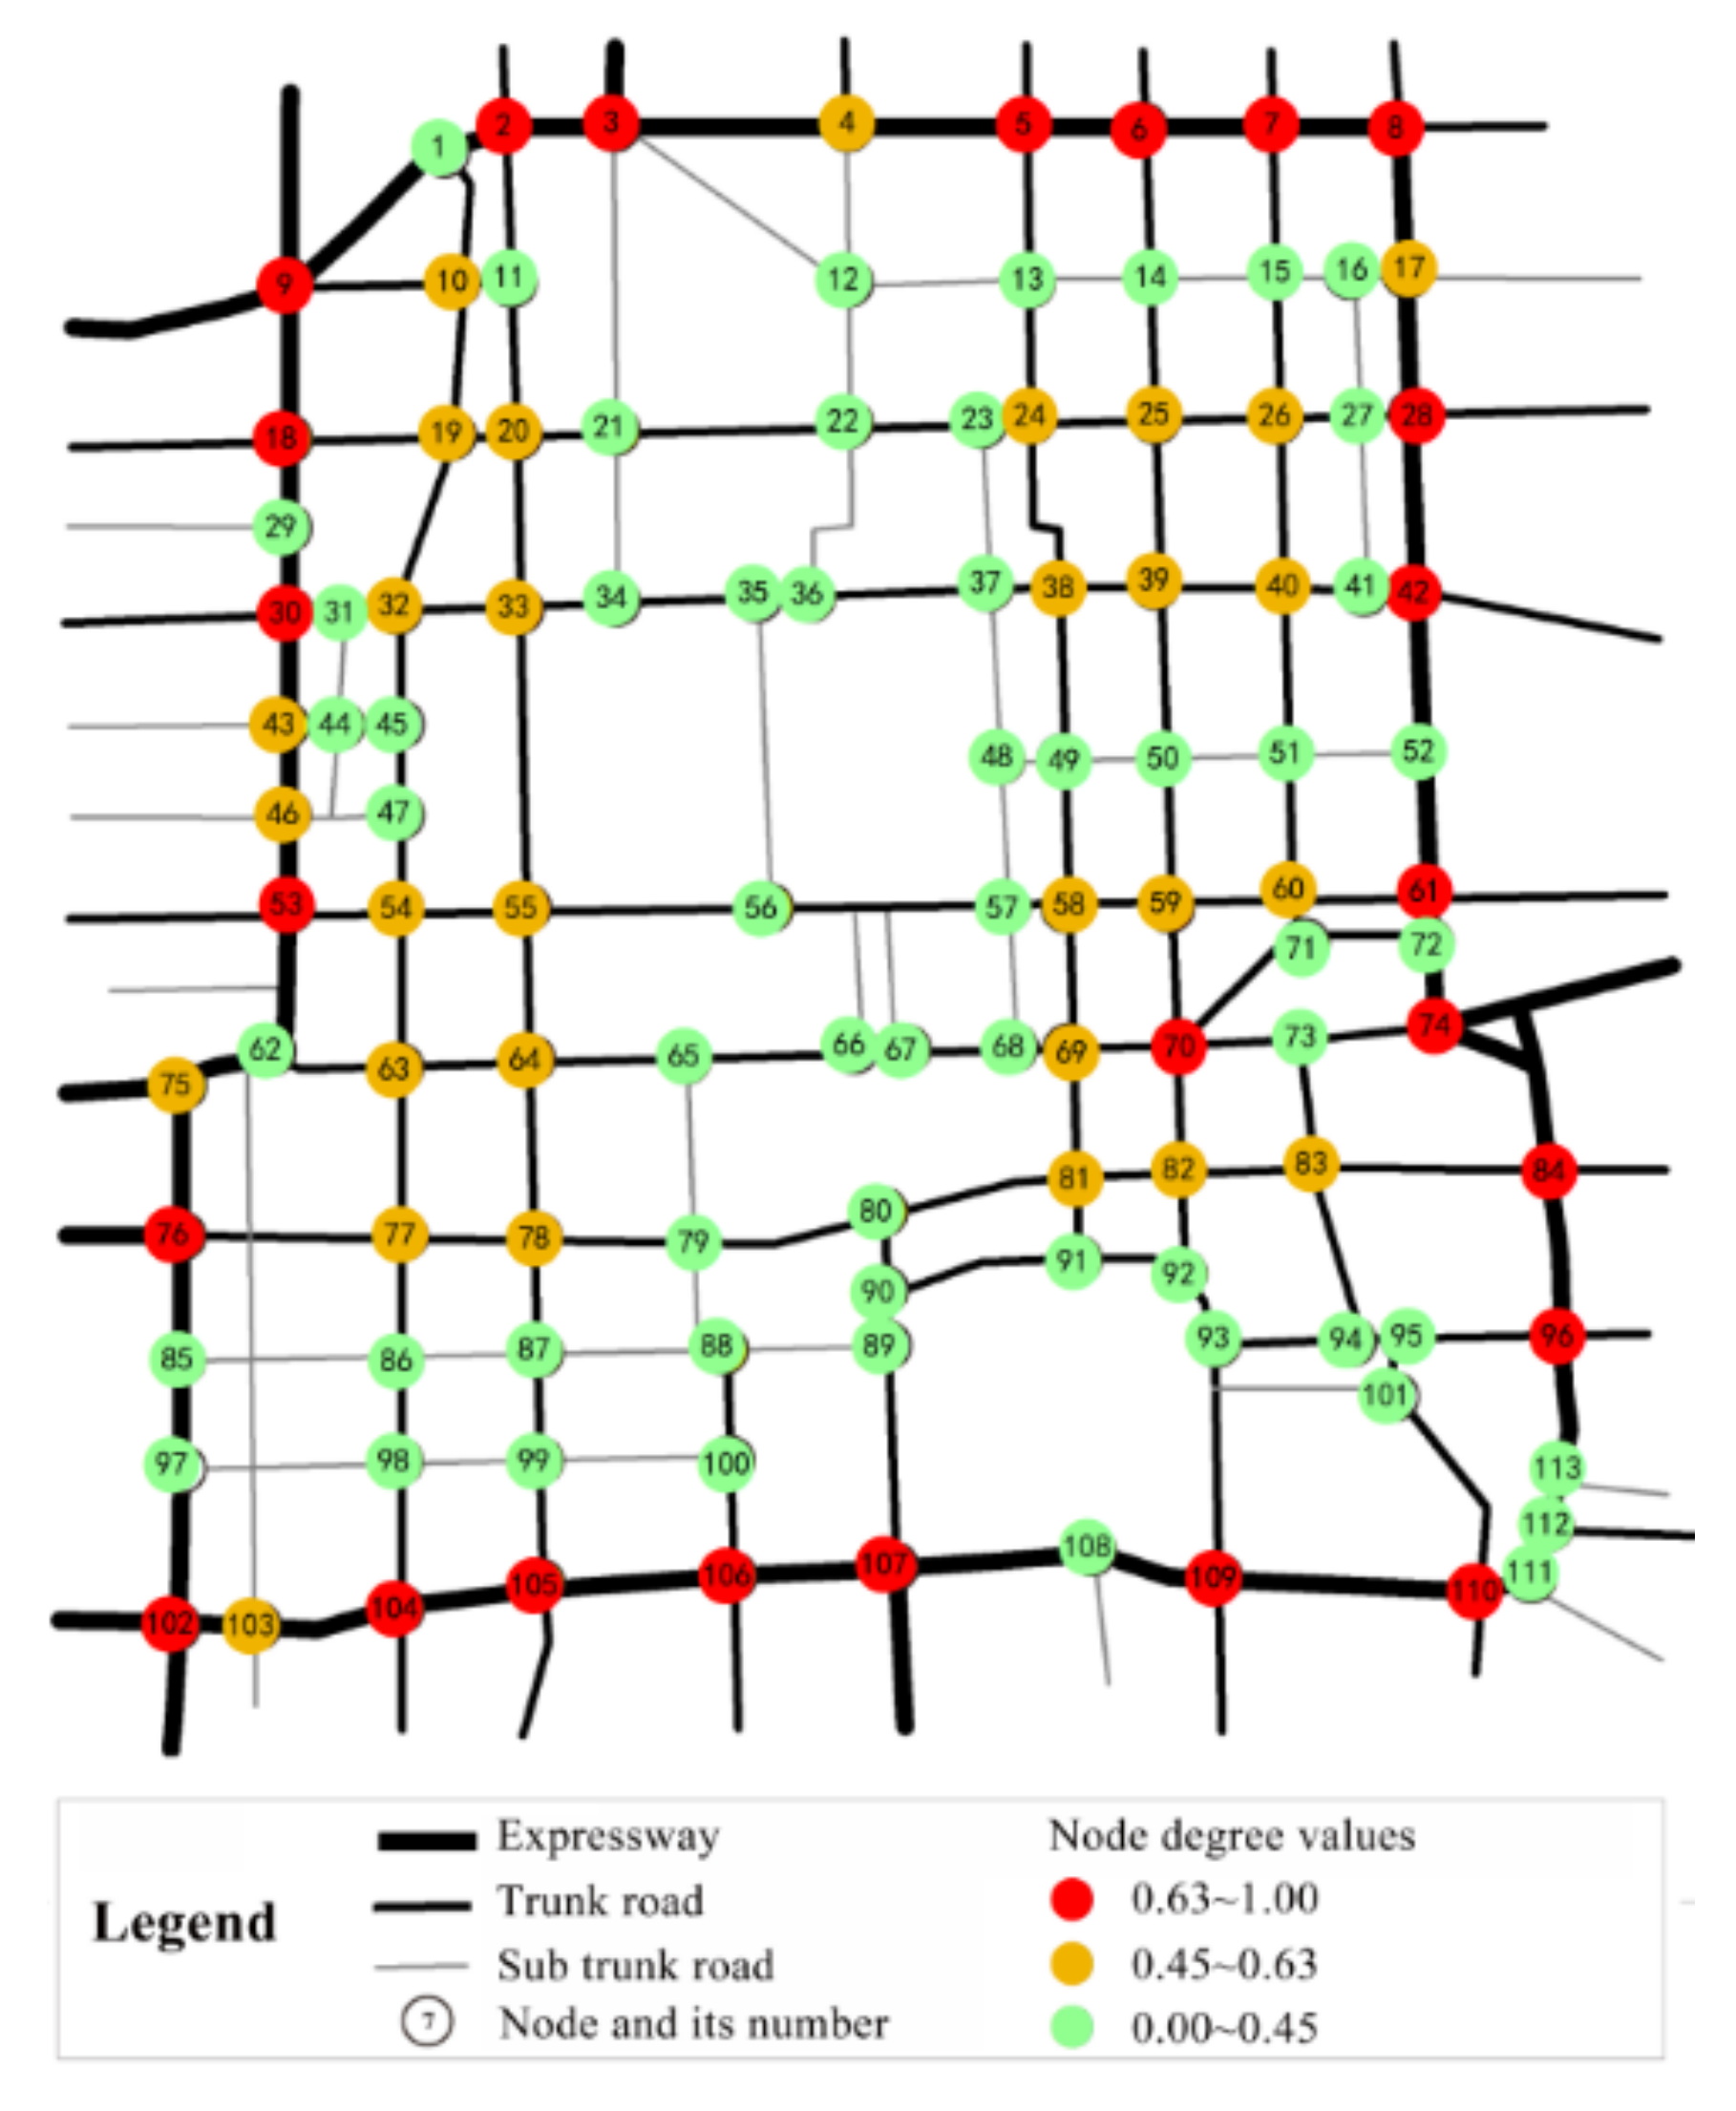
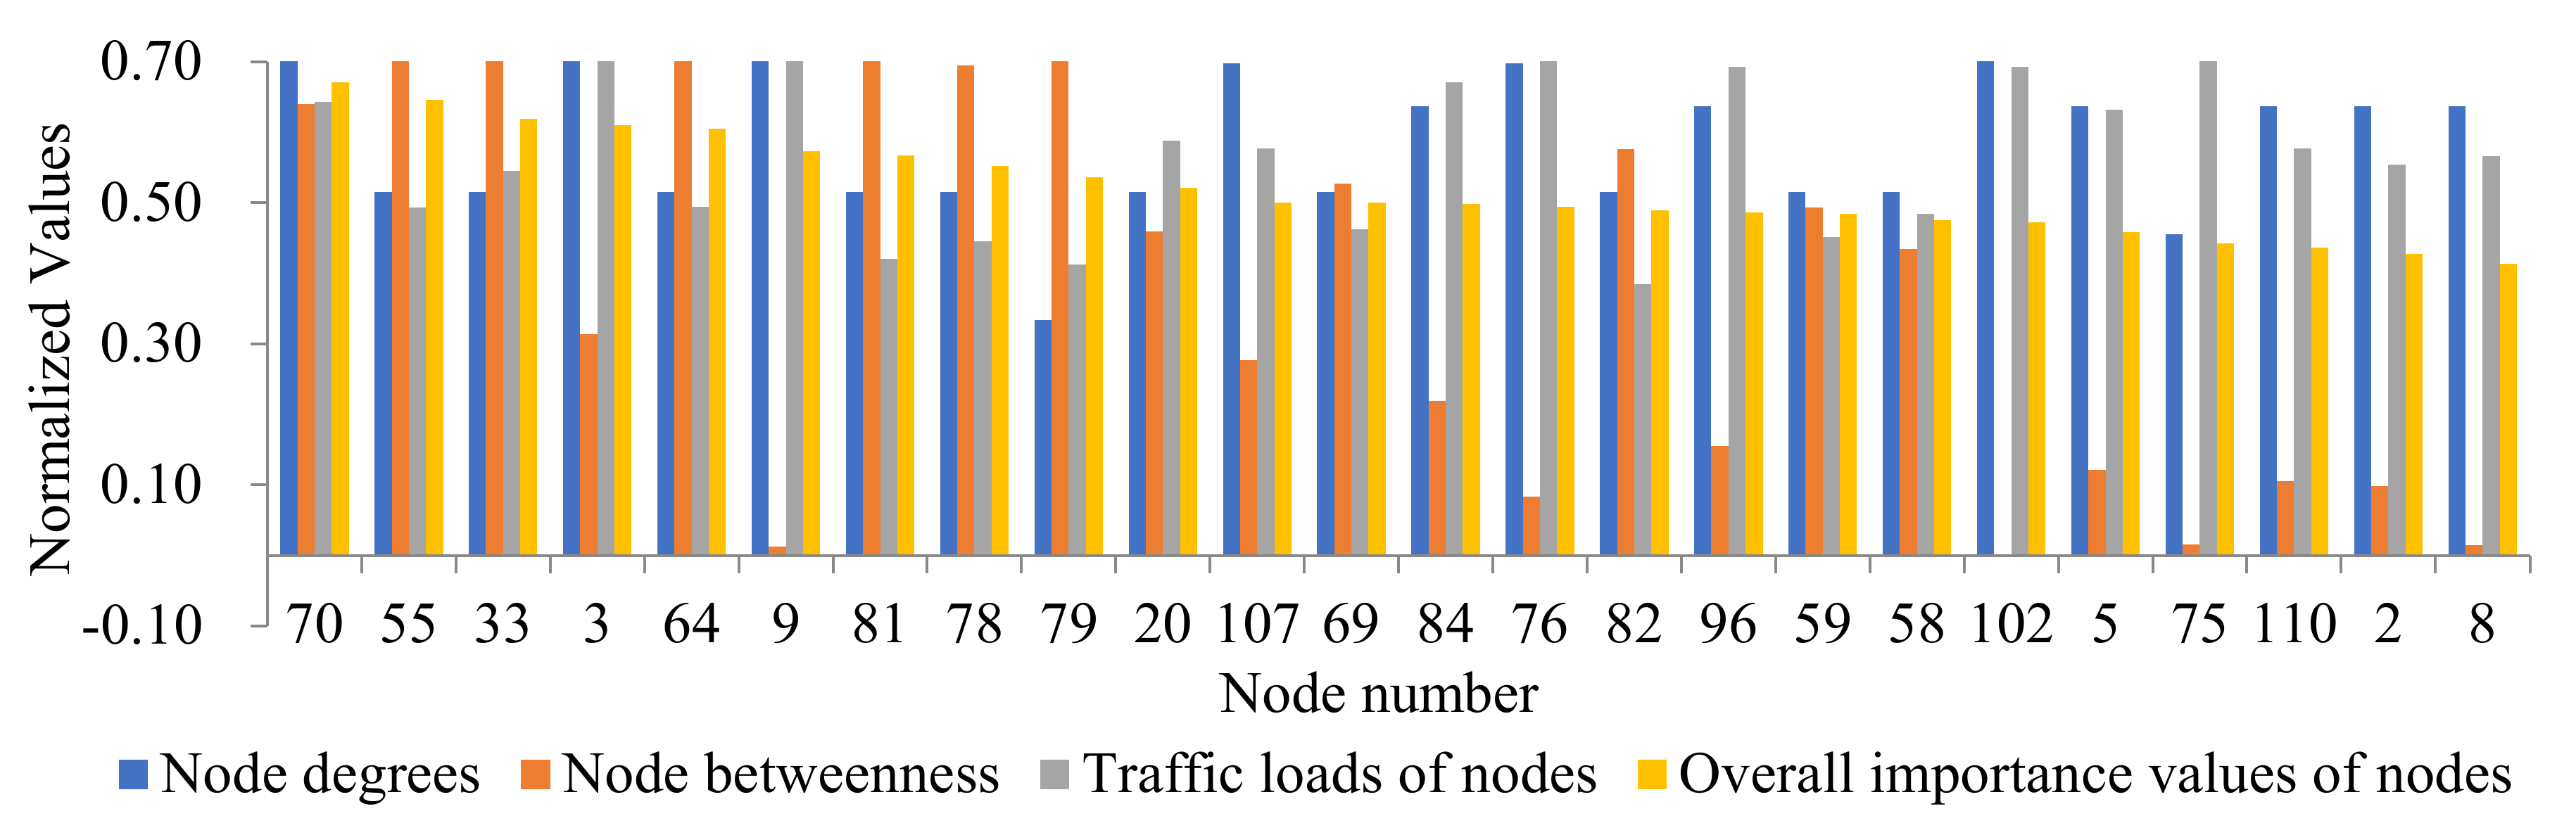
According to the abstract diagram of the road network shown in Figure 3, the topological adjacency matrix of the road network was established based on graph theory. The weighted connection degree of the node could be calculated with the method of road grade weighting. The scatter diagram after standardization was shown in Figure 4. To identify the spatial characteristics of the weighting connection degree of road network nodes more intuitively, the weighted connection degree of road network nodes was divided into three grades according to the natural breakpoint classification, and its spatial distribution was shown in Figure 5. The results show that the spatial distribution of the weighted connection degree values of nodes presents certain differentiation. The nodes with high connection degree (the standard value of weighted connection degree is greater than 0.63) are basically evenly distributed on the expressways, accounting for 22% of all the nodes in the whole road network, indicating that the connection grade of the peripheral expressways is relatively high. The nodes with moderate connection degree (the standard value of weighted connection degree is greater than OR equal to 0.45, but less than 0.63) are distributed on the trunk roads on the east and west sides of the whole road network. Most of them are intersections between the trunk roads, and it accounts for about 27% of all the nodes. The nodes with low connection degree are (the standard value of weighted connection degree is less than 0.63) are mostly distributed on the secondary trunk roads, accounting for about 51% of all the nodes in the whole road network. It can be seen that the distribution of nodes with weighted connection degree in the whole road network generally shows the structure of “peripheral high connectivity degree-central low connectivity degree”. If the key nodes are identified according to the high weighted connection degree of the nodes, most of the key nodes are on the expressways in the road network.
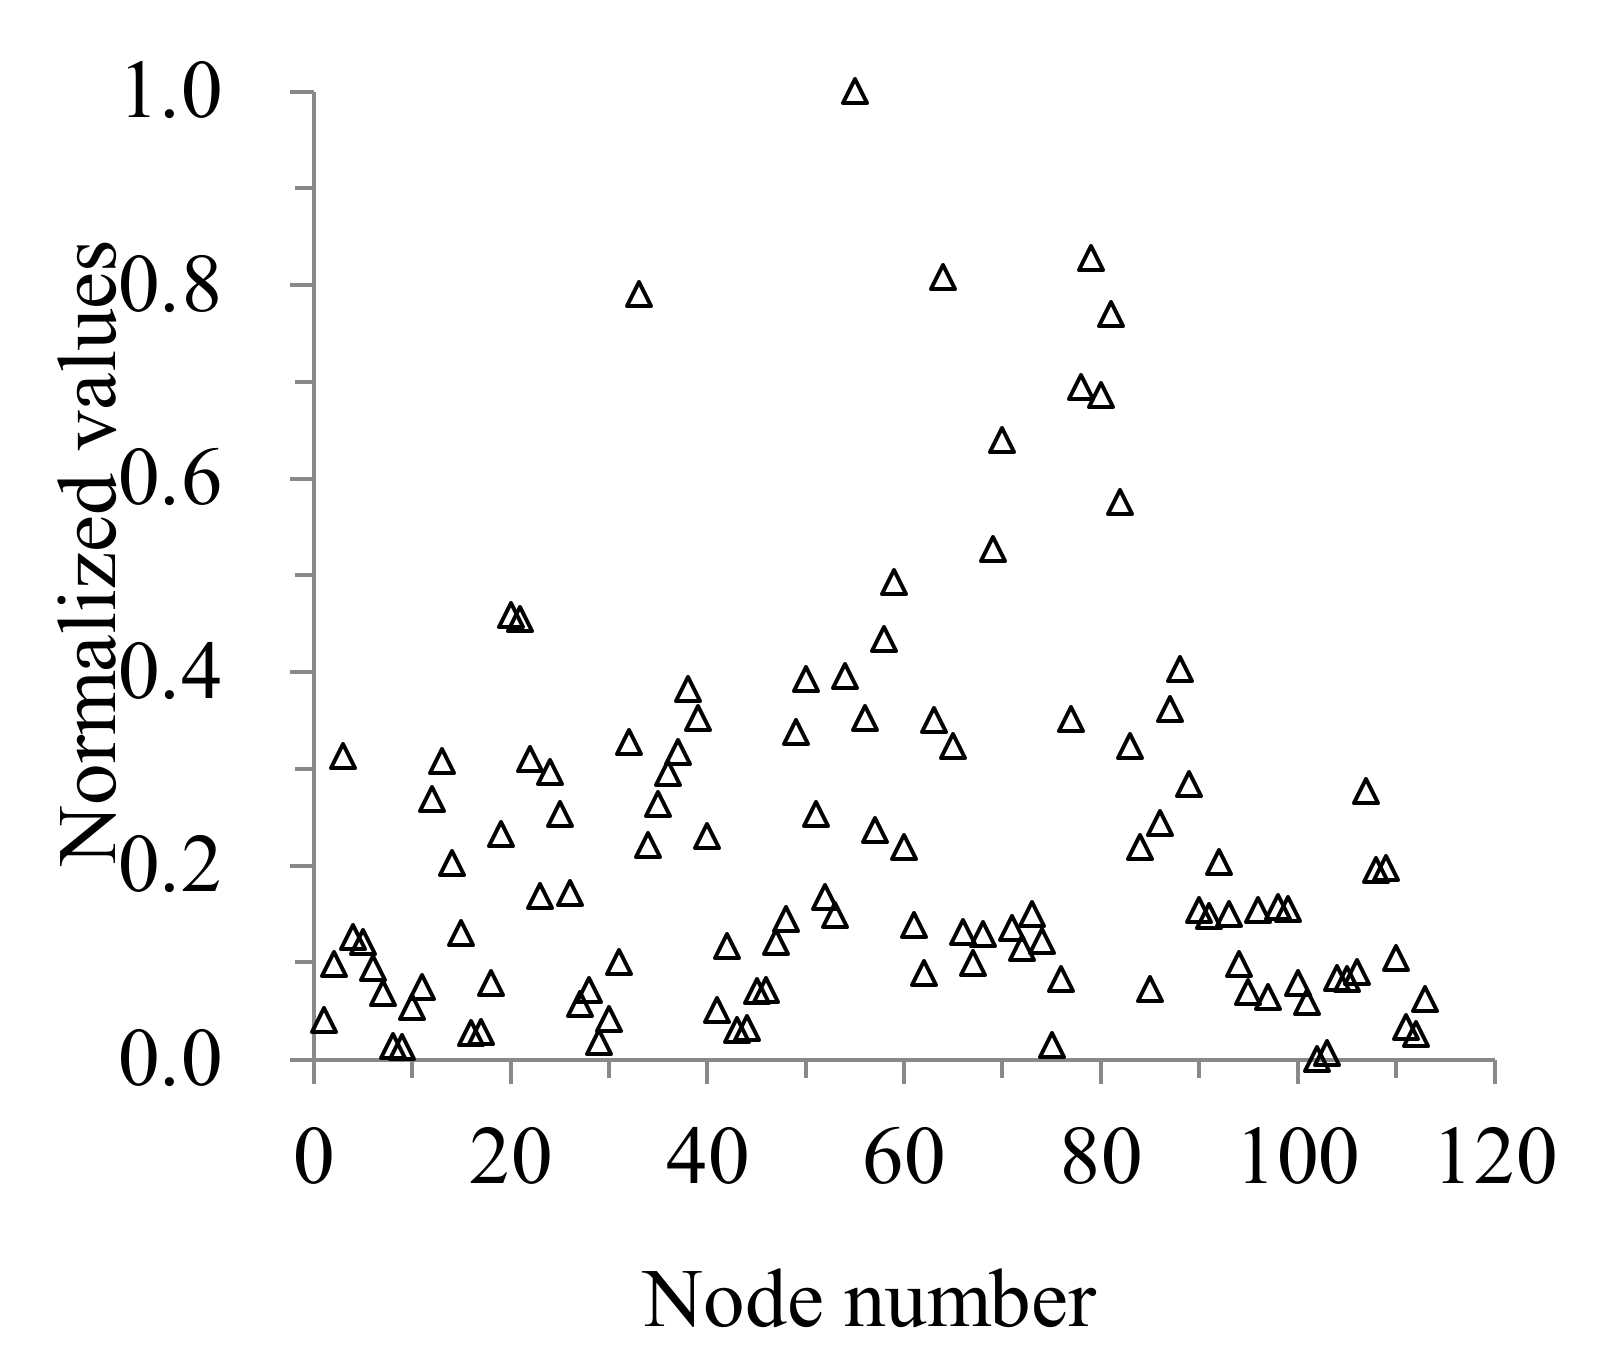
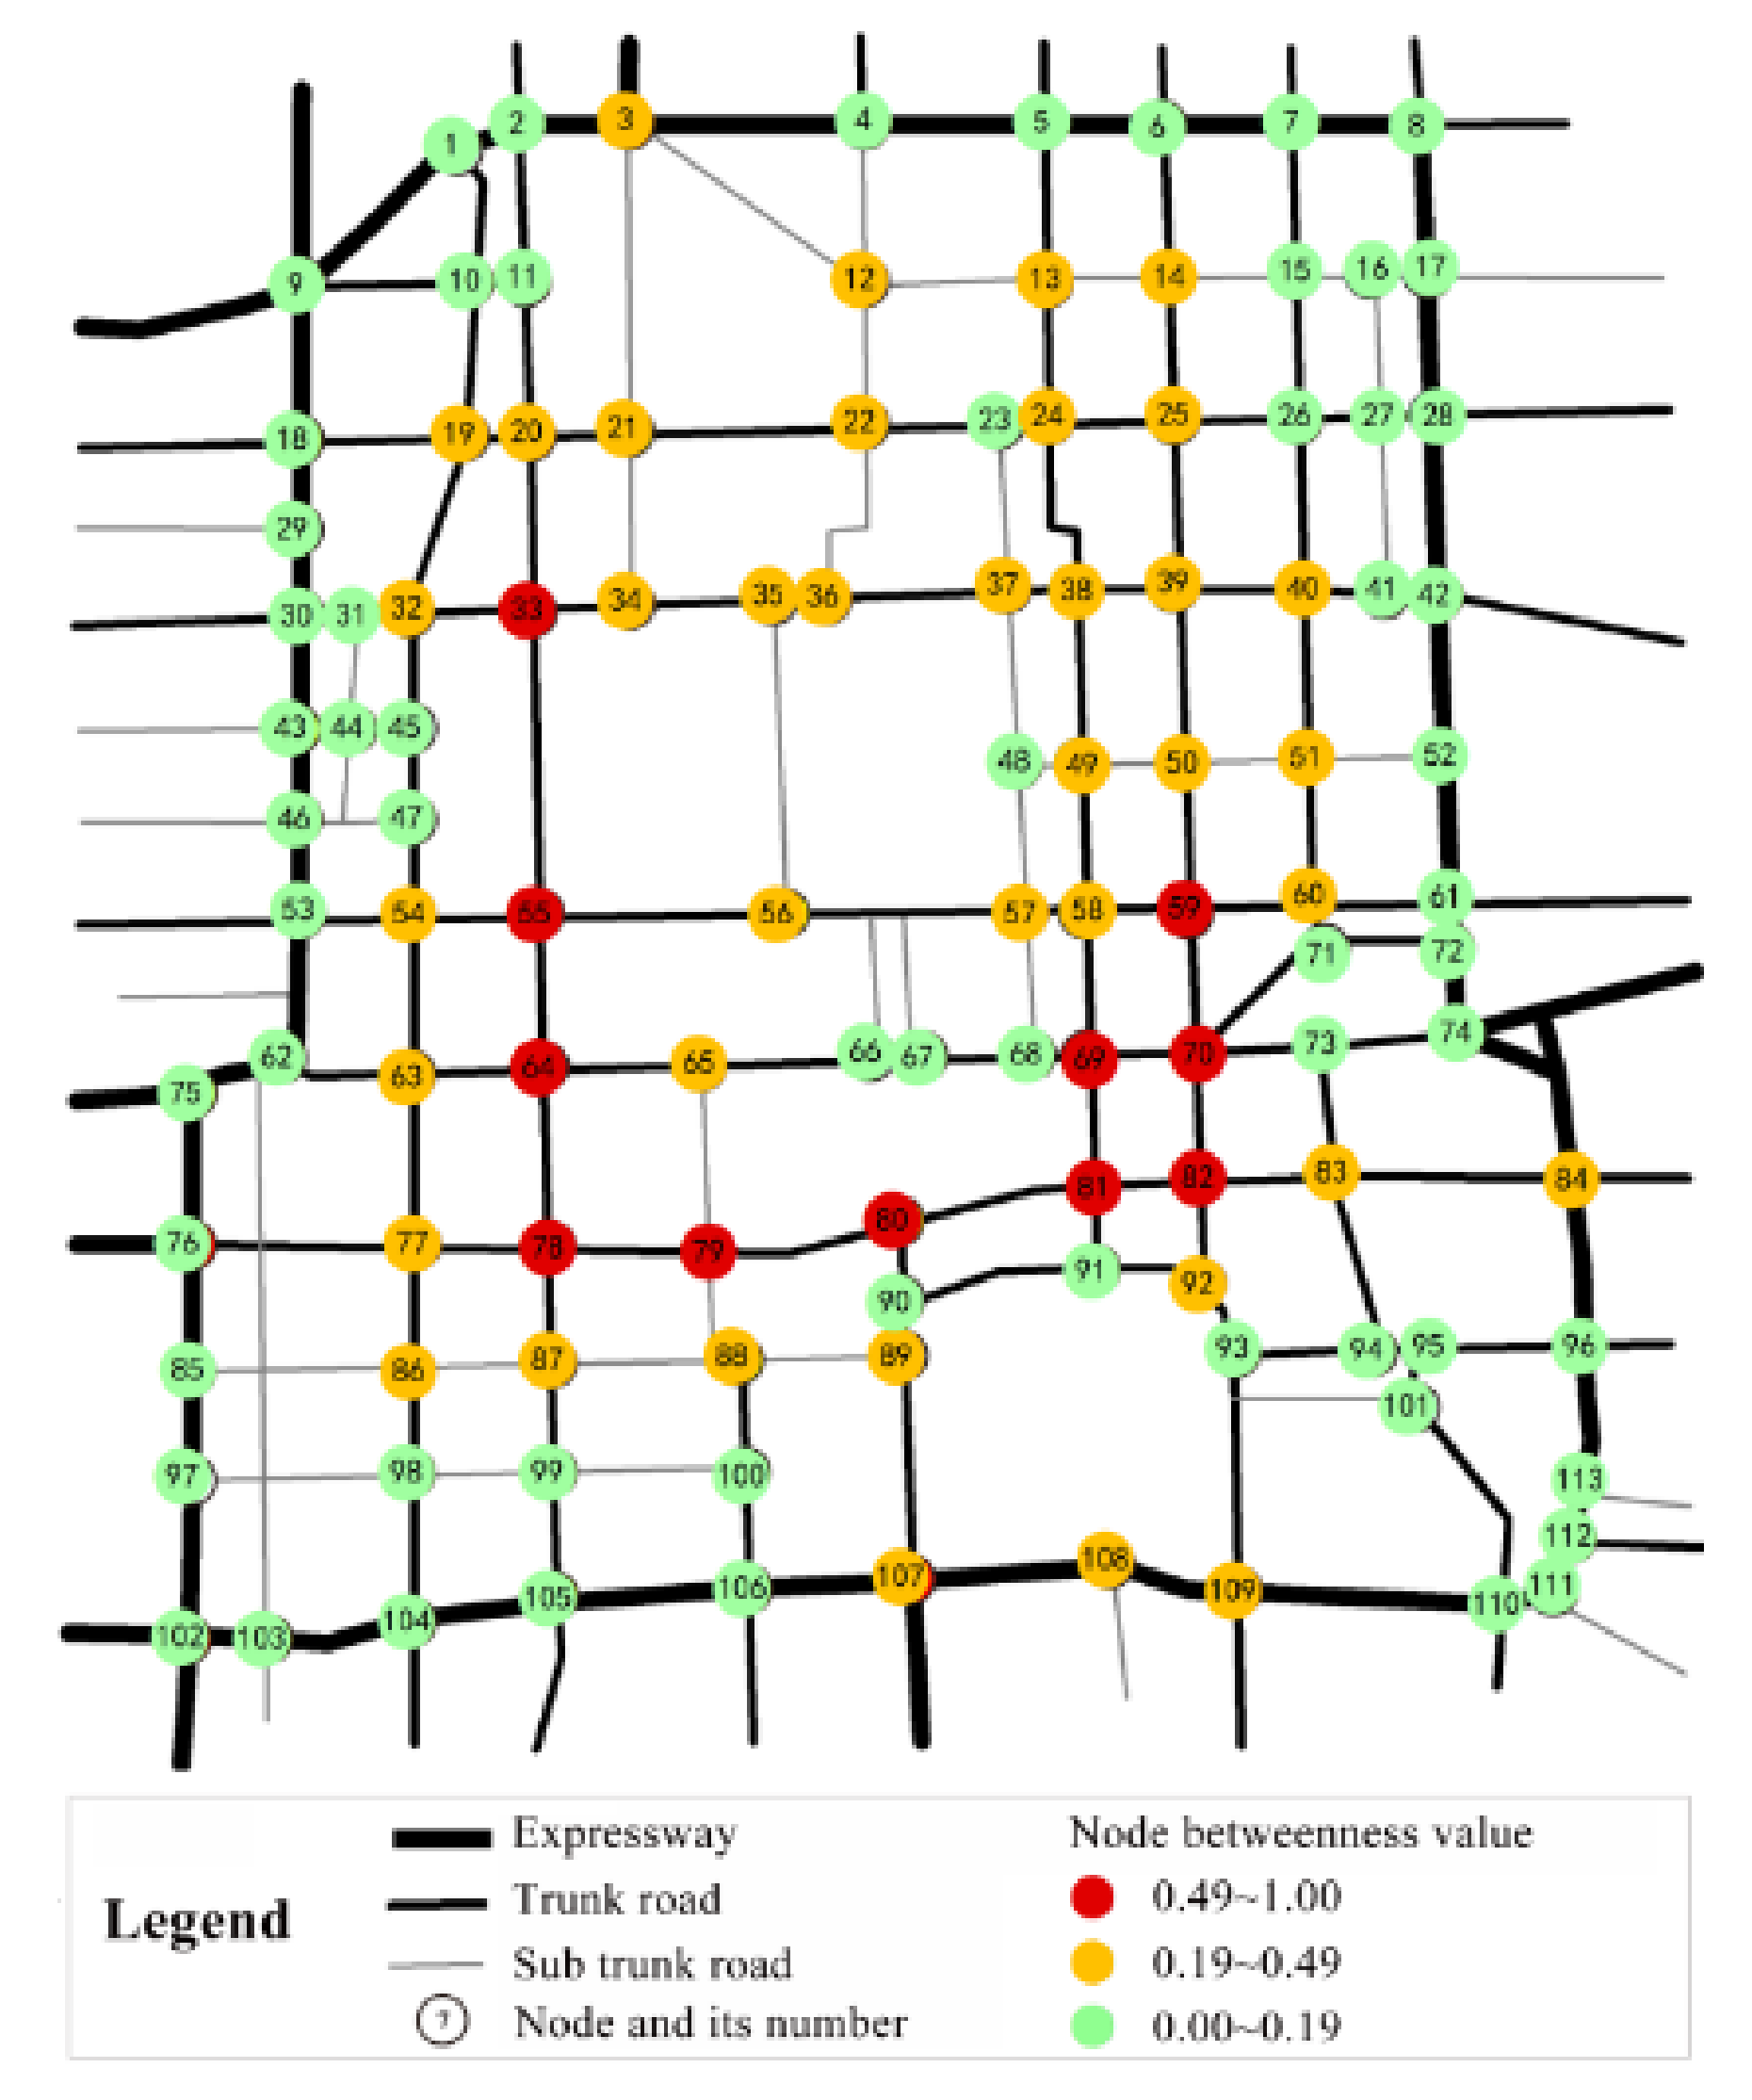
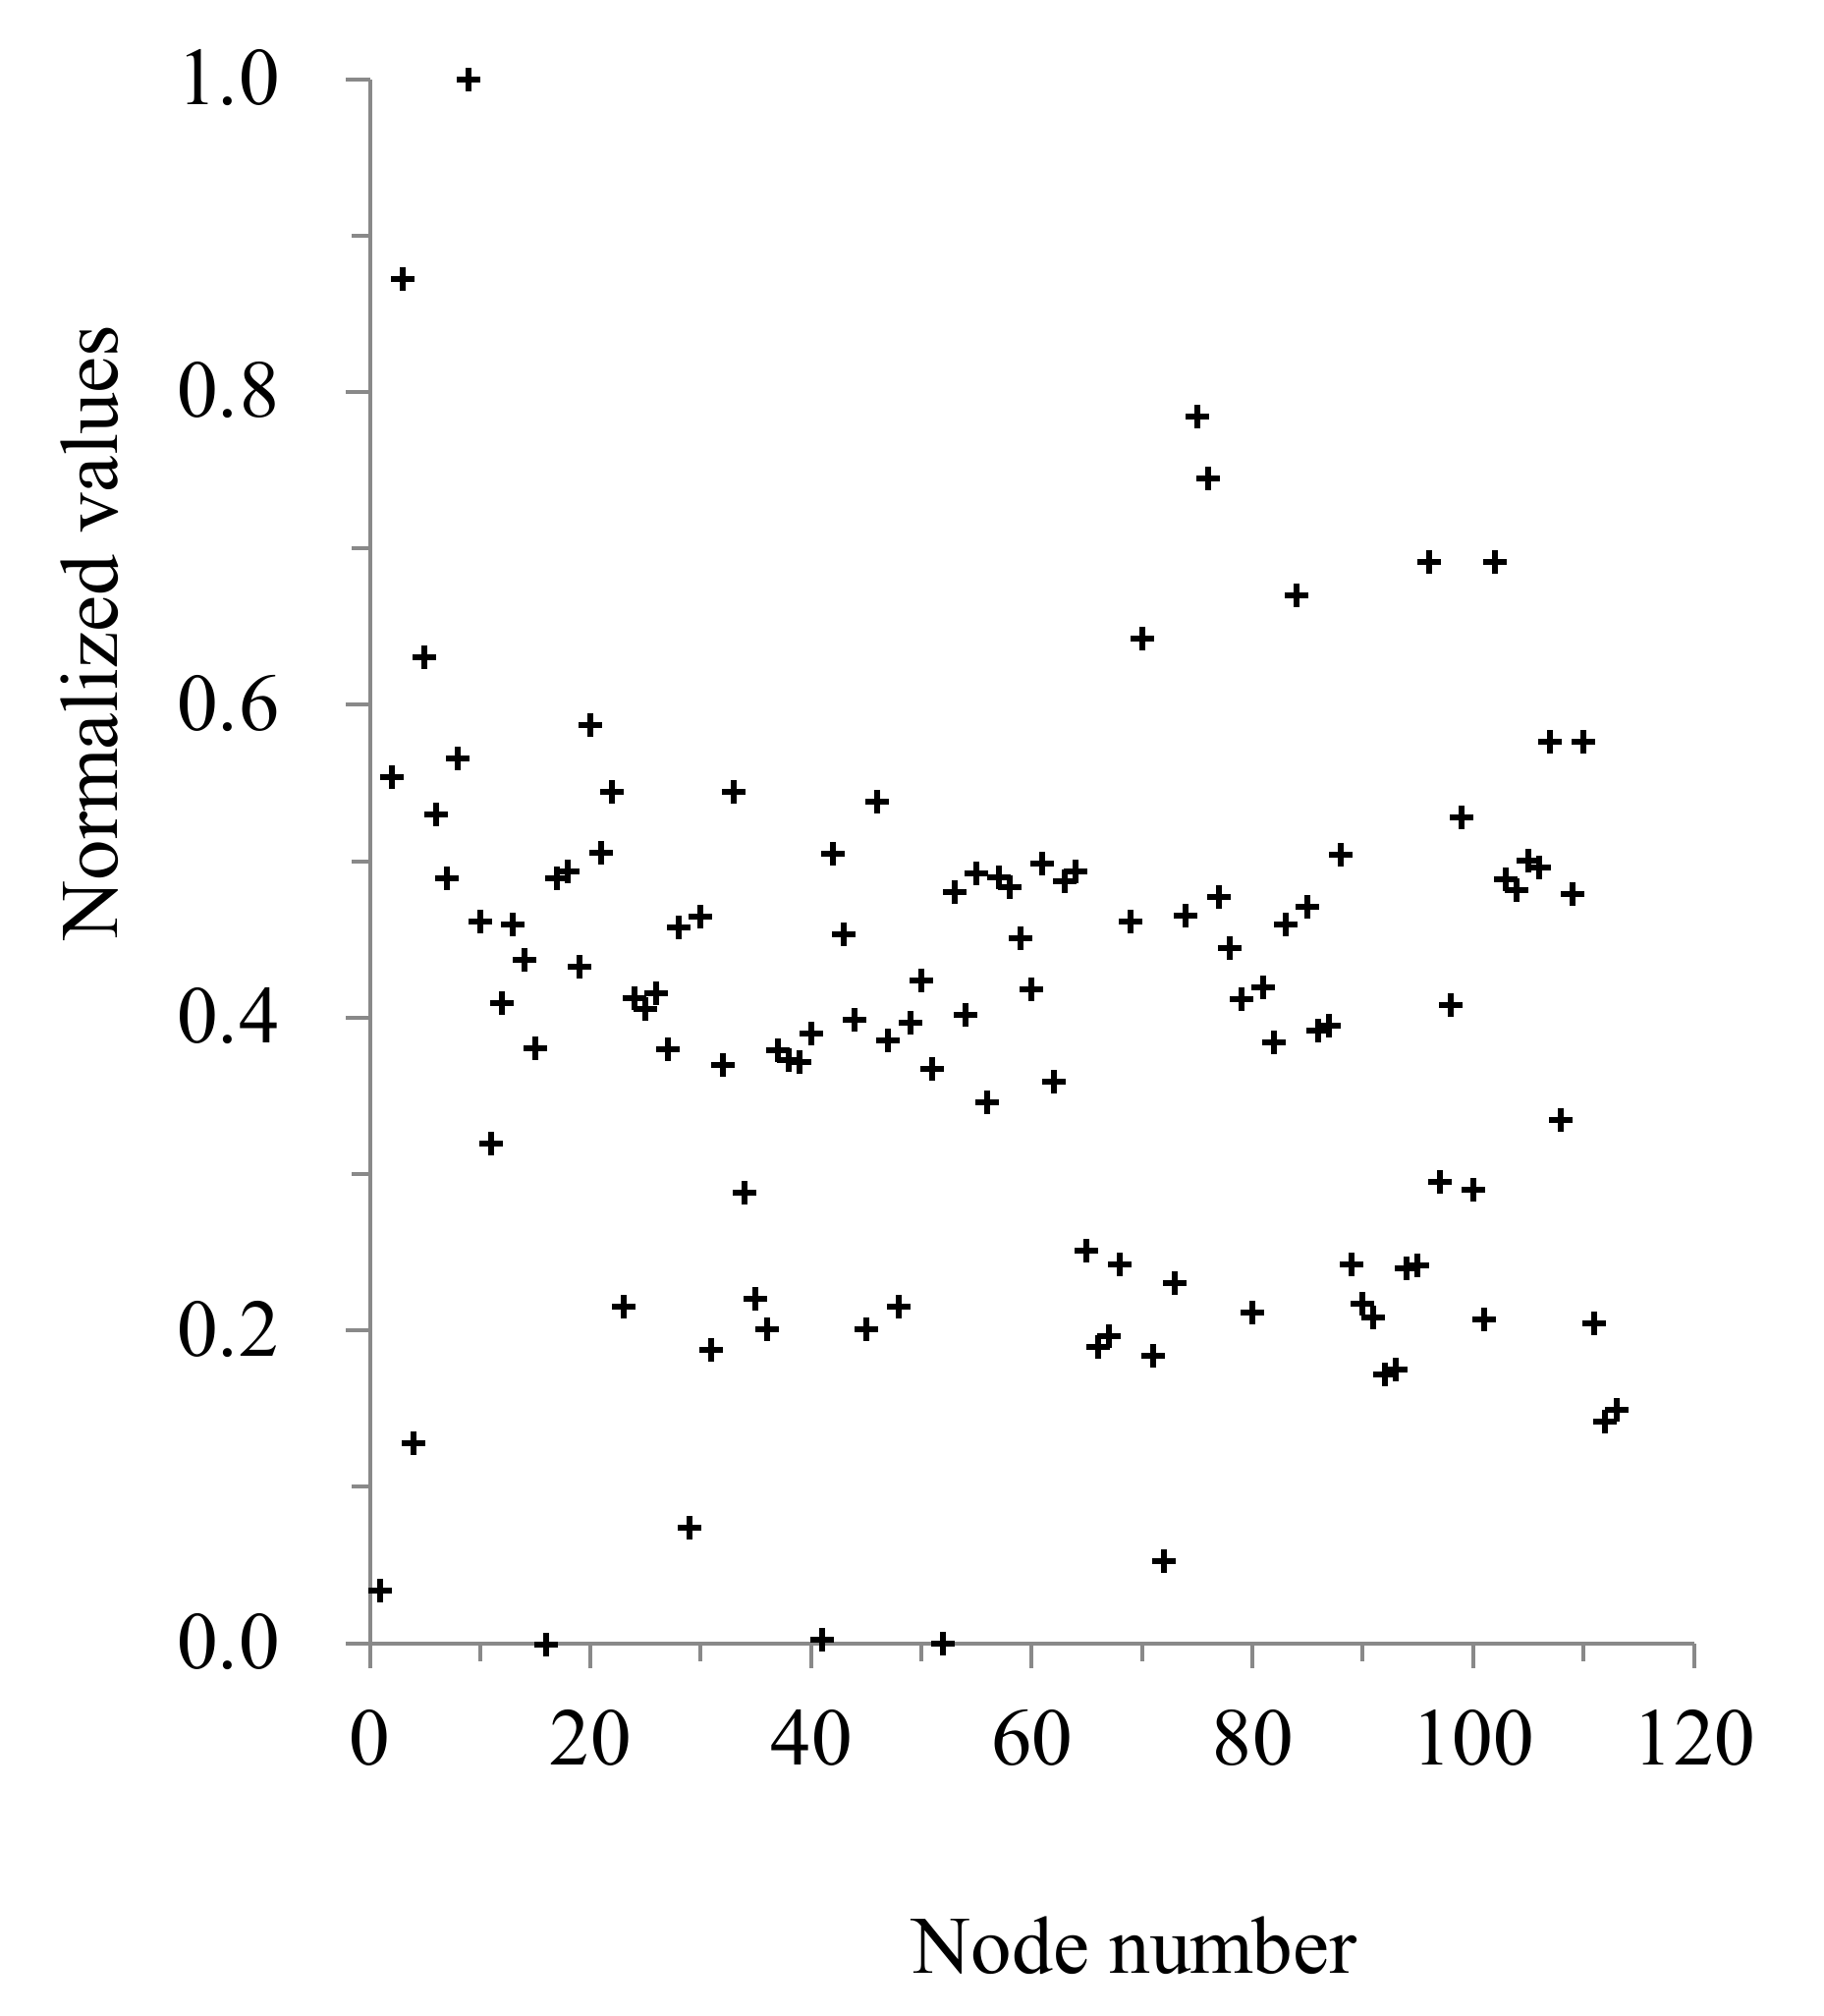
With regard to the calculation for the betweenness of nodes, it is assumed that the shortest path between two nodes in the road network is all in the expressway ring. The betweenness of 113 nodes in the road network were obtained, and the scatter plot was obtained by standardization, shown in Figure 6. All the nodes were divided into three grades according to the natural breakpoint classification, and its spatial distribution was shown in Figure 7. The results show that the betweenness of nodes shows a “triangular” distribution, and most of the nodes with high betweenness values are distributed between the 50th and the 70th nodes, showing a certain degree of agglomeration. The nodes with a high betweenness value (the standard value of the betweenness is greater than OR equals 0.49) were distributed on the trunk roads in the central area of the road network. The spatial distribution pattern was an “L-type” pattern, and they accounted for 10% of all the nodes. The nodes with medium betweenness value (the standard value of the betweenness is greater than and equals 0.19, but less than 0.49) were distributed around the “L-type” shape of high-betweenness nodes, accounting for 35% of all the nodes. This means that the spatial distribution of road network nodes with high betweenness value presents “L-type” shape characteristics. The nodes with low betweenness (the standard value of the betweenness is less than 0.19) were mostly distributed on the road network periphery, accounting for 56% of all the nodes. It can be seen that the betweenness of nodes shows a certain structural characteristic of the "hierarchical circle layer” in the spatial distribution. If the key nodes are identified according to the node intermediate number, most of the key nodes are located on the trunk road in the central area of the road network.
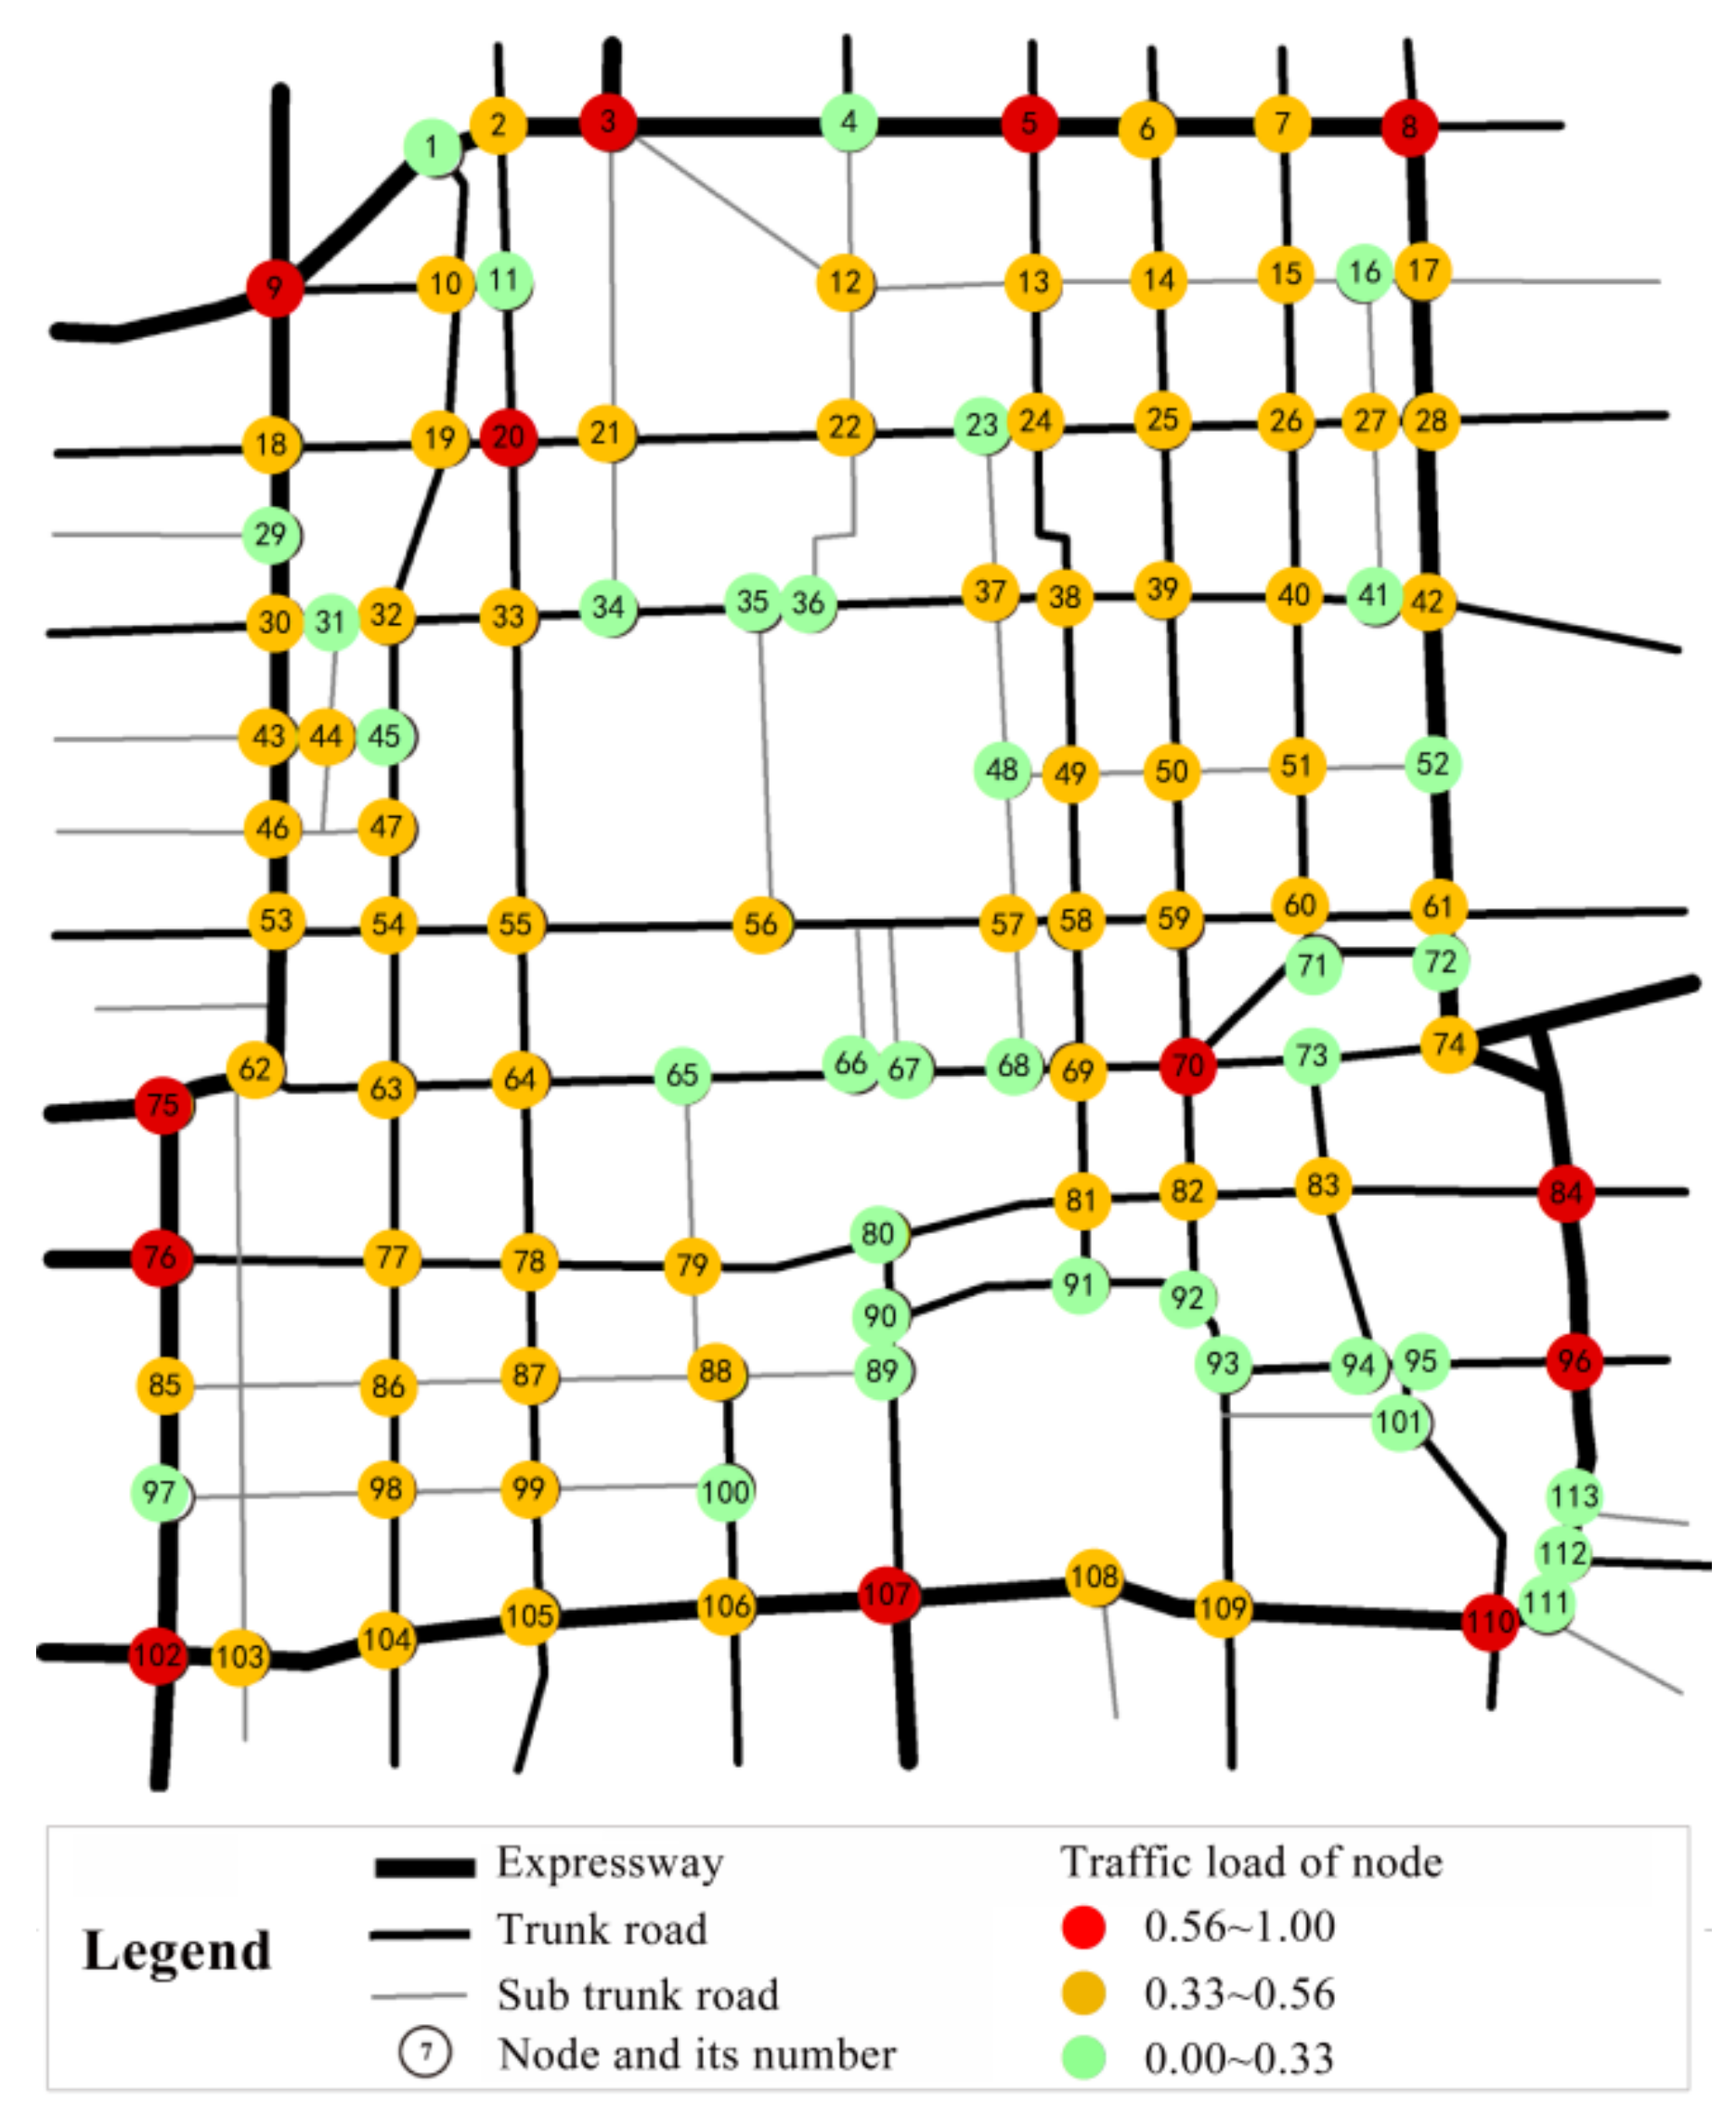
For the traffic flow characteristics, the four-grade running state divided on the Baidu map was used to assign weights to represent the traffic load of road segments. The traffic load value of the node was calculated according to Equation (3). The traffic flow during the rush hour in the five days during weekdays was considered. Because this period of time is the most congested, this can best reflect the actual situation of the traffic load of the road network. To accurately reflect the characteristics of the traffic flow, the traffic operation state of the Baidu map during the traffic peak period from 7: 00 to 9: 00 in 5 days was collected in this paper, and the average traffic load of the nodes in the road network was calculated. The scatter plot of the calculated data after standardized processing was shown in Figure 8. All the nodes were divided into three grades according to the classification of natural breakpoints, and the spatial distribution of the average traffic load was shown in Figure 9. The nodes with high traffic load (the standard value of average traffic load is greater than OR equals 0.56) were mainly distributed in expressways and individual trunk roads, accounting for 12% of all the nodes. The nodes with low traffic load (the standard value of average traffic load is less than 0.33) were generally distributed on the northwest-southeast link of the road network, accounting for 31% of all the nodes. The nodes with middle traffic load (the standard value of average traffic load is greater than OR equals 0.33, but less than 0.56) were distributed in the northeast and southwest region, accounting for 58% of all the nodes. It can be seen that during the morning rush hour, most of the nodes carrying large traffic volume in the whole road network were the intersections between expressways on the outer edge of the road network and the trunk roads in a certain range on both sides of the northwest-southeast line.
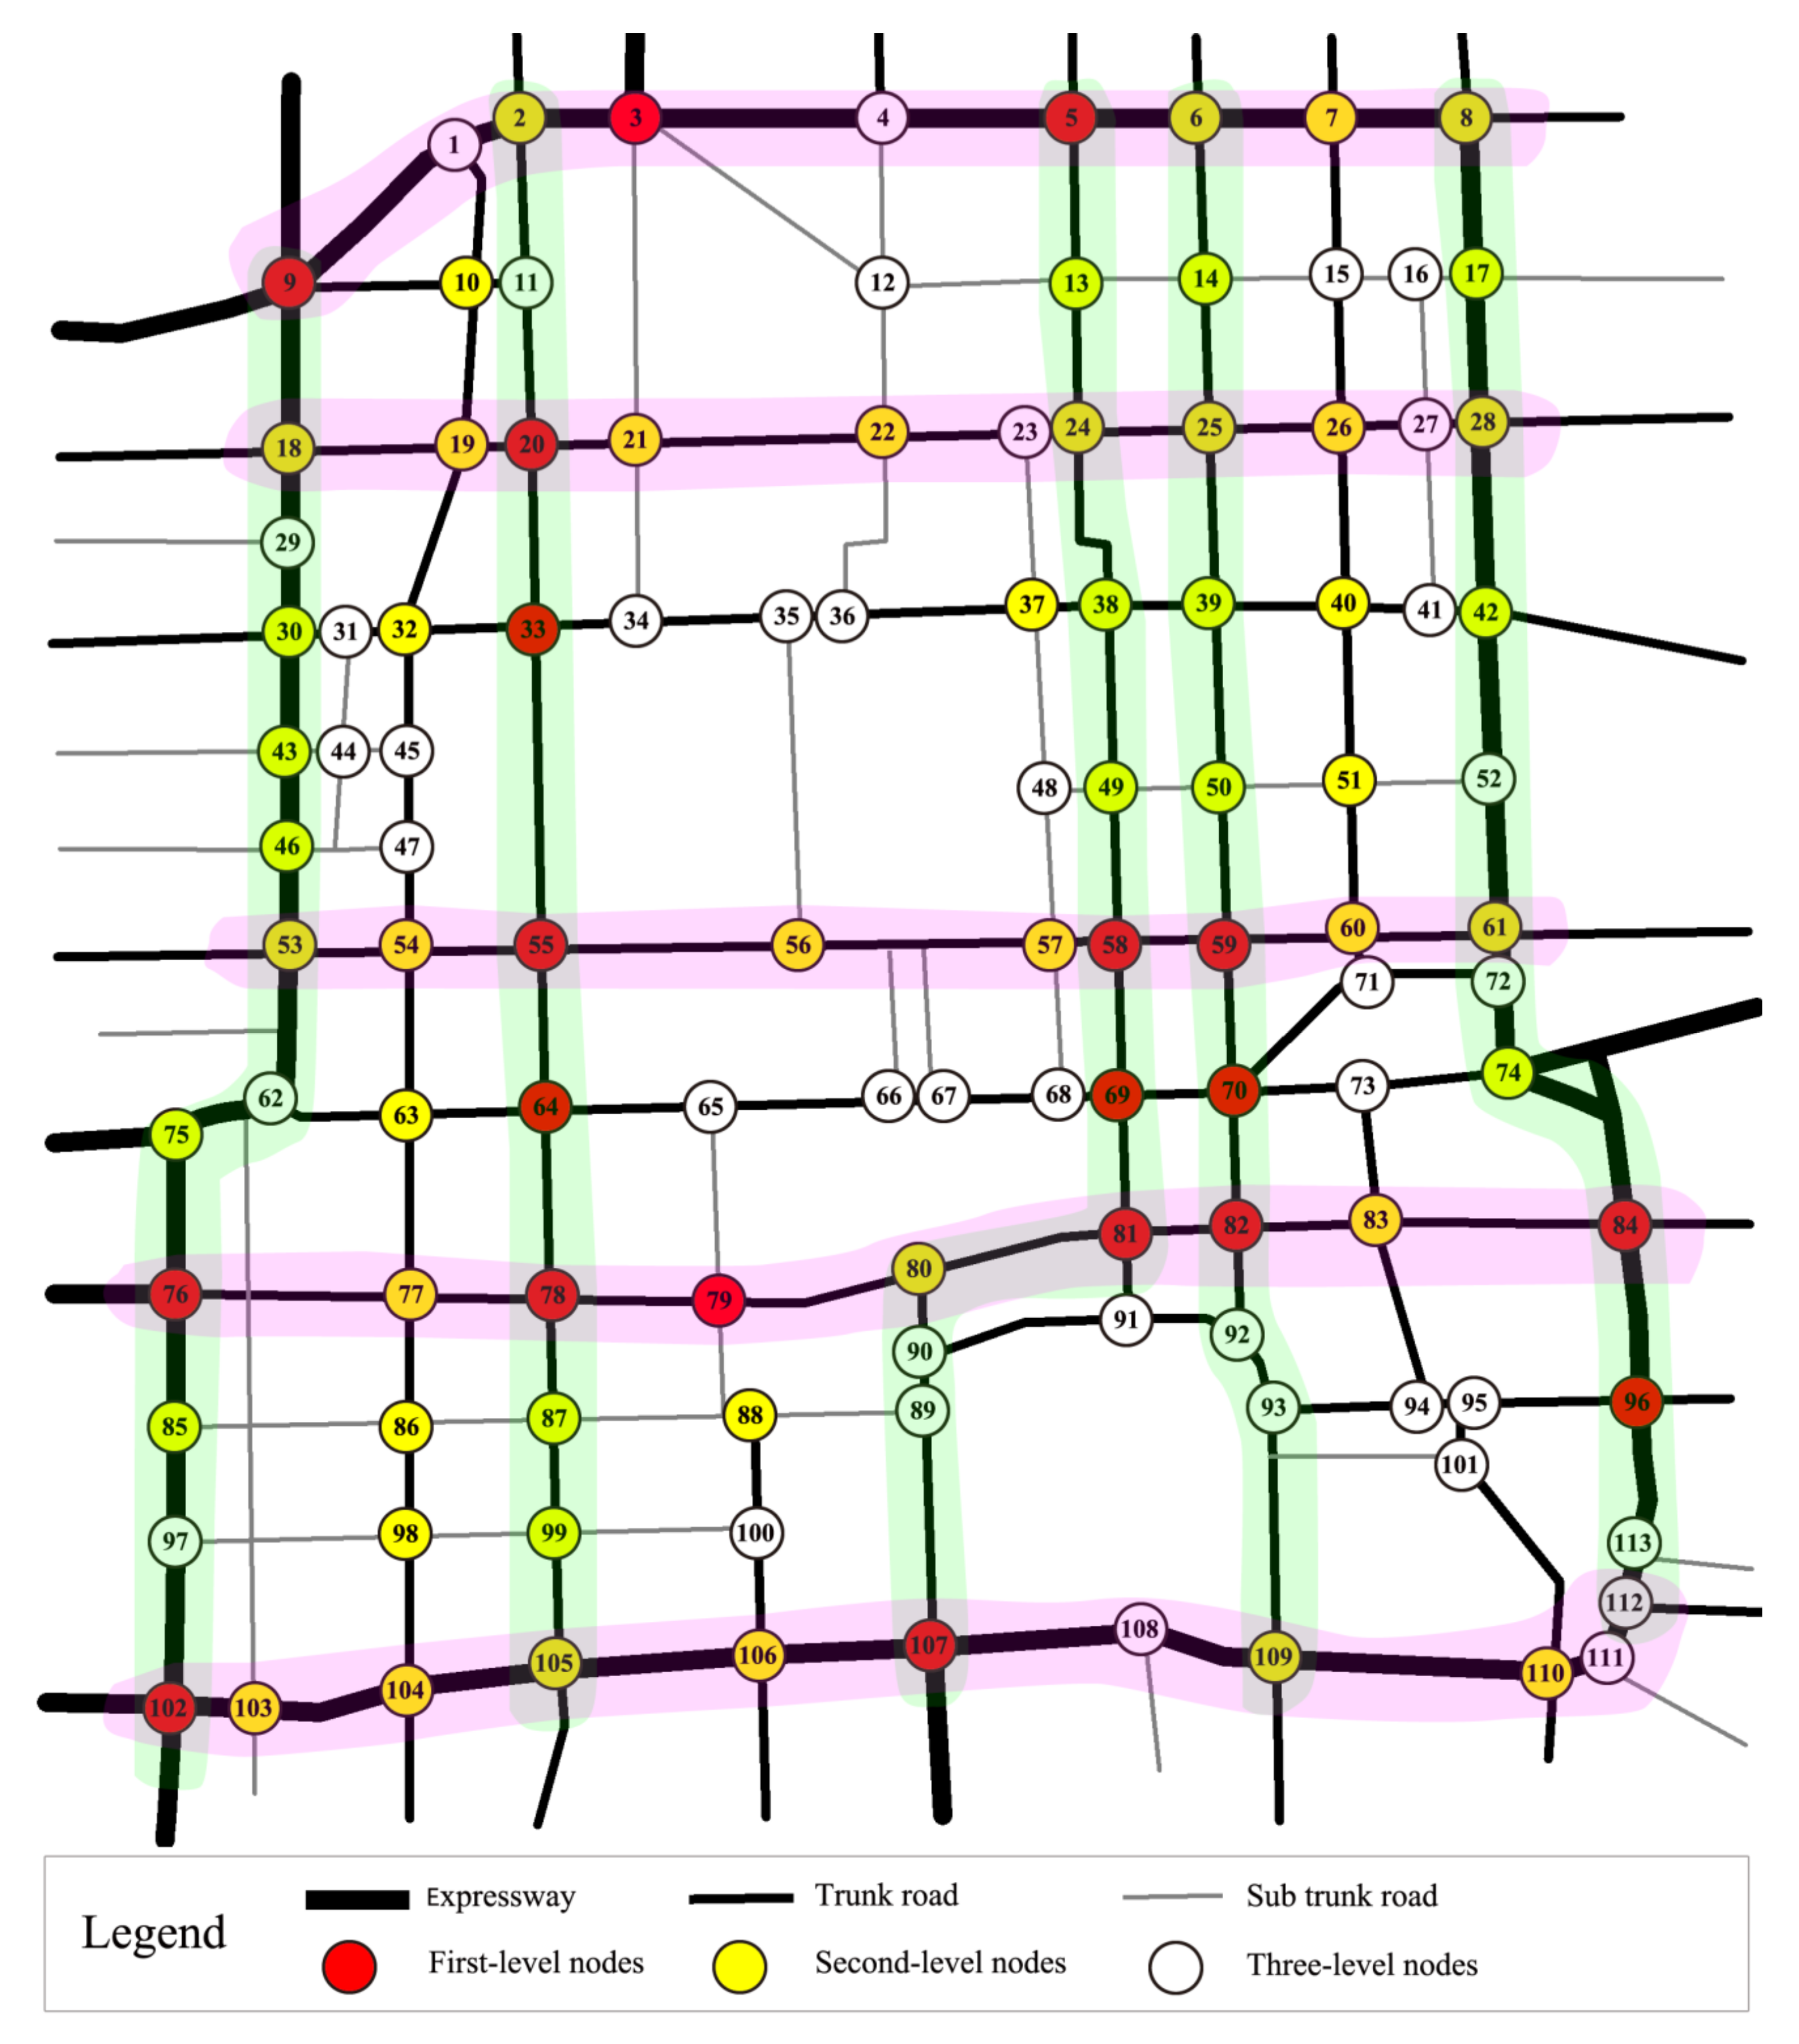
The above analysis shows that the results identified according to the three indexes respectively are inconsistent, and they can even turn out to be completely different. It can be seen that it is unreasonable and limited to use a single index to identify the key nodes of the road network. In addition, SPSS software was used to analyze the correlation about the three indexes, namely weighting connection degree (x1), betweenness (x2) and average traffic load (x3), and the correlation coefficient R and significant parameter P were obtained as follows respectively: R12 = 0.066, P = 0.490; R13 = 0.725, P = 0.000; R23 = 0.1490, P = 0.115. It can be seen that there was a high correlation between weighted connection degree and the average traffic load of nodes. The reason is that the traffic load of the node is composed of the traffic load of the road connected to the node, and the weighted connection degree is the number of road segments connected to the node, so the two have a high correlation. The correlation between other indicators was low, which indicates that these indicators reflect the attribute information of road network nodes from different aspects, and the importance of a single evaluation index to evaluate the importance of nodes has limitations. Hence, we should comprehensively consider the characteristic indicators of nodes for systematic analysis of the importance of nodes. Therefore, the dynamic classification method was used to grade the nodes according to the three attribute indexes of nodes, as shown in Figure 10. The spatial distribution of the node categories of the whole road network was shown in Figure 11.
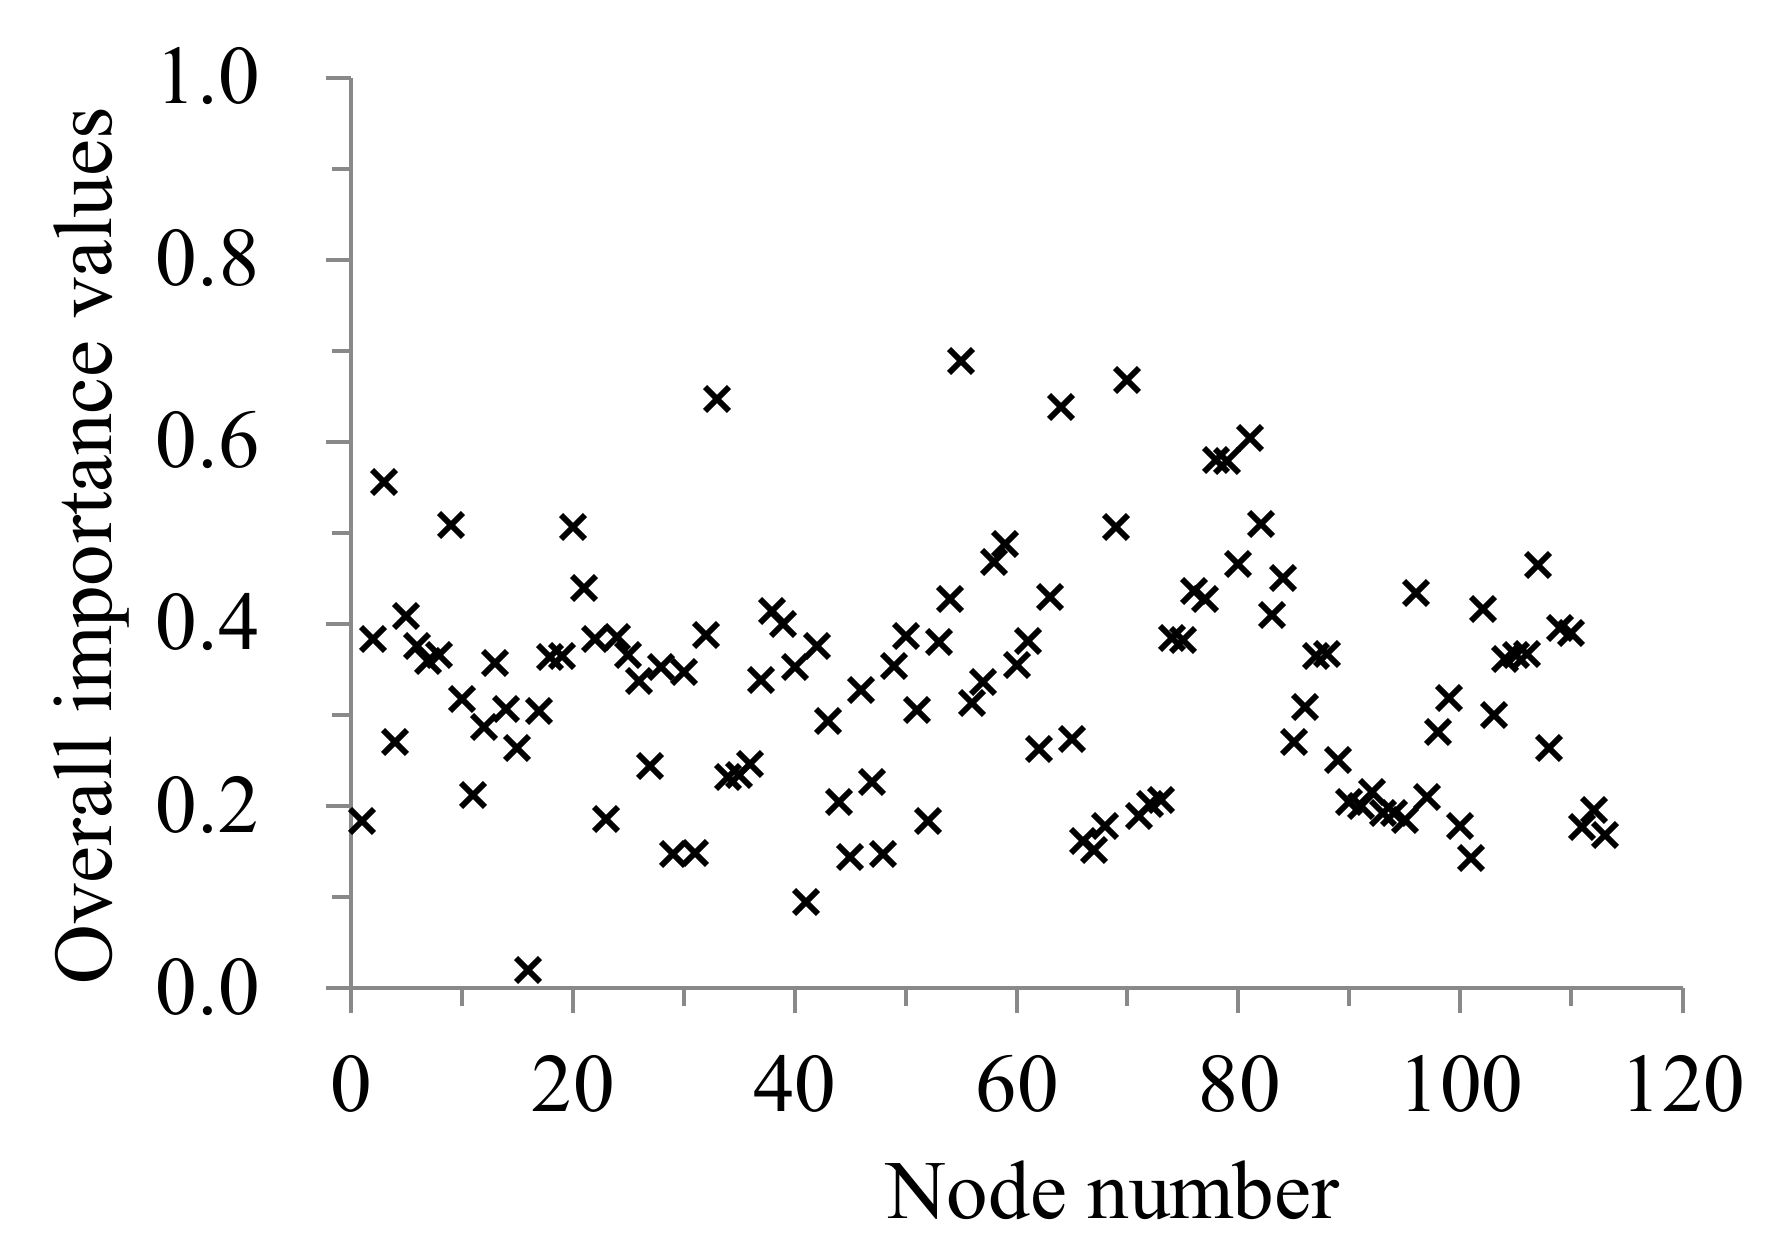
Figure 11 shows that the Grade I nodes (red nodes) were mostly distributed in the core layer of the road network. The Grade II nodes (brown nodes) were generally distributed in the outer circle layer of the road network. The Grade III nodes (green nodes) were evenly distributed in the road network space. However, the node classification result identified by the dynamic classification method is only a dynamic clustering based on the similarity between node attributes, without taking into account the impact of the comprehensive importance of nodes, the classification and recognition results may be biased. Therefore, based on the objective weighting method of information entropy, the weight vector of evaluation indexes was calculated as w = (0.30033, 0.34876, 0.35091), and the comprehensive importance of each node was calculated by the TOPSIS method, as shown in Figure 12.
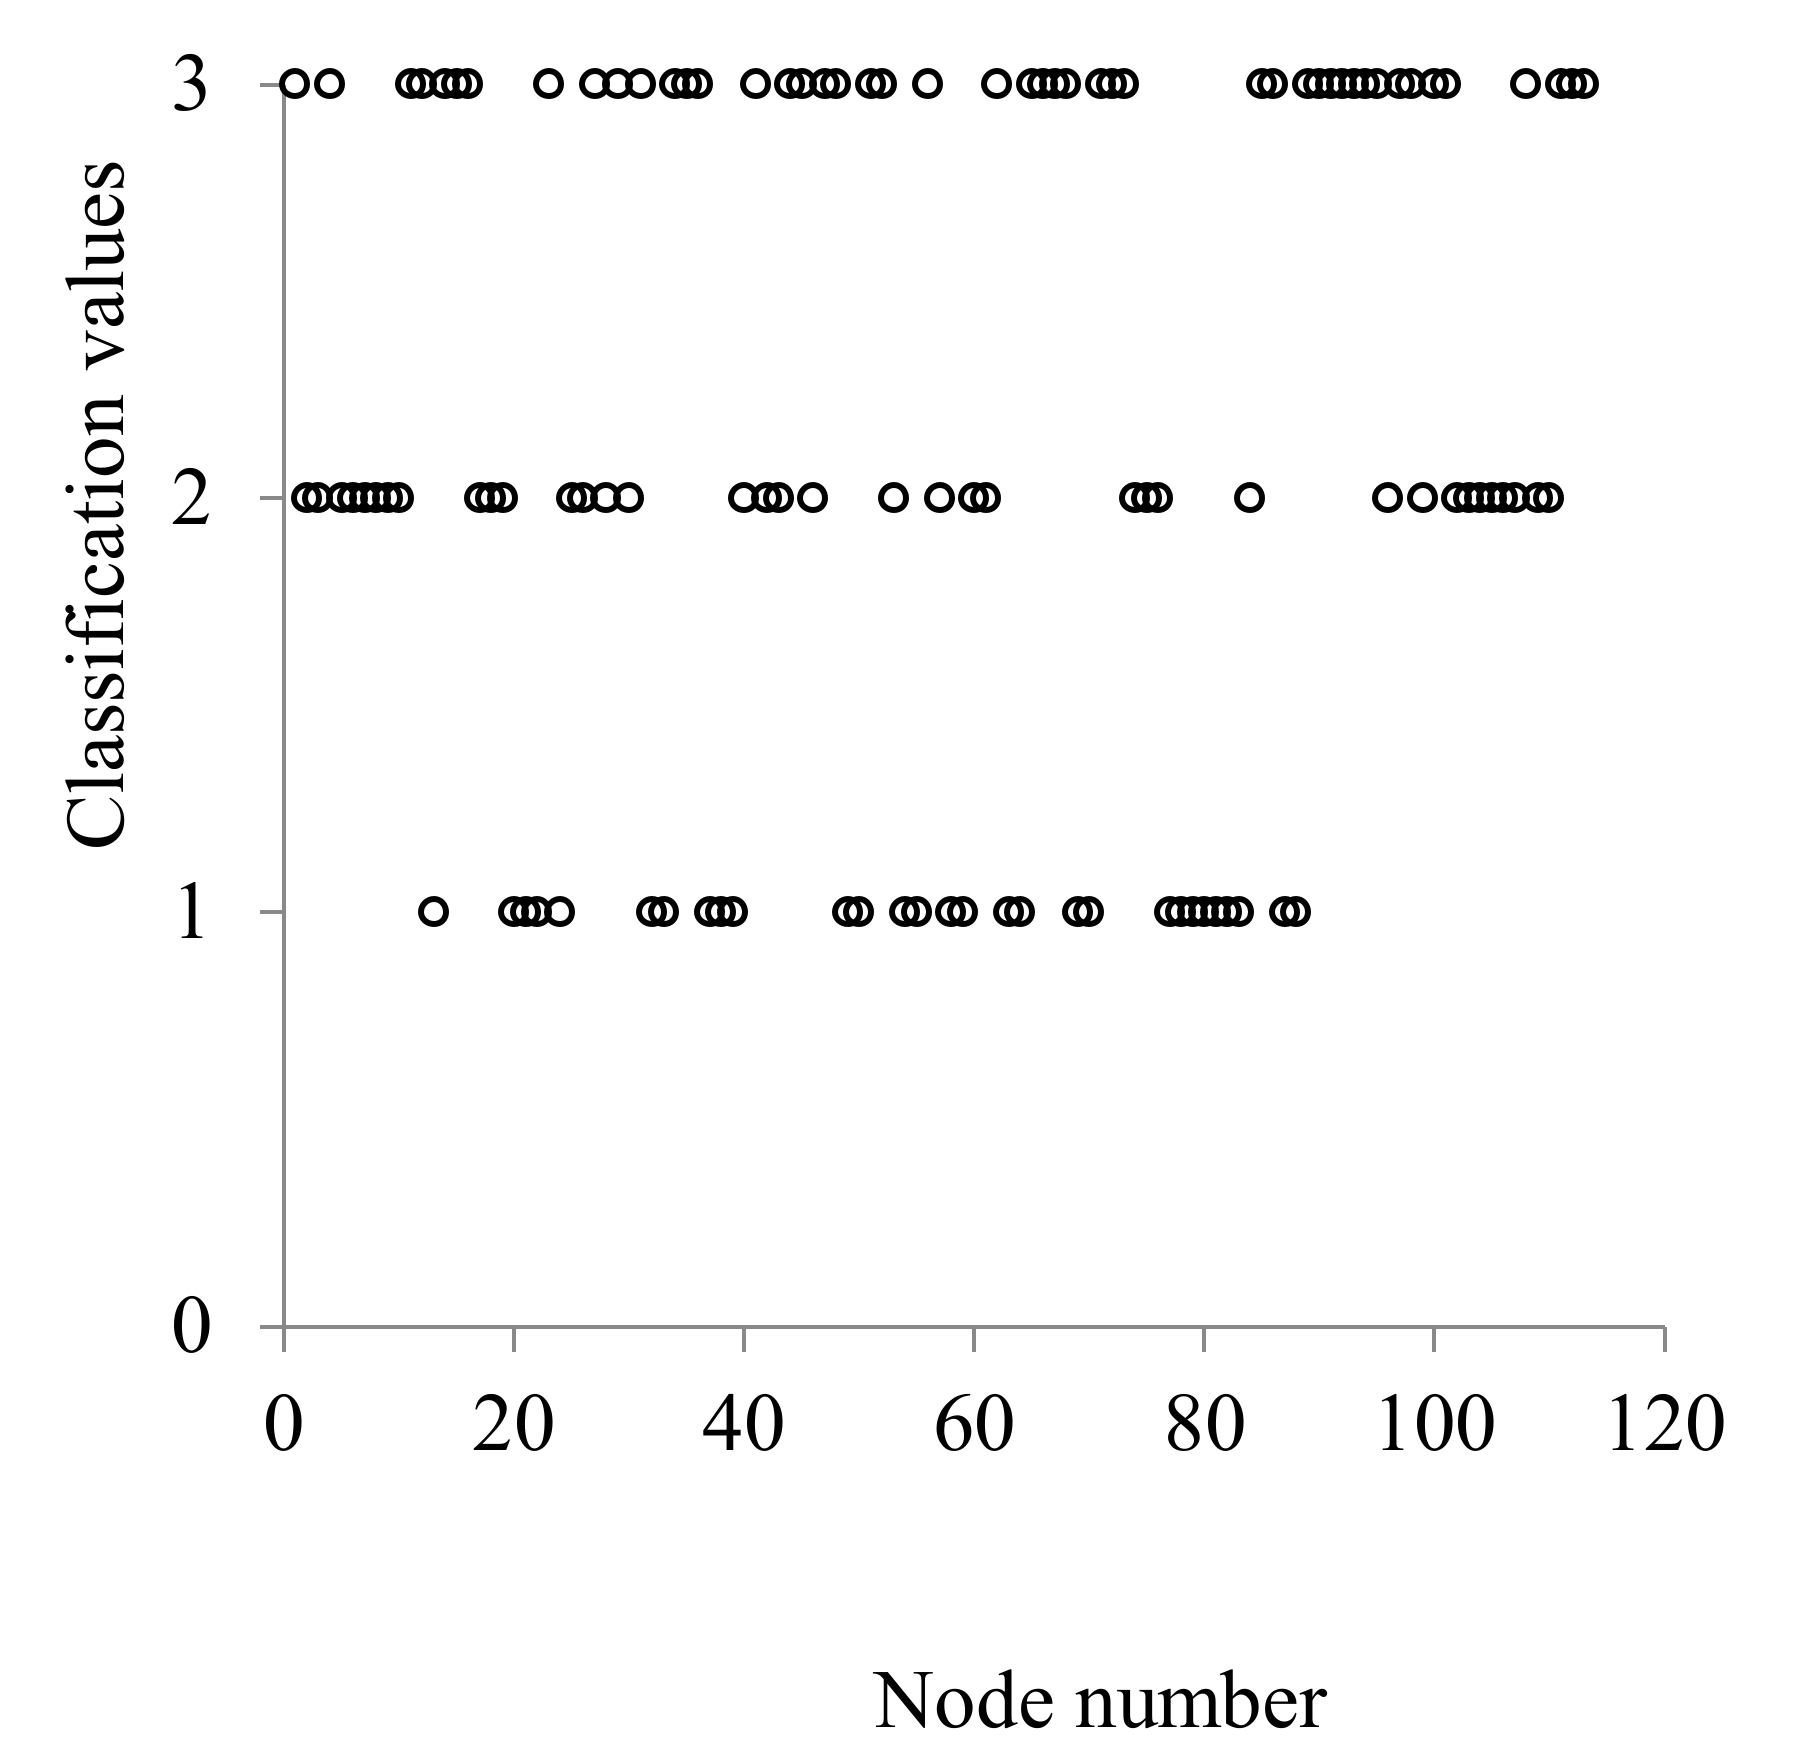
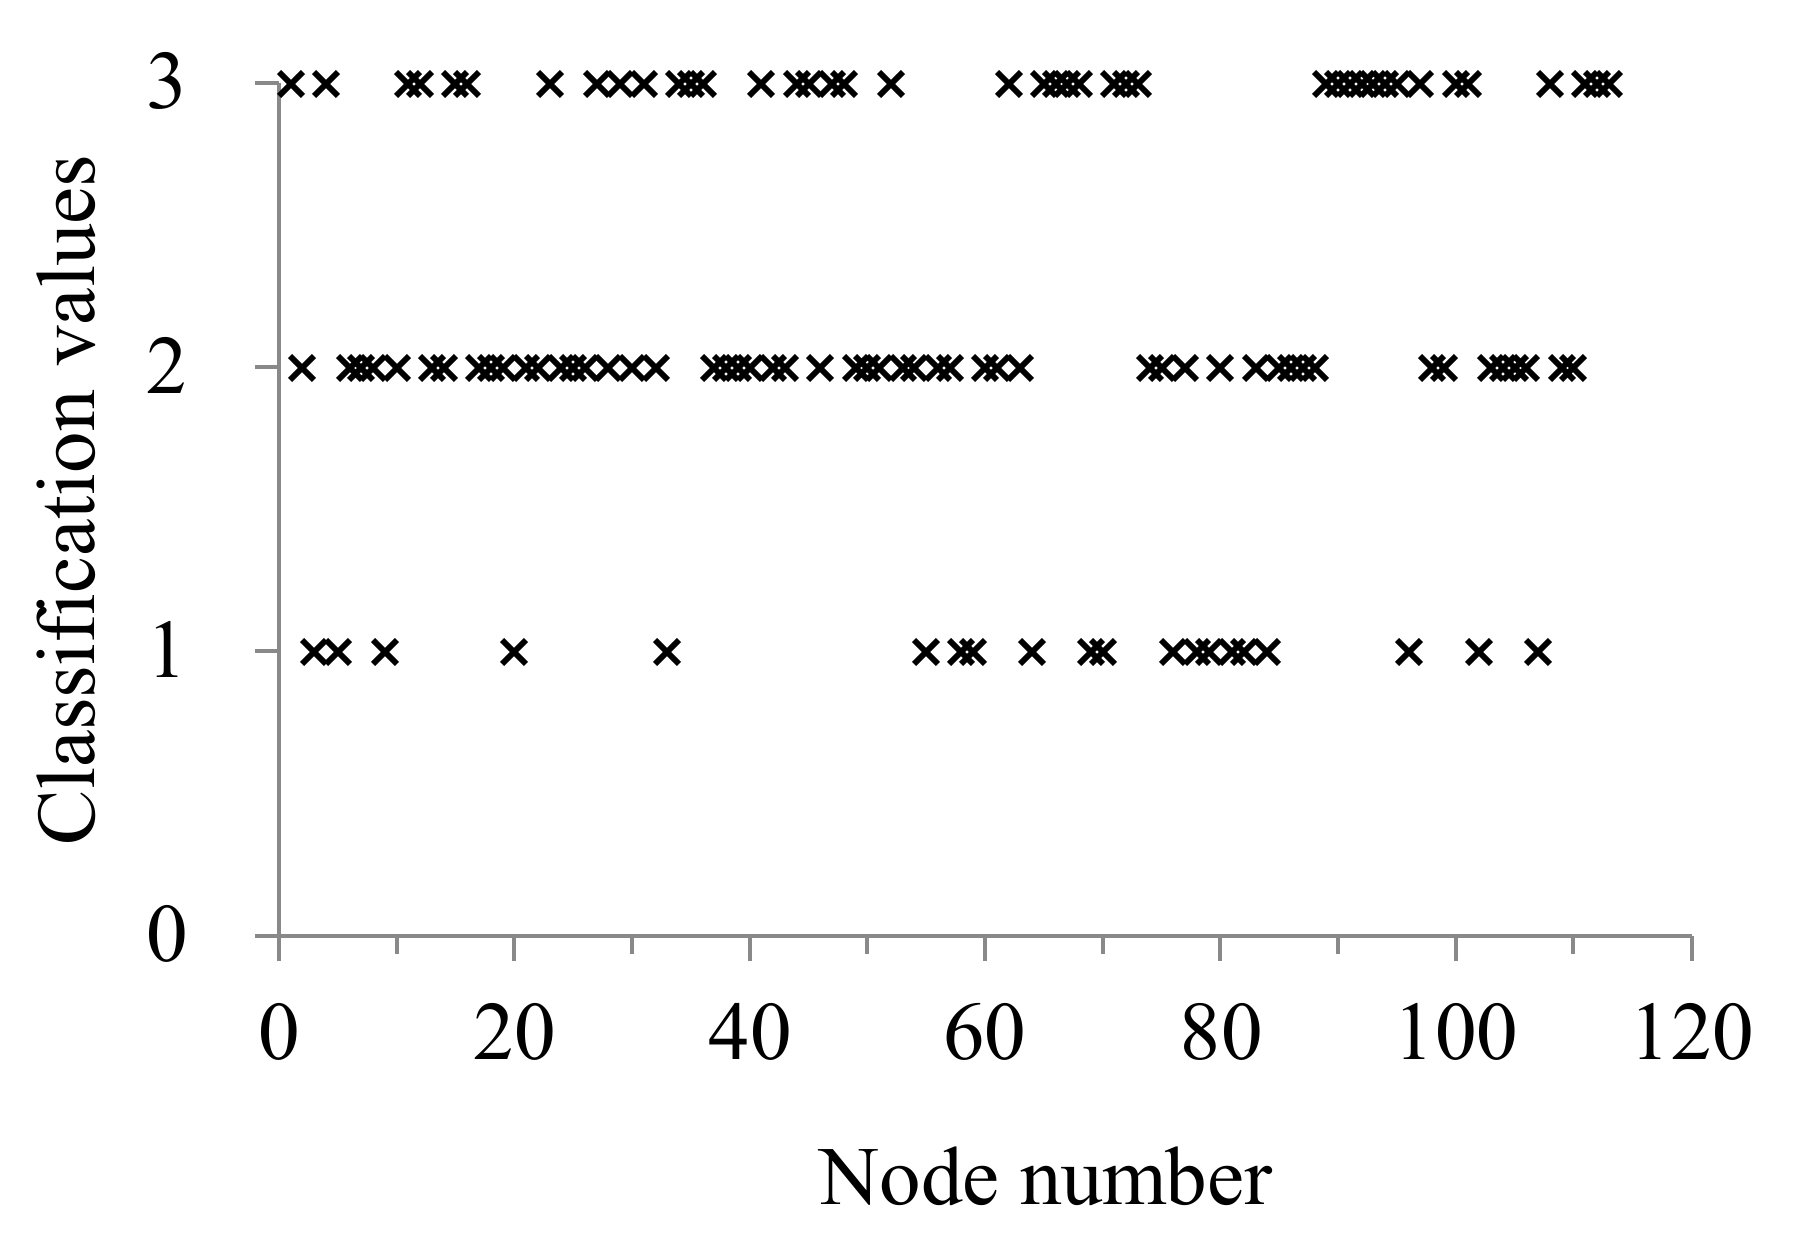
The three-grade classification of road network nodes was obtained according to the dynamic classification method (DT). Then the comprehensive evaluation value of the road network node is obtained by using the multi-attribute comprehensive evaluation method, and the exact threshold values of a comprehensive evaluation for assigning levels to nodes are obtained according to the clustering center of the dynamic classification result. Comprehensive consideration of the importance ranking and dynamic hierarchical clustering of nodes, it was determined that the nodes with comprehensive evaluation value Zi ≥ 0.45 were the first-grade nodes, the nodes with 0.45 > Zi ≥ 0.30 were the secondary-grade nodes, the nodes with Zi < 0.30 were the third-grade nodes. Finally, there were 20 first-grade nodes, accounting for 17.70%; 52 secondary-grade nodes, accounting for 46.02%; 41 third-grade nodes, accounting for 36.28%, as shown in Figure 13. The spatial distribution characteristics of each category of nodes were clearly listed in Figure 14. The first-grade nodes (red marking) were regarded as the key node of the road network, the second-grade nodes were yellow marking nodes, and the third-grade nodes were white marking nodes. The first-grade nodes identified were the intersections between expressways and trunk roads, trunk road, and trunk road. The importance of Node 5 was the least and the comprehensive evaluation value was 0.4577.
The self-organizing competitive neural network method in literature [15] is a deep learning method, which builds a network prediction model according to the internal correlation of the evaluation index data, and classifies nodes by the trained network model. The method in this paper is compared with the existing methods, which has verified the feasibility and effectiveness of the method in this paper. According to the internal relationship between the index data of road network nodes, the dynamic classification method forms the clustering group of road network nodes, that is, the hierarchical classification of road network nodes. The multi-attribute comprehensive evaluation method integrates the comprehensive evaluation value of road network nodes according to the characteristics of the road network node index. Then the comprehensive evaluation and ranking of road network nodes are used to modify the classification results of road network nodes. This method comprehensively considers the inherent relevance of each index data, as well as the ranking of the integrated results of the evaluation indicators, which shows that the method takes into account the macro and micro characteristics of road network nodes. The first-grade nodes identified by self-organizing competitive neural network method [15] were as follows: 2, 3, 5, 8, 9, 55, 75, 76, 84, 96, 102, 107, and 110. The nodes 2, 8, 75, and 110 did not belong to the first-grade node sequence determined by the method proposed in this paper. The comprehensive evaluation values of the four nodes are 0.4276, 0.4131, 0.4421, and 0.4365, respectively, which were all less than the comprehensive evaluation value of Node 5 (see Figure 15), and the dynamic clustering results of the four nodes all belonged to the secondary-grade nodes (see Figure 10 and Figure 11). It can be seen that the recognition result by the method in this paper is more accurate and reasonable.
According to the spatial distribution pattern of first-grade and secondary-grade nodes, the “five vertical and five horizontal” pattern of the important traffic corridor of the regional road network was formed, that is, five vertical corridors (green marking): (1) 9#→62#→75#→102#; (2) 2#→105#; (3) 5#→81#→80#→107#; (4) 6#→82#→109#; (5) 8#→74#→112#. Five horizontal corridors (pink marking): (1) 9#→1#→8#; (2) 18#→28#; (3) 53#→61#; (4) 76#→84#; (5) 102#→112#.
From the perspective of road network system engineering, preventive measures such as monitoring and early warning, project resilience improvement, and emergency function guarantee should be implemented the event prevention resilience of the first-grade key nodes of the road network before an emergency occurs. The improvement of the engineering toughness of road network nodes can enhance the anti-event robustness of road network nodes and reduce their failure probability, to enhance the security of urban road network systems. To adapt and absorb the damage situation of the road network caused by emergencies and reduce the impact of failure nodes on the overall performance of the road network, the failure degree and the number of failure nodes should be reduced as much as possible. After the occurrence of an emergency, the rapid and efficient intervention of the monitoring and early warning of the transportation department, emergency traffic organization, and emergency safeguard measures can reduce the recovery time of the failure nodes of the road network. Emergency traffic organizations can guide on-site vehicles to flow into the secondary or tertiary road network nodes and their connected roads, to avoid the cascade failure effect of the road network nodes caused by the failure of important nodes, which paralyzes the local overall performance of the road network.
From the microscopic point of view of nodes, for the bridge nodes in the first-grade nodes, the vulnerability of various types of bridges under all kinds of emergencies is analyzed, the damage forms of different bridges are summarized and sorted out, and the corresponding emergency disposal plan and process is formulated. For the road intersections in the first-grade nodes, the microscopic simulation analysis of the key intersections should be carried out, and the emergency treatment plan of road damage or road congestion should be made.
4. Conclusions
- (1)
- Urban complex road network model was constructed based on the complex network theory. The node quantitative indexes were selected from the local attribute, global attribute, and functional attribute of the urban complex road network. A grade identification method of a critical node in the road network based on multi-attribute evaluation correction was established, which provides the basis for the emergency guarantee and recovery of the key nodes after the event. However, the value of weight in the comprehensive evaluation method will affect the evaluation result. In future research, subjective and objective determination of optimal weight will be considered to make the model more accurate.
- (2)
- The road network within the second Ring Road of Beijing was taken as an example. The analysis showed that the distribution of weighting connection degree of nodes on the whole road network generally presented the structure of “peripheral high connectivity-central low connectivity”. If we identify the key nodes according to the highly weighted connection value of the nodes, most of the key nodes are on the expressways in the road network peripherally. The betweenness of nodes presented a certain structural characteristic of the "hierarchical circle layer” in spatial distribution. If it was identified according to the betweenness of nodes, most of the key nodes were located on the trunk road in the central area of the road network. Most of the nodes carrying large traffic volumes in the whole road network were the expressways on the outer edge of the road network and the intersections of the trunk roads in a certain range on both sides of the northwest-southeast line.
- (3)
- The first-grade nodes identified by the method in this paper were all the intersections among expressways and trunk roads. Compared with the self-organizing competitive neural network clustering method, the proposed method is more scientific and reasonable, and more accurate and effective in node identification. According to the spatial distribution pattern of first-grade and secondary-grade nodes, the “five vertical and five horizontal” pattern of the important traffic corridor of the regional road network was formed. Preventive measures such as monitoring and early warning (Traffic Control Centers), project resilience improvement (Road Management and Maintenance Department) and emergency function guarantee (Transportation Authority) should be implemented the event prevention resilience of the first-grade key nodes of the road network before an emergency occurs. Emergency traffic organizations can guide on-site vehicles to flow into the secondary or tertiary road network nodes and their connected roads, to avoid the cascade failure effect of the road network nodes caused by the failure of important nodes.
Author Contributions
Conceptualization, C.L.; Formal analysis, H.Y.; Funding acquisition, C.L. and H.Y.; Investigation, Y.S.; Methodology, C.L.; Project administration, X.G.; Software, H.Y., Y.S. and L.W.; Supervision, L.W. and X.G.; Validation, L.W.; Visualization, Y.S.; Writing—original draft, C.L., H.Y. and Y.S.; Writing—review & editing, C.L. and H.Y. All authors have read and agreed to the published version of the manuscript.
Funding
This research was funded by the Scientific Research Fund of Institute of Engineering Mechanics, China Earthquake Administration (Grant No. 2019EEEVL0501), National Natural Science Funds of China (Grant No. 51908025), and Natural Science Foundations of Hebei Province, China (Grant No. E2019202470, G2018202059), Tianjin Science and Technology Plan Project (Grant No. 19YFZCSN01200) and Key R & D projects in Hebei Province (Grant No. 20375506D).
Institutional Review Board Statement
Not applicable.
Informed Consent Statement
Not applicable.
Data Availability Statement
No Data.
Acknowledgments
We thank five anonymous reviewers for their comments. The first authors are the main contributors to this paper.
Conflicts of Interest
The authors declare no conflict of interest.
References
- Wang, L.C. Research on Identification of Key Nodes and Sections of Urban Road Network; Jilin University: Changchun, China, 2017. [Google Scholar]
- Yu, H.Y.; Fang, J.; Liu, S.; Ren, Y.L.; Lu, J. A node optimization model based on the spatiotemporal characteristics of the road network for urban traffic mobile crowd sensing. Veh. Commun. 2021, 31, 100383. [Google Scholar] [CrossRef]
- Lai, Y.C.; Motter, A.E.; Nishikawa, T. Attacks and cascades in complex networks. Lect. Notes Phys. 2004, 650, 299–310. [Google Scholar]
- Takayasu, F.; Kazumi, S.; Tetsuo, I.; Kazuhiro, K. Estimating node connectedness in spatial network under stochastic link disconnection based on efficient sampling. Appl. Netw. Sci. 2019, 4, 66. [Google Scholar] [CrossRef] [Green Version]
- Wu, H.; Wang, L.X.; Cheng, X. Important evaluation of nodes of lifeline system based on network analysis—Take the power grid in some districts of Guangzhou city as an example. Earthq. Eng. Eng. Dyn. 2015, 35, 232–238. [Google Scholar]
- Huang, W.C.; Zhou, B.; Yu, Y.C.; Yin, D.Z. Vulnerability analysis of road network for dangerous goods transportation considering intentional attack: Based on Cellular Automata. Reliab. Eng. Syst. Saf. 2021, 214, 107779. [Google Scholar] [CrossRef]
- Bellingeri, M.; Lu, Z.M.; Cassi, D.; Scotognella, F. Analyses of the response of a complex weighted network to nodes removal strategies considering links weight: The case of the Beijing urban road system. Mod. Phys. Lett. B 2021, 32, 1850067. [Google Scholar] [CrossRef]
- Barthelemy, M. Betweenness centrality in large complex networks. Eur. Phys. J. B 2004, 38, 163–168. [Google Scholar] [CrossRef]
- Wang, L. A two-stage stochastic programming framework for evacuation planning in disaster responses. Comput. Ind. Eng. 2020, 145, 106458. [Google Scholar] [CrossRef]
- Hong, Z.L.; Liu, B.Y.; Zhang, Y.P. Application of complex network in transportation network’s node importance evaluation. J. Xi’an Technol. Univ. 2014, 34, 404–410. [Google Scholar]
- Boulin, R.; Boily, M.C.; Masse, B.R. Dynamical systems to define centrality in social networks. Soc. Netw. 2000, 22, 187–220. [Google Scholar]
- Liu, Z.Z.; Chen, H.; Liu, E.Z.; Hu, W.Y. Exploring the resilience assessment framework of urban road network for sustainable cities. Phys.-Stat. Mech. Its Appl. 2022, 586, 126465. [Google Scholar] [CrossRef]
- Wang, L.; Yu, X.Y.; Li, Y.H.; Li, Z.X. Traffic complex network node importance assessment based on FCM clustering. J. Transp. Syst. Eng. Inf. Technol. 2010, 6, 169–173. [Google Scholar]
- Ren, B.A.; Zhang, Y.; Chen, J.; Shen, L.C. Efficient network disruption under imperfect information: The sharpening effect of network reconstruction with no prior knowledge. Physica A 2019, 520, 196–207. [Google Scholar] [CrossRef]
- Qin, Z.H. Study on the Location of Emergency Resources Based on the Key Nodes in the Road Network; Beijing Jiaotong University: Beijing, China, 2015. [Google Scholar]
- Zhang, H.L.; Zhang, M. Muti-index comprehensive evaluation method on network node importance. J. Xi’an Univ. Post Telecommun. 2016, 21, 38–41. [Google Scholar]
- Xing, B.; Cao, J.H.; Song, T.L.; Dong, Y.S. Synthesis evaluation method for network node importance in equipment support based on TOPSIS. J. Acad. Armored Force Eng. 2017, 31, 28–34. [Google Scholar]
- Yu, H.; Liu, Z.; Li, Y.J. Key nodes in complex networks identified by muti-attribute decision-making method. Acta Phys. Sin. 2013, 62, 54–62. [Google Scholar]
- Liu, Y.; Jin, J.; Zhang, Y.; Xu, C. A new clustering algorithm based on data field in complex networks. J. Supercomput. 2014, 67, 723–737. [Google Scholar] [CrossRef]
- Cao, W.D.; Liu, H.X. Nodes importance ranking model of complex network based on muti-level gray relational analysis. Comput. Eng. Sci. 2014, 62, 1165–1171. [Google Scholar]
- Zheng, L.L.; Wang, S.G.; Wang, W.; Ding, T.Q. Study on the identification method of hub node in urban road network. J. Wuhan Univ. Technol. Transp. Sci. Eng. 2015, 39, 675–679. [Google Scholar]
- Guo, X.C.; Ma, R.N.; Wang, G. Experimental properties of phase transitions in traffic flow. Comput. Simul. 2017, 34, 264–268. [Google Scholar]
- Macioszek, E.; Kurek, A. Extracting Road Traffic Volume in the City before and during COVID-19 through Video Remote Sensing. Remote Sens. 2021, 13, 2329. [Google Scholar] [CrossRef]
- Liu, X.L.; Wang, L.; Liu, T.Z.; Xu, J. Forecasting spatiotemporal boundary of emergency-event-based traffic congestion in expressway network considering highway node acceptance capacity. Sustainability 2021, 13, 12195. [Google Scholar] [CrossRef]
- Peng, H.; Wang, Y.X.; Chen, Z.Y.; Lv, Z.H. Dynamic sensor speed measurement algorithm and influencing factors of traffic safety with wireless sensor network nodes and RFID. IEEE Sens. J. 2021, 21, 15679–15686. [Google Scholar] [CrossRef]
- Roberts, G.W.; Tang, X.; Brown, C.J. Measurement and correlation of displacements on the Severn Suspens, ion Bridge using GPS. Appl. Geomat. 2019, 11, 161–176. [Google Scholar] [CrossRef]
- Galiano, G.; Moretti, L. Consistency of urban roads to manage emergencies: Methodology to identify the minimum network with total connectivity at maximum availability. Sustainability 2021, 13, 11151. [Google Scholar] [CrossRef]
- Sun, C.S.; Pei, X.; Hao, J.H.; Wang, Y.W.; Zhang, Z.; Wong, S.C. Role of road network features in the evaluation of incident impacts on urban traffic mobility. Transp. Res. Part B-Methodol. 2019, 117, 101–116. [Google Scholar] [CrossRef]
- Haghighi, N.; Fayyaz, S.K.; Liu, X.C.; Grubesic, T.H.; Wei, R. A multi-scenario probabilistic simulation approach for critical transportation network risk assessment. Netw. Spat. Econ. 2018, 18, 181–203. [Google Scholar] [CrossRef]
- Yang, B.M.; Yan, J.; Cai, Z.; Ding, Z.; Li, D.Z.; Cao, Y.; Guo, L.M. A novel heuristic emergency path planning method based on vector grid map. ISPRS Int. J. Geo-Inf. 2021, 10, 370. [Google Scholar] [CrossRef]
- Gao, Z.H.; Li, M.C.; Chen, Z.J. Research on small world characteristic of urban road network. Geogr. Geo-Inf. Sci. 2007, 23, 97–101. [Google Scholar]
- Song, H.Q.; Guo, J.; Liu, G. Auto generalization approach and importance evaluation of urban roads based on complex networks. Eng. Surv. Mapp. 2017, 26, 8–12. [Google Scholar]
- Kerner, B.S.; Rehborn, H. Experimental properties of phase transitions in traffic flow. Phys. Rev. Lett. 1997, 79, 4030–4033. [Google Scholar] [CrossRef]
- Available online: https://map.baidu.com/search/%E5%8C%97%E4%BA%AC%E5%B8%82/@12959838.024499584,4826359.200089177,13.49z/maplayer%3Dtrafficrealtime?querytype=s&da_src=shareurl&wd=%E5%8C%97%E4%BA%AC&c=332&src=0&pn=0&sug=0&l=12&b=(13003732.58,4687570.67;13091156.58,4727442.67)&from=webmap&biz_forward=%7B%22scaler%22:2,%22styles%22:%22pl%22%7D&device_ratio=2) (accessed on 9 October 2021).
- He, D.C. Complex System and Complex Network; Higher Education Press: Beijing, China, 2009. [Google Scholar]
- Pinto, N.; Antunes, A.P.; Roca, J. A cellular automata model for integrated simulation of land use and transport interactions. ISPRS Int. J. Geo-Inf. 2021, 10, 149. [Google Scholar] [CrossRef]
- Aljoufie, M.; Zuidgeest, M.; Brussel, M.; Van Vliet, J.; Van Masrseveen, M. A cellular automata-based land use and transport interaction model applied to Jeddah, Saudi Arabia. Landsc. Urban Plan. 2013, 112, 89–99. [Google Scholar] [CrossRef]
- Zhang, Y.; Lin, H.; Yang, X.Y.; Long, W.R. Combining expert weights for online portfolio selection based on the gradient descent algorithm. Knowl.-Based Syst. 2021, 234, 107533. [Google Scholar] [CrossRef]
- Liu, C.F.; Cao, C.B.; Liu, C.W.; Zhao, S.W.; Liu, Z.P. Dynamic grading clustering method based model for evaluation of service state of bridge structure. China Saf. Sci. J. 2018, 28, 98–102. [Google Scholar] [CrossRef]
Figure 1.
Flow diagram of TOPSIS-DT method.

Figure 2.
Location of the study area in Beijing (enclosed area of dashed line).

Figure 3.
The road network topology map of Beijing Second Ring.

Figure 4.
Normalized values of node degrees.

Figure 5.
Spatial distribution of node degree.

Figure 6.
Normalized values of node betweenness.

Figure 7.
Spatial distribution of node betweenness.

Figure 8.
Normalized values of traffic loads of nodes.

Figure 9.
Spatial distribution of traffic loads of nodes.

Figure 10.
Clustering results of nodes.

Figure 11.
Spatial distribution of node classification.

Figure 12.
Overall importance values of nodes.

Figure 13.
Final classification results.

Figure 14.
Distribution map of key nodes of the urban road network.

Figure 15.
Ranking of the first-grade nodes.


Table 1.
Description of some comprehensive evaluation methods.
| Methods | Advantages | Disadvantages | Applicability |
|---|---|---|---|
| FCM clustering method [14], Self-organizing competition neural network clustering method [15], Adaptive clustering method [19] | The clustering results and related parameters are obtained automatically according to the characteristics of index data. | It is necessary to determine the classification parameters in advance, and the correlation between indicators is seldom considered. | It is suitable for large-grained network cluster structure, the network of core and peripheral structure can only be roughly divided. |
| GRA [20], PCA [21], CSM [22], TOPSIS [17,18] | The correlation of the index and the influence of the index weight are considered, and the ranking of each evaluation object can be obtained. | The importance ranking of nodes can only be given, and the importance level needs to be artificially divided. The spatial heterogeneity of road network are not considered. | It is suitable for comprehensive evaluation of the importance of road network nodes based on multiple indicators and can give the ranking and horizontal comparison of network nodes. |
Table 2.
Emergency function guarantees grade requirements of road network nodes.
| Grade | Basic Requirements |
|---|---|
| Ⅰ | It is not interrupted during the event or must be enabled immediately after the event. The recovery time ranges from a few minutes to a few hours. Ensure the safety of the main structure and auxiliary facilities of emergency through design before the event. |
| Ⅱ | After the event, a certain preparation time for emergency inspection is allowed, which is limited to a few hours to 1 day, but usually does not include the emergency repair of the main structure. Before the event, it is designed to ensure the safety of the main structure and ancillary facilities that affect the important emergency functions. |
| Ⅲ | Damage may occur during an event, but it can be replaced in other ways or can be put into use through emergency repair and emergency settings after the event. The main structure ensures the selection and setting of safety or post-event emergency redundancy schemes through pre-event design. |
Publisher’s Note: MDPI stays neutral with regard to jurisdictional claims in published maps and institutional affiliations. |
© 2022 by the authors. Licensee MDPI, Basel, Switzerland. This article is an open access article distributed under the terms and conditions of the Creative Commons Attribution (CC BY) license (https://creativecommons.org/licenses/by/4.0/).
Share and Cite
MDPI and ACS Style
Liu, C.; Yin, H.; Sun, Y.; Wang, L.; Guo, X. A Grade Identification Method of Critical Node in Urban Road Network Based on Multi-Attribute Evaluation Correction. Appl. Sci. 2022, 12, 813. https://doi.org/10.3390/app12020813
AMA Style
Liu C, Yin H, Sun Y, Wang L, Guo X. A Grade Identification Method of Critical Node in Urban Road Network Based on Multi-Attribute Evaluation Correction. Applied Sciences. 2022; 12(2):813. https://doi.org/10.3390/app12020813
Chicago/Turabian StyleLiu, Chaofeng, He Yin, Yixin Sun, Ling Wang, and Xiaodong Guo. 2022. "A Grade Identification Method of Critical Node in Urban Road Network Based on Multi-Attribute Evaluation Correction" Applied Sciences 12, no. 2: 813. https://doi.org/10.3390/app12020813
Note that from the first issue of 2016, this journal uses article numbers instead of page numbers. See further details here.