
Model-Based Methods to Produce Greener Metakaolin Composite Concrete


1
Department of Architectural Engineering, Kangwon National University, Chuncheon-Si 24341, Korea
2
Department of Integrated Energy and Infra System, Kangwon National University, Chuncheon-Si 24341, Korea
*
Author to whom correspondence should be addressed.
Appl. Sci. 2021, 11(22), 10704; https://doi.org/10.3390/app112210704
Submission received: 13 October 2021
/
Revised: 11 November 2021
/
Accepted: 11 November 2021
/
Published: 12 November 2021
(This article belongs to the Special Issue Carbon Neutrality and Carbon Reductions in the Concrete Industry)
Abstract
:Featured Application
1. Estimate strength development of metakaolin composite concrete; 2. Estimate sustainability of blended concrete; 3. Material design of greener blended concrete.
Abstract
Metakaolin is reactive and is widely used in the modern concrete industry. This study presents an integrated strength–sustainability evaluation framework, which we employed in the context of metakaolin content in concrete. First, a composite hydration model was employed to calculate reactivity of metakaolin and cement. Furthermore, a hydration-based linear equation was designed to evaluate the compressive strength development of metakaolin composite concrete. The coefficients of the strength evaluation model are constants for different mixtures and ages. Second, the sustainability factors—CO2 emissions, resource consumption, and energy consumption—were determined based on concrete mixtures. Moreover, the sustainability factors normalized for unit strength were obtained based on the ratios of total CO2 emissions, energy consumption, and resource consumption to concrete strength. The results of our analysis showed the following: (1) As the metakaolin content increased, the normalized CO2 emissions and resource consumption decreased, and the normalized energy first decreased and then slightly increased. (2) As the concrete aged from 28 days to three months, the normalized CO2 emissions, resource consumption, and energy consumption decreased. (3) As the water/binder ratio decreased, the normalized CO2 emissions, resource consumption, and energy consumption decreased. Summarily, the proposed integrated strength–sustainability evaluation framework is useful for finding greener metakaolin composite concrete.
1. Introduction
Metakaolin mainly consists of SiO2 and Al2O3 and shows high reactivity. The addition of metakaolin can provide various benefits to concrete, such as increased late age strength, enhanced chloride ingress and acid resistance, and lower shrinkage and greenhouse gas emissions [1,2]. In recent years, metakaolin has increasingly been used for concrete manufacturing.
Strength is one of the fundamental engineering properties of structural concrete. The evaluation of strength development is meaningful for structural element design and construction management. Many numerical models have been presented for evaluating the strength of metakaolin composite concrete. Razak and Wong [3] proposed a strength model that analyzes the efficiency of metakaolin using metakaolin replacement percentage, water/binder ratio, and age. Using the concept of efficiency factor, Papadakis and Demis [4] and Badogiannis et al. [5] proposed a software package that evaluates the strength class and service life of blended concrete. In addition to the efficiency factor method, some strength models have been proposed that use machine learning methods. Mustafa [6], Moradi et al. [7], Y. Sharifi and M. Hosseinpour [8] analyzed the strength of metakaolin concrete by using artificial neural networks. Asteris et al. [9] analyzed the strength using multivariate adaptive regression splines and an M5P model tree. Oluwatobi et al. [10] analyzed strength development based on the method of gene expression programming. Ayobami [11] evaluated the strength of self-compacting metakaolin composite concrete using response surface analysis.
Sustainability is becoming more and more important for the modern concrete industry. Many studies have evaluated the sustainability of concrete. Tae et al. [12] performed lifecycle CO2 evaluations of different concretes and found that high strength concrete can lower lifecycle energy consumption. Mena et al. [13] proposed a blended system that can reduce CO2 emissions by 40% for structural light-weight aggregate concrete. Possan et al. [14] proposed models to calculate the CO2 emissions and CO2 uptake of composite concrete. Long et al. [15] calculated the CO2 emissions, energy consumption, and resource consumption of self-compacting concrete with various mineral admixtures. Gusano et al. [16] reported that material substitution and CO2 capture technology are useful for making low-CO2-emission cement. Mane et al. [17] reported when 20% of cement was replaced by pozzolanic materials, the number of cracks and width of cracks can be reduced. Dawood et al. [18] made a cost analysis between ferrocement panels and conventional reinforced concrete, and showed ferrocement panels can reduce the initial cost by about 27%. Konecny et al. [19] proposed an effective methodology of sustainable assessment of concrete mixtures considering environmental impact, performance, service life, and cost.
Although various models have been used to evaluate strength and sustainability, said models present some weakness. Regarding the strength evaluation models, machine learning-based ones are black box techniques that do not consider the physical/chemical processes of binder hydration and strength development. Moreover, the extrapolation ability of machine learning-based models is very weak. When the ranges of input parameters, such as water/binder ratio, metakaolin/binder ratio, and age fall outside of the ranges of the training data, a machine learning-based model cannot be used. In addition, although the physical meaning of the efficiency factor method is much clearer than the workings of a machine learning-based model, it is difficult to obtain an accurate equation for the efficiency factor that accounts for various mixtures and curing ages. Lastly, previous models mainly focused on single aims, such as a strength evaluation or evaluating CO2 emissions. A dual-aim model which can evaluate both strength and CO2 emissions is necessary.
To conquer the weak points of previous numerical models, this research proposes an integrated framework for evaluations of strength and sustainability. A linear equation based on a composite hydration model is proposed to calculate the strength evolution of metakaolin composite concrete. Moreover, the normalized CO2 emissions, resource consumption, and energy consumption for unit strength were obtained. Methods for greener metakaolin composite concrete were found.
The structures of this study are as follows: the current section is the introduction; the second and third sections show evaluations of strength and sustainability, respectively; the fourth section is the discussion, and the last section presents the conclusions.
2. The Strength Evaluation Model
2.1. A Hydration-Based Strength Model of Composite Concrete
The strength evolution of hardening concrete closely relates to binder hydration. As binder hydration increases, the hydration products can fill the pore space and contribute to the development of strength. Moreover, regarding the metakaolin composite concrete, because cement and metakaolin reactions coincide, metakaolin composite concrete shows a more complex hydration process than plain concrete without metakaolin [20].
In our previous studies [21,22,23], a composite hydration model was presented for metakaolin composite concrete. Cement hydration and metakaolin reaction were simulated separately. Moreover, the interactions between the reactions of metakaolin and cement were considered using the contents of calcium hydroxide and the capillary water content. The hydration extent of Portland cement can be calculated as , where is the rate of Portland cement hydration, and the degree of reaction of metakaolin can be calculated as , where is the rate of metakaolin reaction. Our previous studies [21,22,23] showed details of equations for the cement hydration rate and the rate of metakaolin reaction.
Maekawa et al. [24] proposed that for plain concrete, strength can be expressed as a linear equation of the degree of reaction of cement. Based on a similar idea, we assumed for metakaolin composite concrete that the strength of concrete can be determined as a linear equation of the hydration degree of Portland cement and the reaction extent of metakaolin as follows:
where , , and are strength coefficients; , , and are the masses of Portland cement, metakaolin, and water in the concrete mix proportions, respectively. The unit of strength coefficients , , and is MPa. considers the effect of cement hydration on strength. considers the effect of the metakaolin reaction on strength, and considers strength to start after a threshold age, not immediately at time-point zero. This is like final setting (hardening of concrete starts after the time of final setting). Moreover, because the composite hydration model considers the influences of concrete mixtures and curing ages, the values of strength coefficients , , and do not change as concrete mixtures and curing ages vary.
2.2. Verification of the Strength Evaluation Model
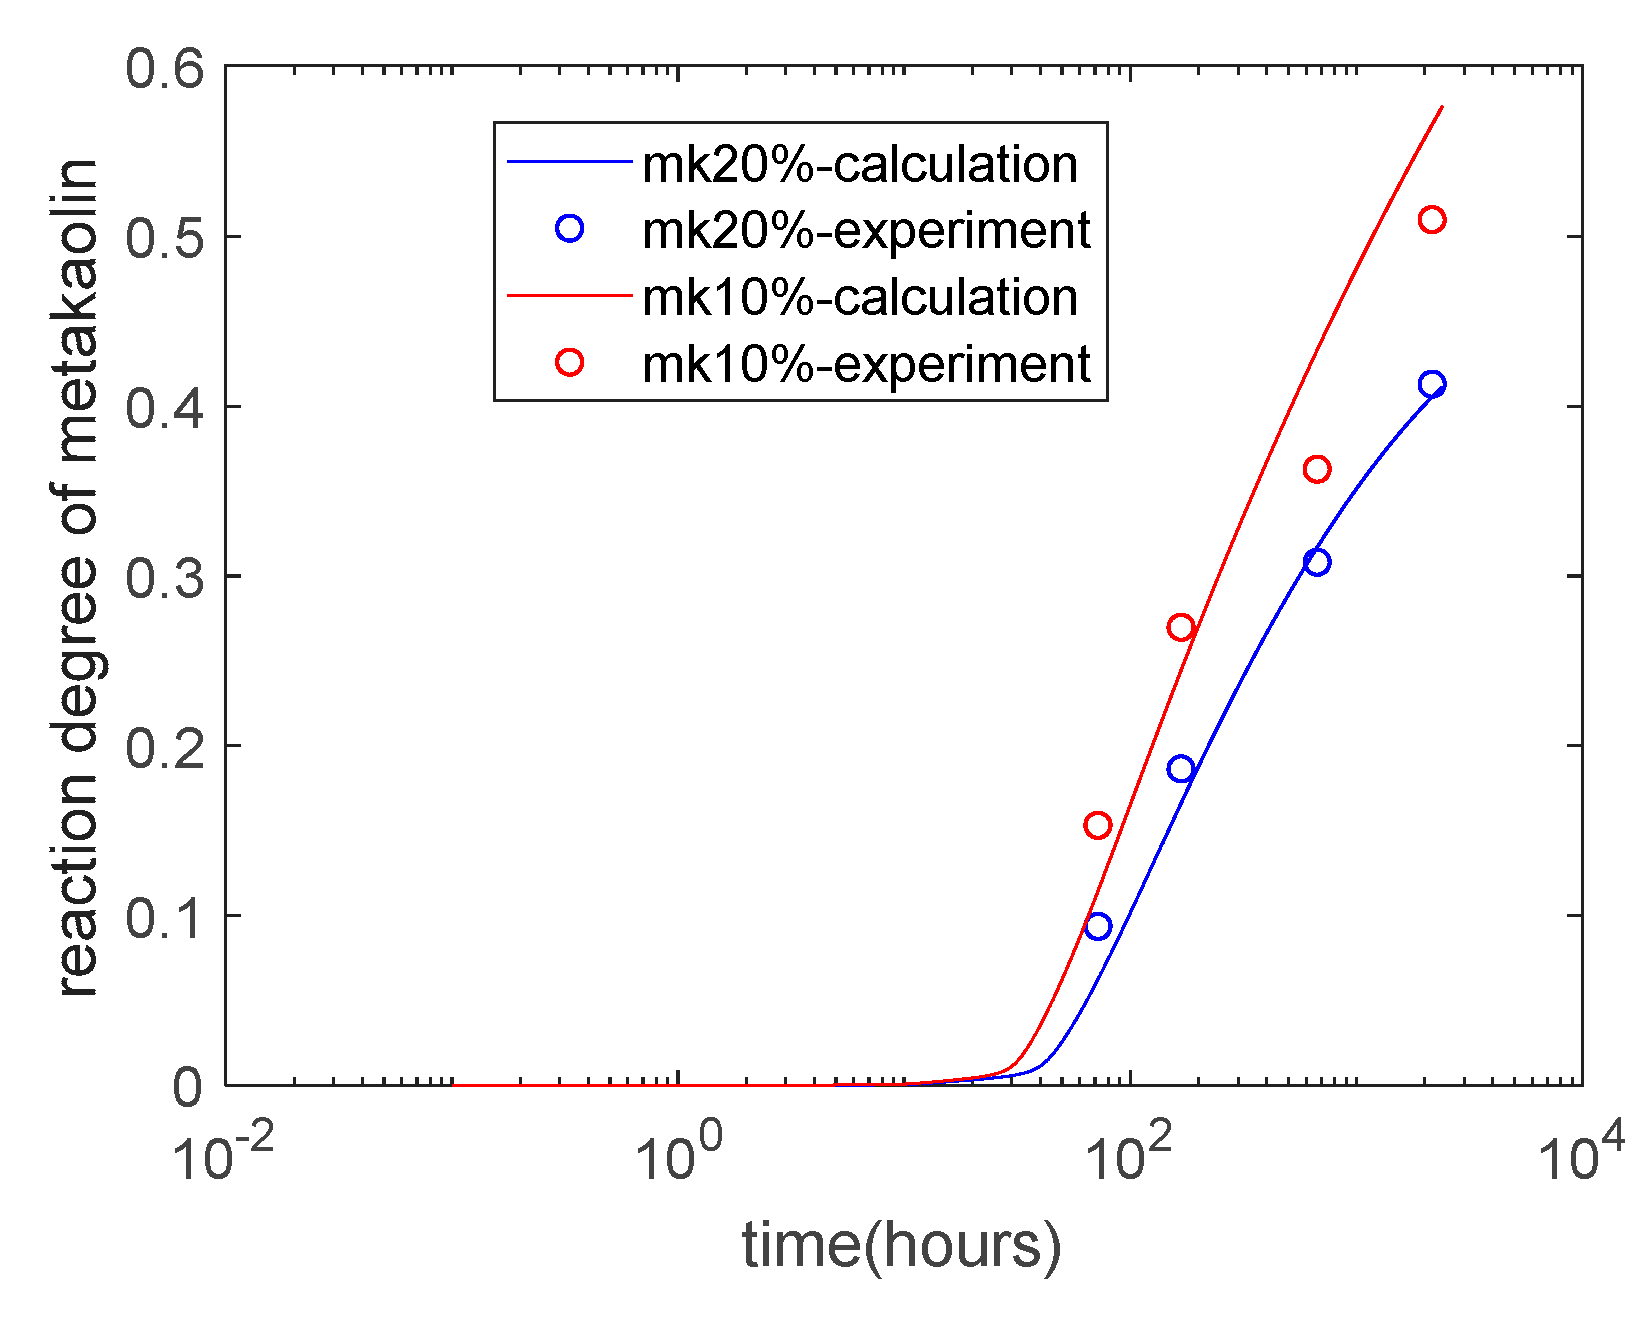
The strength evaluation model was verified using experimental results from references [25,26]. Poon et al. [25] measured the reaction extent of metakaolin in a cement–metakaolin composite at 3, 7, 28, and 90 days of age. The water/binder ratio of composite paste specimens was 0.30. The degree of reaction of metakaolin was measured using selective dissolution methods. Figure 1 shows the analysis results versus experimental results of metakaolin’s degree of reaction. First, we can see that as the replacement percentage of metakaolin increased from 10% to 20%, the degree of reaction of metakaolin decreased. This is because of the reduction in the alkali activation impact of calcium hydroxide [27]. Second, at 90 days old, the degree of reaction of metakaolin was about 40–50%, which was much lower than hydration degree of Portland cement. In other words, the pozzolanic reaction of metakaolin is much slower than that of cement.
Seddik et al. [26] performed extensive experimental studies on the strength of metakaolin composite concrete. The mixtures of specimens are shown in the Table 1. In total, 24 mixtures were used. The water/binder ratio of concrete specimens ranged from 0.45 to 0.65. The metakaolin/binder ratios of concrete specimens ranged from 0 to 25%, the curing temperature was 20 °C, and the ages during compressive strength measurements ranged from 1 day to 365 days.
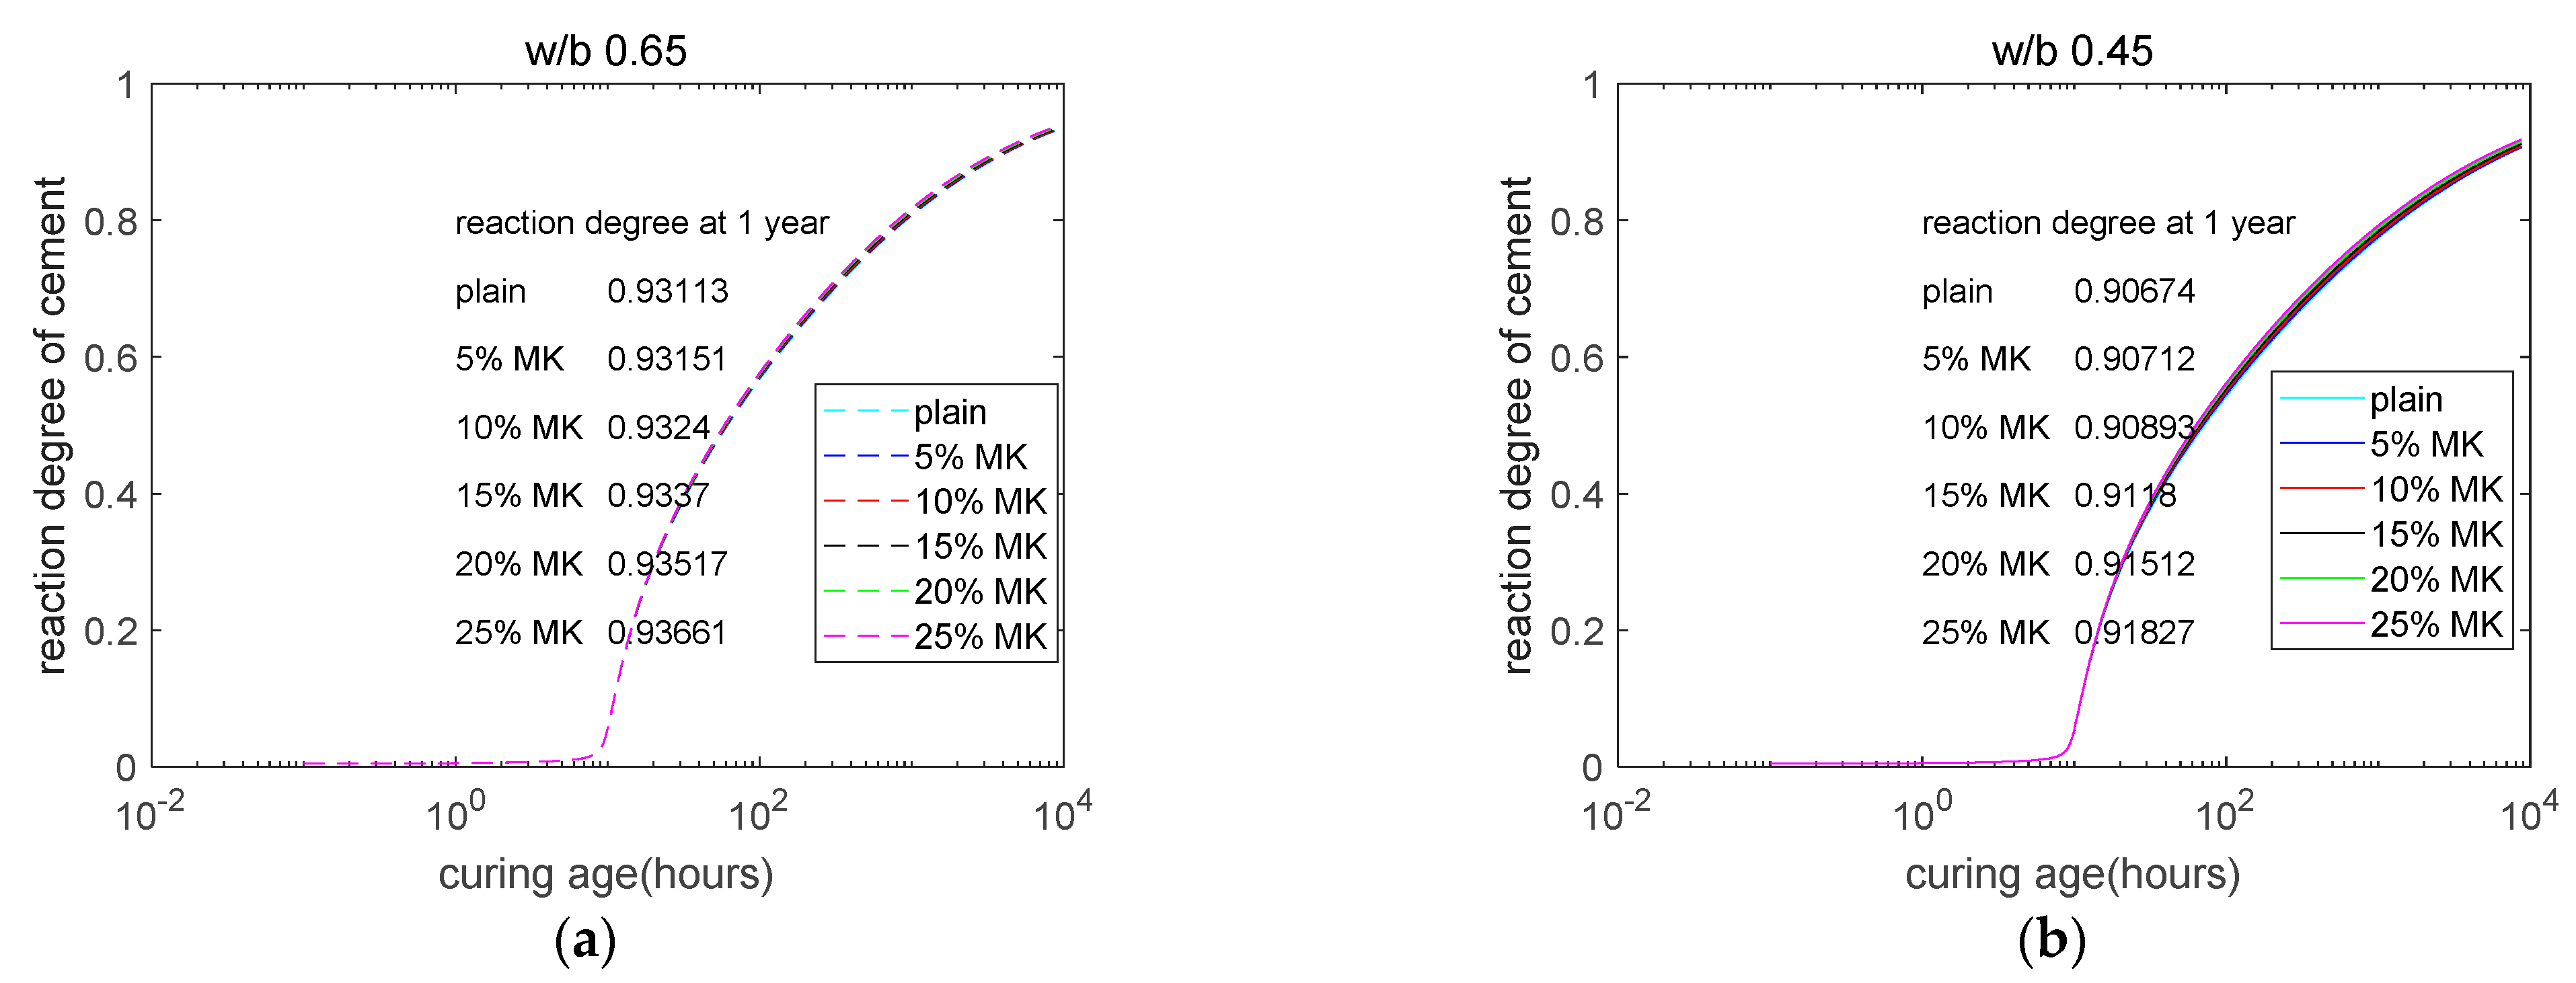
The input parameters of the hydration model are concrete mixtures and curing temperatures. Based on the mixtures shown in Table 1, the degrees of reaction of cement and metakaolin in cement–metakaolin binary composite concretes were determined. As shown in Figure 2a, for the water/binder ratio 0.65 group, after the addition of metakaolin, the improvement in the hydration extent of Portland cement was marginal. Compared with the water/binder ratio 0.65 group, the hydration degree of Portland cement in the water/binder ratio 0.45 group was slightly higher (shown in Figure 2b). This was because, compared with the water/binder ratio 0.65 group, the dilution effect from the addition of metakaolin for water/binder ratio 0.45 group was more obvious. Moreover, as the water/binder ratio decreased from 0.65 to 0.45, the hydration extent of Portland cement decreased. This was because of the shortage of capillary water for concrete specimens with lower water/binder ratios.
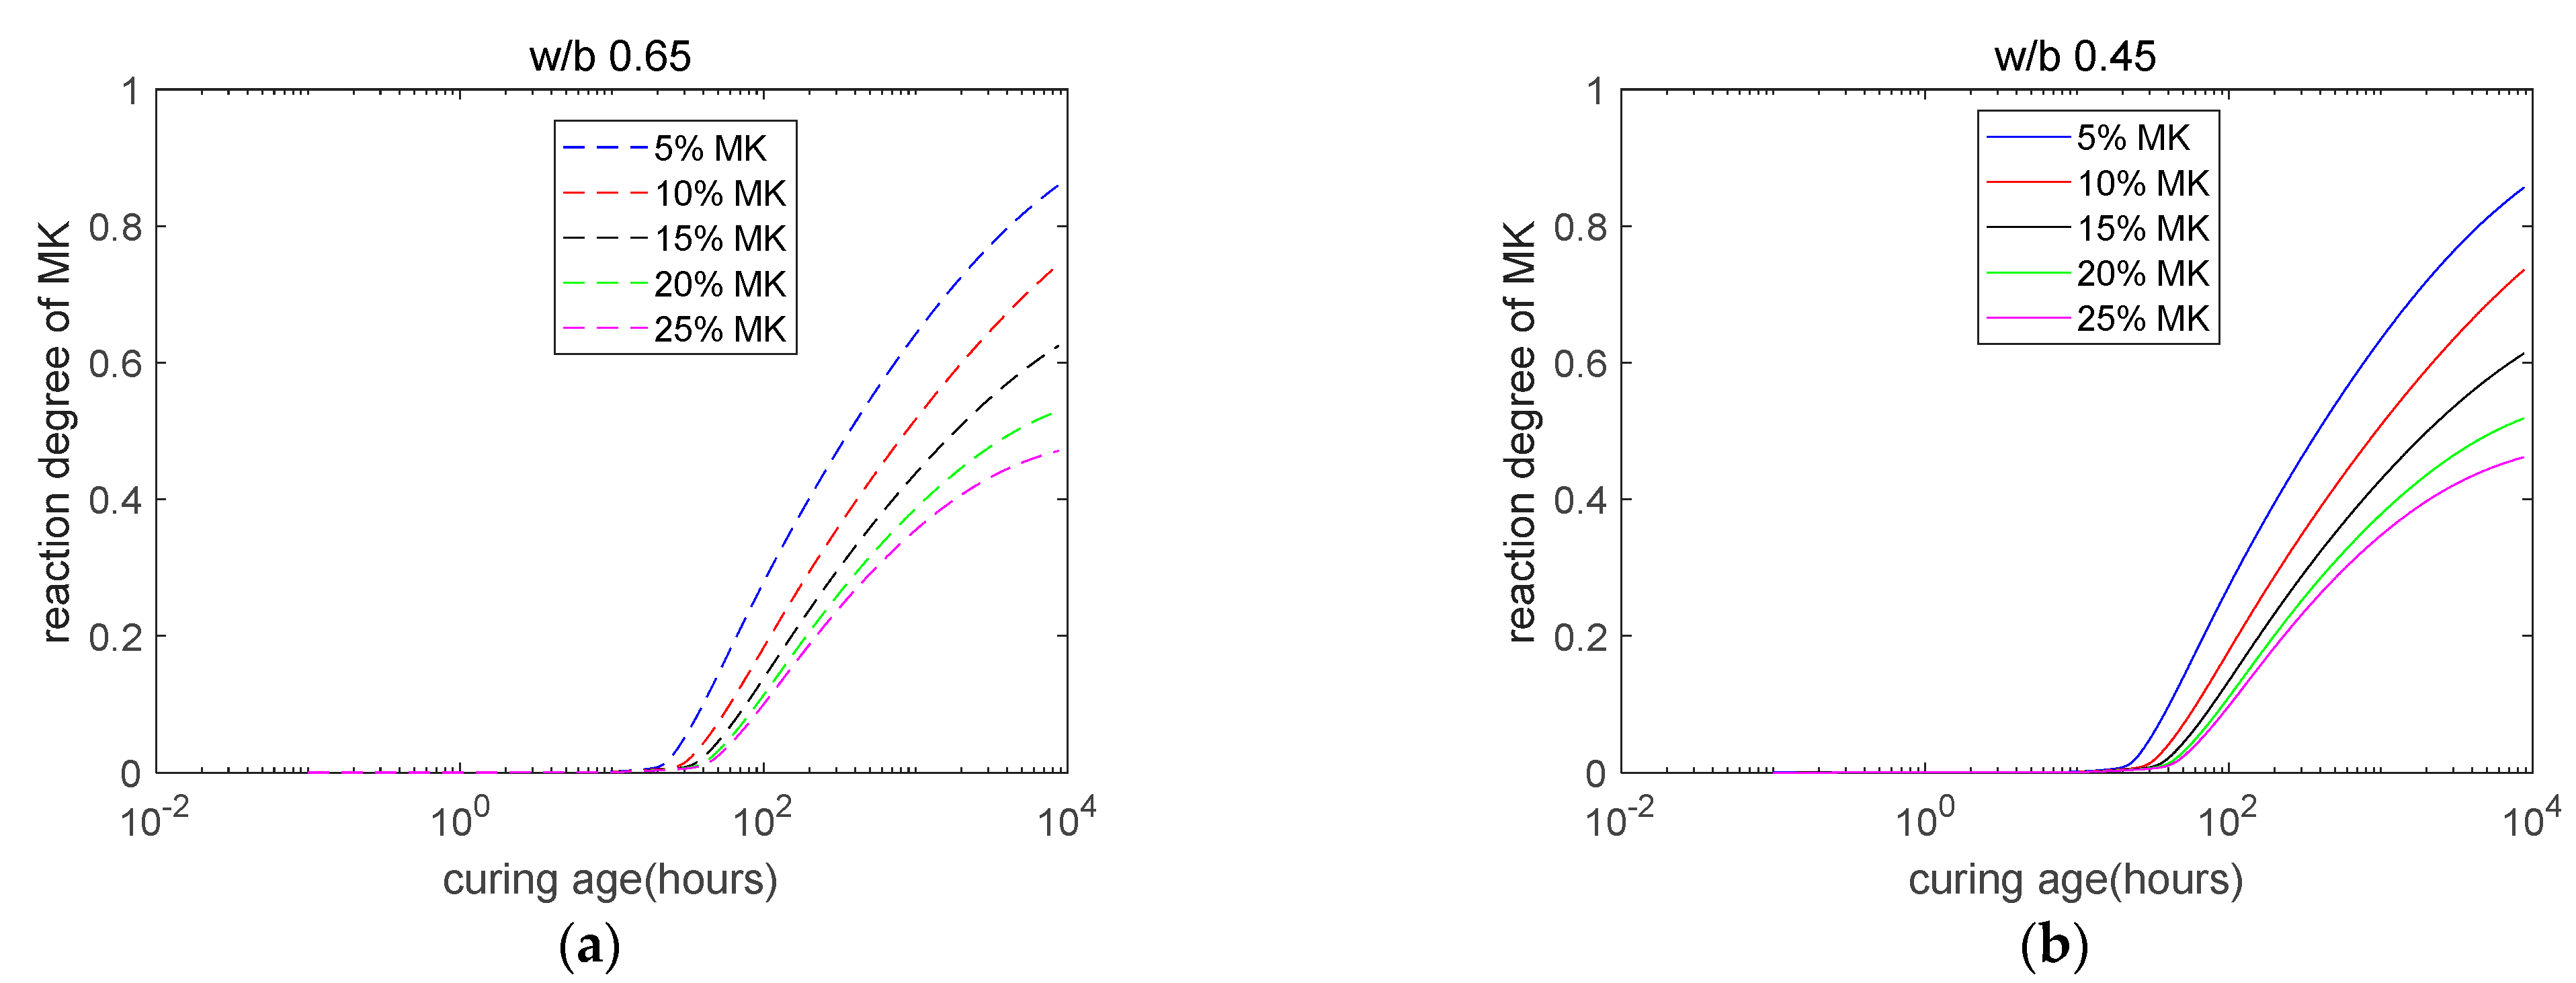
Figure 3a,b show that, as the replacement ratio of metakaolin increases, the degree of reaction of metakaolin greatly reduces. When the water/binder ratio changes from 0.65 to 0.45, the degree of reaction of metakaolin slightly reduces. Hence, compared with the water/binder ratio, the impact of the replacement percentage on the degree of reaction of metakaolin is more significant. Moreover, based on the comparison of Figure 2 and Figure 3, we can see the reactivity of Portland cement is much stronger than that of metakaolin.
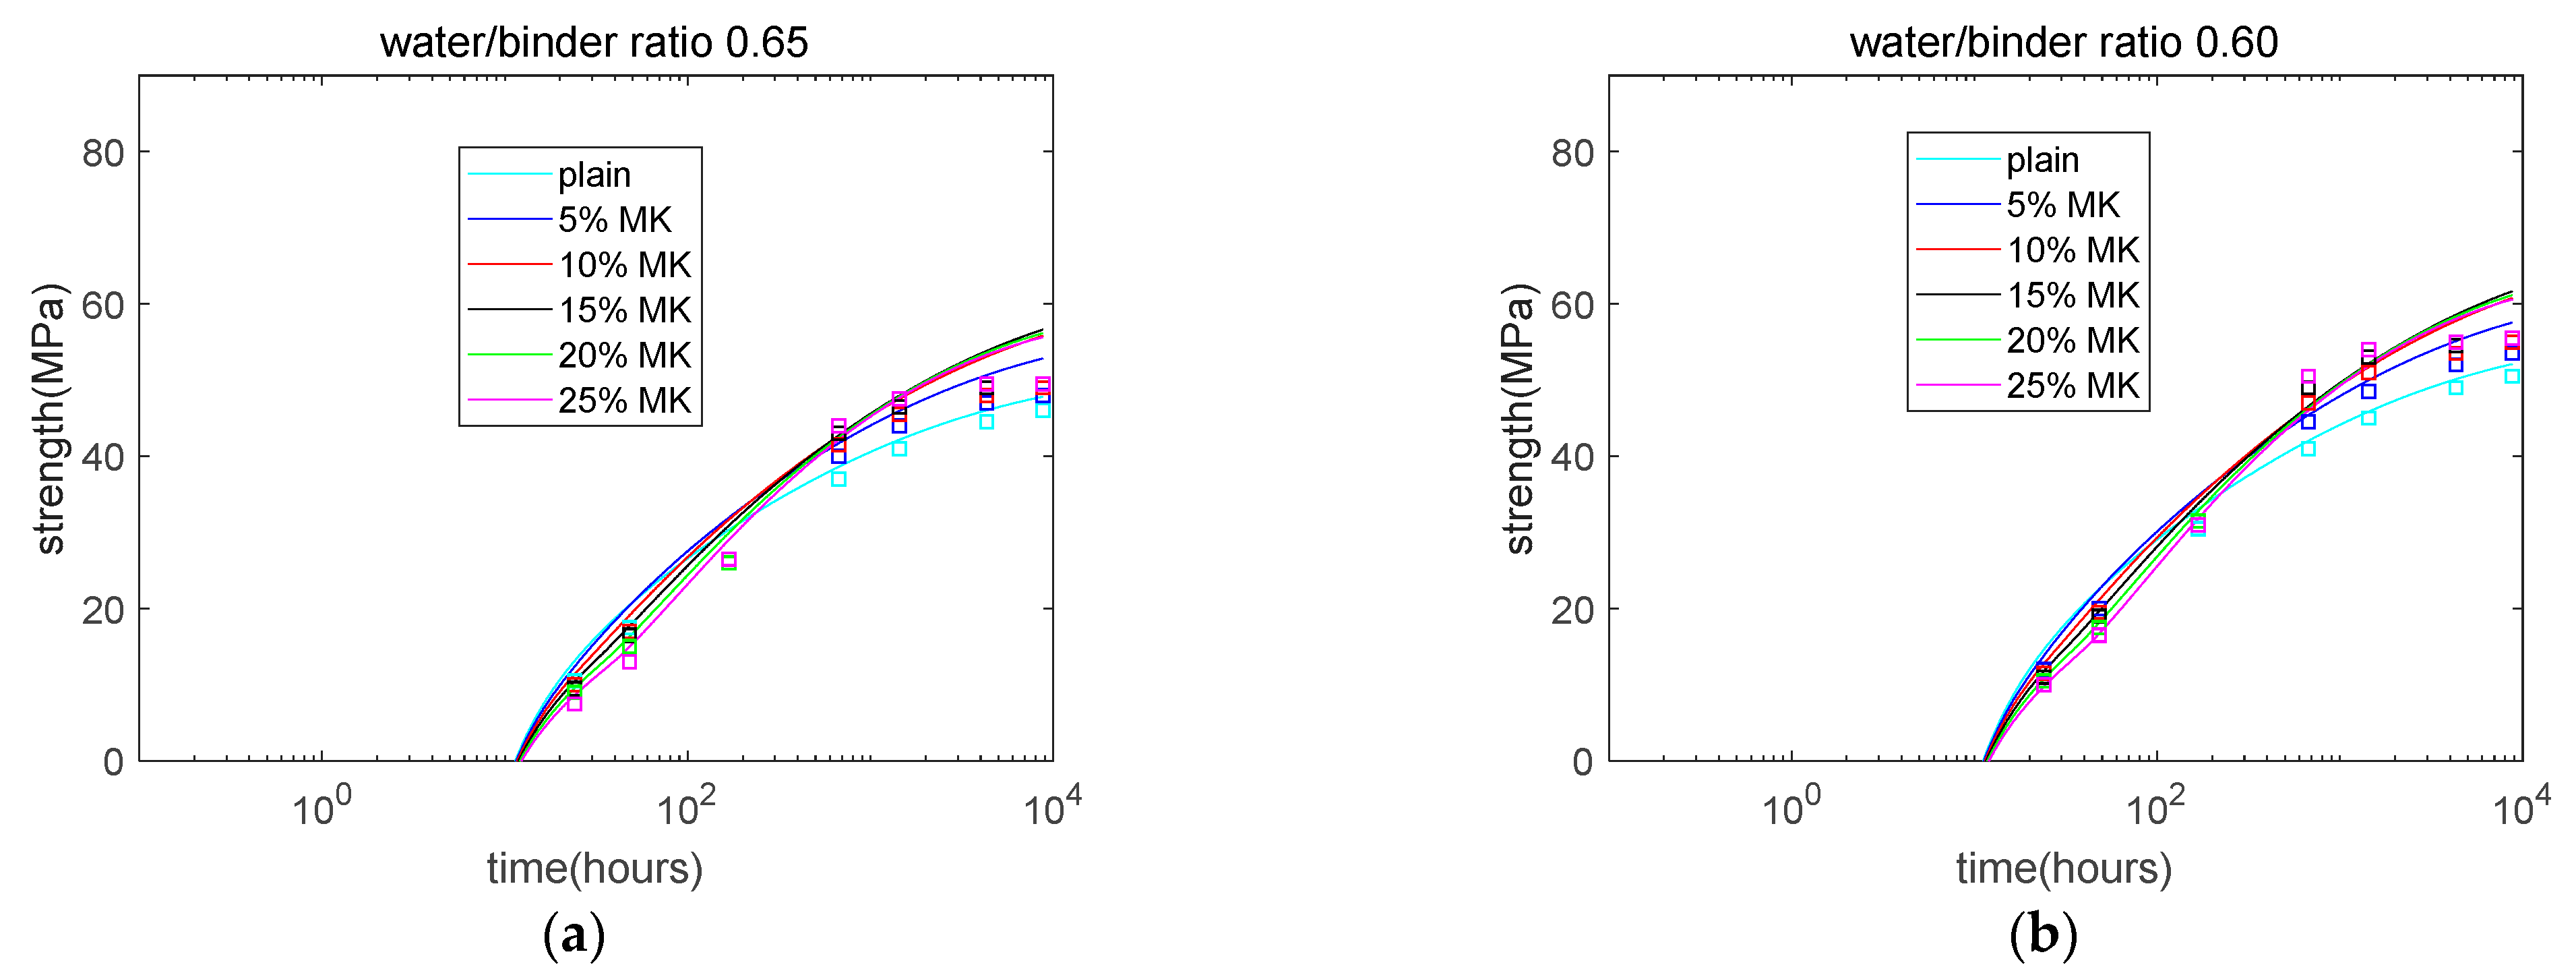
Based on the results of concrete strength at various ages [26], the strength coefficients , , and of Equation (1) were calculated as 37.91, 116.71, and 6.48 MPa, respectively. These strength coefficients do not vary for different mixtures and ages. The strength coefficient of metakaolin is much higher than that of cement . This may be because metakaolin has higher SiO2 content than cement. Higher SiO2 content is helpful for the formation of secondary calcium silicate hydrate, which is the essential hydration product for concrete strength [28,29].
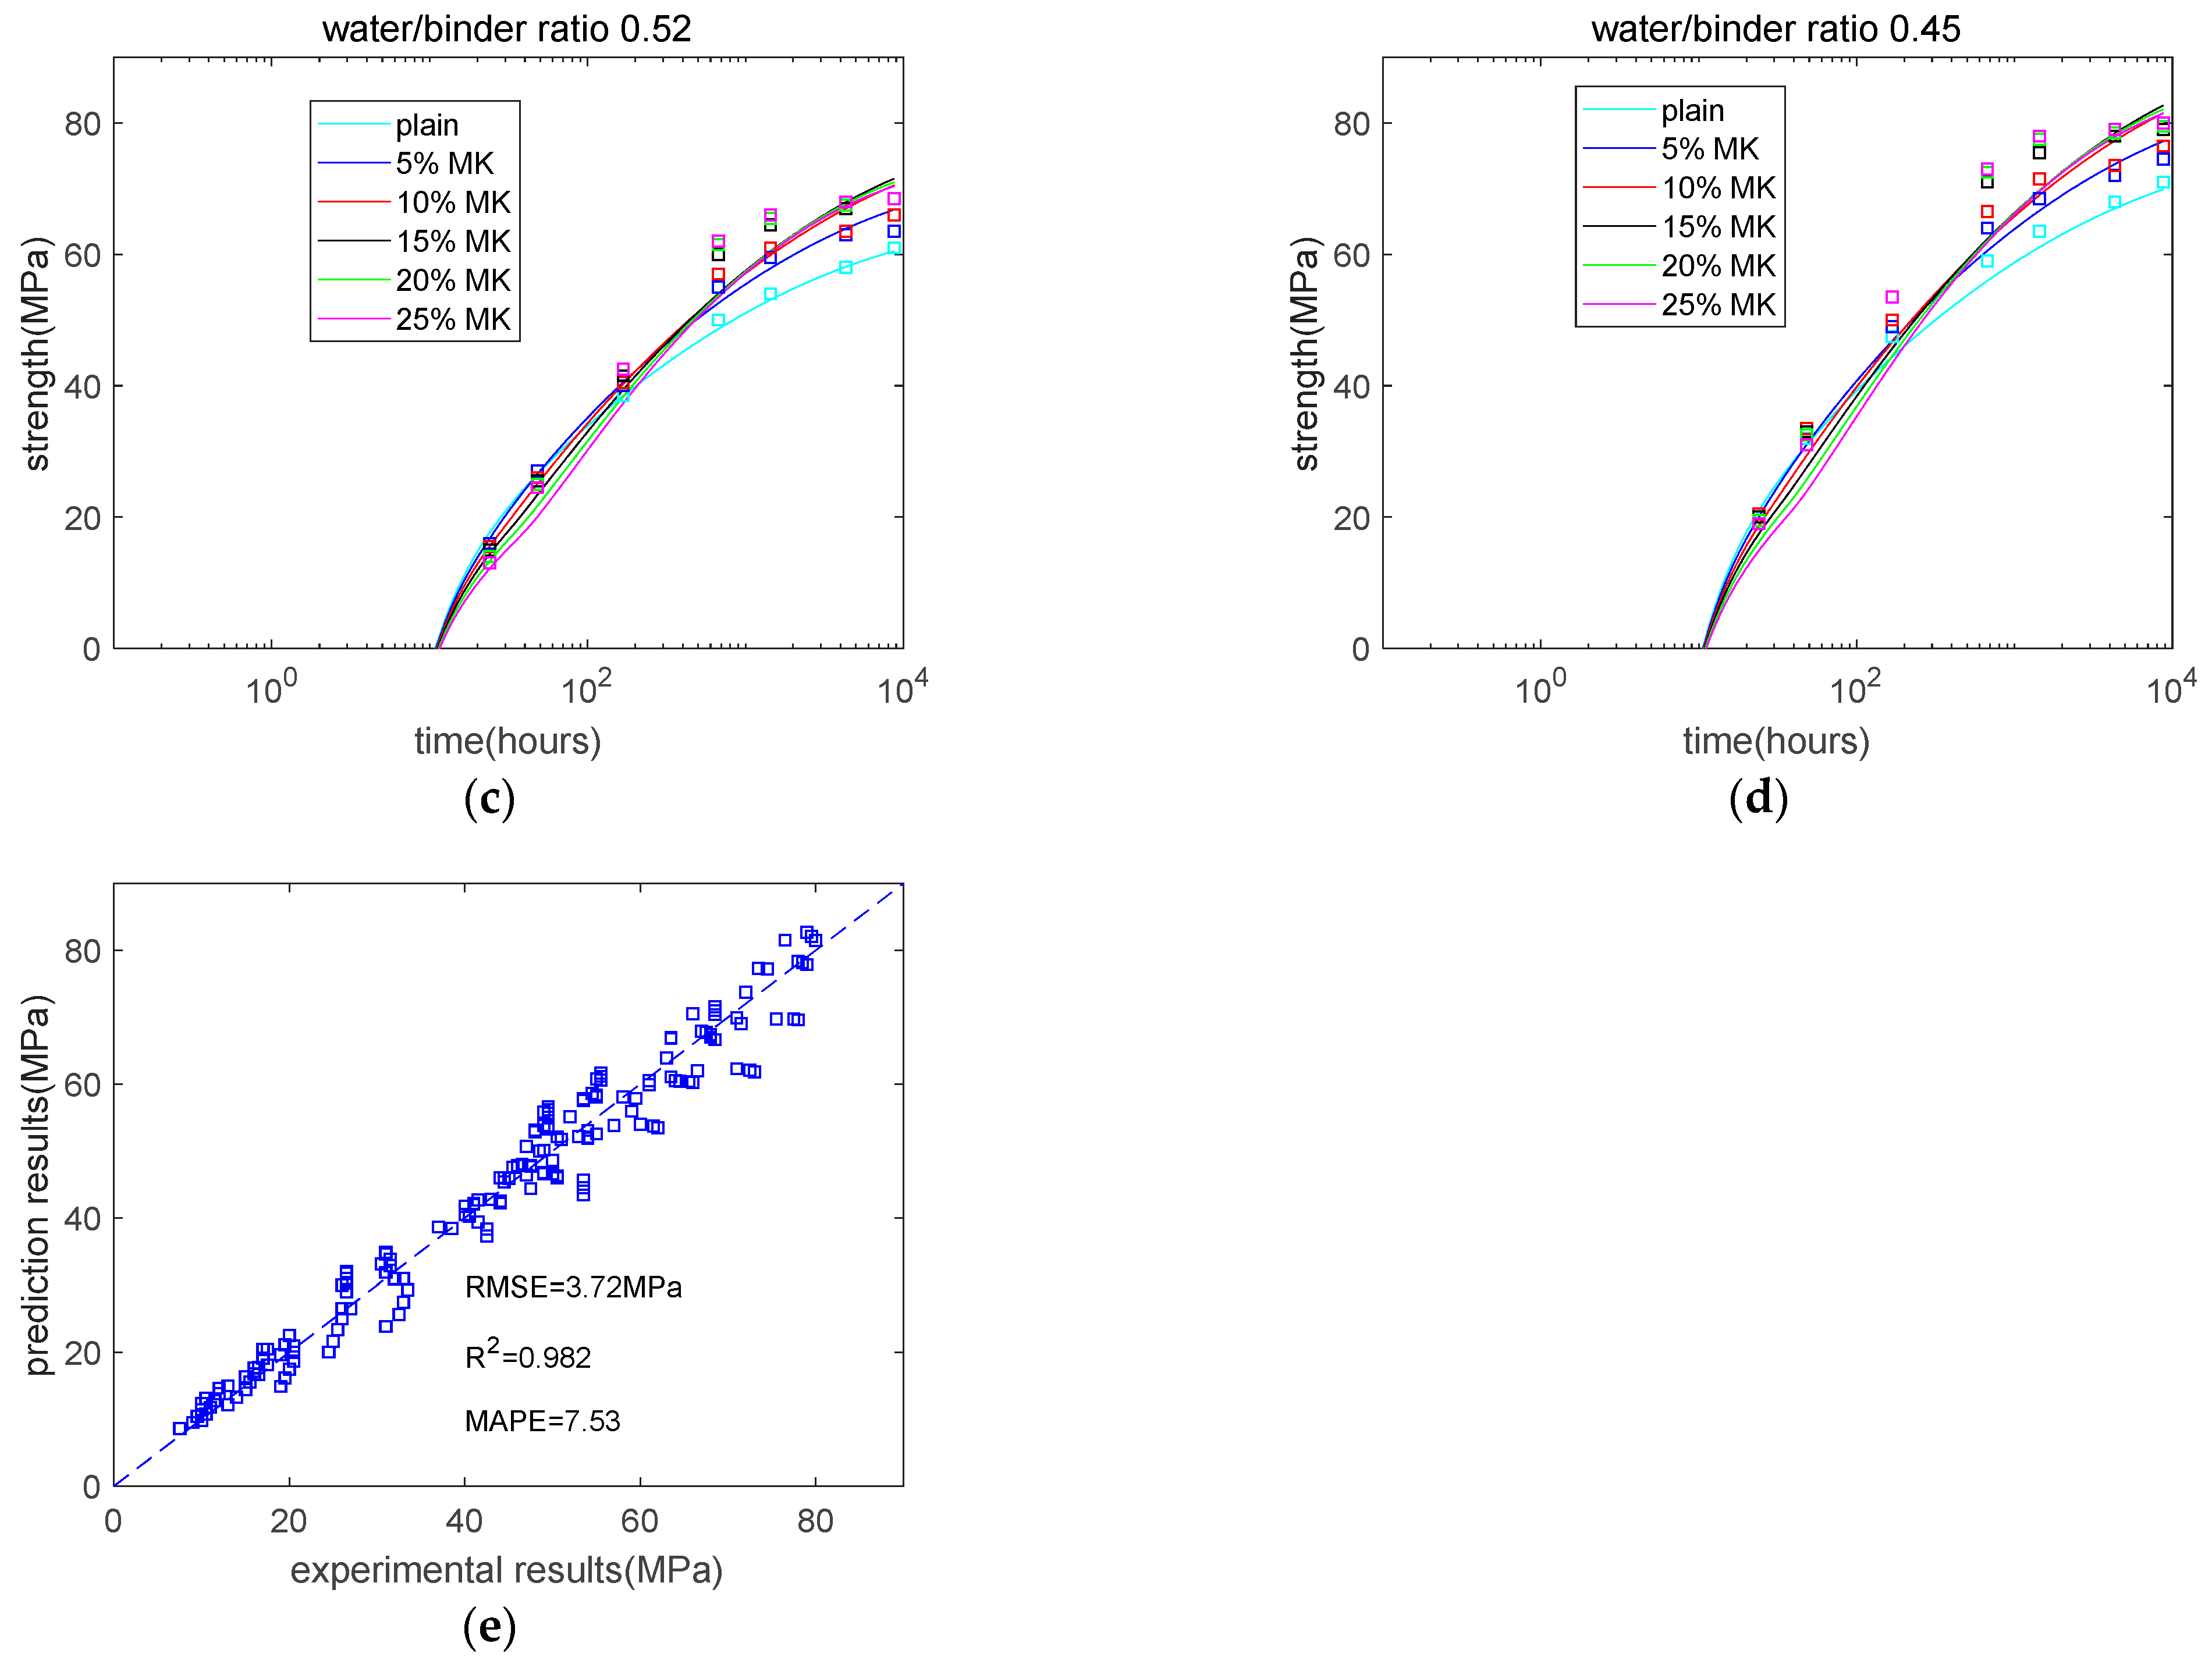
Figure 4a–d shows that at early ages, metakaolin composite concrete has less strength than plain concrete. At early ages, more metakaolin means lower concrete strength. When older, metakaolin composite concrete has greater strength than plain concrete because of the pozzolanic reaction of metakaolin. In other words, the proposed strength development model can reflect the crossover phenomenon of the strength between plain concrete and metakaolin composite concrete [30]. Moreover, the strength development model also found the strength development of concrete does not start immediately, but starts at a threshold age. Before this threshold age, the strength is zero, and after this threshold age, the strength is higher than zero. The threshold age is like final setting age. In concrete terminology, final setting is the starting time for hardening. In addition, the strength development model shows that as the water/binder ratio reduces, the strength of the concrete increases. Given a certain water content, larger quantities of binder have two effects. One is increasing the available binder for hydration, and the other is decreasing the extent of hydration. The overall results are the formation of more hydration products and higher compressive strength. This agrees with Abram’s law. Figure 4e shows experimental results versus analysis results. The root mean square error (RMSE) of the prediction was 3.72 MPa, the mean absolute percentage error (MAPE) of the prediction is 7.53, and the coefficient of determination (R2) was 0.982. This high coefficient of determination shows the accuracy of the proposed strength development model [31]. Summarily, the proposed hydration–strength model can give reasonable evaluation results of strength for metakaolin composite concrete with various mix combinations and various curing ages. Moreover, because the strength evaluation equation is a linear equation with three coefficients, three experimental data points of compressive strength are enough to calibrate the values of strength coefficients , , and . Compared with the huge amounts of experimental data used for machine learning-based methods, the number of experimental data required for the hydration-based strength model is remarkably low.
3. The Sustainability Evaluation Model and Methods for Achieving Sustainability
3.1. The Sustainability Evaluation Model
The sustainability of concrete depends on many indexes, such as CO2 emissions, energy consumption, and resource consumption [32]. The CO2 emissions of concrete, , can be determined as the sum of individual components [33,34,35,36,37] as follows:
where i = 1,6 means concrete components, such as cement, metakaolin, sand, stone, superplasticizer, and water. means the mass of each component of concrete in the concrete mixture (shown in the Table 1). denotes the CO2 emissions of 1 kg of each concrete component (shown in the Table 2). Moreover, based on total CO2 emissions, the normalized CO2 emissions, for unit strength can be determined as follows:
In Equation (3), the unit of is kg/m3, and the unit of is kg/m3/MPa. Moreover, based on similar methods, the normalized energy consumption for unit strength can be calculated as the ratio of total energy consumption to concrete strength [38]. The normalized resource consumption for unit strength can be calculated as the ratio of total resource consumption to concrete strength. Moreover, because the strength is dependent on age, the normalized CO2 emissions, normalized resource consumption, and normalized energy consumption also depend on the curing age.
3.2. Methods for Achieving Sustainability
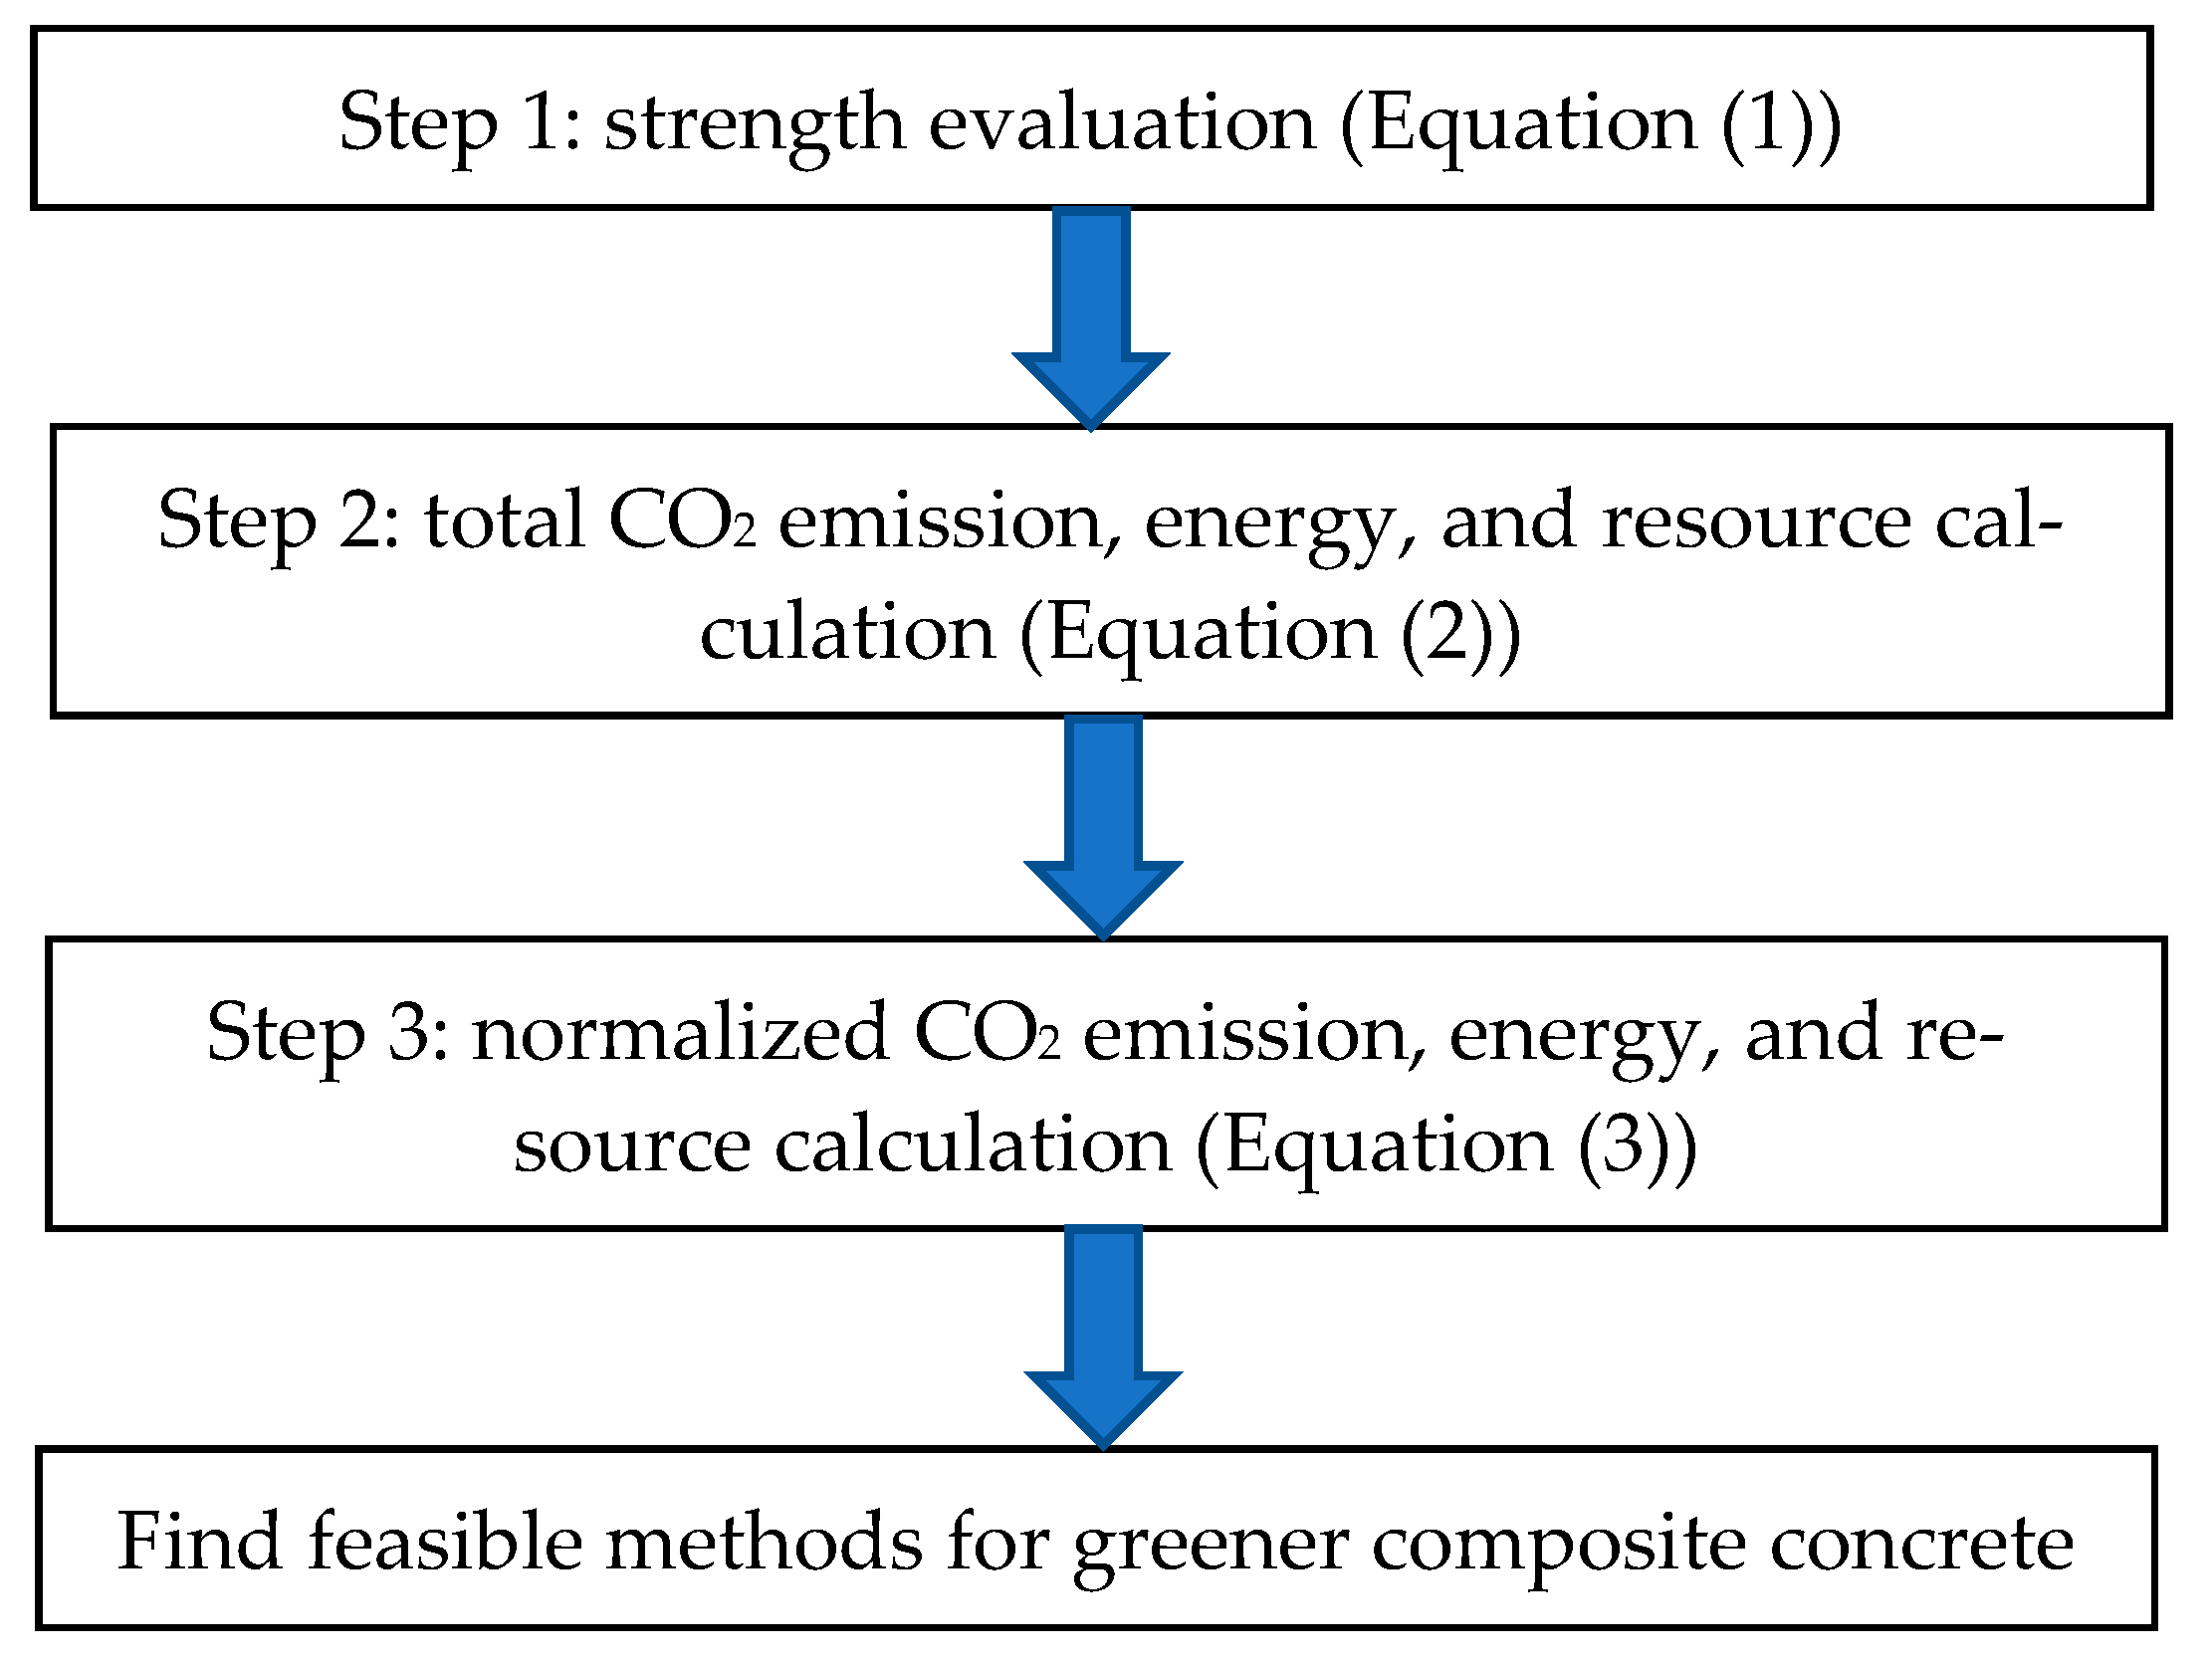
As shown in the Figure 5, the steps for the analysis of the sustainability of concrete can be summarized as follows:
First, based on the composite hydration model, the strength of metakaolin composite concrete can be determined using Equation (1). Second, based on concrete mixtures, the total CO2 emissions, energy consumption, and resource consumption for 1 m3 of concrete can be determined using Equation (2). Third, the sustainability factors—normalized CO2 emissions, normalized energy consumption, and normalized resource consumption—can be determined using Equation (3). Finally, feasible methods for greener composite concrete can be found based on the results of parameter studies.
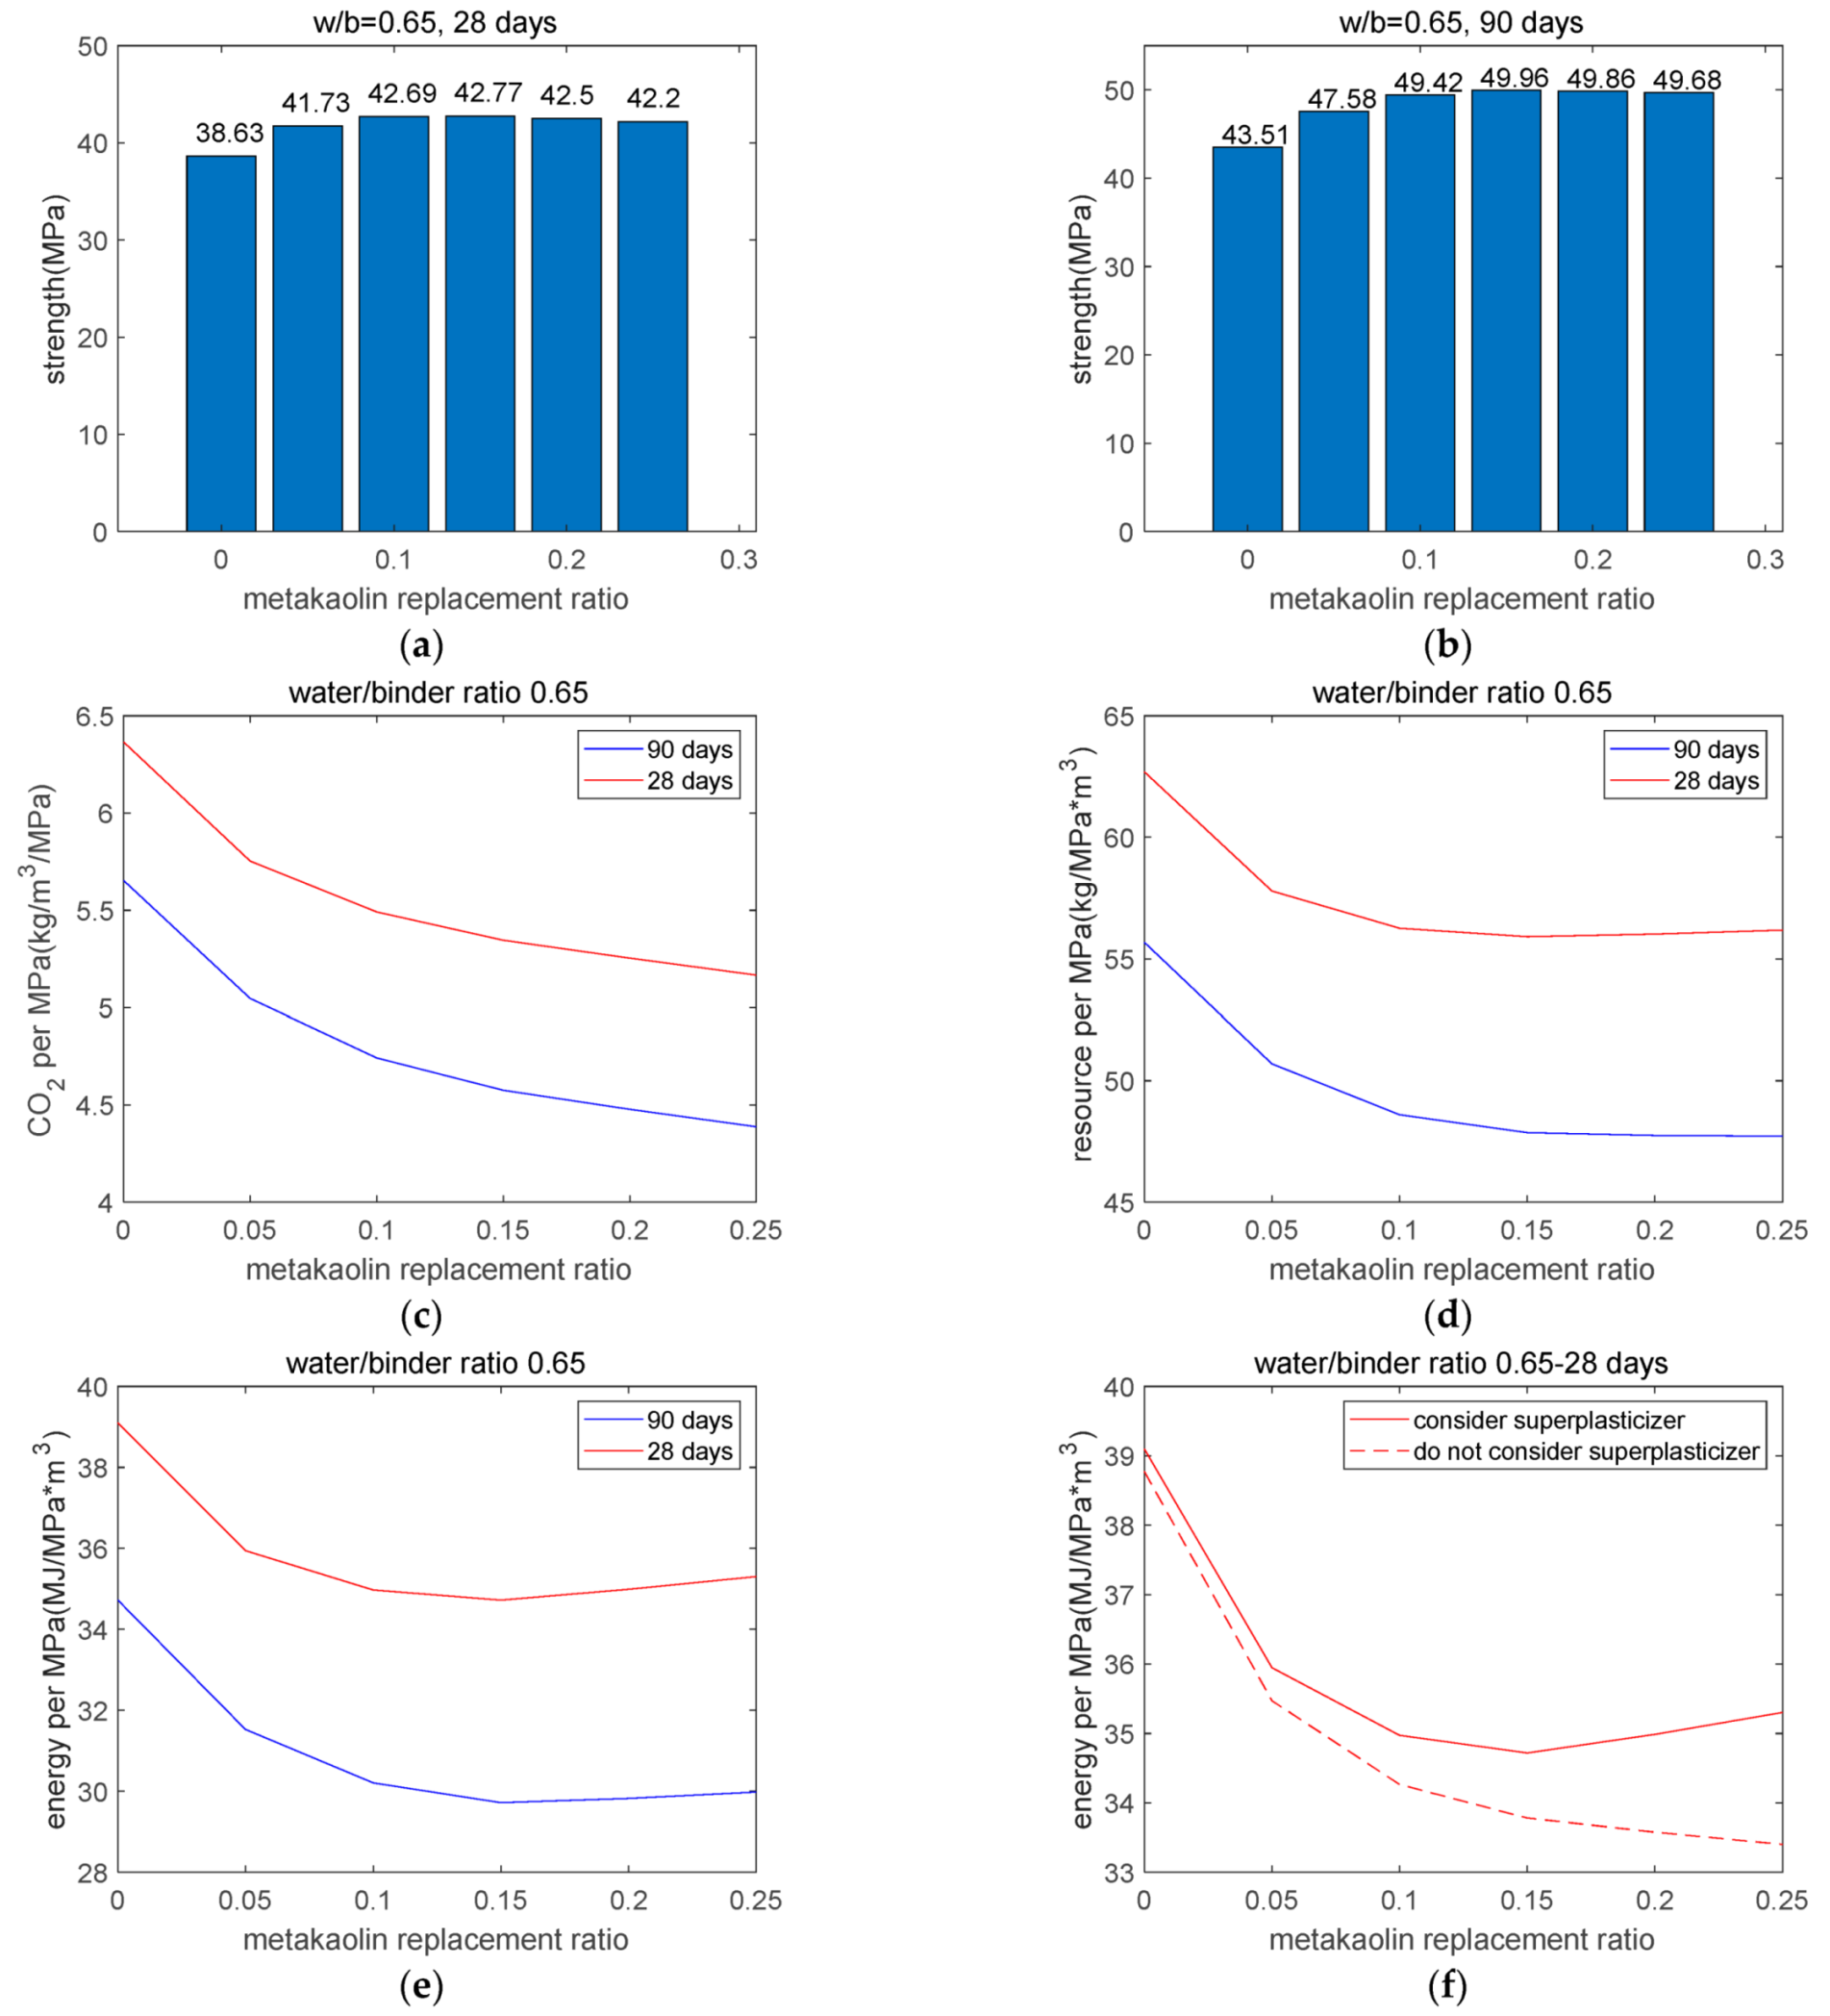
Figure 6 shows the results of sustainability for the water/binder ratio 0.65 group. From 28 to 90 days, the strength of concrete increased (Figure 6a,b). Figure 6c,d shows that as the replacement percentage of metakaolin increases, the normalized CO2 emissions and resource consumption decreased. Moreover, as the design age changed from 28 to 90 days, the normalized CO2 emissions and resource consumption decreased. Figure 6e shows the normalized energy consumption. When the replacement ratio of metakaolin was less than 0.15, normalized energy consumption showed reductions as the content of metakaolin increased. Once the replacement ratio of metakaolin was higher than 0.15, normalized energy consumption showed slight increments as the content of metakaolin increased. This is because the energy consumption of 1 kg of superplasticizer is far higher than that of the rest of a concrete mixture. Moreover, as shown in the Table 1, as the content of metakaolin increased, the content of superplasticizer significantly increased. Figure 6f shows the effect of superplasticizer on normalized energy consumption. The difference between accounting for and not accounting for the superplasticizer is more obvious for mixtures with high metakaolin content, which contained amounts of high superplasticizer. Moreover, if the contribution of the superplasticizer is ignored, we can find a different trend; i.e., the normalized energy consumption continuously decreases as the replacement percentage of metakaolin increases. Hence, it is important to consider the energy consumption from the superplasticizer for a mixture with high metakaolin content.
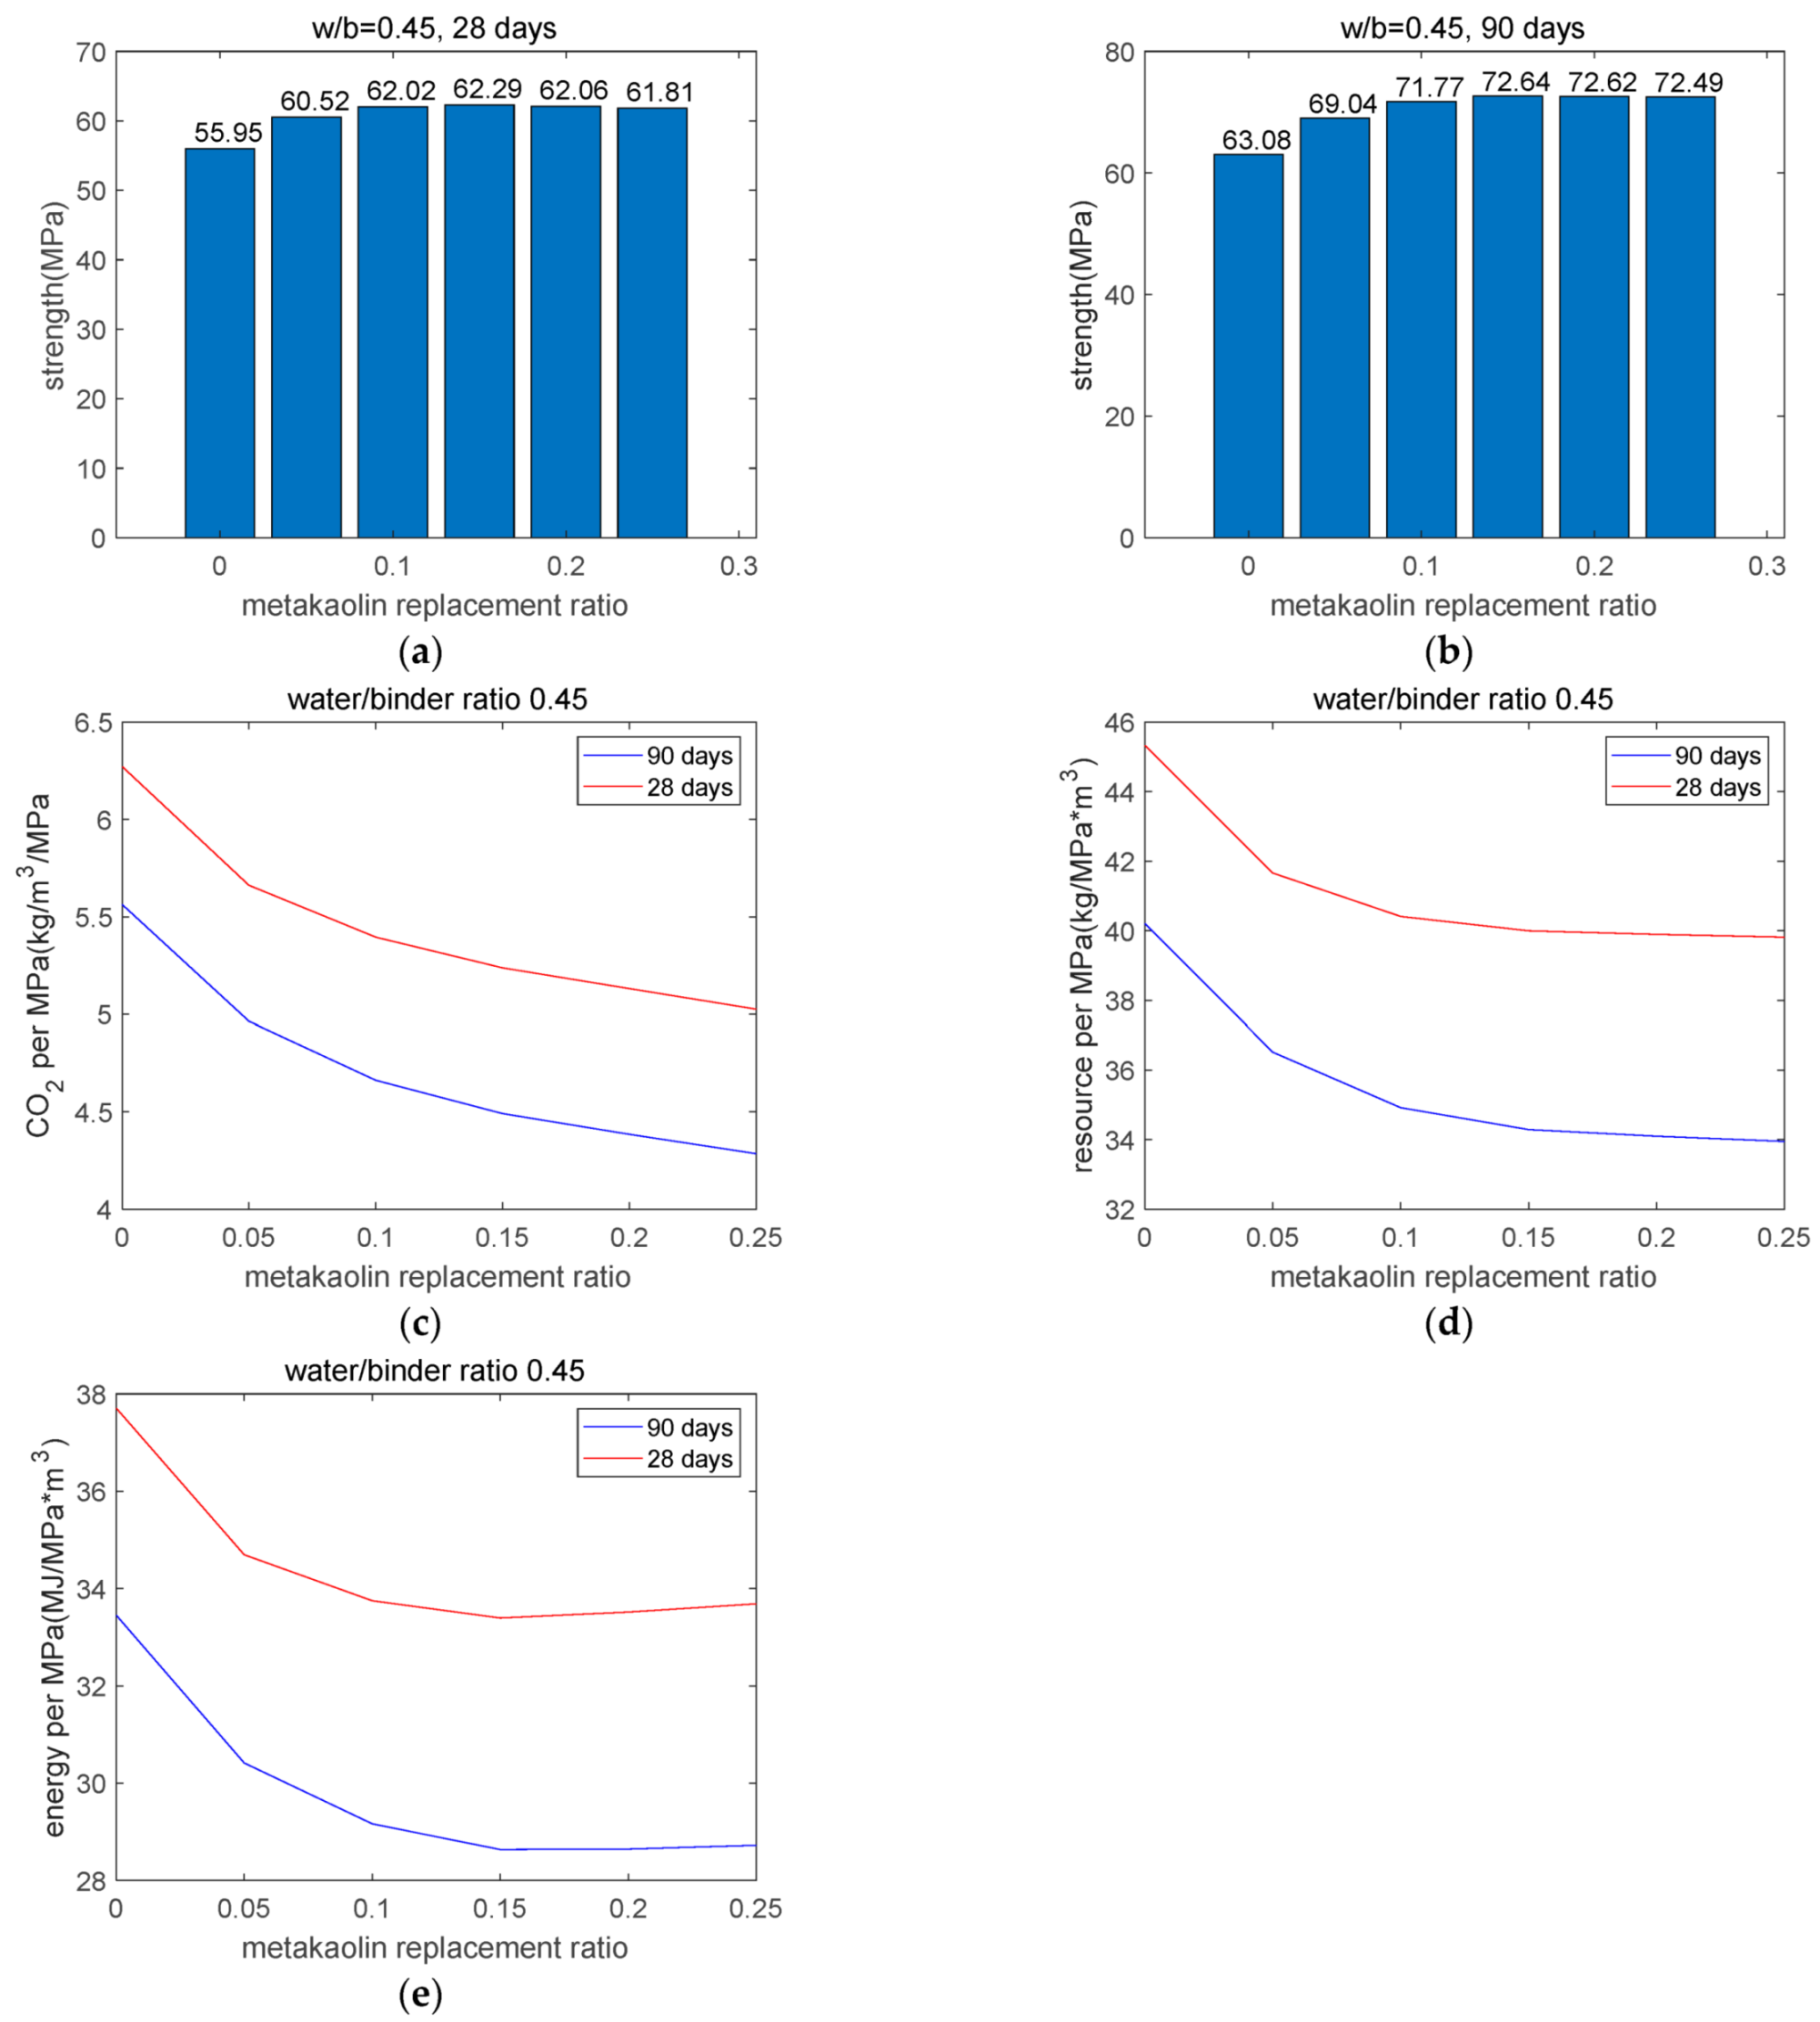
Figure 7 shows the results of sustainability for the water/binder ratio 0.45 group. Generally, the fundamental trends of the water/binder ratio 0.45 group are like those of the water/binder ratio 0.65 group. As the replacement percentage of metakaolin increased, the normalized CO2 emissions and normalized resource consumption decreased, and the normalized energy consumption showed rapid reduction, followed by a slight increment. Moreover, raising the design age from 28 to 90 days is effective at lowering suitability scores, such as normalized CO2 emissions, energy consumption, and resource consumption.
4. Discussion
Compared with previous strength and sustainability evaluation models, the framework proposed in this study shows some benefits:
First, the strength models in the previous studies mainly can be divided into two types, i.e., efficiency factor-based models and machine learning-based models. Regarding efficiency factor-based models, because the degree of reaction of metakaolin varies among concrete mixtures and ages [39], it is not easy to find an appropriate efficiency of metakaolin for different mixtures and ages [40]. Regarding machine learning-based models, because lots of parameters are used in the regression equations, it is difficult to obtain the clear physical meaning of these many parameters [41,42]. Contrastingly, the proposed strength model is a linear equation that takes three types of values, i.e., cement hydration, metakaolin degree of reaction, and threshold age. Compared with machine learning-based models, the number of parameters in our strength model is far smaller, and each item of our strength model has a clear physical meaning. Unlike efficiency factor-based models, the parameters of our strength model do not change for various mixtures and ages. It is easy for other researchers to use the proposed strength model.
Second, regarding sustainability evaluations, previous studies mainly focused on CO2 emissions; studies about resource consumption and energy consumption are less common [43,44]. Therefore, compared with previous studies, the proposed sustainability evaluation model covers more aspects—not only CO2 emissions, but also resource consumption and energy consumption. Moreover, the integrated strength–sustainability procedure is convenient. After inputting concrete mix proportions and curing conditions, the results of sustainability items can be automatically calculated.
Third, in future research, the following items should be studied: (1) the cost analysis of reinforced concrete structures, which considers material cost, labor cost, and indirect cost [18]; (2) the service life analysis in the operation stage, such as cracks and shrinkage, corrosion of steel rebar, and freezing and thawing [17]; (3) sustainable design method with various indicators, such as concrete performance, durability, and total cost. Moreover, the global optimal design of reinforced concrete structures with multiple aims should be performed [21,22].
5. Conclusions
This study presented an integrated strength–sustainability evaluation framework to produce greener metakaolin composite concrete. The framework consists of a strength model and a sustainability model. The input parameters are concrete mix proportions and curing temperature; and the outputs are strength, normalized CO2 emissions, resource consumption, and energy consumption.
First, based on a hydration model, the reaction extents of metakaolin and cement are determined. Moreover, a linear equation is proposed for evaluation of concrete strength development. Using the strength model, the strength development at various ages is determined. The coefficients of the strength model do not vary for different mix combinations and ages. The strength development model reflects the strength crossover between composite concrete and plain concrete, and accounts for the fact that strength starts after a threshold age, not immediately. The hydration strength model has a simple format and high evaluation accuracy.
Second, the calculation results of the strength model are used as input parameters for sustainability evaluation models. Based on the results of the sustainability analysis, some methods for achieving greener concrete were found: extending the design ages and lowering the water/binder ratios are effective ways to reduce normalized CO2 emissions, resource consumption, and energy consumption. Increasing the replacement ratio of metakaolin can lower the normalized CO2 emissions and resource consumption.
Third, when the replacement ratio of metakaolin was less than 0.15, normalized energy consumption showed reductions as the content of metakaolin increased. When the replacement ratio of metakaolin was higher than 0.15, normalized energy consumption showed slight increments as the content of metakaolin increased. This is because the energy consumption of 1 kg of superplasticizer is far higher than that of the rest of a concrete mixture. It is important to consider the energy consumption of the superplasticizer for a mixture with high metakaolin content.
In summary, it is helpful to use the proposed integrated strength–sustainability evaluation framework in the production of greener metakaolin composite concrete.
Author Contributions
Conceptualization, K.-B.P., R.-S.L.; methodology, Y.H., X.-Y.W. and R.-S.L.; validation, K.-B.P., Y.H., R.-S.L. and X.-Y.W.; writing—original draft preparation, K.-B.P. and X.-Y.W.; writing—review and editing, K.-B.P., Y.H. and X.-Y.W.; visualization, Y.H. and X.-Y.W.; supervision, K.-B.P. and X.-Y.W. All authors have read and agreed to the published version of the manuscript.
Funding
This study was supported by 2018 Research Grant (PoINT) from Kangwon National University. This study was supported by the National Research Foundation of Korea (NRF-2015R1A5A1037548, NRF-2020R1A2C4002093, and NRF-2020R1A2C1102871). This study was supported by BK21 FOUR (Fostering Outstanding Universities for Research).
Institutional Review Board Statement
Not applicable.
Informed Consent Statement
Not applicable.
Data Availability Statement
The data presented in this study are available from the corresponding author upon reasonable request.
Conflicts of Interest
The authors declare no conflict of interest.
References
- Wong, H.S.; Abdul Razak, H. Efficiency of calcined kaolin and silica fume as cement replacement material for strength performance. Cem. Concr. Res. 2005, 35, 696–702. [Google Scholar] [CrossRef] [Green Version]
- Sharifi, Y.; Hosseinpour, M. Adaptive neuro-fuzzy inference system and stepwise regression for compressive strength assessment of concrete containing metakaolin. Iran Univ. Sci. Technol. 2019, 9, 251–272. [Google Scholar]
- Abdul Razak, H.; Wong, H.S. Strength estimation model for high-strength concrete incorporating metakaolin and silica fume. Cem. Concr. Res. 2005, 35, 688–695. [Google Scholar] [CrossRef] [Green Version]
- Papadakis, V.G.; Demis, S. Predictive modeling of concrete compressive strength based on cement strength class. Comput. Concr. 2013, 11, 587–602. [Google Scholar] [CrossRef]
- Badogiannis, E.; Aggeli, E.; Papadakis, V.G.; Tsivilis, S. Evaluation of chloride-penetration resistance of metakaolin concrete by means of a diffusion—Binding model and of the k-value concept. Cem. Concr. Compos. 2015, 63, 1–7. [Google Scholar] [CrossRef]
- Sarıdemir, M. Predicting the compressive strength of mortars containing metakaolin by artificial neural networks and fuzzy logic. Adv. Eng. Softw. 2009, 40, 920–927. [Google Scholar] [CrossRef]
- Moradi, M.J.; Khaleghi, M.; Salimi, J.; Farhangi, V.; Ramezanianpour, A.M. Predicting the compressive strength of concrete containing metakaolin with different properties using ANN. Measurement 2021, 183, 109790. [Google Scholar] [CrossRef]
- Sharifi, Y.; Hosseinpour, M. Compressive Strength Assessment of Concrete Containing Metakaolin Using ANN. J. Rehabil. Civ. Eng. 2020, 8, 15–27. [Google Scholar] [CrossRef]
- Asteris, P.G.; Ashrafian, A.; Rezaie-Balf, M. Prediction of the compressive strength of self-compacting concrete using surrogate models. Comput. Concr. 2019, 24, 137–150. [Google Scholar] [CrossRef]
- Akin, O.O.; Ocholi, A.; Abejide, O.S.; Obari, J.A.; Zhang, C. Prediction of the Compressive Strength of Concrete Admixed with Metakaolin Using Gene Expression Programming. Adv. Civ. Eng. 2020, 2020, 8883412. [Google Scholar] [CrossRef]
- Busari, A. Response Surface Analysis of the Compressive Strength of Metakoalin Self-Compacting Concrete. Adv. Sci. Technol. Res. J. 2019, 13, 7–13. [Google Scholar] [CrossRef]
- Tae, S.; Baek, C.; Shin, S. Life cycle CO2 evaluation on reinforced concrete structures with high-strength concrete. Environ. Impact Assess. Rev. 2011, 31, 253–260. [Google Scholar] [CrossRef]
- Mena, J.; González, M.; Remesar, J.C.; Lopez, M. Developing a very high-strength low-CO2 cementitious matrix based on a multi-binder approach for structural lightweight aggregate concrete. Constr. Build. Mater. 2020, 234, 117830. [Google Scholar] [CrossRef]
- Possan, E.; Felix, E.F.; Thomaz, W.A. CO2 uptake by carbonation of concrete during life cycle of building structures. J. Build. Pathol. Rehabil. 2016, 1, 9. [Google Scholar] [CrossRef] [Green Version]
- Long, G.; Gao, Y.; Xie, Y. Designing more sustainable and greener self-compacting concrete. Constr. Build. Mater. 2015, 84, 301–306. [Google Scholar] [CrossRef]
- García-Gusano, D.; Cabal, H.; Lechón, Y. Long-term behaviour of CO2 emissions from cement production in Spain: Scenario analysis using an energy optimisation model. J. Clean. Prod. 2015, 99, 101–111. [Google Scholar] [CrossRef]
- Mane, K.M.; Joshi, A.M.; Kulkarni, D.K.; Prakash, K.B. Study of shrinkage characteristics of concrete made with pozzolanic materials and partly replacing River sand by MS. J. Build. Pathol. Rehabil. 2021, 6, 19. [Google Scholar] [CrossRef]
- Dawood, E.T.; Shawkat, A.S.; Abdullah, M.H. Flexural performance of ferrocement based on sustainable high-performance mortar. Case Stud. Constr. Mater. 2021, 15, e00566. [Google Scholar] [CrossRef]
- Konecny, P.; Ghosh, P.; Hrabova, K.; Lehner, P.; Teply, B. Effective methodology of sustainability assessment of concrete mixtures. Mater. Struct. 2020, 53, 98. [Google Scholar] [CrossRef]
- Badogiannis, E.; Papadakis, V.G.; Chaniotakis, E.; Tsivilis, S. Exploitation of poor Greek kaolins: Strength development of metakaolin concrete and evaluation by means of k-value. Cem. Concr. Res. 2004, 34, 1035–1041. [Google Scholar] [CrossRef]
- Wang, X.-Y. Analysis of Hydration-Mechanical-Durability Properties of Metakaolin Blended Concrete. Appl. Sci. 2017, 7, 1087. [Google Scholar] [CrossRef]
- Wang, X.-Y. Analysis of Hydration and Optimal Strength Combinations of Cement-Limestone-Metakaolin Ternary Composite. Adv. Mater. Sci. Eng. 2019, 2019, 8361810. [Google Scholar] [CrossRef] [Green Version]
- Wang, X.-Y.; Lee, H.-S. Microstructure modeling of carbonation of metakaolin blended concrete. Adv. Concr. Constr. 2019, 7, 167–174. [Google Scholar] [CrossRef]
- Maekawa, K.; Ishida, T.; Kishi, T. Multi-scale Modeling of Concrete Performance-Integrated Material and Structural Mechanics. J. Adv. Concr. Technol. 2003, 1, 91–126. [Google Scholar] [CrossRef] [Green Version]
- Poon, C.-S.; Lam, L.; Kou, S.C.; Wong, Y.-L.; Wong, R. Rate of pozzolanic reaction of metakaolin in high-performance cement pastes. Cem. Concr. Res. 2001, 31, 1301–1306. [Google Scholar] [CrossRef]
- Meddah, M.S.; Ismail, M.A.; El-Gamal, S.; Fitriani, H. Performances evaluation of binary concrete designed with silica fume and metakaolin. Constr. Build. Mater. 2018, 166, 400–412. [Google Scholar] [CrossRef]
- Lee, H.S.; Lim, S.M.; Wang, X.Y. Optimal Mixture Design of Low-CO2 High-Volume Slag Concrete Considering Climate Change and CO2 Uptake. Int. J. Concr. Struct. Mater. 2019, 13, 56. [Google Scholar] [CrossRef]
- Papadakis, V.G. Effect of fly ash on Portland cement systems: Part I. Low-calcium fly ash. Cem. Concr. Res. 1999, 29, 1727–1736. [Google Scholar] [CrossRef]
- Papadakis, V.G. Effect of fly ash on Portland cement systems: Part II. High-calcium fly ash. Cem. Concr. Res. 2000, 30, 1647–1654. [Google Scholar] [CrossRef]
- Soutsos, M.; Hatzitheodorou, A.; Kwasny, J.; Kanavaris, F. Effect of in situ temperature on the early age strength development of concretes with supplementary cementitious materials. Constr. Build. Mater. 2016, 103, 105–116. [Google Scholar] [CrossRef] [Green Version]
- Mohammed, A.; Rafiq, S.; Sihag, P.; Kurda, R.; Mahmood, W.; Ghafor, K.; Sarwar, W. ANN, M5P-tree and nonlinear regression approaches with statistical evaluations to predict the compressive strength of cement-based mortar modified with fly ash. J. Mater. Res. Technol. 2020, 9, 12416–12427. [Google Scholar] [CrossRef]
- Naqi, A.; Jang, J. Recent Progress in Green Cement Technology Utilizing Low-Carbon Emission Fuels and Raw Materials: A Review. Sustainability 2019, 11, 537. [Google Scholar] [CrossRef] [Green Version]
- Hameed, R.; Seo, J.; Park, S.; Amr, I.T.; Lee, H.K. CO2 Uptake and Physicochemical Properties of Carbonation-Cured Ternary Blend Portland Cement-Metakaolin-Limestone Pastes. Materials 2020, 13, 4656. [Google Scholar] [CrossRef]
- Scrivener, K.L.; John, V.M.; Gartner, E.M. Eco-efficient cements: Potential economically viable solutions for a low-CO2 cement-based materials industry. Cem. Concr. Res. 2018, 114, 2–26. [Google Scholar] [CrossRef]
- Wang, X.-Y. Impacts of climate change on optimal mixture design of blended concrete considering carbonation and chloride ingress. Front. Struct. Civ. Eng. 2020, 14, 473–486. [Google Scholar] [CrossRef]
- Madandoust, R.; Mousavi, S.Y. Fresh and hardened properties of self-compacting concrete containing metakaolin. Constr. Build. Mater. 2012, 35, 752–760. [Google Scholar] [CrossRef]
- Ramezanianpour, A.A.; Bahrami Jovein, H. Influence of metakaolin as supplementary cementing material on strength and durability of concretes. Constr. Build. Mater. 2012, 30, 470–479. [Google Scholar] [CrossRef]
- Lotteau, M.; Loubet, P.; Sonnemann, G. An analysis to understand how the shape of a concrete residential building influences its embodied energy and embodied carbon. Energy Build. 2017, 154, 1–11. [Google Scholar] [CrossRef]
- Babu, K.G.; Dinakar, P. Strength efficiency of metakaolin in concrete. Struct. Concr. 2006, 7, 27–31. [Google Scholar] [CrossRef]
- Shen, P.; Lu, L.; Chen, W.; Wang, F.; Hu, S. Efficiency of metakaolin in steam cured high strength concrete. Constr. Build. Mater. 2017, 152, 357–366. [Google Scholar] [CrossRef]
- Armaghani, D.J.; Asteris, P.G. A comparative study of ANN and ANFIS models for the prediction of cement-based mortar materials compressive strength. Neural Comput. Appl. 2021, 33, 4501–4532. [Google Scholar] [CrossRef]
- Lingam, A.; Karthikeyan, J. Prediction of compressive strength for HPC mixes containing different blends using ANN. Comput. Concr. 2014, 13, 621–632. [Google Scholar] [CrossRef]
- Kim, T.H.; Chae, C.U.; Kim, G.H.; Jang, H.J. Analysis of CO2 Emission Characteristics of Concrete Used at Construction Sites. Sustainability 2016, 8, 348. [Google Scholar] [CrossRef] [Green Version]
- Latawiec, R.; Woyciechowski, P.; Kowalski, K.J. Sustainable Concrete Performance—CO2-Emission. Environments 2018, 5, 27. [Google Scholar] [CrossRef] [Green Version]
Figure 1.
Experimental versus predicted values for the degree of reaction of metakaolin.

Figure 2.
Hydration levels of Portland cement in cement–metakaolin blends. (a) hydration extent of Portland cement: water/binder ratio 0.65. (b) hydration extent of Portland cement: water/binder ratio 0.45.
Figure 2.
Hydration levels of Portland cement in cement–metakaolin blends. (a) hydration extent of Portland cement: water/binder ratio 0.65. (b) hydration extent of Portland cement: water/binder ratio 0.45.

Figure 3.
Degrees of reaction of metakaolin in cement–metakaolin blends. (a) reaction extent of metakaolin: water/binder ratio 0.65. (b) reaction extent of metakaolin: water/binder ratio 0.45.
Figure 3.
Degrees of reaction of metakaolin in cement–metakaolin blends. (a) reaction extent of metakaolin: water/binder ratio 0.65. (b) reaction extent of metakaolin: water/binder ratio 0.45.

Figure 4.
Evaluation of the strength of concrete. (a) water/binder ratio 0.65. (b) water/binder ratio 0.60. (c) water/binder ratio 0.52. (d) water/binder ratio 0.45. (e) experiment versus prediction results.
Figure 4.
Evaluation of the strength of concrete. (a) water/binder ratio 0.65. (b) water/binder ratio 0.60. (c) water/binder ratio 0.52. (d) water/binder ratio 0.45. (e) experiment versus prediction results.


Figure 5.
Flowchart of sustainability analysis.

Figure 6.
Sustainability analysis of the water/binder ratio 0.65 group. (a) strength on day 28 of water/binder ratio 0.65 group. (b) strength on day 90 of water/binder ratio 0.65 group. (c) normalized CO2 emissions of water/binder ratio 0.65 group. (d) normalized resource consumption of water/binder ratio 0.65 group. (e) normalized energy consumption of water/binder ratio 0.65 group. (f) effect of superplasticizer on normalized energy consumption.

Figure 7.
Sustainability analysis of the water/binder ratio 0.45 group. (a) strength on day 28 of water/binder ratio 0.45 group. (b) strength on day 90 of water/binder ratio 0.45 group. (c) normalized CO2 emissions of water/binder ratio 0.45 group. (d) normalized resource consumption of water/binder ratio 0.45 group. (e) normalized energy consumption of water/binder ratio 0.45 group.

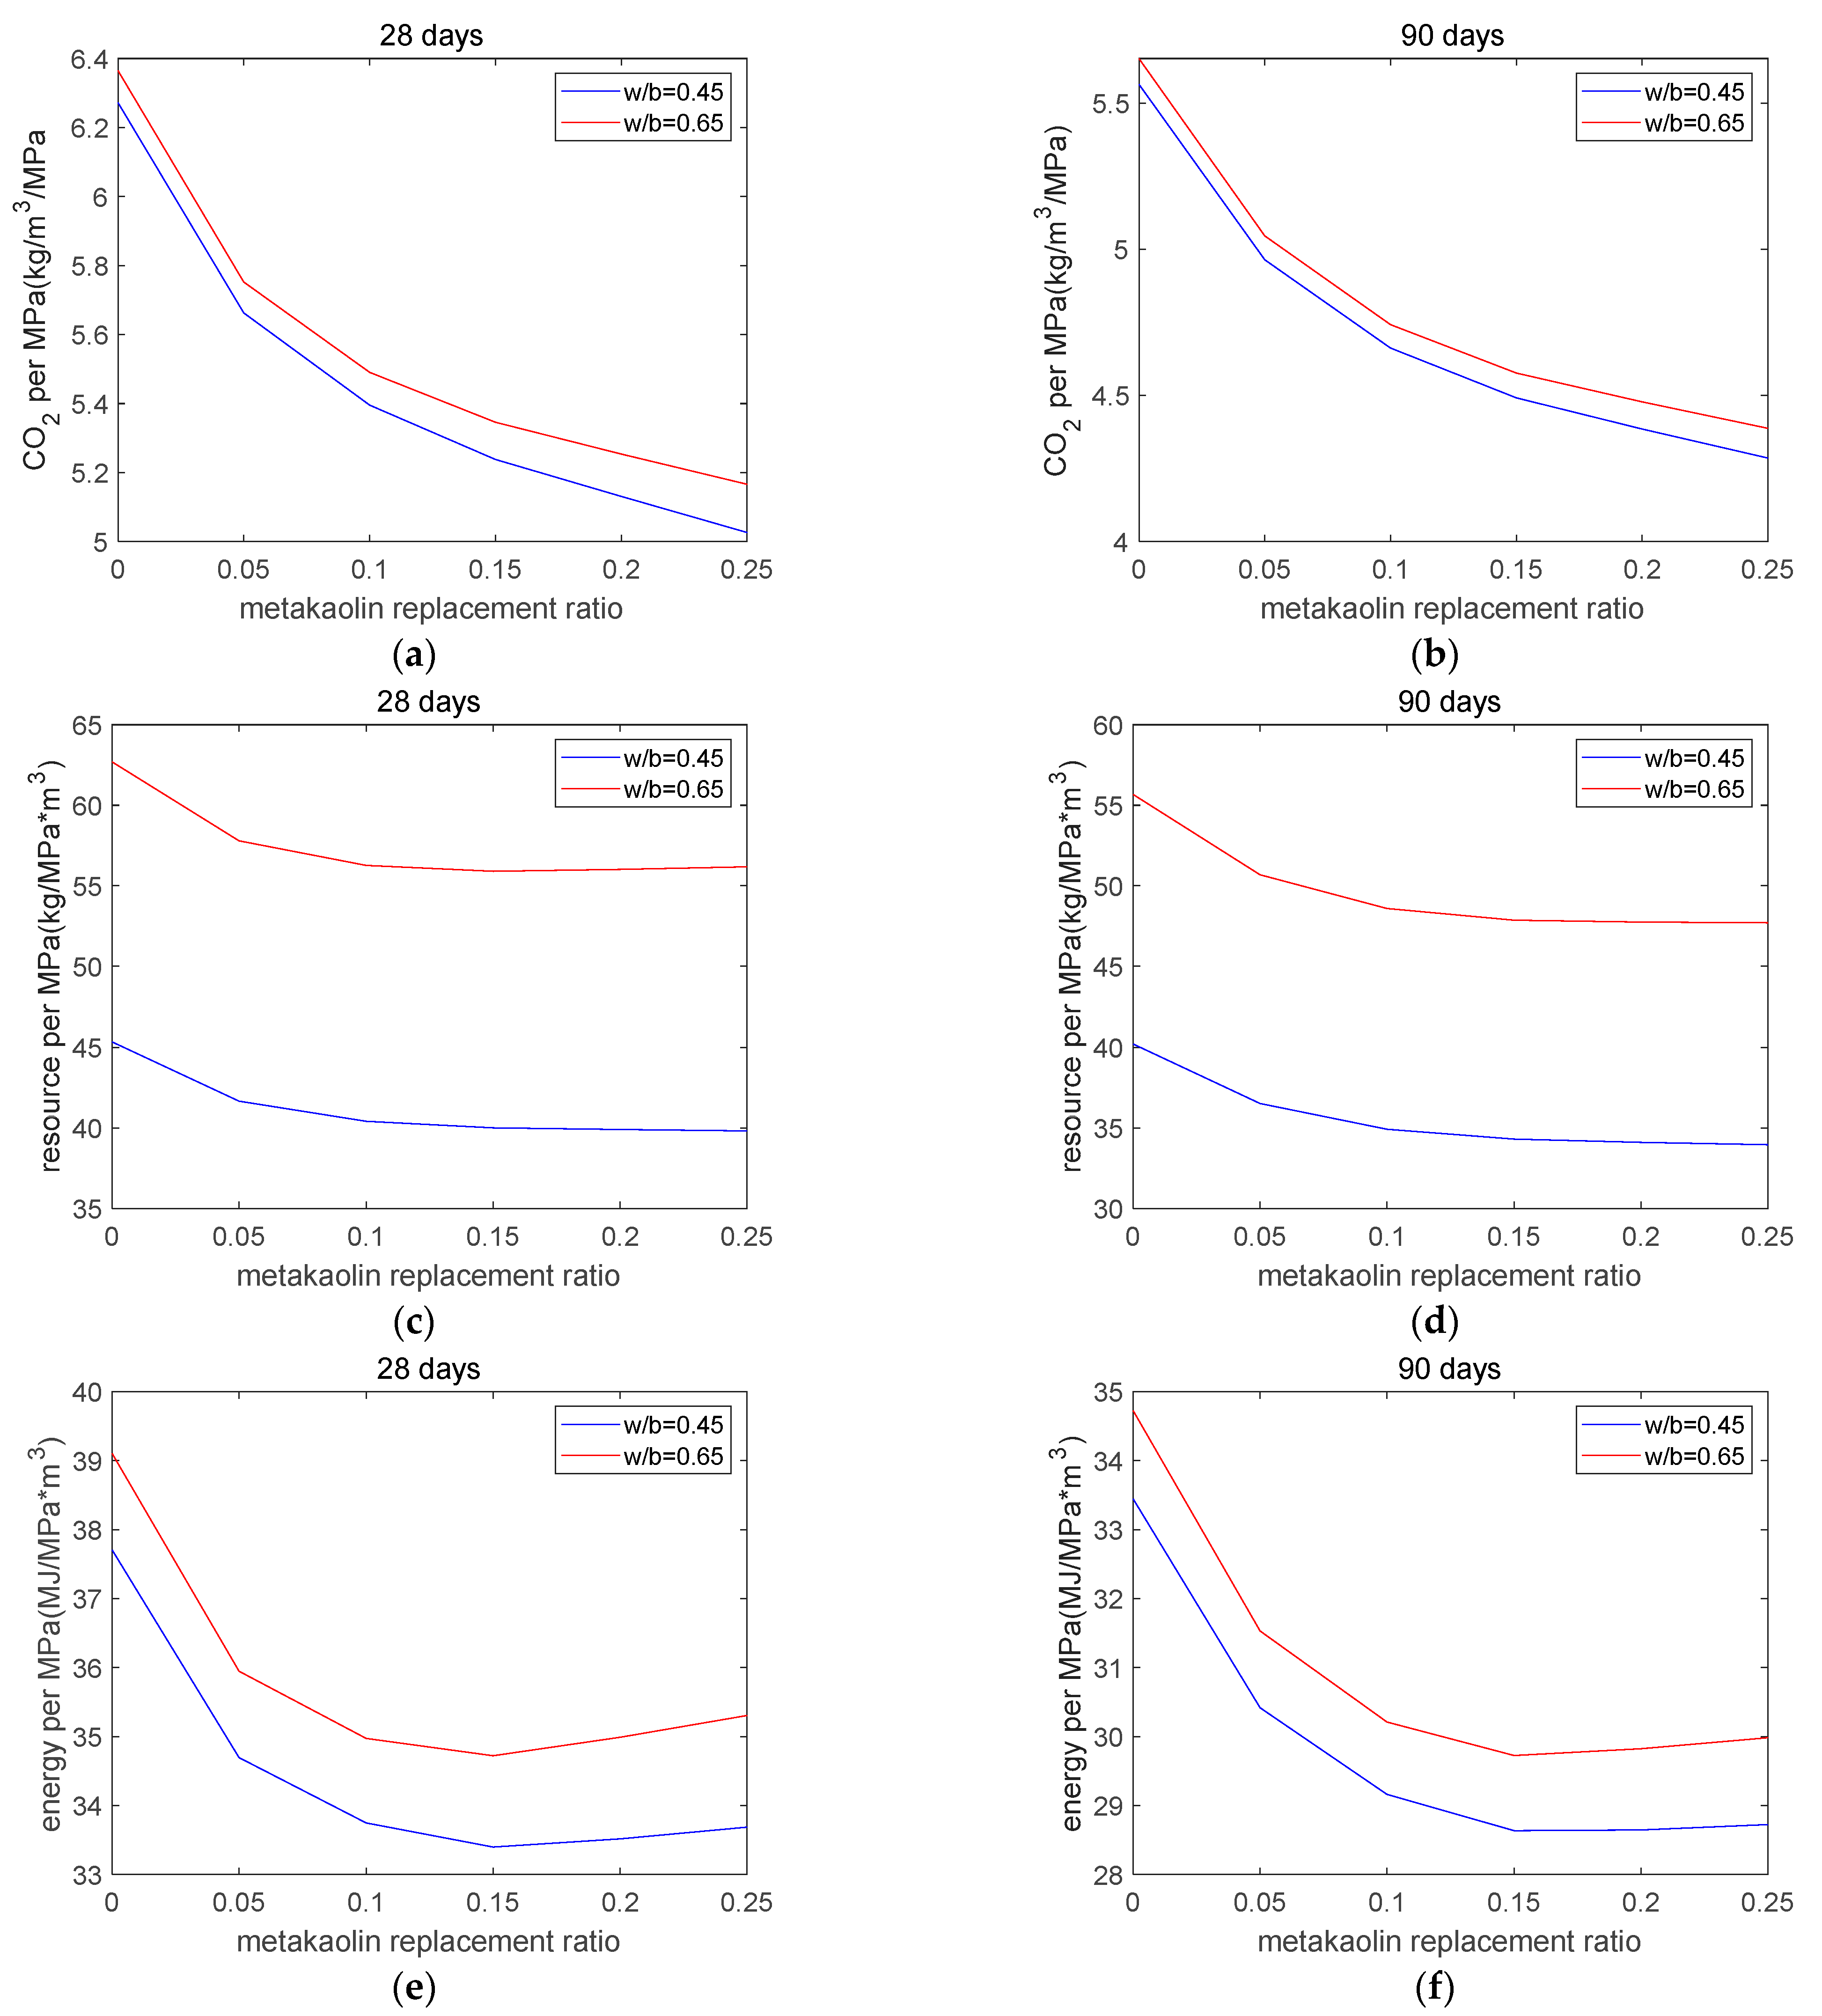
Figure 8.
The influences of the water/binder ratio on sustainability. (a) influence of water/binder ratio on normalized CO2 emissions—28 days. (b) influence of water/binder ratio on normalized CO2 emissions—90 days. (c) influence of water/binder ratio on normalized resource consumption—28 days. (d) influence of water/binder ratio on normalized resource consumption—90 days. (e) influence of water/binder ratio on normalized energy consumption—28 days. (f) influence of water/binder ratio on normalized energy consumption—90 days.


Table 1.
Mixtures of specimens. Adapted with permission from ref. [26]. Copyright 2018 Elsevier.
Table 1.
Mixtures of specimens. Adapted with permission from ref. [26]. Copyright 2018 Elsevier.
| Water/ Binder | Binder (kg/m3) | Metakaolin Percentage (%) | Superplasticizer (% of Binder) | Sand (kg/m3) | 5 to10 mm Coarse Aggregate (kg/m3) | 10 to 20 mm Coarse Aggregate (kg/m3) | Water (kg/m3) |
|---|---|---|---|---|---|---|---|
| 0.65 | 285 | – | 0.24 | 730 | 400 | 800 | 185 |
| 5 | 0.38 | ||||||
| 10 | 0.58 | ||||||
| 15 | 0.77 | ||||||
| 20 | 1.15 | ||||||
| 25 | 1.54 | ||||||
| 0.60 | 310 | – | 0.13 | 710 | 400 | 800 | 185 |
| 5 | 0.26 | ||||||
| 10 | 0.43 | ||||||
| 15 | 0.69 | ||||||
| 20 | 1.04 | ||||||
| 25 | 1.30 | ||||||
| 0.52 | 355 | – | 0.11 | 670 | 400 | 800 | 185 |
| 5 | 0.39 | ||||||
| 10 | 0.50 | ||||||
| 15 | 0.80 | ||||||
| 20 | 1.15 | ||||||
| 25 | 1.45 | ||||||
| 0.45 | 410 | – | 0.21 | 625 | 400 | 800 | 185 |
| 5 | 0.42 | ||||||
| 10 | 0.67 | ||||||
| 15 | 0.84 | ||||||
| 20 | 1.18 | ||||||
| 25 | 1.55 |
Table 2.
The CO2 emissions, energy consumption, and resource consumption of concrete components. Adapted with permission from ref. [15]. Copyright 2015 Elsevier.
Table 2.
The CO2 emissions, energy consumption, and resource consumption of concrete components. Adapted with permission from ref. [15]. Copyright 2015 Elsevier.
| Items | CO2 (kg/kg) | Energy (MJ/kg) | Resource (kg/kg) |
|---|---|---|---|
| Metakaolin | 0.4 | 3.48 | 1.0 |
| Cement | 0.83 | 4.727 | 1.73 |
| Sand | 0.001 | 0.022 | 1.0 |
| Coarse aggregate | 0.007 | 0.113 | 1.0 |
| Water | 0.0003 | 0.006 | 0 |
| Superplasticizer | 0.72 | 18.3 | 0 |
Publisher’s Note: MDPI stays neutral with regard to jurisdictional claims in published maps and institutional affiliations. |
© 2021 by the authors. Licensee MDPI, Basel, Switzerland. This article is an open access article distributed under the terms and conditions of the Creative Commons Attribution (CC BY) license (https://creativecommons.org/licenses/by/4.0/).
Share and Cite
MDPI and ACS Style
Park, K.-B.; Lin, R.-S.; Han, Y.; Wang, X.-Y. Model-Based Methods to Produce Greener Metakaolin Composite Concrete. Appl. Sci. 2021, 11, 10704. https://doi.org/10.3390/app112210704
AMA Style
Park K-B, Lin R-S, Han Y, Wang X-Y. Model-Based Methods to Produce Greener Metakaolin Composite Concrete. Applied Sciences. 2021; 11(22):10704. https://doi.org/10.3390/app112210704
Chicago/Turabian StylePark, Ki-Bong, Run-Sheng Lin, Yi Han, and Xiao-Yong Wang. 2021. "Model-Based Methods to Produce Greener Metakaolin Composite Concrete" Applied Sciences 11, no. 22: 10704. https://doi.org/10.3390/app112210704
Note that from the first issue of 2016, this journal uses article numbers instead of page numbers. See further details here.