
Contributions of Machine Learning Models towards Student Academic Performance Prediction: A Systematic Review


1
Center for Artificial Intelligence (CAI), King Khalid University, Abha 61421, Saudi Arabia
2
College of Science and Arts, King Khalid University, Abha 61421, Saudi Arabia
3
College of Computer Science, King Khalid University, Abha 61421, Saudi Arabia
*
Author to whom correspondence should be addressed.
Appl. Sci. 2021, 11(21), 10007; https://doi.org/10.3390/app112110007
Submission received: 7 August 2021
/
Revised: 5 October 2021
/
Accepted: 6 October 2021
/
Published: 26 October 2021
(This article belongs to the Special Issue AI in Education)
Abstract
:Machine learning is emerging nowadays as an important tool for decision support in many areas of research. In the field of education, both educational organizations and students are the target beneficiaries. It facilitates the educational sector in predicting the student’s outcome at the end of their course and for the students in deciding to choose a suitable course for them based on their performances in previous exams and other behavioral features. In this study, a systematic literature review is performed to extract the algorithms and the features that have been used in the prediction studies. Based on the search criteria, 2700 articles were initially considered. Using specified inclusion and exclusion criteria, quality scores were provided, and up to 56 articles were filtered for further analysis. The utmost care was taken in studying the features utilized, database used, algorithms implemented, and the future directions as recommended by researchers. The features were classified as demographic, academic, and behavioral features, and finally, only 34 articles with these features were finalized, whose details of study are provided. Based on the results obtained from the systematic review, we conclude that the machine learning techniques have the ability to predict the students’ performance based on specified features as categorized and can be used by students as well as academic institutions. A specific machine learning model identification for the purpose of student academic performance prediction would not be feasible, since each paper taken for review involves different datasets and does not include benchmark datasets. However, the application of the machine learning techniques in educational mining is still limited, and a greater number of studies should be carried out in order to obtain well-formed and generalizable results. We provide future guidelines to practitioners and researchers based on the results obtained in this work.
1. Introduction
In recent centuries, the academic performances of students have been appraised on the basis of memory-related tests or regular examinations and by comparing their performances to identify the factors for predicting their academic excellence. In the contemporary world, there are full-fledged, developed, and advanced technologies that enable an individual from any domain, even with minimal programming knowledge, to predict their future data. Machine learning (ML) is now a prevalent technology to forecast data ranging from supermarkets to astronomical realms. Academicians and administrative personnel use data to predict a student’s performance during the time of admission, predict the job scope for a student at the time of course completion or the dropout based on the aggregate numbers from the entire set of students, or gauge a particular student’s success or failure rate in the subsequent grades. These have even led to recommendation systems for the students to select their area of expertise. These recommendation systems started its implementation from higher secondary schools [1], predicting the retention of students [2], family tutoring and recommender systems [3,4,5,6].With an enormous growth of research contributions in the field of big data and ML, learning analytics and supportive learning have also shown their growth in education. Education institutions have expressed their interest in predicting students’ performance or related model development to estimate their own students’ performance. This prediction is anticipated to favor the growth of their institutions. Such model developments are likely to support the creation of follow-up actions that may be taken to set up remedial actions on the drawbacks associated with student comprehension and to rectify them.
The objective of this systematic survey was to delineate completed, implemented, and published ideas of various researchers, starting from the earliest works to the most recent ones. Furthermore, this study aimed to understand the rate of success of the implemented ML-related models in specific domains of research to predict student academic performance. Even though there are a number of existing ML algorithms, only a few exist in every category based on the area of interest taken up for analysis. The regression algorithms stand to prove their accuracy in the prediction of student academic performance. The regression algorithms [6,7,8,9,10,11] stand by classification algorithms [12,13,14,15,16,17] to enhance their prediction accuracy by means of ensemble methods. As analyzed, this survey starts with developing an systematic literature review (SLR) model, which provides pertinent ideas to novice researchers on the algorithms used or articles published, and their results obtained in the domain of predicting student academic performance. This may potentially lead to the creation of a new ML model that can yield much higher accuracy with limited usage of resources. The purpose of this SLR is to summarize and clarify the available and accessible resources of the previously published articles. The rest of this paper is organized as follows: Section 2 discusses the methodology adopted, followed by Section 3 that summarizes the findings, followed by an elaborate discussion of the same. Section 4 outlines the implications of this SLR, the limitations of this study, and finally, suggestions for prospective future research.
2. Review Methodology
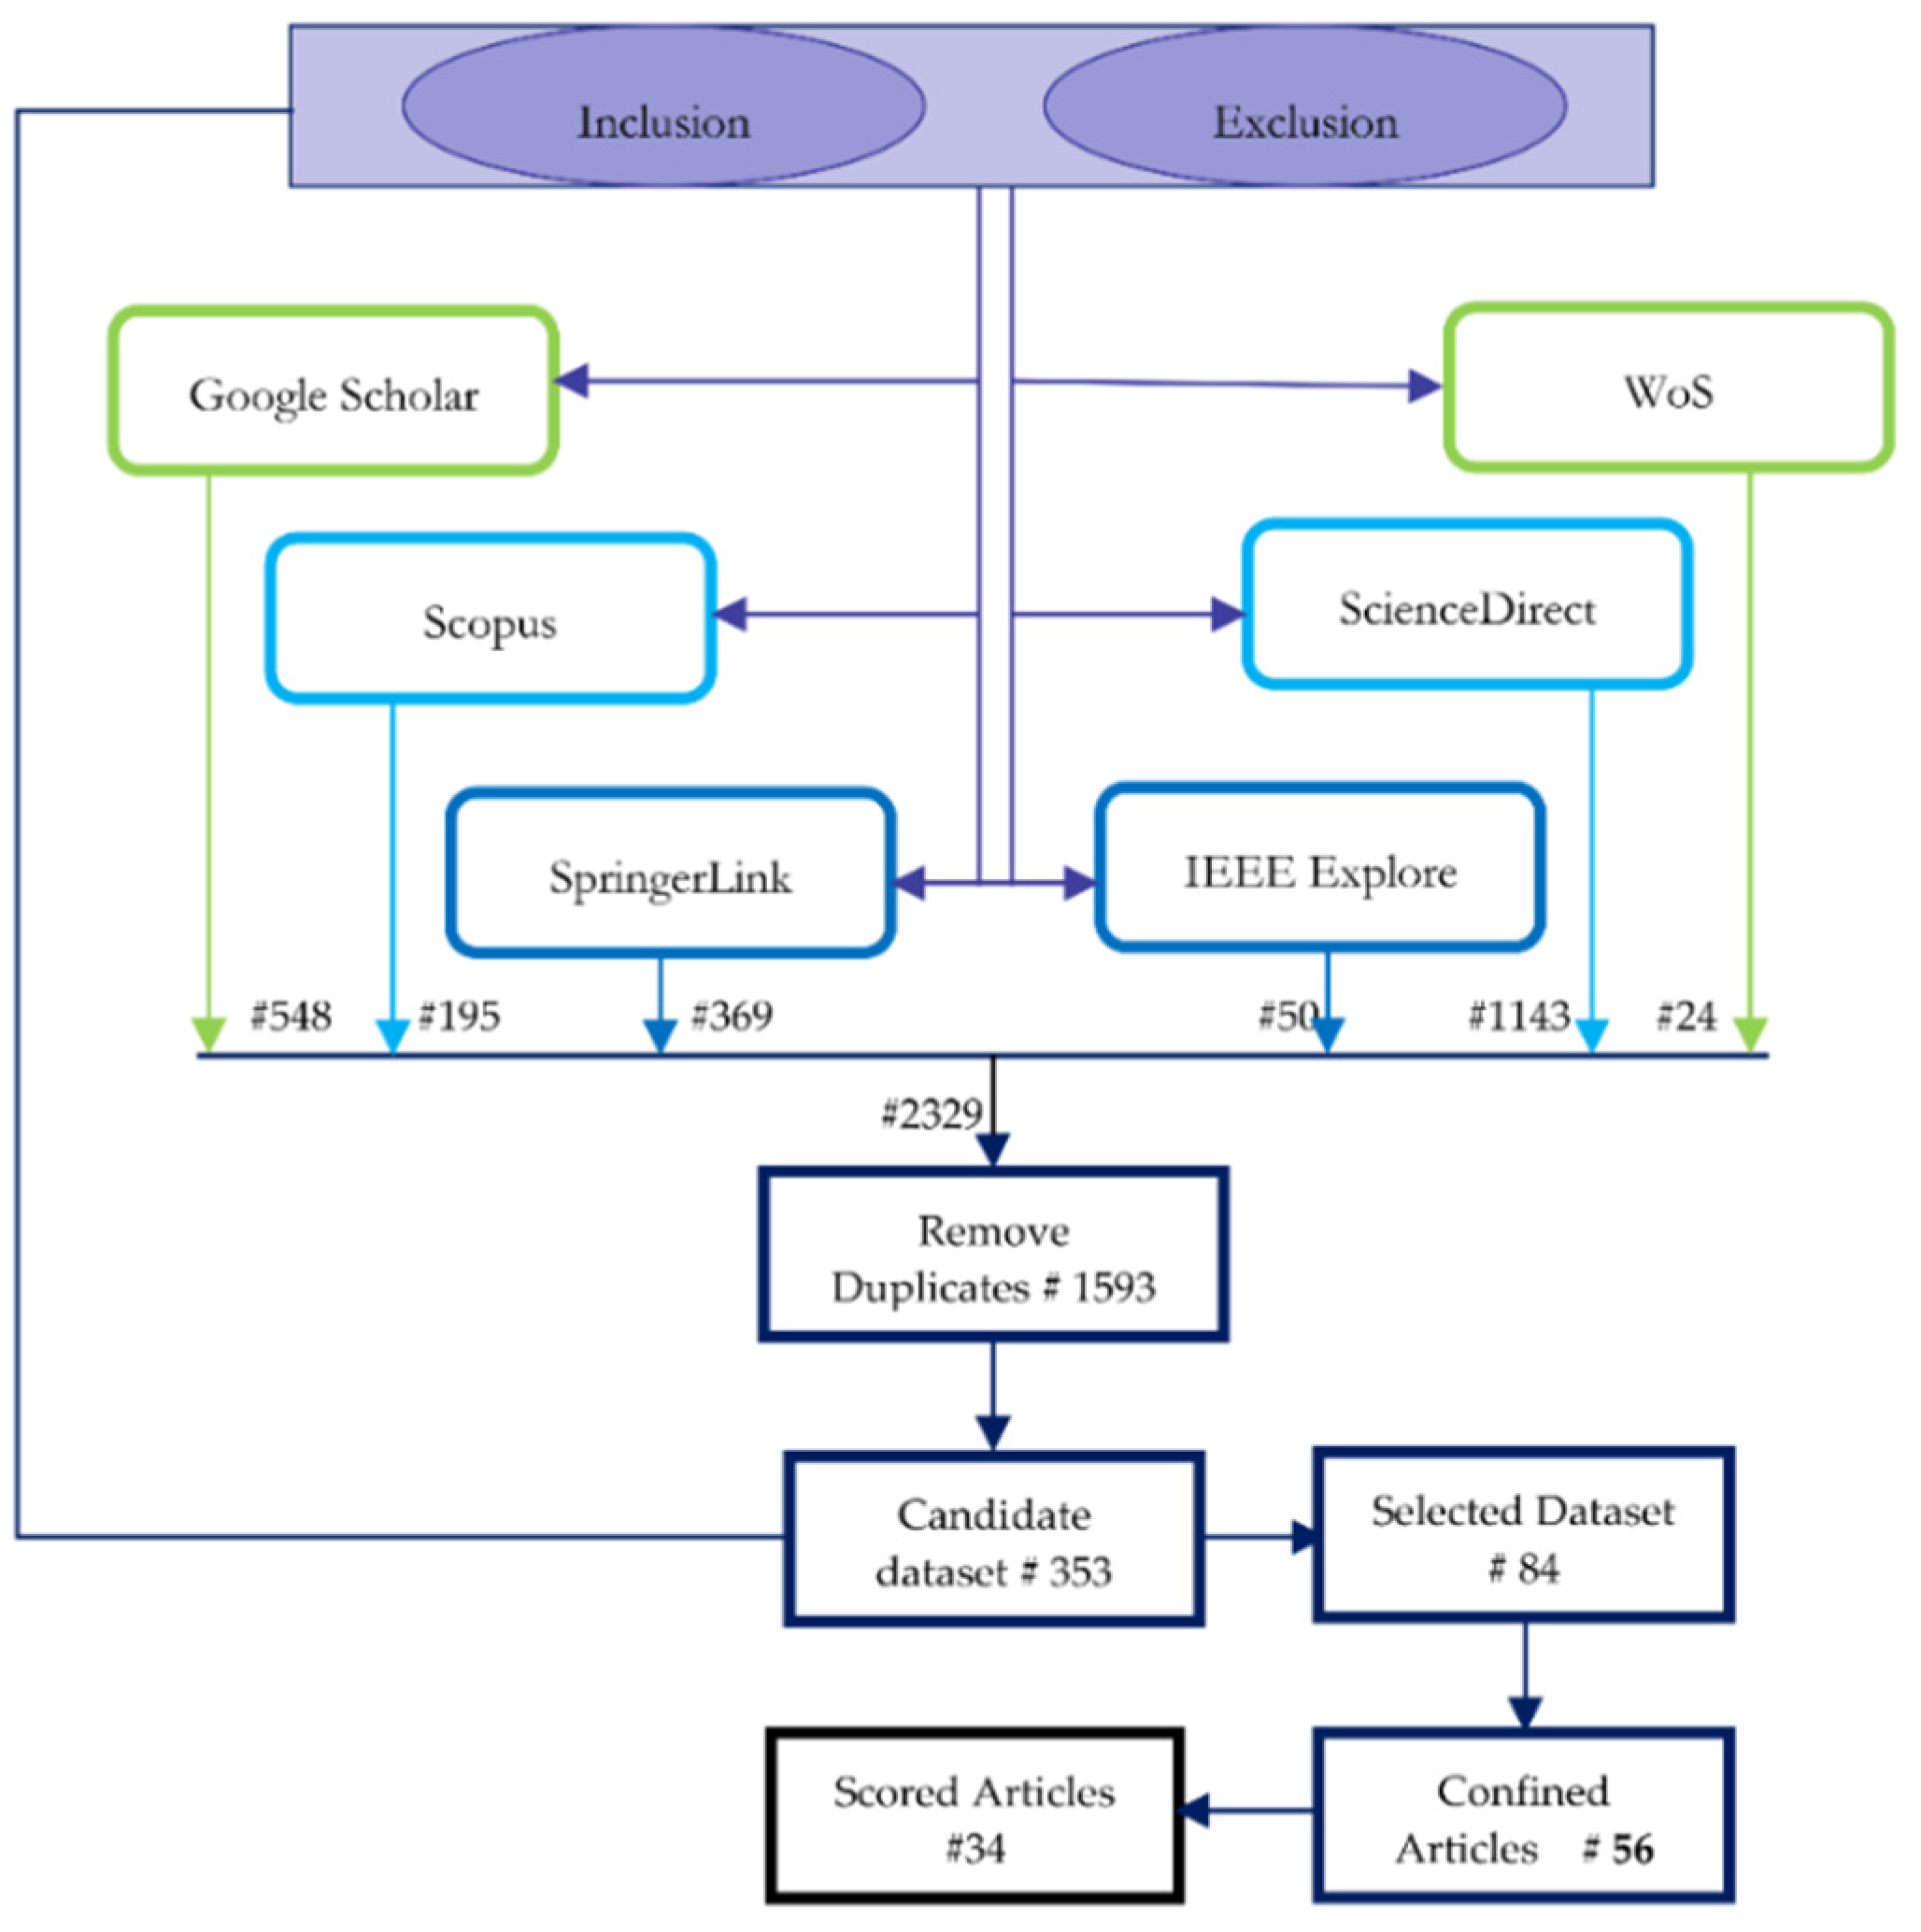
The purpose of this SLR is to study the published articles in the domain of student academic performance prediction with the help of machine learning (ML) or artificial intelligence (AI)-related models. To acquire a deep insight of the previous works published, the domain of interest was analyzed from multifarious dimensions. To perform this SLR in a well-formed structure, the methodology underwent five different stages as shown in Figure 1.
The first step initiated with the identification of the research questions, which provided clear data on the nature of publications presented so far in the specified area of research. This identification of research questions, in turn, provided a coherent picture of the design of search strategy. The results obtained from the defined search strategy narrowed down this study to precisely define the selection criteria to filter the articles that were pertinent to the real necessity of this study. To filter even further based on the “quality,” a scoring system related to the testing of the quality of the selected articles was framed. The final corpus of articles was evaluated, and the results are reported in this paper.
2.1. Research Question (RQ) Identification
The framed SLR aimed to provide and assess the empirical evidence from the studies that deployed ML or AI models in predicting the student academic performance. The motivation behind developing these RQs relied on the real focus of this systematic review. The initial process of SLR and the perfect base to perform the SLR was formed with the exact definition of the RQs. Five principal RQs were framed to explicate the exact idea of this systematic review.
The research questions were framed such that the articles responding either partially or perfectly alone stands in the filter of articles. These sustained articles proceeded further for evaluation to describe the concepts of machine learning application in the field of educational mining.
RQ1: What are the different ML models/techniques used for student academic performance prediction?
The aim of this research question is to understand the models that have been implemented for predicting student academic performance. The models/techniques used are analyzed to obtain an insight of the most frequently used methods, new proposed methods, and methods that provide better results or performance metrics. The reader of the article will be able to find a list of such methods that are utilized and proved by various researchers so that the budding researchers can adopt new ideas from existing works.
RQ2: What are the various estimation methods/metrics used? What is the performance measure used to appraise the performance of the models in the described problem area?
This research question has been framed with the target to identify the metrics that have been used to measure the precision of the developed model. Furthermore, it aims to assess the way the referred articles speak of their credibility and accuracy in proving the purpose of the developed model. Even though the metrics used for analyzing the machine learning models are standardized, the values obtained by various methods on different databases speak to the importance of each feature and its contribution towards the performance metrics discussed in the relevant articles.
RQ3: Are there any datasets and collection methods; if they exist, is their usage specified?
RQ3 responds with the quality of analysis made, so that the size of datasets reveals their proportion of reliability. The datasets used in the referred articles are considered as a research question to show the features taken under consideration and the importance level of each feature towards arriving at the best model and better performance measure.
RQ4: Are there any guidelines on the number of features considered or the features used?
This research question aims at finding the data collected and the source and identifying the effective features in the dataset. The guidelines regarding the features used provide an idea during the feature extraction process of developing an ML-based model or a prototype. These guidelines discussed in different articles of multiple features show the insights that each author has attained during their research. The readers will be able to identify the importance of choosing the features or the justification provided by the authors in eliminating the consideration of certain features.
RQ5: Are enough comparisons made to prove the reliability of the proposed model?
The models that are proposed in the cluster of articles are to be segregated and selected for a further examination based on the comparative measures that were taken to validate the proposed works as adequate and substantial and that they surpass the previously presented works in the pertinent literature. Even though every model when proposed seems to prove its innovation, solid proof is needed to say that the proposed model is genuine. Hence, a considerable number of methods that were existing should be taken into consideration and analyzed for improvement in the performance measure of the proposed system. Hence, a bird’s-eye definition is needed in each article to prove its contribution.
2.2. Search Strategy
AI expanded its level of implementation combined with data mining and knowledge discovery into a notable field of model development in the form of ML, which grew further into another level of deep learning (DL). This paper predominantly focuses on ML and AI as a peripheral aspect of implementation to develop a model in the problem of predicting student academic performance.
2.2.1. Search Strategy Design
To narrow down the search among thousands of published research articles, the search queries (SQs) were defined clearly and delimited by the refined queries. The input terms involve “machine learning”, “artificial intelligence,” “academic performance prediction,” “student academic performance,” and “student success prediction.” Even though the search could have been performed in all fields of metadata, it was restricted to Title, Abstract, and Keywords. The corpus for the synthesis was created through a metadata search on the article indexed in six major libraries of academic publications, namely Google Scholar, Web of Science (WoS), Scopus, ScienceDirect, SpringerLink, and IEEE Explore. The syntax of the search could be altered based on the database requirements. The search period of the database varied from 1959 to 2020 and the articles that are yet to be published, and based on the period of application, this may have been reduced further. Only the latest articles in this application were considered.
The SQs were used in the following formats and varied based on the database conditions of search.
SQ1: [“machine learning” AND “academic performance prediction”] ((“title” AND “abstract”) OR “keywords”)
SQ2: [((“machine learning” OR “artificial intelligence”) AND (“academic performance prediction” OR “student academic performance”))] ((“title” AND “abstract”) OR “keywords”)
SQ3: [“machine learning” AND “student success prediction”] ((“title” AND “abstract”) OR “keywords”)
The input search query, SQ1–SQ3, gave a generalized format; however, each database had its own form of SQ. Thereby, the search was performed accordingly.
2.2.2. Selection Criteria
The entire procedure of selection criteria was divided into two phases. Phase 1, termed as the collection and analysis phase, comprised article collection, removing duplicates, and applying inclusion and exclusion criteria, as shown in Figure 2. Phase 2, termed as the synthesis phase, forwarded the refined articles to proceed further with quality analysis to refine further and narrow down the articles to analyze the methods and find results for the defined five research questions.
The set of articles collected as a corpus based on the SQs (SQ1–SQ3), counting to 2239 articles, included some of the inclusion and exclusion criteria except that could not be applied at this stage. The collected articles were refined further to remove duplicates and proceed with the reapplication of missed out inclusion or exclusion criteria, if any.
Inclusion criteria:
- Using ML to analyze the academic performance;
- Using ML to preprocess the modeling data;
- Comparative assessment of various ML methods and their results obtained;
- Journal versions—for duplicate articles, the recently published article is considered;
- Articles including online education assessment;
- Academic performance and recommendation systems.
Exclusion Criteria:
- Review articles;
- Book chapters;
- Factor analysis;
- Articles not written in the English language.
Step 1: Extract all the articles from the six data sources with the predefined criteria for inclusion and exclusion.
Using the four SQs as defined, a corpus of articles was amassed. A total of 2329 articles were collected based on the defined SQs as shown in Table 1. From this basic search retrieval, the duplicate articles were removed.
Step 2: Remove duplicates.
Duplicates that are obtained using search query. Since the articles chosen might find citations in several sources, this step was carried out. After the elimination of the duplicates, a total of 1593 articles for further processing were selected. For duplication of the article title from multiple databases, the database that had the article in its creamy layer, the top 50% of the total article is retained and the article in other citing database sources is eliminated.
Step 3: Re-apply inclusion and exclusion criteria if needed.
After the application of the same to the Title, Abstract, and Keywords, the resultant set comprised 353 articles.
Step 4: Manual refinement of corpus.
After manual refinement by analyzing each title, the final obtained result set mentioned as the selected dataset was 80 articles. Firstly, manual refinement was carried out by eliminating the articles that had a similar combination of title and method that seemed to be repeated. Secondly, in some cases, even if there was a match of keywords applied in the search query abstract of some articles, it did not reflect the necessary information of the review considered. The main source of manual refinement is the abstract of the article. Only the recent and complete study articles were considered.
Step 5: The selected articles were then evaluated using the quality assessment as discussed in the next section to finalize with 56 articles.
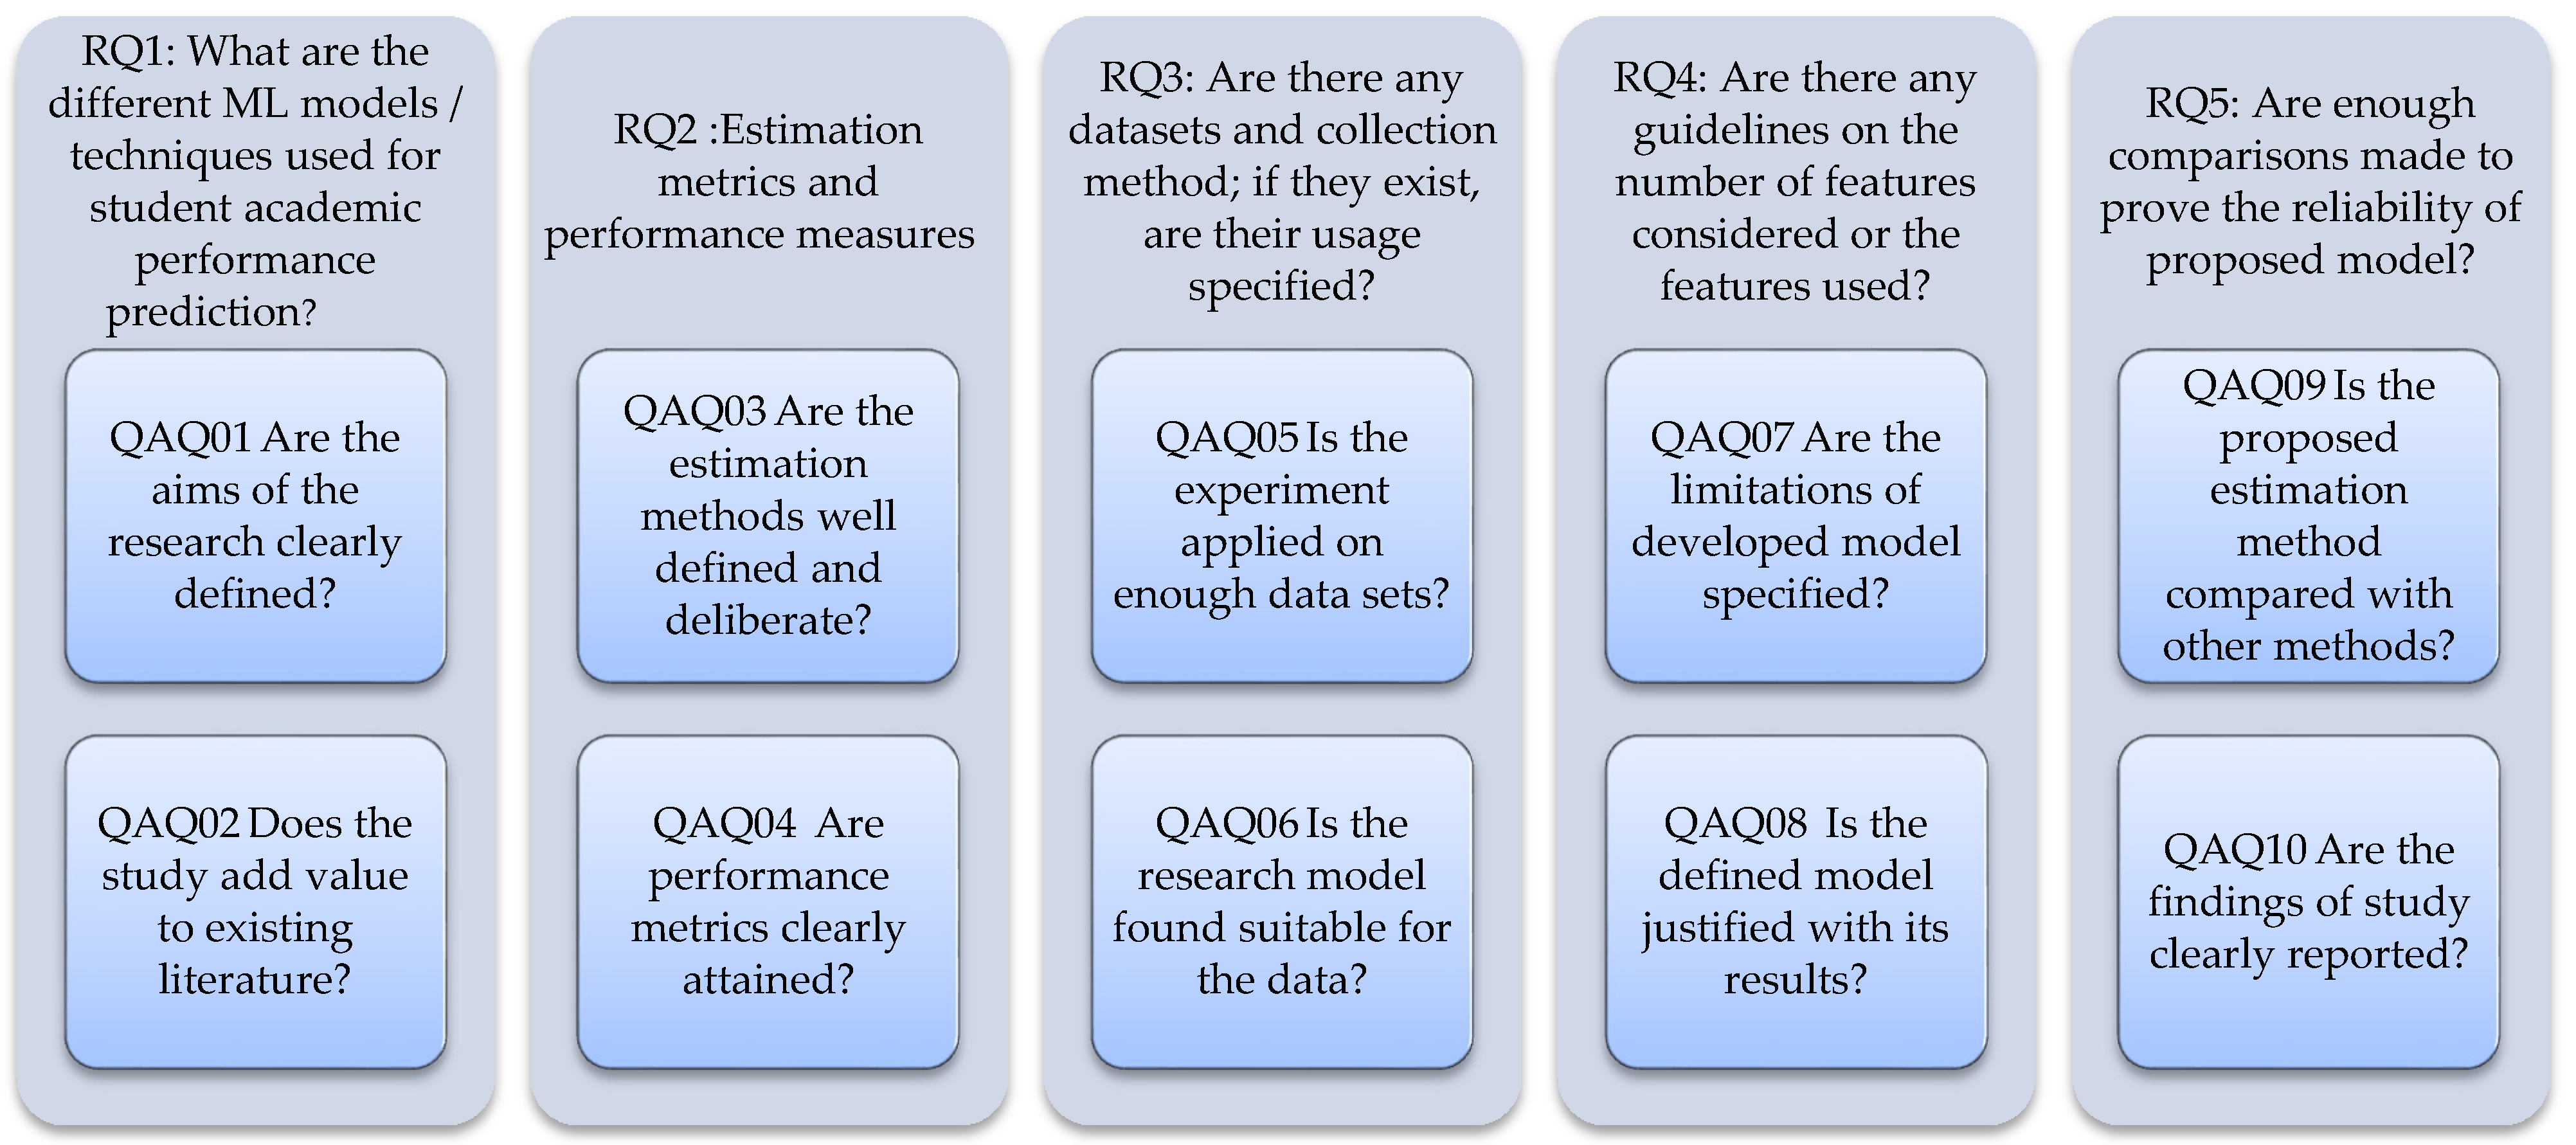
2.3. Study Quality Assessment
After refinement with consideration of these basic quality measures, the articles were analyzed for quality assessment as enumerated in Figure 3. The selected dataset reduced to the most suitable 56 articles, pertinent to the requirement of research for further investigation.
3. Results and Discussions
A fundamental eligibility criterion for selecting the articles was that they could answer the research questions framed. Table 2 provides evidence corroborating the selection of articles for study. Based on the questions each article was able to answer and the data that could be obtained for further quality score assessment of the article, the summary of articles taken up for study is tabulated. These tabulating aspects preceded in the rest of the article reveals the entire systematic literature review of the article. The pictorial and tabular depiction of results aims to give a better insight on the study carried over.
3.1. Overview of the Selected Studies
As the studies extracted from SpringerLink and ScienceDirect in the candidate datasets consisted of more research databanks, the search source was restricted to four of the indexing sources in majority, namely Scopus, WoS, IEEE Explore, and with the least contribution from Google Scholar. A total of 56.6% of the selected papers were taken from Scopus and the next 38.5% was contributed by the articles taken from WoS for this study. The remaining 5% of the articles were found interesting from IEEE Explore and Google Scholar. The details are depicted in Table 3.
As shown in Figure 3, the research questions were extended to 10 quality assessment questions based on which the scores of Table 4 are calculated.
The selected articles were taken into consideration to undergo quality score assessment. The scores were given on a scale of 1, 0.5, and 0 measuring a positive, partial, and negative response, respectively, to the quality assessment questionnaire that comprised 10 questions contributing to a total score of 10 for each selected article. Quality assessment attempts to weigh the studies and their importance to this survey. The scores were categorized as very high (9–10), high (7–8), medium (5–6), low (3–4), and very low (0–2). Each study under consideration could have a maximum score of 10 and a minimum score of 0.
Hence, the 80 studies taken into consideration as shown in Table 2 were reduced to 56 final articles for a further analysis. The quality assessment questionnaire was prepared such that the answers were derived in relevance to the research questions.
Table 5 shows the article distribution from the selected articles based on the quality score.
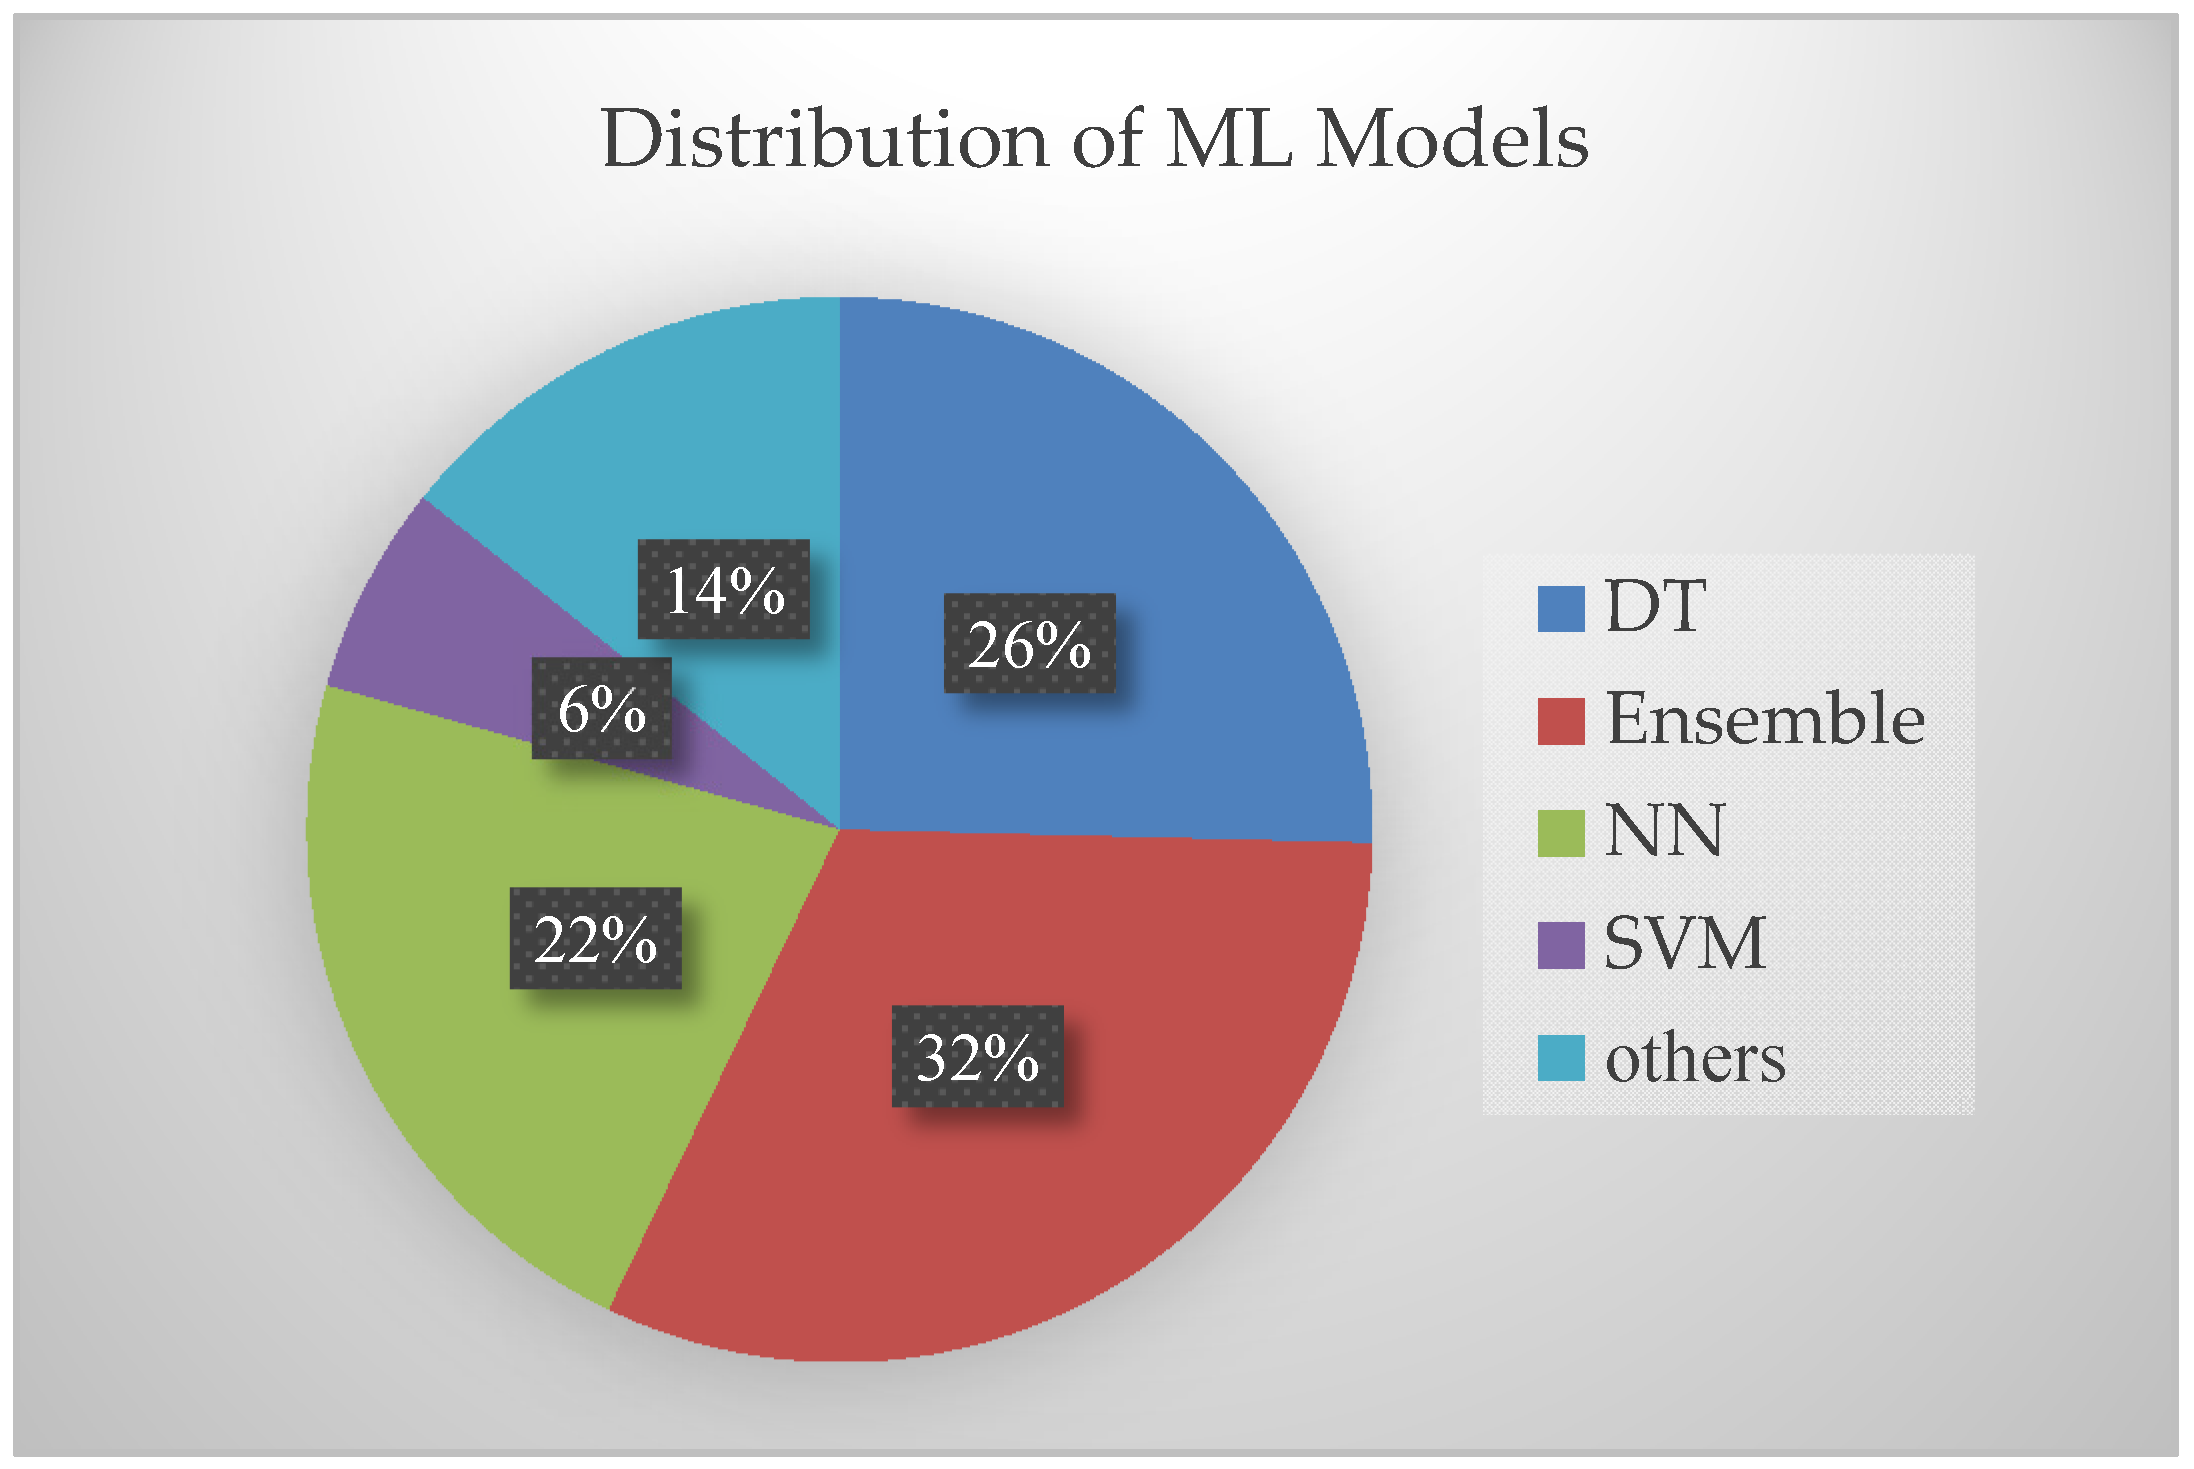
3.2. Models and Metrics Used
The selected publications illustrate the reference and the ML methods to furnish an insight of the overview on the models developed and to provide an answer to RQ1. For ease of analysis, the ML algorithms branched are categorized under major classes. RQ1 addresses the ML models used. The entire set of ML models used in different articles is broadly categorized as decision trees (DT), neural network (NN), support vector machine (SVM), and ensemble method. RQ1 was supported by the graphical data in Figure 4, depicting the ML methods used in the selected articles of study and the frequency of their use. Figure 4 shows that 32% of the used models contribute to ensemble models, 22% to neural network models, 26% of decision tree models, and 14% of other ML algorithms.
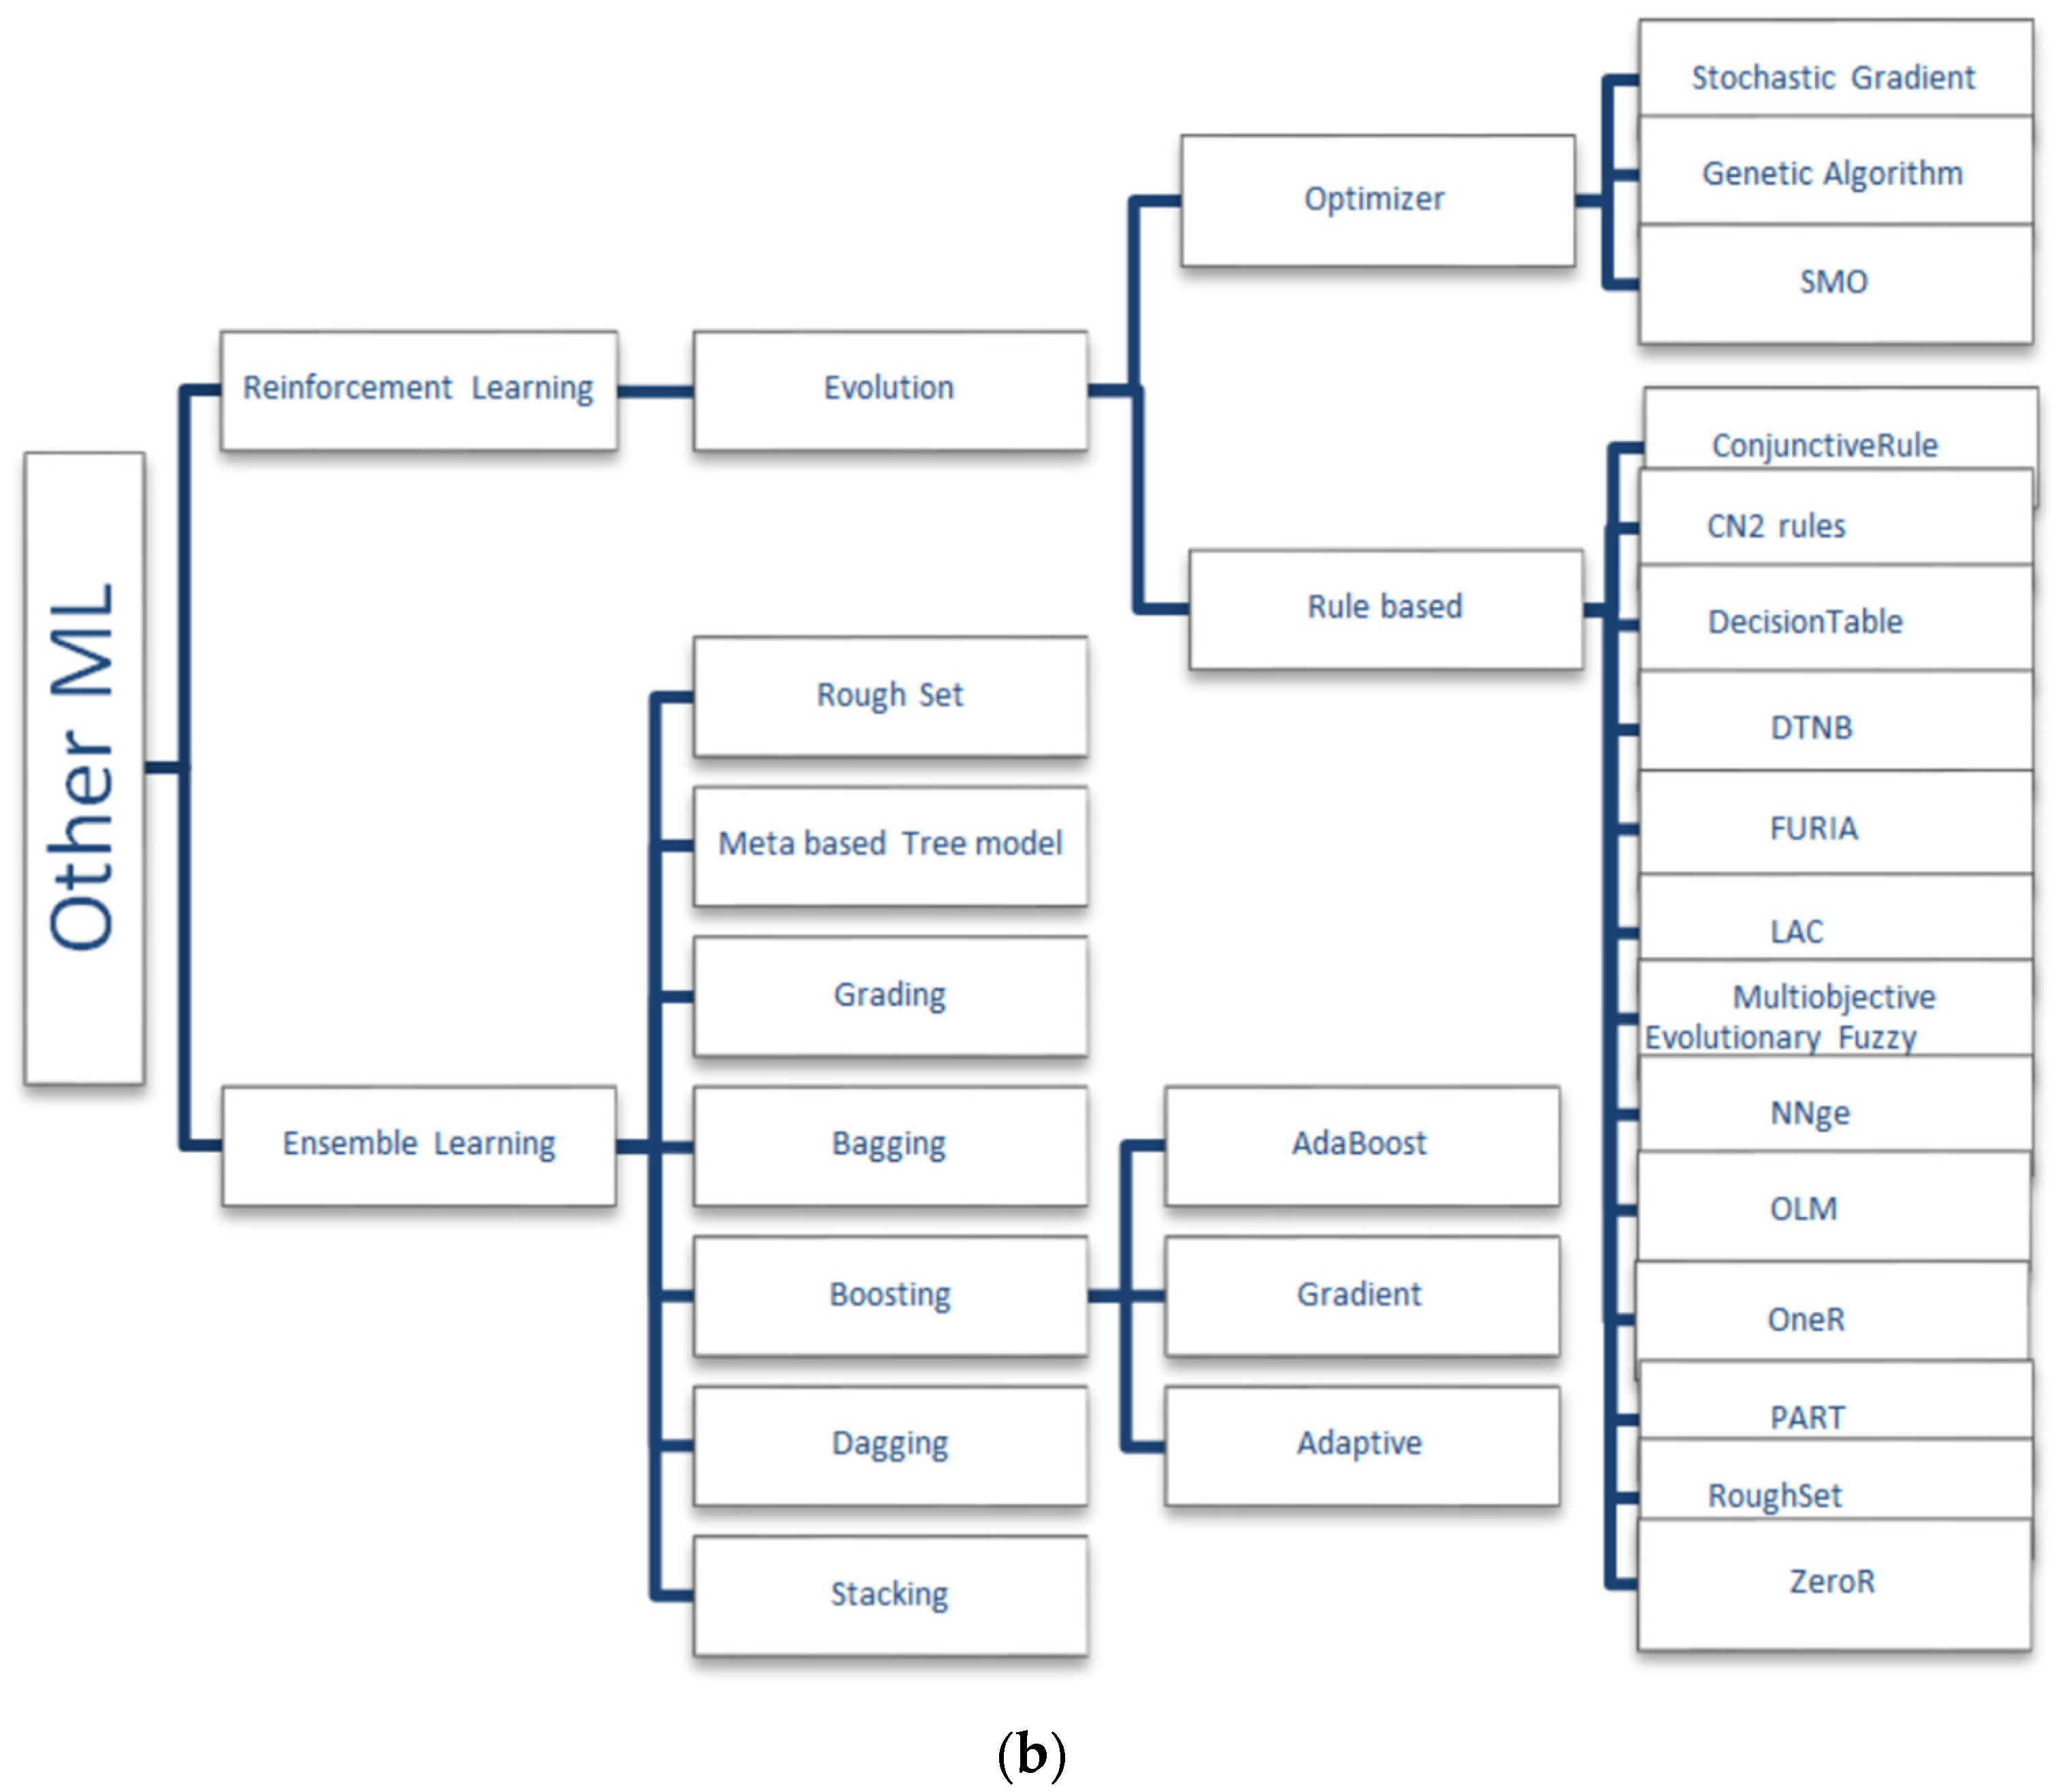
As defined by Patrick [81], the taxonomy of algorithms that were utilized for the purpose of study are shown in Figure 5a,b. The taxonomy defined is based on the mathematical impact of the algorithms used. The following subsections gives a brief notation of the several mathematical idea-based models as given by Patrick [81].
3.2.1. Supervised Learning Algorithms
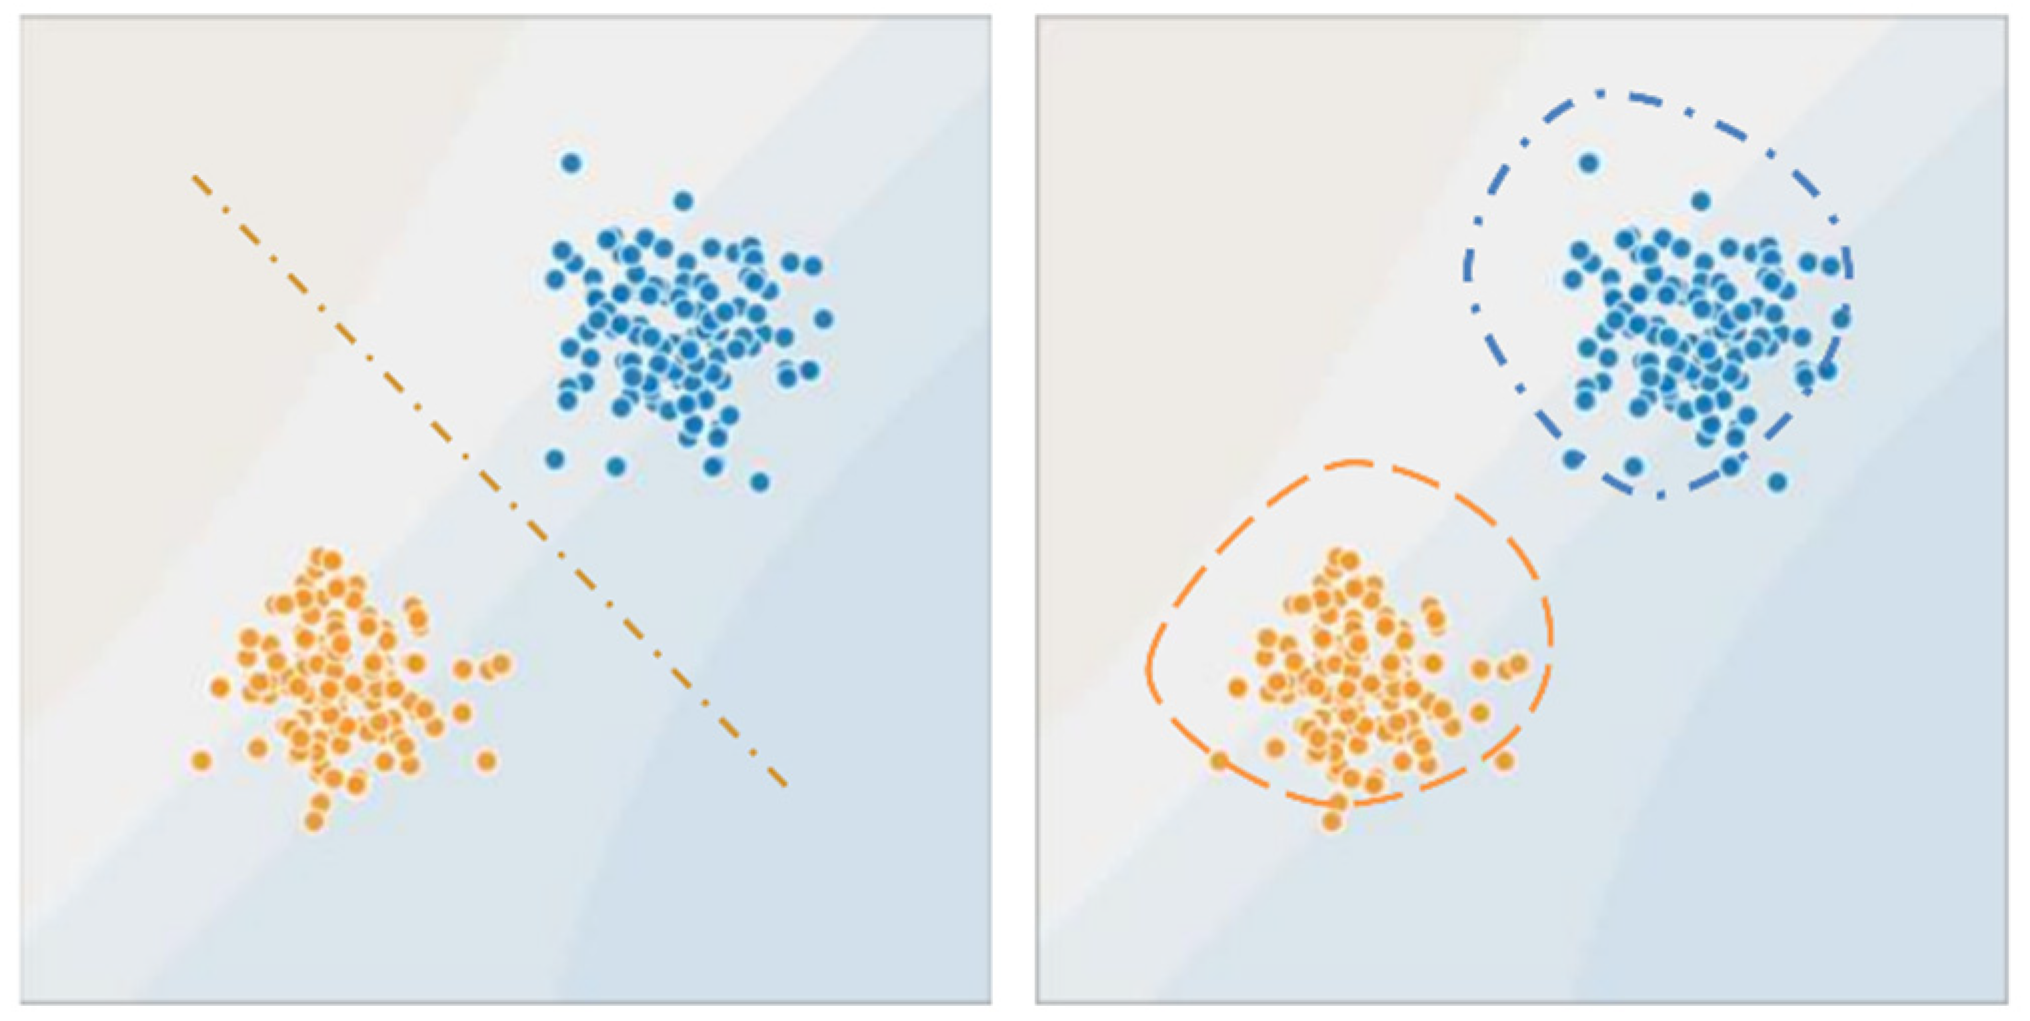
Given a set of data points {x1, …,xm} associated to a set of outcomes {y1, …,ym}, the aim of the supervised learning algorithms is to build a classifier that can predict y from x. The supervised learning algorithm prediction can be a regression model producing a continuous output or a classification model predicting a class of the given input values. A broad classification of supervised learning involves two types of mathematical concepts to perform either classification of regression model formulation. Logistic regression, support vector machine, and conditional random fields are popular discriminative models; naïve Bayes, Bayesian networks, and hidden Markov models are commonly used generative models. The supervised model is branched up as generative and discriminative models as in Figure 6. The generative model learns the probability distributions of the data and estimates the conditional probability P(x∣y) to then deduce to the posterior P(y∣x), whereas the discriminative model creates a decision boundary to directly estimate P(y∣x).
In a generative random model, the two models that were used by different authors include naïve Bayes and belief networks. Naïve Bayes assumes that all features are independent, whereas belief networks allows the user to specify which attributes are, in fact, conditionally independent.
In supervised learning, the hypothesis is noted as hθ, the model that we choose. For a given input data xi, the model prediction output is hθ(xi). A loss function is given as L:(z,y) ∈ ℝ × Y⟼L(z,y) ∈ ℝ that takes as inputs the predicted value z corresponding to the real data value y and outputs how different they are. Some of the loss functions are least squared error, logistic loss, hinge loss, and cross entropy. The loss function then contributes to the calculation of cost function as . The update rule for gradient descent is expressed in terms of the cost function calculated, and the learning rate α ∈ ℝ is given as . With the known parameters , the likelihood and the parameters , the optimal parameters are determined as .
Some of the linear discriminative models included in the survey articles are linear regression, logistic regression, polynomial regression, ridge regression, and the non-parametric discriminative model, which includes K-nearest neighbor. While discrete discriminative models include support vector machine models, neural networks, and trees in several variants. However, the linear discriminative algorithm works in its own fashion, and the articles taken up for study have included some of the mentionable variations in their work. They include the Widrow–Hoff rule and locally weighted regression parameters in the calculation of optimal parameters. Support vector machines have used the concepts of Lagragian multipliers and Kernel and optimal classifiers in different notations.
3.2.2. Unsupervised Learning Algorithms
Unsupervised learning algorithm takes into account the aim of finding hidden patterns from the input data, provided output labels do not exist. The major concentrations of the authors were found in clustering, Jensen’s inequality, mixture of Gaussians, and expectation maximization. Most of the articles on unsupervised learning tried to attain their pattern of clustering by finding patterns using dimension reduction techniques. These dimension reduction techniques find the variance maximizing directions onto which to project the data. Some of the metrics used to evaluate the clustering are the Davies–Bouldin index, popularly known as DB index, which calculates the average distance of all points in a particular cluster from the cluster centroid, and the Dunn index that calculates the ratio between the minimum inter-cluster distance to the maximum intra-cluster distance. The Dunn index showed an increase as the performance of the model improved.
Many ensemble learning and reinforcement learning algorithms were taken into account in the survey made. Even though all the articles taken for study could not be illustrated, some of the models are given in brief note. For better understanding of the models used, they are best illustrated in Figure 5a,b.
The articles that contribute to the categorization are shown in Table A1, Table A2, Table A3 and Table A4 of the Appendix A. Based on the quality score, the articles are segregated. Even though there exist some discrepancies with the presence of metrics in the articles, they were also considered for quality assessment, where they obtained a minimal score. The evaluation metrics or the principles used were not found in most of the articles, which could not provide a proper insight on the data or the model used.
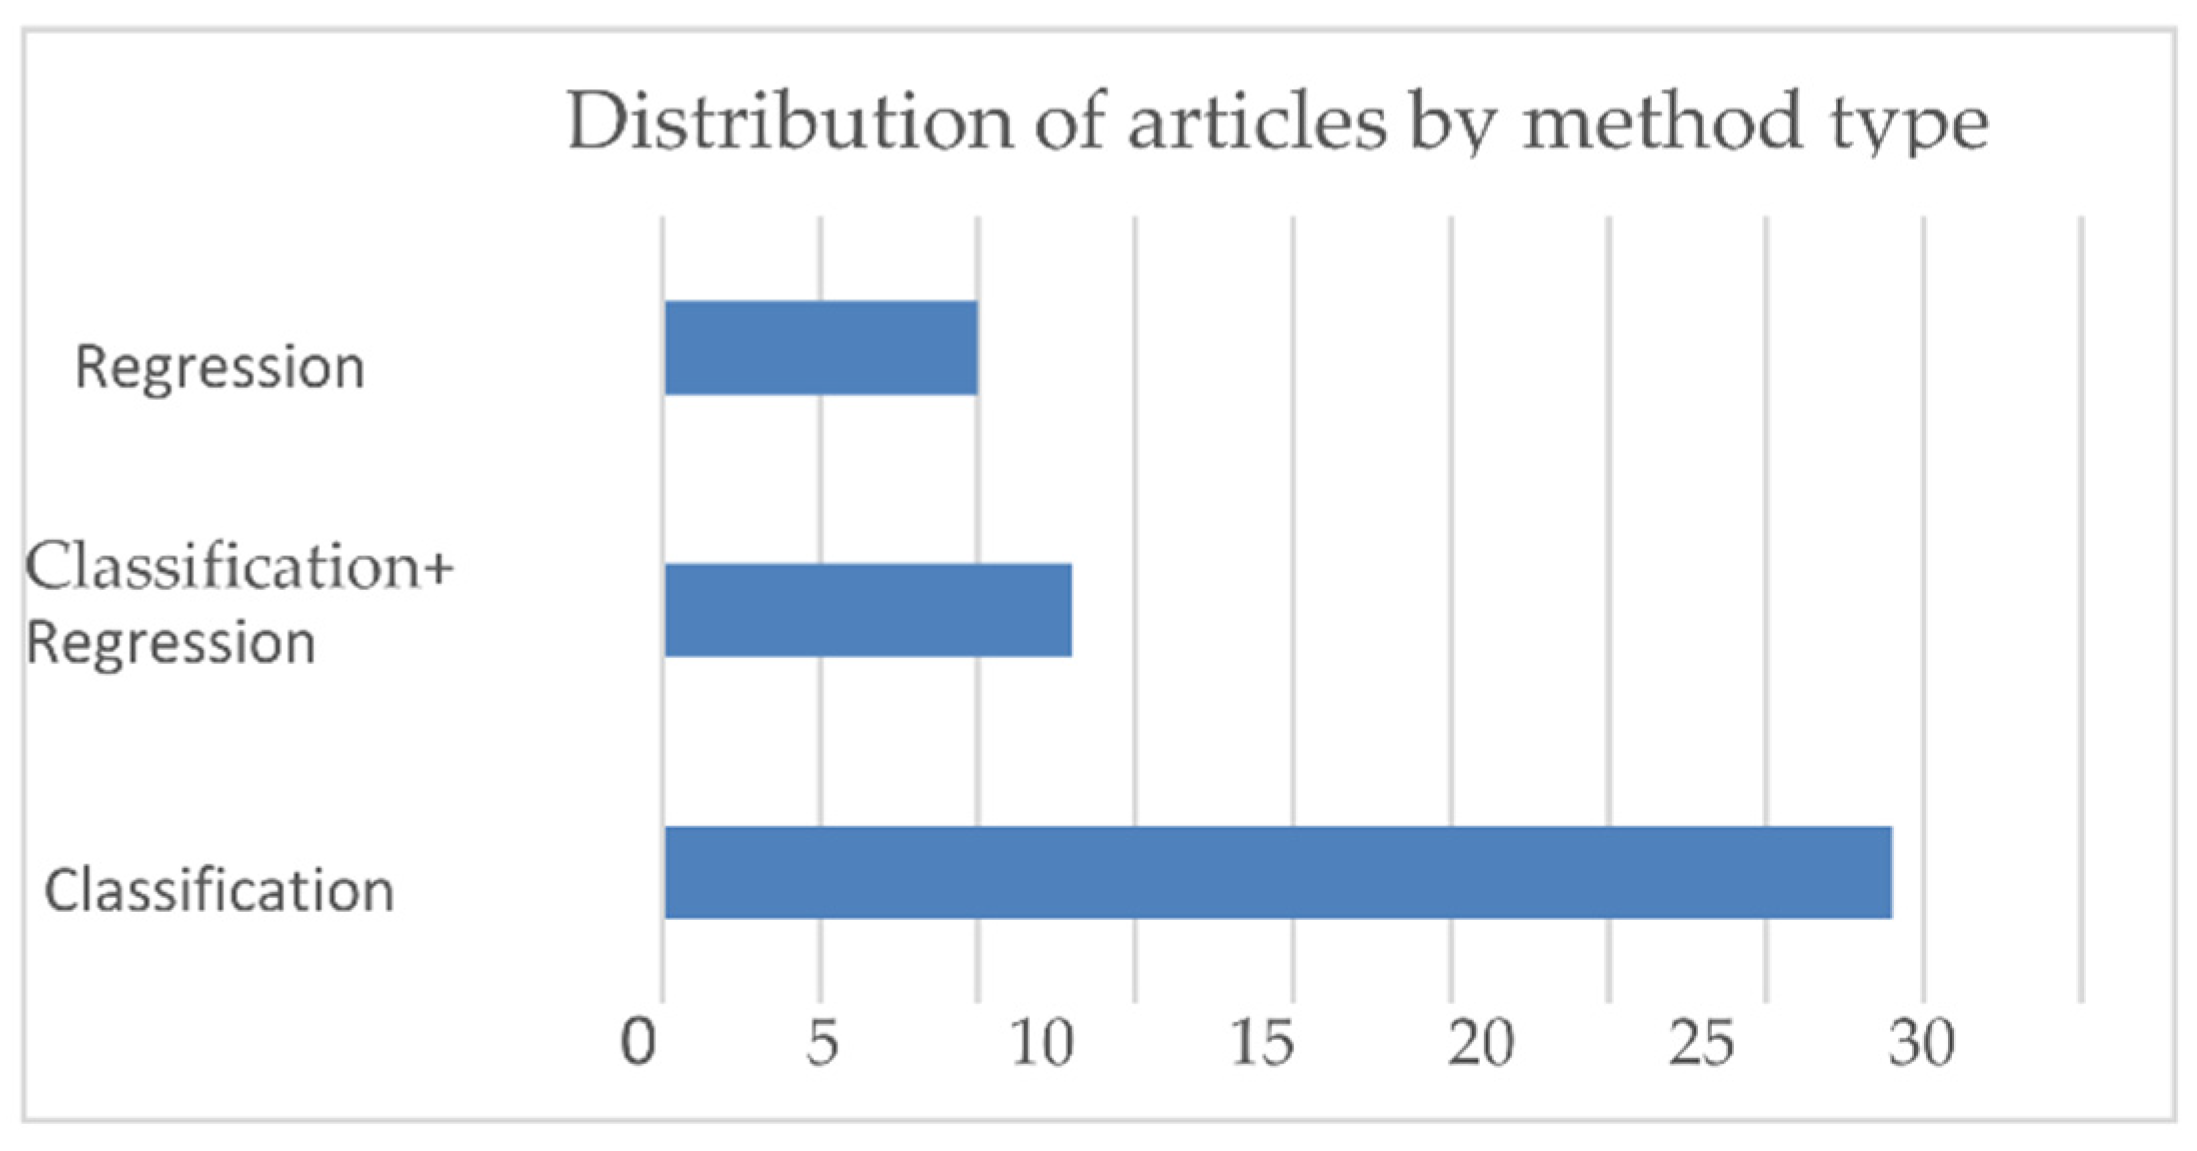
The entire set of the selected articles were evaluated and analyzed with respect to the performance metrics, which gives a response to RQ2. The set of algorithms, as discussed in the previous section, takes up the major category based on the way those algorithms function as classification and regression, and in some articles, an ensemble of classification and regression algorithms were used. The usage of articles in these categories is analyzed as shown in Figure 7.
A classification problem is the one where the dependent variable is a categorical one. Classification models entail algorithms such as logistic regression, DT, random forest, and naïve Bayes. Model performance metrics are estimated based on the values obtained from confusion matrix, accuracy score, classification report, receiver operating characteristic (RoC), and area under curve (AUC), confusion matrix being an intuitive metrics to determine the accuracy of the given model is suitable for a multiclass classification problem. The performance metrics with respect to the classification algorithms taken up for study are listed in Table 6.
Confusion matrix depicts the overall performance of the model, and accuracy reveals the number of correct predictions made by the model.
Regression problems are the ones wherein we find a linear relationship between the target variables and the predictors. In such problems, the target variable holds a continuous value. Such methods are typically used for forecasting. Regression models include algorithms such as linear regression, DT, random forest, and SVM.
The performance metrics of the regression problems are identified as mean absolute error (MAE), mean square error (MSE), root mean square error (RMSE), and R-squared error. An MAE value of 0 indicates no error or perfect predictions. An MSE estimated to zero means that the estimator predicts observations of the parameter with perfect accuracy. Root mean squared error (RMSE) measures the average magnitude of the error by taking the square root of the average of squared differences between the predicted and actual observation. The RMSE will always be larger than or equal to the MAE; the greater the difference between them, the greater the variance in the individual errors in the sample. If RMSE = MAE, then all the errors are of the same magnitude. R-squared score is the proportion of the variance in the dependent variable that is predictable from the independent variable(s). It is known as the coefficient of determination. The value of R2 lies between 0 and 1, where 0 means no fit and 1 implies a perfect fit. The performance metrics with respect to the regression algorithms taken up for study are listed in Table 7. Research question analysis on the corpus yielded a valuable report on the datasets utilized for the analysis of the proposed models. Most of the authors have performed the analysis on collected real-time data from various educational institutions.
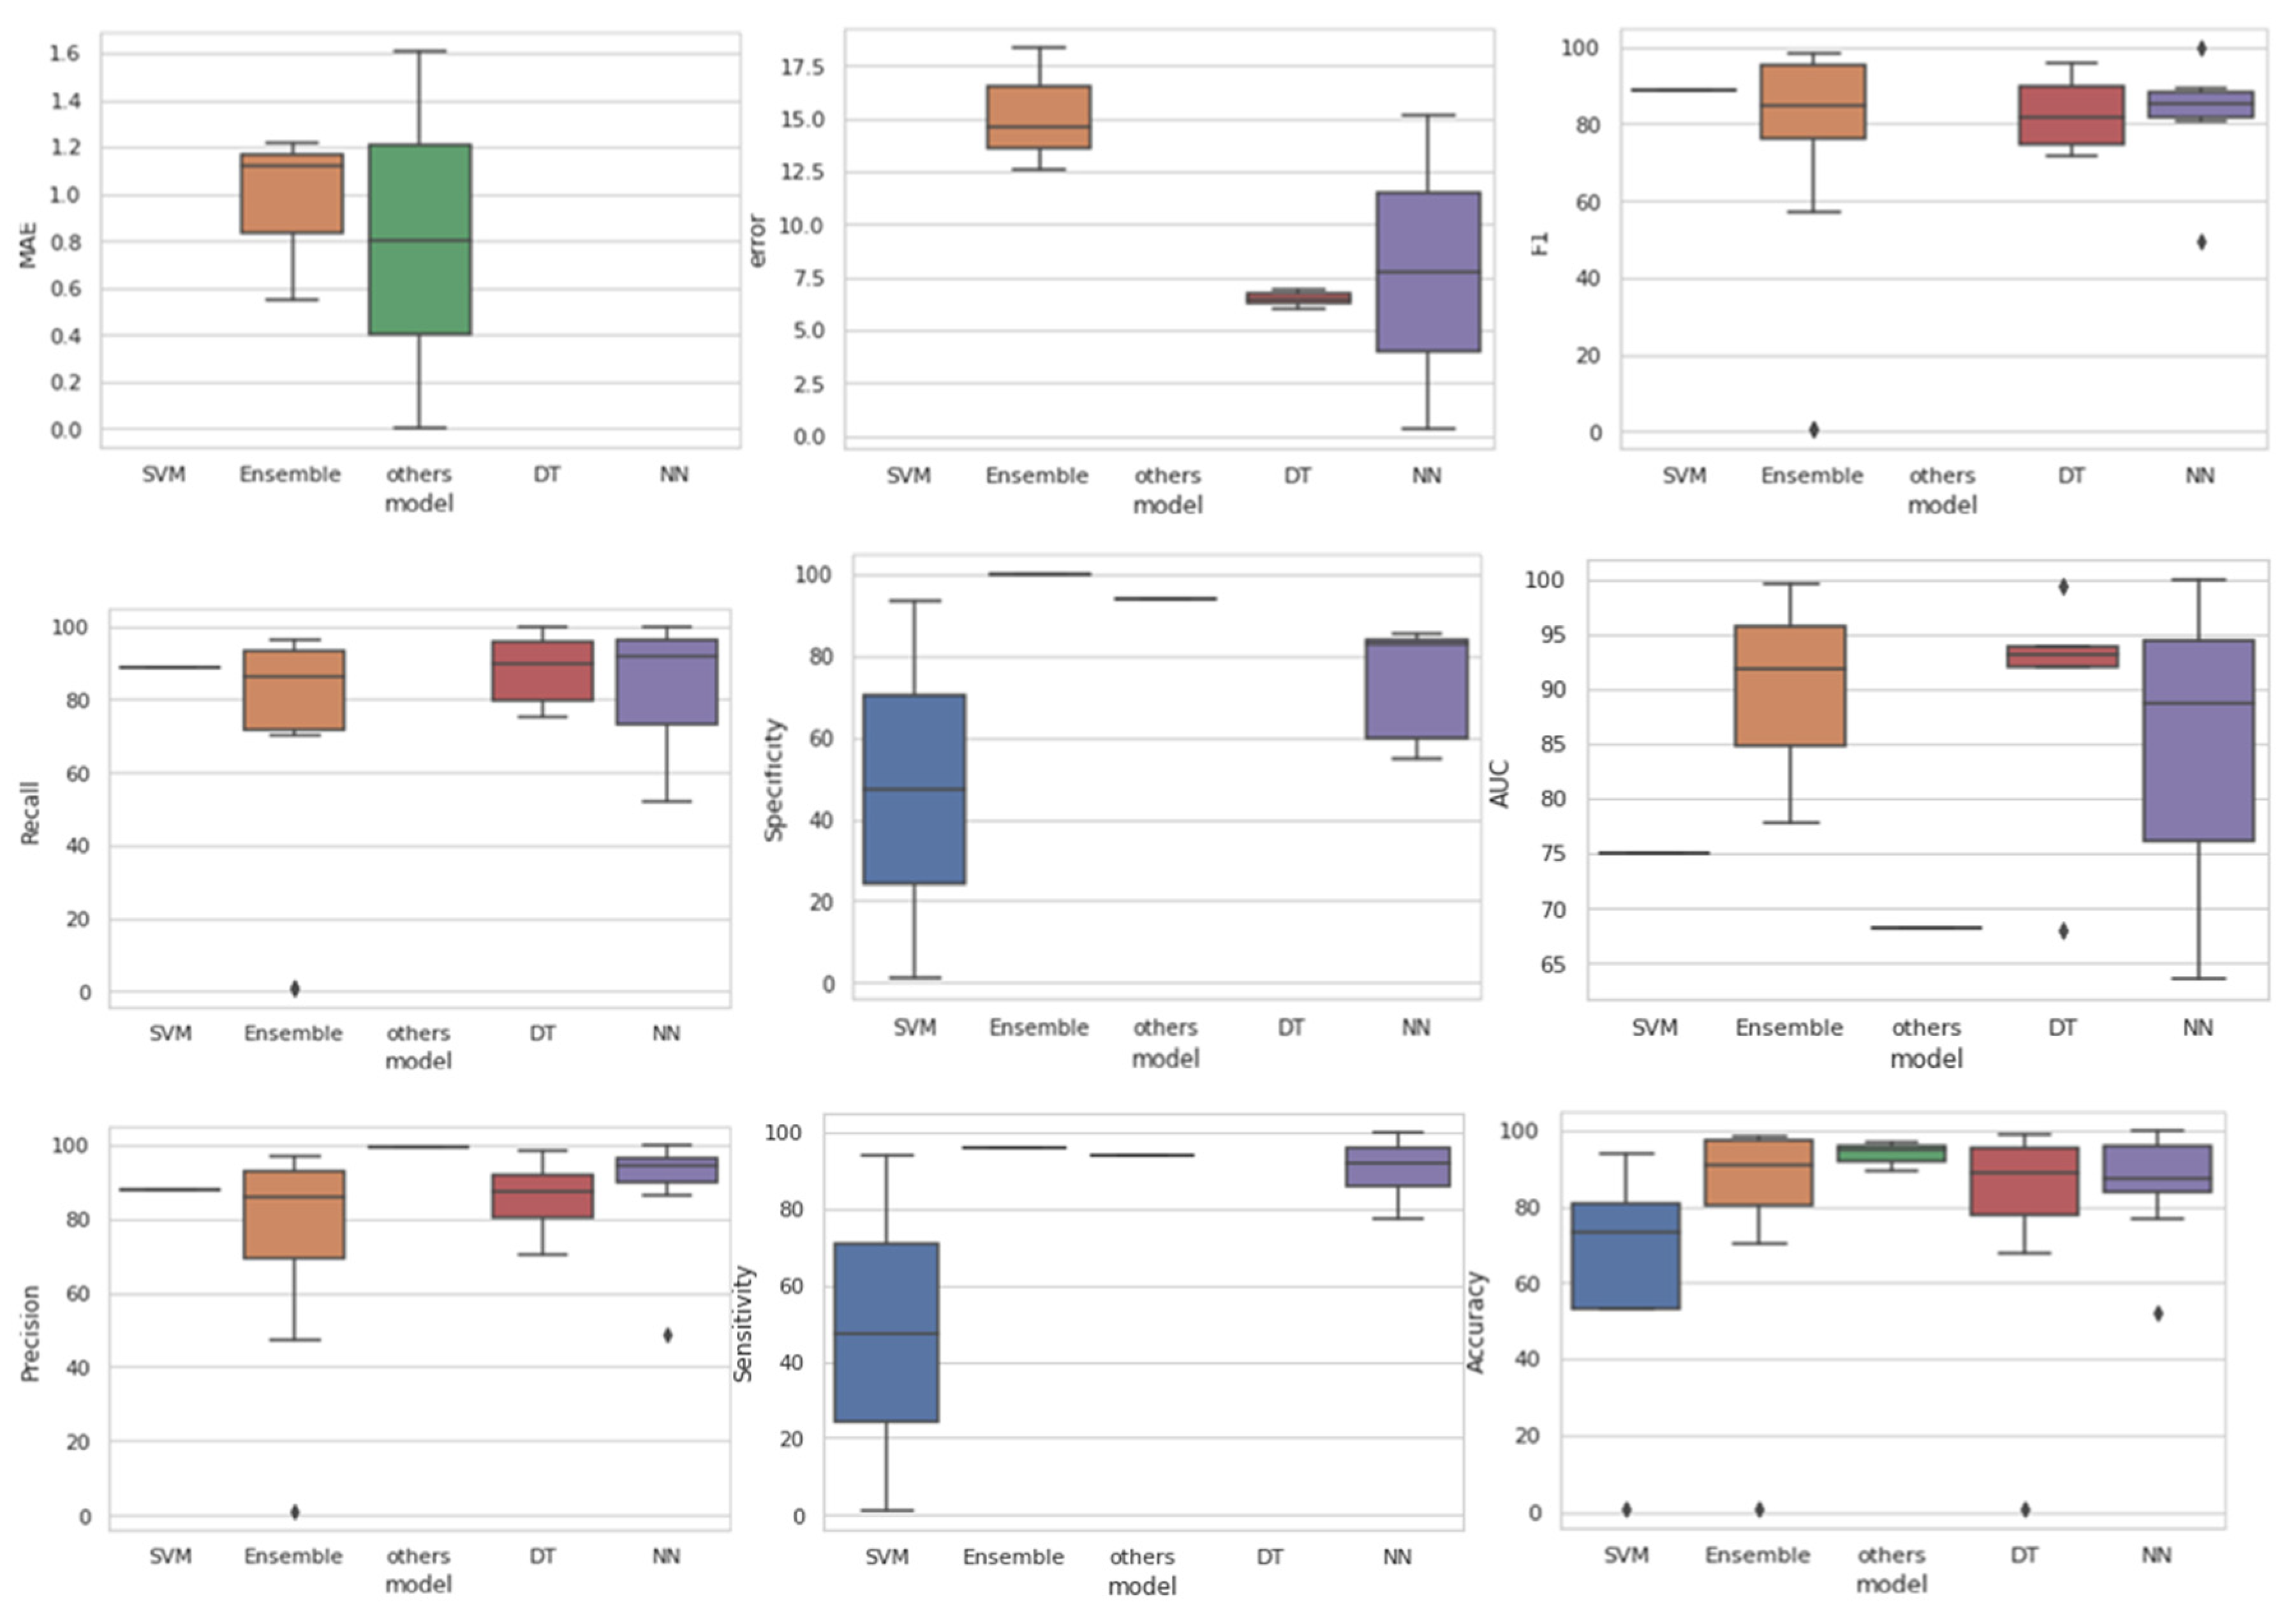
However, only a few articles reflect their testing and validation on open data sources. The box and whisker plots in Figure 8 denote the percentile of the values obtained against each performance metric. Even though there exists certain outliers for a few performance metrics, they can be overlooked. Table 8 displays the specific articles that have utilized the mentioned performance metrics and the number of articles that have utilized these measures.
3.3. Dataset Preparation and Utilization
RQ3 enquired about the datasets, their collection methods, and their details of usage. RQ3 is provided with a score in quality assessment based on the number of datasets used. Considering the datasets used in the selected corpus of articles and their maximum and minimum sizes, the score varied from 100s, 1000s, and 10,000s as 0, 0.5, and 1, respectively. Since minimum data size could not prove the credibility of results obtained by the author’s experiment, they were provided with the least evaluation score. Approximately 75% of the articles were assessed for their dataset with the ML algorithms and reported the performance metrics based on the self-collected data from their own source. The remaining 25% of the articles used existing datasets of academic performances. The related articles’ references are specified in Table 8. The datasets used are mentioned in the Table A1, Table A2, Table A3 and Table A4 of the Appendix A. The datasets are not detailed in this section, since they are not benchmark datasets, but the parameters that were considered by various datasets collected are consolidated in Table 9.
3.4. Feature Description and Usage
Even though RQs 4 and 5 speak of the feature mentions and their usage in the research articles under study, they play a central role in deciding the features to be concentrated and the way data collection can take place in future in order to proceed with effective research on academic performance prediction.
Some of the features mentioned as a group in the research articles are social, demographic, personal, academic, extracurricular, and previous academic record. Even though the categorization was made in this common aspect, the individual components contributing to the research conducted varied in accordance with the educational institution, their geography, and their previous experience with students. The data do not only limit themselves to category of education institution or mode of study; it varies from online education university, online education courses, regular academic universities, colleges, schools, and others.
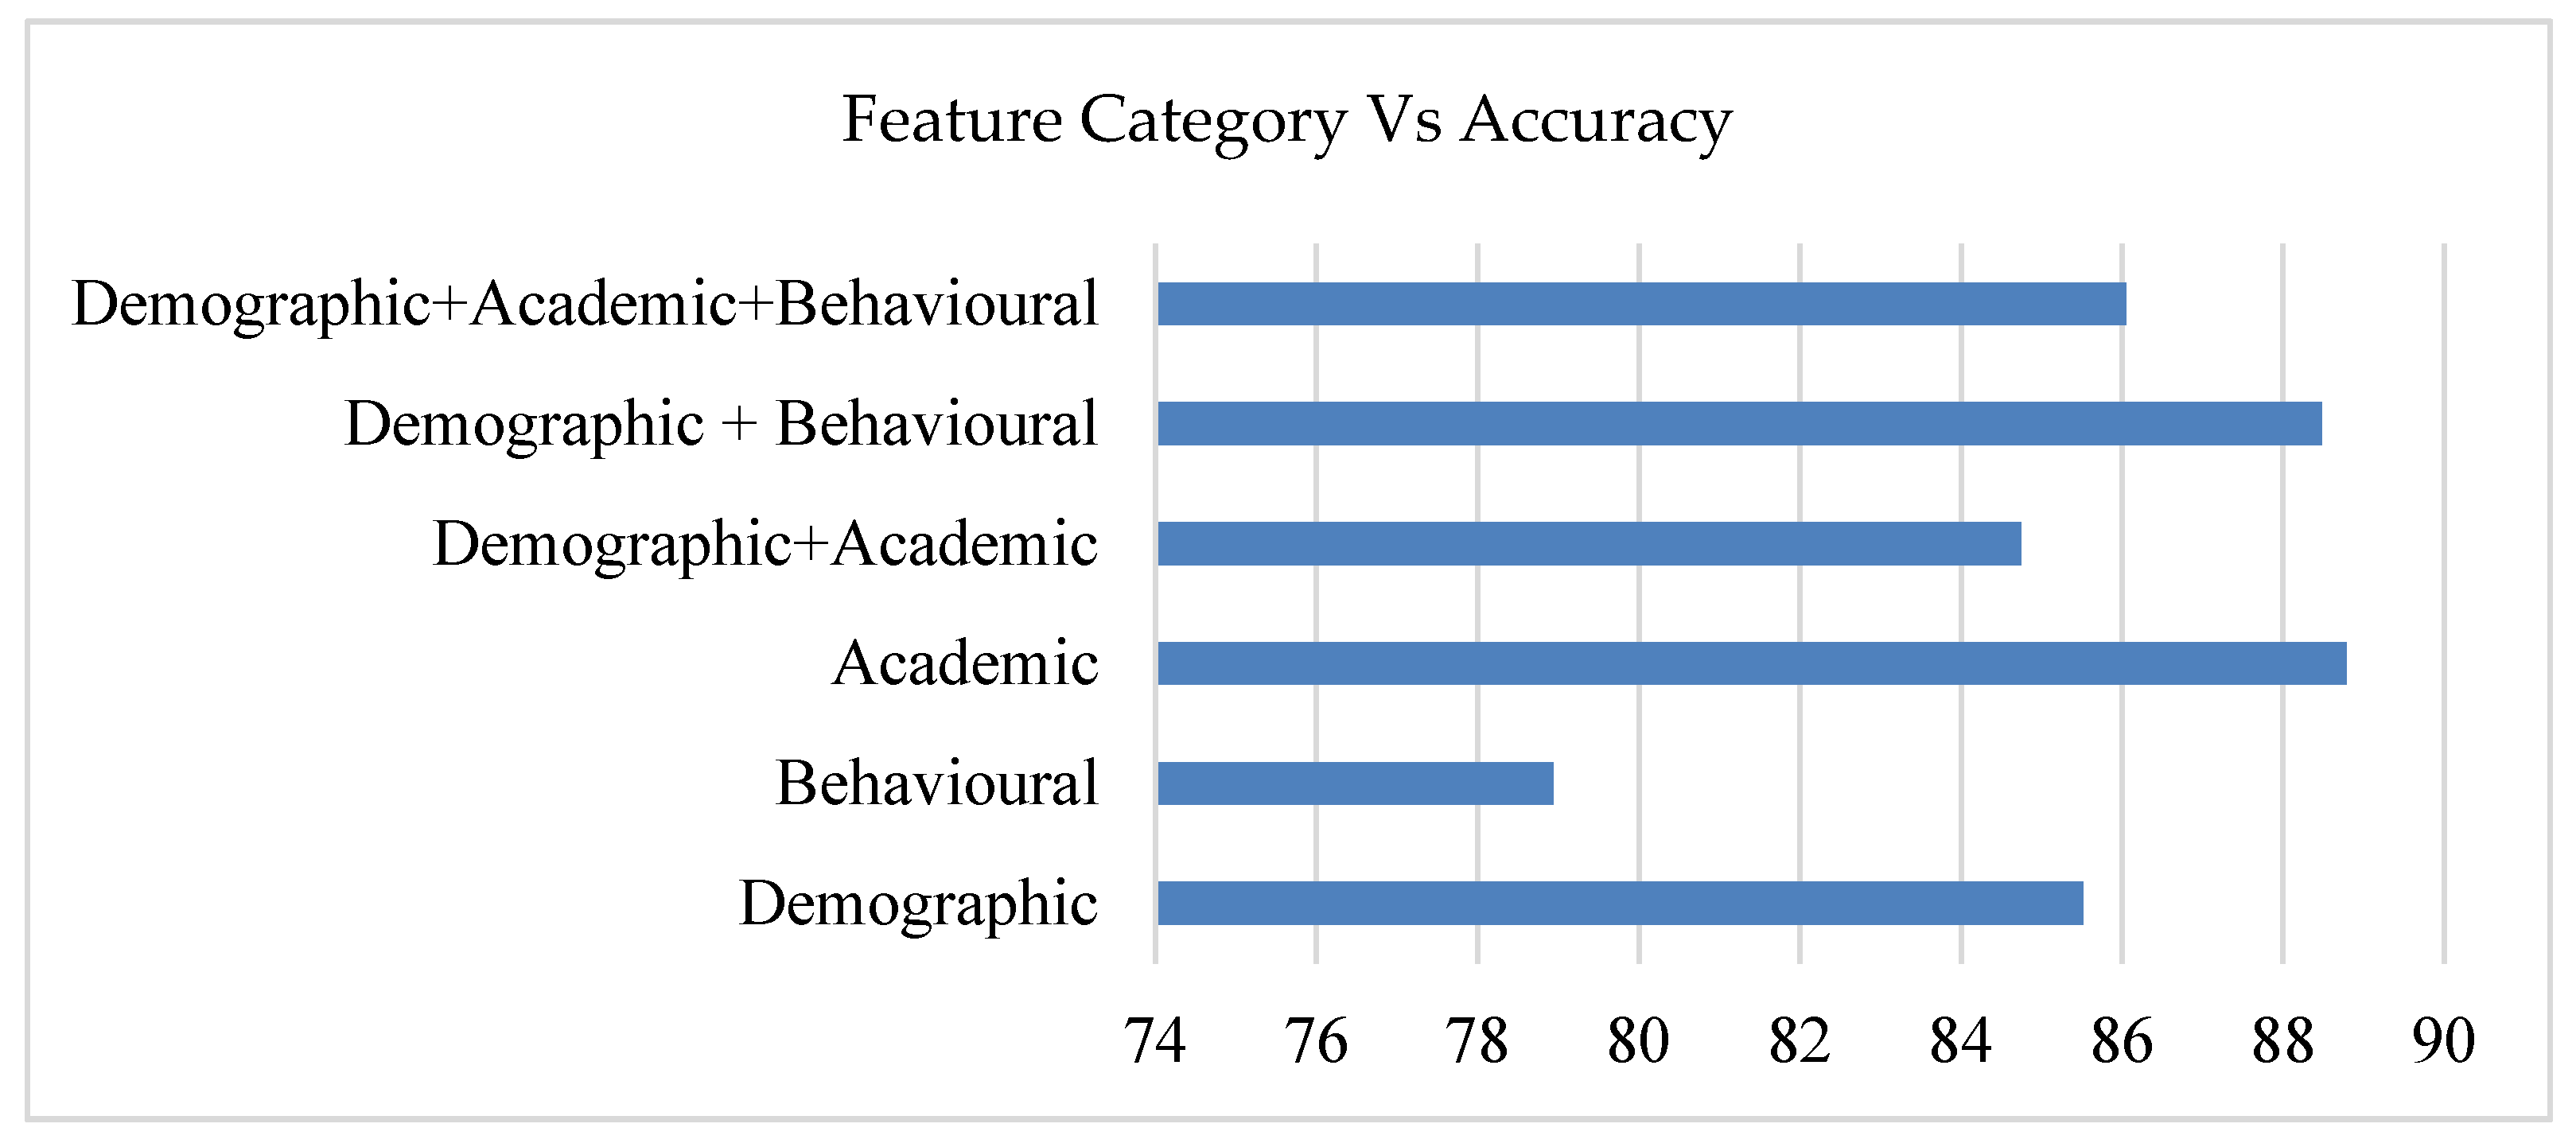
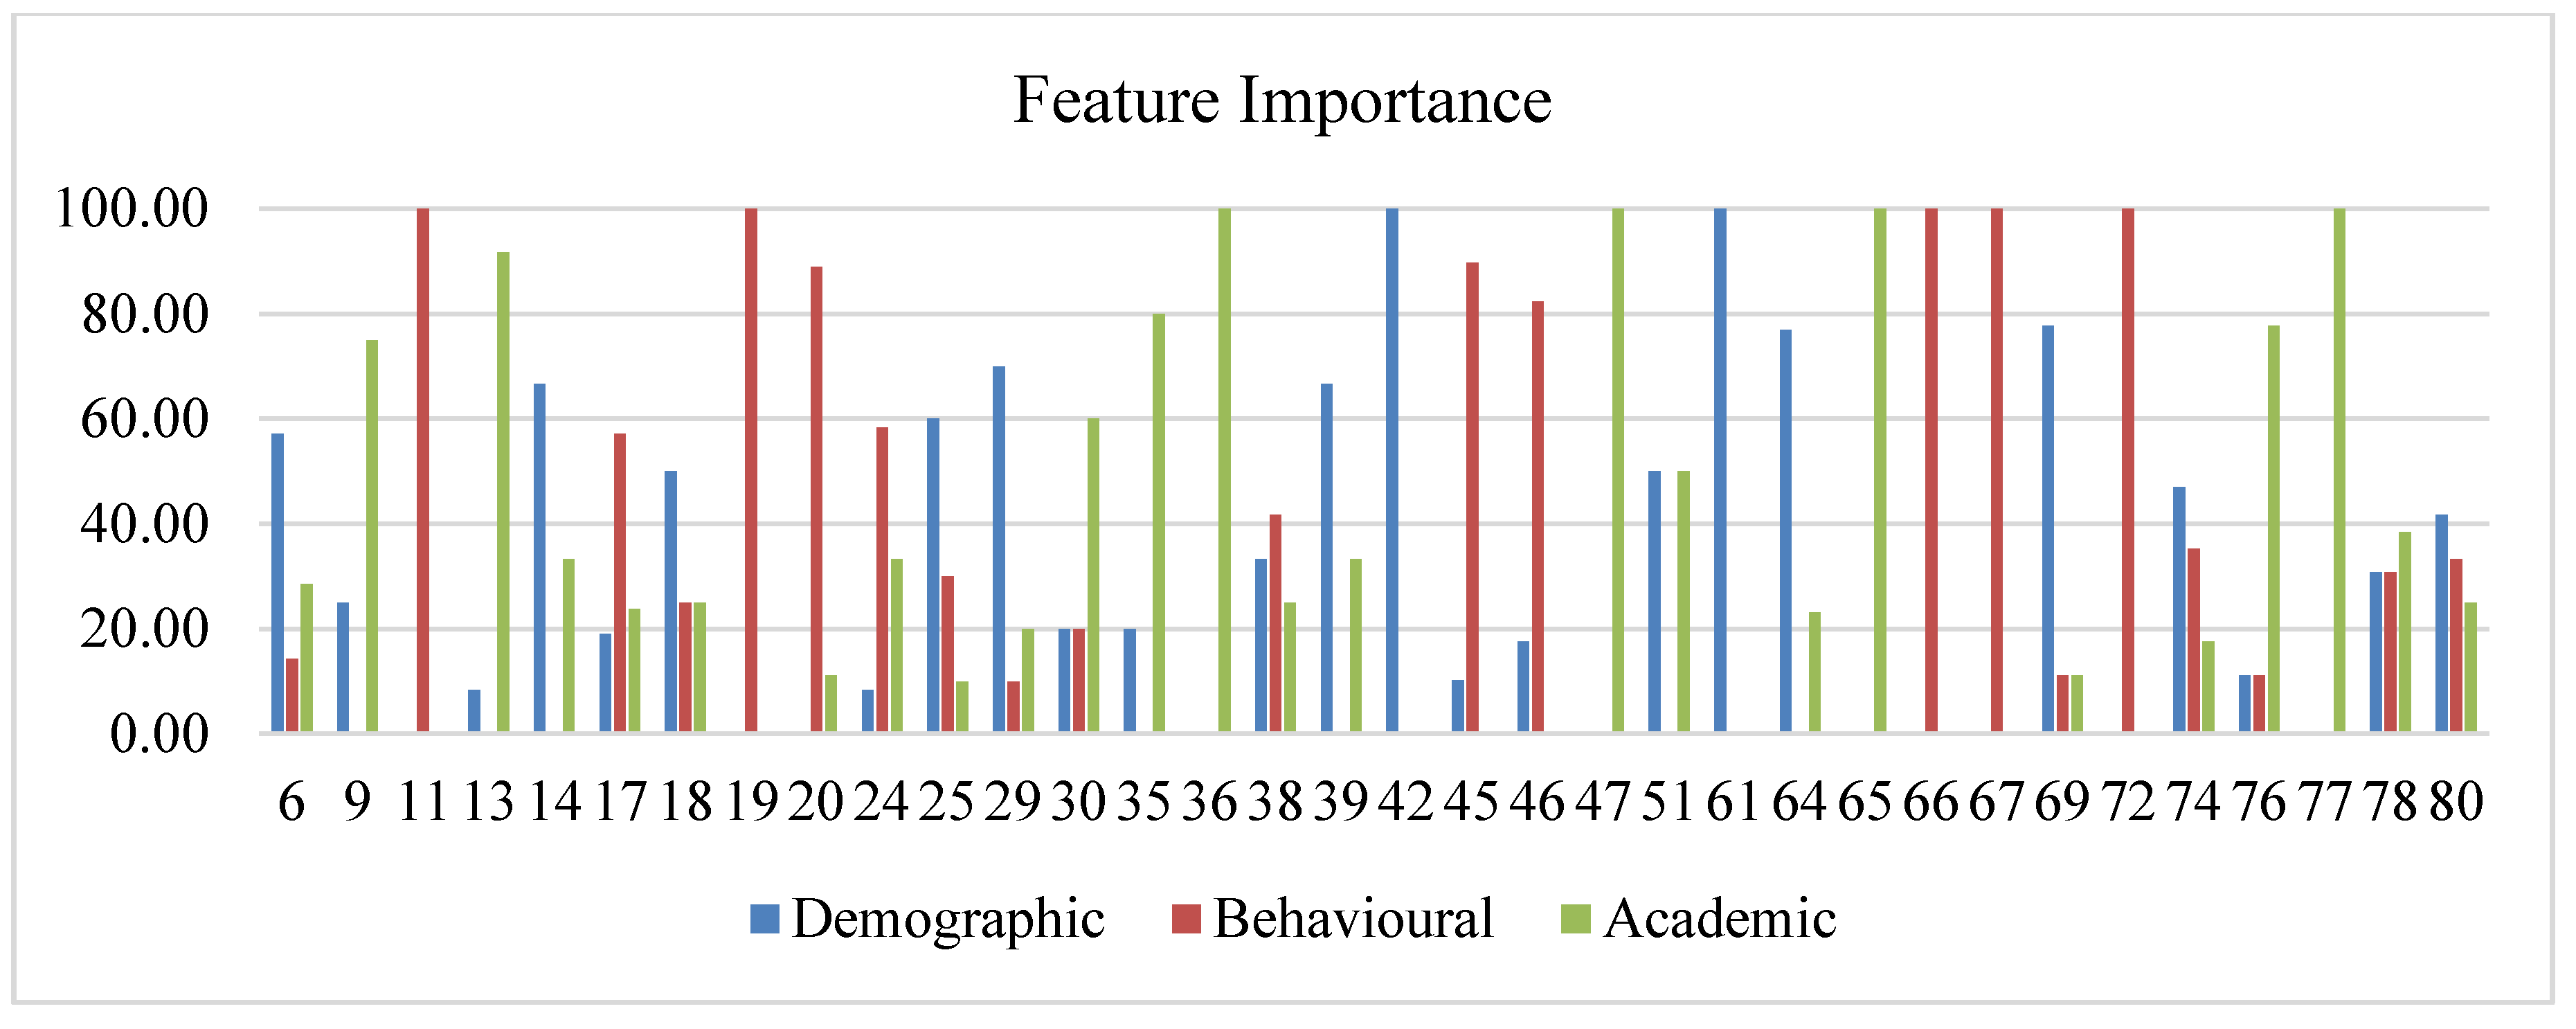
The category of features to their accuracy and their importance is shown in Figure 9 and Figure 10. Figure 9 includes the details of the importance given to each feature category. Out of the scored articles, around 39% of articles contributed with three-feature set importance, dual-feature set importance is given by 30% of articles, and one-feature set is given importance by 32% of articles. Additionally, it is noted that minimal accuracy stays when considering only the behavioral features. However, the accuracy stays equal with demographic–academic dual feature and with academic features contributing to an average accuracy when all the three features are considered.
Based on the features described in the articles, they are broadly classified based on demographic, academic, and behavioral features. Out of the selected 56 articles of study, only 34 articles sustained delivering their features and their nature of importance. Table 9 specifies the detailed list of parameters that have been adopted in the studies. The quality assessment score is contributed as a response received from RQ 6 as shown in Table 4. The number of comparisons made in the proposed model to prove that its excellence against other models was considered. The taxonomy broadly explains the models used in each category of ML algorithms.
Even though each ML-based algorithm works on the same principle in its own way, it behaves differently for the data used. The ML algorithm must be trained and used for the specific data to be fit enough for classification or prediction. Hence, the models that were used are also considered for evaluation, as this can potentially provide a fair idea to the future researchers on the process of proceeding with their research in the domain of academic assessment and prediction.
This systematic review was constrained to ML algorithms used in the domain of academic performance prediction. It was found that various algorithms have been used; some algorithms that were not used and applied were not considered for testing in this domain of research. Hence, the future researchers can consider those algorithms used in the previous studies as benchmarks and proceed with the unused ML models to showcase the results. Additionally, a bird’s-eye view on the related disciplines of ML, namely AI, DL, statistics, and data mining with respect to this domain of research, can be done in order to devise new valuable ideas and provide the attempts to implement them.
4. Conclusions
Conclusions attained from the systematic review made are:
- DT and ensemble learning models have been employed in several selected articles, wherein NNs or transfer learning with appropriate layers can be adopted to make an unbiased decision on the model suitable for the collected data.
- Most articles focused only on a specific aspect of accuracy, and it seems to be a biased one. Indeed, the performance measures can be chosen from a wide variety of available measures suitable for the problem of study as classification or regression.
- The amount of data collected for the dataset can be computed in a high quantity and of a cohort nature of a specific set of students to analyze their change in behavioral features and demographic features that influences their academic feature study.
- Behavioral features were taken in a large quantity, which could be equated to the other two categories of features as academic and demographic features. In the online mode of study, the demographic feature does not have much impact on the academic features, whereas during offline modes of study, three types of features contribute equally to the performance of the student, which, in turn, leads us to decide the dropout percentage.
When a model is proposed, it is a common practice to compare the performance of various ML models on the collected data, which can influence the correctness or credibility of the data collected. However, it is a perfect practice to compare the performance of the proposed model against the datasets that were used in already existing research studies to prove the precision of the model, which, in turn, may likely lead to fine tuning of the model to fit multiple datasets.
Author Contributions
Conceptualization, S.A. and P.B.; methodology, P.B.; software, A.Q.; validation, S.A. and A.Q.; formal analysis, M.M.; investigation, P.B.; resources, P.B. and M.M.; data curation, P.B.; writing—original draft preparation, P.B.; writing—review and editing, P.B. and S.A.; visualization, M.M.; supervision, S.A. and A.Q.; project administration, S.A. and A.Q.; funding acquisition, S.A., P.B., M.M., and A.Q. All authors have read and agreed to the published version of the manuscript.
Funding
The research and the APC are funded by King Khalid University under the research Grant No. RGP1/207/42.
Acknowledgments
We would like to acknowledge the King Khalid University for their immense support in every step of research work carried out.
Conflicts of Interest
The authors declare no conflict of interest.
Appendix A

Table A1.
Estimation metrics (decision-tree-based models).
| Ref. | Models Used | Accuracy | AUC | Recall | Precision | F1 | Dataset Used | Quality Score |
|---|---|---|---|---|---|---|---|---|
| [11] | Random forest | 77.29 | NS | 75.6 | 75.6 | 75.6 | xAPI-Edu-Data | 9 |
| [12] | Random forest | 86 | 68 | 86 | 85 | 85 | Self-data from 3 different universities | 9 |
| [24] | Decision tree | 79 | NS | 75.1 | 70.3 | 72 | Webpage | 9 |
| [29] | Decision tree | 98.94 | 99.4 | 100 | 85.7 | 92 | Self-collected | 9 |
| [31] | Decision tree | 95.82 | NS | NS | NS | NS | UCI repository | 8 |
| [34] | Decision tree | 96.5 | NS | NS | 93 | NS | Collected data | 9 |
| [44] | Decision tree | 75 | NS | NS | NS | NS | Self-data | 8 |
| [46] | Decision tree | 98.5 | 92.1 | 97.3 | 94 | 95.6 | University of Stanford | 9 |
| [54] | Genetic algorithm-based decision tree | 94.39 | NS | NS | NS | NS | Federal Board of Pakistan | 8 |
| [55] | Random forest | 79.8 | 93.8 | 79.8 | 78.8 | 79 | University of Nigeria | 7 |
| [58] | Random forest | NS | 93 | NS | NS | NS | Self-data | 9 |
| [59] | Multiple linear regression | 90 | NS | 90 | 89 | 89 | Kaggle | 7 |
| [60] | Decision tree | 87.21 | NS | 93.65 | 89.39 | NS | University of Phayao | 9 |
| [62] | Random forest | 70.1 | NS | NS | NS | NS | University of Li’ege (Belgium) | 9 |
| [64] | Decision tree | 94.63 | NS | 95.76 | 98.33 | 71.9 | Open University of China | 10 |
| [79] | Decision tree | 67.71 | NS | NS | NS | NS | NEDUET, Pakistan | 9 |
Note: NS—not specified.
Table A2.
Estimation metrics (ensemble-based models).
| Ref. | Models Used | Accuracy | Sensitivity | Specificity | AUC | Recall | Precision | F1 | Dataset Used | Quality Score |
|---|---|---|---|---|---|---|---|---|---|---|
| [7] | Ensemble (J48, real AdaBoost) | 95.78 | NS | NS | NS | 0.958 | 0.958 | 0.96 | UCI Student Performance | 8 |
| [15] | Ensemble (reptree bagging) | 97.5 | NS | NS | NS | 96.3 | 96.4 | 96.2 | Self-data | 8 |
| [27] | Ensemble [DT, boosting] | 96.96 | NS | NS | NS | 95.97 | 94.97 | 95.5 | Self-data | 8 |
| [32] | Ensemble [NN, RF-boosting] | NS | NS | NS | NS | NS | NS | NS | NS | 6 |
| [43] | Ensemble [NB + AdaBoost] | 98.12 | 96 | 100 | NS | NS | NS | 98 | Directorate of Higher Secondary Education | 7 |
| [44] | Ensemble [DT-XGBoost] | NS | NS | NS | NS | 92.5 | 89 | 89 | OULAD | 8 |
| [47] | Ensemble [DT, SMO] | 90.13 | NS | NS | NS | NS | NS | NS | Microsoft showcase school “Avgoulea-Linardatou” | 9 |
| [57] | SVM-boosting | 90.6 | NS | NS | NS | NS | 97 | NS | North Carolina | 5 |
| [61] | [DT, ANN, SVM] Stacking ensemble | NS | NS | NS | 77.7 | 74.52 | NS | 76.1 | Self-data | 10 |
| [63] | Ensemble learning [random forest (RF) and adaptive boosting (AdaBoost)] | 98 | NS | NS | NS | 91 | 69 | 78 | Self-data | 7 |
| [66] | RF, KNN, and adaptive boosting | 70 | NS | NS | NS | 70 | 70 | 79 | University of León | 9 |
| [74] | Ensemble [RF, boosting] | 98.22 | NS | NS | NS | NS | NS | NS | Self-data | 10 |
| [76] | Hybrid linear vector quantization (LVQ + AdaBoost) | 92.6 | NS | NS | NS | 95.6 | 91 | 92.3 | NS | 8 |
| [78] | Ensemble (DT + K means clustering) | 75.47 | NS | NS | NS | 72.2 | 47.27 | 57.1 | NS | 8 |
| [80] | Ensemble learning (SVM, RF, AdaBoost + logistic regression via stacking) | NS | NS | NS | 91.9 | 86 | 85.5 | 85 | Hankou University | 10 |
Note: NS—not specified.
Table A3.
Estimation metrics (neural-network-based models).
| Ref. | Models Used | Accuracy | Sensitivity | Specificity | AUC | Recall | Precision | F1 | Dataset Used | Quality Score |
|---|---|---|---|---|---|---|---|---|---|---|
| [16] | NB, MLP, SMO, C4.5, JRip, kNN | 85.43 | NS | 82.61 | NS | 97.48 | NS | 84.3 | Self-data | 10 |
| [17] | MLP-BP(ANN) | 100 | NS | NS | 100 | 100 | 100 | 100 | Self-data | 10 |
| [22] | CNN | 99.4 | NS | NS | 88.7 | 77.26 | 97 | 86 | US K12 schools | 8 |
| [26] | Improved deep belief network | 83.14 | NS | NS | NS | NS | ADS, GT4M | 10 | ||
| [35] | NN | 51.9 | NS | NS | 63.5 | 51.9 | 48.6 | 49.4 | Self-data | 10 |
| [37] | NN | 96 | NS | NS | NS | 92 | 96 | 89.2 | NS | 6 |
| [39] | MLP(ANN) | 94.8 | NS | NS | NS | 94.8 | 94.2 | NS | STIKOM Poltek Cirebon | 10 |
| [45] | ANN | 88.48 | NS | NS | NS | 69 | 93 | NS | OULA | 9 |
| [56] | BPNN | 84.8 | 94.8 | 54.6 | NS | NS | 86.3 | NS | Self-data | 6 |
| [65] | MLR, MLP, RBF, SVM | 89.9 | NS | NS | NS | NS | NS | NS | NS | 9 |
| [67] | NN | 96 | NS | NS | NS | NS | NS | NS | University of Tartu in Estonia | 10 |
| [69] | NN—Levenberg–Marquardt learning algorithm | 83.7 | 77.37 | 85.16 | NS | NS | NS | NS | Self-data | 10 |
| [72] | RBF | 76.92 | 100 | 60 | NS | NS | NS | NS | NS | 8 |
| [77] | kNN | 86 | 89 | 84 | NS | NS | NS | 81 | Self-data | 9 |
Note: NS—not specified.
Table A4.
Estimation metrics (others-based models).
| Ref. | Models Used | Accuracy | Sensitivity | Specificity | AUC | Recall | Precision | F1 | Dataset Used | Quality Score |
|---|---|---|---|---|---|---|---|---|---|---|
| [3] | Adversarial network based deep support vector machine | 0.954 | 0.971 | 0.968 | NS | NS | NS | NS | Self-data | 8 |
| [10] | Multiple linear regression model | NS | NS | NS | NS | NS | NS | NS | Covenant University in Nigeria | 6 |
| [19] | LSTM | NS | NS | NS | 68.2 | NS | NS | NS | Canadian University | 10 |
| [20] | SVM | 70.21 | NS | NS | NS | NS | NS | NS | George Mason University | 10 |
| [25] | Decision tree, random Forest, support vector machine, logistic regression, AdaBoost, stochastic gradient descent | 96.65 | 93.75 | 93.75 | NS | NS | 99.6 | NS | UCI | 10 |
| [30] | Multiple regression algorithm | NS | NS | NS | NS | NS | NS | NS | Self-collected | 10 |
| [36] | Logistic regression | 89.15 | NS | NS | NS | NS | NS | NS | Covenant University | 9 |
| [40] | SVM | 76.67 | NS | NS | NS | NS | NS | NS | 5 | |
| [41] | Non-linear SVM | NS | NS | NS | 75 | 89 | 88 | 89 | OULAD | 7 |
| [51] | LR | 94.9 | NS | NS | NS | NS | NS | NS | Imam Abdulrahman bin Faisal University | 10 |
| [53] | Vector-based SVM | 93.8 | 94 | 93.6 | NS | NS | NS | NS | OULA | 7 |
| [75] | Transfer learning (deep learning) | NS | NS | NS | NS | NS | NS | NS | NS | 8 |
Note: NS—not specified.
References
- Rebai, S.; Ben Yahia, F.; Essid, H. A graphically based machine learning approach to predict secondary schools performance in Tunisia. Socio-Econ. Plan. Sci. 2019, 70, 100724. [Google Scholar] [CrossRef]
- Tatiana, A.C.; Cudney, E.A. Predicting Student Retention Using Support Vector Machines. Procedia Manuf. 2019, 39, 1827–1833. [Google Scholar] [CrossRef]
- Chui, K.T.; Liu, R.W.; Zhao, M.; De Pablos, P.O. Predicting Students’ Performance with School and Family Tutoring Using Generative Adversarial Network-Based Deep Support Vector Machine. IEEE Access 2020, 8, 86745–86752. [Google Scholar] [CrossRef]
- Fernandez-Garcia, A.J.; Rodriguez-Echeverria, R.; Preciado, J.C.; Manzano, J.M.C.; Sanchez-Figueroa, F. Creating a Recommender System to Support Higher Education Students in the Subject Enrollment Decision. IEEE Access 2020, 8, 189069–189088. [Google Scholar] [CrossRef]
- Xu, J.; Moon, K.H.; van der Schaar, M. A Machine Learning Approach for Tracking and Predicting Student Performance in Degree Programs. IEEE J. Sel. Top. Signal Process. 2017, 11, 742–753. [Google Scholar] [CrossRef]
- Song, X.; Li, J.; Sun, S.; Yin, H.; Dawson, P.; Doss, R.R.M. SEPN: A Sequential Engagement Based Academic Performance Prediction Model. IEEE Intell. Syst. 2020, 36, 46–53. [Google Scholar] [CrossRef]
- Imran, M.; Latif, S.; Mehmood, D.; Shah, M.S. Student Academic Performance Prediction using Supervised Learning Techniques. Int. J. Emerg. Technol. Learn. (iJET) 2019, 14, 92–104. [Google Scholar] [CrossRef] [Green Version]
- Rivera, J.E.H. A Hybrid Recommender System to Enrollment for Elective Subjects in Engineering Students using Classification Algorithms. Int. J. Adv. Comput. Sci. Appl. 2020, 11, 400–406. [Google Scholar] [CrossRef]
- Cen, L.; Ruta, D.; Powell, L.; Hirsch, B.; Ng, J. Quantitative approach to collaborative learning: Performance prediction, individual assessment, and group composition. Int. J. Comput. -Supported Collab. Learn. 2016, 11, 187–225. [Google Scholar] [CrossRef]
- Adekitan, A.I.; Shobayo, O. Gender-based comparison of students’ academic performance using regression models. Eng. Appl. Sci. Res. 2020, 47, 241–248. [Google Scholar]
- Enaro, A.O.; Chakraborty, S. Feature Selection Algorithms for Predicting Students Academic Performance Using Data Mining Techniques. Int. J. Sci. Technol. Res. 2020, 9, 3622–3626. [Google Scholar]
- Huang, A.Y.Q.; Lu, O.H.T.; Huang, J.C.H.; Yin, C.J.; Yang, S.J.H. Predicting Students’ Academic Performance by Using Educational Big Data and Learning Analytics: Evaluation of Classification Methods and Learning Logs. Interact. Learn. Environ. 2020, 28, 206–230. [Google Scholar] [CrossRef]
- Xu, X.; Wang, J.; Peng, H.; Wu, R. Prediction of academic performance associated with internet usage behaviors using machine learning algorithms. Comput. Hum. Behav. 2019, 98, 166–173. [Google Scholar] [CrossRef]
- Livieris, I.E.; Drakopoulou, K.; Tampakas, V.T.; Mikropoulos, T.A.; Pintelas, P. Predicting Secondary School Students’ Performance Utilizing a Semi-supervised Learning Approach. J. Educ. Comput. Res. 2018, 57, 448–470. [Google Scholar] [CrossRef]
- Shanthini, A.; Vinodhini, G.; Chandrasekaran, R.M. Predicting Students’ Academic Performance in the University Using Meta Decision Tree Classifiers. J. Comput. Sci 2018, 14, 654–662. [Google Scholar] [CrossRef] [Green Version]
- Vialardi, C.; Chue, J.; Peche, J.; Alvarado, G.; Vinatea, B.; Estrella, J.; Ortigosa, Á. A data mining approach to guide students through the enrollment process based on academic performance. User Model User-Adap. Inter. 2011, 21, 217–248. [Google Scholar] [CrossRef] [Green Version]
- Musso, M.F.; Hernández, C.F.R.; Cascallar, E.C. Predicting key educational outcomes in academic trajectories: A machine-learning approach. High. Educ. 2020, 80, 875–894. [Google Scholar] [CrossRef] [Green Version]
- Lagman, A.C.; Alfonso, L.P.; Goh, M.L.I.; Lalata, J.-A.P.; Magcuyao, J.P.H.; Vicente, H.N. Classification Algorithm Accuracy Improvement for Student Graduation Prediction Using Ensemble Model. Int. J. Inf. Educ. Technol. 2020, 10, 723–727. [Google Scholar] [CrossRef]
- Chen, F.; Cui, Y. Utilizing Student Time Series Behaviour in Learning Management Systems for Early Prediction of Course Performance. J. Learn. Anal. 2020, 7, 1–17. [Google Scholar] [CrossRef]
- Damuluri, S.; Islam, K.; Ahmadi, P.; Qureshi, N.S. Analyzing Navigational Data and Predicting Student Grades Using Support Vector Machine. Emerg. Sci. J. 2020, 4, 243–252. [Google Scholar] [CrossRef]
- Kabakus, A.T.; Senturk, A. An analysis of the professional preferences and choices of computer engineering students. Comput. Appl. Eng. Educ. 2020, 28, 994–1006. [Google Scholar] [CrossRef]
- Yang, Z.; Yang, J.; Rice, K.; Hung, J.-L.; Du, X. Using Convolutional Neural Network to Recognize Learning Images for Early Warning of At-Risk Students. IEEE Trans. Learn. Technol. 2020, 13, 617–630. [Google Scholar] [CrossRef]
- Cruz-Jesus, F.; Castelli, M.; Oliveira, T.; Mendes, R.; Nunes, C.; Sa-Velho, M.; Rosa-Louro, A. Using artificial intelligence methods to assess academic achievement in public high schools of a European Union country. Heliyon 2020, 6, e04081. [Google Scholar] [CrossRef] [PubMed]
- Figueroa-Canas, J.; Sancho-Vinuesa, T. Early Prediction of Dropout and Final Exam Performance in an Online Statistics Course. IEEE Rev. Iberoam. De Tecnol. Del Aprendiz. 2020, 15, 86–94. [Google Scholar] [CrossRef]
- Razaque, A.; Alajlan, A. Supervised Machine Learning Model-Based Approach for Performance Prediction of Students. J. Comput. Sci. 2020, 16, 1150–1162. [Google Scholar] [CrossRef]
- Sokkhey, P.; Okazaki, T. Study on Dominant Factor for Academic Performance Prediction using Feature Selection Methods. Int. J. Adv. Comput. Sci. Appl. 2020, 11. [Google Scholar] [CrossRef]
- Almasri, A.; Alkhawaldeh, R.S.; Çelebi, E. Clustering-Based EMT Model for Predicting Student Performance. Arab. J. Sci. Eng. 2020, 45, 10067–10078. [Google Scholar] [CrossRef]
- Sethi, K.; Jaiswal, V.; Ansari, M. Machine Learning Based Support System for Students to Select Stream (Subject). Recent Adv. Comput. Sci. Commun. 2020, 13, 336–344. [Google Scholar] [CrossRef]
- Gil, J.S.; Delima, A.J.P.; Vilchez, R.N. Predicting Students’ Dropout Indicators in Public School using Data Mining Approaches. Int. J. Adv. Trends Comput. Sci. Eng. 2020, 9, 774–778. [Google Scholar] [CrossRef]
- Qazdar, A.; Er-Raha, B.; Cherkaoui, C.; Mammass, D. A machine learning algorithm framework for predicting students performance: A case study of baccalaureate students in Morocco. Educ. Inf. Technol. 2019, 24, 3577–3589. [Google Scholar] [CrossRef]
- Gamao, A.O.; Gerardo, B.D.; Medina, R.P. Prediction-Based Model for Student Dropouts using Modified Mutated Firefly Algorithm. Int. J. Adv. Trends Comput. Sci. Eng. 2019, 8, 3461–3469. [Google Scholar] [CrossRef]
- Susheelamma, H.K.; Ravikumar, K.M. Student risk identification learning model using machine learning approach. Int. J. Electr. Comput. Eng. 2019, 9, 3872–3879. [Google Scholar] [CrossRef]
- Kostopoulos, G.; Kotsiantis, S.; Fazakis, N.; Koutsonikos, G.; Pierrakeas, C. A Semi-Supervised Regression Algorithm for Grade Prediction of Students in Distance Learning Courses. Int. J. Artif. Intell. Tools 2019, 28. [Google Scholar] [CrossRef]
- Buenaño-Fernández, D.; Gil, D.; Luján-Mora, S. Application of Machine Learning in Predicting Performance for Computer Engineering Students: A Case Study. Sustainability 2019, 11, 2833. [Google Scholar] [CrossRef] [Green Version]
- Adekitan, A.I.; Noma-Osaghae, E. Data mining approach to predicting the performance of first year student in a university using the admission requirements. Educ. Inf. Technol. 2019, 24, 1527–1543. [Google Scholar] [CrossRef]
- Adekitan, A.I.; Salau, O. The impact of engineering students’ performance in the first three years on their graduation result using educational data mining. Heliyon 2019, 5, e01250. [Google Scholar] [CrossRef] [Green Version]
- Maitra, S.; Eshrak, S.; Bari, M.A.; Al-Sakin, A.; Munia, R.H.; Akter, N.; Haque, Z. Prediction of Academic Performance Applying NNs: A Focus on Statistical Feature-Shedding and Lifestyle. Int. J. Adv. Comput. Sci. Appl. 2019, 10, 561–570. [Google Scholar] [CrossRef]
- Almasri, A.; Celebi, E.; Alkhawaldeh, R. EMT: Ensemble Meta-Based Tree Model for Predicting Student Performance. Sci. Program. 2019, 2019, 3610248. [Google Scholar] [CrossRef] [Green Version]
- Nurhayati, O.D.; Bachri, O.S.; Supriyanto, A.; Hasbullah, M. Graduation Prediction System Using Artificial Neural Network. Int. J. Mech. Eng. Technol. 2018, 9, 1051–1057. [Google Scholar]
- Aluko, R.O.; Daniel, E.I.; Oshodi, O.S.; Aigbavboa, C.O.; Abisuga, A.O. Towards reliable prediction of academic performance of architecture students using data mining techniques. J. Eng. Des. Technol. 2018, 16, 385–397. [Google Scholar] [CrossRef] [Green Version]
- Nadar, N.; Kamatchi, R. A Novel Student Risk Identification Model using Machine Learning Approach. Int. J. Adv. Comput. Sci. Appl. 2018, 9, 305–309. [Google Scholar] [CrossRef]
- Kostopoulos, G.; Kotsiantis, S.; Pierrakeas, C.; Koutsonikos, G.; Gravvanis, G.A. Forecasting students’ success in an open university. Int. J. Learn. Technol. 2018, 13, 26–43. [Google Scholar] [CrossRef]
- Navamani, J.M.A.; Kannammal, A. Predicting performance of schools by applying data mining techniques on public examination results. Res. J. Appl. Sci. Eng. Technol. 2015, 9, 262–271. [Google Scholar] [CrossRef]
- Wakelam, E.; Jefferies, A.; Davey, N.; Sun, Y. The potential for student performance prediction in small cohorts with minimal available attributes. Br. J. Educ. Technol. 2019, 51, 347–370. [Google Scholar] [CrossRef] [Green Version]
- Waheed, H.; Hassan, S.U.; Aljohani, N.R.; Hardman, J.; Alelyani, S.; Nawaz, R. Predicting academic performance of students from VLE big data using deep learning models. Comput. Hum. Behav. 2020, 104, 106189. [Google Scholar] [CrossRef] [Green Version]
- Mourdi, Y.; Sadgal, M.; El Kabtane, H.; Fathi, W.B.; El Kabtane, H.; Youssef, M.; Mohamed, S.; Wafaa, B.F. A machine learning-based methodology to predict learners’ dropout, success or failure in MOOCs. Int. J. Web Inf. Syst. 2019, 15, 489–509. [Google Scholar] [CrossRef]
- Livieris, I.E.; Kotsilieris, T.; Tampakas, V.; Pintelas, P. Improving the evaluation process of students’ performance utilizing a decision support software. Neural Comput. Appl. 2018, 31, 1683–1694. [Google Scholar] [CrossRef]
- Son, L.H.; Fujita, H. Neural-fuzzy with representative sets for prediction of student performance. Appl. Intell. 2019, 49, 172–187. [Google Scholar] [CrossRef]
- Coussement, K.; Phan, M.; De Caigny, A.; Benoit, D.F.; Raes, A. Predicting student dropout in subscription-based online learning environments: The beneficial impact of the logit leaf model. Decis. Support Syst. 2020, 135, 113325. [Google Scholar] [CrossRef]
- Injadat, M.; Moubayed, A.; Nassif, A.B.; Shami, A. Systematic ensemble model selection approach for educational data mining. Knowl.-Based Syst. 2020, 200, 105992. [Google Scholar] [CrossRef]
- Tatar, A.E.; Düştegör, D. Prediction of Academic Performance at Undergraduate Graduation: Course Grades or Grade Point Average? Appl. Sci. 2020, 10, 4967. [Google Scholar] [CrossRef]
- Karthikeyan, V.G.; Thangaraj, P.; Karthik, S. Towards developing hybrid educational data mining model (HEDM) for efficient and accurate student performance evaluation. Soft Comput. 2020, 24, 18477–18487. [Google Scholar] [CrossRef]
- Chui, K.T.; Fung, D.C.L.; Lytras, M.D.; Lam, T.M. Predicting at-risk university students in a virtual learning environment via a machine learning algorithm. Comput. Hum. Behav. 2020, 107, 105584. [Google Scholar] [CrossRef]
- Yousafzai, B.K.; Hayat, M.; Afzal, S. Application of machine learning and data mining in predicting the performance of intermediate and secondary education level student. Educ. Inf. Technol. 2020, 25, 4677–4697. [Google Scholar] [CrossRef]
- Adekitan, A.I.; Salau, O. Toward an improved learning process: The relevance of ethnicity to data mining prediction of students’ performance. SN Appl. Sci. 2020, 2, 8. [Google Scholar] [CrossRef] [Green Version]
- Lau, E.T.; Sun, L.; Yang, Q. Modelling, prediction and classification of student academic performance using artificial neural networks. SN Appl. Sci. 2019, 1, 982. [Google Scholar] [CrossRef] [Green Version]
- Sorensen, L.C. “Big Data” in Educational Administration: An Application for Predicting School Dropout Risk. Educ. Adm. Q. 2019, 55, 404–446. [Google Scholar] [CrossRef]
- Alsuwaiket, M.; Blasi, A.H.; Al-Msie’deen, R.F. Formulating module assessment for improved academic performance predictability in higher education. arXiv 2020, arXiv:2008.13255. [Google Scholar]
- Suguna, R.; Shyamala Devi, M.; Bagate, R.A.; Joshi, A.S. Assessment of feature selection for student academic performance through machine learning classification. J. Stat. Manag. Syst. 2019, 22, 729–739. [Google Scholar] [CrossRef]
- Nuankaew, P. Dropout Situation of Business Computer Students, University of Phayao. Int. J. Emerg. Technol. Learn. 2019, 14, 115–131. [Google Scholar] [CrossRef] [Green Version]
- Adejo, O.W.; Connolly, T. Predicting student academic performance using multi-model heterogeneous ensemble approach. J. Appl. Res. High. Educ. 2018, 10, 61–75. [Google Scholar] [CrossRef]
- Hoffait, A.-S.; Schyns, M. Early detection of university students with potential difficulties. Decis. Support Syst. 2017, 101, 1–11. [Google Scholar] [CrossRef]
- Rovira, S.; Puertas, E.; Igual, L. Data-driven system to predict academic grades and dropout. PLoS ONE 2017, 12, 0171207. [Google Scholar] [CrossRef] [PubMed] [Green Version]
- Tan, M.; Shao, P. Prediction of student dropout in e-Learning program through the use of machine learning method. Int. J. Emerg. Technol. Learn. 2015, 10, 11. [Google Scholar] [CrossRef]
- Huang, S.; Fang, N. Predicting student academic performance in an engineering dynamics course: A comparison of four types of predictive mathematical models. Comput. Educ. 2013, 61, 133–145. [Google Scholar] [CrossRef]
- Guerrero-Higueras, Á.M.; Fernández Llamas, C.; Sánchez González, L.; Gutierrez Fernández, A.; Esteban Costales, G.; González, M.Á.C. Academic Success Assessment through Version Control Systems. Appl. Sci. 2020, 10, 1492. [Google Scholar] [CrossRef] [Green Version]
- Hooshyar, D.; Pedaste, M.; Yang, Y. Mining Educational Data to Predict Students’ Performance through Procrastination Behavior. Entropy 2020, 22, 12. [Google Scholar] [CrossRef] [Green Version]
- Ezz, M.; Elshenawy, A. Adaptive recommendation system using machine learning algorithms for predicting student’s best academic program. Educ. Inf. Technol. 2019, 25, 2733–2746. [Google Scholar] [CrossRef]
- Al-Sudani, S.; Palaniappan, R. Predicting students’ final degree classification using an extended profile. Educ. Inf. Technol. 2019, 24, 2357–2369. [Google Scholar] [CrossRef] [Green Version]
- Gray, C.C.; Perkins, D. Utilizing early engagement and machine learning to predict student outcomes. Comput. Educ. 2019, 131, 22–32. [Google Scholar] [CrossRef]
- Garcia, J.D.; Skrita, A. Predicting Academic Performance Based on Students’ Family Environment: Evidence for Colombia Using Classification Trees. Psychol. Soc. Educ. 2019, 11, 299–311. [Google Scholar] [CrossRef] [Green Version]
- Babić, I.Đ. Machine learning methods in predicting the student academic motivation. Croat. Oper. Res. Rev. 2017, 8, 443–461. [Google Scholar] [CrossRef]
- Kotsiantis, S.B. Use of machine learning techniques for educational proposes: A decision support system for forecasting students’ grades. Artif. Intell. Rev. 2012, 37, 331–344. [Google Scholar] [CrossRef]
- Sokkhey, P.; Okazaki, T. Hybrid Machine Learning Algorithms for Predicting Academic Performance. Int. J. Adv. Comput. Sci. Appl. 2020, 11, 32–41. [Google Scholar] [CrossRef] [Green Version]
- Hussain, S.; Gaftandzhieva, S.; Maniruzzaman, M.; Doneva, R.; Muhsin, Z.F. Regression analysis of student academic performance using deep learning. Educ. Inf. Technol. 2020, 26, 783–798. [Google Scholar] [CrossRef]
- Bhagavan, K.S.; Thangakumar, J.; Subramanian, D.V. Predictive analysis of student academic performance and employability chances using HLVQ algorithm. J. Ambient. Intell. Humaniz. Comput. 2020, 12, 3789–3797. [Google Scholar] [CrossRef]
- Akçapınar, G.; Altun, A.; Aşkar, P. Using learning analytics to develop early-warning system for at-risk students. Int. J. Educ. Technol. High. Educ. 2019, 16, 40. [Google Scholar] [CrossRef]
- Francis, B.K.; Babu, S.S. Predicting Academic Performance of Students Using a Hybrid Data Mining Approach. J. Med. Syst. 2019, 43, 162. [Google Scholar] [CrossRef]
- Asif, R.; Hina, S.; Haque, S.I. Predicting student academic performance using data mining methods. Int. J. Comput. Sci. Netw. Secur. 2017, 17, 187–191. [Google Scholar]
- Yan, L.; Liu, Y. An Ensemble Prediction Model for Potential Student Recommendation Using Machine Learning. Symmetry 2020, 12, 728. [Google Scholar] [CrossRef]
- Nicolas, P.R. Leverage Scala and Machine Learning to Construct and Study Systems that Can Learn from Data; Packt Publishing Ltd.: Birmingham, UK, 2015. [Google Scholar]
Figure 1.
Implemented systematic literature review protocol.

Figure 2.
Phase 1: collection and analysis.

Figure 3.
Quality assessment questions and related research questions.

Figure 4.
Graphical illustration of ML methods used.

Figure 5.
(a) Taxonomy of the algorithms used. (b) Taxonomy of other machine learning models used.


Figure 6.
Supervised learning models.

Figure 7.
Distribution of ML models used.

Figure 8.
Box and whisker plots—performance metrics.

Figure 9.
Accuracy against feature category.

Figure 10.
Feature importance in articles.

Table 1.
A Summary of the collected articles.
| SQ | SQ1 | SQ2 | SQ3 | Database-Wise Count |
|---|---|---|---|---|
| Google Scholar | 70 | 465 | 13 | 548 |
| WoS | 171 | 24 | 0 | 195 |
| Scopus | 3 | 170 | 1 | 369 |
| ScienceDirect | 8 | 41 | 1 | 50 |
| SpringerLink | 1043 | 0 | 100 | 1143 |
| IEEE Explore | 0 | 24 | 0 | 24 |
| Query-Wise Count | 1295 | 724 | 115 | 2329 |
Table 2.
Summary of selected studies.
| Ref. | RQ1 | RQ2 | RQ3 | RQ4 | RQ5 | Ref. | RQ1 | RQ2 | RQ3 | RQ4 | RQ5 | Ref. | RQ1 | RQ2 | RQ3 | RQ4 | RQ5 | Ref. | RQ1 | RQ2 | RQ3 | RQ4 | RQ5 |
|---|---|---|---|---|---|---|---|---|---|---|---|---|---|---|---|---|---|---|---|---|---|---|---|
| [1] | * | - | * | - | - | [2] | * | - | - | - | - | [3] | * | * | * | - | * | [4] | * | - | - | - | - |
| [5] | * | * | * | - | - | [6] | * | * | * | * | * | [7] | * | - | - | - | - | [8] | * | * | * | * | * |
| [9] | * | * | * | - | - | [10] | * | * | * | * | * | [11] | * | * | * | - | - | [12] | * | * | * | * | * |
| [13] | * | * | * | * | * | [14] | * | * | * | - | * | [15] | * | - | - | - | - | [16] | * | * | * | * | * |
| [17] | * | * | - | * | * | [18] | * | * | * | * | * | [19] | * | * | * | * | * | [20] | * | - | - | - | - |
| [21] | * | * | * | - | * | [22] | * | - | - | - | * | [23] | * | * | * | * | * | [24] | * | * | * | * | * |
| [25] | * | * | * | * | * | [26] | * | * | * | * | - | [27] | * | - | - | - | * | [28] | * | * | * | * | - |
| [29] | * | - | - | - | - | [30] | * | - | - | - | * | [31] | * | * | * | * | * | [32] | * | * | * | * | * |
| [33] | * | * | * | - | * | [34] | * | * | - | - | * | [35] | * | * | * | * | * | [36] | * | * | * | * | * |
| [37] | * | * | * | * | * | [38] | * | * | - | - | * | [39] | * | * | * | * | * | [40] | * | * | * | * | - |
| [41] | * | * | - | - | - | [42] | * | * | * | - | * | [43] | * | * | - | * | * | [44] | * | * | * | - | * |
| [45] | * | * | * | * | * | [46] | * | * | * | * | * | [47] | * | * | * | * | * | [48] | * | * | * | * | * |
| [49] | * | * | * | - | - | [50] | * | * | * | - | - | [51] | * | - | - | - | - | [52] | * | * | * | * | * |
| [53] | * | - | - | - | - | [54] | * | * | * | - | * | [55] | * | * | * | * | * | [56] | * | * | * | - | * |
| [57] | * | * | * | - | - | [58] | * | * | * | - | - | [59] | * | * | * | * | * | [60] | * | * | * | - | * |
| [61] | * | * | * | * | * | [62] | * | * | * | * | * | [63] | * | * | * | - | * | [64] | * | * | * | * | * |
| [65] | * | * | - | * | * | [66] | * | * | * | * | * | [67] | * | * | * | * | * | [68] | * | * | * | - | - |
| [69] | * | * | * | * | * | [70] | * | - | - | - | - | [71] | * | - | * | - | - | [72] | * | * | - | * | * |
| [73] | * | - | * | - | - | [74] | * | * | * | * | * | [75] | * | * | - | * | * | [76] | * | * | - | * | * |
| [77] | * | * | * | * | * | [78] | * | * | - | * | * | [79] | * | * | * | * | * | [80] | * | * | * | * | * |
Note: * represents that the research article responds to one or both of the QAQ in each RQ, others do not.
Table 3.
Distribution of the selected studies.
| Indexing Source | # of Articles | % |
|---|---|---|
| Scopus | 47 | 56.6 |
| WoS | 32 | 38.5 |
| IEEE Explore | 3 | 3.6 |
| Google Scholar | 1 | 1.2 |
Table 4.
Quality scores of selected studies.
| Ref. | QAQ01 | QAQ02 | QAQ03 | QAQ04 | QAQ05 | QAQ06 | QAQ07 | QAQ08 | QAQ09 | QAQ10 | SCORE | Ref. | QAQ01 | QAQ02 | QAQ03 | QAQ04 | QAQ05 | QAQ06 | QAQ07 | QAQ08 | QAQ09 | QAQ10 | SCORE |
|---|---|---|---|---|---|---|---|---|---|---|---|---|---|---|---|---|---|---|---|---|---|---|---|
| [1] | 1 | 1 | 0 | 0 | 1 | 1 | 0 | 0 | 0 | 0 | 4 | [2] | 1 | 1 | 0 | 0 | 0 | 0 | 0 | 0 | 0 | 0 | 2 |
| [3] | 1 | 1 | 1 | 1 | 1 | 1 | 0 | 0 | 1 | 1 | 8 | [4] | 1 | 1 | 0 | 0 | 0 | 0 | 0 | 0 | 0 | 0 | 2 |
| [5] | 1 | 1 | 1 | 1 | 1 | 1 | 0 | 0 | 0 | 0 | 6 | [6] | 1 | 1 | 1 | 1 | 1 | 1 | 1 | 1 | 1 | 1 | 10 |
| [7] | 1 | 1 | 1 | 1 | 1 | 1 | 0 | 0 | 1 | 1 | 8 | [8] | 1 | 1 | 1 | 1 | 1 | 1 | 0 | 0 | 0 | 0 | 6 |
| [9] | 1 | 1 | 1 | 1 | 1 | 1 | 1 | 0 | 1 | 1 | 9 | [10] | 1 | 1 | 1 | 1 | 1 | 1 | 1 | 1 | 1 | 1 | 10 |
| [11] | 1 | 1 | 1 | 1 | 0 | 0 | 0 | 0 | 1 | 1 | 6 | [12] | 1 | 1 | 1 | 1 | 0 | 1 | 1 | 1 | 1 | 1 | 9 |
| [13] | 1 | 1 | 1 | 1 | 0 | 1 | 0 | 0 | 0 | 0 | 5 | [14] | 1 | 1 | 1 | 1 | 0 | 1 | 1 | 1 | 1 | 1 | 9 |
| [15] | 1 | 1 | 1 | 1 | 0 | 0 | 1 | 1 | 1 | 1 | 8 | [16] | 1 | 1 | 1 | 1 | 0 | 0 | 1 | 1 | 1 | 1 | 8 |
| [17] | 1 | 1 | 1 | 1 | 1 | 1 | 1 | 1 | 1 | 1 | 10 | [18] | 1 | 1 | 0 | 0 | 0 | 0 | 0 | 0 | 0 | 0 | 2 |
| [19] | 1 | 1 | 1 | 1 | 1 | 1 | 1 | 1 | 1 | 1 | 10 | [20] | 1 | 1 | 1 | 1 | 0 | 1 | 1 | 1 | 1 | 1 | 9 |
| [21] | 1 | 1 | 1 | 1 | 1 | 1 | 0 | 0 | 0 | 0 | 6 | [22] | 1 | 1 | 1 | 1 | 1 | 1 | 1 | 1 | 1 | 1 | 10 |
| [23] | 1 | 1 | 1 | 1 | 1 | 1 | 1 | 1 | 1 | 1 | 10 | [24] | 1 | 1 | 1 | 1 | 1 | 1 | 0 | 0 | 1 | 1 | 8 |
| [25] | 1 | 1 | 0 | 0 | 0 | 0 | 0 | 0 | 0 | 0 | 2 | [26] | 1 | 1 | 1 | 1 | 1 | 1 | 1 | 1 | 1 | 1 | 10 |
| [27] | 1 | 1 | 1 | 1 | 1 | 0 | 1 | 1 | 1 | 1 | 9 | [28] | 1 | 1 | 1 | 1 | 1 | 1 | 1 | 1 | 1 | 1 | 10 |
| [29] | 1 | 1 | 1 | 1 | 1 | 1 | 1 | 1 | 1 | 1 | 10 | [30] | 1 | 1 | 0 | 0 | 0 | 0 | 0 | 0 | 0 | 0 | 2 |
| [31] | 1 | 1 | 1 | 1 | 1 | 1 | 0 | 0 | 1 | 1 | 8 | [32] | 1 | 1 | 0 | 0 | 0 | 0 | 0 | 0 | 0 | 0 | 2 |
| [33] | 1 | 1 | 1 | 1 | 0 | 1 | 1 | 1 | 1 | 1 | 9 | [34] | 1 | 1 | 1 | 1 | 1 | 1 | 1 | 1 | 1 | 1 | 10 |
| [35] | 1 | 1 | 1 | 1 | 0 | 1 | 1 | 0 | 1 | 1 | 8 | [36] | 1 | 1 | 0 | 0 | 0 | 0 | 0 | 0 | 0 | 0 | 2 |
| [37] | 1 | 1 | 1 | 1 | 0 | 1 | 1 | 1 | 1 | 1 | 9 | [38] | 1 | 1 | 1 | 1 | 0 | 1 | 1 | 0 | 1 | 1 | 8 |
| [39] | 1 | 1 | 1 | 1 | 1 | 1 | 0 | 0 | 1 | 1 | 8 | [40] | 1 | 1 | 1 | 1 | 1 | 1 | 1 | 0 | 1 | 1 | 9 |
| [41] | 1 | 1 | 1 | 1 | 1 | 1 | 1 | 1 | 1 | 1 | 10 | [42] | 1 | 1 | 1 | 1 | 0 | 1 | 1 | 1 | 1 | 1 | 9 |
| [43] | 1 | 1 | 1 | 1 | 0 | 0 | 0 | 0 | 1 | 1 | 6 | [44] | 1 | 1 | 1 | 1 | 1 | 1 | 1 | 1 | 1 | 1 | 10 |
| [45] | 1 | 1 | 1 | 1 | 1 | 1 | 1 | 1 | 1 | 1 | 10 | [46] | 1 | 1 | 1 | 1 | 1 | 0 | 0 | 0 | 0 | 0 | 5 |
| [47] | 1 | 1 | 1 | 1 | 0 | 1 | 0 | 0 | 1 | 1 | 7 | [48] | 1 | 1 | 1 | 1 | 0 | 0 | 1 | 1 | 1 | 1 | 8 |
| [49] | 1 | 1 | 1 | 1 | 0 | 1 | 0 | 0 | 1 | 1 | 7 | [50] | 1 | 1 | 1 | 1 | 0 | 1 | 1 | 0 | 1 | 1 | 8 |
| [51] | 1 | 1 | 1 | 1 | 0 | 1 | 1 | 1 | 1 | 1 | 9 | [52] | 1 | 1 | 1 | 1 | 0 | 1 | 1 | 1 | 1 | 1 | 9 |
| [53] | 1 | 1 | 1 | 1 | 0 | 1 | 0 | 0 | 0 | 0 | 5 | [54] | 1 | 1 | 1 | 1 | 1 | 1 | 0 | 0 | 0 | 0 | 6 |
| [55] | 1 | 1 | 0 | 0 | 0 | 0 | 0 | 0 | 0 | 0 | 2 | [56] | 1 | 1 | 1 | 1 | 1 | 1 | 1 | 1 | 1 | 1 | 10 |
| [57] | 1 | 1 | 0 | 0 | 0 | 0 | 0 | 0 | 0 | 0 | 2 | [58] | 1 | 1 | 1 | 1 | 0 | 1 | 0 | 0 | 1 | 1 | 7 |
| [59] | 1 | 1 | 1 | 1 | 0 | 1 | 1 | 0 | 1 | 1 | 8 | [60] | 1 | 1 | 1 | 1 | 0 | 1 | 0 | 0 | 1 | 1 | 7 |
| [61] | 1 | 1 | 1 | 1 | 1 | 1 | 0 | 0 | 0 | 0 | 6 | [62] | 1 | 1 | 1 | 1 | 1 | 1 | 1 | 0 | 1 | 1 | 9 |
| [63] | 1 | 1 | 1 | 1 | 0 | 1 | 0 | 0 | 1 | 1 | 7 | [64] | 1 | 1 | 1 | 1 | 1 | 1 | 1 | 0 | 1 | 1 | 9 |
| [65] | 1 | 1 | 1 | 1 | 1 | 1 | 1 | 1 | 1 | 1 | 10 | [66] | 1 | 1 | 1 | 1 | 1 | 1 | 1 | 0 | 1 | 1 | 9 |
| [67] | 1 | 1 | 1 | 1 | 0 | 1 | 0 | 0 | 1 | 1 | 7 | [68] | 1 | 1 | 1 | 1 | 1 | 1 | 1 | 1 | 1 | 1 | 10 |
| [69] | 1 | 1 | 1 | 1 | 1 | 0 | 1 | 1 | 1 | 1 | 9 | [70] | 1 | 1 | 1 | 1 | 1 | 1 | 1 | 1 | 1 | 1 | 10 |
| [71] | 1 | 1 | 1 | 1 | 0 | 1 | 0 | 0 | 0 | 0 | 5 | [72] | 1 | 1 | 1 | 1 | 1 | 1 | 1 | 1 | 1 | 1 | 10 |
| [73] | 1 | 1 | 0 | 0 | 0 | 0 | 0 | 0 | 0 | 0 | 2 | [74] | 1 | 1 | 0 | 0 | 0 | 1 | 0 | 0 | 0 | 0 | 3 |
| [75] | 1 | 1 | 1 | 1 | 0 | 0 | 1 | 1 | 1 | 1 | 8 | [76] | 1 | 1 | 0 | 0 | 1 | 1 | 0 | 0 | 0 | 0 | 4 |
| [77] | 1 | 1 | 1 | 1 | 1 | 1 | 1 | 1 | 1 | 1 | 10 | [78] | 1 | 1 | 1 | 1 | 0 | 0 | 1 | 1 | 1 | 1 | 8 |
| [79] | 1 | 1 | 1 | 1 | 0 | 1 | 1 | 1 | 1 | 1 | 9 | [80] | 1 | 1 | 1 | 1 | 1 | 1 | 1 | 0 | 1 | 1 | 9 |
Table 5.
Article distribution based on quality score.
| Criteria | # of Articles | % of Articles |
|---|---|---|
| very high (9 ≤ score ≤ 10) | 36 | 45% |
| high (7 ≤ score ≤ 8) | 20 | 25% |
| medium (5 ≤ score ≤ 6) | 11 | 13.75% |
| low (3 ≤ score ≤ 4) | 3 | 3.75% |
| very low (score ≤ 2) | 10 | 12.5% |
Table 6.
Performance metrics—classification algorithms.
| Performance Metrics | Measures | SVM | DT | NN | Ensemble | Performance Metrics | Measures | SVM | DT | NN | Ensemble | Performance Metrics | Measures | SVM | DT | NN | Ensemble |
|---|---|---|---|---|---|---|---|---|---|---|---|---|---|---|---|---|---|
| Accuracy | Count | 4 | 15 | 14 | 16 | F1 | Count | 1 | 8 | 6 | 13 | Precision | Count | 1 | 10 | 7 | 11 |
| Mean | 60 | 80 | 86.9 | 84.7 | Mean | 89 | 82.5 | 81.65 | 72.7 | Mean | 89 | 85.9 | 87.87 | 75.1 | |||
| Min | 93.8 | 79 | 51.9 | 61 | Min | 89 | 71.9 | 49.4 | 53 | Min | 89 | 70.3 | 48.6 | 95 | |||
| Max | 95 | 98.94 | 100 | 98.5 | Max | 89 | 95.6 | 100 | 98.2 | Max | 89 | 98.3 | 100 | 97 | |||
| Std. Dev | 40.86 | 24.46 | 12.16 | 24.08 | Std. Dev | - | 9.2 | 17.08 | 33.9 | Std. Dev | - | 8.77 | 17.8 | 28.8 | |||
| Sensitivity/Recall | Count | 1 | 9 | 7 | 12 | AUC | Count | 1 | 5 | 3 | 3 | Specificity | Count | 2 | - | 5 | 1 |
| Mean | 89 | 88.13 | 83.2 | 71.8 | Mean | 75 | 89.2 | 84 | 89.7 | Mean | 47.28 | - | 73 | 100 | |||
| Min | 89 | 75 | 51.9 | 48 | Min | 75 | 68 | 63.5 | 77.7 | Min | 0.97 | - | 54.6 | 100 | |||
| Max | 89 | 100 | 100 | 96.3 | Max | 75 | 99.4 | 100 | 99.6 | Max | 94 | - | 85.16 | 100 | |||
| Std. Dev | - | 9.47 | 17.8 | 34.5 | Std. Dev | - | 12 | 18.6 | 11.1 | Std. Dev | 65 | - | 14.73 | - |
Table 7.
Performance metrics—regression algorithms.
| Measures | SVM | DT | NN | ENSEMBLE | Measures | SVM | DT | NN | ENSEMBLE | ||
|---|---|---|---|---|---|---|---|---|---|---|---|
| MSE | Count | - | 1.00 | 1.00 | 2.00 | RMSE | Count | - | 2.00 | - | 4.00 |
| Mean | - | 0.05 | 75.90 | 7.60 | Mean | - | 0.35 | - | 6.14 | ||
| Min | - | 0.05 | 0.75 | 0.14 | Min | - | 0.21 | - | 56.00 | ||
| Max | - | 0.05 | 0.75 | 0.15 | Max | - | 0.50 | - | 17.90 | ||
| Std. Dev | - | - | - | 10.59 | Std. Dev | - | 0.21 | - | 0.79 | ||
| MAE | Count | - | - | - | 3.00 | Error | Count | - | 1.00 | 2.00 | 3.00 |
| Mean | - | - | - | 9.60 | Mean | - | 6.96 | 77.50 | 15.17 | ||
| Min | - | - | - | 55.00 | Min | - | 6.96 | 0.30 | 12.50 | ||
| Max | - | - | - | 12.15 | Max | - | 6.96 | 15.20 | 18.30 | ||
| Std. Dev | - | - | - | 0.35 | Std. Dev | - | - | 10.50 | 2.95 |
Table 8.
Evaluation parameters used.
| Performance Metric | References | # |
|---|---|---|
| Accuracy | [3,6,8,11,12,14,15,16,17,18,20,22,24,25,26,27,29,31,34,35,36,37,38,39,40], [42,43,44,45,46,47,51,53,54,56,57,59,60,63,64,65,66,67,69,72,73,74,76,77,78,79] | 51 |
| Sensitivity | [16,25,31,43,53,56,64] | 7 |
| Specificity | [3,16,25,43,53,56,69,72,77] | 9 |
| AUC | [12,17,19,22,29,35,38,41,46,55,58,61,80] | 13 |
| Recall | [6,7,11,12,15,16,17,18,22,24,27,29,32,35,37] [39,41,45,46,55,59,60,61,63,64,66,76,78,80] | 29 |
| Precision | [7,11,12,15,17,18,22,24,25,27,29,32,34,35,37] [39,41,45,46,55,56,57,59,60,63,64,66,76,78,80] | 30 |
| F1 | [6,7,11,12,15,16,17,22,24,27,29,32,35] [37,38,39,43,46,55,59,61,63,64,66,76,78,80] | 27 |
| MSE | [6,26,43,44] | 4 |
| MAE | [30,33,42,63,75] | 5 |
| RMSE | [7,10,30,54,55,61,74] | 7 |
| Error | [18,45,55,56,58,61,80] | 7 |
Table 9.
Summary of the features used.
| Demographic Features | Preliminary education | Behavioral features | Personal | Number of times opened |
| Gender | Self-evaluation | Number of times closed | ||
| Age | Time management | Number of times “Next” used | ||
| Location of stay | Anxiety | Number of times “Previous” used | ||
| Duration of travel | Study aids | Number of times “seek” used | ||
| Parent education | Study time duration | Number of times “jump” used | ||
| Level of income | Isolation | Number of times “search” used | ||
| Status of family | Search of emotional support | Activity and engagement | ||
| Social support group | Self-blame | Number of forum replies | ||
| Year of admission and age | Problem in focusing | Number of clarifications sought | ||
| Number of siblings | Fatalism | Number of hand-raises | ||
| Computer knowledge | Reaction time | Time spent online | ||
| Type of parent employment | Avoiding amusement | Number of assignments submitted | ||
| Type of student self-employment | Verbal communication | Number of tests submitted | ||
| Disability | Interest and motivation | Time spent on assignment | ||
| Mode of study | User navigation | Time spent on quiz | ||
| Tuition fee source | Number of clicks on the discussion forum | Number of days absent | ||
| Commuting | Number of clicks on material of study | Specificity of the days absent | ||
| Academic features | Individual semester grades | On-campus clicks versus off-campus clicks | Number of clicks on report | |
| Final exam grades | Number of clicks during weekdays | Number of clicks on mark issued | ||
| Individual subject grades | Number of clicks during weekends | Dual pane activity | ||
| Grade of previous semesters | Number of clicks on modules | E-books | ||
| Oral exam grades | Number of bookmarks created | Number of times opened | ||
| Written exam grades | Number of bookmarks deleted | Number of times closed | ||
| Number of appearance for exams | Video content | |||
| Entrance test grades | ||||
| Prerequisite course grade | ||||
| Curriculum | ||||
| Academic resource | ||||
Publisher’s Note: MDPI stays neutral with regard to jurisdictional claims in published maps and institutional affiliations. |
© 2021 by the authors. Licensee MDPI, Basel, Switzerland. This article is an open access article distributed under the terms and conditions of the Creative Commons Attribution (CC BY) license (https://creativecommons.org/licenses/by/4.0/).
Share and Cite
MDPI and ACS Style
Balaji, P.; Alelyani, S.; Qahmash, A.; Mohana, M. Contributions of Machine Learning Models towards Student Academic Performance Prediction: A Systematic Review. Appl. Sci. 2021, 11, 10007. https://doi.org/10.3390/app112110007
AMA Style
Balaji P, Alelyani S, Qahmash A, Mohana M. Contributions of Machine Learning Models towards Student Academic Performance Prediction: A Systematic Review. Applied Sciences. 2021; 11(21):10007. https://doi.org/10.3390/app112110007
Chicago/Turabian StyleBalaji, Prasanalakshmi, Salem Alelyani, Ayman Qahmash, and Mohamed Mohana. 2021. "Contributions of Machine Learning Models towards Student Academic Performance Prediction: A Systematic Review" Applied Sciences 11, no. 21: 10007. https://doi.org/10.3390/app112110007
Note that from the first issue of 2016, this journal uses article numbers instead of page numbers. See further details here.