
Optimum Design of Flexural Strength and Stiffness for Reinforced Concrete Beams Using Machine Learning


1
Department of Civil Engineering, Tishk International University, Sulaimani, Qirga, Sulaimaniya 46001, Iraq
2
Chair of Computational Science and Simulation Technology, Leibniz University Hannover, Appelstr. 11, 30167 Hannover, Germany
3
Mathematics Department, College of Science, Sulaimani University, Sulaimaniya 46001, Iraq
4
Department of Civil Engineering, University of Tabriz, Tabriz 5166616471, Iran
*
Author to whom correspondence should be addressed.
Appl. Sci. 2021, 11(18), 8762; https://doi.org/10.3390/app11188762
Submission received: 31 July 2021
/
Revised: 16 September 2021
/
Accepted: 16 September 2021
/
Published: 20 September 2021
(This article belongs to the Special Issue Novel Computing Methods for Machine Learning)
Abstract
:In this paper, an optimization approach was presented for the flexural strength and stiffness design of reinforced concrete beams. Surrogate modeling based on machine learning was applied to predict the responses of the structural system in three-point flexure tests. Three design input variables, the area of steel bars in the compression zone, the area of steel bars in the tension zone, and the area of steel bars in the shear zone, were adopted for the dataset and arranged by the Box-Behnken design method. The dataset was composed of thirteen specimens of reinforced concrete beams. The specimens were tested under three-point flexure loading at the age of 28 days and both the failure load and the maximum deflection values were recorded. Compression and tension tests were conducted to obtain the concrete data for the analysis and numerical modeling. Afterward, finite element modeling was performed for all the specimens using the ATENA program to verify the experimental tests. Subsequently, the surrogate models for the flexural strength and the stiffness were constructed. Finally, optimization was conducted supporting on the factorial method for the predicted responses. The adopted approach proved to be an excellent tool to optimize the design of reinforced concrete beams for flexure and stiffness. In addition, experimental and numerical results were in very good agreement in terms of both the failure type and the cracking pattern.
1. Introduction
The percentage of steel reinforcement controls the behavior and failure process in reinforced concrete members. This failure can be of steel yielding followed by crushing of concrete in the case of under-reinforced beams and crushing of concrete in the case of over-reinforced beams. Hence, minimum ductility requirements should be satisfactorily met while designing reinforced concrete beams. This can be attained by providing an adequate amount of tensile reinforcement. If a beam is provided with less steel than required, the failure becomes brittle. This stimulates instability in the overall response of a beam. Before concrete cracking, the load-deflection response of a plain cement concrete beam and a reinforced concrete beam is of equal order. When the ultimate strength generated with the provided reinforcement is less than the flexural cracking strength, immediate crack growth is created. Therefore, a certain amount of minimum tension reinforcement is necessary for ductile behavior. While the percentage of flexural reinforcement increases, the ultimate strength, and ductility of reinforced concrete beams increase [1]. However, provisions for minimum flexural reinforcement specified by most codes of practice are based on empirical approaches. The criteria for evaluating minimum reinforcement consider that a beam should not fail instantly upon concrete crushing. To meet this condition, the ultimate capacity of a reinforced concrete beam should be greater than, or equal to, its cracking moment. Most codes use flexural strength to evaluate cracking stress in beams [2,3,4,5,6,7,8,9]; however, large-scale specimens have less cracking bending strength than flexural strength. In the traditional design method, cylinder split tensile test, compression test, and modulus of rupture tests are used to define concrete properties, which cannot completely characterize the behavior of concrete [10]. Damage assessment plays an important role in the evaluation of the stability and strength of a structure, which is significant for both existing structures and those under construction [11].
The flexural strength of normal-strength concrete members is commonly designed using rectangular stress block parameters. Current design codes provide rectangular stress block parameters for a simplified design methodology. However, these stress blocks are determined by tests of reinforced concrete columns, which have apparent limitations. A rectangular stress block can be used because the shape of the stress–strain relation of concrete is analogous to the trapezoid. However, the shape of the stress–strain relationship of concrete changes into a triangle as the compressive strength of concrete increases. For this reason, rectangular stress block parameters depend on the compressive strength of concrete [12].
In design practice, when the deflection of a reinforced concrete beam is calculated, according to standards, two states are analyzed: the cracked state and the uncracked state. The flexural stiffness of a reinforced concrete beam changes from an uncracked state to a cracked state. The equation for the effective moment of inertia used to calculate a moment of inertia somewhere between the uncracked moment of inertia and the cracked moment of inertia depends on the applied load. As the load increases, the initial distribution of stiffness of the element changes, and the number of cracks varies non-deterministically. The distribution of strains and stresses in concrete and steel, along the axis of the element, is irregular. The resulting effective moment of inertia can be used in elastic deflection equations to approximate actual deflections. Enhancing the physical properties of the concrete can increase the shear strength and flexural strength of the beam [13].
In a previous study, Nariman et al. [14] experimentally and numerically investigated the flexural strength and stiffness of an invented reinforced concrete beam with a new reinforcement system comprising additional steel bracings and steel plates, arranged to auto-balance the compression and tension forces developed in the member due to an increasing applied load in a three-point flexure test. The newly invented reinforcement system increased the flexural strength and the stiffness of the member to 300% compared with an ordinary reinforced concrete beam. LS-DYNA was used for the numerical simulations. Shishegaran et al. [15] suggested a new method to increase the flexural capacity of reinforced concrete beams in a simply supported form. They adopted laboratory work together with numerical modeling and the results revealed an increase in the load-bearing capacity and the stiffness of the structural elements. A stress block method was proposed by Al-Kamal [16], which was verified using a database that consisted of 52 singly tested reinforced high-strength concrete beams with a concrete strength above 55 MPa. The proposed model was compared with models of various design codes and proposals of researchers found in the literature. Ghasemi and Shishegaran [17] proposed a reinforcement technique in a beam to increase the bending capacity that supports a sealed rubber tube with a diameter twice that of the reinforcement bar covering the slanted part to separate it from the concrete of the beam.
Baran and Arsava [18] investigated experimental and numerical analyses of the flexural behavior of concrete beams reinforced with high-strength prestressing strands. For the same reinforcement amount, beams reinforced with high-strength strands exhibited slightly smaller service stiffness than those reinforced with conventional reinforcing bars.
The influence of key factors, including the degree of reinforcement, concrete strength, steel yield strength, compression steel ratio, and confining pressure, were studied by Zhou et al. [19], based on a theoretical method. They developed a new method of beam design called “concurrent flexural strength and deformability design”, which would allow both strength and deformability requirements to be considered simultaneously.
The process of optimizing the design of flexural strength and ductility of reinforced concrete beams depends mainly on conducting laboratory tests on both concrete mixtures and steel reinforcements, which are costly and time-consuming. In this study, we construct a reliable theoretical tool to efficiently predict and optimize the responses of a reinforced concrete beam without depending on only laboratory tests. For this purpose, the machine learning approach is presented. We utilize numerical modeling using ATENA software with the support of the Box-Behnken design method to construct 13 models of reinforced concrete beams to build the surrogate models.
2. Response Surface Model
A response surface model (RSM) is a collection of statistical and mathematical techniques that are useful for developing, improving, and optimizing processes. The choice of RSM for a given computational model depends on the knowledge of the computational model itself [20,21]. It is used in the development of an adequate functional relationship between a response of interest, , and a number of associated input parameters denoted by (x1, x2, …, xk). In general, such a relationship is unknown but can be approximated by a low-degree polynomial model in the form:
where = (x1, x2, …, xk), f (x) is a vector function of p elements that consists of powers and cross-products of powers of x1, x2, …, xk up to a certain degree, denoted by d (≥ 1), β is a vector of p unknown constant coefficients, referred to as parameters, and ϵ is a random experimental error assumed to have a zero mean. This is conditioned on the consideration that the model provides an adequate representation of the response. In this case, quantity represents the mean response, that is, the expected value of y, and is denoted by μ(x). Two important models are commonly used in RSM. These are special cases of the model in Equation (1) and include the first-degree model (d = 1):
and the second-degree model (d = 2):
A series of n experiments should first be carried out, in each of which the response is measured (or observed) for specified settings of the control parameters. The totality of these settings constitutes the so-called response surface design, or just “design”, which can be represented by a matrix, denoted by D, of order n × k, called the design matrix,
where denotes the uth design setting of (i = 1, 2,, k; u = 1, 2,, n). Each row of D represents a point, referred to as a design point, in a k-dimensional Euclidean space. Let denote the response value obtained as a result of applying the uth setting of x, namely = (, , , ), (u = 1, 2, , n). From Equation (1), we then have:
where denotes the error term at the uth experimental run. Equation (5) can be expressed in a matrix form as:
where = (1, 2, , n), is a matrix of order n × p of which the uth row is , and = (1, 2, n). Note that the first column of is the column of ones 1n. Assuming that has a zero mean, the so-called ordinary least-squares estimator of β is [22]:
The Box-Behnken experimental method is rotatable second-order designs based on three-level incomplete factorial designs (see Figure 1). The special arrangement of the Box-Behnken design levels allows the number of design points to increase at the same rate as the number of polynomial coefficients. For three factors, for example, the design can be constructed as three blocks of four experiments consisting of a full two-factor factorial design with the level of the third factor set at zero [23].
In this study, for the three input parameters of the Box-Behnken experimental design, see Table 1. A total of 15 numerical runs were needed. The model was the following form:
where is the predicted response, is the model constant; , , and are the independent variables; , and are the linear coefficients; , , and are the cross-product coefficients and , , and are the quadratic coefficients. The coefficients, i.e., the main effect () and two factors’ interactions () were estimated from the numerical simulations by dedicating the least-squares method [24,25].
3. Dataset
A total of 13 specimens were used in this research, where every specimen had different compression, tension, and shear reinforcement amounts depending on the model arrangement constructed using the Box-Behnken experimental design requirements. The reinforced concrete beam cross section was 200 × 150 mm with a 1020-mm length. We used 10 mm diameter size steel bars for both compression and tension reinforcement and 6 mm diameter size steel bars for the shear reinforcement (see Figure 2). The length between the supports was 890 mm and both supports were rollers, giving freedom in the longitudinal direction of the specimens with a loading rate of 0.1 MPa/s. The labels of the specimens were M1, M2, M3, M4, M5, M6, M7, M8, M9, M10, M11, M12, M13.
The arrangement of the specimens is shown in Table 2. A total of 15 models were created using the Box-Behnken design method with the support of MATLAB code and models 13, 14, and 15 were the same arrangement; therefore only 13 models would be utilized in both the experimental tests and numerical simulations. Three input parameters were considered (compression reinforcement area of steel bars, tension reinforcement area of steel bars, and shear reinforcement area of steel bars). The minimum, middle, and maximum values of each input parameter were identified depending on the existing range for each input parameter (see Table 2).
It is worth mentioning that the outputs are the flexural strength and the stiffness of the reinforced concrete beam, which were being predicted, and would then be utilized to undergo optimization of the design. All specimens were prepared using a concrete mixture with mechanical properties shown in Table 3, determined from the compression cylinder test and split cylinder tension test of a total of six specimens of concrete cylinders with dimensions of 20 × 10 cm. The specimens were kept in water for curing for 28 days.
The results of the three-point flexure test for the 13 specimens of reinforced concrete beams are recorded in Table 4. The determined outputs were the maximum flexure force and the maximum deflection for each specimen.
4. Finite Element Models
ATENA, along with the GID pre-processor, was used to carry out the numerical analyses. Regarding the choice of materials, Cementitious2 material was used for concrete; a fracture–plastic model that considers the fracturing plastic behavior. Bilinear stress–strain curves were used to model the 15-mm-thick steel plates used for the loading plate, and pinned supports. The concrete beam, loading plate, and supports were all meshed with eight-node hexahedral elements, and stirrups and rebars were reinforced with 1-D truss elements embedded in concrete. The load was applied in a displacement-controlled manner with increments of 0.1 mm until failure occurred, considering the damage criterion [26]. Monitoring points were defined to obtain the reaction at the loading plate and deflection at the mid-span The Newton–Raphson method was used to solve the equations. Figure 3 shows a model (M8) of the reinforced concrete beam specimen, which was created using ATENA, to simulate the three-point flexure test. All the models were created supporting the details of each specimen.
The results of the flexural stress and the maximum deflection of the specimens determined from the experimental tests were verified using the results of the numerical models obtained from ATENA. The verification process was necessary to verify the results of the experimental tests, and, as a result, the surrogate models would be a strong tool in predicting the responses of a structural system. Firstly, the flexural stress results of all specimens in the experimental tests were in excellent agreement with the results of the numerical models, see Figure 4 and Table 5. The maximum percentage error reached 2.79% for model M3, which is acceptable.
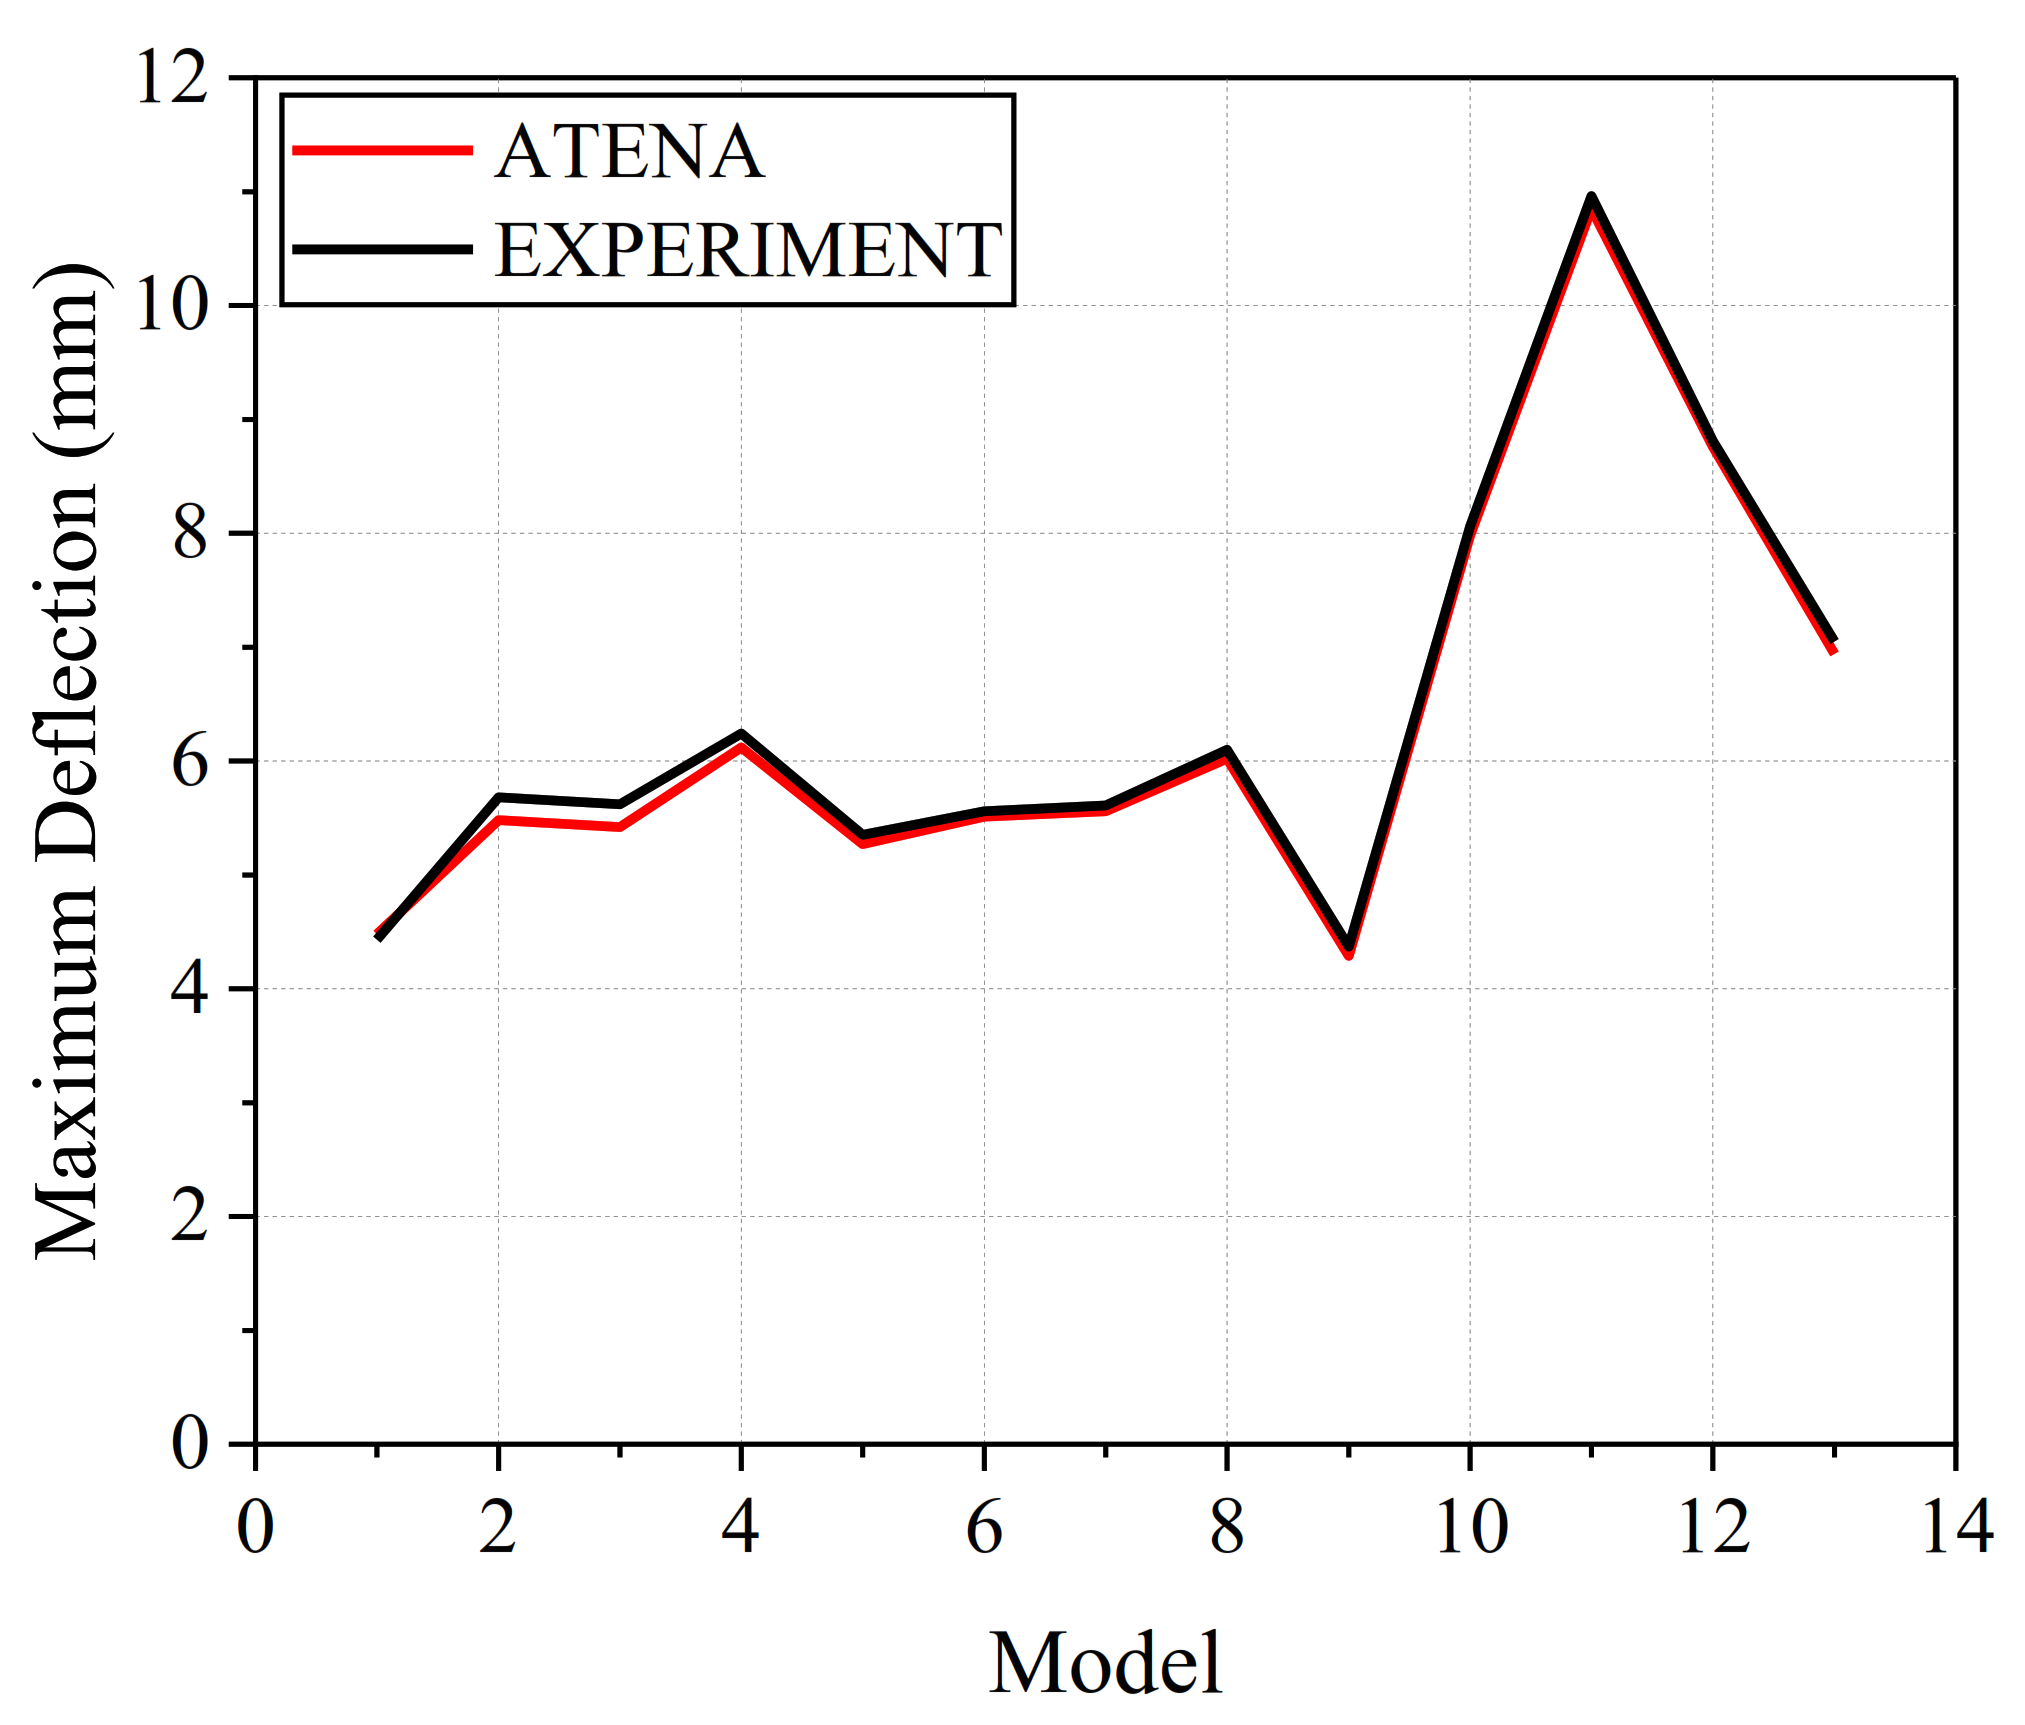
Similarly, the results of the maximum deflection of all specimens in the experimental tests were in very good agreement with the results of the numerical models, as shown in Figure 5 and Table 6. The maximum percentage error reached 3.69% for model M3 again, which is acceptable.
All the results were successfully verified with a satisfactory rate of error that did not exceed 5%. Only the maximum errors in both responses of flexural stress and maximum deflection occurred in specimen M3, which may have been due to many expected reasons: the asymmetric compaction of the specimen, error in applying the load, or improper contact between the load and the concrete surface.
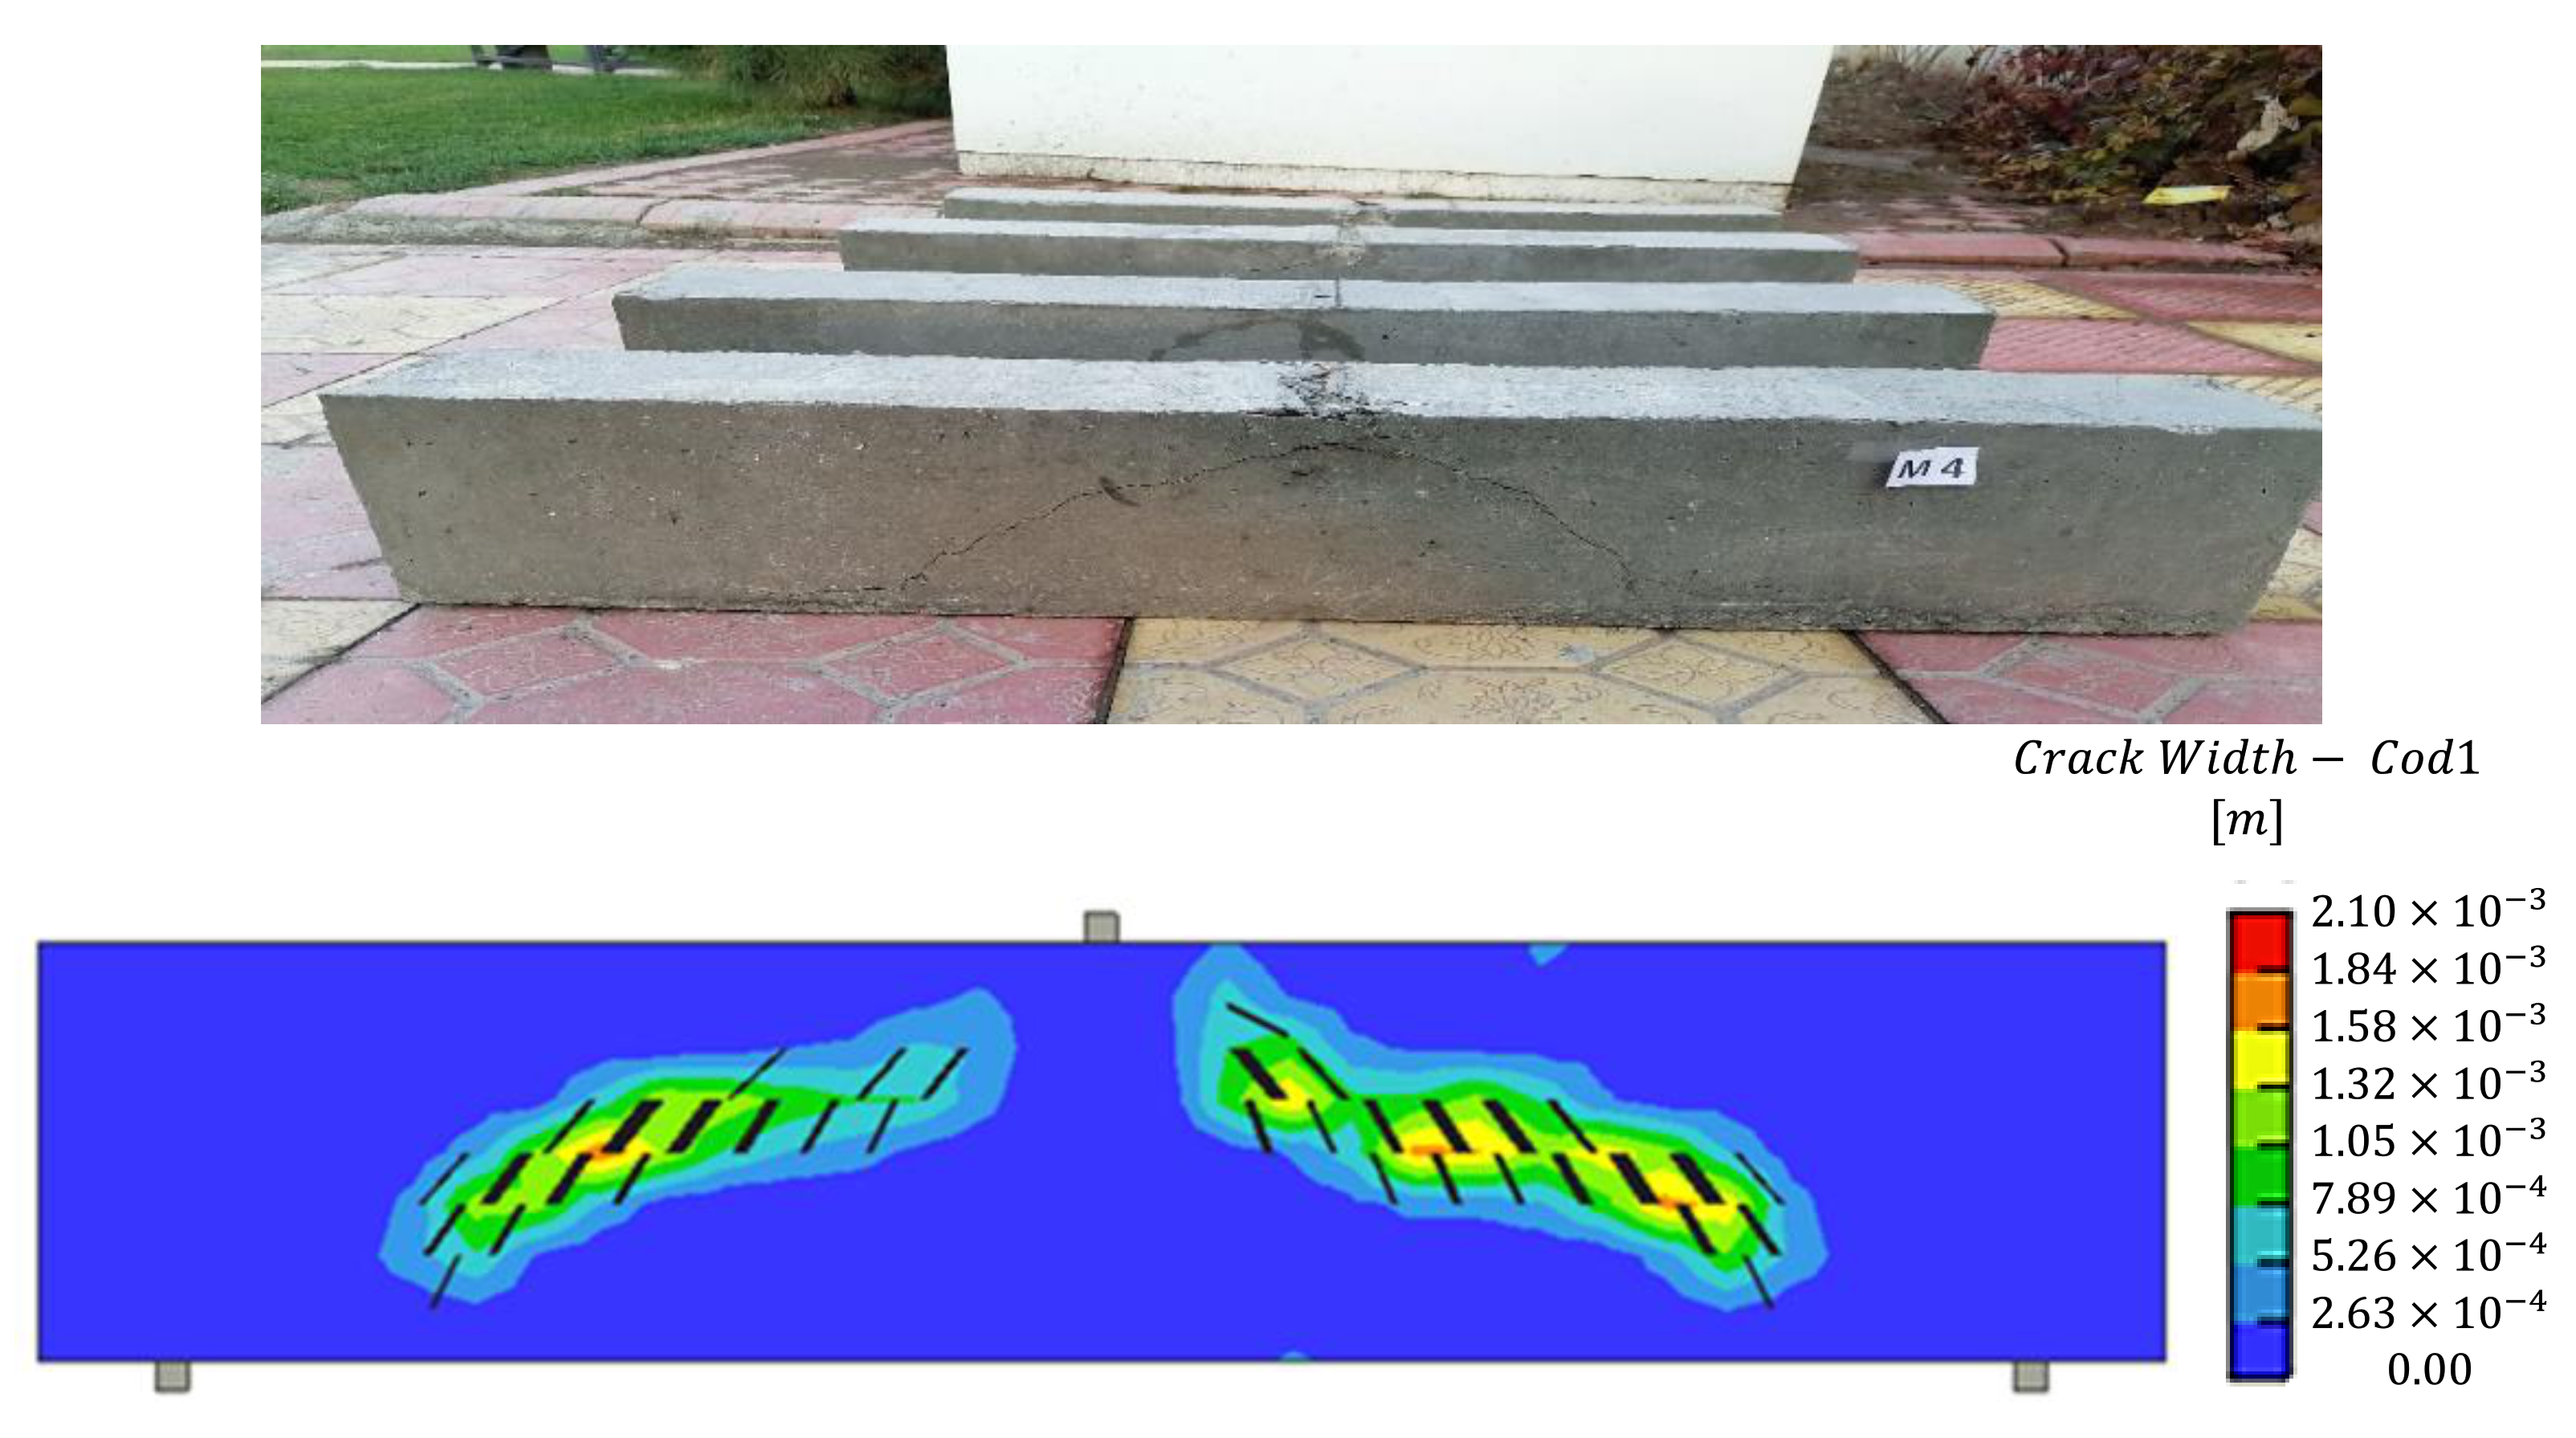
Moreover, we will consider two models, M4 and M9, to verify the results of the experimental tests by comparing both with the numerical simulations obtained from ATENA. The crack pattern in the experimental test of specimen M4 showed an arc shape starting from the tension zone in the region between the flexure zone and shear zone, in both directions. Figure 6 shows the crack pattern associated with M4, showing a very good agreement with the numerical simulation created in ATENA. The cracks propagated and connected in the compression zone under an applied load from a small distance. On the other hand, the crack pattern in the numerical simulation of model M4 from ATENA showed the same pattern, starting from the tension zone in the region between the flexure zone and shear zone, in both directions, with a small difference.
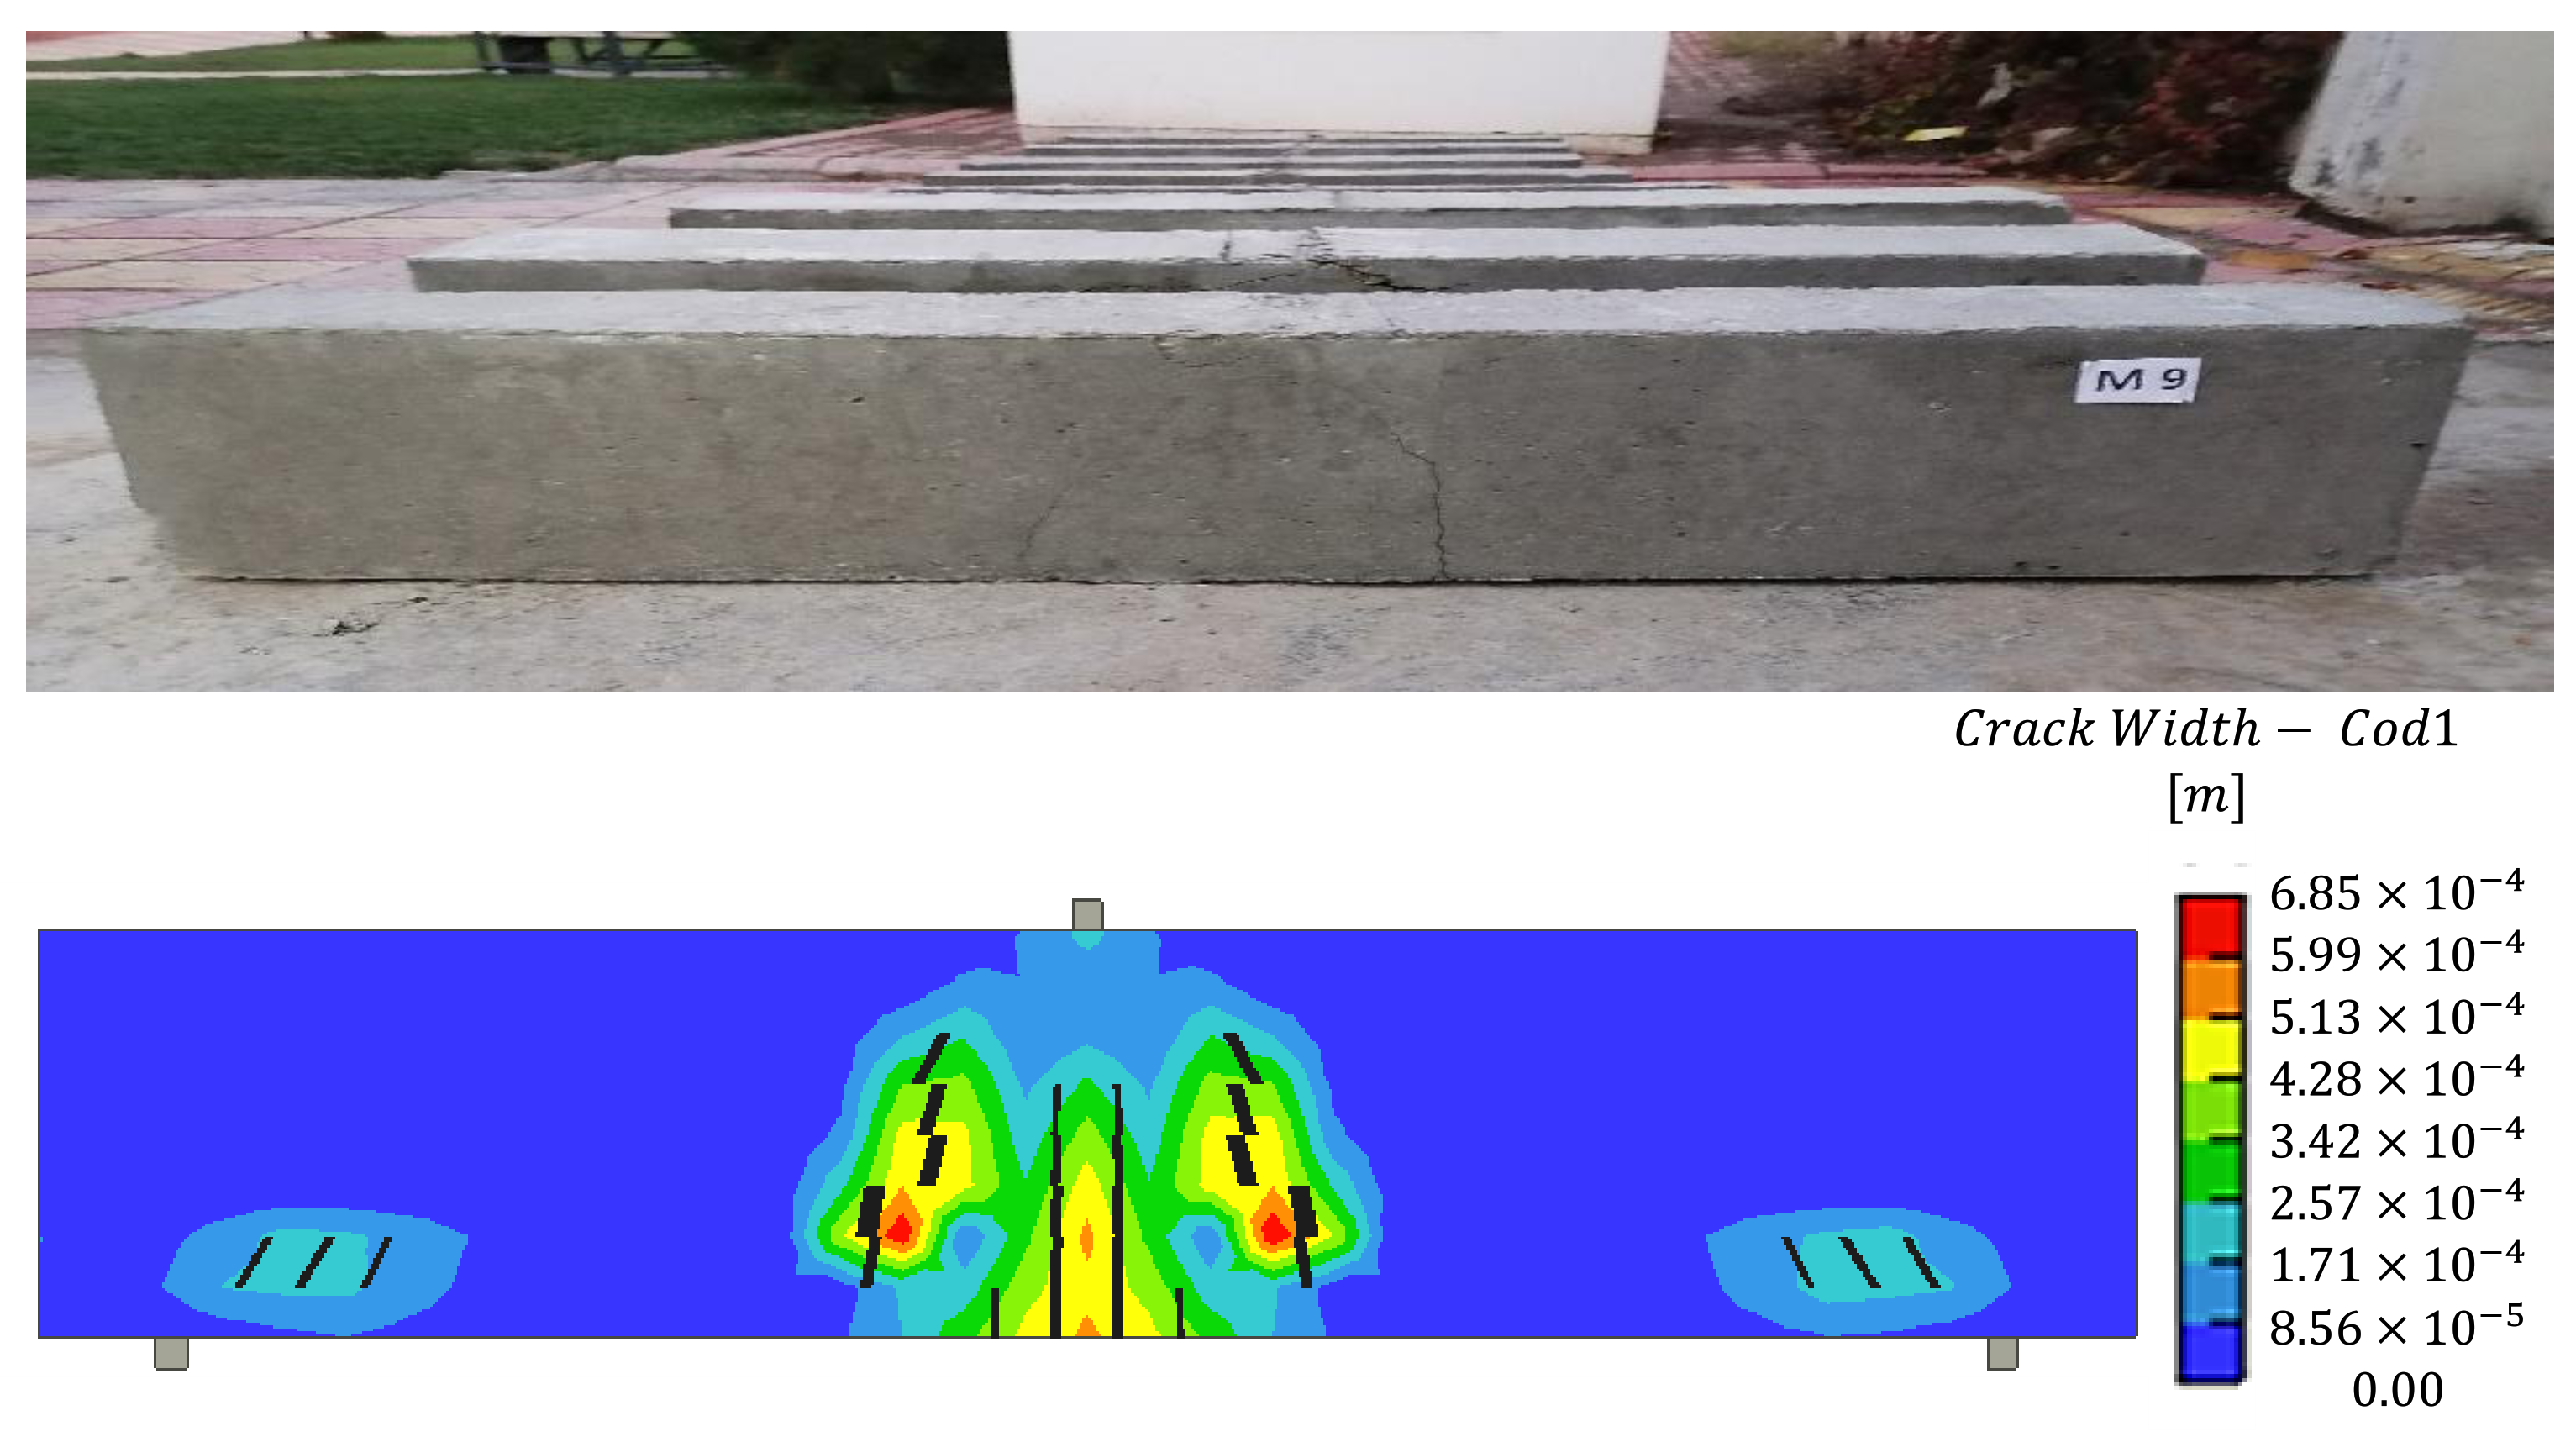
The crack pattern in the experimental test of specimen M9 shows a bounded shape starting from the tension zone in the flexure zone in both directions. A comparison between the experimental and numerical patterns is shown in Figure 7.
5. Surrogate Models
The surrogate models were created using MATLAB codes to determine the coefficients of regression for each response. The least-squares method was adopted to formulate two surrogate models. The design matrix was generated to help formulate the surrogate models by entering the least-squares method equation (see Table 7 and Table 8).
Regression analysis was necessary to compare the results gained from the experimental tests and the results predicted by the surrogate models. Coefficient of determination R2 is a tool used to identify the efficiency of surrogate models, where this parameter has a range value bounded from 0 to 1. This parameter makes use of a comparison between the experimental test results and the predicted results. When the value of this parameter is near 1, it means that the surrogate models are efficient and can be supported to predict the responses of any structural system.
5.1. Flexural Stress
Table 9 lists the details of the regression coefficients, which were used to formulate the surrogate model for the flexural stress prediction.
Accordingly, the equation of the surrogate model for predicting the flexural stress in a reinforced concrete beam is denoted by FS, as follows:
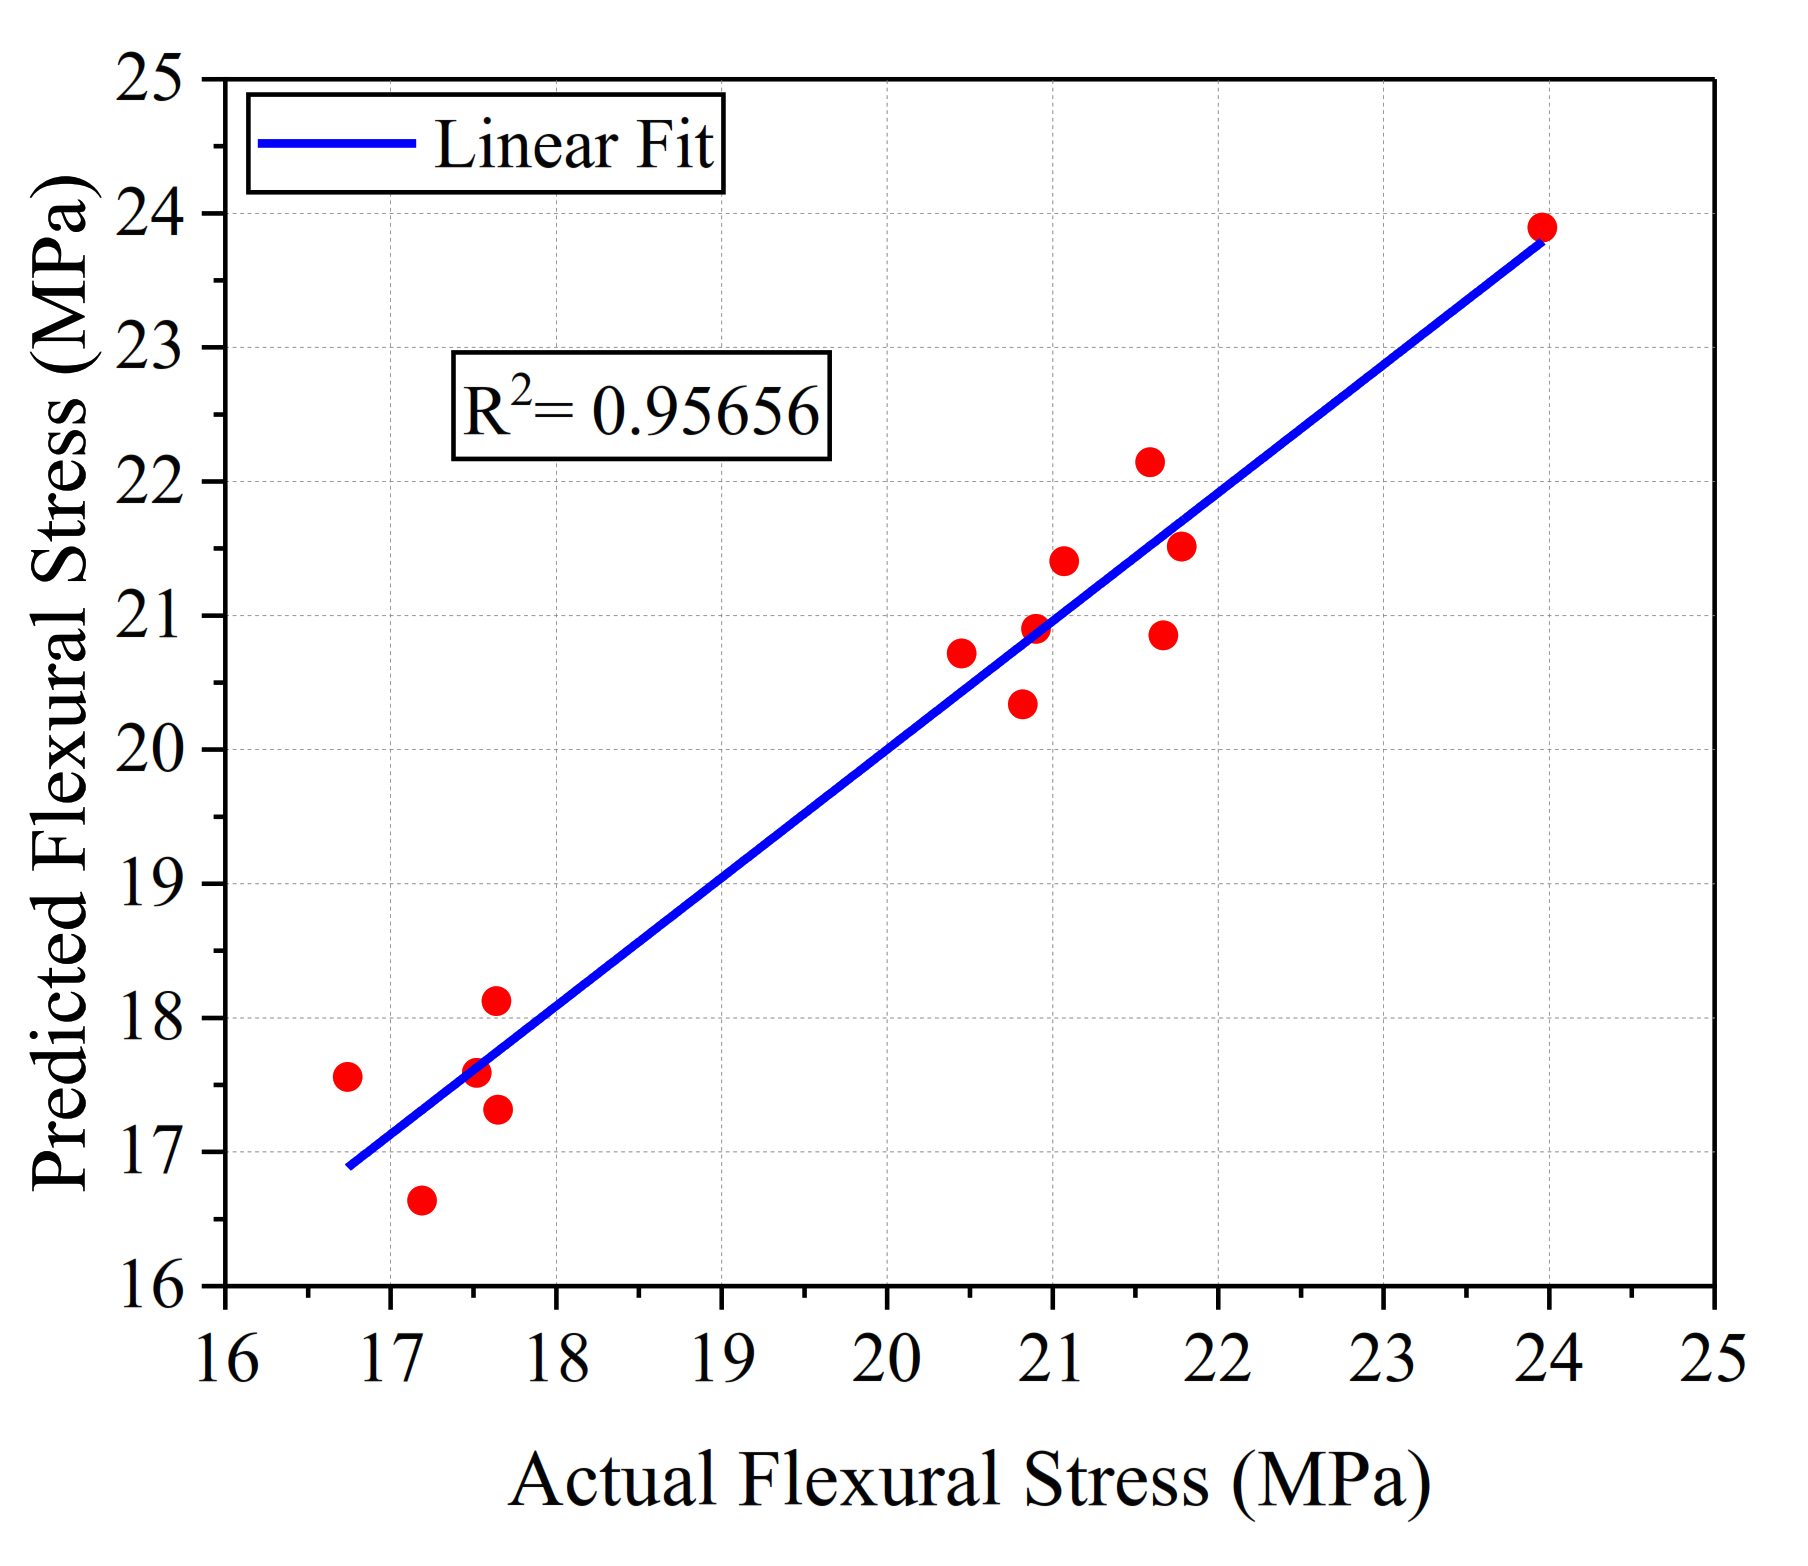
The coefficient of determination for the flexural stress for the results of the experimental tests and the predicted results was R2 = 0.9566, which is an excellent value indicating the efficiency of the surrogate model to predict the flexural stress in reinforced concrete beam specimens.
5.2. Maximum Deflection
Table 10 shows details of the regression coefficients, which were used to formulate the surrogate model for the maximum deflection prediction.
The equation of the surrogate model for predicting the maximum deflection in the reinforced concrete beam is denoted by MD, as follows:
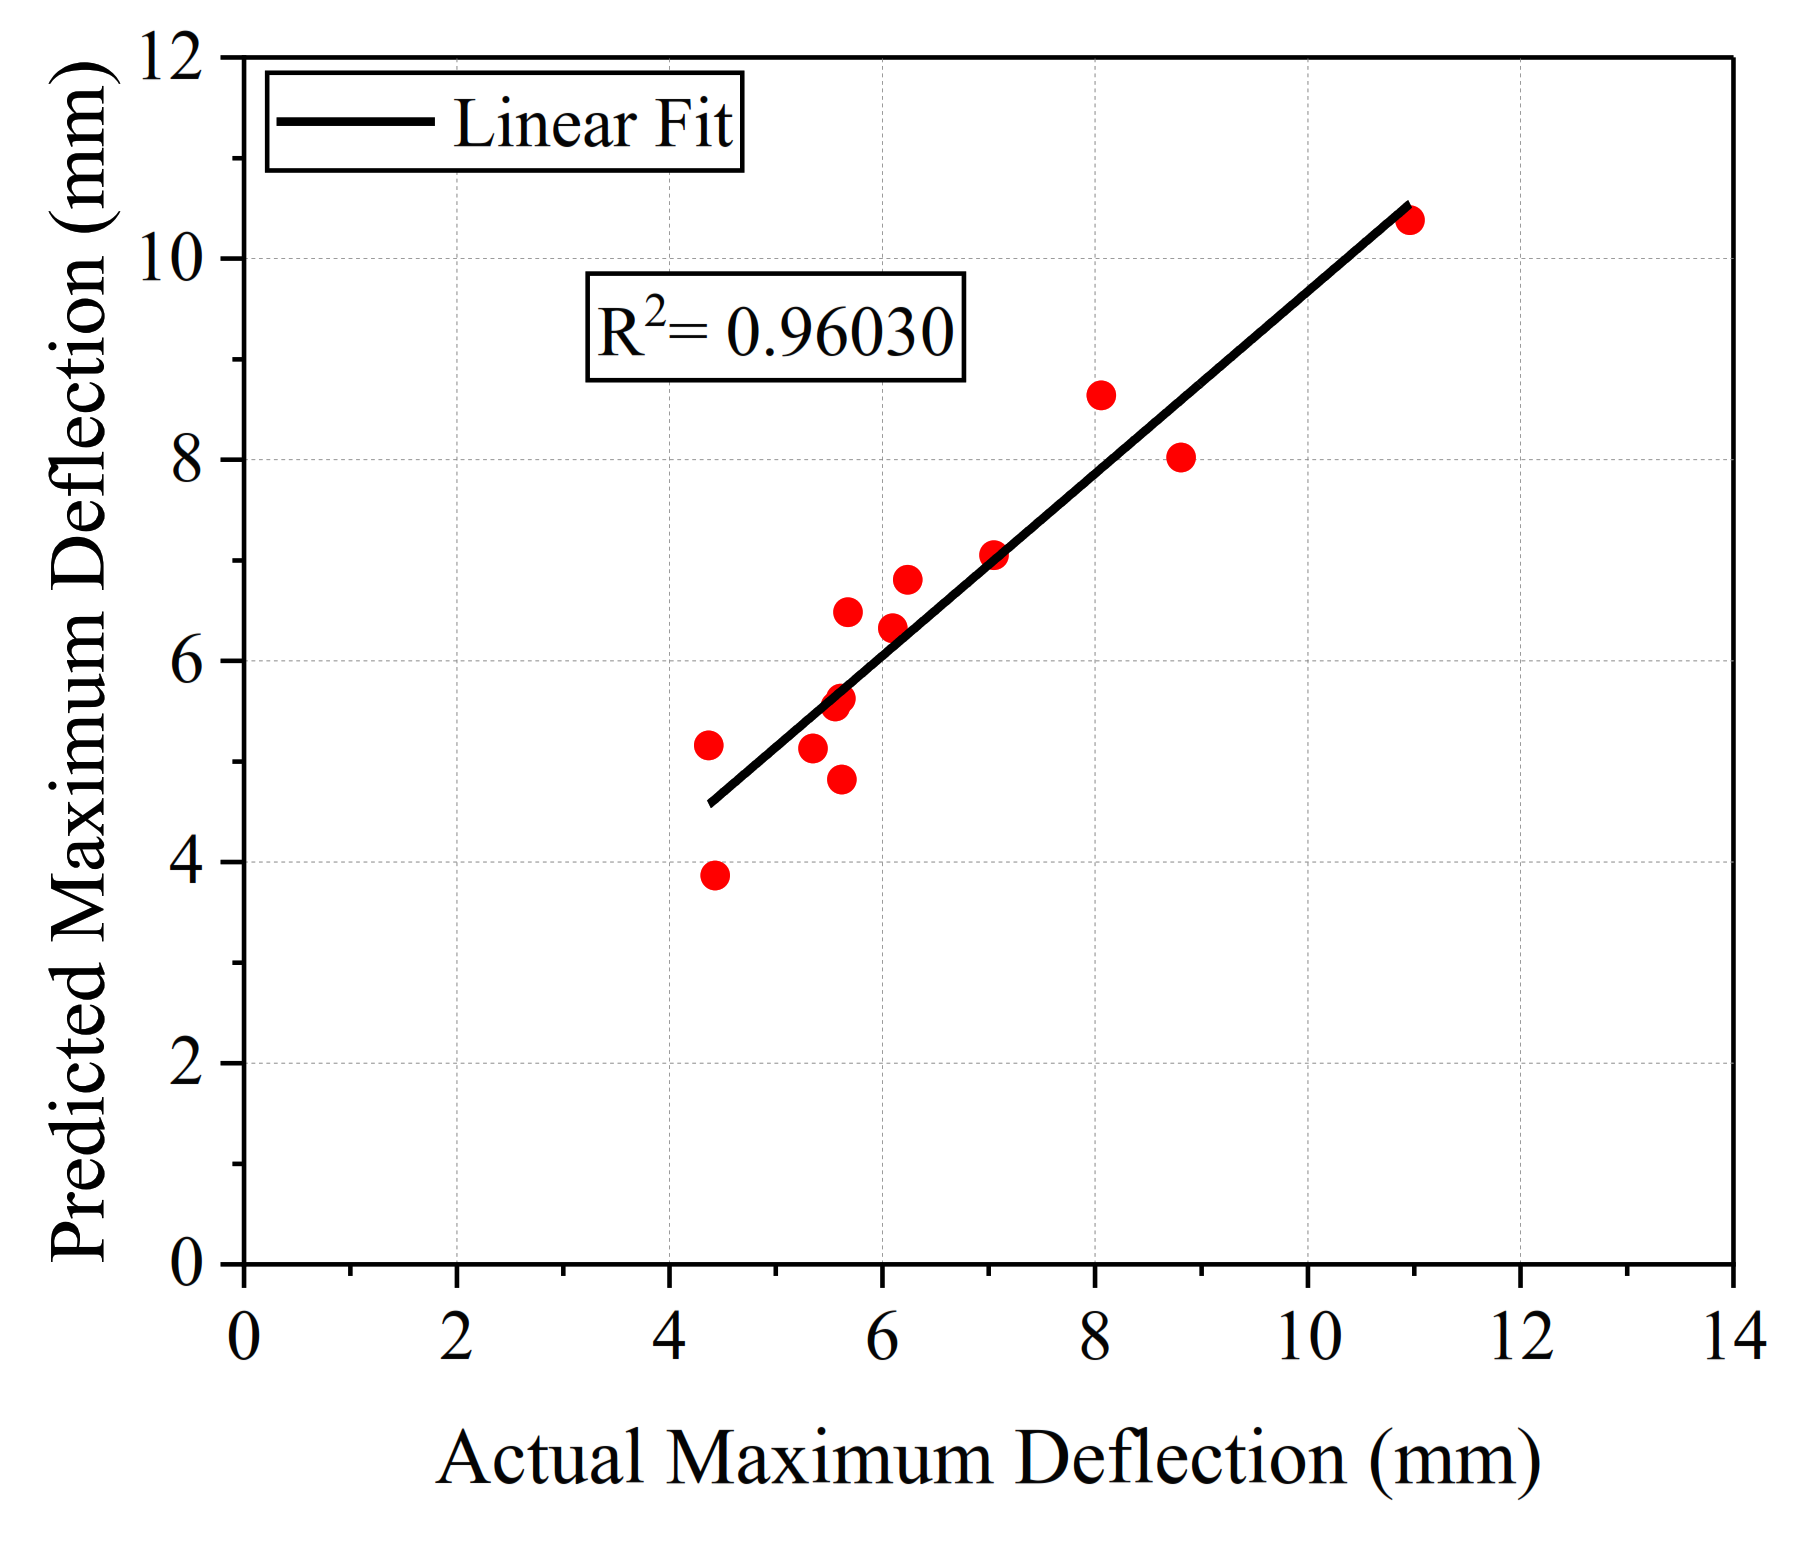
The coefficient of determination for the results of the experimental tests and the predicted results was R2 = 0.9063, which is an excellent value, indicating the efficiency of the surrogate model to predict the maximum deflection in reinforced concrete beam specimens.
5.3. Regression Analysis
When the surrogate models are ready for prediction, regression analysis is necessary to compare the results gained from the experimental tests and the results predicted by the surrogate models. Coefficient of determination R2 is a tool used to identify the efficiency of the surrogate models, where this parameter has a range value starting from 0 to 1. This parameter makes use of a comparison between the experimental test results and the predicted results. When the value of the parameter is near 1, it means that the surrogate models are efficient and can be supported to predict the responses of any structural system.
5.3.1. Flexural Stress
The coefficient of determination for the flexural stress for the results of experimental tests and the predicted results was R2 = 0.9566, which is an excellent value indicating the efficiency of the surrogate model to predict the flexural stress in reinforced concrete beam specimens (Figure 8). Only 4.34% of the system response was not predictable, which is very satisfactory.
5.3.2. Maximum Deflection
The coefficient of determination for the maximum deflection for the results of experimental tests and the predicted results was R2 = 0.9063, which is an excellent value indicating the efficiency of the surrogate model to predict the maximum deflection in reinforced concrete beam specimens (Figure 9). Only 9.37% of the system response was not predictable, which is satisfactory.
6. Optimization Results
The factorial method for the predicted results of the flexural stress and the maximum deflection in reinforced concrete beam specimens was adopted to optimize the design by identifying the minimum and maximum values of each of the two results. A total of 27 models were constructed supporting the surrogate models to detect the optimum values for each result. It is worth mentioning that the three considered parameters were used to formulate the involved models.
6.1. Flexural Stress
Table 11 lists the optimization results for the flexural stress. The optimum values of the flexural stress were 15.645 MPa for the minimum value for model 1 and 23.891 MPa for the maximum value for model 13. Thus, the maximum value, in this case, was considered to undertake its related model arrangement for the optimum design for flexural strength of reinforced concrete beams.
6.2. Maximum Deflection
The optimum values of the maximum deflection were 2.77625 mm for the minimum value for model 1 and 10.38125 mm for the maximum value for model 11. The minimum value was considered to undertake its related model arrangement for the optimum design for stiffness of reinforced concrete beams. The results are summarized in Table 12.
7. Conclusions
Experimental tests and numerical simulations of 13 specimens of reinforced concrete beams were conducted to optimize their flexural strength and stiffness. We used the Box-Behnken design method with the support of the ATENA program to verify the experimental tests and predict the optimum solutions. The following points can be concluded from our analyses:
- The Box-Behnken design method manifested excellent strength in building the surrogate models to predict the responses of the structural system under loading and, as a result, a more efficient, safer, and lower-cost design.
- The numerical models generated in the ATENA program showed a good agreement with the experimental tests, where the results were very similar and very satisfactory. In addition, numerical models can be adopted to predict and optimize the design of the reinforced concrete beams for flexure and ductility.
- The optimization process produced minimum and maximum responses based on the factorial method of the predicted responses of the flexural strength and the stiffness from the surrogate models.
Author Contributions
Conceptualization, N.A.N., K.H. and A.M.R.; methodology, N.A.N.; software, H.S.; validation, N.A.N., H.S. and K.H.; formal analysis, N.A.N.; investigation, N.A.N., A.M.R.; resources, K.H.; data curation, H.S.; writing—original draft preparation, N.A.N.; writing—review and editing, N.A.N., A.M.R., H.S. and K.H.; visualization, N.A.N. and K.H.; supervision, N.A.N. and A.M.R.; project administration, N.A.N.; funding acquisition, not available. All authors have read and agreed to the published version of the manuscript.
Funding
This research received no external funding.
Conflicts of Interest
The authors declare no conflict of interest.
References
- Rao, G.A.; Vijayanand, I.; Eligehausen, R. Studies on ductility and evaluation of minimum flexural reinforcement in RC beams. Mater. Struct. 2007, 41, 759–771. [Google Scholar] [CrossRef]
- Whitney, C.S. Design of Reinforced Concrete Members under Flexure or Combined Flexural and Direct Compression. J. Proc. 1937, 33, 483–498. [Google Scholar]
- Hognestad, E.; Hanson, N.W.; McHenry, D. Concrete stress distribution in ultimate strength design. ACI J. 1955, 52, 455–480. [Google Scholar]
- Mattock, A.; Kriz, L.; Hognestad, E. Rectangular concrete stress distribution in ultimate strength design. ACI J. 1961, 57, 875–928. [Google Scholar]
- Metwally, I.M. Can Different Design Codes Give the Accurate Prediction of Moment Capacities of High-Strength Concrete Members? In Proceedings of the International Conference on Sustainable Design and Construction (ICSDC), Kansas City, MO, USA, 23–25 March 2011; pp. 497–506. [Google Scholar]
- Pam, H.J.; Kwan, A.K.; Islam, M.S. Flexural Strength and Ductility of reinforced Normal and High-Strength Concrete Beams. Struct. Build. 2001, 146, 381–389. [Google Scholar] [CrossRef]
- Bernardo, L.F.A.; Lopes, S.M.R. Neutral Axis Depth versus Flexural Ductility in High-Strength Concrete Beams. J. Struct. Eng. 2004, 130, 452–459. [Google Scholar] [CrossRef]
- Sarkar, S.; Adwan, O.; Munday, J.G. High Strength Concrete: An Investigation of the flexural Behavior of High Strength RC Beams. Struct. Eng. 1997, 75, 115–121. [Google Scholar]
- Ashour, S.A. Effect of compressive strength and tensile reinforcement ratio on flexural behavior of high-strength concrete beams. Eng. Struct. 2000, 22, 413–423. [Google Scholar] [CrossRef]
- Neville, A.M. Properties of Concrete; Longman: London, UK, 1995; Volume 4. [Google Scholar]
- Hamdia, K.; Arafa, M.; Alqedra, M. Structural damage assessment criteria for reinforced concrete buildings by using a Fuzzy Analytic Hierarchy process. Undergr. Space 2018, 3, 243–249. [Google Scholar] [CrossRef]
- Bae, B.-I.; Choi, H.-K.; Choi, C.-S. Flexural Strength Evaluation of Reinforced Concrete Members with Ultra High Performance Concrete. Adv. Mater. Sci. Eng. 2016, 2016, 1–10. [Google Scholar] [CrossRef] [Green Version]
- Namdar, A.; Darvishi, E.; Feng, X.; Zakaria, I.; Yahaya, F.M. Effect of flexural crack on plain concrete beam failure mechanism A numerical simulation. Frat. Integrità Strutt. 2016, 10, 168–181. [Google Scholar] [CrossRef] [Green Version]
- Nariman, A.N.; Mohammed, I.I.; Othman, K.; Dilshad, D.; Khidr, I. Analysis of stiffness and flexural strength of a reinforced concrete beam using an invented reinforcement system. Front. Struct. Civ. Eng. 2021, 15, 378–389. [Google Scholar] [CrossRef]
- Shishegaran, A.; Ghasemi, M.R.; Varaee, H. Performance of a novel bent-up bars system not interacting with concrete. Front. Struct. Civ. Eng. 2019, 13, 1301–1315. [Google Scholar] [CrossRef]
- Al-Kamal, M.K. Nominal flexural strength of high-strength concrete beams. Adv. Concr. Constr. 2019, 7, 1–9. [Google Scholar]
- Ghasemi, M.R.; Shishegaran, A. Role of slanted reinforcement on bending capacity SS beams. Vibroengineering Procedia 2017, 11, 195–199. [Google Scholar]
- Baran, E.; Arsava, T. Flexural Strength Design Criteria for Concrete Beams Reinforced with High-Strength Steel Strands. Adv. Struct. Eng. 2012, 15, 1781–1792. [Google Scholar] [CrossRef]
- Zhou, K.; Ho, J.; Su, R. Flexural Strength and Deformability Design of Reinforced Concrete Beams. Procedia Eng. 2011, 14, 1399–1407. [Google Scholar] [CrossRef] [Green Version]
- Myers, R.H.; Montgomery, D.C.; Anderson-Cook, C.M. Response Surface Methodology: Process and Product Optimization Using Designed Experiments; John Wiley & Sons: New York, NY, USA, 1995; pp. 134–174. [Google Scholar]
- Kwak, J.-S. Application of Taguchi and response surface methodologies for geometric error in surface grinding process. Int. J. Mach. Tools Manuf. 2005, 45, 327–334. [Google Scholar] [CrossRef]
- Khuri, A.I.; Mukhopadhyay, S. Response surface methodology. Wiley Interdiscip. Rev. Comput. Stat. 2010, 2, 128–149. [Google Scholar]
- Amenaghawon, N.A.; Nwaru, K.I.; Aisien, F.A.; Ogbeide, S.E.; Okieimen, C.O. Application of Box-Behnken Design for the Optimization of Citric Acid Production from Corn Starch Using Aspergillus niger. Br. Biotechnol. J. 2013, 3, 236–245. [Google Scholar] [CrossRef]
- Pasma, S.A.; Daik, R.; Maskat, M.Y.; Hassan, O. Application of Box-Behnken Design in Optimization of Glucose Production from Oil Palm Empty Fruit Bunch Cellulose. Int. J. Polym. Sci. 2013, 2013, 1–8. [Google Scholar] [CrossRef] [Green Version]
- Qiu, P.; Cui, M.; Kang, K.; Park, B.; Son, Y.; Khim, E.; Jang, M.; Khim, J. Application of Box-Behnken design with response surface methodology for modeling and optimizing ultrasonic oxidation of arsenite with H2O2. Open Chem. 2014, 12, 164–172. [Google Scholar] [CrossRef]
- Hamdia, K.M.; Rabczuk, T. Key Parameters for Fracture Toughness of Particle/Polymer Nanocomposites; Sensitivity Analysis via XFEM Modeling Approach. In Proceedings of the 7th International Conference on Fracture Fatigue and Wear, Ghent University, Ghent, Belgium, 9–10 July 2019; pp. 41–51. [Google Scholar] [CrossRef]
Figure 1.
Box-Behnken experimental method.

Figure 2.
Reinforcement detailing and flexural test setup.

Figure 3.
Numerical model of the reinforced concrete beam (M8).

Figure 4.
Flexural stress verification.

Figure 5.
Maximum deflection verification.

Figure 6.
Model M4 verification.

Figure 7.
Model M9 verification.

Figure 8.
Regression analysis for flexural stress.

Figure 9.
Regression analysis for maximum deflection.


Table 1.
Ranges of input parameters.
| Parameter | Symbol | Minimum Value | Middle Value | Maximum Value |
|---|---|---|---|---|
| Compression Area of Steel (mm2) | 157.00 | 235.50 | 314.00 | |
| Tension Area of Steel (mm2) | 157.00 | 235.50 | 314.00 | |
| Shear Area of Steel (mm2) | 169.56 | 197.82 | 226.08 |
Table 2.
Arrangement of 15 specimens.
| Model | Area of Compression Steel Bars (mm2) | Area of Tension Steel Bars (mm2) | Area of Shear Steel Bars (mm2) |
|---|---|---|---|
| 1 | 157.00 | 157.00 | 197.82 |
| 2 | 157.00 | 314.00 | 197.82 |
| 3 | 314.00 | 157.00 | 197.82 |
| 4 | 314.00 | 314.00 | 197.82 |
| 5 | 157.00 | 235.50 | 169.56 |
| 6 | 157.00 | 235.50 | 226.08 |
| 7 | 314.00 | 235.50 | 169.56 |
| 8 | 314.00 | 235.50 | 226.08 |
| 9 | 235.50 | 157.00 | 169.56 |
| 10 | 235.50 | 157.00 | 226.08 |
| 11 | 235.50 | 314.00 | 169.56 |
| 12 | 235.50 | 314.00 | 226.08 |
| 13 | 235.50 | 235.50 | 197.82 |
| 14 | 235.50 | 235.50 | 197.82 |
| 15 | 235.50 | 235.50 | 197.82 |
Table 3.
Mechanical properties of the concrete mixture.
| Cylinder Specimen | Maximum Compression Load (kN) | Cylinder Specimen | Maximum Tensile Load (kN) |
|---|---|---|---|
| C1 | 101.74 | T1 | 85.90 |
| C2 | 88.45 | T2 | 66.20 |
| C3 | 99.08 | T3 | 100.19 |
Table 4.
Experimental results and the outputs for the specimens.
| Model | Maximum Flexure Load (kN) | Slope | Flexural Strain(mm/mm) | Young’s Modulus (N/mm2) | Maximum Deflection (mm) | Flexural Stress (MPa) |
|---|---|---|---|---|---|---|
| 1 | 77.240 | 0.7140 | 0.1639 | 104.860 | 4.430 | 17.190 |
| 2 | 94.680 | 0.8330 | 0.1722 | 122.340 | 5.68 | 21.070 |
| 3 | 79.320 | 0.7050 | 0.1704 | 103.540 | 5.62 | 17.650 |
| 4 | 97.040 | 0.7770 | 0.1892 | 114.120 | 6.24 | 21.590 |
| 5 | 79.260 | 0.7400 | 0.1623 | 108.680 | 5.35 | 17.640 |
| 6 | 97.900 | 0.8800 | 0.1685 | 129.240 | 5.56 | 21.780 |
| 7 | 91.900 | 0.8180 | 0.1702 | 120.140 | 5.61 | 20.450 |
| 8 | 93.560 | 0.7610 | 0.1862 | 111.770 | 6.10 | 20.820 |
| 9 | 78.750 | 0.9000 | 0.1326 | 132.180 | 4.37 | 17.520 |
| 10 | 75.240 | 0.4666 | 0.2442 | 68.530 | 8.06 | 16.740 |
| 11 | 97.380 | 0.4440 | 0.3323 | 65.210 | 10.96 | 21.670 |
| 12 | 107.700 | 0.6110 | 0.2670 | 89.740 | 8.81 | 23.960 |
| 13 | 93.930 | 0.6660 | 0.2137 | 97.810 | 7.05 | 20.900 |
Table 5.
Error estimation for flexural stress.
| Model | Flexural Stress ATENA (MPa) | Flexural Stress Experiment (MPa) | Error % |
|---|---|---|---|
| 1 | 17.15611696 | 17.185900 | 0.17 |
| 2 | 21.09721253 | 21.066300 | 0.15 |
| 3 | 17.15664377 | 17.648700 | 2.79 |
| 4 | 21.59387950 | 21.591400 | 0.01 |
| 5 | 17.95554714 | 17.635350 | 1.82 |
| 6 | 21.44176454 | 21.782750 | 1.57 |
| 7 | 20.31767836 | 20.447750 | 0.64 |
| 8 | 20.70511776 | 20.817100 | 0.54 |
| 9 | 17.09409603 | 17.521875 | 2.44 |
| 10 | 16.33360424 | 16.740900 | 2.43 |
| 11 | 21.15750459 | 21.667050 | 2.35 |
| 12 | 24.50759912 | 23.963250 | 2.27 |
| 13 | 20.92028772 | 20.899425 | 0.10 |
Table 6.
Error estimation for maximum deflection.
| Model | Max. Deflection ATENA (mm) | Max. Deflection Experiment (mm) | Error % |
|---|---|---|---|
| 1 | 4.48 | 4.43 | 1.12 |
| 2 | 5.48 | 5.68 | 3.65 |
| 3 | 5.42 | 5.62 | 3.69 |
| 4 | 6.12 | 6.24 | 1.96 |
| 5 | 5.27 | 5.35 | 1.52 |
| 6 | 5.51 | 5.56 | 0.91 |
| 7 | 5.56 | 5.61 | 0.90 |
| 8 | 6.02 | 6.1 | 1.33 |
| 9 | 4.29 | 4.37 | 1.86 |
| 10 | 7.98 | 8.06 | 1.00 |
| 11 | 10.85 | 10.96 | 1.01 |
| 12 | 8.76 | 8.81 | 0.57 |
| 13 | 6.94 | 7.05 | 1.59 |
Table 7.
Design matrix—linear and quadratic terms.
| Model | Constant | X1 | X2 | X3 | X1X1 | X2X2 | X3X3 |
|---|---|---|---|---|---|---|---|
| 1 | 1.00 | 157.00 | 157.00 | 197.82 | 24,649.00 | 24,649.00 | 39,132.75 |
| 2 | 1.00 | 157.00 | 314.00 | 197.82 | 24,649.00 | 98,596.00 | 39,132.75 |
| 3 | 1.00 | 314.00 | 157.00 | 197.82 | 98,596.00 | 24,649.00 | 39,132.75 |
| 4 | 1.00 | 314.00 | 314.00 | 197.82 | 98,596.00 | 98,596.00 | 39,132.75 |
| 5 | 1.00 | 157.00 | 235.50 | 169.56 | 24,649.00 | 55,460.25 | 28,750.59 |
| 6 | 1.00 | 157.00 | 235.50 | 226.08 | 24,649.00 | 55,460.25 | 51,112.17 |
| 7 | 1.00 | 314.00 | 235.50 | 169.56 | 98,596.00 | 55,460.25 | 28,750.59 |
| 8 | 1.00 | 314.00 | 235.50 | 226.08 | 98,596.00 | 55,460.25 | 51,112.17 |
| 9 | 1.00 | 235.50 | 157.00 | 169.56 | 55,460.25 | 24,649.00 | 28,750.59 |
| 10 | 1.00 | 235.50 | 157.00 | 226.08 | 55,460.25 | 24,649.00 | 51,112.17 |
| 11 | 1.00 | 235.50 | 314.00 | 169.56 | 55,460.25 | 98,596.00 | 28,750.59 |
| 12 | 1.00 | 235.50 | 314.00 | 226.08 | 55,460.25 | 98,596.00 | 51,112.17 |
| 13 | 1.00 | 235.50 | 235.50 | 197.82 | 55,460.25 | 55,460.25 | 39,132.75 |
| 14 | 1.00 | 235.50 | 235.50 | 197.82 | 55,460.25 | 55,460.25 | 39,132.75 |
| 15 | 1.00 | 235.50 | 235.50 | 197.82 | 55,460.25 | 55,460.25 | 39,132.75 |
Table 8.
Design Matrix-Interaction Terms.
| Model | X1X2 | X1X3 | X2X3 |
|---|---|---|---|
| 1 | 24,649.00 | 31,057.74 | 31,057.74 |
| 2 | 49,298.00 | 31,057.74 | 62,115.48 |
| 3 | 49,298.00 | 62,115.48 | 31,057.74 |
| 4 | 98,596.00 | 62,115.48 | 62,115.48 |
| 5 | 36,973.50 | 26,620.92 | 39,931.38 |
| 6 | 36,973.50 | 35,494.56 | 53,241.84 |
| 7 | 73,947.00 | 53,241.84 | 39,931.38 |
| 8 | 73,947.00 | 70,989.12 | 53,241.84 |
| 9 | 36,973.50 | 39,931.38 | 26,620.92 |
| 10 | 36,973.50 | 53,241.84 | 35,494.56 |
| 11 | 73,947.00 | 39,931.38 | 53,241.84 |
| 12 | 73,947.00 | 53,241.84 | 70,989.12 |
| 13 | 55,460.25 | 46,586.61 | 46,586.61 |
| 14 | 55,460.25 | 46,586.61 | 46,586.61 |
| 15 | 55,460.25 | 46,586.61 | 46,586.61 |
Table 9.
Regression coefficients for flexural stress.
| Coefficient | Value (10−6) |
|---|---|
| −13.075 | |
| 138.61 × 10⁻³ | |
| 27.47 × 10⁻³ | |
| 77.41 × 10⁻³ | |
| −0.11 × 10⁻³ | |
| −0.14 × 10⁻³ | |
| −81.39 × 10⁻⁶ | |
| 2.43 × 10⁻⁶ | |
| −0.42 × 10⁻³ | |
| 0.35 × 10⁻³ |
Table 10.
Regression coefficients for maximum deflection.
| Coefficient | Value |
|---|---|
| −15.464 | |
| 154.89 × 10⁻³ | |
| 118.87 × 10⁻³ | |
| −130.48 × 10⁻³ | |
| −0.32 × 10⁻³ | |
| 67.95 × 10⁻⁶ | |
| 0.73 × 10⁻³ | |
| −25.56 × 10⁻⁶ | |
| 31.55 × 10⁻⁶ | |
| −0. 66 × 10−3 |
Table 11.
Optimization results for flexural stress.
| Model | X1 (mm2) | X2 (mm2) | X3 (mm2) | |
|---|---|---|---|---|
| 1 | 157.00 | 157.00 | 169.56 | 15.645 |
| 2 | 157.00 | 157.00 | 197.82 | 16.638 |
| 3 | 157.00 | 157.00 | 226.08 | 17.500 |
| 4 | 157.00 | 235.50 | 169.56 | 18.124 |
| 5 | 157.00 | 314.00 | 169.56 | 18.878 |
| 6 | 235.50 | 157.00 | 169.56 | 17.589 |
| 7 | 314.00 | 157.00 | 169.56 | 18.207 |
| 8 | 314.00 | 235.50 | 169.56 | 20.716 |
| 9 | 314.00 | 235.50 | 197.82 | 20.591 |
| 10 | 314.00 | 235.50 | 226.08 | 20.336 |
| 11 | 235.50 | 314.00 | 169.56 | 20.851 |
| 12 | 235.50 | 314.00 | 197.82 | 22.436 |
| 13 | 235.50 | 314.00 | 226.08 | 23.891 |
| 14 | 235.50 | 235.50 | 169.56 | 20.083 |
| 15 | 235.50 | 235.50 | 197.82 | 20.900 |
| 16 | 235.50 | 235.50 | 226.08 | 21.588 |
| 17 | 314.00 | 314.00 | 169.56 | 21.500 |
| 18 | 314.00 | 314.00 | 197.82 | 22.143 |
| 19 | 314.00 | 314.00 | 226.08 | 22.655 |
| 20 | 235.50 | 157.00 | 197.82 | 17.639 |
| 21 | 314.00 | 157.00 | 197.82 | 17.315 |
| 22 | 157.00 | 314.00 | 197.82 | 21.405 |
| 23 | 157.00 | 314.00 | 226.08 | 23.803 |
| 24 | 235.50 | 157.00 | 226.08 | 17.559 |
| 25 | 314.00 | 157.00 | 226.08 | 16.293 |
| 26 | 157.00 | 235.50 | 197.82 | 19.883 |
| 27 | 157.00 | 235.50 | 226.08 | 21.514 |
Table 12.
Optimization results for maximum deflection.
| Model | X1 (mm2) | X2 (mm2) | X3 (mm2) | δmax (mm) |
|---|---|---|---|---|
| 1 | 157.00 | 157.00 | 169.56 | 2.776250 |
| 2 | 157.00 | 157.00 | 197.82 | 3.865000 |
| 3 | 157.00 | 157.00 | 226.08 | 6.116250 |
| 4 | 157.00 | 235.50 | 169.56 | 5.126250 |
| 5 | 157.00 | 314.00 | 169.56 | 8.313750 |
| 6 | 235.50 | 157.00 | 169.56 | 5.158750 |
| 7 | 314.00 | 157.00 | 169.56 | 3.588750 |
| 8 | 314.00 | 235.50 | 169.56 | 5.623750 |
| 9 | 314.00 | 235.50 | 197.82 | 5.392500 |
| 10 | 314.00 | 235.50 | 226.08 | 6.323750 |
| 11 | 235.50 | 314.00 | 169.56 | 10.381250 |
| 12 | 235.50 | 314.00 | 197.82 | 8.620000 |
| 13 | 235.50 | 314.00 | 226.08 | 8.021250 |
| 14 | 235.50 | 235.50 | 169.56 | 7.351250 |
| 15 | 235.50 | 235.50 | 197.82 | 7.050000 |
| 16 | 235.50 | 235.50 | 226.08 | 7.911250 |
| 17 | 314.00 | 314.00 | 169.56 | 8.496250 |
| 18 | 314.00 | 314.00 | 197.82 | 6.805000 |
| 19 | 314.00 | 314.00 | 226.08 | 6.276250 |
| 20 | 235.50 | 157.00 | 197.82 | 6.317500 |
| 21 | 314.00 | 157.00 | 197.82 | 4.817500 |
| 22 | 157.00 | 314.00 | 197.82 | 6.482500 |
| 23 | 157.00 | 314.00 | 226.08 | 5.813750 |
| 24 | 235.50 | 157.00 | 226.08 | 8.638750 |
| 25 | 314.00 | 157.00 | 226.08 | 7.208750 |
| 26 | 157.00 | 235.50 | 197.82 | 4.755000 |
| 27 | 157.00 | 235.50 | 226.08 | 5.546250 |
Publisher’s Note: MDPI stays neutral with regard to jurisdictional claims in published maps and institutional affiliations. |
© 2021 by the authors. Licensee MDPI, Basel, Switzerland. This article is an open access article distributed under the terms and conditions of the Creative Commons Attribution (CC BY) license (https://creativecommons.org/licenses/by/4.0/).
Share and Cite
MDPI and ACS Style
Nariman, N.A.; Hamdia, K.; Ramadan, A.M.; Sadaghian, H. Optimum Design of Flexural Strength and Stiffness for Reinforced Concrete Beams Using Machine Learning. Appl. Sci. 2021, 11, 8762. https://doi.org/10.3390/app11188762
AMA Style
Nariman NA, Hamdia K, Ramadan AM, Sadaghian H. Optimum Design of Flexural Strength and Stiffness for Reinforced Concrete Beams Using Machine Learning. Applied Sciences. 2021; 11(18):8762. https://doi.org/10.3390/app11188762
Chicago/Turabian StyleNariman, Nazim Abdul, Khader Hamdia, Ayad Mohammad Ramadan, and Hamed Sadaghian. 2021. "Optimum Design of Flexural Strength and Stiffness for Reinforced Concrete Beams Using Machine Learning" Applied Sciences 11, no. 18: 8762. https://doi.org/10.3390/app11188762
Note that from the first issue of 2016, this journal uses article numbers instead of page numbers. See further details here.