Article

Experimental Investigation of Concrete Transverse Deformations at Relatively High Loading Rates for Interpretation of High Strength Concrete Behavior

Department of Civil Engineering, Ariel University, Ariel 40700, Israel
*
Author to whom correspondence should be addressed.
Appl. Sci. 2021, 11(18), 8460; https://doi.org/10.3390/app11188460
Submission received: 17 August 2021 / Revised: 6 September 2021 / Accepted: 9 September 2021 / Published: 12 September 2021
(This article belongs to the Topic Advances on Structural Engineering)

Abstract

:
Loading rates affect the behavior of concrete specimens from the beginning of the loading process until failure. At rather high loading rates, longitudinal deformations in concrete specimens under a compressive load are practically elastic up until the ultimate limit state. It has been previously demonstrated that transverse deformations effectively indicate high-strength concrete behavior in the entire static loading process range. A theoretical model for cylindrical concrete specimen failure under compressive load, based on a structural phenomenon, has also been proposed. The aim of the present research is experimental verification of using transverse deformations in addition to longitudinal ones for investigating high-strength concrete behavior at the non-elastic stage. This research is based on testing normal-strength concrete cylindrical specimens under compression at relatively high loading rates. The theoretical model of the cracking and failure scheme of the cylindrical specimens are experimentally confirmed. The obtained results demonstrate that it is possible to use transverse deformations for the interpretation of initiation and development of inelastic deformations in high-strength concrete up to class C90 based on the data for normal-strength concrete specimens of class C30 subjected to relatively high loading rates.

1. Introduction

The transverse deformation analysis of structures is usually limited to obtaining Poisson’s ratio, which is only applicable to the range of elastic concrete behavior. At the same time, for compression, this range can reach half of the concrete strength. Consequently, the elastic compressed concrete stage is an essential part of concrete behavior investigations [1]. However, according to modern design codes, the elastic stage is limited to about 40% of its strength [2,3]. Further concrete behavior is characterized by elastic–plastic deformations, which can be graphically represented by a convex square parabola relative to the deformation’s axis. If instead of a square parabola, a sinusoidal approximation is used, the difference in potential energy is about 7% [4].
The relationship between stresses ( σ c ) and strains ( ε c ) in compressed concrete is characterized by the following three parts [1]:
A linear part from 0 to 0.5 f c k , where f c k is concrete strength;
A convex parabolic part bound by f c k ;
A descending branch.
Deformations range from 0 to 0.5‰, from 0.5 to 2‰, and from 2 to 3.5‰ in the first, second, and third parts, respectively.
This relationship was proposed to describe the behavior of normal-strength concrete (NSC) up to class C60. High-strength concrete (HSC) represents classes C70–C90 [2] and exhibits mainly elastic behavior with weakly expressed elastic–plastic deformations [5]. For the more accurate identification of HSC non-elastic deformations, the use of transverse deformation graphs of the compressed specimens was proposed [6].
At the same time, an additional important factor affecting compressed concrete behavior is the specimen’s loading rate [7,8,9]. The loading rate used in the present research was selected according to standard requirements of modern codes. Following [10], it is recommended to load a concrete specimen at a rate within (0.2 ... 1.0) MPa/s; according to [11], the recommended rate is (0.25 ± 0.05) MPa/s. However, at such loading rates, longitudinal deformations, even for NSC, mainly exhibit elastic behavior [7,8,9].
Twenty-two cylindrical NSC specimens were tested under uniaxial loading [7]. The specimen diameters were between 10 and 80 cm, and their heights were from 20 to 320 cm (which corresponds to a real column length). The specimens were loaded at a rate of about 0.1 MPa/s. The obtained σ c vs. ε c relationships, when σ c was the compressed concrete stresses and ε c was the longitudinal deformations, were characterized by an almost linear performance up until specimen failure. Similar results were obtained for uniaxial loaded 15 × 30 cm cylindrical specimens made of steel fibered reinforced concrete with a strength of 27.6 MPa [8]. In this case, the loading rate was 1.3 mm/min (which corresponds to about 0.1 MPa/s). Comparable results were obtained for twenty-six cylindrical NSC specimens loaded at a rate of (0.25 ± 0.05) MPa/s [9].
It was shown that in certain cases, particularly in steel-fibered high-strength concrete (SFHSC), transverse deformations efficiently indicate elastic–plastic concrete behavior, which is less pronounced when longitudinal deformations are used [6]. A corresponding theoretical model for the type of transverse cracks and their development as well as a consequent scheme for specimen failure was proposed. Following this concept, the transverse crack development process can be divided into three stages:
Linear specimen behavior;
Nonlinear specimen behavior;
Ultimate limit state (ULS).
The first stage continues until the initiation of cracks ( ε t r a n s ε c t   u l ), where ε t r a n s is the transverse deformation value, and ε c t   u l is the ultimate elastic transverse deformation. At this stage, the cylindrical specimen’s cross section is nondamaged and has an original circular shape. The second stage begins from the initiation of cracks, corresponding to ε c t   u l , and continues until a twofold ultimate elastic transverse deformations value ( ε c t   u l < ε t r a n s 2 ε c t   u l ) is reached. In this case, it is assumed that the specimen’s cross section has an inner circular part (unbroken core) and several outer wedge-shaped segments separated by transverse cracks. The last stage corresponds to transverse deformations that exceed 2 ε c t   u l . Similar concrete and mortar cylindrical specimen failure patterns were also obtained under cyclic uniaxial compression [12].
The present research is focused on the experimental verification of the proposed theoretical model based on the dependence of transverse deformations on longitudinal ones. With this aim, cylindrical NSC specimens were tested, and transverse deformations were analyzed. The specimens were tested at a loading rate of 0.2   MPa / s . Longitudinal and transverse deformations were measured and recorded simultaneously.
The obtained experimental results were further evaluated from the point of view of confirming the principles of the structural phenomenon [13] (a brief description of this phenomenon is given in the following sub-section).

The Essence of the Structural Phenomenon

The structural phenomenon was proposed as a result of an extensive experimental and theoretical database analysis related to concrete structures [13]. The essence of the phenomenon is that structural parameters in elastic state increase or decrease twice at failure. This behavior usually occurs for symmetrical structures under symmetrical loading. The phenomenon has been proven at the material level and is also valid for reinforced concrete structures subjected to static and dynamic loads.
The structural phenomenon is based on two theories: the quasi-isotropic state of a structure at the ultimate limit state (ULS) [14] and the mini-max principle [15]. Theoretical and experimental confirmation of the phenomenon is obtained for different structure types, such as beams, frames, spatial structures, and structural joints. The structural phenomenon allows additional equation(s) for calculating structural parameters to be obtained. This, in turn, can lead to the development of efficient methods for structural analysis that allow using less empirical coefficients in design procedures.

2. Research Aims

A method for analyzing the weakly expressed inelastic behavior of HSC using compressed NSC subjected to relatively high loading rates is investigated in this study. Since longitudinal inelastic deformations in compressed HSC specimens are practically not manifested, transverse deformations can be used for concrete inelastic behavior analysis [6]. The value of these deformations is approximately five times less than that of the longitudinal ones (Poisson’s ratio is approximately equal to 0.2). However, it also does not provide a good solution for the HSC problem since the initiation of longitudinal cracks caused by transverse deformations practically coincides with specimen failure.
For this reason, another solution is considered in this paper. As mentioned above, NSC behaves elastically almost until failure at rather high loading rates, as does HSC. However, maximal longitudinal deformations in NSC are almost two times higher than in HSC. At the same time, concrete tensile strength practically does not grow when the concrete class increases to over C70. Therefore, transverse deformation development in NSC is much more significant than in HSC, which leads, in turn, to the longitudinal crack development that determines inelastic concrete behavior in the transverse direction of a specimen. Thus, NSC subjected to relatively high loading rates can be considered as a model of HSC behavior at normal loading rates based on transverse deformation analysis.
The main purpose of this research is to investigate transverse deformation development in a concrete specimen under axial compression throughout the entire concrete behavior range until failure. The influence of transverse deformations on the nature of crack development and the specimen failure pattern is also considered based on the structural phenomenon [13]. For this purpose, transverse deformation dependence on longitudinal deformations is investigated throughout the entire loading process, from the beginning of loading until failure.
The objectives of this study are:
Detailed analysis of the elastic–plastic behavior of cylindrical NSC specimens and revealing the advantages of using transverse deformations as one of the main features of compressed concrete behavior;
Analysis of the nature of specimen failure based on transverse crack development;
Verification of a theoretical model of the specimen’s upper surface failure pattern [6] based on the structural phenomenon;
Confirming that the unbroken cylindrical core area is twice as small as the initial one;
Checking the possibility of interpreting HSC behavior using relatively high NSC specimen loading rates.

3. Experimental Program

3.1. Testing Stages

In the framework of the present study, the first three 15 × 15 × 15 cm cubic specimens were tested to obtain the concrete strength. Measuring equipment suitability was preliminarily verified by applying step loading and unloading to three 15 × 30 cm cylindrical specimens. For this reason, ten load steps were selected (each load step was 40 kN). After that, two test series were conducted to analyze elastic–plastic behavior of 15 × 30 cm cylindrical specimens under a constant loading rate of 0.2 MPa/s. The first and the second test series included four and three specimens, marked as Sp1.1, Sp1.2, Sp1.3, Sp1.4 and Sp2.1, Sp2.2, Sp2.3, respectively.

3.2. Material Properties

Concrete proportioning was based on the absolute volumes method [16]. The following materials were used to prepare the concrete mixture:
A locally produced composite 42.5N CEM II/B-LL Portland cement [17] with portions of limestone between 21 and 35%;
A locally available quarry sand fraction of 0 to 4.75 mm;
A locally available quarry crushed dolomite limestone coarse aggregate fraction of 19/14 according to SI 3-1998 [18].
Basic properties of the concrete components are presented in Table 1. The final composition is given in Table 2. The concrete mixture was prepared using a 0.045 m3 rotating pan mixer when the calculated mixture volume was 0.043 m3. Dried aggregates were used for all of the mixtures.

3.3. Concrete Mixture and Specimen Preparation

The concrete mixture was prepared according to ASTM C192/C192M [19]. Cubic and cylindrical specimens were cast. Internal and external vibrations were used to compact the fresh concrete in cylindrical and cubical molds, respectively. All of the specimens were removed from the molds 24 h after casting and were cured for 27 days at constant a 23 ± 2   ° C temperature and at a relative humidity of 95 ± 5 % .

3.4. Motivation for Selecting the Cylindrical Specimens

The cylindrical specimens are obviously more suitable to achieve the research goals because there is no local stress concentration problem as is the case, for example, in the corners of the prismatic ones. Additionally, cylindrical specimens are characterized by uniform deformation development along the entire perimeter of the specimen section. Thus, the edge effect problem is avoided in the tests.
The ratio between the diameter and the height of the concrete cylindrical specimen was 1:2 (15:30 cm). This ratio allows the modeling of real full-scale compressed structural element behavior. Additionally, the chosen ratio guarantees the presence of a relatively large unrestrained area in the middle of the specimen’s height [20]. In this case, the element buckling problem is practically prevented. At the same time, due to some inaccuracy in the transmission of external compressive forces and concrete heterogeneity, additional stresses associated with small (technological) eccentricities may appear. This problem was solved by selecting a proper test setup.

3.5. Test Setup

The measurement system was selected according to the following main behavioral features of a specimen that needed to be obtained:
Loading force;
Longitudinal deformations;
Transverse deformations.
To conduct the axial compression test, the class 1 testing machine (with a maximum error of 1% FS) and a maximum load of 3000 kN, which was controlled by a PC-unit, was used. The applied load was measured by an external pressure sensor, which had been installed in the oil line of the testing machine.
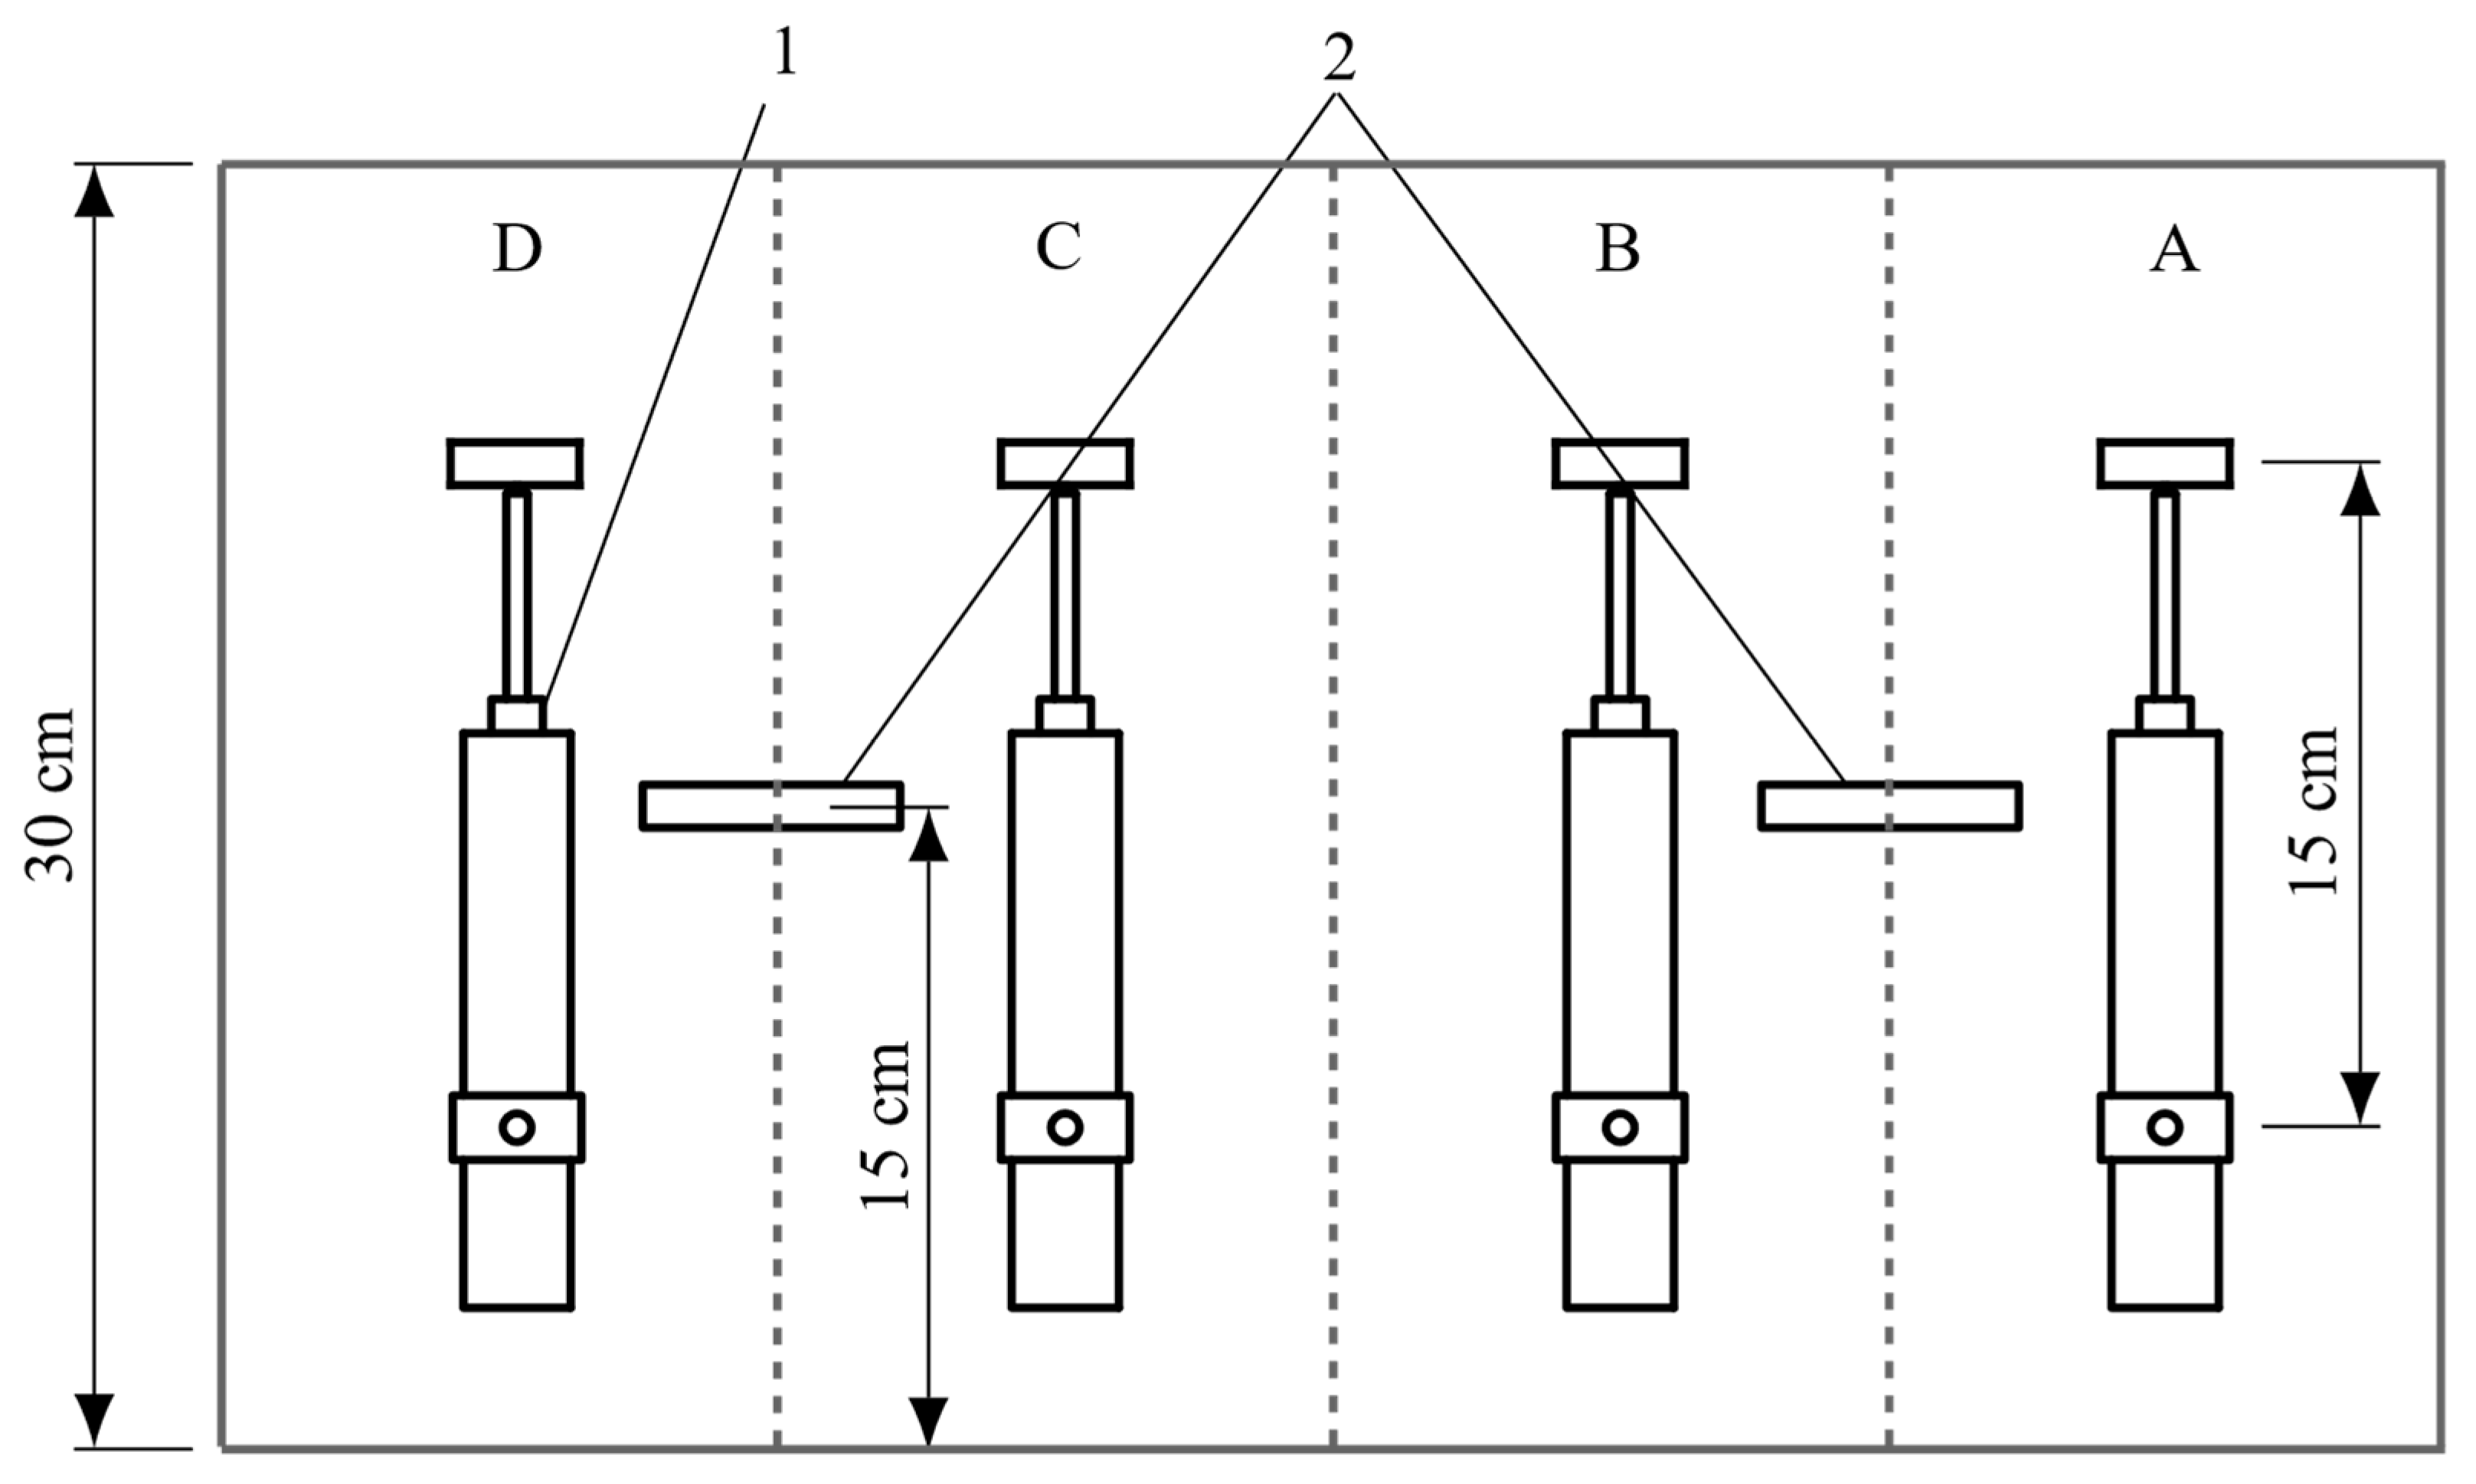
Four linear displacement transducers (LDT) with a 50-mm stroke and a high-measure resolution ( < 1   µ m ) were used to measure the longitudinal deformations. The sensors were located in the specimen’s central zone in order to exclude the influence of the edge effect associated with the friction forces occurring at the contact area between the specimen and the testing machine plates. The base of the longitudinal deformation measurement was 15 cm. The upper view of the tested specimen and the measurement devices was given in Figure 1. Figure 2 shows the location of the devices on the specimen’s surface development.
As mentioned above, there was a technological eccentricity problem caused by inaccuracy in the applied force transmission. This problem was solved by using four sensors located on the tested specimen’s opposite sides (see Figure 1). Such sensor distribution allowed more accurate data to be obtained that revealed the presence of eccentricity in stress distribution. The LDT sensors were attached by originally developed mounts, allowing independent deformation transfer to each sensor.
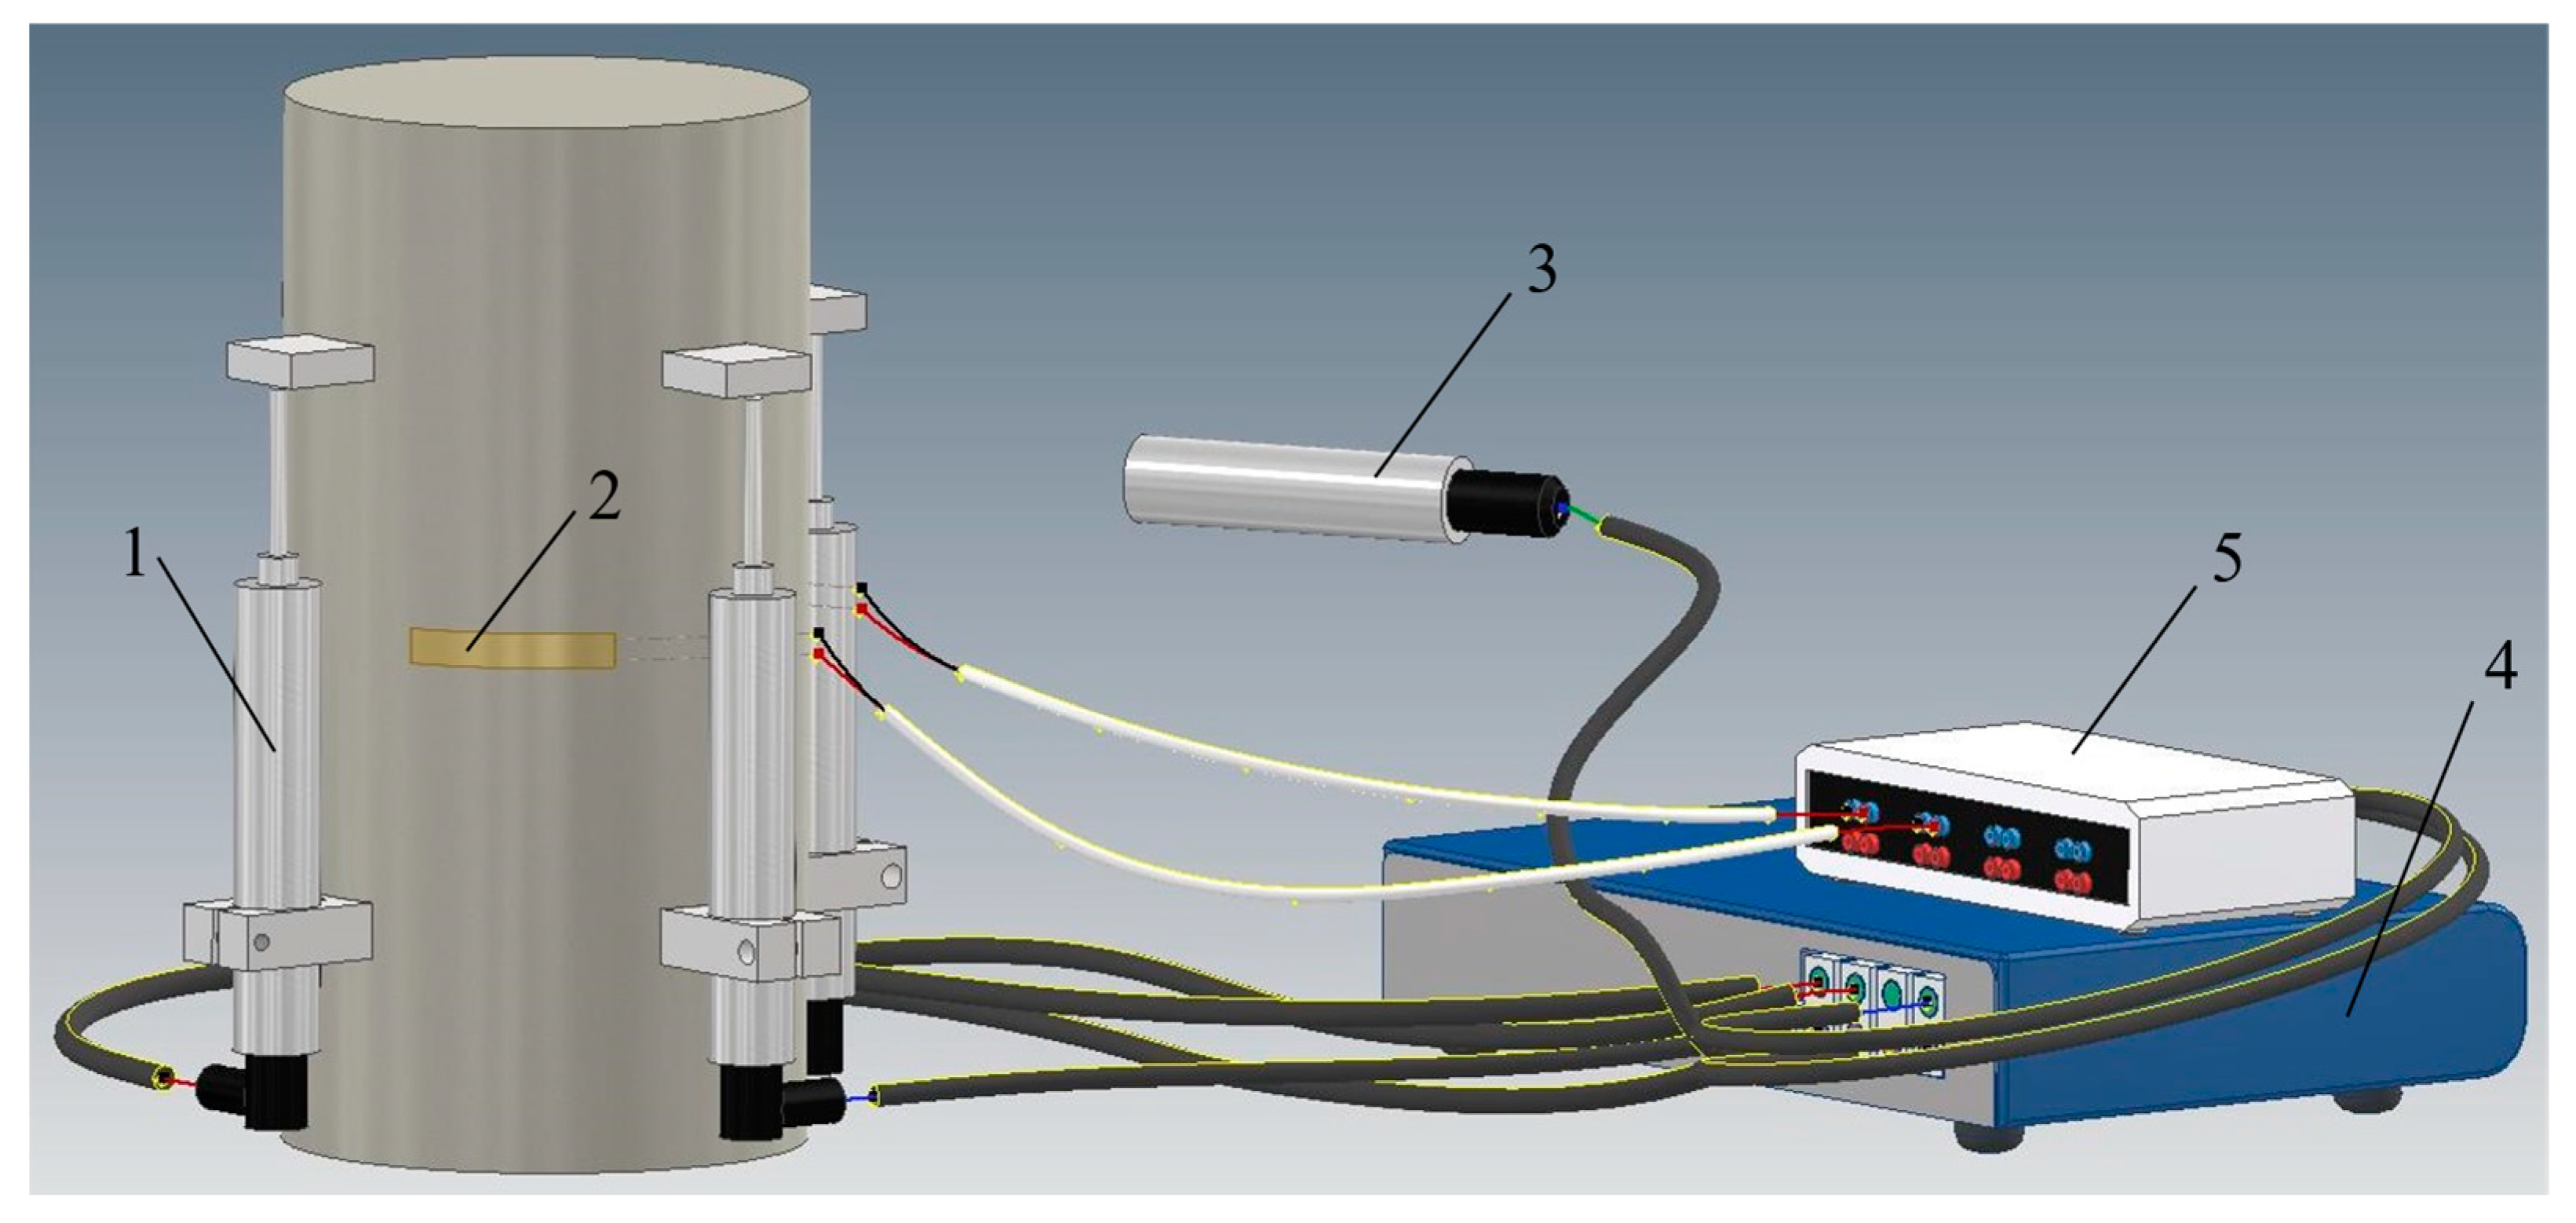
Two strain-gauges (SG) with a 60 mm basis, a measure resolution up to 0.1 micro-strains, a resistance of 120 Ohm, and a gauge factor of 2.07 were used to measure the transverse deformations. The SG length was chosen based on the requirement of exceeding the coarse aggregate maximum dimensions by at least three times [21]. The general view of the test setup is presented in Figure 3.
A thin layer of sifted fine grain sand was used to level the upper surface of the cylindrical specimens. It also allowed for a reduction in the friction effect between the testing machine plate and the specimens.

4. Experimental Results and Discussion

4.1. Evaluation of Concrete Parameters in the Elastic State

The experimentally obtained dependences between the longitudinal deformations and the stresses in uniaxially loaded cylindrical concrete specimens, which were tested in the first test series, are presented in Figure 4. As evident from this figure, the dependences are close to linear and allow for the disclosure of the concrete’s ultimate elastic deformations and its modulus of elasticity.
The dependences of the transverse deformations on stresses are shown in Figure 5. These dependences enable the concrete’s Poisson’s ratio as well as the pattern of inelastic concrete deformation development (which cannot be done using only longitudinal deformations) to be obtained. It should be mentioned that this possibility becomes available when the transverse deformations exceed the Poisson’s ratio validity range, i.e., after the initiation of longitudinal cracks, when ε t r a n s > ε c t   u l .
Following Figure 5, the tested specimens exhibited elastic behavior in the transverse direction up until about 70% of the concrete strength (concrete specimen strength ranges from 20.9 to 28.2 MPa). For example, the concrete strength of Sp1.1 is equal to 24 Mpa, and the strength value corresponding to the elastic stage reaches 17 MPa, which is about 70% of the specimen strength. Further, transverse deformations grow in a nonlinear manner, which indicates the development of inelastic deformations that are not evident in the longitudinal direction (see Figure 4). The experimental results are summarized in Table 3.
The obtained experimental data correspond to those available in Eurocode 2 [2]. A comparison of the known Poisson ratios data [6] is presented in Table 4. As evident from this table, the Poisson’s ratios for all of the tested specimens are close to the known results.
It should be also noted that according to the previously proposed theoretical model [1], the maximum elastic longitudinal deformations are within 0.5‰, and the ultimate elastic deformations are equal to 1‰, which is also confirmed by the obtained experimental data.
The data obtained in the second test series show the similar tendencies in the behavior of the specimens and confirms the previously presented results (Figure 6 and Figure 7).

4.2. Evaluation of Cylindrical Specimen Behavior in the Inelastic State

Following modern design codes [2,3], Poisson’s ratio determines concrete behavior in the transverse direction. At the same time, based on the experimental results obtained in the framework of the present study, it is very important to consider the transverse deformations over the range of the Poisson’s ratios. With this aim, the dependence of the transverse deformations on longitudinal ones was analyzed. The relationship between these deformations for the first test series is shown in Figure 8. As evident from this figure, the dependence is nonlinear in the interval when ε t r a n s > ε c t   u l (see Table 3).
Table 5 presents the values of the Poisson’s ratios as well as the relationship between the maximum transverse, ε t r a n s 1 , and longitudinal deformations, ε c 1 , at ULS. Following this table, the average ratio between these two parameters and the Poisson’s ratio, ε t r a n s 1 / ε c 1 ν , is about 1.8. It should be noted that, in accordance with the structural phenomenon [13], this value should be close to 2 [6]. The difference between the obtained experimental and theoretical results is about 10%, which is explained by concrete heterogeneity and the probable technological eccentricity that was described above.
The dependence between ε t r a n s / ε c and the longitudinal deformations, ε c , is shown in Figure 9. This dependence is an additional tool that demonstrates the correspondence of concrete behavior with the previously developed theoretical model [6]. Following Figure 9, the value of ε t r a n s / ε c increases very slowly, increasing approximately up to ε c = 0.9   , and then a sharp increase in this ratio is evident. This confirms that concrete behavior in this area is inelastic and corresponds to the theoretical model. According to this model, the ultimate elastic concrete behavior is limited by a longitudinal strain value of 1.0‰, which correlates with the experimental value of 0.9‰. At the longitudinal crack development stage caused by transverse deformations, the ratio ε t r a n s / ε c tends to be 0.4‰, which is approximately twice as high as it is in the elastic stage. This statement corresponds to the structural phenomenon [13].

4.3. Analysis of Specimen Failure Progress Caused by Transverse Deformations

To analyze the entire process of longitudinal crack development, frame by frame images were used (Figure 10). According to [6], this process is divided into three stages. In the first stage, the concrete is exposed to tension until the initiation of longitudinal cracks, when ε t r a n s ε c t   u l (Figure 10a), where, according to the results presented in Table 3, the average value of ε c t   u l for three the specimens is equal to 0.095‰. In the second stage, when ε c t   u l < ε t r a n s 2 ε c t   u l (that is, transverse deformations develop until they reach a value of about 0.2 ‰ (Figure 5)), there is the process of longitudinal crack initiation and development (as shown in Figure 10b). At the selected loading rate, this stage continues for about 6 seconds. The crack propagation process ends with specimen failure, when ε t r a n s > 2 ε c t   u l (Figure 10c). The obtained longitudinal crack development pattern corresponds to the deformation process and failure in the columns. For example, a similar behavior in the reinforced concrete columns of residential building was observed during the Mexico earthquake in 2017 [6].
Crack propagation in the specimens occurs parallel to the compressive force direction that proves deformation development in the transverse direction, which is caused only by pure tension due to the cylindrical form of the specimens. As a result, the longitudinal crack development process in specimens leads to their separation into several vertical wedge-shaped segments and an unbroken circular inner core, which was theoretically predicted earlier [6].
The following important investigation step is to analyze the specimen failure type after unloading (Figure 11). Following the structural phenomenon [13], it can be theoretically predicted that the cross-section area of the destroyed specimens is approximately half that of the initial one. Experimental studies confirmed this prediction for all of the tested specimens. The area of the inner core A and of the outer segments B were formed on the upper surface of all of specimens at failure (see Figure 11).
The ratios between the entire cross-section area of the specimens (A + B) and that of the inner core A are presented in Table 6. The obtained data show that the average ratio is close to 2, which confirms the structural phenomenon [13].
Thus, the typical failure pattern of a compressed concrete specimen is presented in Figure 12.

4.4. Correspondence of the Obtained Experimental Results to the Available Data

Eight cylindrical NSC specimens with a height-to-diameter ratio equal to 2 were tested under uniaxial loading [7]. Diameters of the specimens differed from 10 to 80 cm. The presented data report crack development in the vertical direction and the formation of an unbroken circular inner core that corresponds to the failure pattern described in this paper (see Figure 2: 20-40-02 and 40-80-02 [7]). Additionally, all of the specimens demonstrate elastic behavior in the longitudinal direction practically until failure, regardless of the size difference (see Figure 3 [7]).
Thirty-three 15 × 30 cm fibered-concrete cylindrical specimens with a minimum 28-day concrete compressive strength of 27.6 MPa were uniaxially loaded. The typical failure pattern with vertical longitudinal cracks is presented in Figure 8 [8]. The obtained stress–longitudinal strain relationships for compressed concrete specimens are linear, almost until peak load [8]. Thus, it should be mentioned that the results obtained for concrete mixes with different amounts and types of fiber correspond to the results obtained in this paper for NSC specimens.
Six cylindrical NSC specimens with different end conditions were subjected to uniaxial compression [9]. In this case, transverse deformations were additionally measured. The obtained data show a good convergence with the present research results. The stress–longitudinal strain relationships are linear until failure when the stress–transverse strain relationships have well pronounced non-elastic behavior until a peak load (see Figure 2 and Figure 3 [9]). The earlier described failure pattern is obtained for specimens with reduced friction conditions (see Figure 5 [9]).
Thus, the results presented for 47 specimens [7,8,9] correspond to the data obtained by testing 7 specimens within the framework of the present research. This, in turn, significantly increases the reliability of the obtained results.

5. Comparison of the Results Obtained for NSC with Available Data for HSC

Based on the data obtained in the framework of the present study (see Section 4), the behavior of NSC, which corresponds to class C30 at relatively high loading rates, can be compared with that of HSC, which is described in [
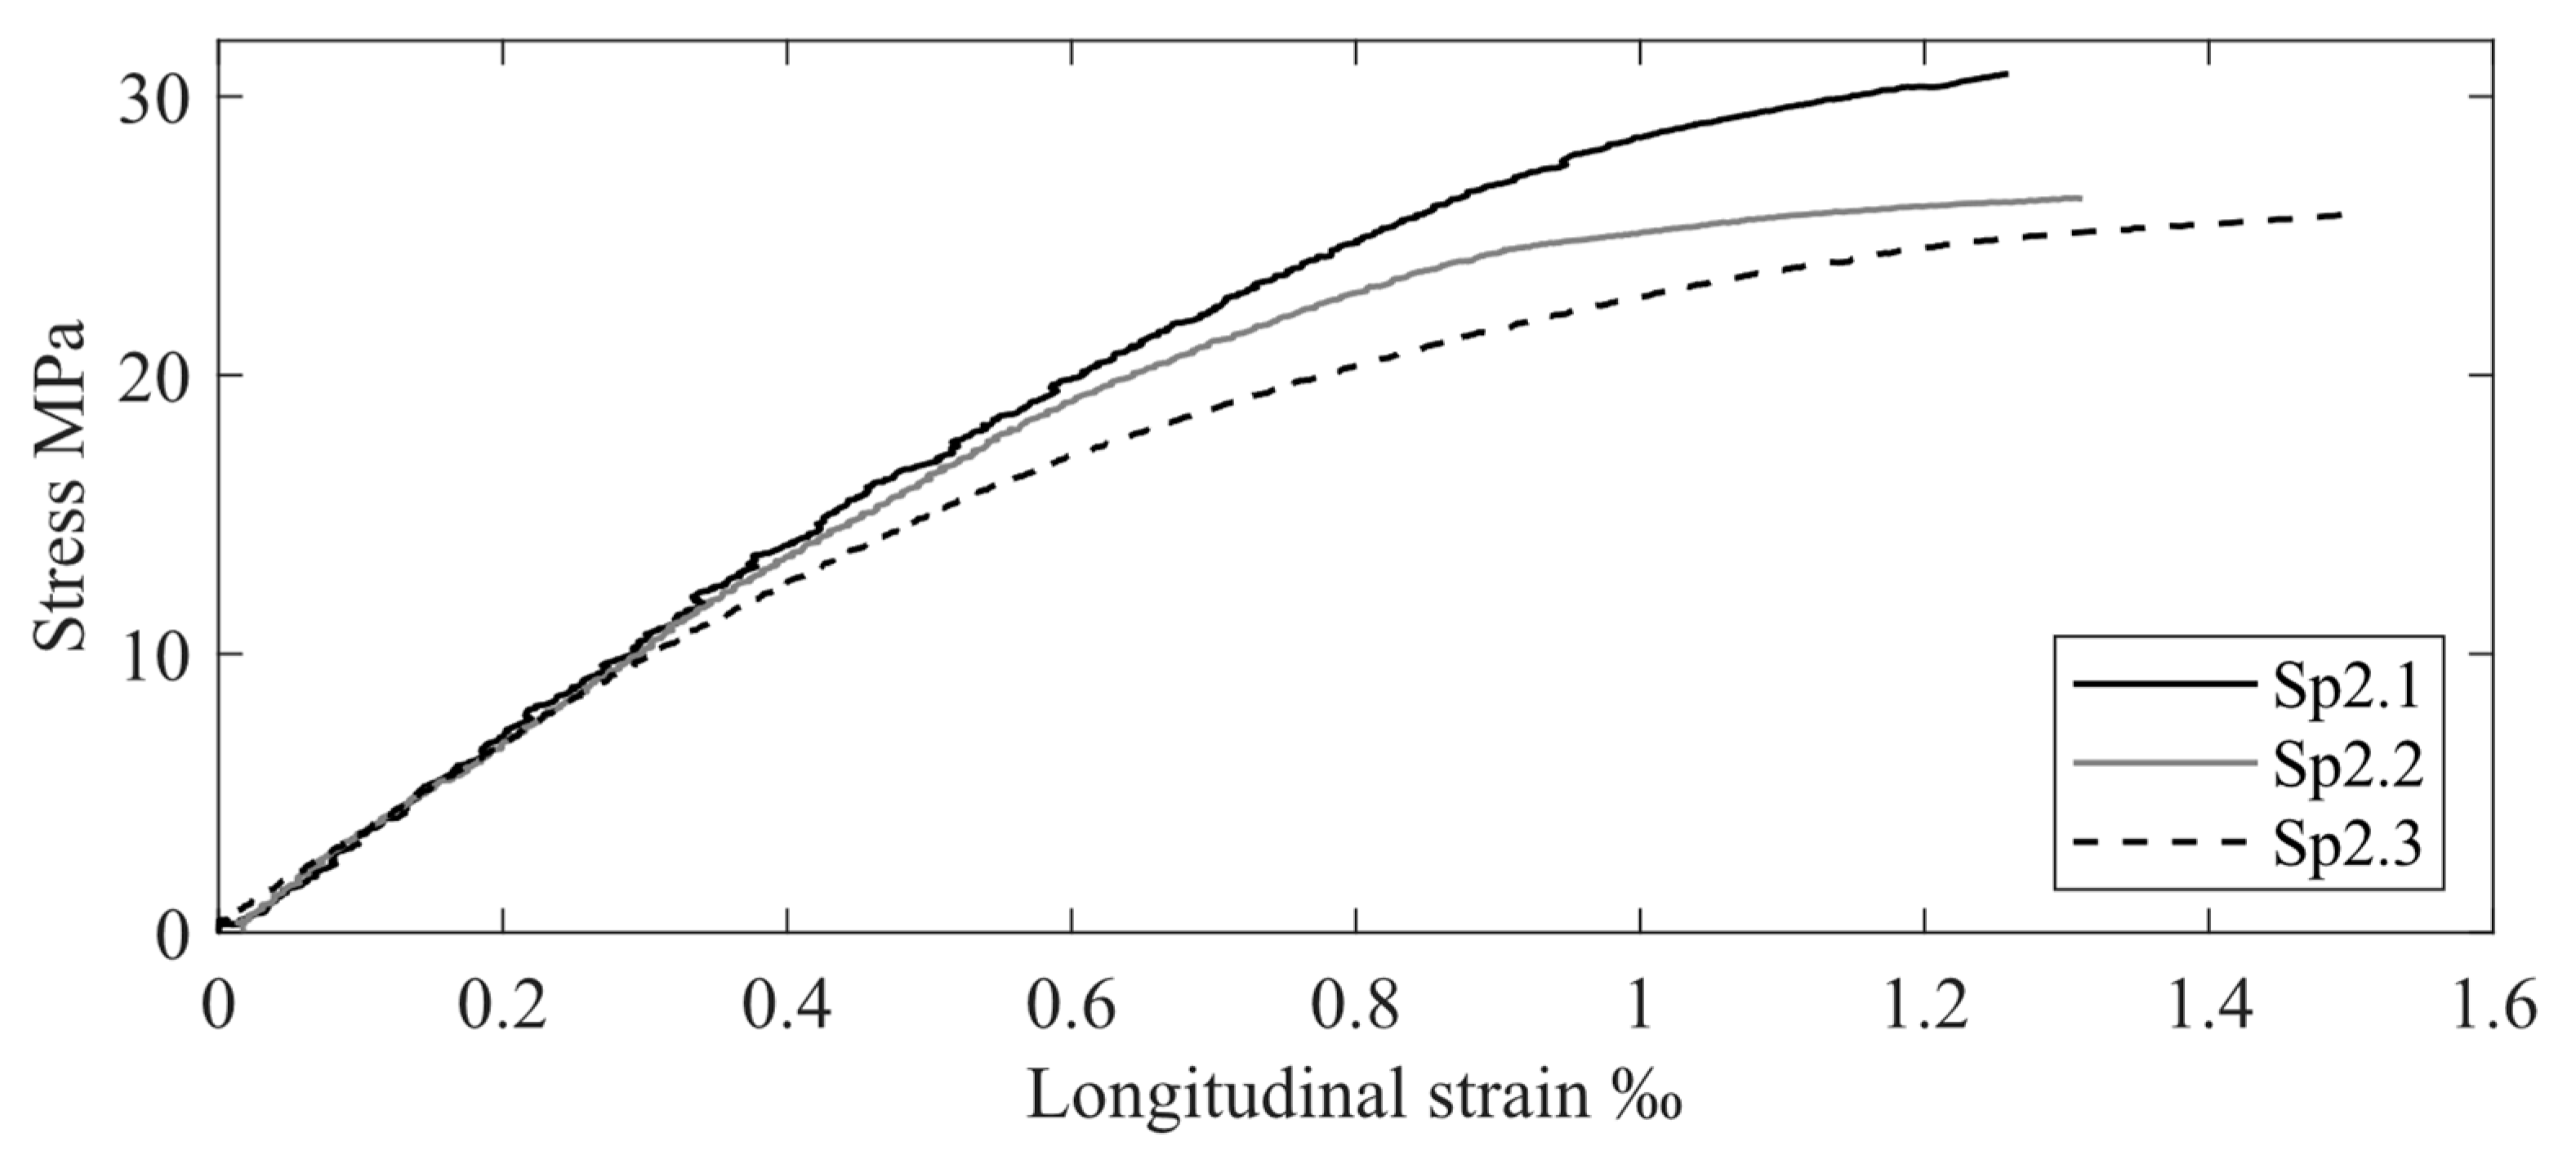
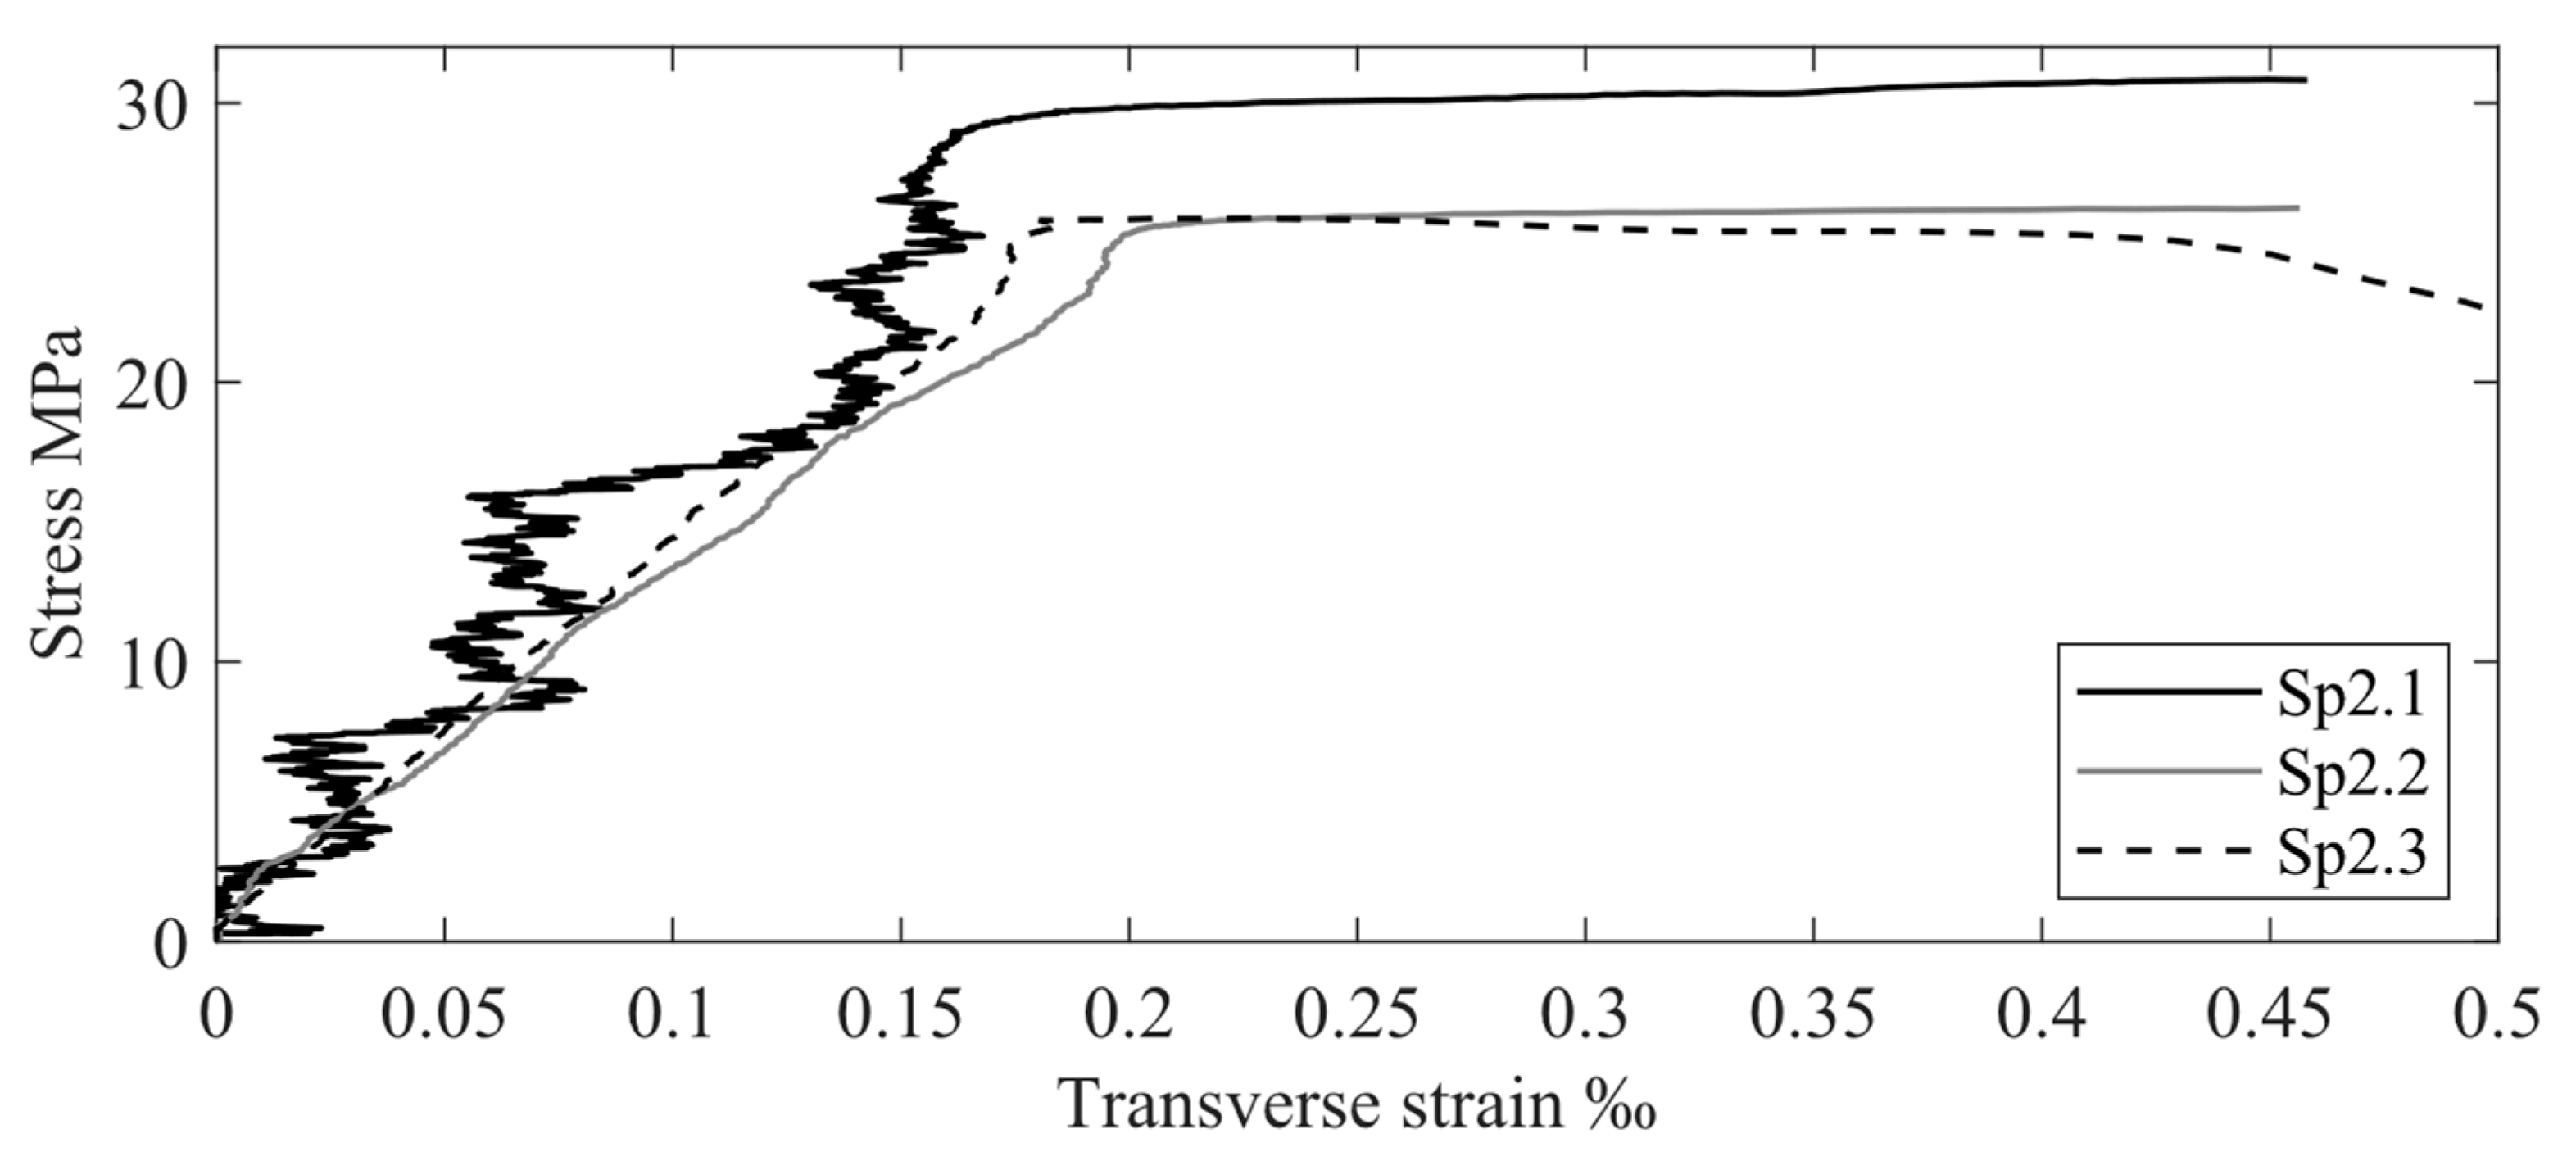
6]. The available data on HSC (class C90) includes the test results for three cylindrical specimens. Longitudinal deformations were measured using linear variable displacement transducers (LVDT) and transverse deformations measured by strain gauges. The dependences of these two types of deformations on stresses under uniaxial load are shown in Figure 13 and Figure 14, respectively. Corresponding data for the comparison of the elastic and nonelastic behavior of HSC and NSC are provided in Table 7 and Table 8.
The limit transverse deformation of the HSC specimens corresponding to concrete elastic behavior is 0.15 ‰. In this case, the external load value is approximately half of the concrete strength, which corresponds to the structural phenomenon [13]. The average Poisson’s ratio value is equal to 0.18. Further load increases are accompanied by the linear development of longitudinal deformations (Figure 13), while the transverse deformations begin to exhibit elastic–plastic behavior (
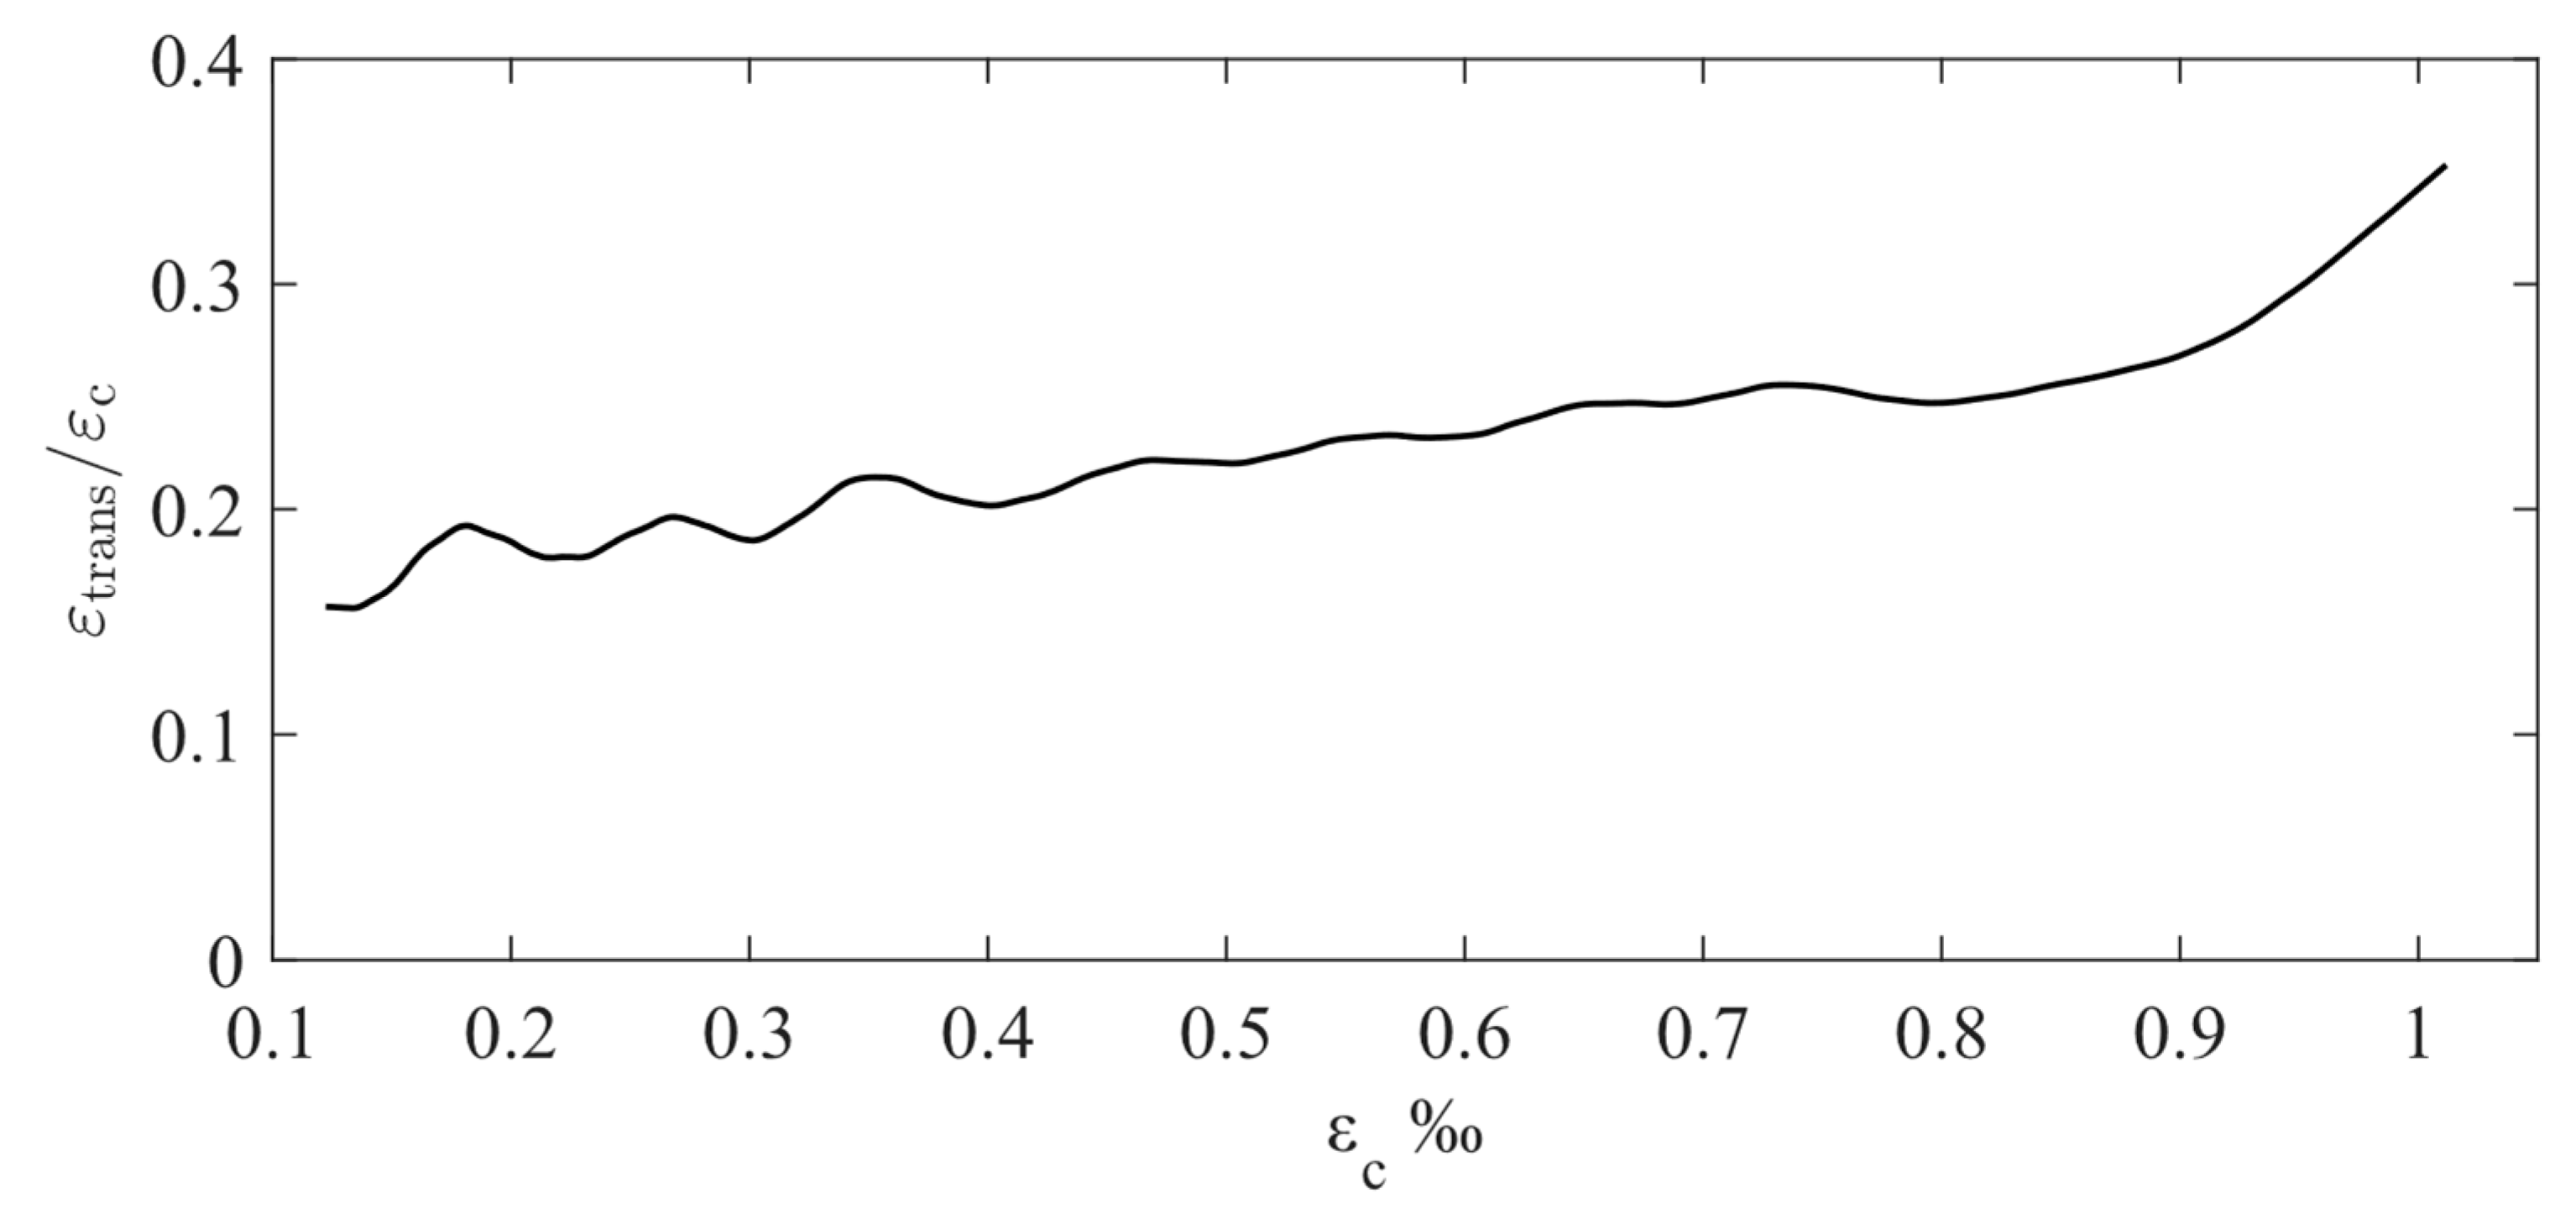
Figure 14). Therefore, it is logical to analyze the ratio between the longitudinal and transverse deformations for further interpretation of the HSC behavior. Following Table 8, at ULS, this ratio is equal to 0.31, which is close to the results obtained in the frame of the present study (see Table 5). It should be mentioned that the relative transverse deformation growth, ε t r a n s 1 / ε c 1 ν , in both cases (for HSC and NSC) is equal to about 1.7.
A comparison of the results obtained for the NSC and HSC (Table 5 and Table 8) shows sufficient convergence of the standard deviations and the coefficients of variation for Poisson’s coefficient and ε t r a n s 1 / ε c 1 . The standard deviations are 0.024 and 0.031 and the coefficients of variation are 13.7% and 10.1% for Poisson’s coefficient and ε t r a n s 1 / ε c 1 , respectively. Thus, the obtained data confirm that it is possible to use experimental results for NSC specimens obtained at rather a high loading rate for the interpretation of HSC behavior. This, in turn, allows for the disclosure of the presence of the non-elastic behavior stage in compressed HSC, which is important for developing proper and effective design approaches.

6. Conclusions

The importance of this research is attributable to the fact that the inelastic behavior of compressed high-strength concrete specimens is practically not pronounced in longitudinal deformations and therefore is not even analyzed. Consequently, high-strength concrete is considered to be a pure brittle material, which significantly limits its applications, especially under dynamic loads. For this reason, the experimental investigation of normal strength concrete at relatively high loading rates was conducted in order to prove the effectiveness of using transverse deformations as an indicator for the interpretation of high-strength concrete behavior.
The obtained experimental results and their comparison with high-strength concrete specimen behavior showed good convergence of such parameters such as Poisson’s ratio and the ratio of transverse to longitudinal deformations in the inelastic stage of concrete behavior. The proposed theoretical failure pattern for compressed cylindrical concrete specimens, which includes an unbroken circular core surrounded by separate vertical wedge-shaped elements, was also experimentally confirmed. Additionally, the ratio between the initial specimen’s cross-section area and the destroyed one was obtained as approximately equal to 2, which corresponds to the structural phenomenon.
Thus, the approach of using transverse deformations for analyzing concrete performance proves that from the viewpoint of transverse deformations, high-strength concrete behaves inelastically and not as a brittle material. In our opinion, further investigation of this phenomenon can form a basis for the more accurate and effective design of high-strength concrete structures.

Author Contributions

Conceptualization, I.I.; methodology, I.I.; I.F. and Y.R.; validation, I.I.; I.F. and Y.R.; investigation, I.F., I.I., and Y.R.; resources, I.I. and Y.R.; data curation, I.F., I.I., and Y.R.; formal analysis, I.F.; writing—original draft preparation, I.F., I.I., and Y.R.; writing—review and editing, I.I., I.F., and Y.R. All authors have read and agreed to the published version of the manuscript.

Funding

This research received no external funding.

Acknowledgments

This research was conducted with the assistance of the Center for Integration in Science, Ministry of Aliyah and Integration, the State of Israel.

Conflicts of Interest

The authors declare no conflict of interest.

References

  1. Iskhakov, I.; Ribakov, Y. Theoretical Stress-Strain Model for Compressed Composite Cement Materials. In Transaction High Performance and Optimum Design of Structures and Materials III; de Wilde, W.P., Hernández, S., Kravanja, S., Eds.; WIT Transactions on the Built Environment: Southampton, UK, 2018; Volume 175, pp. 9–16. [Google Scholar]
  2. British Standards Institution. EN 1992-1-1: Eurocode 2: Design of Concrete Structures-Part 1-1: General Rules and Rules for Buildings; British Standards Institution: London, UK, 2004. [Google Scholar]
  3. The Standards Institution of Israel. SI 466 Part 1: Concrete Code: General Principles; The Standards Institution of Israel: Tel Aviv, Israel, 2017. [Google Scholar]
  4. Iskhakov, I. Concrete Structures 1 (Selected Topics and Exercises); Academic College of Judea and Samaria: Ariel, Israel, 2002. (In Hebrew) [Google Scholar]
  5. Holschemacher, K.; Iskhakov, I.; Ribakov, Y. Laboratory Tests of Two-Layer Beams Consisting of Normal and Fibered High Strength Concrete: Ductility and Technological Aspects. Mech. Adv. Mater. Struct. 2012, 19, 513–522. [Google Scholar] [CrossRef]
  6. Iskhakov, I.; Ribakov, Y. Transverse Deformations and Structural Phenomenon as Indicators of Steel Fibred High-Strength Concrete Nonlinear Behavior. Adv. Mater. Sci. Eng. 2019, 2019, 9147849. [Google Scholar] [CrossRef] [Green Version]
  7. Muciaccia, G.; Rosati, G.; Luzio, G.D. Compressive Failure and Size Effect in Plain Concrete Cylindrical Specimens. Constr. Build. Mater. 2017, 137, 185–194. [Google Scholar] [CrossRef]
  8. Shi, X.; Park, P.; Rew, Y.; Huang, K.; Sim, C. Constitutive Behaviors of Steel Fiber Reinforced Concrete Under Uniaxial Compression and Tension. Constr. Build. Mater. 2020, 233, 15. [Google Scholar] [CrossRef]
  9. Roddenberry, M.; Kampmann, R.; Ansley, M.H.; Bouchard, N.; Ping, W.V. Failure Behavior of Concrete Cylinders under Different End Conditions. ACI Mater. J. 2011, 108, 79–87. [Google Scholar]
  10. The Standards Institution of Israel. SI 26 Part 5: Methods of Testing Concrete: Properties of Hardened Concrete Other than Strength; The Standards Institution of Israel: Tel Aviv, Israel, 1995. [Google Scholar]
  11. ASTM International. ASTM C39/C39M-20: Standard Test Method for Compressive Strength of Cylindrical Concrete Specimens; ASTM International: West Conshohocken, PA, USA, 2020. [Google Scholar]
  12. Zhou, M.; Liao, J.; An, L.; Deng, W.; Hassanein, M.F.; Yu, Z. Analysis of Stress-Induced Cracks in Concrete and Mortar under Cyclic Uniaxial Compression. Constr. Build. Mater. 2018, 187, 652–664. [Google Scholar] [CrossRef]
  13. Iskhakov, I.; Ribakov, Y. Structural Phenomenon of Cement-Based Composite Elements in Ultimate Limit State. Adv. Mater. Sci. Eng. 2016, 2016, 4710752. [Google Scholar] [CrossRef] [Green Version]
  14. Iskhakov, I. Quasi-isotropic ideally elastic-plastic model for calculation of RC elements without empirical coefficients. Struct. Eng. Mech. Comput. 2001, 1, 367–374. [Google Scholar]
  15. Iskhakov, I.; Ribakov, Y. Ultimate Equilibrium of RC Structures Using Mini-Max Principle; Nova Science Publishers: Hauppauge, NY, USA, 2014. [Google Scholar]
  16. ACI. ACI 211.1-91: Standard Practice for Selecting Proportions for Normal, Heavyweight, and Mass Concrete; ACI: Farmington Hills, MI, USA, 1991. [Google Scholar]
  17. CEN. EN 197-1:2011-11: Cement-Part 1: Composition, Specifications and Conformity Criteria for Common Cements; CEN: Brussels, Belgium, 2011. [Google Scholar]
  18. The Standards Institution of Israel. SI 3: Mineral Aggregates from Natural Sources; The Standards Institution of Israel: Tel Aviv, Israel, 1998. [Google Scholar]
  19. ASTM International. ASTM C192/C192M-19: Standard Practice for Making and Curing Concrete Test Specimens in the Laboratory; ASTM International: West Conshohocken, PA, USA, 2019. [Google Scholar]
  20. Van Mier, J.G.M.; Shah, S.P.; Arnaud, M.; Balayssac, J.P.; Bascoul, A.; Choi, S.; Dasenbrock, D.; Ferrara, G.; French, C.; Gobbi, M.E.; et al. Strain-Softening of Concrete in Uniaxial Compression—Report of the Round-Robin Test carried out by RILEM TC 148-SSC. Mater. Struct. 1997, 30, 195–209. [Google Scholar] [CrossRef]
  21. Hanson, N.W.; Kurvits, O.A. Instrumentation for Structural Testing; PCA Development Bulletin D91. J. PCA Res. Dev. Lab. 1965, 7, 24–38. [Google Scholar]
  22. Bondarenko, V.M.; Suvorkin, D.G. Reinforced Concrete and Stone Structures; Vysshaya Shkola: Moscow, Russia, 1987. (In Russian) [Google Scholar]
  23. NIIZHB. BR 52-101-2003: Non-Pre-Stressed Concrete and Reinforced Concrete Structures; NIIZHB: Moscow, Russia, 2004. (In Russian) [Google Scholar]
  24. Iskhakov, I. Plastic Energy Dissipation, Ductility and Load-Carrying Capacity of RC Elements; ALFA Publishing: Tel Aviv, Israel, 2012. (In Hebrew) [Google Scholar]
Figure 1. Measurement device position scheme: 1. Cylindrical concrete specimen; 2. LDT devices; 3. Strain-gauge (SG) sensors; A, B, C, and D–sectors.
Applsci 11 08460 g001
Figure 2. Specimen surface development: 1. LDT devices; 2. SG sensors; A, B, C and D–sectors (according to Figure 1).
Applsci 11 08460 g002
Figure 3. Measurement device system: 1. LDT devices; 2. SG sensors; 3. load sensor; 4. data logger; 5. Wheatstone bridge.
Applsci 11 08460 g003
Figure 4. Experimental dependences σ c vs. ε c .
Applsci 11 08460 g004
Figure 5. Experimental dependences σ c vs. ε t r a n s .
Applsci 11 08460 g005
Figure 6. Experimental dependences σ c vs. ε c .
Applsci 11 08460 g006
Figure 7. Experimental dependences σ c vs. ε t r a n s .
Applsci 11 08460 g007
Figure 8. Dependences of transverse strains on longitudinal ones.
Applsci 11 08460 g008
Figure 9. Dependences between average ε t r a n s / ε c and ε c .
Applsci 11 08460 g009
Figure 10. Typical crack propagation in the investigated specimens: (a) End of stage 1–crack development initiation; (b) Stage 2–crack development process; (c) Stage 3–specimen failure.
Applsci 11 08460 g010
Figure 11. Failure pattern of the upper surface of the specimens.
Applsci 11 08460 g011
Figure 12. Typical failure pattern of compressed concrete specimen.
Applsci 11 08460 g012
Figure 13. Experimental σ c ε c dependences for HSC (following [6]).
Applsci 11 08460 g013
Figure 14. Experimental σ c ε t r a n s dependences for HSC (following [6]).
Applsci 11 08460 g014
Table 1. Concrete component properties.
ComponentsUnitsValues
Cement density, ρ c e m kg/m32900
Standard cement consistency, K s c c %27.5
Sand fineness modulus, F M -1.85
Sand particle density, ρ s kg/m32644.5
Crushed stone bulk density (oven-dry), ρ c s b kg/m31270.9
Crushed stone particle density, ρ c s kg/m32586.7
Table 2. Concrete mixture proportioning.
ComponentsUnitsValues
Cement, Ckg/m3448.4
Water, Wkg/m3224.2
Water-cement ratio, W/C-0.5
Sand, Skg/m3602.2
Crushed stone, CSkg/m31017.8
Fresh concrete density in compacted state, ρ c kg/m32293
Table 3. Experimental values of maximum elastic and ultimate transverse concrete strains, modulus of elasticity, E c m , and Poisson’s ratio, ν .
Specimen ε c   e l ,   ε c t   u l ,   E c m , MPa ν
Sp1.10.6780.100277000.15
Sp1.20.4530.100276000.22
Sp1.30.5560.086267400.16
Sp1.40.6050.092320000.15
Average0.5730.095285100.17
Table 4. Poisson’s ratios.
References
SI 466 [3]Bondarenko and Suvorkin [22]BR [23]Eurocode 2 [2]Iskhakov [24]
0.15 ... 0.250.200.200.200.15 ... 0.20
Table 5. Relationship between transverse and longitudinal strains at ULS and Poisson’s ratio values.
Specimen ν ε t r a n s 1 ε c 1 ε t r a n s 1 / ε c 1 ν
Sp1.10.150.281.86
Sp1.20.220.351.57
Sp1.30.160.261.63
Sp1.40.150.322.13
Average0.170.301.80
Table 6. Measured values of ( A + B ) and A and their ratio.
Specimen ( A + B ) ,   c m 2 A ,   c m 2 A + B A
Sp1.1176.591.61.9
Sp1.2176.475.12.3
Sp1.3176.474.92.4
Sp1.4177.199.41.8
Average176.685.32.1
Table 7. Experimental values of maximum elastic strains, ultimate transverse strains, and Poisson’s ratios for HSC (following [6]).
Specimen No. ε c   e l , ‰ ε c t   u l , ‰ ν
10.7800.1430.18
20.8290.1610.19
31.0040.1620.16
Average0.8710.1550.18
Table 8. Relationships between experimental Poisson’s ratio values, transverse, and longitudinal strains at ULS (following [6]).
Specimen No. ν ε t r a n s 1 ε c 1 ε t r a n s 1 / ε c 1 ν
10.180.341.89
20.190.291.53
30.160.291.81
Average0.180.311.74
Publisher’s Note: MDPI stays neutral with regard to jurisdictional claims in published maps and institutional affiliations.

