
Hemodynamic Analysis on the Anastomosis Angle in Arteriovenous Graft Using Multiphase Blood Model


1
School of Mechanical Engineering, Chung-Ang University, Seoul 06974, Korea
2
Asan Medical Center, Department of Surgery, Division of Vascular Surgery, College of Medicine, University of Ulsan, Seoul 05505, Korea
*
Author to whom correspondence should be addressed.
Appl. Sci. 2021, 11(17), 8160; https://doi.org/10.3390/app11178160
Submission received: 19 July 2021
/
Revised: 27 August 2021
/
Accepted: 30 August 2021
/
Published: 2 September 2021
(This article belongs to the Section Biomedical Engineering)
Abstract
:Numerical analysis was performed for the effect of the venous anastomosis angle in a forearm arteriovenous graft for hemodialysis using a multiphase blood model. The geometry of the blood vessel was generated based on the patient-computed tomography data. The anastomosis angles were set at 15°, 30°, and 45°. The hematocrit was set at 34%, 45%, and 58%. The larger anastomosis angle, high wall shear stress area >11 Pa, increases to the side of the vein wall away from the anastomosis site. Further, the relatively low wall shear stress area, <3 Pa, occurs near the anastomosis site in larger anastomosis angles. Therefore, the effect of high wall shear stress has advantages in the vicinity of the anastomosis, as the anastomosis angle is larger, but disadvantages as the distance from the anastomosis increases. Moreover, patients with low hematocrit are advantageous for WSS area.
1. Introduction
A lasting functioning vascular access is essential for renal function replacement therapy by hemodialysis. Surgical vascular access creation, including arteriovenous fistula (AVF) and arteriovenous graft (AVG), are the preferred options for long-term dialysis compared to central venous catheters [1]. Although the dialysis access creation technique is widely used in clinical practice, long-term patency remains an unsolved major clinical problem for chronic hemodialysis treatment and a leading cause of morbidity and hospitalization in these patients [2]. The patency of vascular access for hemodialysis is mostly limited by growing stenoses that lead to decreased flow rate, thromboses, and, finally, access failure. Several risk factors are related to the patency of dialysis access, including sex, vessel size or distensibility, surgical technique, hypoxia, and an underlying uremic condition, but no clear pathophysiology has been elucidated yet [3,4,5]. Intimal hyperplasia is central to the pathology of hemodialysis access stenosis and occlusion [6]. Intimal hyperplasia has been widely studied in various vascular bypass surgeries, not limited to vascular access creation [7,8]. In arterial bypass grafts, simulation or animal studies have reported that disturbed flow regions are seen at the heel, the toe, and at the floor of the distal end-to-side anastomosis, which corresponds to the disturbed flow regions [9]. Similarly, in vascular access for hemodialysis, wall shear stress (WSS) from the localized fluid pattern is believed to be one of the most important factors in developing intimal hyperplasia [5]. Endothelial cells probably play a key role in the change of wall properties and altered WSS, as endothelial cells are in direct contact with the flowing blood and can translate the physical stimuli of shear stress to a biological effect [10]. The WSS is suggested as an index for the prediction of stenosis resulting from intimal hyperplasia [11].
Boghosian et al. found that low shear stress occurred where the stenosis progressed; it was also mentioned that this low wall shear stress causes damage to endothelial cells [12]. Carroll et al. found that high WSS and reverse flow could cause dysfunction of the AVF [13,14]. McGah et al. showed that AVF was associated with extremely high shear rates, also supporting the hypothesis that low and oscillating shear stress is the pathogenesis of the disease [15,16].
The anastomotic angle has a significant impact on the local disturbed flow patterns in both types of vascular access and is a factor that can be altered by the surgeon [17,18,19]. Most studies were conducted on AVFs, and conflicting results on the recommended anastomotic angle associated with low-flow disturbance were observed [17,19,20].
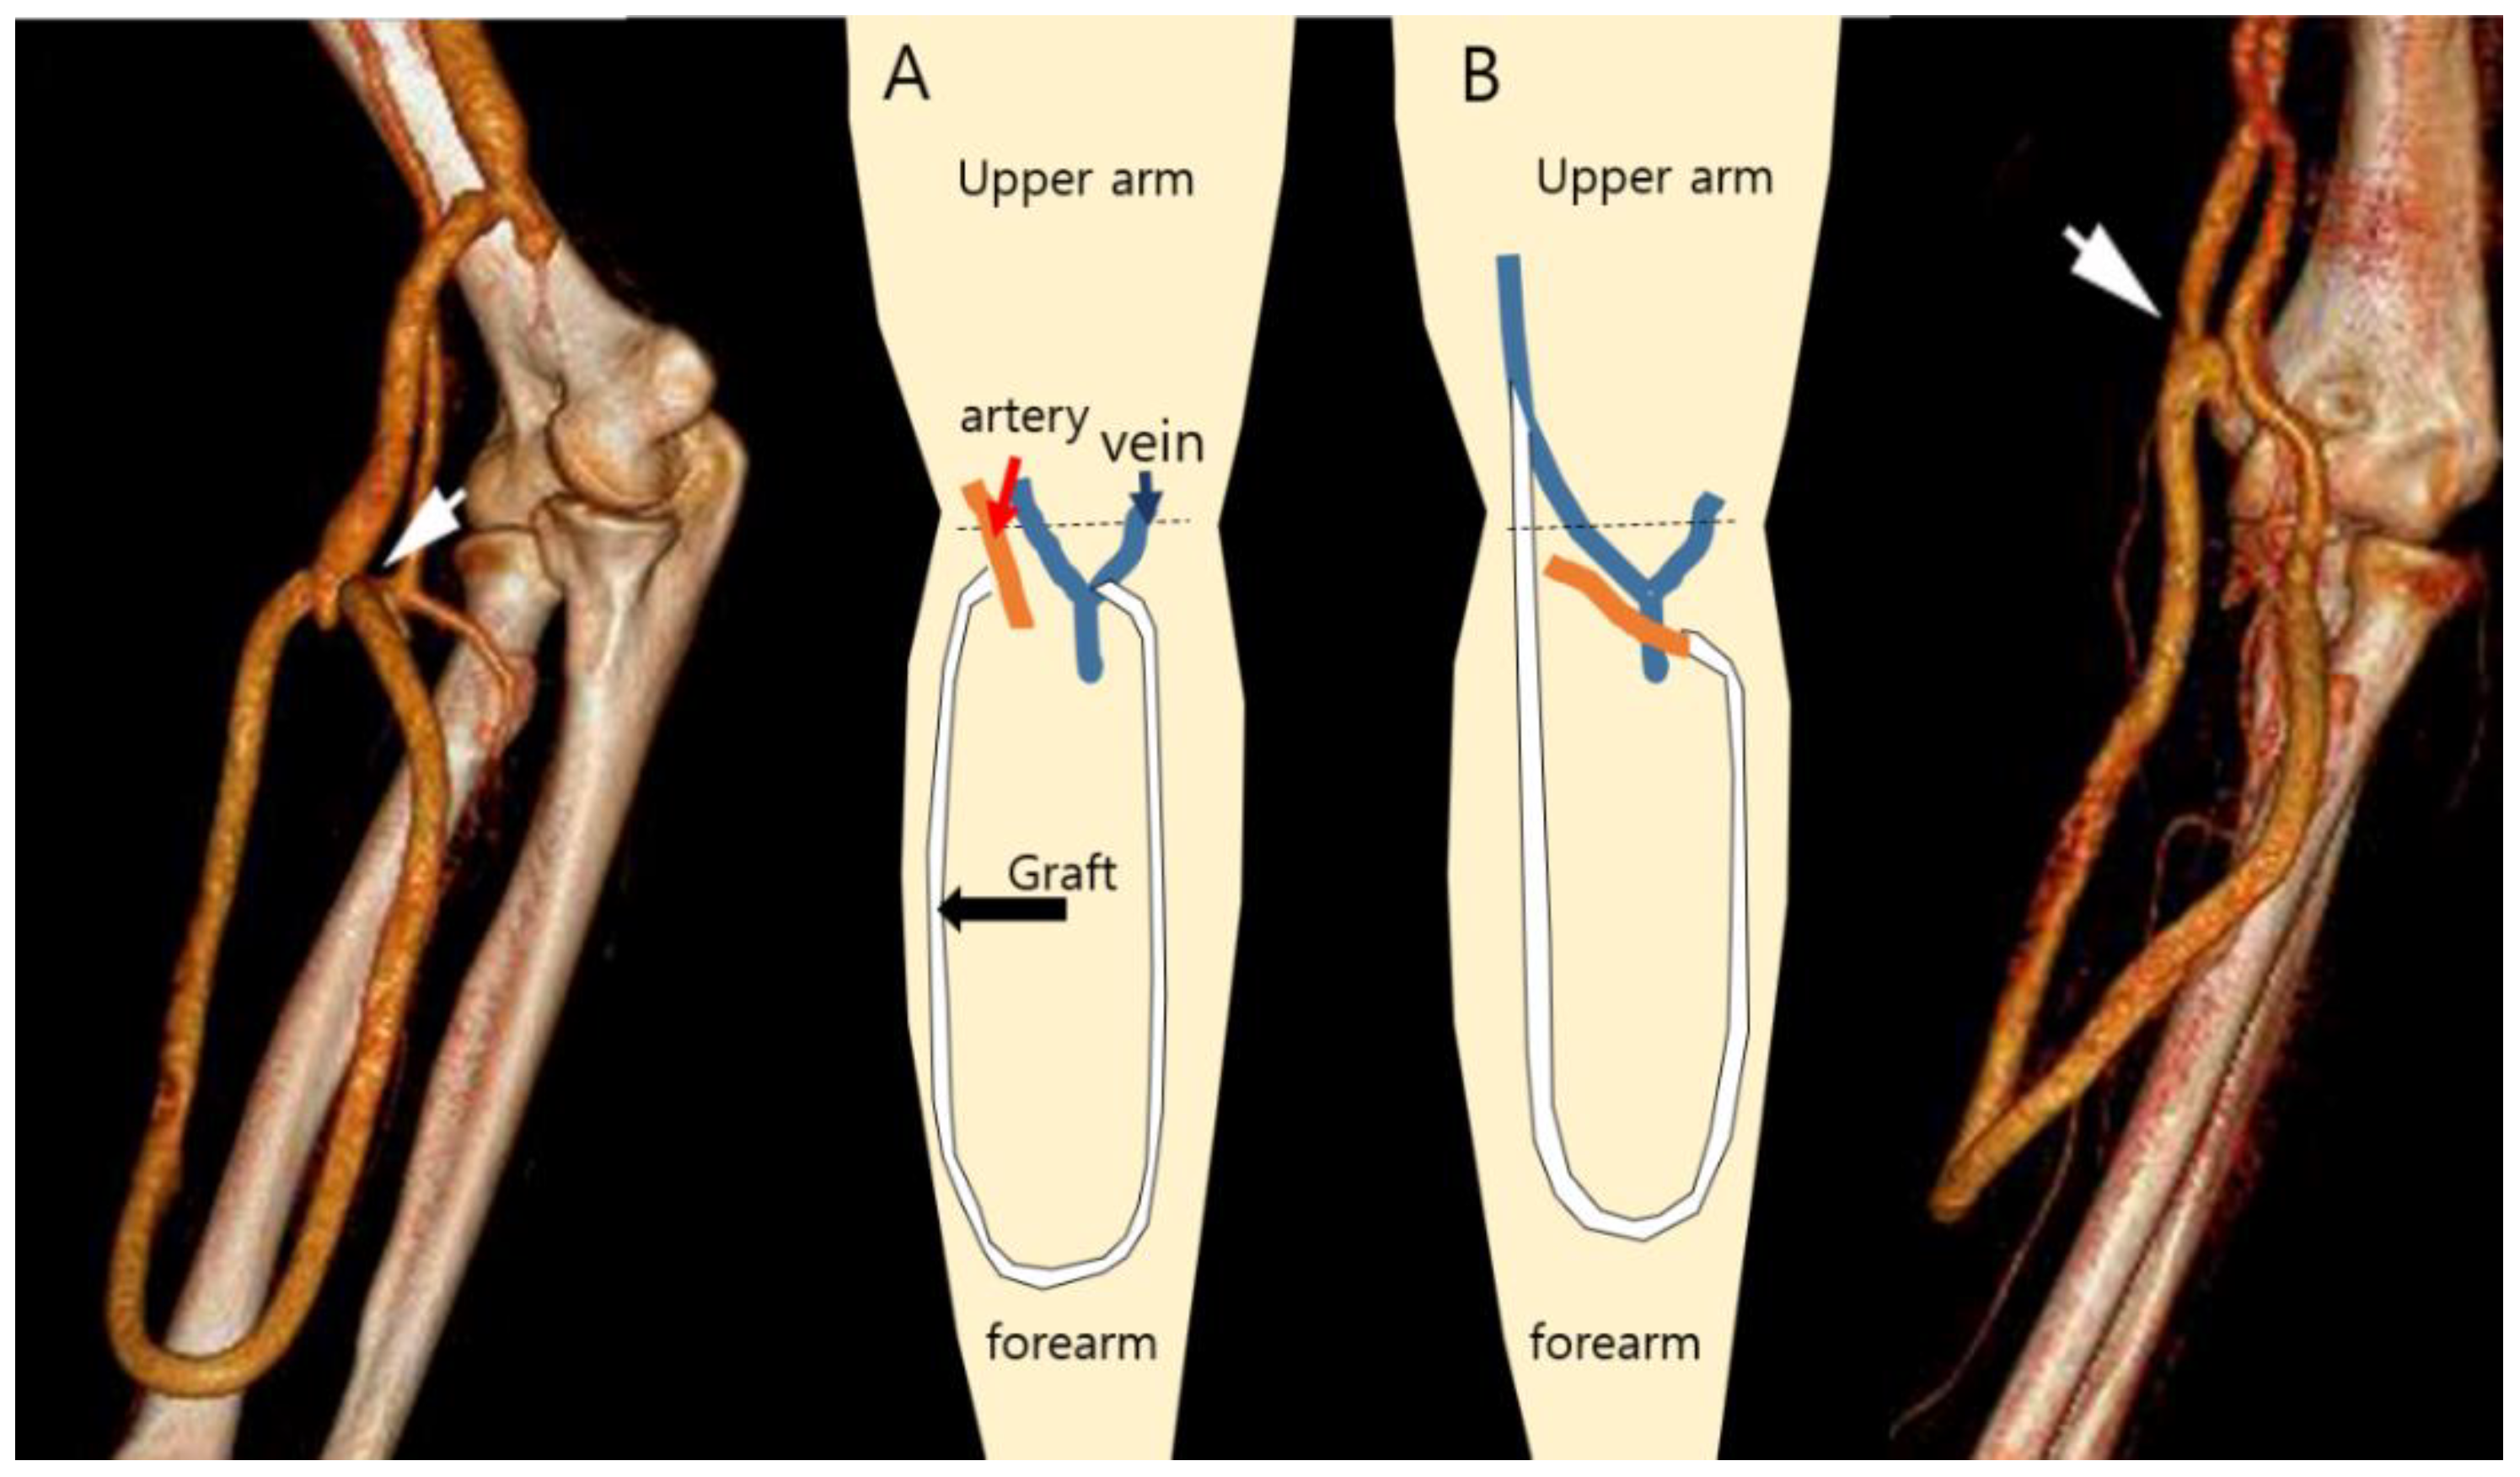
Usually, the sites and types of hemodialysis access are primarily determined on the basis of the diameter and condition of the outflow vein and inflow artery [21]. In the case of AVF, there is little room for morphologic variation created by the surgeon because the configuration of the AVF is primarily determined by the patient’s venous anatomy once the anastomosis is made. However, in the case of the AVG, the configuration may vary depending on the surgeon’s experience and preferences, especially for the prosthetic brachial-antecubital forearm loop access. In most cases, a superficial vein located in the antecubital fossa is selected as the outflow vein. However, the basilic vein right above the elbow joint can also be utilized to save the upper arm veins when the forearm veins are unsuitable, as shown in Figure 1. When comparing with the antecubital veins as the outflow, the basilic vein above the elbow joint provides an almost parallel course to the graft with a more acute anastomotic angle.
In practice, the anastomotic angle is not simply determined by the angle at which the end of the vessel was cut for the anastomosis on a three-dimensional plane. Therefore, the anastomosis angle is determined according to which vein is selected as the outflow vein and in which configuration the artificial graft is inserted.
As mentioned above, wall shear stress is an important hemodynamic factor in AVG that induces stenosis. Therefore, it is important to precisely analyze the hemodynamics, including WSS, according to the anastomotic angle of AVG.
Blood viscosity is a physical characteristic of blood that most directly affects WSS calculations by computational fluid dynamics. Among the various components of blood, plasma has Newtonian fluid characteristics; however, various blood substances, such as red blood cells, change the blood into non-Newtonian fluid with shear-thinning characteristics [21,22].
Blood models, such as the Pow-law model, Casson model, and Carreau–Yasuda model, express the shear-thinning characteristics of blood well. However, because blood is assumed to be a bulk fluid, it has a limitation in that it does not consider local hematocrit changes according to the flow.
Few blood models have been proposed to account for the effect of hematocrit on blood viscosity.
Ahmed Elhanafy et al. [23], based on the Quemada model, presented a blood model that considers the viscosity according to the concentration of red blood cells and the viscoelastic effect using the Oldroyd-B model. However, this model also has a limitation in that it is difficult to consider the local concentration change according to the red blood cell because blood is assumed as the bulk fluid.
Jung and Hassanein presented a multiphase blood model using the multiphase computational fluid dynamics approach proposed by Gidapow, Anderson, and Jackson [21].
This model assumed that the blood was plasma, white blood cells, and red blood cells. In addition, the multiphase blood model shows good accuracy within the range of 30–55% hematocrit. Since the multiphase model calculates the behavior of red blood cells, it has the advantage of considering the local concentration of red blood cells according to the flow.
In particular, hematocrit is a factor that significantly affects blood viscosity, and the hematocrit increases dramatically during hemodialysis because the dialyzer removes water during hemodialysis. In addition, during hemodialysis, blood with a high hematocrit flows into a vein through the AVG. The flow into the vein through the AVG is affected by the angle of the anastomosis. Furthermore, hematocrit should be changed by the flow.
Therefore, in this study, numerical analysis was performed using a multiphase blood model to consider the hemodynamic characteristics of AVG according to the anastomotic angle formed in the vein.
2. Materials and Methods
This retrospective review was conducted after acquiring local institutional review board approval (C2016074(1817)). Informed consent was waived for this study. The data of 4 patients who underwent prosthetic brachio-antecubital loop access with a 6-mm Gore expanded polytetrafluoroethylene graft (W. L. Gore and Associates Inc., Flagstaff, AZ, USA) between 2010 and 2011 were used to generate a computational model. Data, including outflow vein diameter and anastomosis, were acquired using ultrasonography (Prosound α7; ALOKA Co., Ltd., Tokyo, Japan) and computed tomography (Brilliance iCT 256s, Philips, Cleveland, OH, USA). The WSS and hemodynamic characteristics were analyzed by the computational fluid dynamic method with the multiphase blood model at several anastomotic angles.
3. Numerical Details
3.1. Governing Equations
The multiphase blood model was used to consider the shear thinning effect of blood according to the hematocrit [21,23]. The multiphase blood model calculates the mass, momentum, and energy exchange between two phase substances by assuming that red blood cells are solid in plasma. The multiphase blood model equation is as follows. Continuity equation: The continuity equation is expressed as Equation (1). Here, the subscript k denotes plasma and red blood cell phases. The subscript ε denotes the volume fraction of each phase.
Blood mixture density (3).
Momentum equation: momentum equation is expressed as Equation (2).
Here, the stress tensor of plasma is the same as Equation (5). The stress tensor of red blood cells is the same as Equation (6).
Plasma stress tensor (5).
RBC stress tensor (6).
The viscosity of the mixture fluid is determined by the volume fraction of each phase. Because of these characteristics, the multiphase blood model has advantages for depicting flow characteristics where the hematocrit varies locally, such as in hemodialysis. The relative viscosity of the mixture fluid is the same as Equation (7).
In this model, the percentage of red blood cells is assumed as the hematocrit.
For greater than 6.
For less than 6.
where .
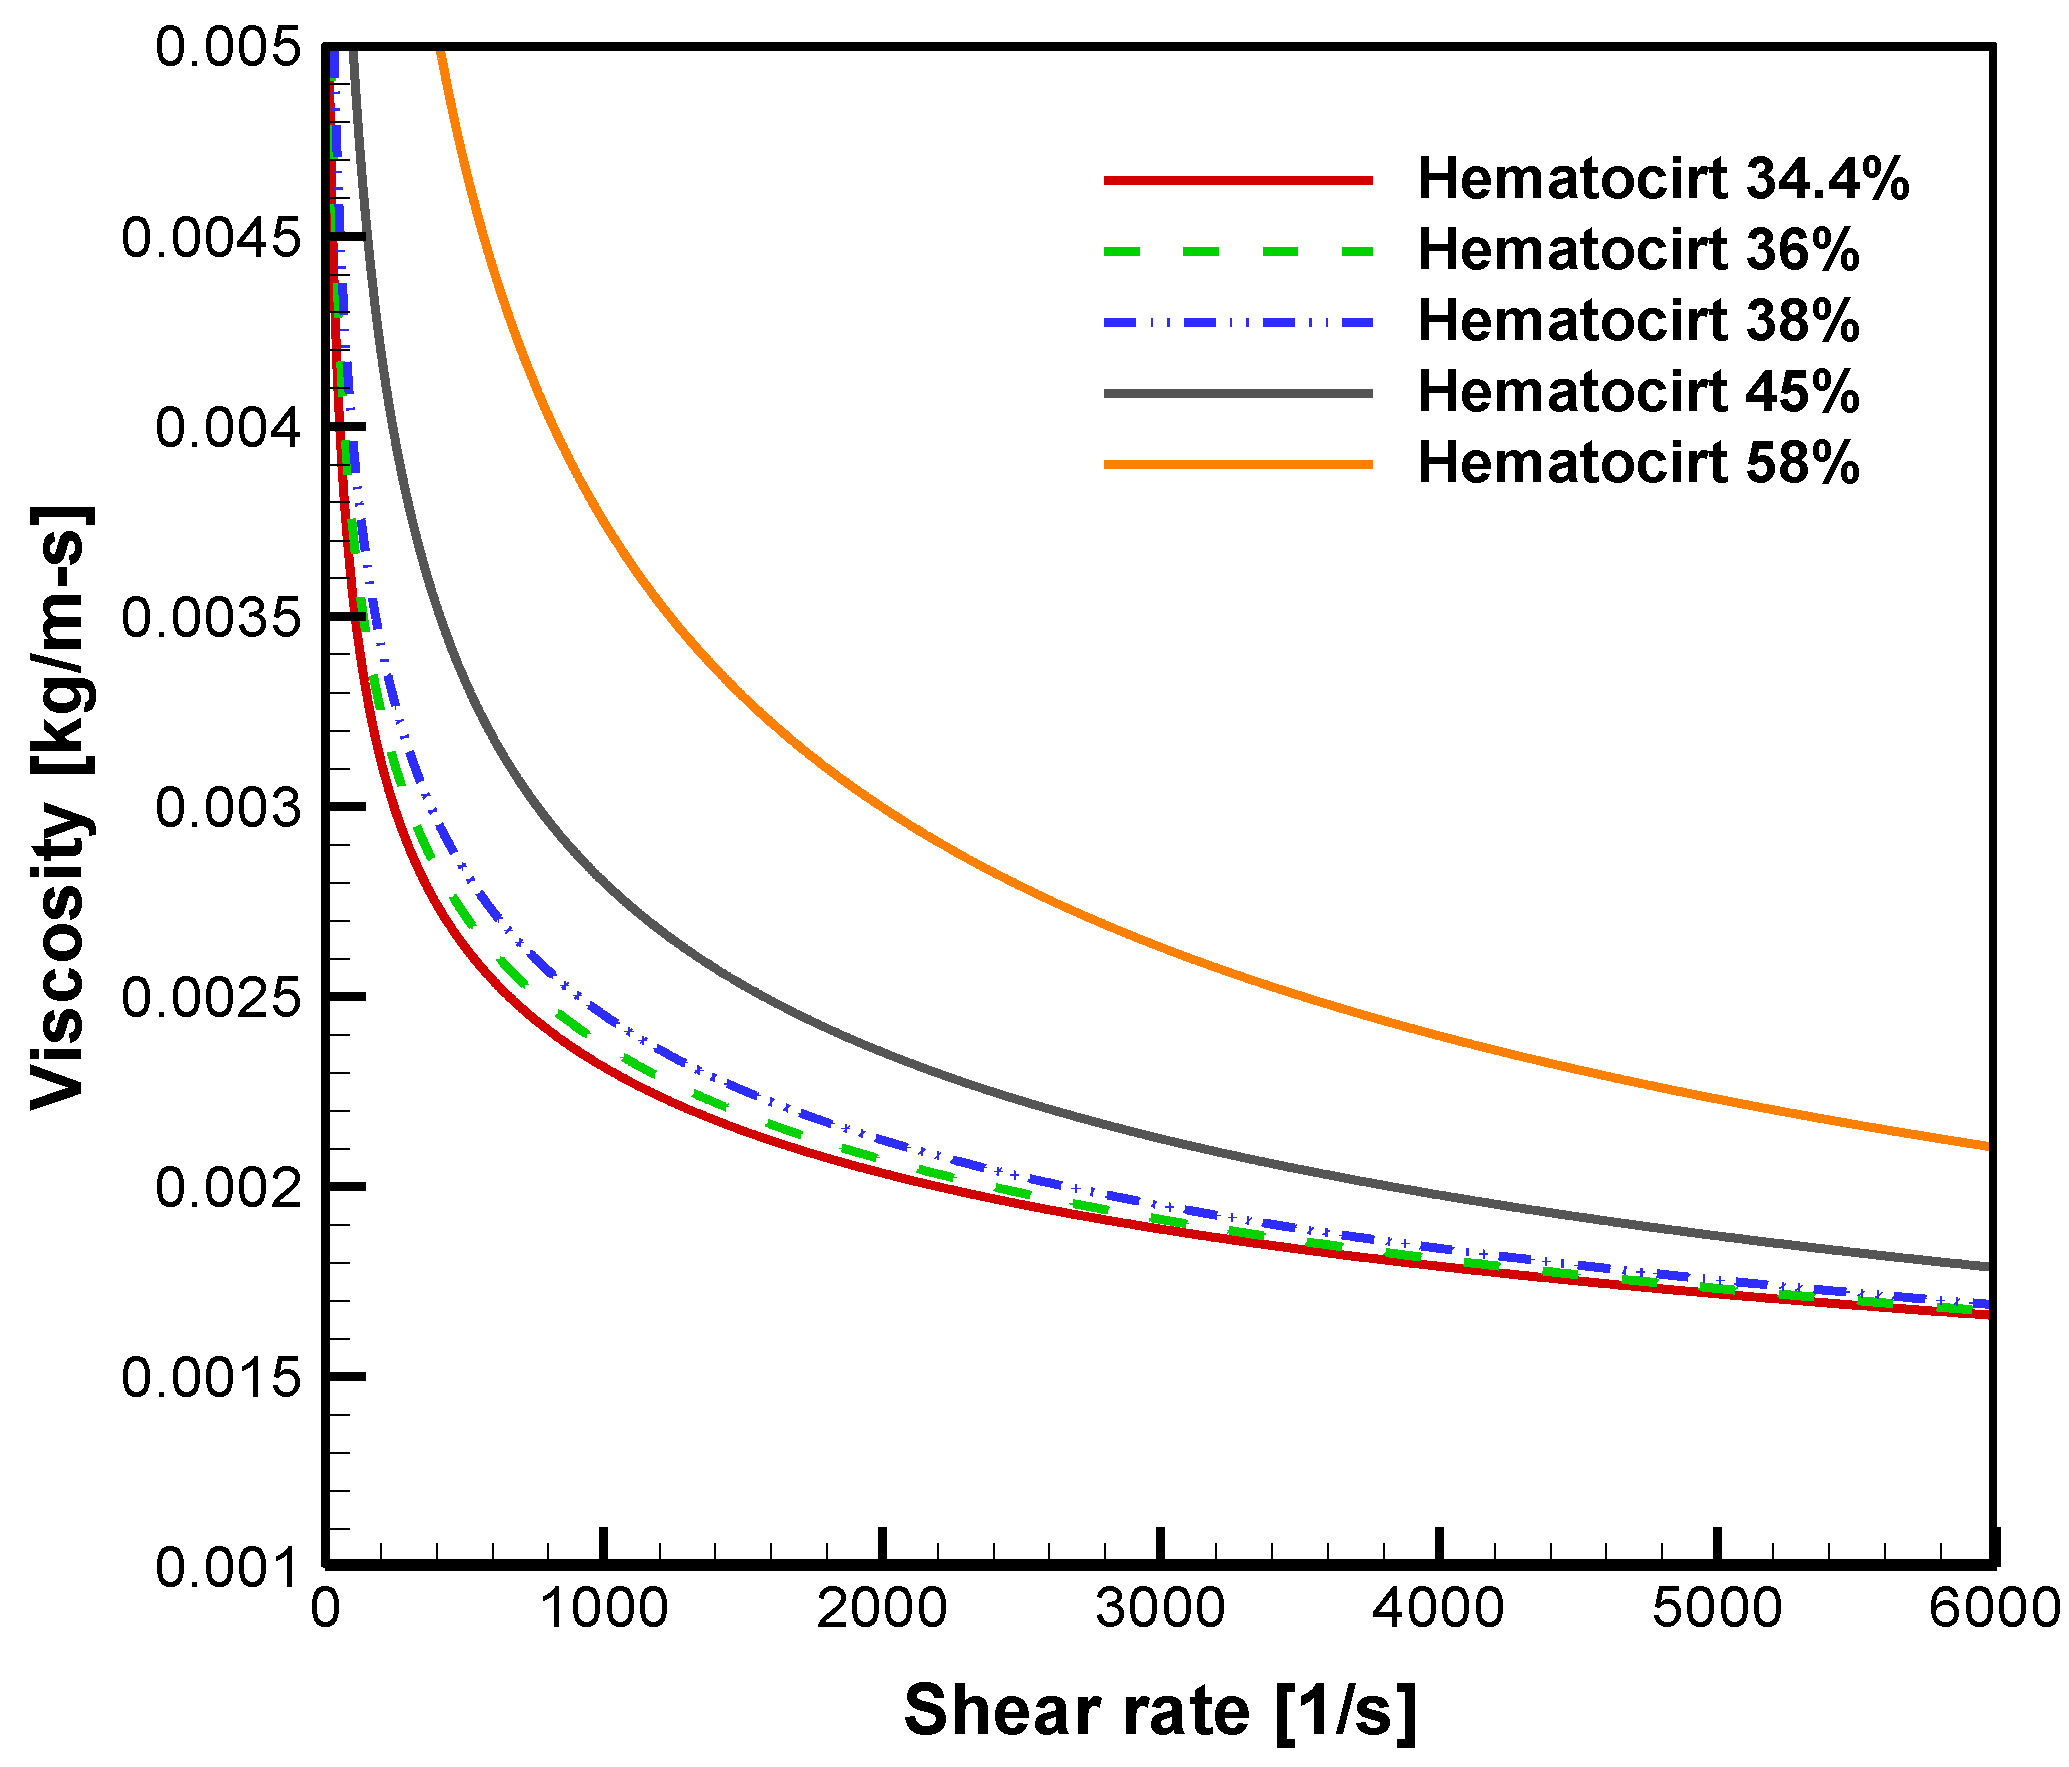
Figure 2 shows the viscosity calculated according to the hematocrit of the multiphase blood model used in this study. Viscosity shows shear thinning characteristics that decrease with increasing shear rate. In addition, as the hematocrit increases, the viscosity increases relatively significantly. These characteristics are expected to have a significant effect on WSS on the venous side, where high hematocrit flows during hemodialysis.
3.2. Geometry and Numerical Detail
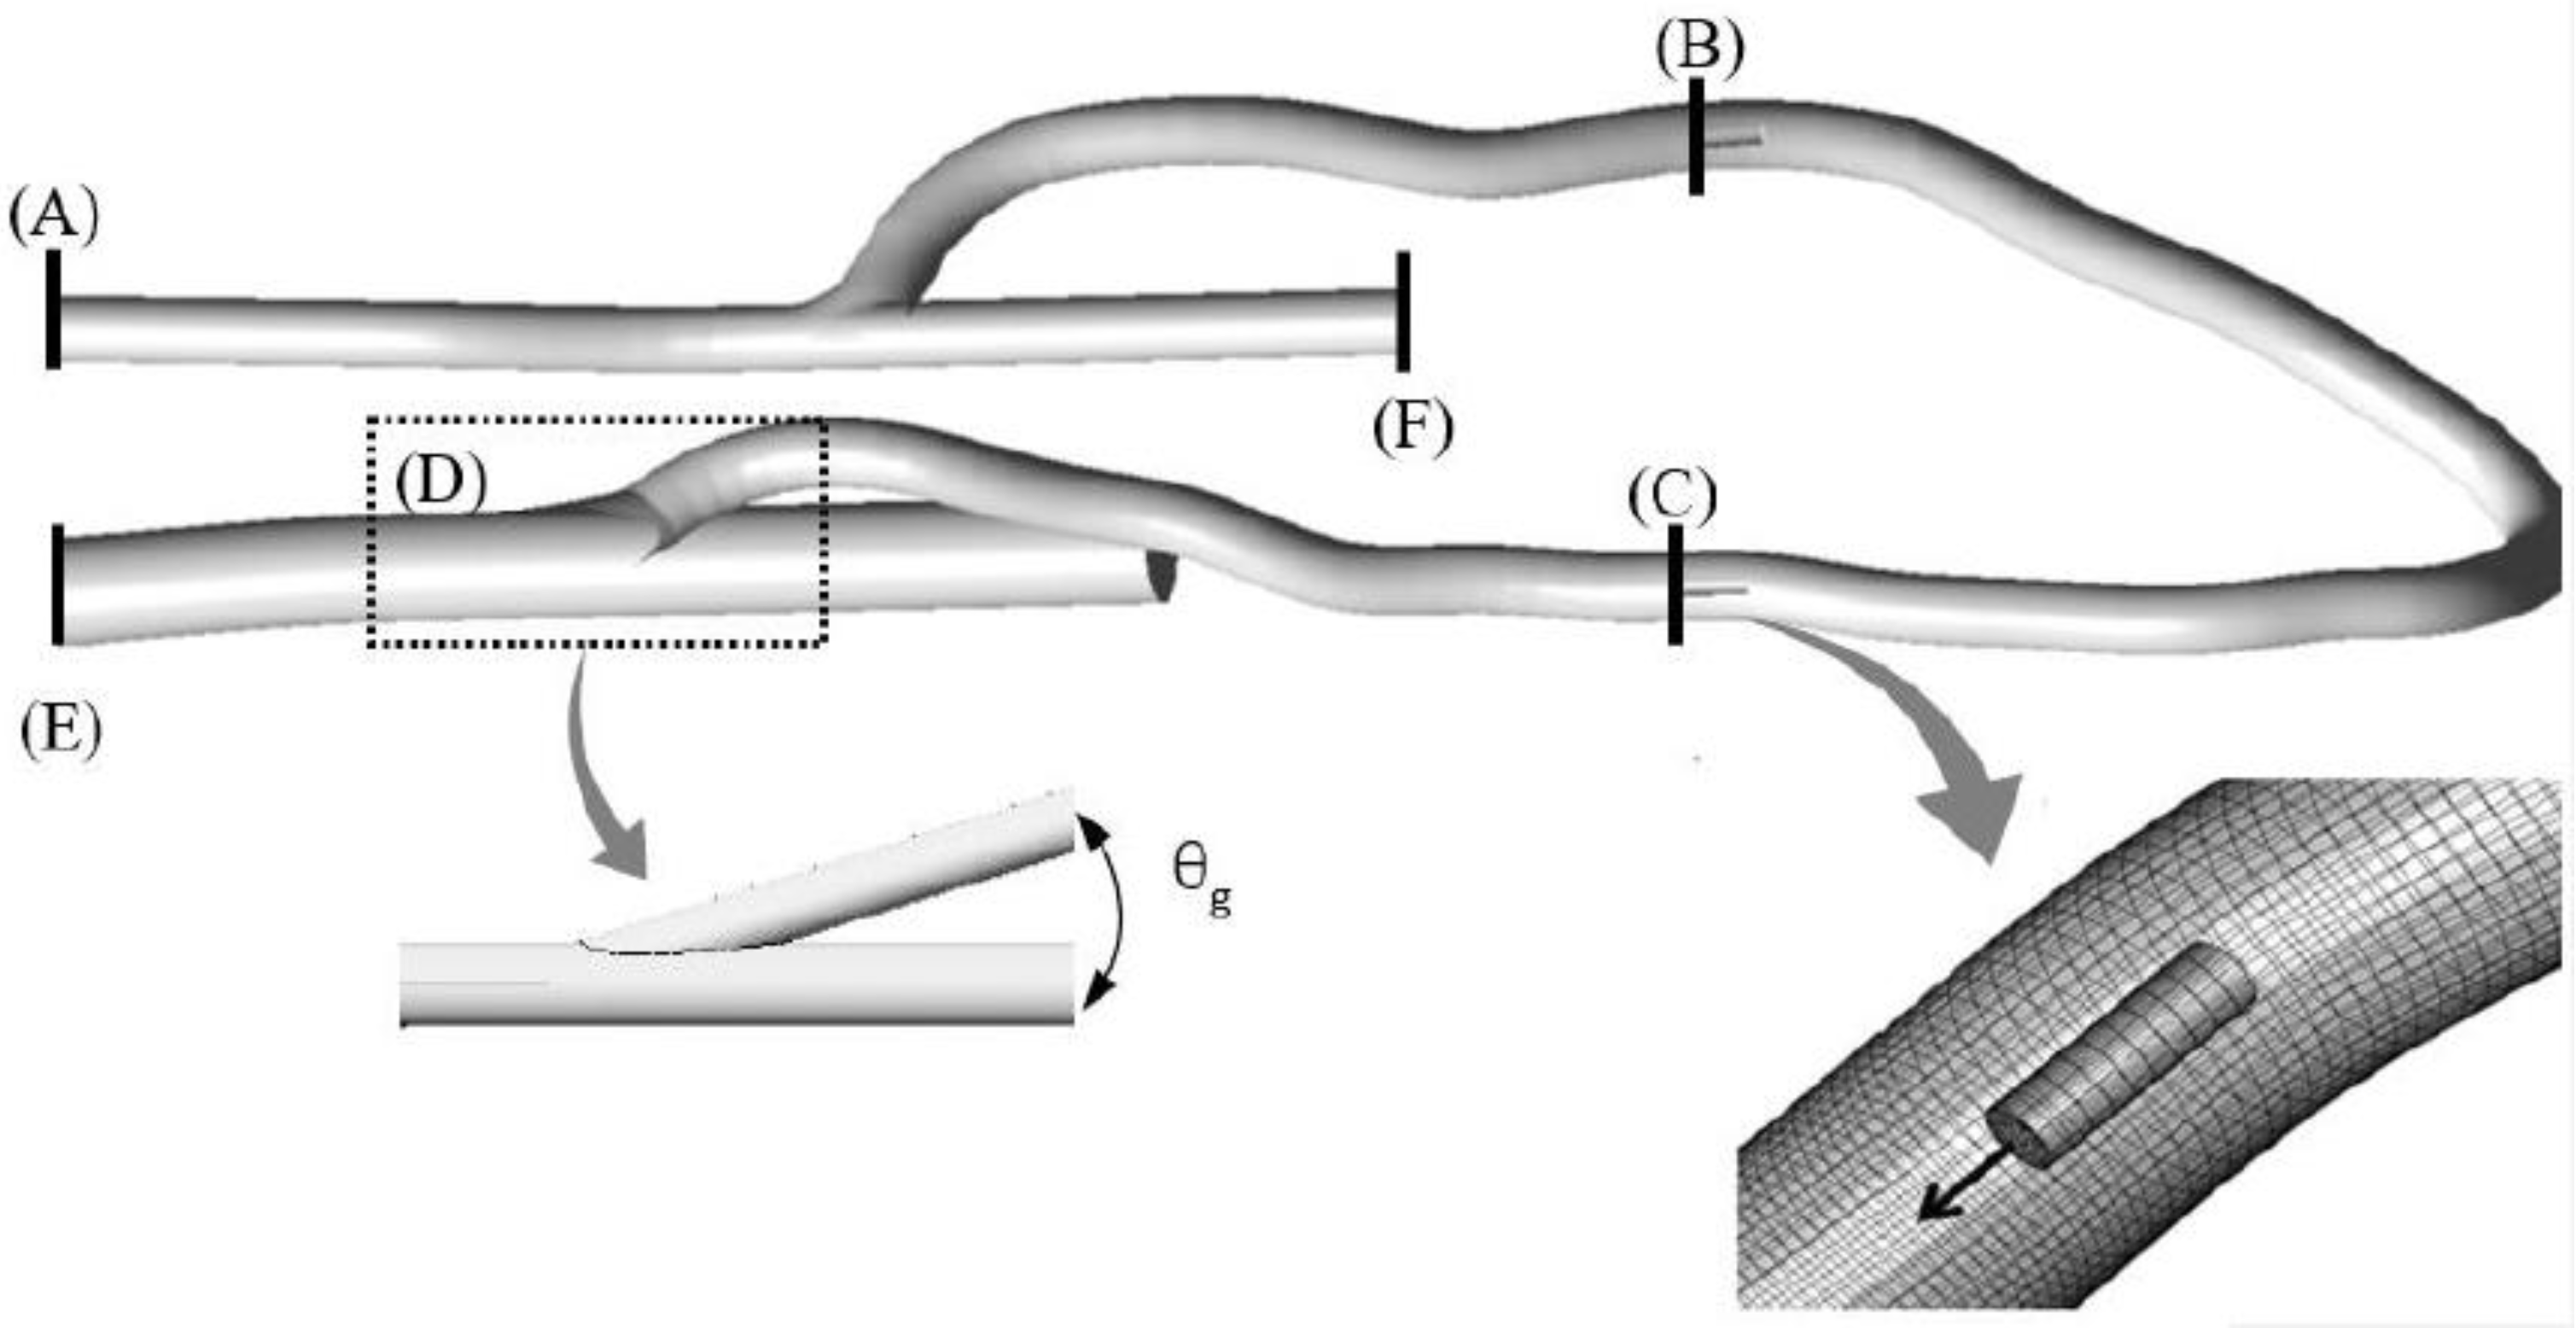
The simplified geometry of the arteriovenous graft was generated in a circular shape. Since the physiological curvature of blood vessels form anisotropic flow, the shape closest to the circular shape among the CT data was selected for ease of flow analysis, as shown in Figure 3.
The diameters of the vein and artery were set as 7 and 3.8 mm, respectively, considering the minimum diameter measured on ultrasound imaging among the patients (Table 1). To investigate the effect of the anastomotic angle (θg), the angles were set to 15°, 30°, and 45° (Cases 1, 2, and 3, respectively) based on the patients’ computed tomography data.
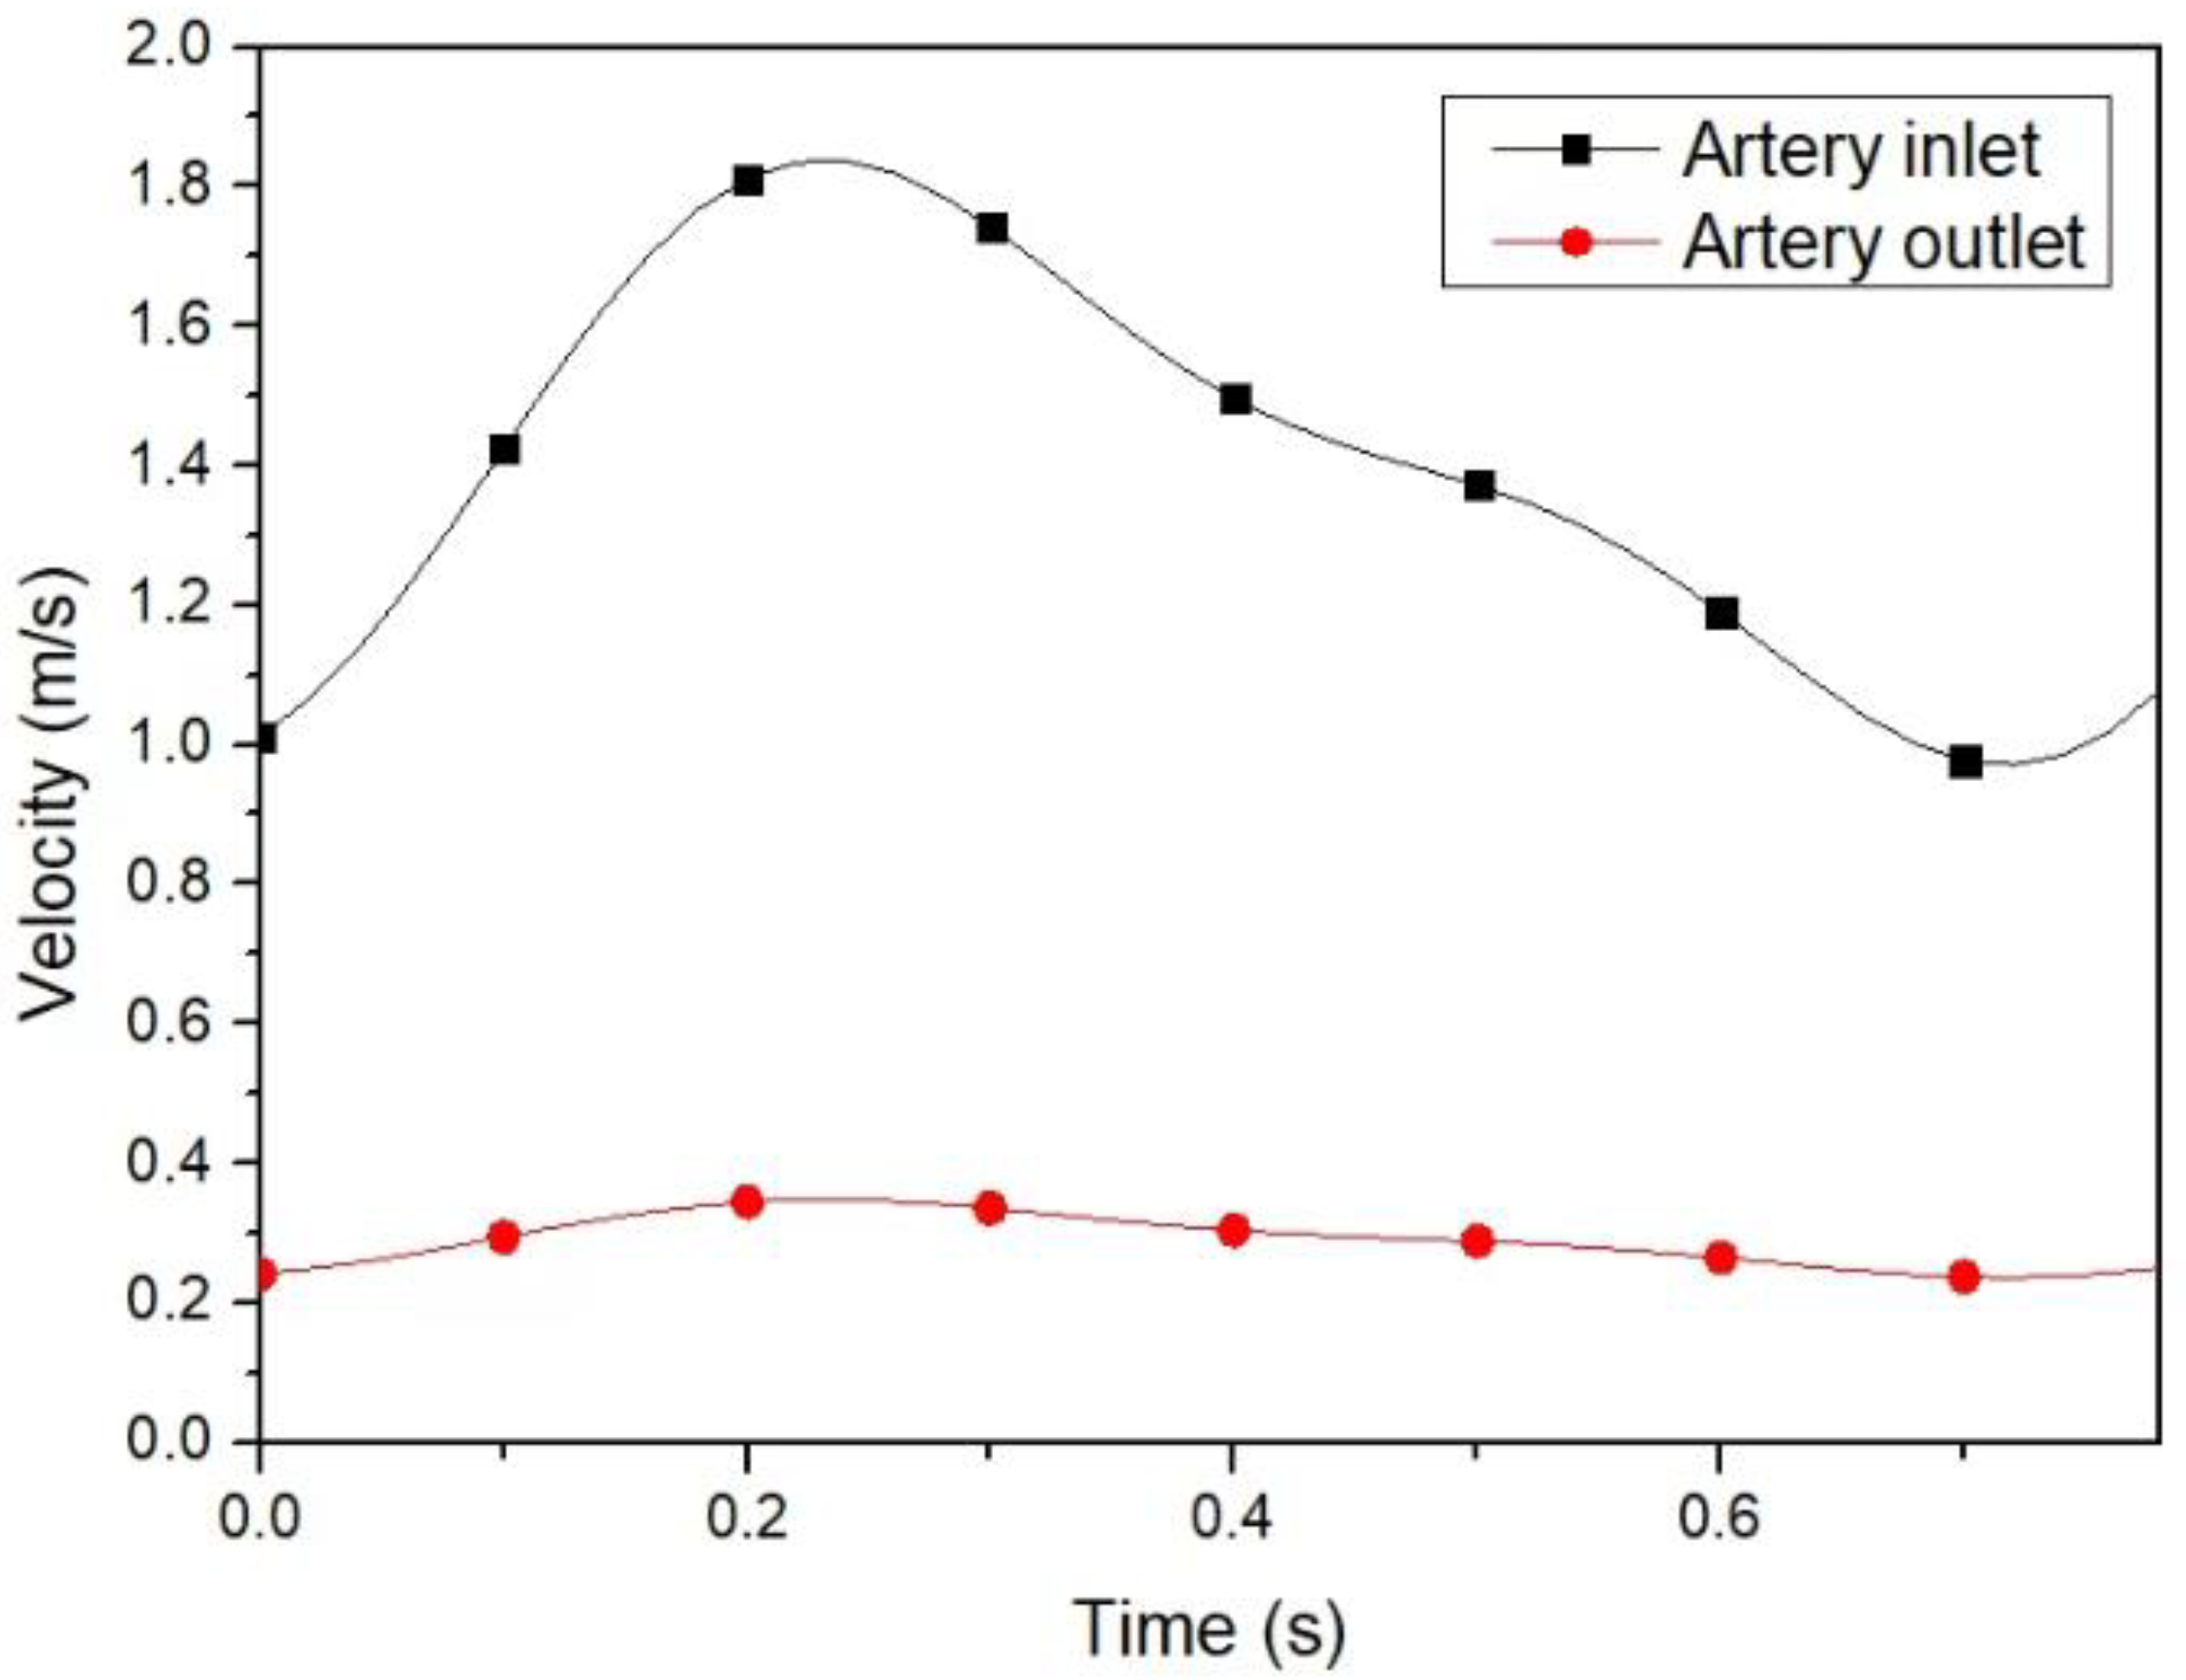
The boundary conditions of the graft and vein inlet were set based on the Doppler data obtained throughout the cardiac cycle, as shown in Figure 4. The velocities of the graft and vein inlet were measured at the graft and before and after the venous anastomosis. After calculating the velocity by using fast Fourier transforms, the mean minimum peak systolic velocities of 1 and 0.3 m/s were used for the boundary conditions of the artery inlet (A). The hematocrit of the artery inlet was 34% in all cases. The zero gradient with mass rate weighting is applied at the boundary condition of the outlet (E,F). Accordingly, the mass rate weighting of the vein outlet was set to 100%. The flow rate of suction and injection needle were −400 and 400 mL/min (B,C), respectively. Hematocrit introduced into the graft through the injection needle was 34%, 45%, and 58%. The blood vessels were assumed as rigid bodies with nonslip conditions.
The maximum Reynolds number of the flow was larger than 120,000 in all the cases, and the standard k-ε model was used to consider turbulence. The numerical studies were performed using commercial software (ANSYS Fluent v19). The PISO scheme was used for pressure–velocity coupling. In addition, the second-order upwind scheme was used for the discretization of the momentum. The convergence criterion of the residual set was 0.001 for mass continuity. The computational time was approximately 20 min for each case on a 16-node 3.2-GHz CPU.
3.3. Grid Independence Test
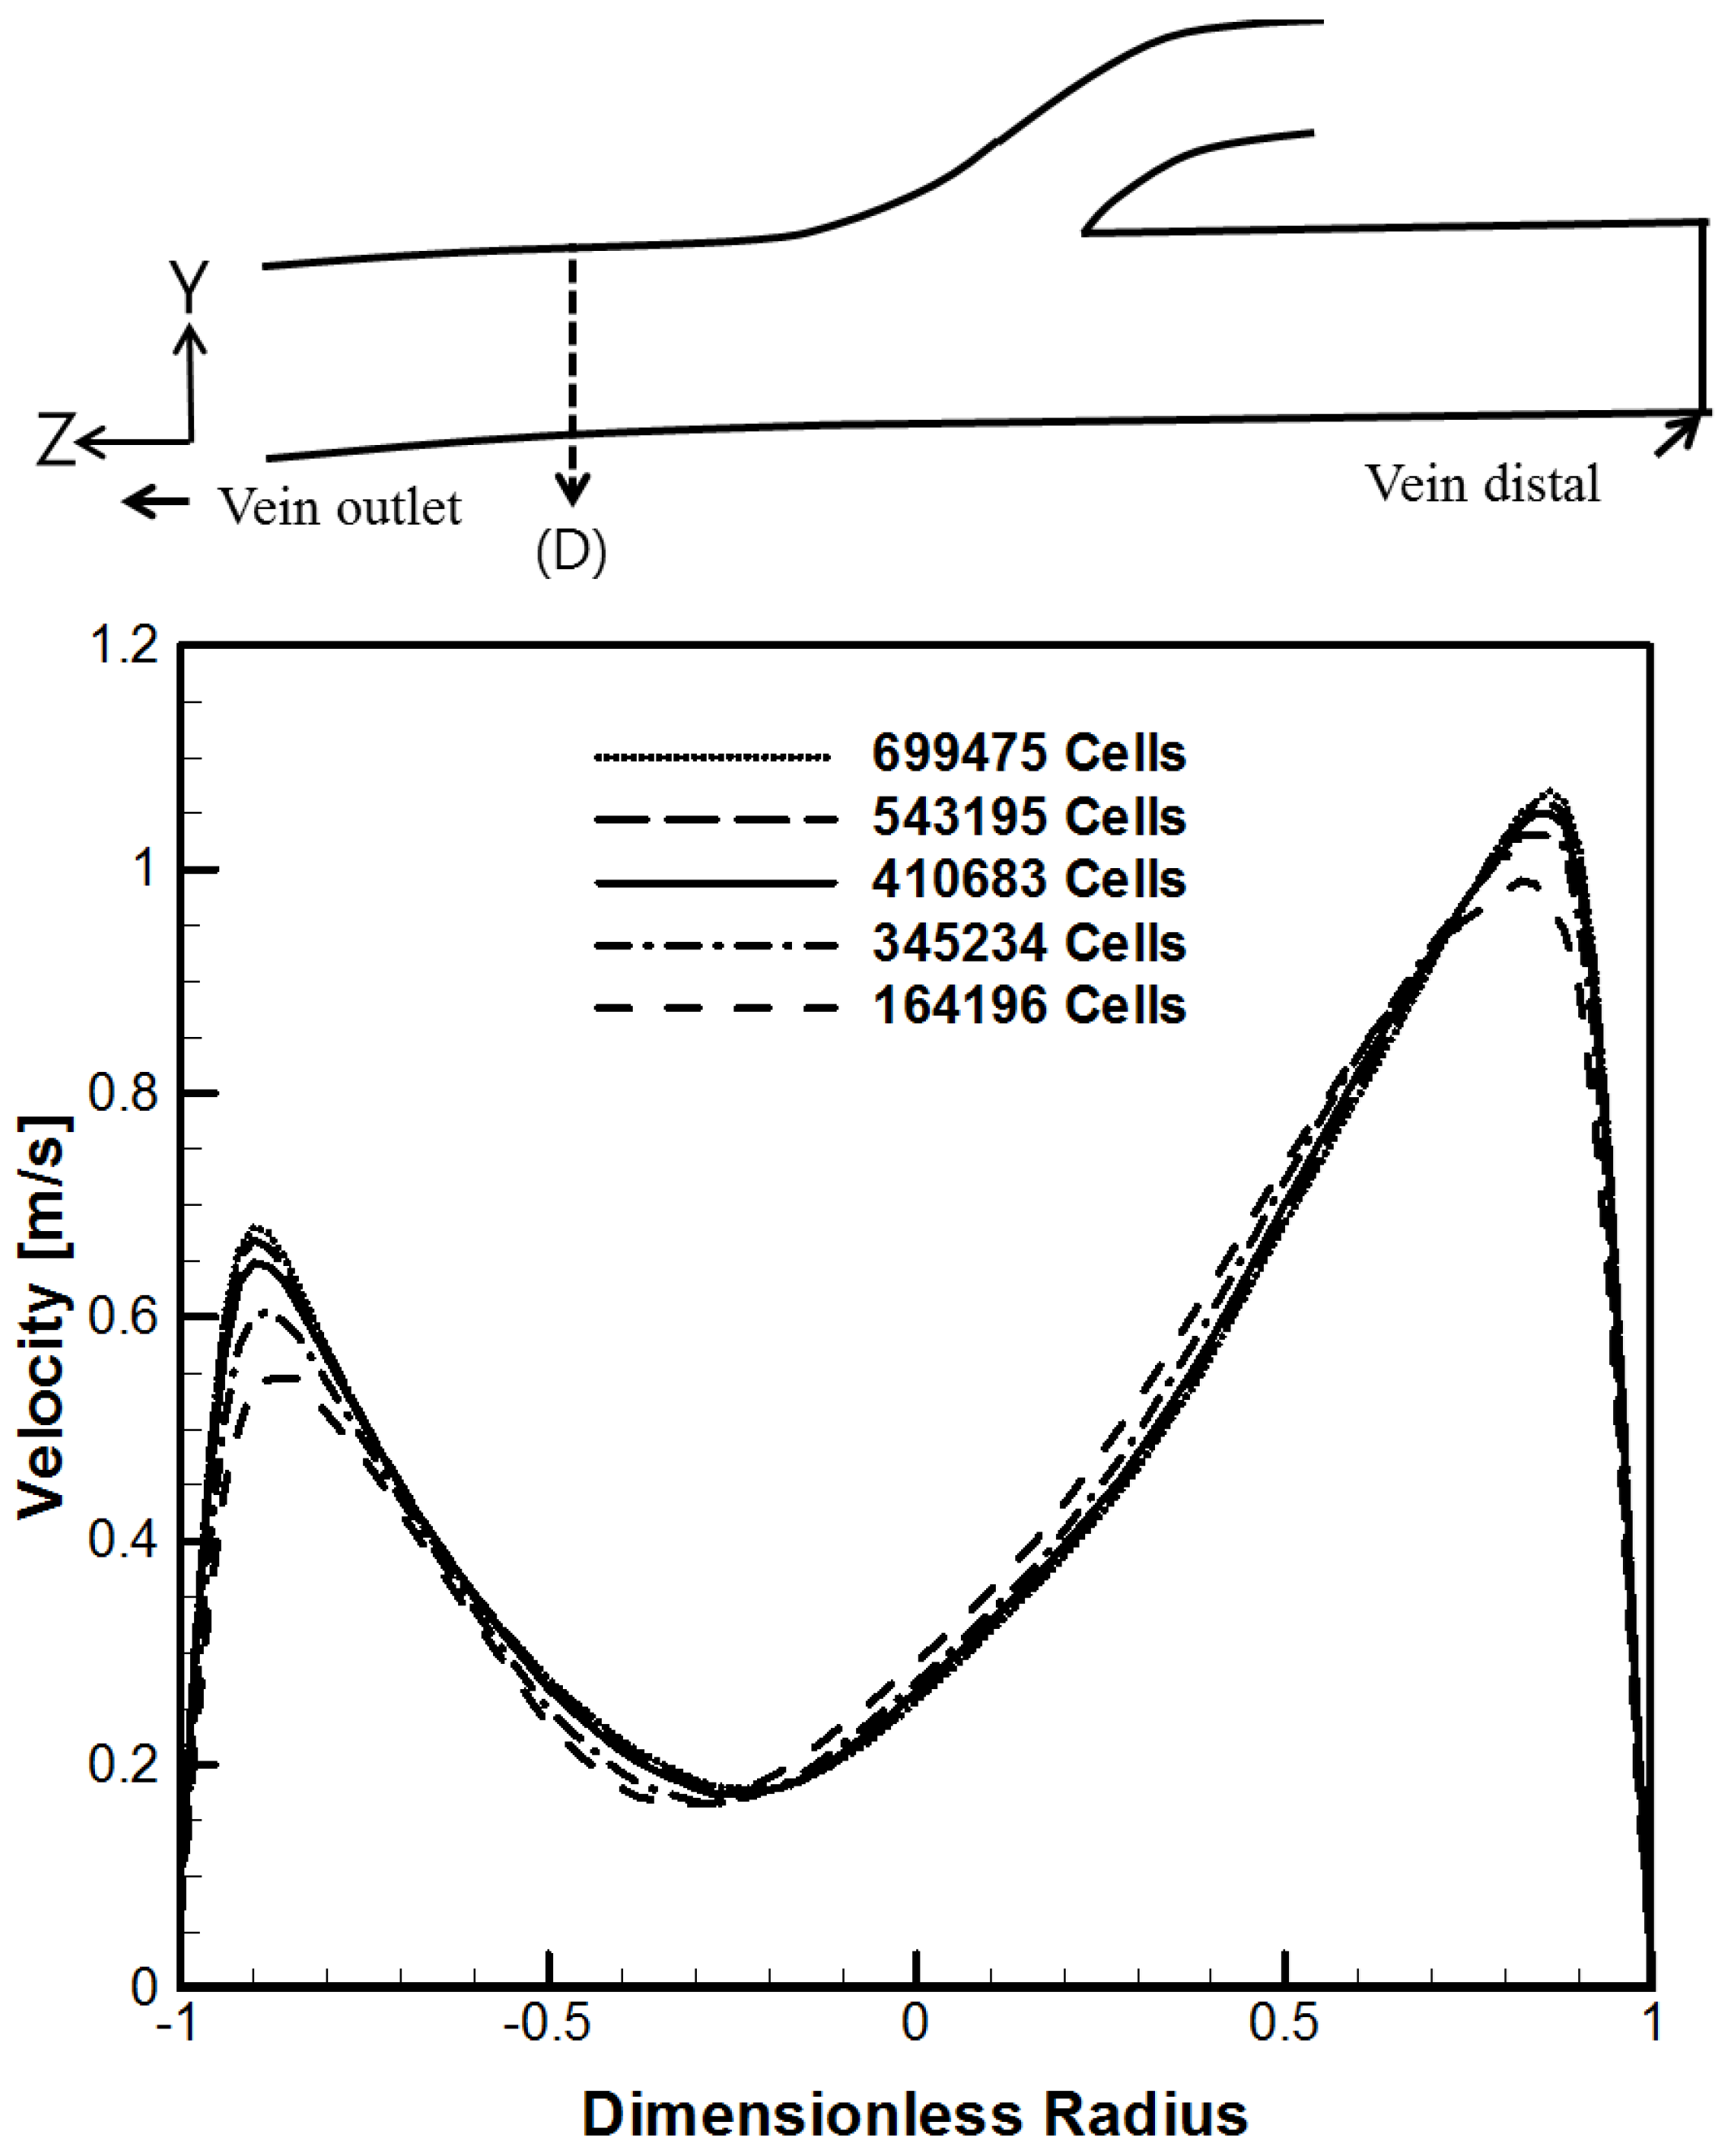
The computational grid consists of hexahedron meshes. The number of grids was selected at about 410,683 through a grid independence test based on the flow velocity at Line (D), as shown in Figure 5. Grid independence was performed at a steady flow. An important factor in the analysis of this study, such as WSS, is dominantly influenced by the flow near the wall. For the number of grids, the smallest number of grids in which the flow velocity (Y ~ −0.9 and 0.9) near the wall differs by less than 5% from the result of the maximum number of grids was selected.
4. Results and Discussion
4.1. Hematocrit and Flow Analysis
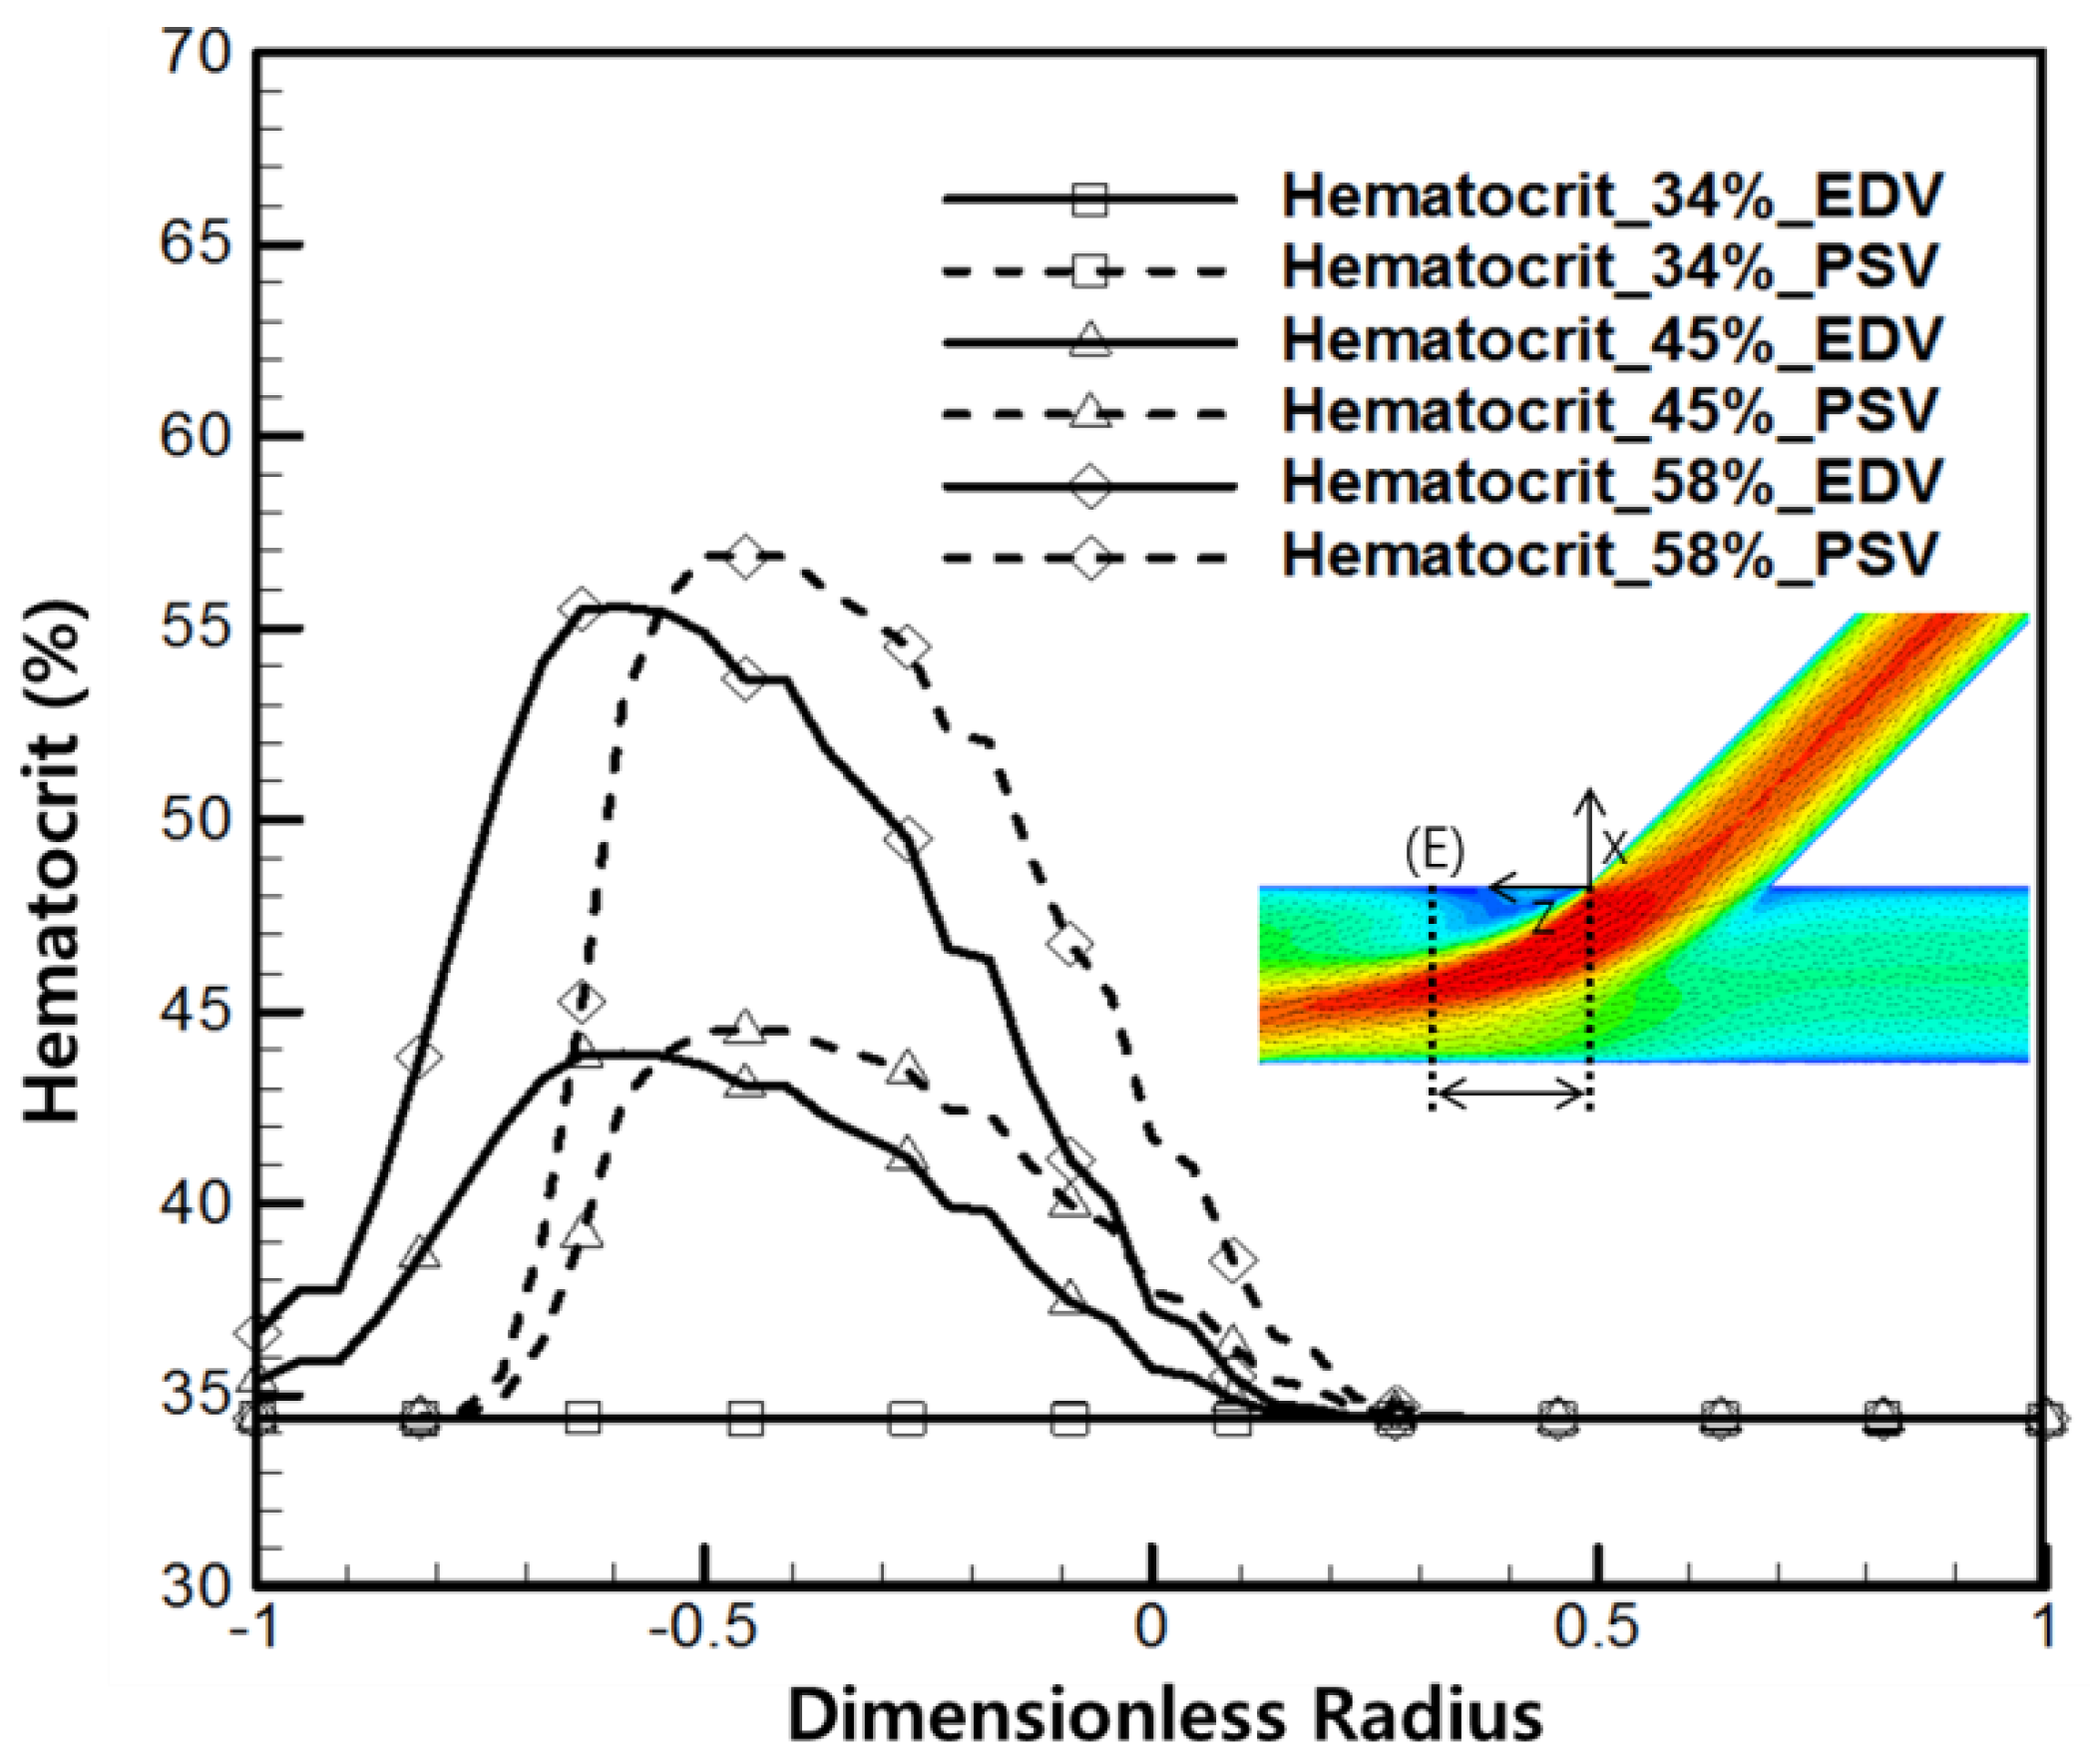
Figure 6 shows the hematocrit in Line (E) with a vein anastomosis angle of 45° and 5 mm away from the tip of the vein anastomosis site. The dimensionless radius of −1 is the bottom surface of the vein, and dimensionless radius 1 is the top surface (x = 0). Blood with high hematocrit from the injection needle flows into the graft. Blood with high hematocrit mixes with blood flowing along the graft from the artery and flows into the vein anastomosis area. At the Line (E) position, the maximum hematocrit falls by about 2% from about 45% to 43% and from 58% to 56%. Because the graft length is short compared to the flow rate, blood flowing into the graft from the needle is concentrated in the center of the graft and flows into vein anastomosis. Due to this fluid characteristic, hematocrit is concentrated in the dimensionless radius 0.5 part. This hematocrit shows a high value at the bottom (dimensionless radius −1) at end-diastolic velocity (EDV), where the artery flow rate is relatively slower than peak systolic velocity (PSV) because when the flow rate into vein anastomosis is high, the hematocrit mixes less with the surrounding area.
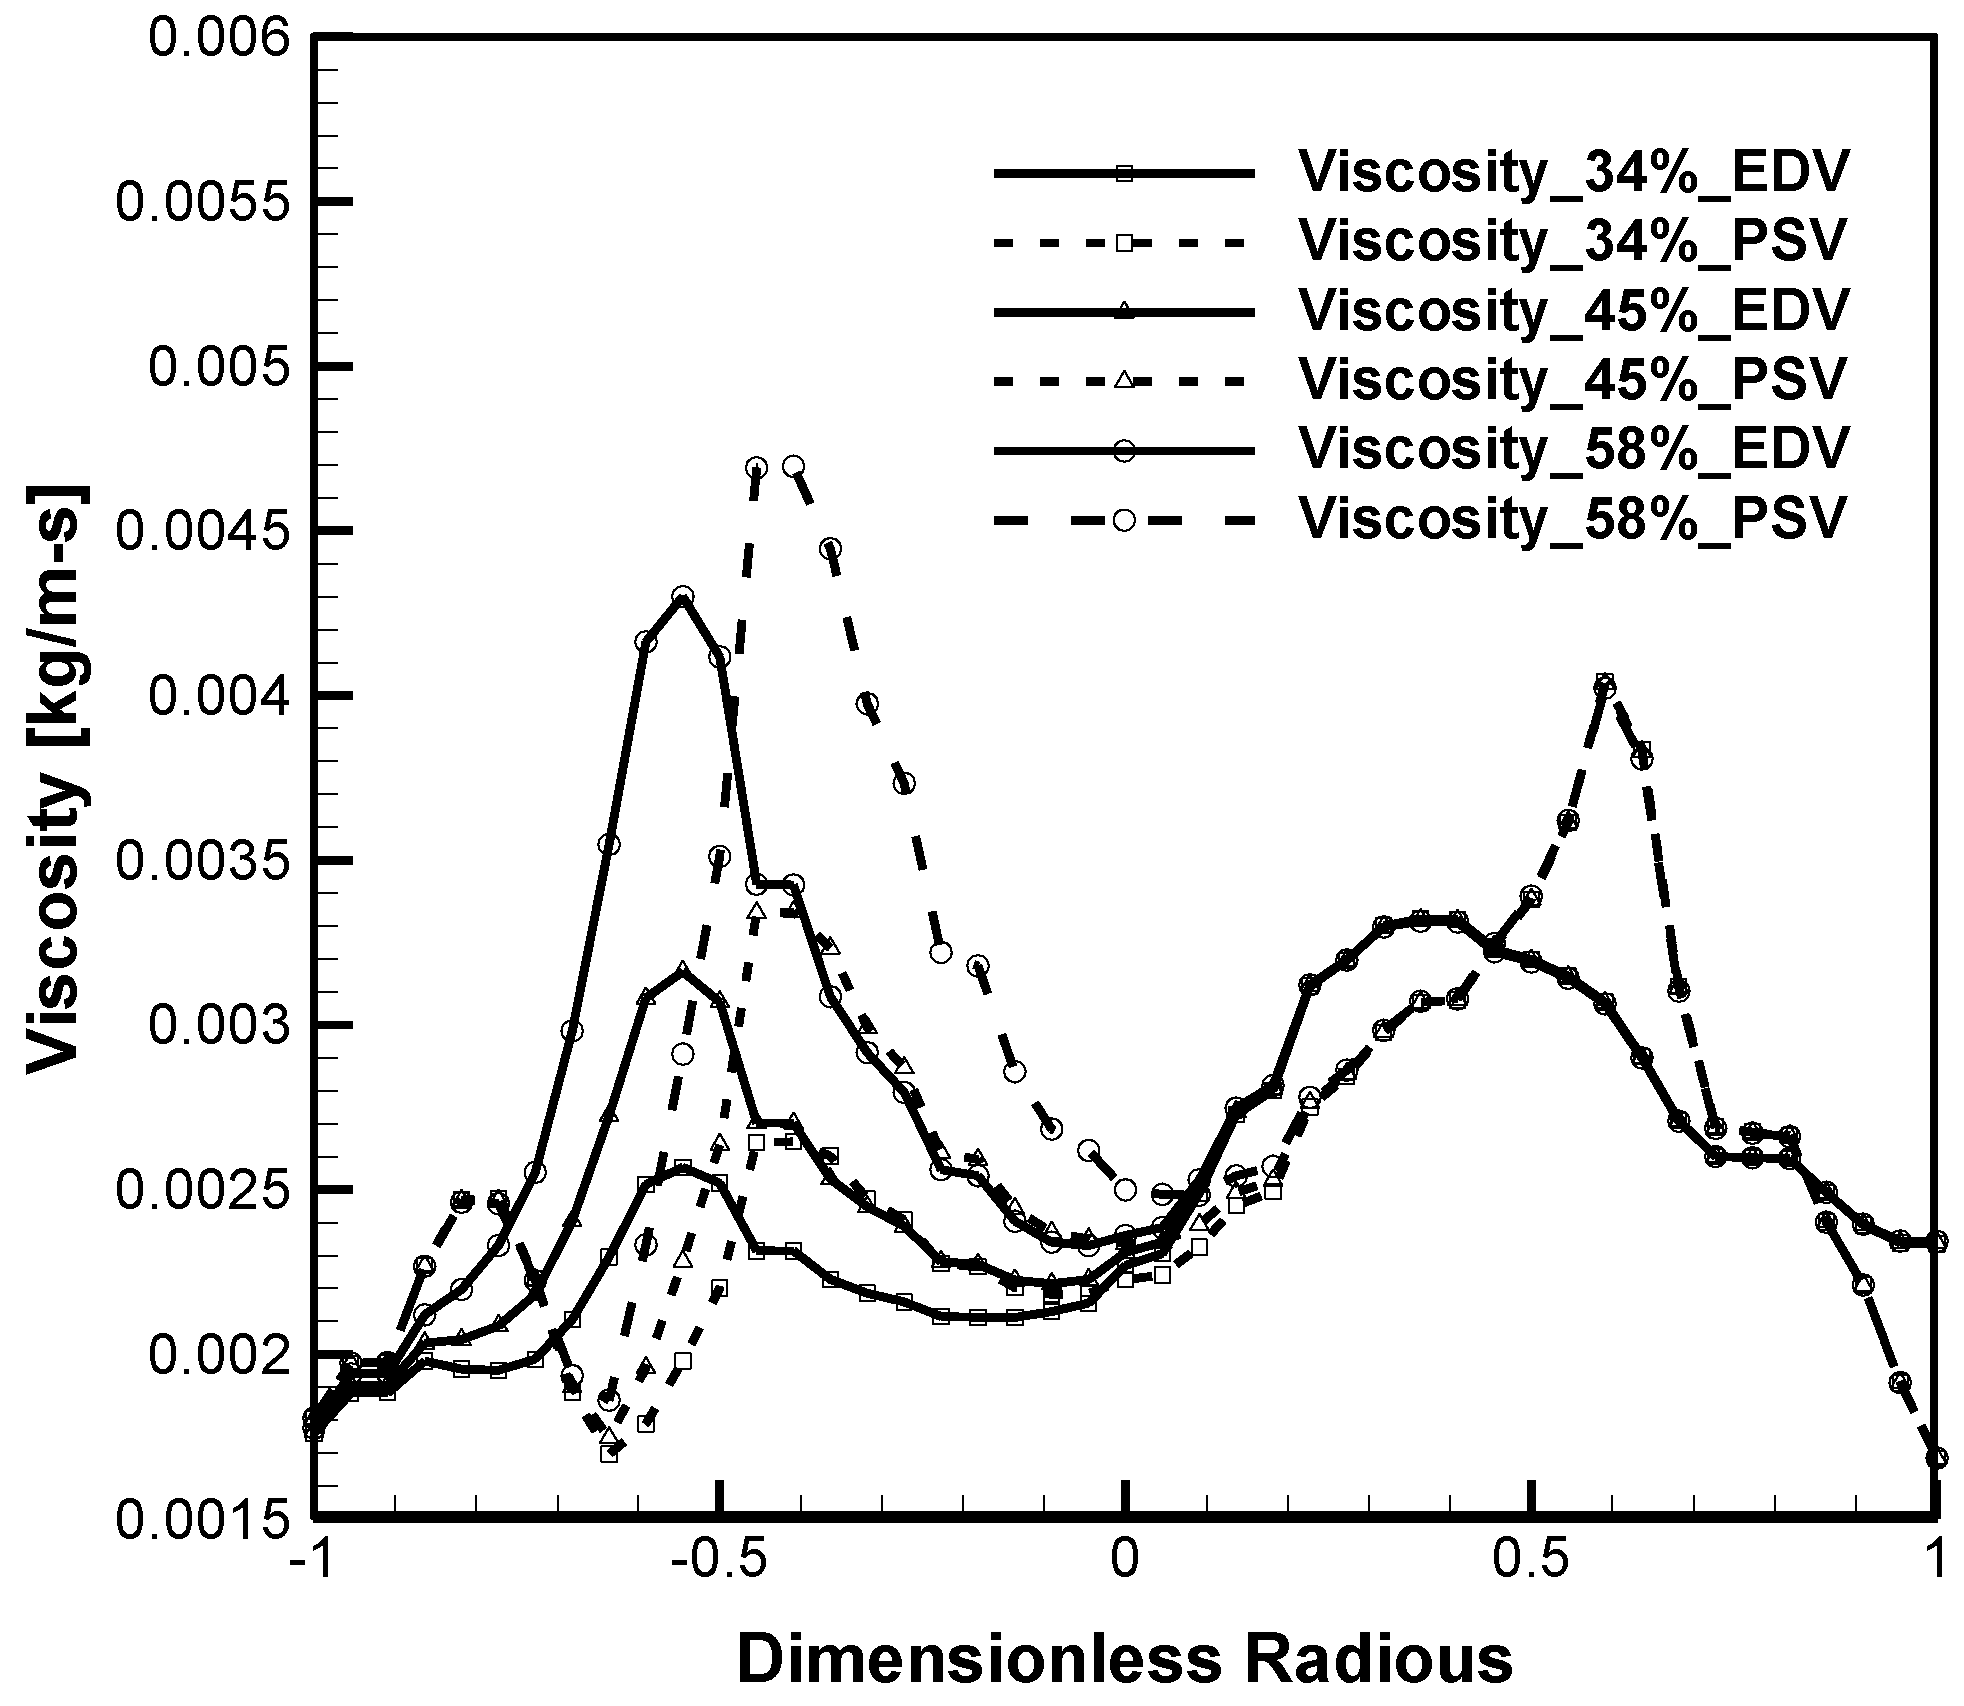
Figure 7 shows the viscosity at Line (E). The multiphase blood model has a characteristic of shear-thinning blood in which the viscosity decreases as the shear rate of the blood increases, and the viscosity increases as the hematocrit increases. The viscosity is generally low near the wall and high at the center of the flow because the shear rate is high near the wall. Viscosity varies according to hematocrit in areas with high hematocrit blood flow from the graft (dimensionless radius −1 to 0). On the contrary, the viscosity does not change according to the hematocrit between dimensionless 0 and 1, where there is no change in hematocrit.
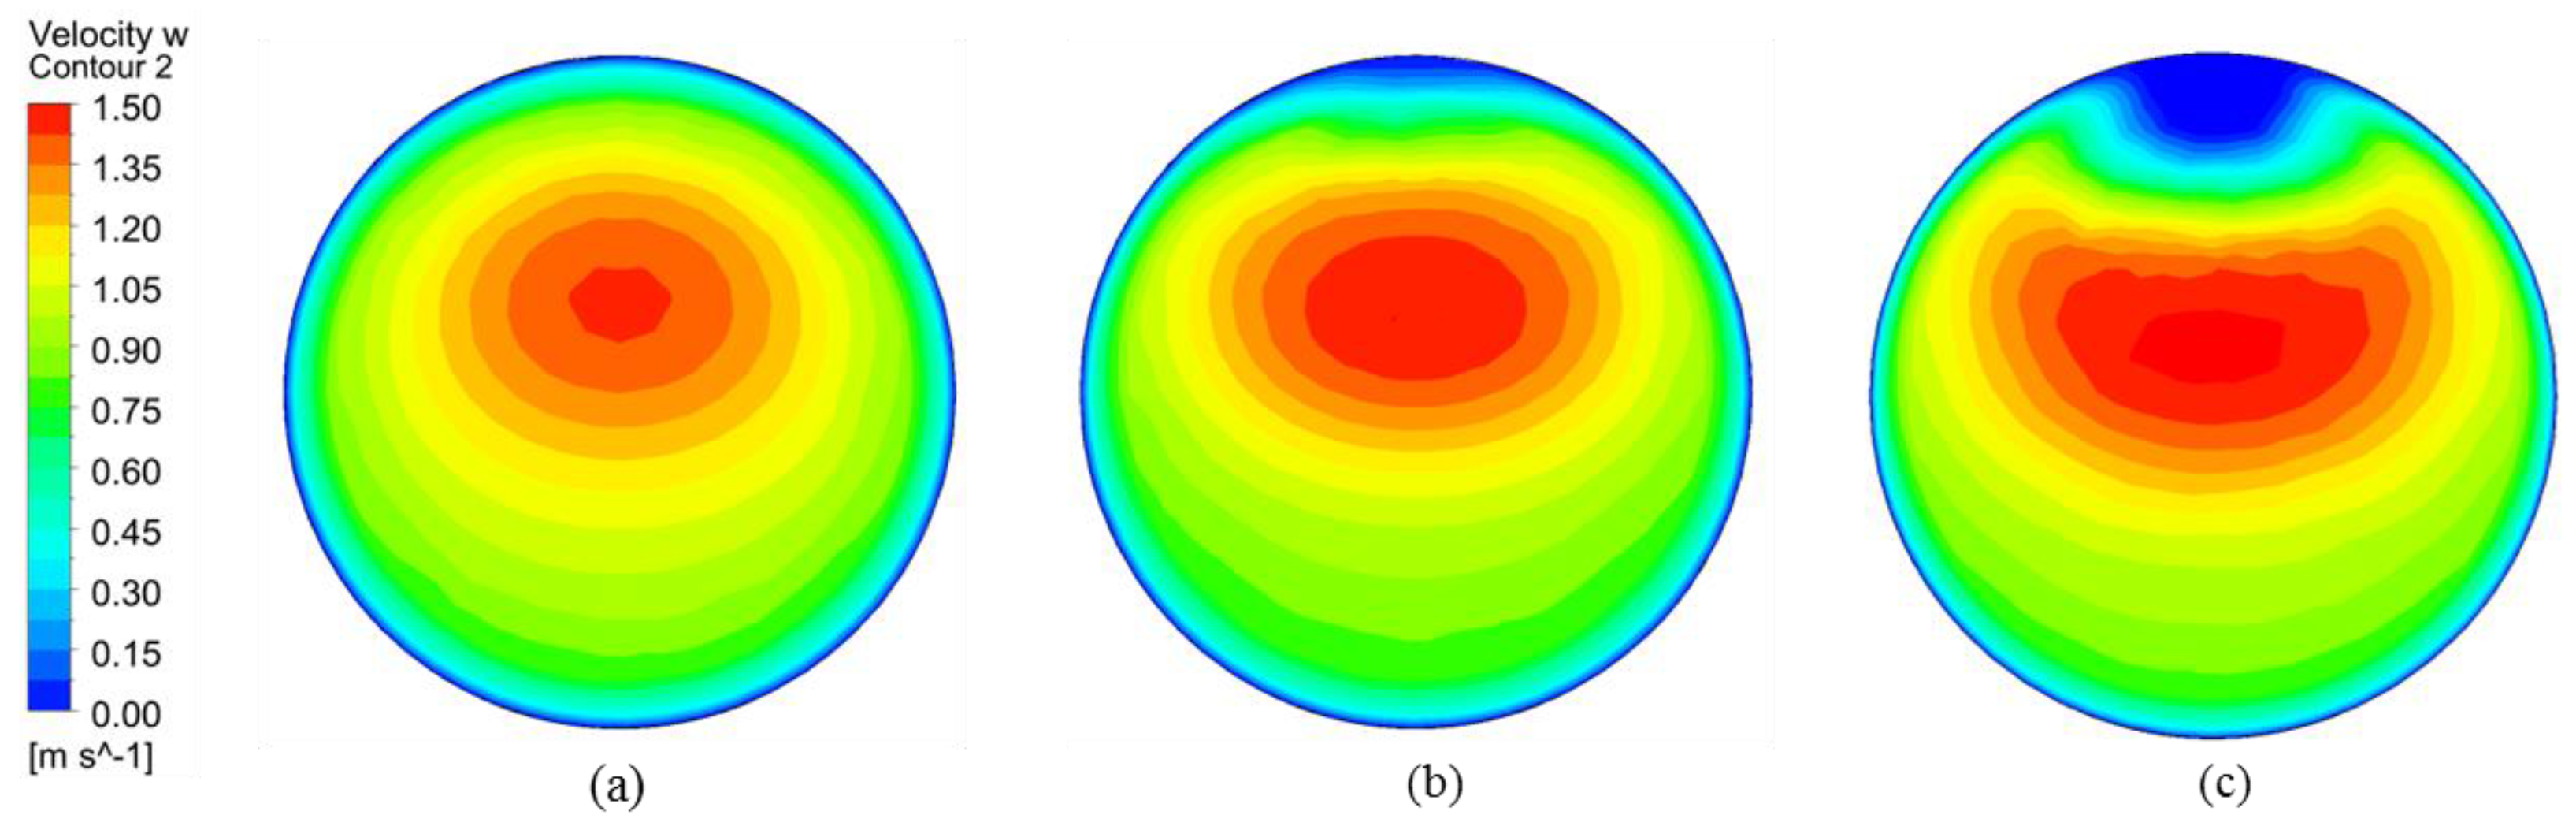
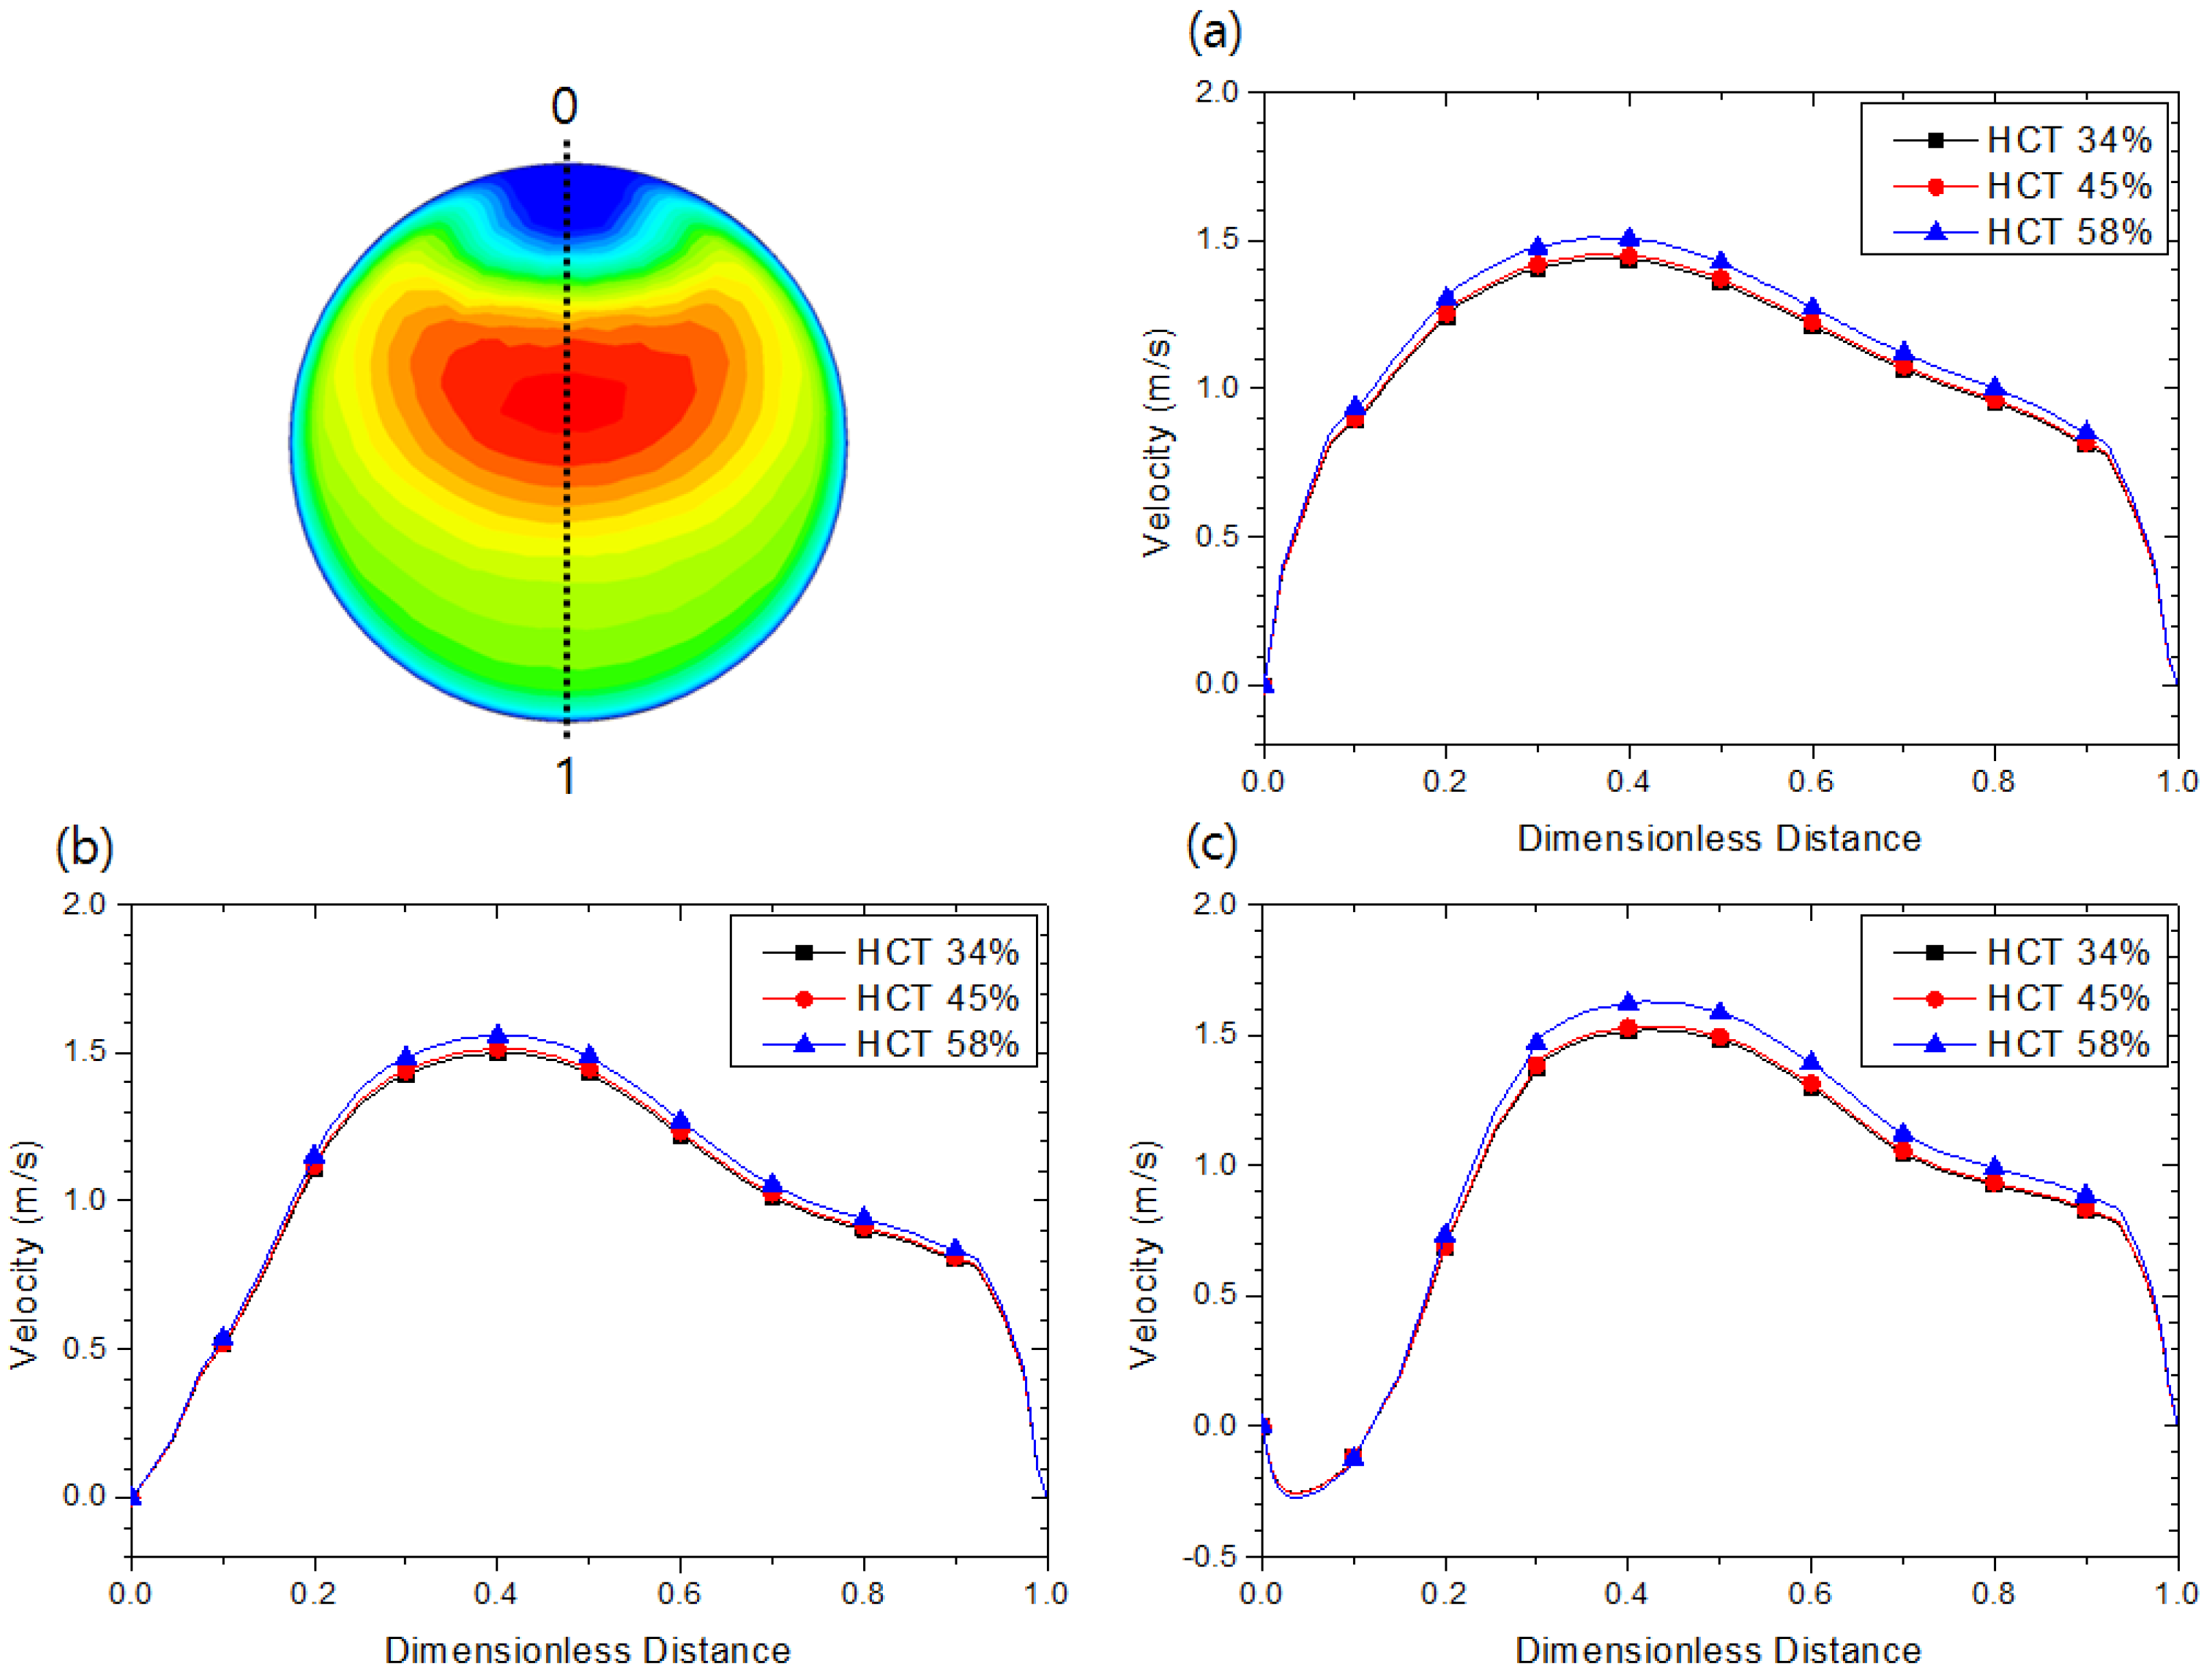
Figure 8 is the contour of the X-Y plane for the velocity w component at the Line (E) location with hematocrit 58%. The anastomosis angles of Figure 8a–c are 15°, 30°, and 45°, respectively. As the anastomosis angle increases, the flow velocity from the graft to the vein anastomosis increases in an elliptical shape. On the contrary, the flow rate toward the upper surface decreases. The reason for the decrease in the flow velocity on the upper surface side is that recirculation flow occurs.
Figure 9 is the velocity, w, distribution according to hematocrit. The higher the hematocrit, the higher the peak velocity, w, tends to increase slightly. In particular, in the case of 45°, where the relatively high flow velocity range is concentrated in the center, the shear rate at the center is lowered, and as can be seen in Figure 2, the viscosity increases rapidly at the low shear rate range, so the change in the velocity, w, tends to increase.
4.2. Effect of the Anastomosis Angle
Vascular responses to high blood flow and WSS, and to low blood flow and WSS, are known to be endothelial cell-dependent [24]. The response to WSS varies between the autogenous AVF and the prosthetic AVG. For autogenous vein fistulas, intimal thickening was reported to correlate with low blood velocity and resulting low WSS [25,26]. On the contrary, on the venous side of AVG, higher blood flow leads to flow disturbances and intima-media thickening [27].
In our numerical study, a low WSS of < 0.2 Pa region was not observed. Therefore, we took higher WSS into consideration, which corresponds to the higher endothelial damage and resultant intimal hyperplasia.
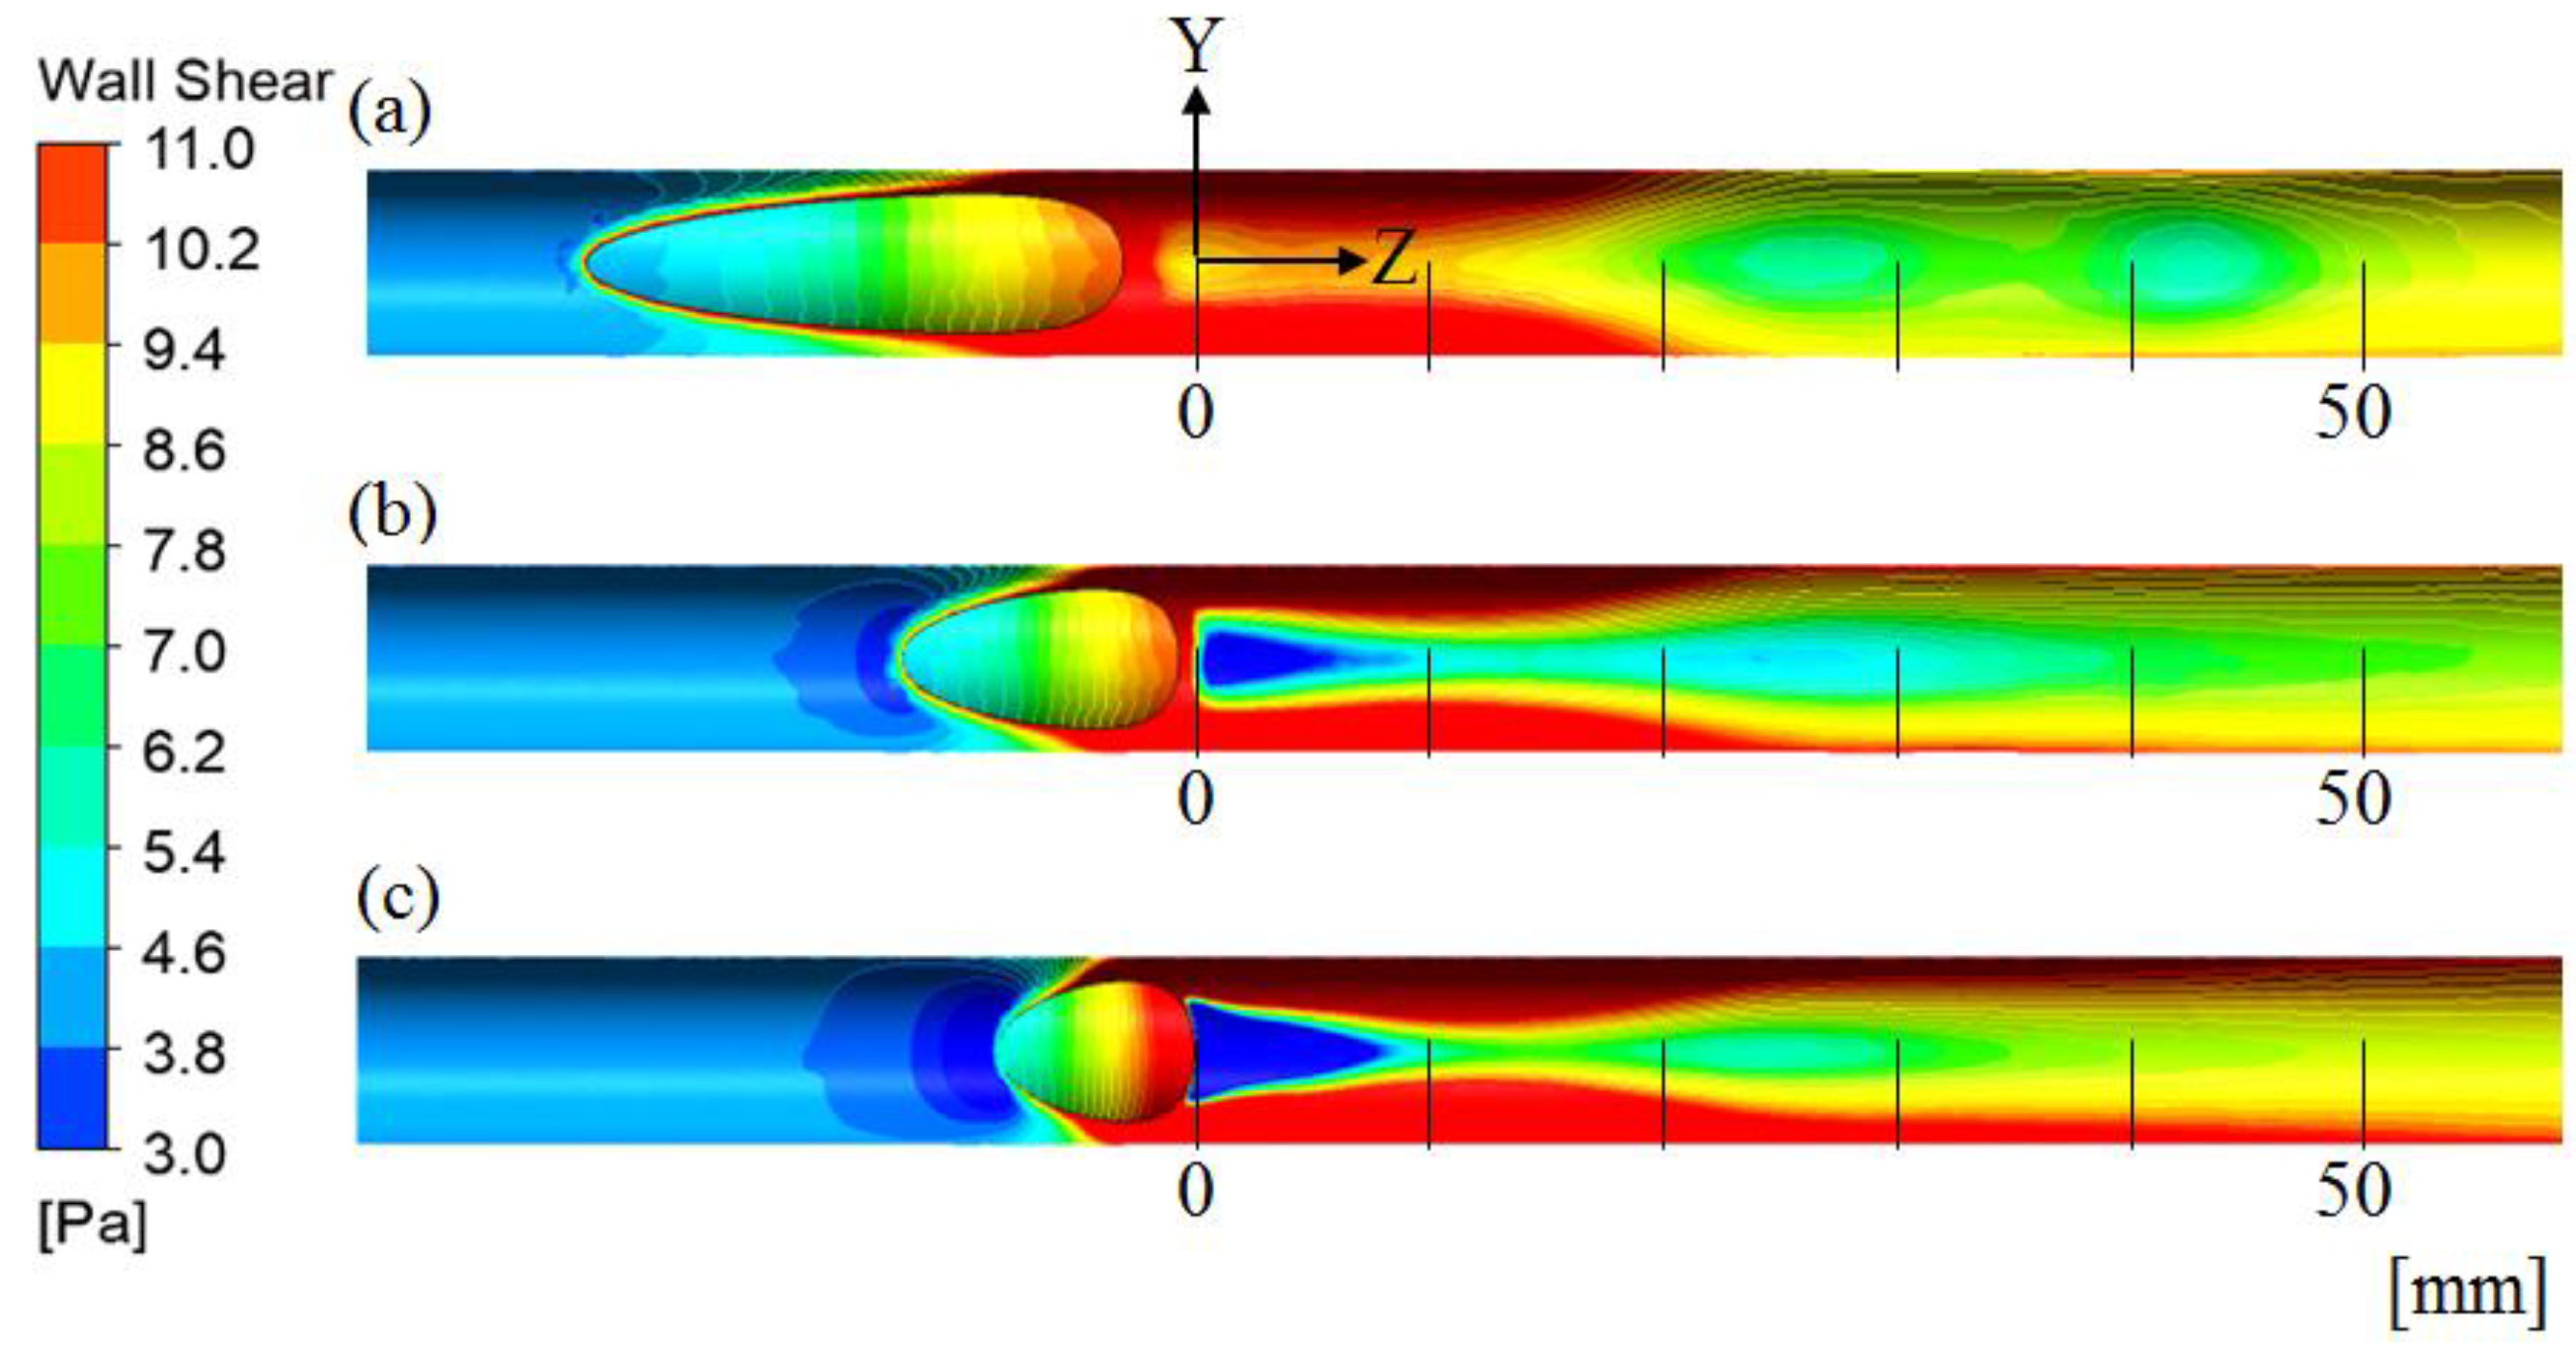
Figure 10 represents the WSS contour at the upper surface of the vein divided by the Y-Z plane (x = 0) ((a) Case 1: θg = 15°, (b) Case 2: θg = 30°, and (c) Case 3: θg = 45°, hematocrit of injection needle is 58%). The WSS after the anastomosis (z = 0) showed over 3 Pa on the whole wall of the vein in Case 1, while the WSS of Cases 2 and 3 was <3 Pa, which corresponds to the shear stress of the normal limit of the vein. The lowest WSS value was 0.311 Pa at the upper surface of z-1.
The WSS near the anastomosis was associated with the flow characteristics, which depends on the angle of anastomosis. The reason WSS was lower than 3 Pa in Cases 2 and 3 is that the flow velocity change near the wall is relatively low, as shown in Figure 9b,c. In particular, in Case 3, the very low WSS region occurs relatively broadly, as can be seen in Figure 9c, because the flow near the wall causes the recirculation flow in the opposite direction to the main flow, which flows from the graft to the vein anastomosis.
In addition, high WSS, >11 Pa, occurs on both Y-axis walls. In particular, as the anastomosis angle increases, the high WSS area of both walls increases because the high flow velocity range is formed relatively close in the direction of both walls, as shown in Figure 8c. If the gradient of the flow velocity near the wall is large, the shear rate increases and the WSS also increases. Excessively high or low WSS is known to cause problems, such as intimal hyperplasia. Therefore, in terms of high WSS, Case 2 and Case 3 are advantageous in the vicinity of the anastomosis (Z < 10 mm), but there is a disadvantage in that the high WSS region is widened in the Z direction. Low WSS regions occur locally only below the anastomosis area (Z < 10 mm).
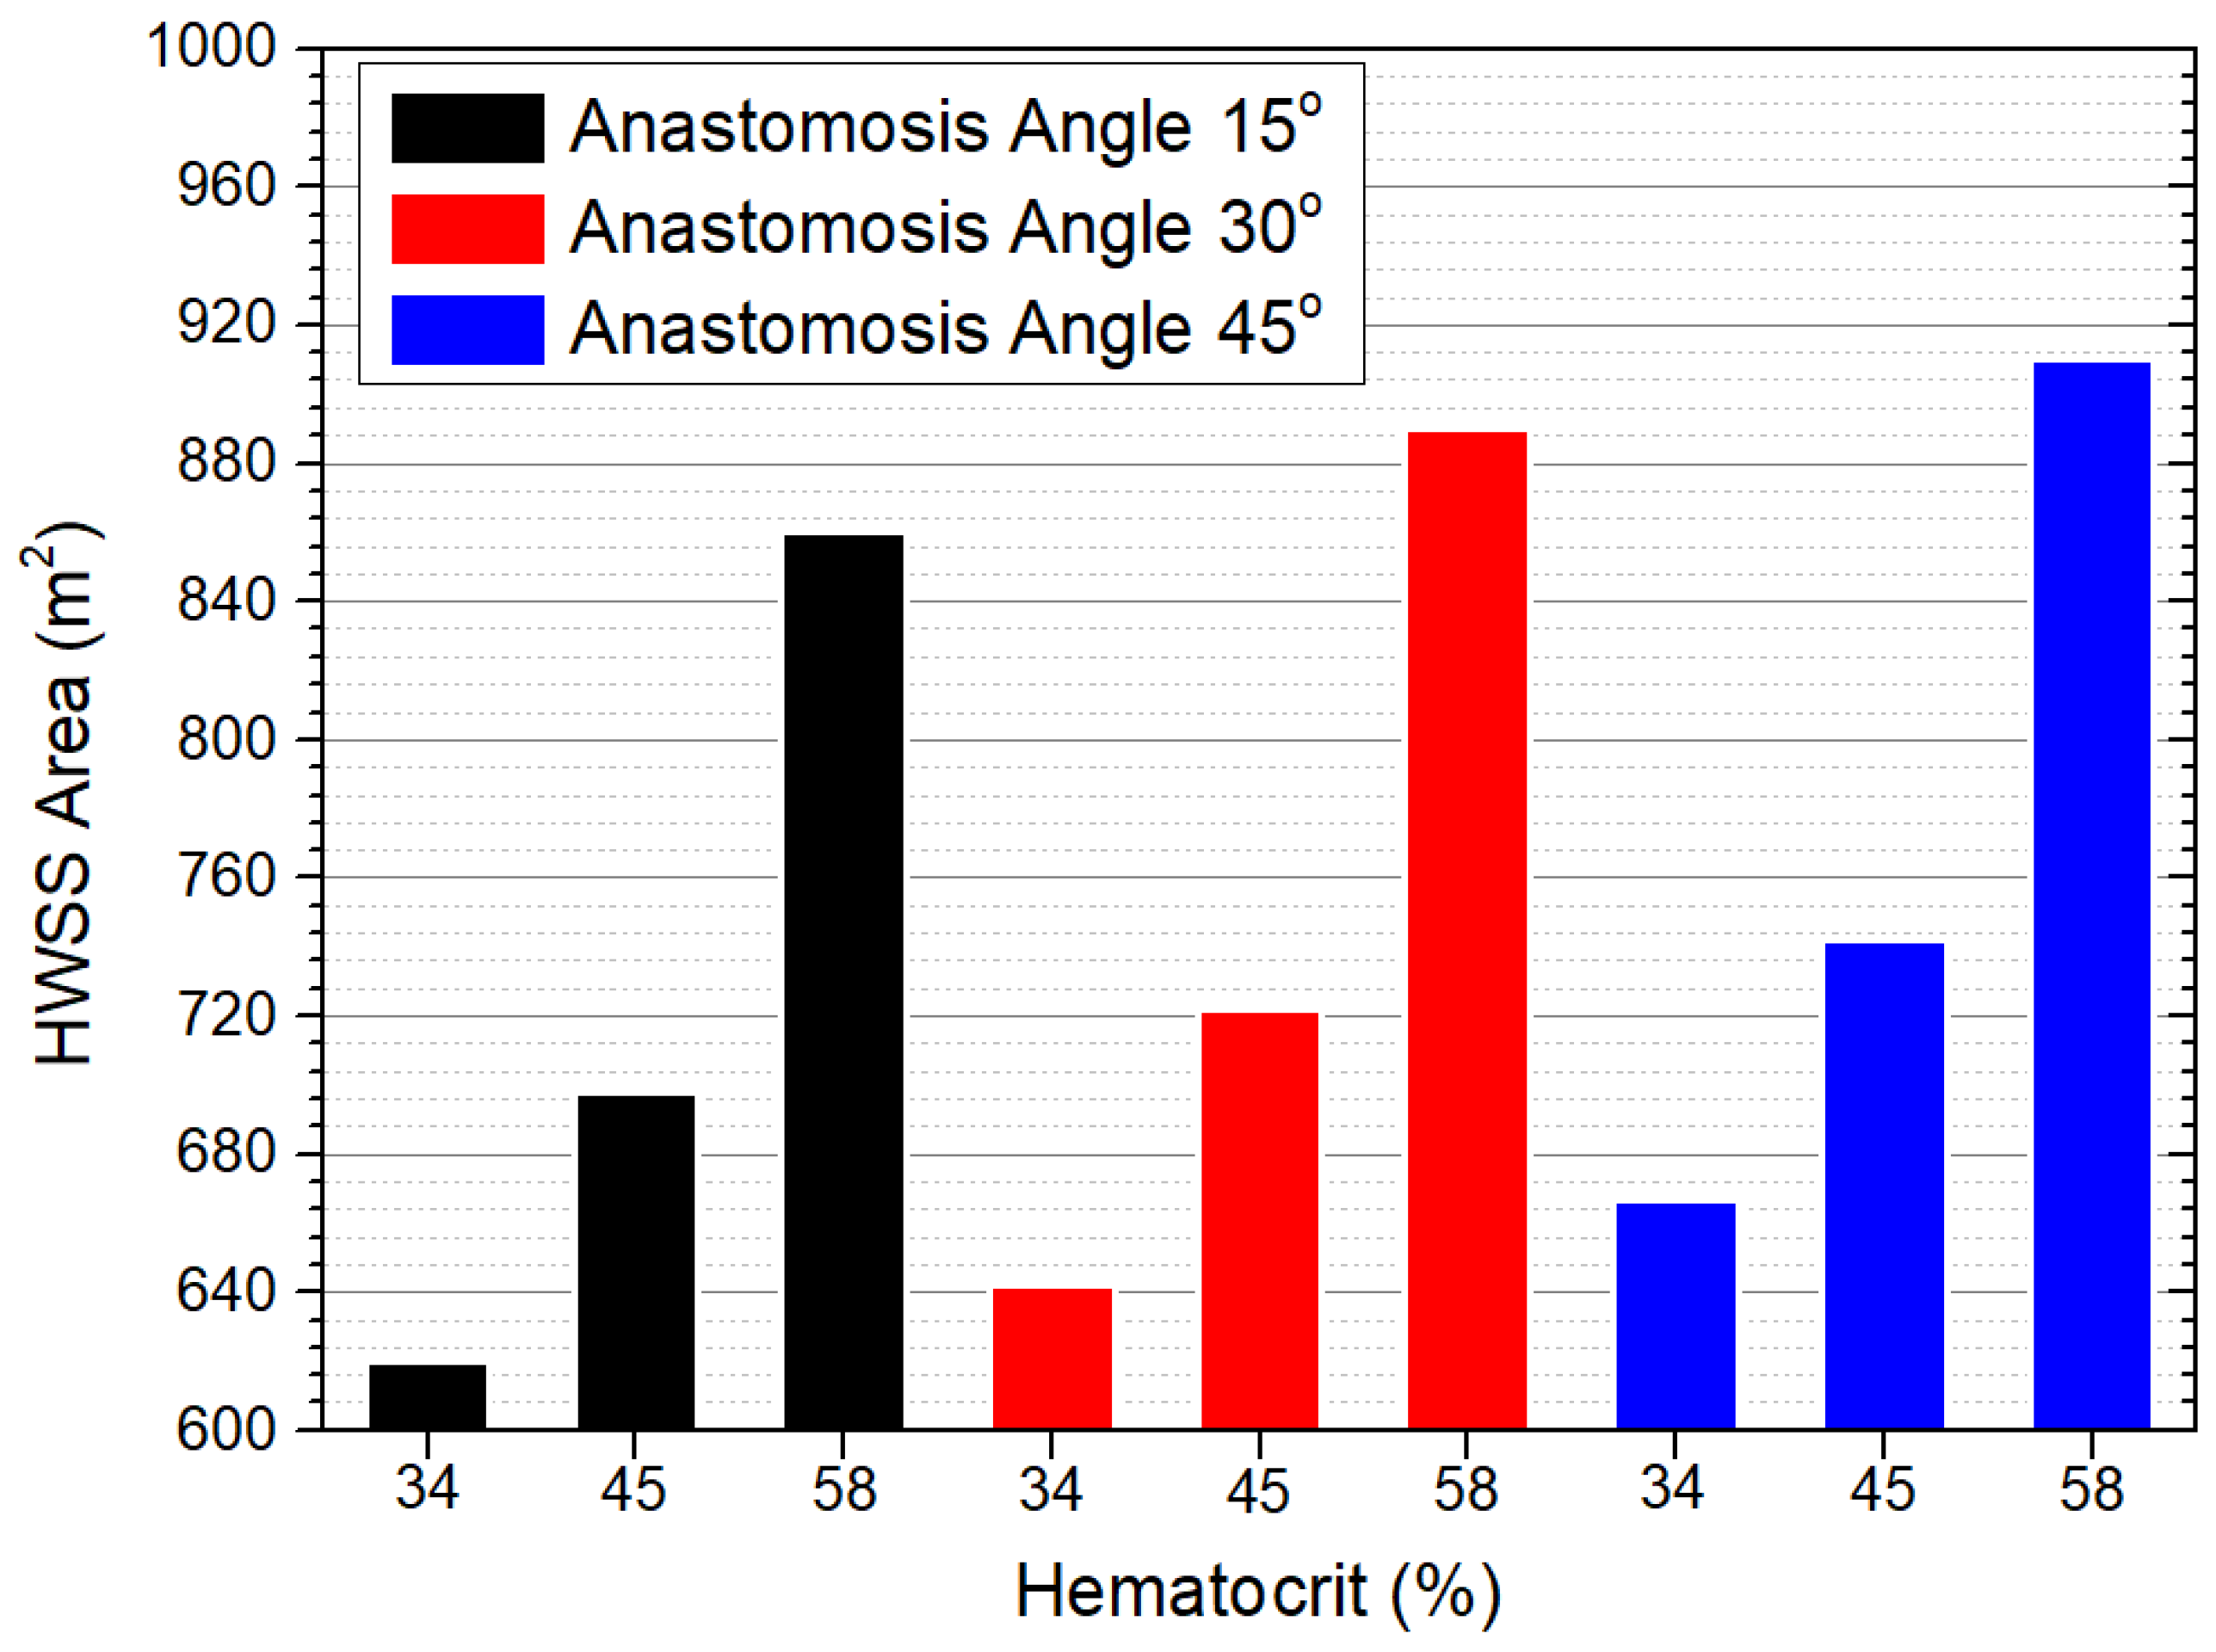
Figure 11 shows the high WSS area over 11 Pa. The variation of the high WSS area is up to about 38%, depending on the anastomotic angle. However, as described in Figure 10 above, at a low anastomosis angle, a high WSS area occurs near the anastomotic site, and at a high anastomosis angle, a high WSS area occurs at a location away from the anastomosis site.
In this study, the shape was simplified as much as possible for a parameter study on the effect of WSS with hematocrit. Therefore, it is difficult to conclude which anastomosis angle is appropriate considering the actual shape of vein anastomosis and the characteristics, such as vasodilation and intimal hyperplasia. Therefore, it is necessary to examine which angle is advantageous in terms of intimal proliferation and more diverse viewpoints.
Additionally, there is a limitation in size, similar to the diameter of the vessels applied in the study. If the blood vessel is excessively dilated or has an excessively different shape, additional considerations for the flow are required.
Finally, this study contributed to analyzing the effect of hematocrit considered flow in AVG from the point of view of hemodynamics.
5. Conclusions
According to the arteriovenous graft numerical analysis, the following conclusions were derived.
The larger the anastomosis angle, the lower the risk of WSS near the anastomosis site, but the higher WSS area increases to the side of the vein wall away from the anastomosis site. Further, a low wall shear stress area occurs near the anastomosis site in larger anastomosis angles. Therefore, the effect of high wall shear stress has advantages in the vicinity of the anastomosis as the anastomosis angle is larger, but disadvantages as the distance from the anastomosis increases. Moreover, patients with low hematocrit are advantageous for WSS area.
Author Contributions
Conceptualization, H.K.; Methodology, J.T.K.; Software, J.T.K.; Validation, J.T.K. and H.S.R.; Formal Analysis, J.T.K.; Investigation, J.T.K. and H.S.R.; Resources, J.T.K. and H.S.R.; Data Curation, H.K.; Writing—Original Draft Preparation, J.T.K. and H.K.; Writing—Review and Editing, J.T.K., H.S.R. and H.K. Visualization, J.T.K. and H.K.; Supervision, H.S.R. All authors have read and agreed to the published version of the manuscript.
Funding
This research was supported by the convergence research grants between Medicine and Engineering, Chung-Ang University in 2010. This research was supported through BK21 FOUR (Fostering Outstanding Universities for Research) Program funded by Ministry of Education of Korea (No. I21SS7609062).
Institutional Review Board Statement
The study was conducted in accordance with the guidelines of the Declaration of Helsinki and was approved by the Institutional Review Board of the Chung-Ang university hospital (protocol code C2016074(1817).
Informed Consent Statement
The requirement for patient consent was waived due to the retrospective nature of the study.
Conflicts of Interest
The authors declare no conflict of interest.
References
- Lok, C.E.; Huber, T.S.; Lee, T.; Shenoy, S.; Yevzlin, A.S.; Abreo, K.; Allon, M.; Asif, A.; Astor, B.C.; Glickman, M.H.; et al. KDOQI Clinical Practice Guideline for Vascular Access: 2019 Update. Am. J. Kidney Dis. 2020, 75 (Suppl. 2), S1–S164. [Google Scholar] [CrossRef] [PubMed] [Green Version]
- Riella, M.C.; Roy-Chaudhury, P. Vascular access in haemodialysis: Strengthening the Achilles’ heel. Nat. Rev. Nephrol. 2013, 9, 348. [Google Scholar] [CrossRef]
- Feldman, H.I.; Kobrin, S.; Wasserstein, A. Hemodialysis vascular access morbidity. J. Am. Soc. Nephrol. 1996, 7, 523–535. [Google Scholar] [CrossRef]
- Malovrh, M. Interventional Nephrology and Dialysis: The Role of Sonography in the Planning of Arteriovenous Fistulas for Hemodialysis. Semin. Dial. 2003, 16, 299–303. [Google Scholar] [CrossRef] [PubMed]
- Brahmbhatt, A.; Misra, S. The biology of hemodialysis vascular access failure. Semin. Interv. Radiol. 2016, 33, 015–020. [Google Scholar] [CrossRef] [PubMed] [Green Version]
- Skartsis, N.; Manning, E.; Wei, Y.; Velazquez, O.C.; Liu, Z.J.; Goldschmidt-Clermont, P.J.; Salman, L.H.; Asif, A.; Vazquez-Padron, R.I. Origin of neointimal cells in arteriovenous fistulae: Bone marrow, artery, or the vein itself? Semin. Dial. 2011, 24, 242–248. [Google Scholar] [CrossRef] [PubMed] [Green Version]
- Kraiss, L.W.; Geary, R.L.; Mattsson, E.J.; Vergel, S.; Au, Y.P.; Clowes, A.W. Acute reductions in blood flow and shear stress induce platelet-derived growth factor-A expression in baboon prosthetic grafts. Circ. Res. 1996, 79, 45–53. [Google Scholar] [CrossRef]
- Collins, M.J.; Li, X.; Lv, W.; Yang, C.; Protack, C.D.; Muto, A.; Jadlowiec, C.C.; Shu, C.; Dardik, A. Therapeutic strategies to combat neointimal hyperplasia in vascular grafts. Expert Rev. Cardiovasc. 2012, 10, 635–647. [Google Scholar] [CrossRef]
- Staalsen, N.-H.; Ulrich, M.; Winther, J.; Pedersen, E.M.; How, T.; Nygaard, H. The anastomosis angle does change the flow fields at vascular end-to-side anastomoses in vivo. J. Vasc. Surg. 1995, 21, 460–471. [Google Scholar] [CrossRef] [Green Version]
- Nanjo, H.; Sho, E.; Komatsu, M.; Sho, M.; Zarins, C.K.; Masuda, H. Intermittent short-duration exposure to low wall shear stress induces intimal thickening in arteries exposed to chronic high shear stress. Exp. Mol. Pathol. 2006, 80, 38–45. [Google Scholar] [CrossRef]
- Misra, S.; Fu, A.A.; Misra, K.D.; Glockner, J.F.; Mukhopadhyay, D. Wall shear stress measurement using phase contrast magnetic resonance imaging with phase contrast magnetic resonance angiography in arteriovenous polytetrafluoroethylene grafts. Angiology 2009, 60, 441–447. [Google Scholar] [CrossRef] [Green Version]
- Boghosian, M.; Cassel, K.; Hammes, M.; Funaki, B.; Kim, S.; Qian, X.; Wang, X.; Dhar, P.; Hines, J. Hemodynamics in the cephalic arch of a brachiocephalic fistula. Med. Eng. Phys. 2014, 36, 822–830. [Google Scholar] [CrossRef] [PubMed] [Green Version]
- Carroll, G.T.; McGloughlin, T.M.; Burke, P.E.; Egan, M.; Wallis, F.; Walsh, M.T. Wall shear stresses remain elevated in mature arteriovenous fistulas: A case study. J. Biomech. Eng. 2011, 133, 021003. [Google Scholar] [CrossRef]
- Carroll, G.T.; McGloughlin, T.M.; O’Keeffe, L.M.; Callanan, A.; Walsh, M.T. Realistic Temporal Variations of Shear Stress Modulate MMP-2 and MCP-1 Expression in Arteriovenous Vascular Access. Cell. Mol. Bioeng. 2009, 2, 591–605. [Google Scholar] [CrossRef]
- McGah, P.M.; Leotta, D.F.; Beach, K.W.; Aliseda, A. Effects of wall distensibility in hemodynamic simulations of an arteriovenous fistula. Biomech. Model. Mechanobiol. 2014, 13, 679–695. [Google Scholar] [CrossRef] [PubMed] [Green Version]
- McGah, P.M.; Leotta, D.F.; Beach, K.W.; Eugene Zierler, R.; Aliseda, A. Incomplete restoration of homeostatic shear stress within arteriovenous fistulae. J. Biomech. Eng. 2013, 135, 011005. [Google Scholar] [CrossRef] [Green Version]
- Ene-Iordache, B.; Cattaneo, L.; Dubini, G.; Remuzzi, A. Effect of anastomosis angle on the localization of disturbed flow in ‘side-to-end’ fistulae for haemodialysis access. Nephrol. Dial. Transplant. 2013, 28, 997–1005. [Google Scholar] [CrossRef] [PubMed]
- Hakaim, A.G.; Nalbandian, M.N.; Heller, J.K.; Chowla, A.C.; Oldenburg, W.A. Improved patency of prosthetic arteriovenous grafts with an acute anastomotic angle and flow diffuser. J. Vasc. Surg. 2003, 37, 1032–1035. [Google Scholar] [CrossRef] [PubMed] [Green Version]
- Yang, C.-Y.; Li, M.-C.; Lan, C.-W.; Lee, W.-J.; Lee, C.-J.; Wu, C.-H.; Tang, J.-M.; Niu, Y.-Y.; Lin, Y.-P.; Shiu, Y.-T.; et al. The Anastomotic Angle of Hemodialysis Arteriovenous Fistula Is Associated With Flow Disturbance at the Venous Stenosis Location on Angiography. Front. Bioeng. Biotechnol. 2020, 8, 846. [Google Scholar] [CrossRef] [PubMed]
- Tordoir, J.H.M.; Zonnebeld, N.; van Loon, M.M.; Gallieni, M.; Hollenbeck, M. Surgical and Endovascular Intervention for Dialysis Access Maturation Failure During and After Arteriovenous Fistula Surgery: Review of the Evidence. Eur. J. Vasc. Endovasc. Surg. 2018, 55, 240–248. [Google Scholar] [CrossRef] [Green Version]
- Jung, J.; Hassanein, A. Three-phase CFD analytical modeling of blood flow. Med. Eng. Phys. 2008, 30, 91–103. [Google Scholar] [CrossRef] [PubMed]
- Scardulla, F.; Pasta, S.; D’Acquisto, L.; Sciacca, S.; Agnese, V.; Vergara, C.; Quarteroni, A.; Clemenza, F.; Bellavia, D.; Pilato, M. Shear stress alterations in the celiac trunk of patients with a continuous-flow left ventricular assist device as shown by in-silico and in-vitro flow analyses. J. Heart Lung Transpl. 2017, 36, 906–913. [Google Scholar] [CrossRef]
- Elhanafy, A.; Elsaid, A.; Guaily, A. Numerical investigation of hematocrit variation effect on blood flow in an arterial segment with variable stenosis degree. J. Mol. Liq. 2020, 313, 113550. [Google Scholar] [CrossRef]
- Masuda, H.; Kawamura, K.; Sugiyama, T.; Kamiya, A. Effects of endothelial denudation in flow-induced arterial dilatation. Front. Med. Biol. Eng. 1993, 5, 57–62. [Google Scholar] [PubMed]
- Dobrin, P.B.; Littooy, F.N.; Endean, E.D. Mechanical factors predisposing to intimal hyperplasia and medial thickening in autogenous vein grafts. Surgery 1989, 105, 393–400. [Google Scholar] [PubMed]
- Franzoni, M.; Cattaneo, I.; Longaretti, L.; Figliuzzi, M.; Ene-Iordache, B.; Remuzzi, A. Endothelial cell activation by hemodynamic shear stress derived from arteriovenous fistula for hemodialysis access. Am. J. Physiol. Heart Circ. Physiol. 2016, 310, H49–H59. [Google Scholar] [CrossRef] [Green Version]
- Fillinger, M.F.; Reinitz, E.R.; Schwartz, R.A.; Resetarits, D.E.; Paskanik, A.M.; Bredenberg, C.E. Beneficial effects of banding on venous intimal-medial hyperplasia in arteriovenous loop grafts. Am. J. Surg. 1989, 158, 87–94. [Google Scholar] [CrossRef]
Figure 1.
Configuration of the forearm loop access. Either superficial veins located in the antecubital fossa (A) or the basilic vein right above the elbow joint (B) can be selected as an outflow vein. When comparing with the antecubital veins as the outflow, the basilic vein above the elbow joint provides an almost parallel course to the graft. (Arrow: venous anastomosis).

Figure 2.
Viscosity distribution with hematocrit.

Figure 3.
Geometry and boundary conditions of AVG. Artery inlet; Hematocrit: 34% (A), Suction needle (B), Injection needle; Hematocrit: 34%, 45%, 58% (C), Anastomosis angle; 15°, 30°, 45° (D), Venin outlet (E), Artery outlet (F).
Figure 3.
Geometry and boundary conditions of AVG. Artery inlet; Hematocrit: 34% (A), Suction needle (B), Injection needle; Hematocrit: 34%, 45%, 58% (C), Anastomosis angle; 15°, 30°, 45° (D), Venin outlet (E), Artery outlet (F).

Figure 4.
Velocity profile throughout the cardiac cycle at the graft and vein.

Figure 5.
Grid independence test at Line (D).

Figure 6.
Hematocrit distribution at Line (E), anastomosis angle is 45°, the hematocrit is concentrated in a parabolic shape under the influence of flow from the graft.
Figure 6.
Hematocrit distribution at Line (E), anastomosis angle is 45°, the hematocrit is concentrated in a parabolic shape under the influence of flow from the graft.

Figure 7.
Viscosity distribution at Line (E), anastomosis angle is 45°.

Figure 8.
Velocity w contour at the surface of Line (E), hematocrit is 58%, anastomosis angle of (a–c) are 15°, 30°, and 45°, respectively.
Figure 8.
Velocity w contour at the surface of Line (E), hematocrit is 58%, anastomosis angle of (a–c) are 15°, 30°, and 45°, respectively.

Figure 9.
Velocity, w, distribution according to the hematocrit at Line (E), anastomosis angle of (a–c) are 15°, 30°, and 45°, respectively.
Figure 9.
Velocity, w, distribution according to the hematocrit at Line (E), anastomosis angle of (a–c) are 15°, 30°, and 45°, respectively.

Figure 10.
Wall shear stress contour of the upper surface, hematocrit is 58%, anastomosis angle of (a–c) are 15°, 30°, and 45°, respectively.
Figure 10.
Wall shear stress contour of the upper surface, hematocrit is 58%, anastomosis angle of (a–c) are 15°, 30°, and 45°, respectively.

Figure 11.
High wall shear stress area over 11 Pa.


Table 1.
Diameter and anastomosis angle of the patients.
| Patient 1 | Patient 2 | Patient 3 | Patient 4 | Mean | |
|---|---|---|---|---|---|
| Graft diameter (mm) | 6.0 | 6.0 | 6.0 | 6.0 | 6.0 |
| Vein diameter (mm) | 7.0 | 8.7 | 7.1 | 9.2 | 8.0 |
| Artery diameter (mm) | 4.0 | 3.0 | 3.9 | 4.1 | 3.75 |
| Anastomosis angle | 15 | 18 | 21 | 30 |
Publisher’s Note: MDPI stays neutral with regard to jurisdictional claims in published maps and institutional affiliations. |
© 2021 by the authors. Licensee MDPI, Basel, Switzerland. This article is an open access article distributed under the terms and conditions of the Creative Commons Attribution (CC BY) license (https://creativecommons.org/licenses/by/4.0/).
Share and Cite
MDPI and ACS Style
Kim, J.T.; Kim, H.; Ryou, H.S. Hemodynamic Analysis on the Anastomosis Angle in Arteriovenous Graft Using Multiphase Blood Model. Appl. Sci. 2021, 11, 8160. https://doi.org/10.3390/app11178160
AMA Style
Kim JT, Kim H, Ryou HS. Hemodynamic Analysis on the Anastomosis Angle in Arteriovenous Graft Using Multiphase Blood Model. Applied Sciences. 2021; 11(17):8160. https://doi.org/10.3390/app11178160
Chicago/Turabian StyleKim, Ji Tae, Hyangkyoung Kim, and Hong Sun Ryou. 2021. "Hemodynamic Analysis on the Anastomosis Angle in Arteriovenous Graft Using Multiphase Blood Model" Applied Sciences 11, no. 17: 8160. https://doi.org/10.3390/app11178160
Note that from the first issue of 2016, this journal uses article numbers instead of page numbers. See further details here.