
Real-Time Surveillance System for Analyzing Abnormal Behavior of Pedestrians


Department of Image, Graduate School of Advanced Imaging Science, Multimedia and Film Chung-Ang University, Seoul 06974, Korea
*
Author to whom correspondence should be addressed.
†
These authors contributed equally to this work.
Appl. Sci. 2021, 11(13), 6153; https://doi.org/10.3390/app11136153
Submission received: 17 May 2021
/
Revised: 24 June 2021
/
Accepted: 27 June 2021
/
Published: 2 July 2021
(This article belongs to the Special Issue Advanced Intelligent Imaging Technology Ⅲ)
Abstract
:In spite of excellent performance of deep learning-based computer vision algorithms, they are not suitable for real-time surveillance to detect abnormal behavior because of very high computational complexity. In this paper, we propose a real-time surveillance system for abnormal behavior analysis in a closed-circuit television (CCTV) environment by constructing an algorithm and system optimized for a CCTV environment. The proposed method combines pedestrian detection and tracking to extract pedestrian information in real-time, and detects abnormal behaviors such as intrusion, loitering, fall-down, and violence. To analyze an abnormal behavior, it first determines intrusion/loitering through the coordinates of an object and then determines fall-down/violence based on the behavior pattern of the object. The performance of the proposed method is evaluated using an intelligent CCTV data set distributed by Korea Internet and Security Agency (KISA).
1. Introduction
Recent advances in deep learning technology have made a quantum leap in computer vision-based analysis of abnormal behavior in a CCTV environment. In most areas needing security, one or more surveillance cameras are installed to monitor or record the crime scene. More specifically, vision-based surveillance techniques try to detect and classify intrusion, loitering, fall-down, and violence, to name a few. Although various action recognition methods were proposed for abnormal behavior analysis in the literature, there are a few CCTV-based surveillance systems for analyzing abnormal behavior based on the identification of the same object. Since existing approaches to abnormal behavior analysis used datasets created for classifying general actions. We proposed a novel abnormal behavior analysis method in a CCTV environment by merging detection, tracking, and action recognition algorithms. Each algorithm in the proposed method can be optimized and replaced with other algorithms based on the application.
In this paper, we analyze a pedestrian’s abnormal behavior in a surveillance camera environment. To analyze the pedestrian’s abnormal behavior, the location and moving trajectory should be accurately estimated. For fast, reliable detection, we used you only look once (YOLO)v4 detector [1] with additional training data sets to deal with scale variation of the object in a real environment. Current state-of-the-art computer vision techniques still try to solve various challenging problems including: light changes, rapid motion, motion blur, deformation, occlusions, and rotations. In addition to accuracy and reliability, fast processing is another key to the visual surveillance for real-time analysis. Since a single video tracking algorithm cannot solve the complicated abnormal behavior analysis problem due to the problems mentioned so far, we combine visual tracking and object detection methods to compensate for tracking failures and update re-appearing pedestrians. To speed up the entire processing, the proposed method periodically performs detection to identify the location of the pedestrian at a given interval, and the kernelized correlation filter (KCF) tracks the location in the rest of video frames. Since the KCF tracker [2] cannot deal with the occlusion problem by itself, we assigned weights to color values to improve the tracking performance. The proposed method consists of two main modules: object detection and abnormal behavior analysis. For accurate analysis of abnormal behavior, we additionally insert the same object identification and inter-module communication subsystems. Pedestrian detection and tracking method is used in a module for identifying the location of a pedestrian, and an intruding or loitering pedestrian in a specific area can be detected using the coordinates of the tracked pedestrian. In this module, pedestrian information is stored to analyze the abnormal behavior of the same pedestrian, and the image of the pedestrian is transmitted to the abnormal behavior analysis module through TCP/IP communication to detect violence or fall. Three-dimensional (3D) ResNet [3] was used for real-time action recognition. We build training data including normal, violent, and falling actions in a CCTV environment. The proposed system is implemented using a deep neural network that is suitable for a real surveillance environment. The performance of the proposed method was evaluated using datasets distributed by Korea Internet and Security Agency (KISA) [4]. This paper is organized as follows: Section 2 summarizes the related works to analyze abnormal behavior. Section 3 describes the proposed abnormal behavior analysis method. Section 4 presents experimental results using KISA datasets, and Section 5 concludes the paper.
2. Related Work
To analyze an abnormal behavior, we need to classify normal and abnormal event classes. Support vector machine (SVM) was an early stage machine learning algorithm to classify normal and abnormal behaviors. Somaieh Amraee et al. proposed a method to detect an abnormal event using SVM based on the motion of the extracted region after removing redundant information by extracting a candidate region [5]. Kalaivani et al. used pyramid of histogram of oriented gradients (PHOG) to combine the shape and motion of the object with the histogram of the size, direction and entropy [6]. The extracted motion information is classified using SVM. To overcome the limitation of traditional machine learning techniques including SVM, motion estimation, and oriented gradient-based methods, a behavior recognition-based method recently used a two-stream network considering both temporal and spatial spaces [7]. Symonyan proposed a two-stream action recognition network using both spatial information and optical flow [8]. To recognize motion information in more efficient manner, convolutional neural network-based multiple-stream networks were proposed in the literature [9,10]. Neives et al. proposed an self-estimation training method using a teacher–student method based on initially estimated optical flow, and Karpathy et al. analyzed spatial information using convolutional neural network (CNN) and temporal information using Long Short-Term Memory (LSTM) [11,12]. Joao proposed Inflated 3D ConvNet (I3D) that can pre-train a 3D neural network by designing an extended network after training a 2D neural network for action recognition [13]. Wang et al. takes the results of the I3D as inputs to four streams followed by normalization. For higher performance action recognition, feature vectors were normalized and then connected in [14]. Human pose information was additionally used for abnormal behavior analysis [15,16,17].
Recently, various action recognition and detection methods were applied for visual surveillance systems [18,19,20,21]. Mojarad et al. proposed an anomaly detection system using sensors [21]. The sensor-based detection approach is more accurate than a single image-based method at the cost of additional sensors. Ji et al. analyzed abnormal behavior using a tiny YOLO model implemented on an embedded board for commercial surveillance systems [19]. At the cost of the light-weight two-dimensional (2D) implementation, its behavior classification performance is lower than that of the 3D-CNN-based behavior recognition algorithm. Hu et al. proposed a three-step method to analyze abnormal behavior using Faster Region-based Convolutional Neural Network (Faster R-CNN) [22], Histogram of Large Scale Optical Flow (HLSOF) descriptor, and Multiple Instance Support Vector Machine (MISVM) [20]. Hu’s method analyzes abnormal behavior by efficiently characterizing action, but it does not have a system for efficiently managing crowd objects. To address the aforementioned issues, we propose an efficient abnormal behavior analysis method using a single image-based object management system. Since there are few approaches under low-light or low-resolution environments, it is not easy to get public datasets except KISA dataset that is optimized for CCTV environments including low-light and low-resolution environments. Most of the existing abnormal behavior studies evaluate the performance of behavior recognition algorithms using public datasets.
3. Proposed Method
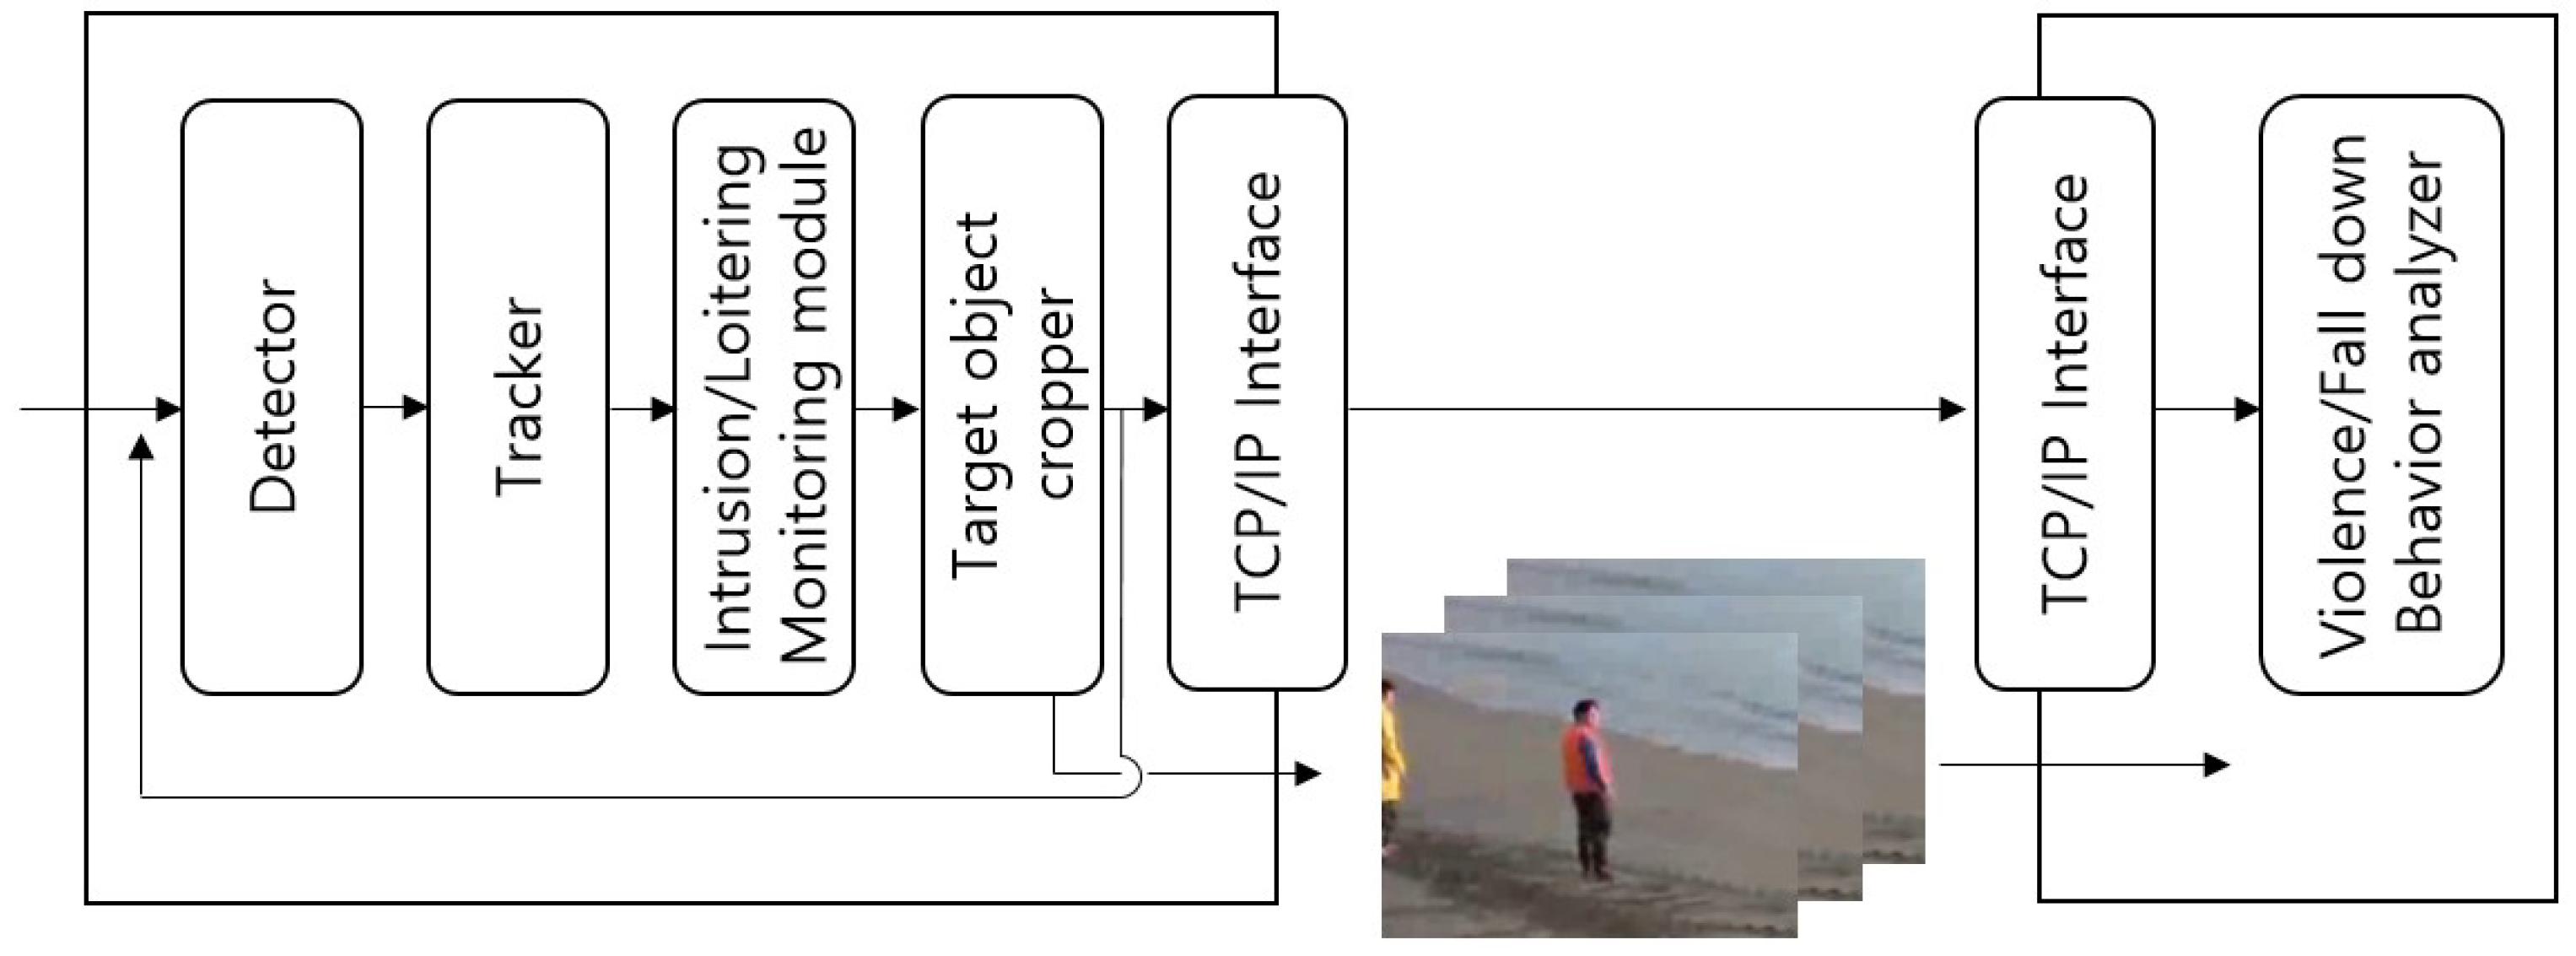
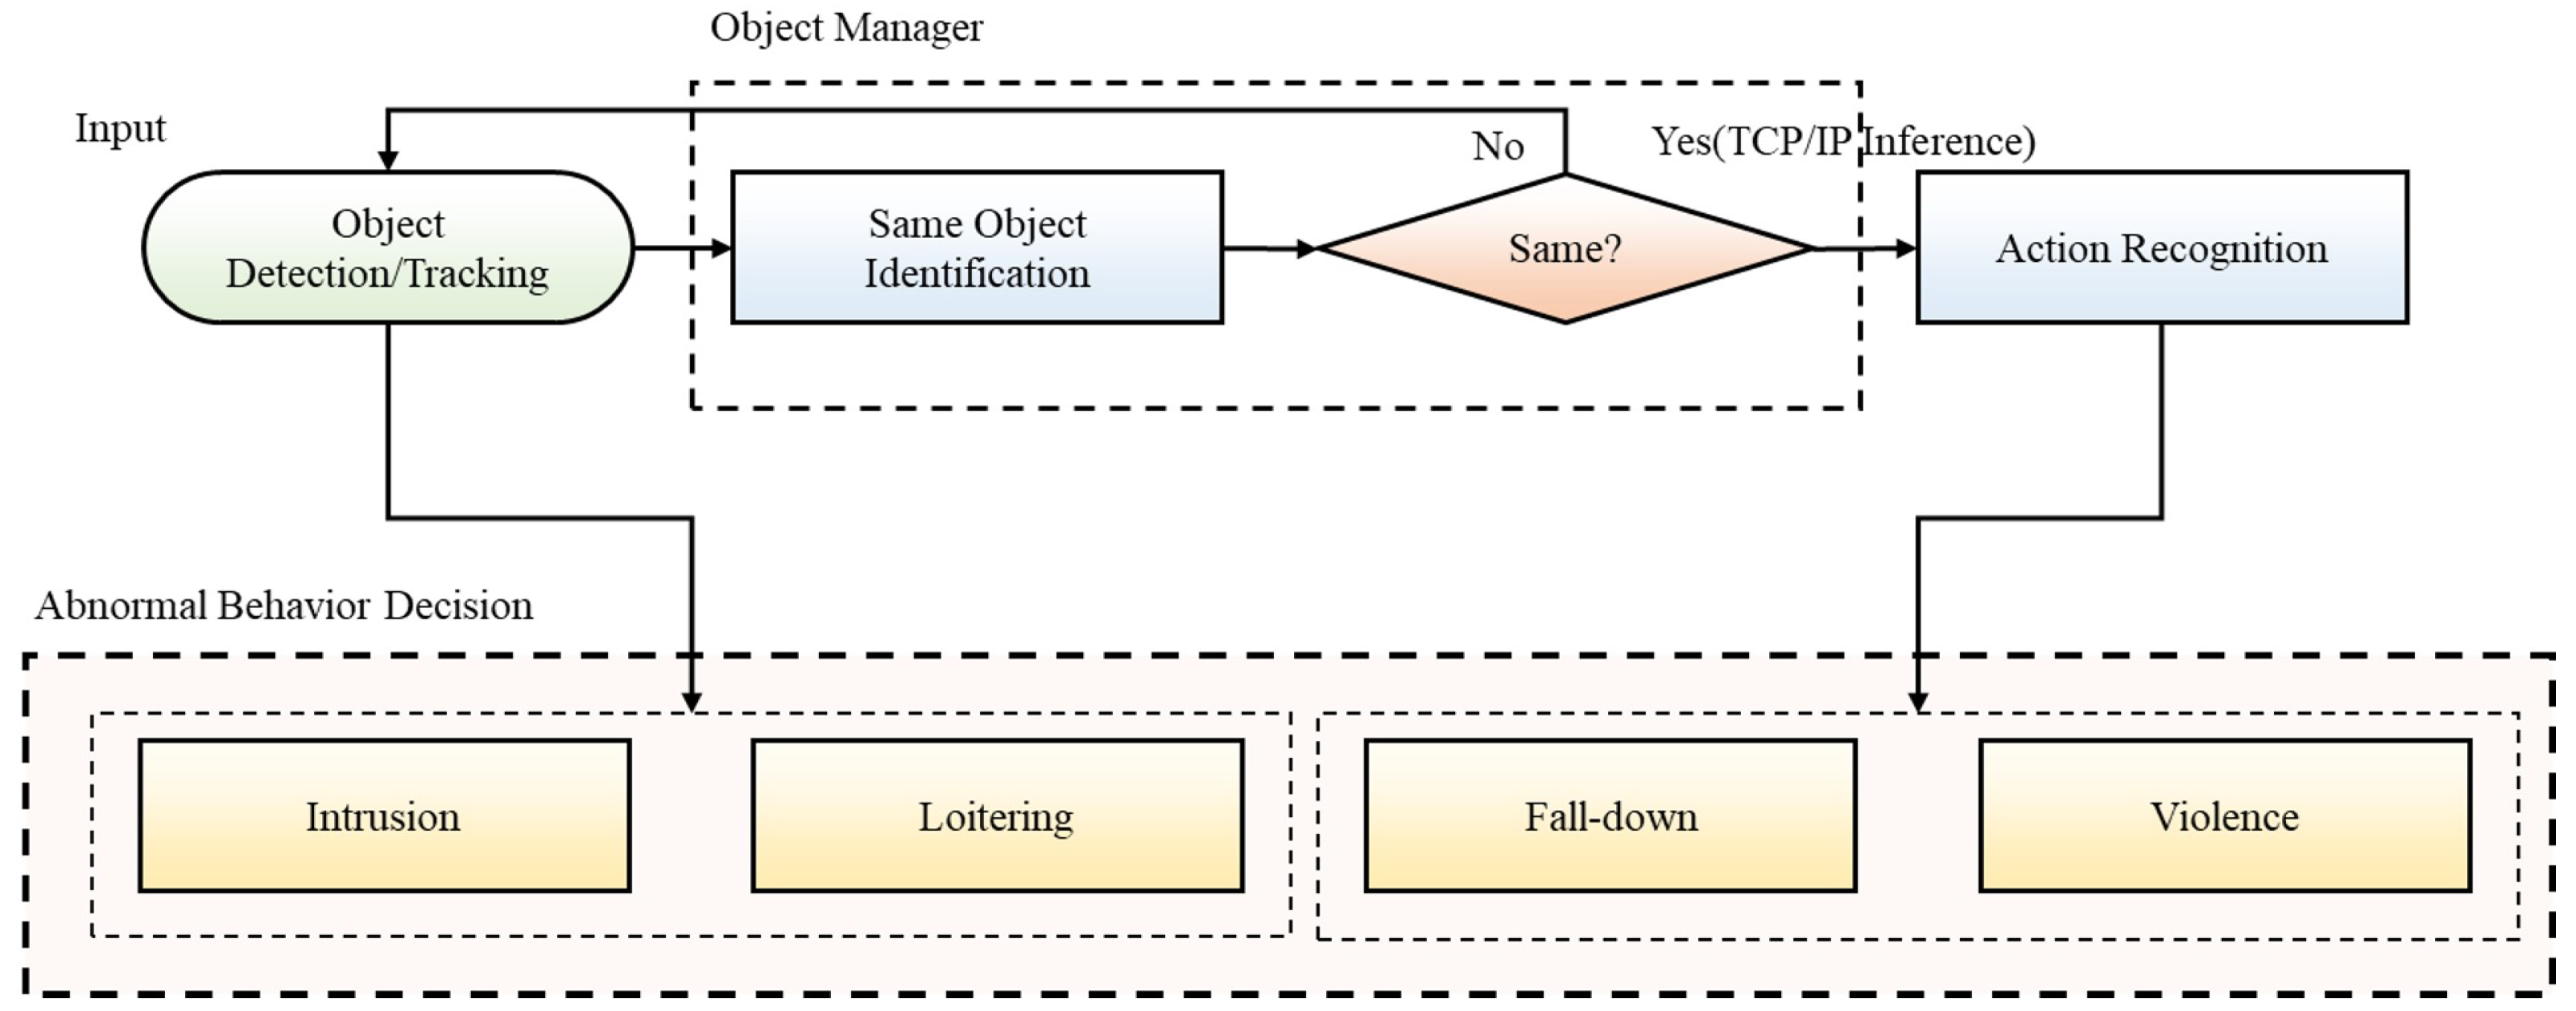
The proposed abnormal behavior analysis framework consists of two modules for: (i) detection and tracking pedestrians and (ii) analyzing abnormal behavior as shown in Figure 1. This section is organized as follows: (i) pedestrian detection and tracking method, (ii) a set of modules for analyzing abnormal behavior, (iii) detection algorithm for intrusion and loitering behavior, and (iv) detection algorithm for fall and violent behavior.
3.1. Pedestrian Detection and Tracking Method
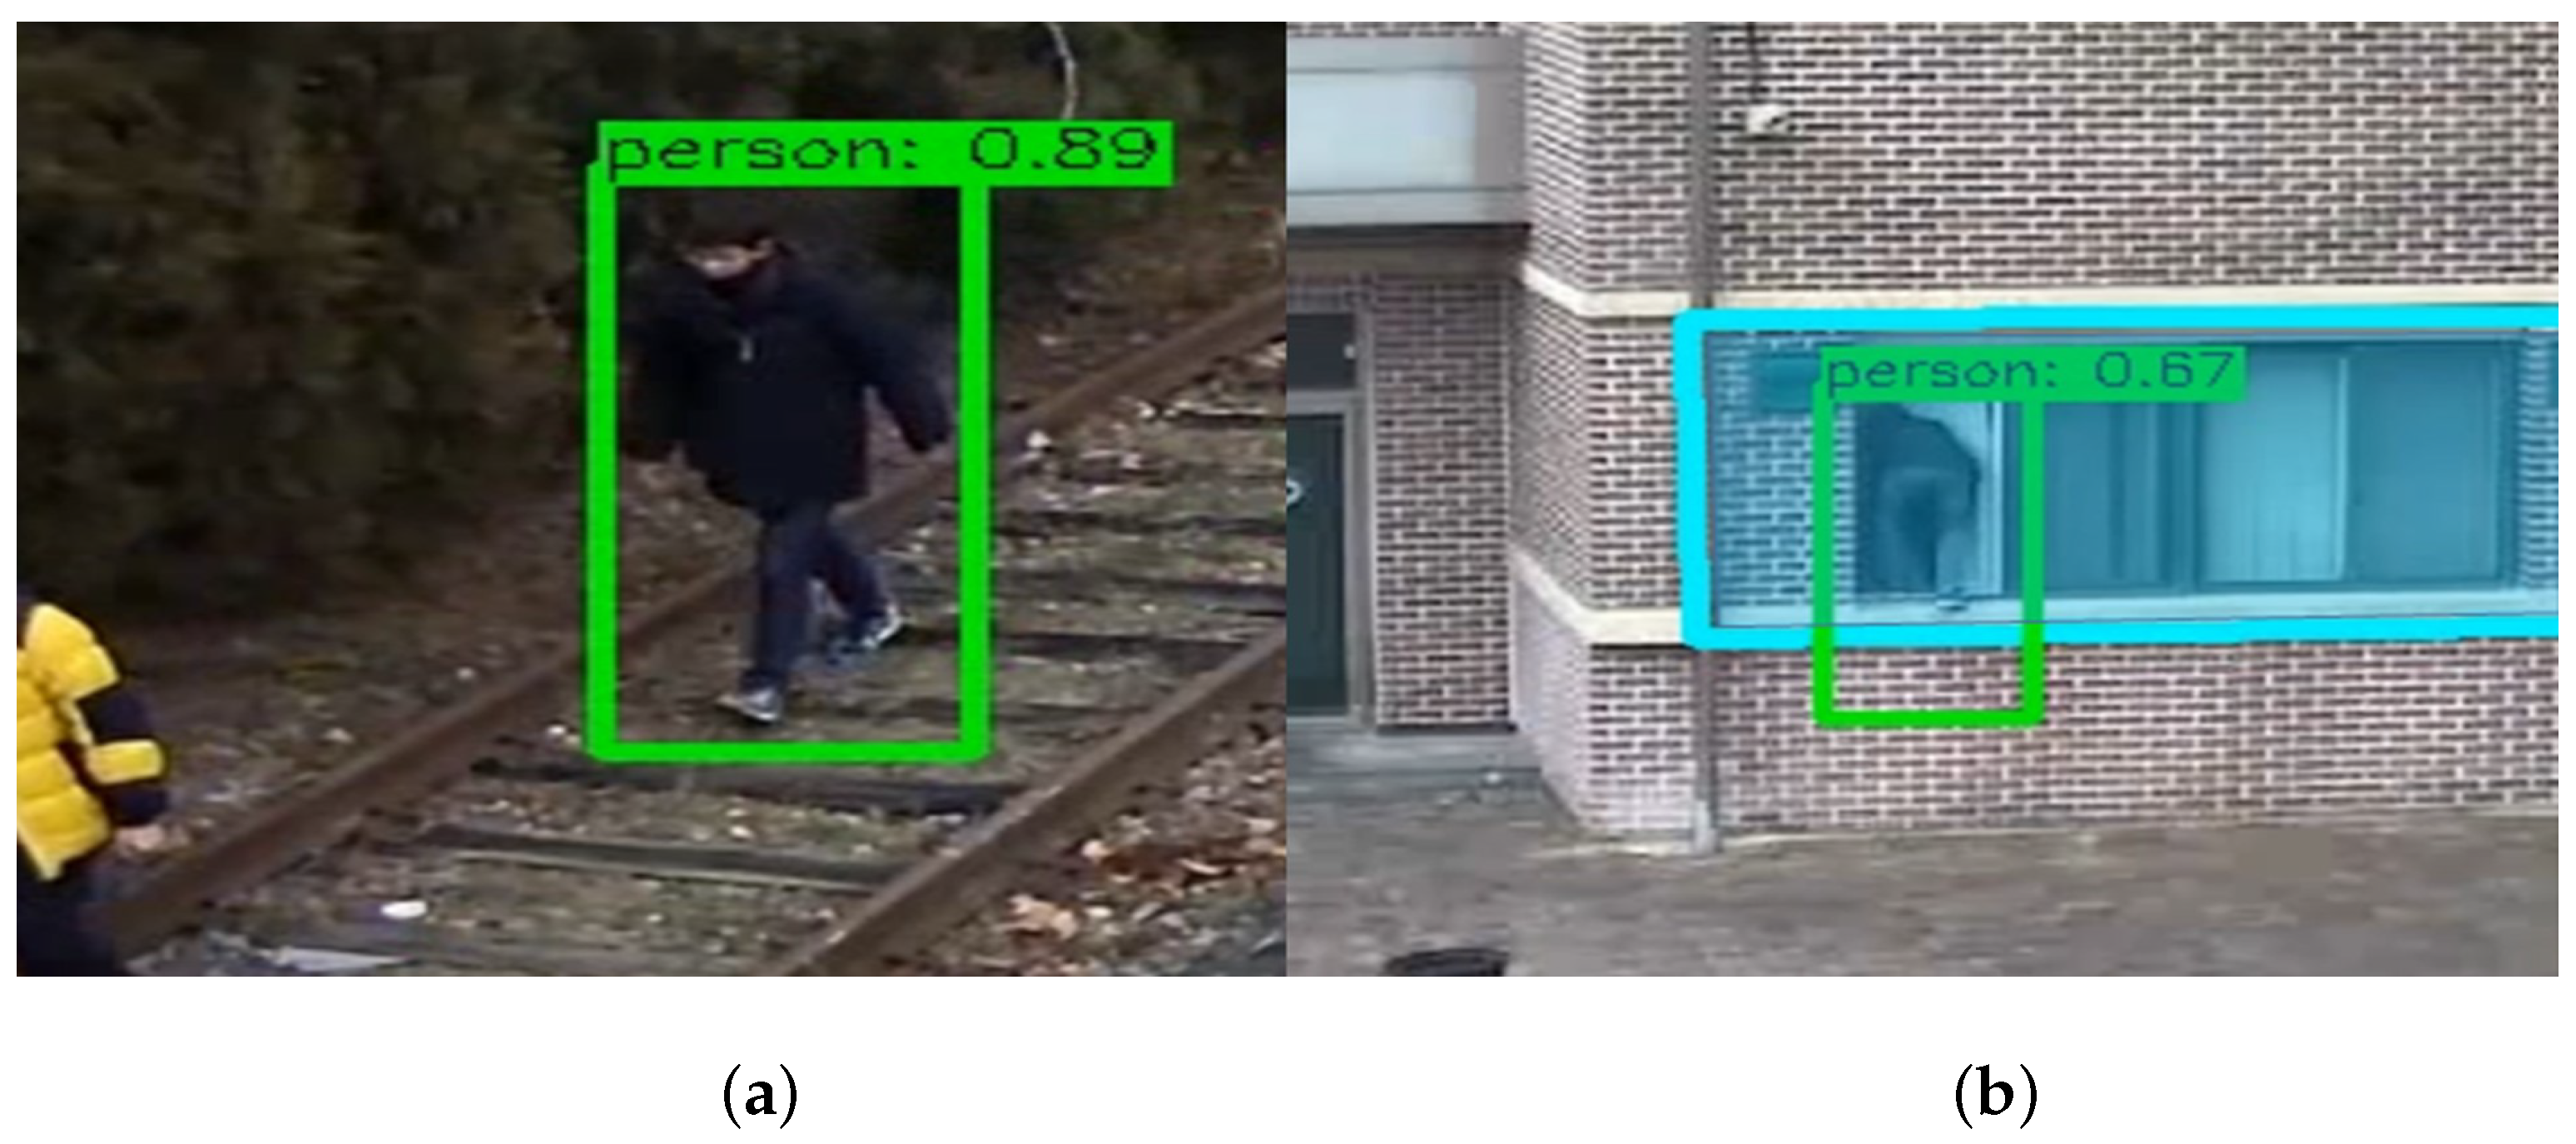
Since abnormal behavior analysis should work with real-time streaming images as input, object detection does not perform at every frame, and a tracking algorithm estimates the coordinate of the object in the skipped frames. More specifically, the object detection network detects an object at every 12 frames, and the coordinate of the detected object are used as the input of the tracker. The reason for not using detection every frame is that it takes a lot of computation to perform detection every frame of a video. In the context, we performed the detection periodically and used the tracking method in between. A certain period was set to 12 frames showing the best performance when tracking and detection were merged according to the experimental results. It is necessary to update newly detected or disappeared at a specific point in the input image. Figure 2a,b, respectively, show the situation where the object goes out of the image and the situation where the object enters the house through the window. Existing trackers keep tracking the most similar patch even after the object disappears. Since object detection is performed every 12 frames, the tracker is updated according to the detected person in the corresponding area to determine whether to track the object or not.
In the proposed method, the object detection network uses YOLOv4 as the baseline network. The unified detection increases the processing speed compared with two-stage methods such as Regions with Convolutional Neuron Networks features (R-CNN) [22]. The input image is divided into grid cells and the score for each object is calculated. The score is calculated by Equation (1), and if there is no object in the image, the score becomes 0. represents the intersection divided by union of the correct answer box and the predicted box, and represents the probability that an object exists within the bounding box.
The probability corresponding to each class is expressed as the following Equation (2). represents the classification probability of the object in the grid cell. The detector divides the input image into an S X S grid. Each grid cell has the confidence score defined in (1) for the bounding box. If there is no object in the cell, the confidence score is 0. In addition, a class-specific confidence score is obtained by multiplying the confidence score of (1) and the Conditional Class Probability of (2). Finally, the output of the detector include the center and size of the object, and the probability of matching the learned class. Object tracking is then performed by setting the coordinates of the object to be detected as the input of the tracker. The KCF tracker has two advantages: (i) efficient computation by replacing the correlation operation in the spatial domain with the element-by-element operation in the Fourier domain and (ii) robustness against shape changes using online training. Its performance can be further improved by incorporating the weight of the color histogram in the target patch. The formula for generating a color space by weighting the main colors is as follows:
where is the output of the grayscale image, represents the relative ratio of color values, and is the patch of the target object. To improve the tracking performance in a scene with objects having different color values, the proposed tracking method considers the color distribution of the object, and adaptively weight the color components. To detect a very small object, we used five YOLO layers, and additional learning was performed with images having small objects. The training data consisted of self-collected surveillance camera images including the Microsoft Common Objects in Context (COCO) 2014 data set [23], 26,123 training images, and 4050 validation images.
3.2. A Set of Behavior Analysis Modules
An object of interest is initially detected by the detector, and its location is tracked every frame by the tracker. To analyze the abnormal behavior of the interesting object, we developed a module, denoted as ObjectManager, that systematically manages the information obtained from the detector and tracker.
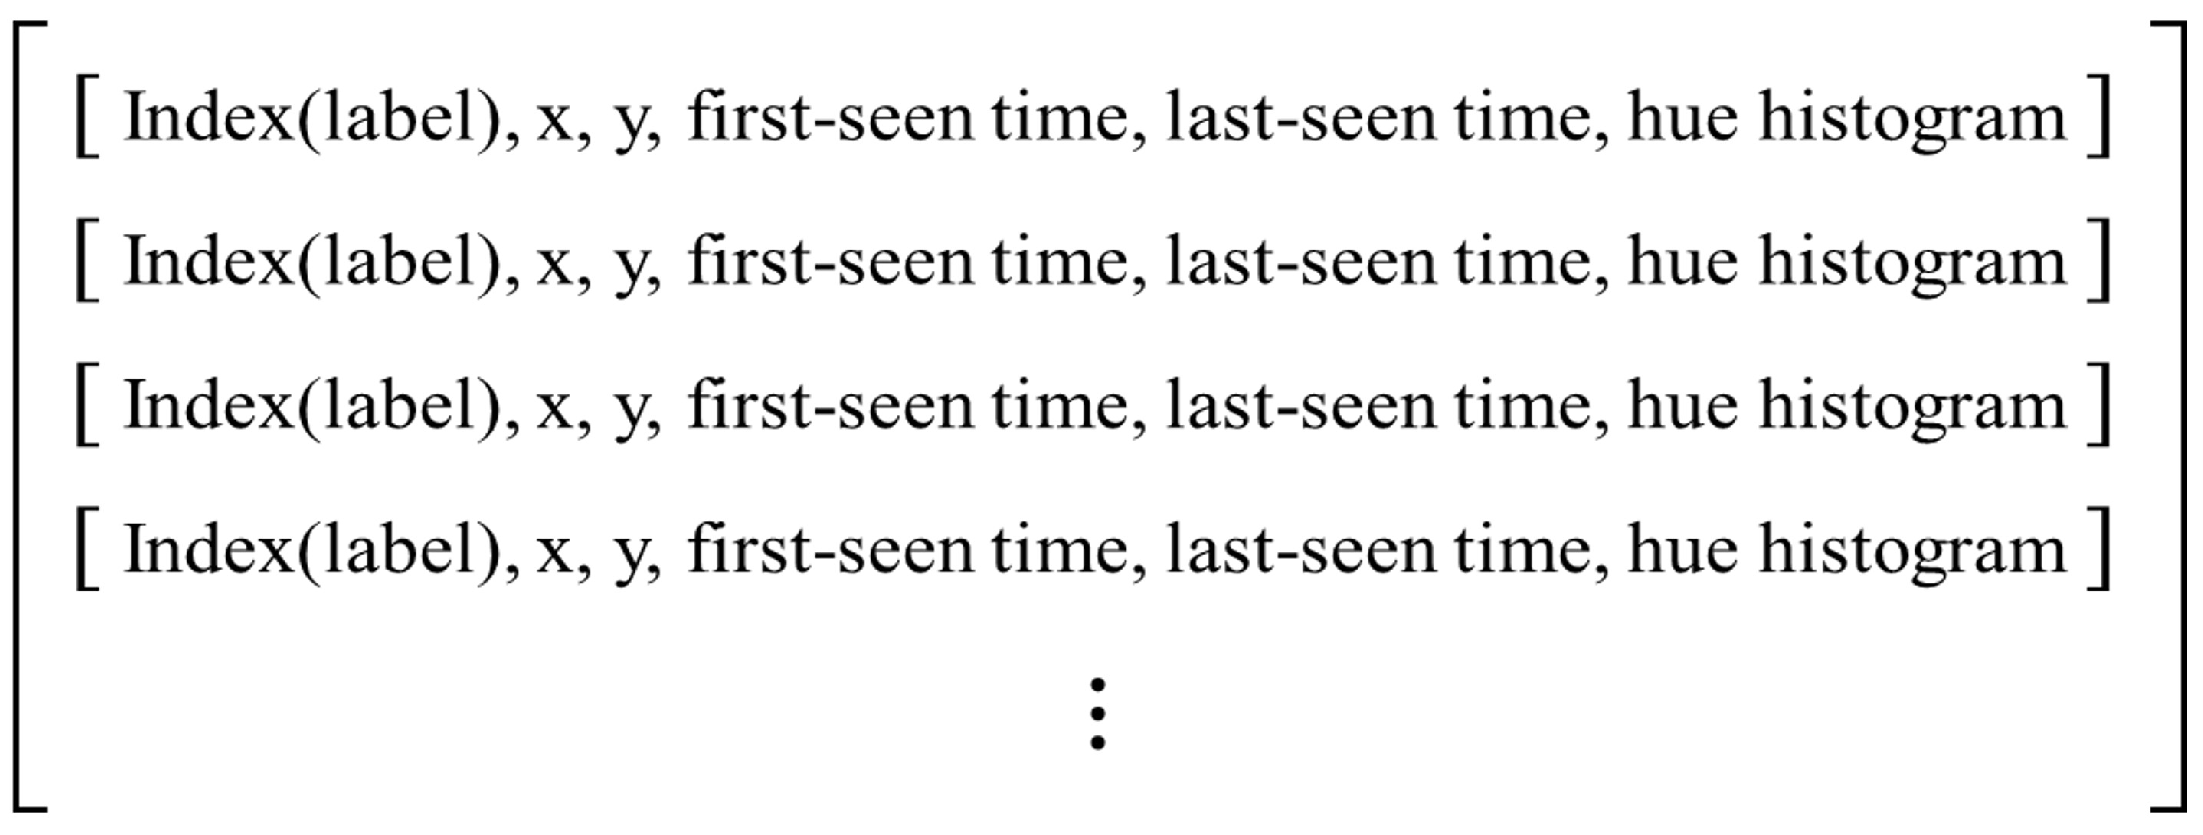
ObjectManager composes information of each object as shown in Figure 3, where (x, y) represents the latest coordinate of the interesting object. ID is object label information for managing each object. The first-seen time means the time when the interesting object was first detected by the detector, and the last-seen time means the last time detected or tracked by the detector or tracker. Hue histogram is color histogram information for managing the same object. Information on a single object is composed of these six items.
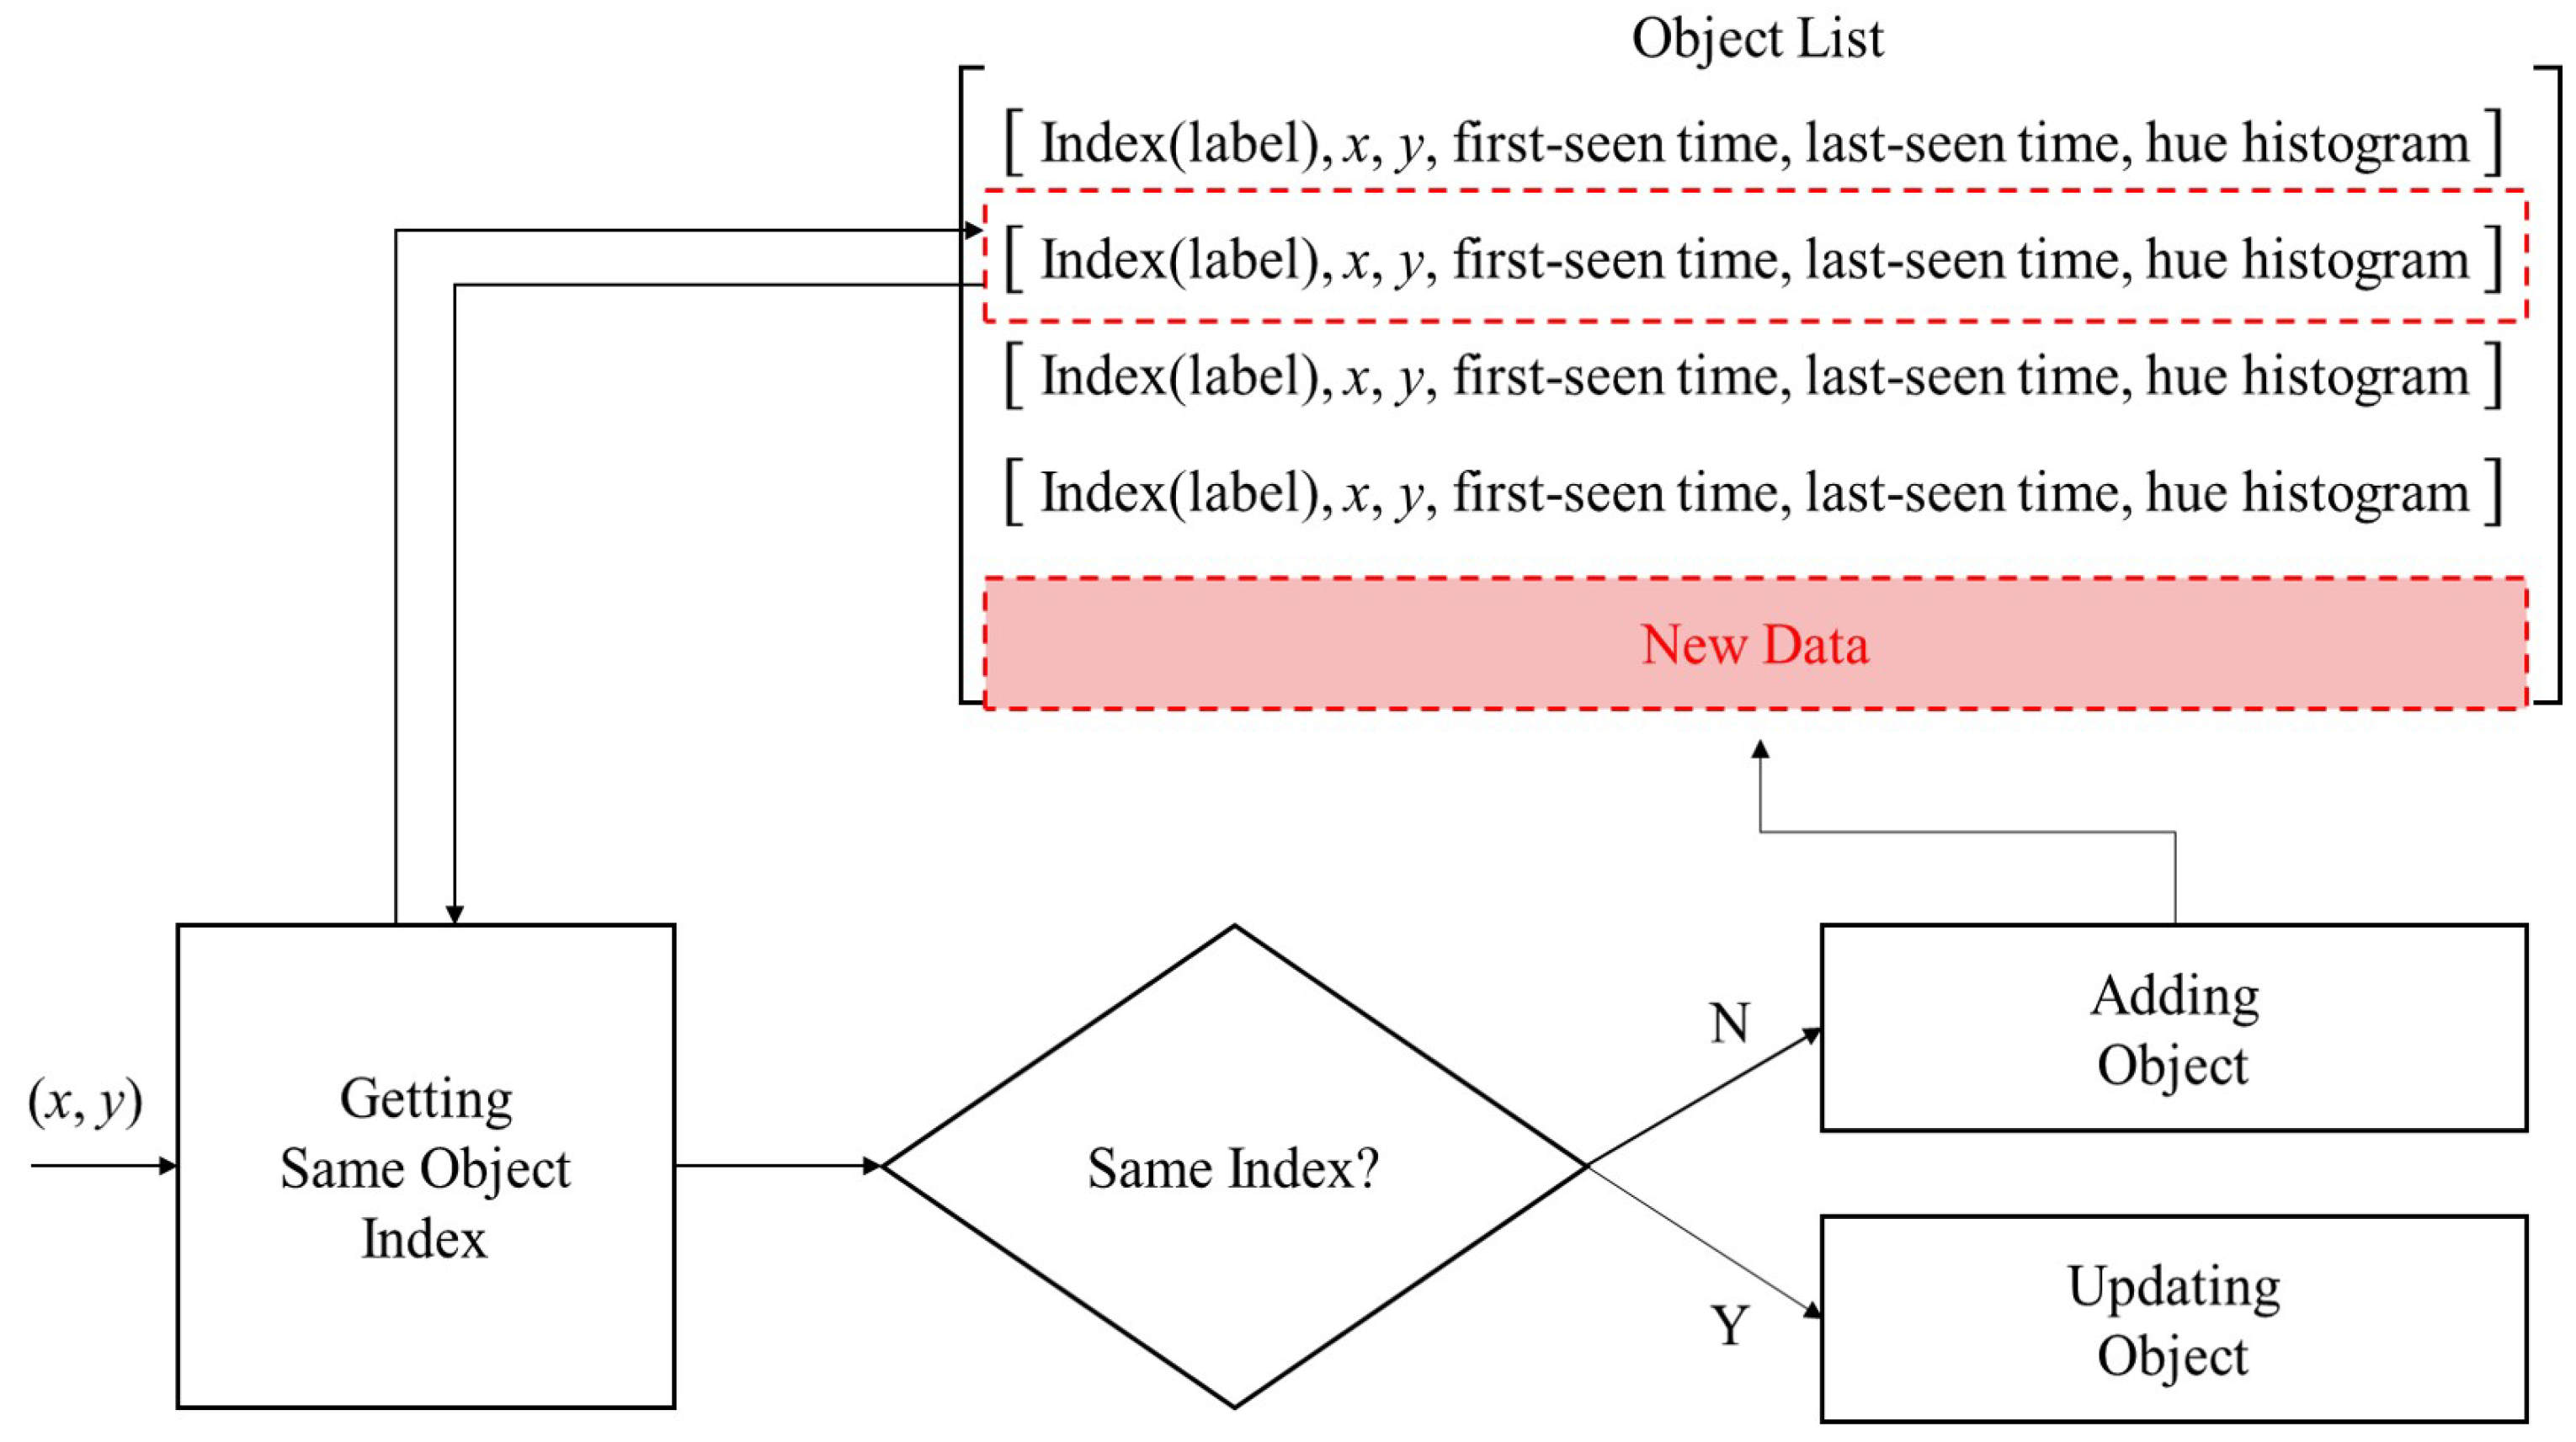
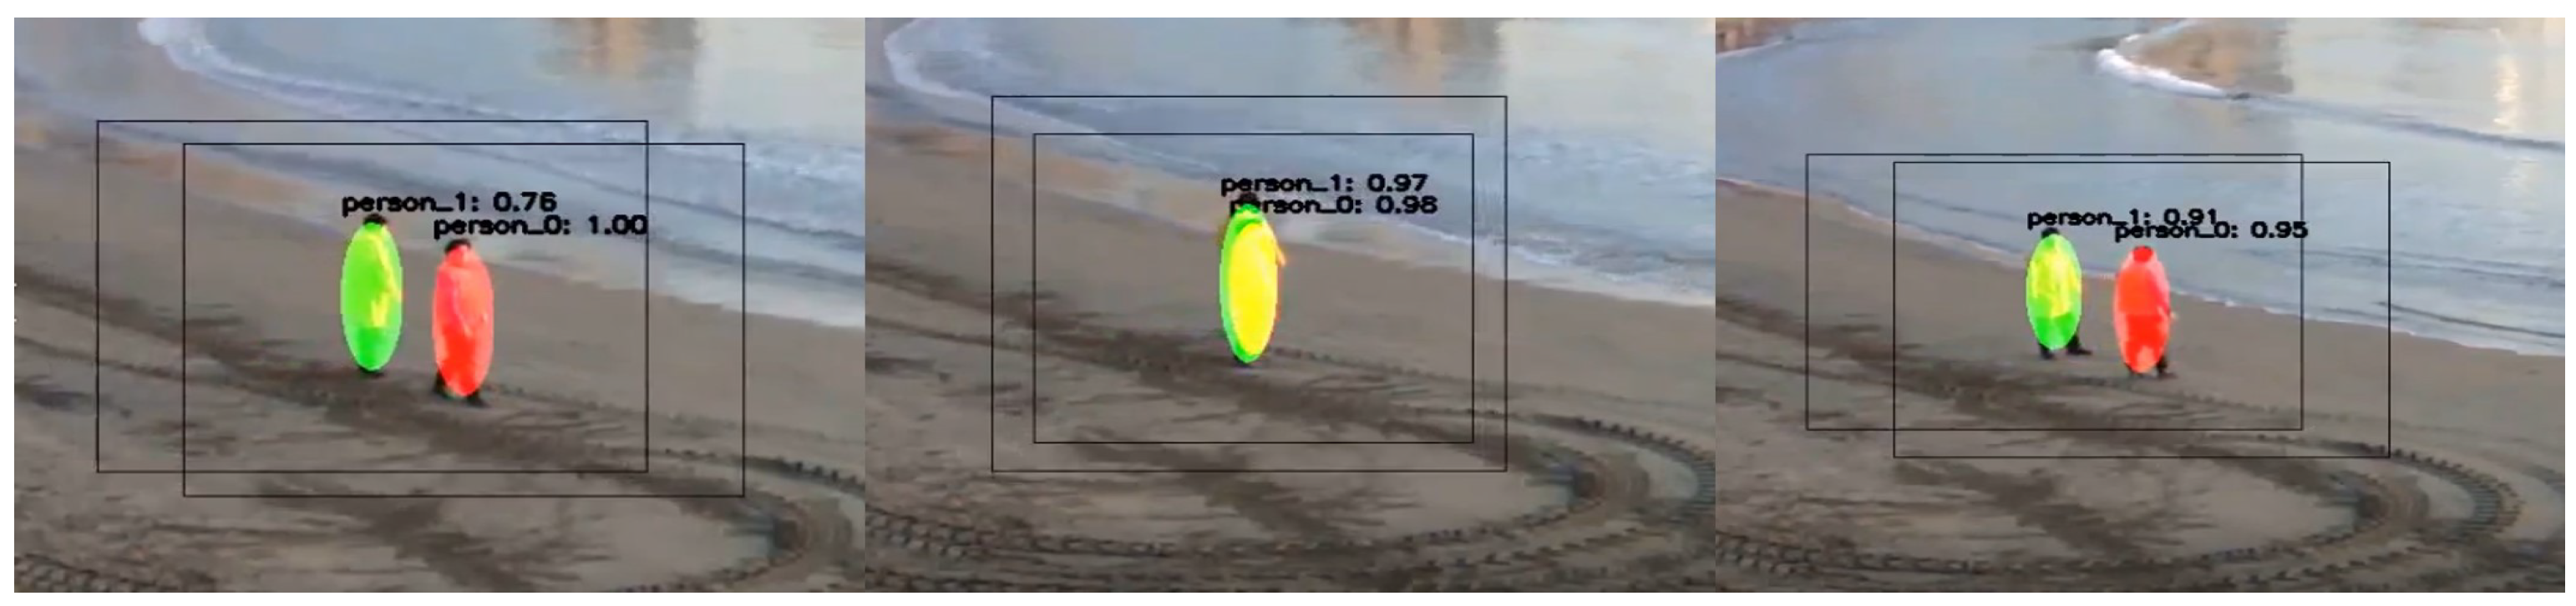
Figure 4 shows the flowchart of ObjectManager operation. ObjectManager first receives the coordinate of the interesting object from detector and tracker. Next, It determines whether the object is the same object by comparing with the object information currently managed in the Object List, and it is determined based on the distance of the coordinates. We additionally compare the color histogram information extracted from the objects to determine whether they are the same object [24]. The similarity of two histograms, denoted as and , is defined as
where and represent the mean of the two histograms. Figure 5 shows an example of object tracking results using histogram comparison. It shows accurate tracking results even in the occlusion situation.
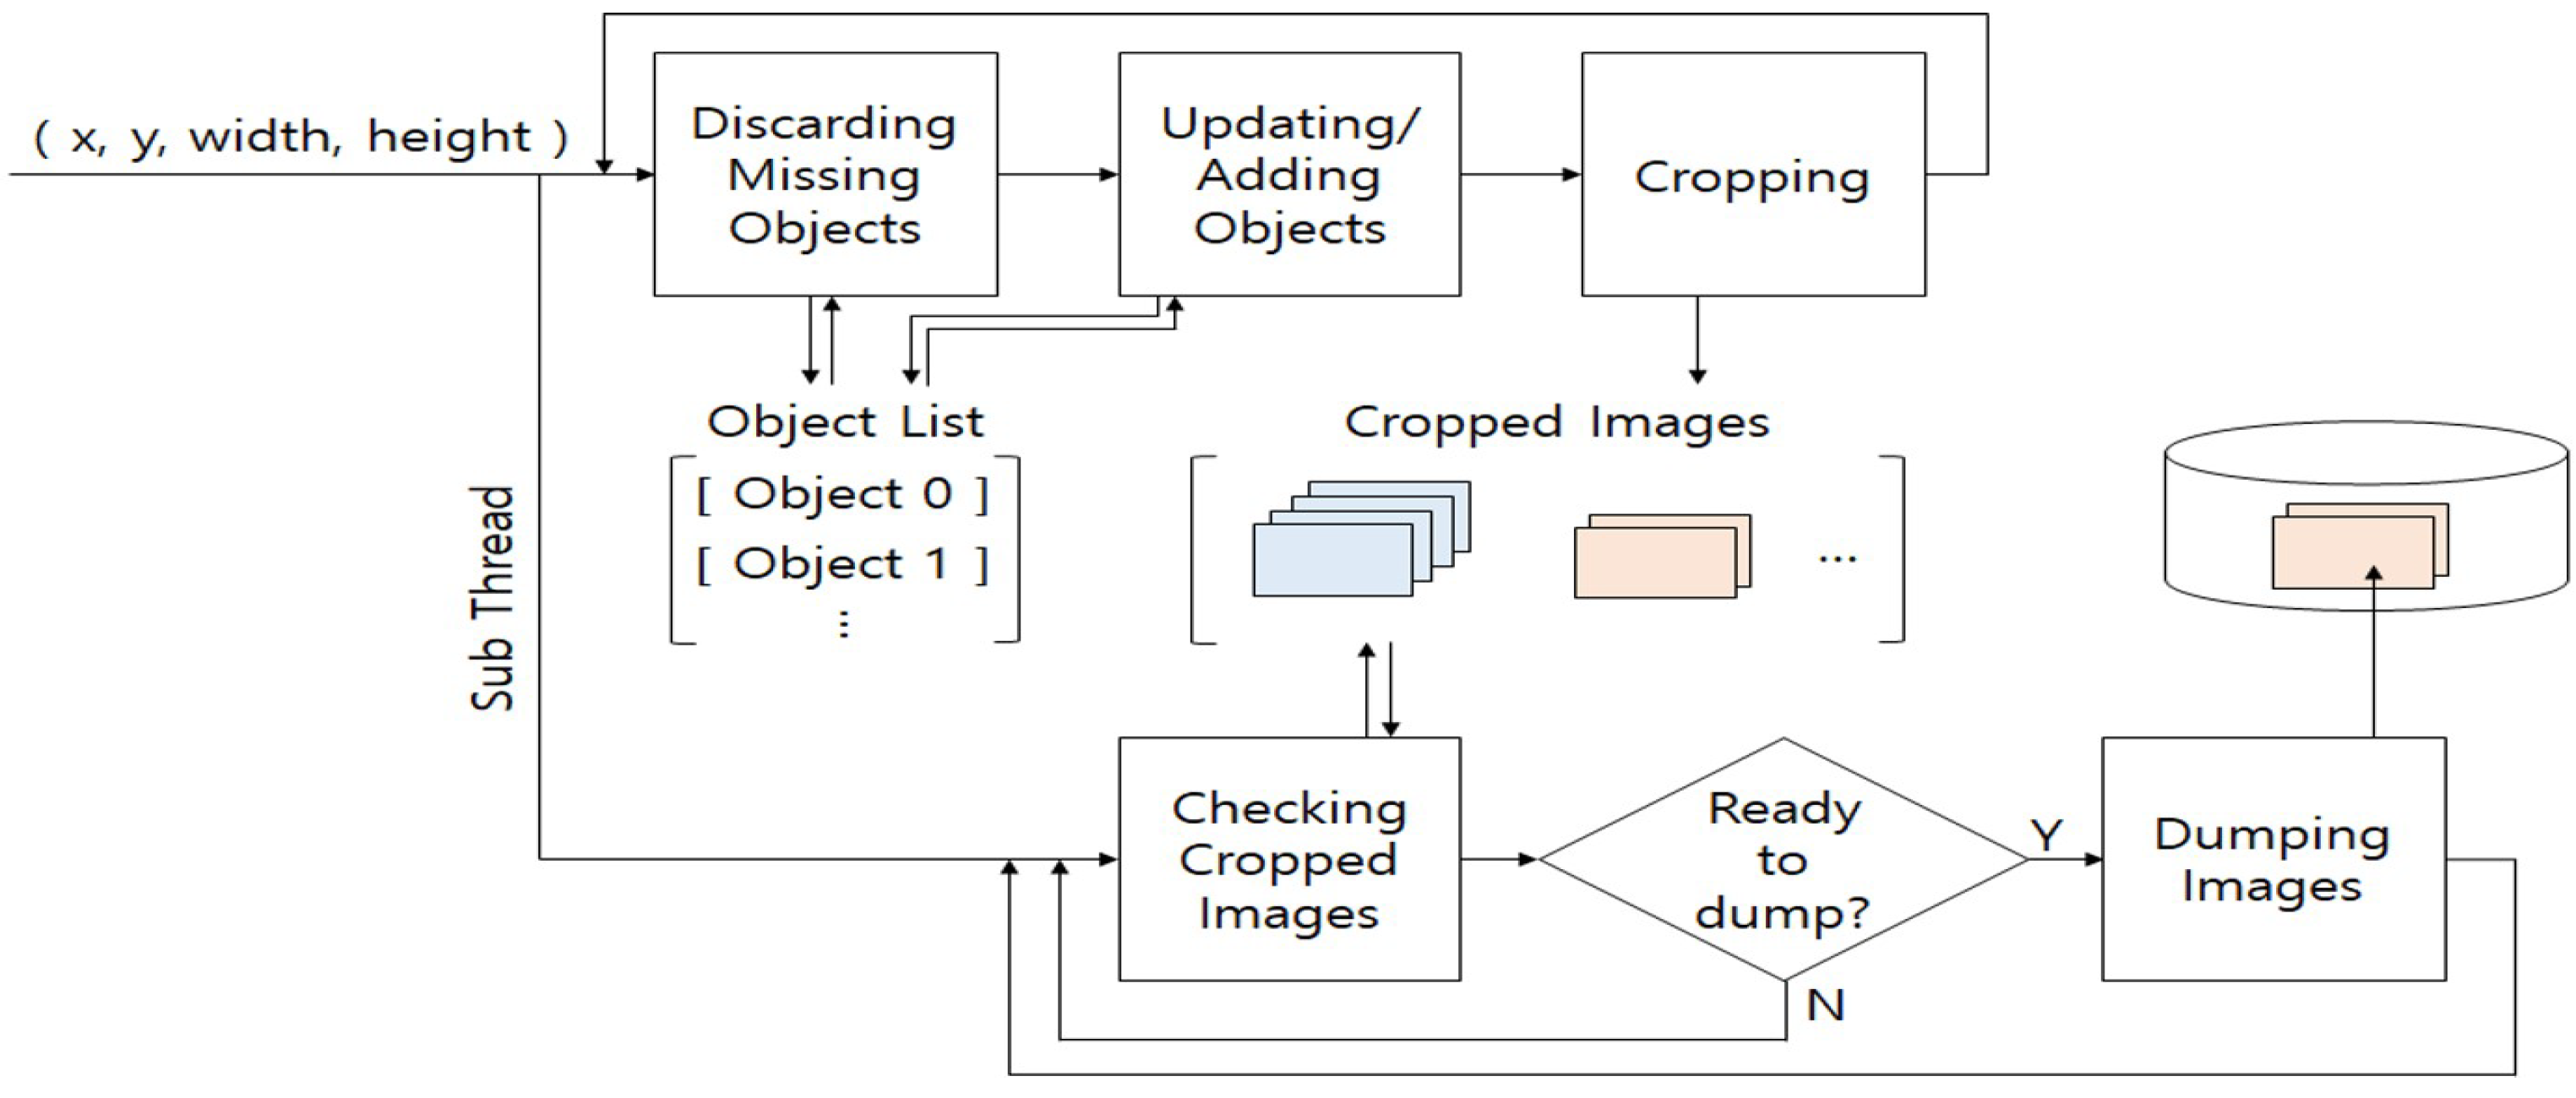
Where index represents the object similarity, if the index is determined to be the same, the information of the object is updated. The current input object information is then added as a new object information if the same object does not exist anymore. If the time of the last detected or tracked object is not updated for a certain period, the object is no longer observed in the input image and is removed from the Object List to manage only valid objects. The abnormal behavior analysis module acquires several close-up images of a specific interesting object on a continuous frame and uses them as input data. In this context, we need a function, denoted as ObjectCropper, to crop the image of the interesting object being tracked every frame. ObjectCropper manages the cropped image of the same object as a bundle, and then provides it to the abnormal behavior analysis module. ObjectCropper receives coordinates and size information of the interesting object. As a result, an appropriately cropped region is calculated for the interesting object. The image of each interesting object is separately saved for efficient management. When the number of cropped image reaches a pre-specified quantity, a sub-thread for dumping the image saves the image in the specified folder. The abnormal behavior analysis module takes the stored image as an input to analyze the abnormal behavior. Figure 6 shows the overall operation flow of ObjectCropper.
The processing of recording the cropped image to the auxiliary storage device causes a serious bottleneck and adversely affects the performance of the overall system. Therefore, by operating a sub-thread for storing the cropped image, we can reduce the number of main-thread operations. The ‘continuity’ is an important condition to collect and manage cropped images. ObjectCropper collects cropped images of the interesting objects. In checking cropped Images, we determined whether the same object comes in consecutive frames. The continuity determination method used the assigned ID through ObjectManager and the last detection time. If the set of cropped images are not continuous, the abnormal behavior analysis module receives non-contiguous frame information, which may cause performance degradation in abnormal behavior analysis. If ObjectCropper periodically detects a non-contiguous set, we discard it without transferring to the abnormal behavior analysis network.
3.3. Intrusion and Loitering Abnormal Behavior Judgment Algorithm
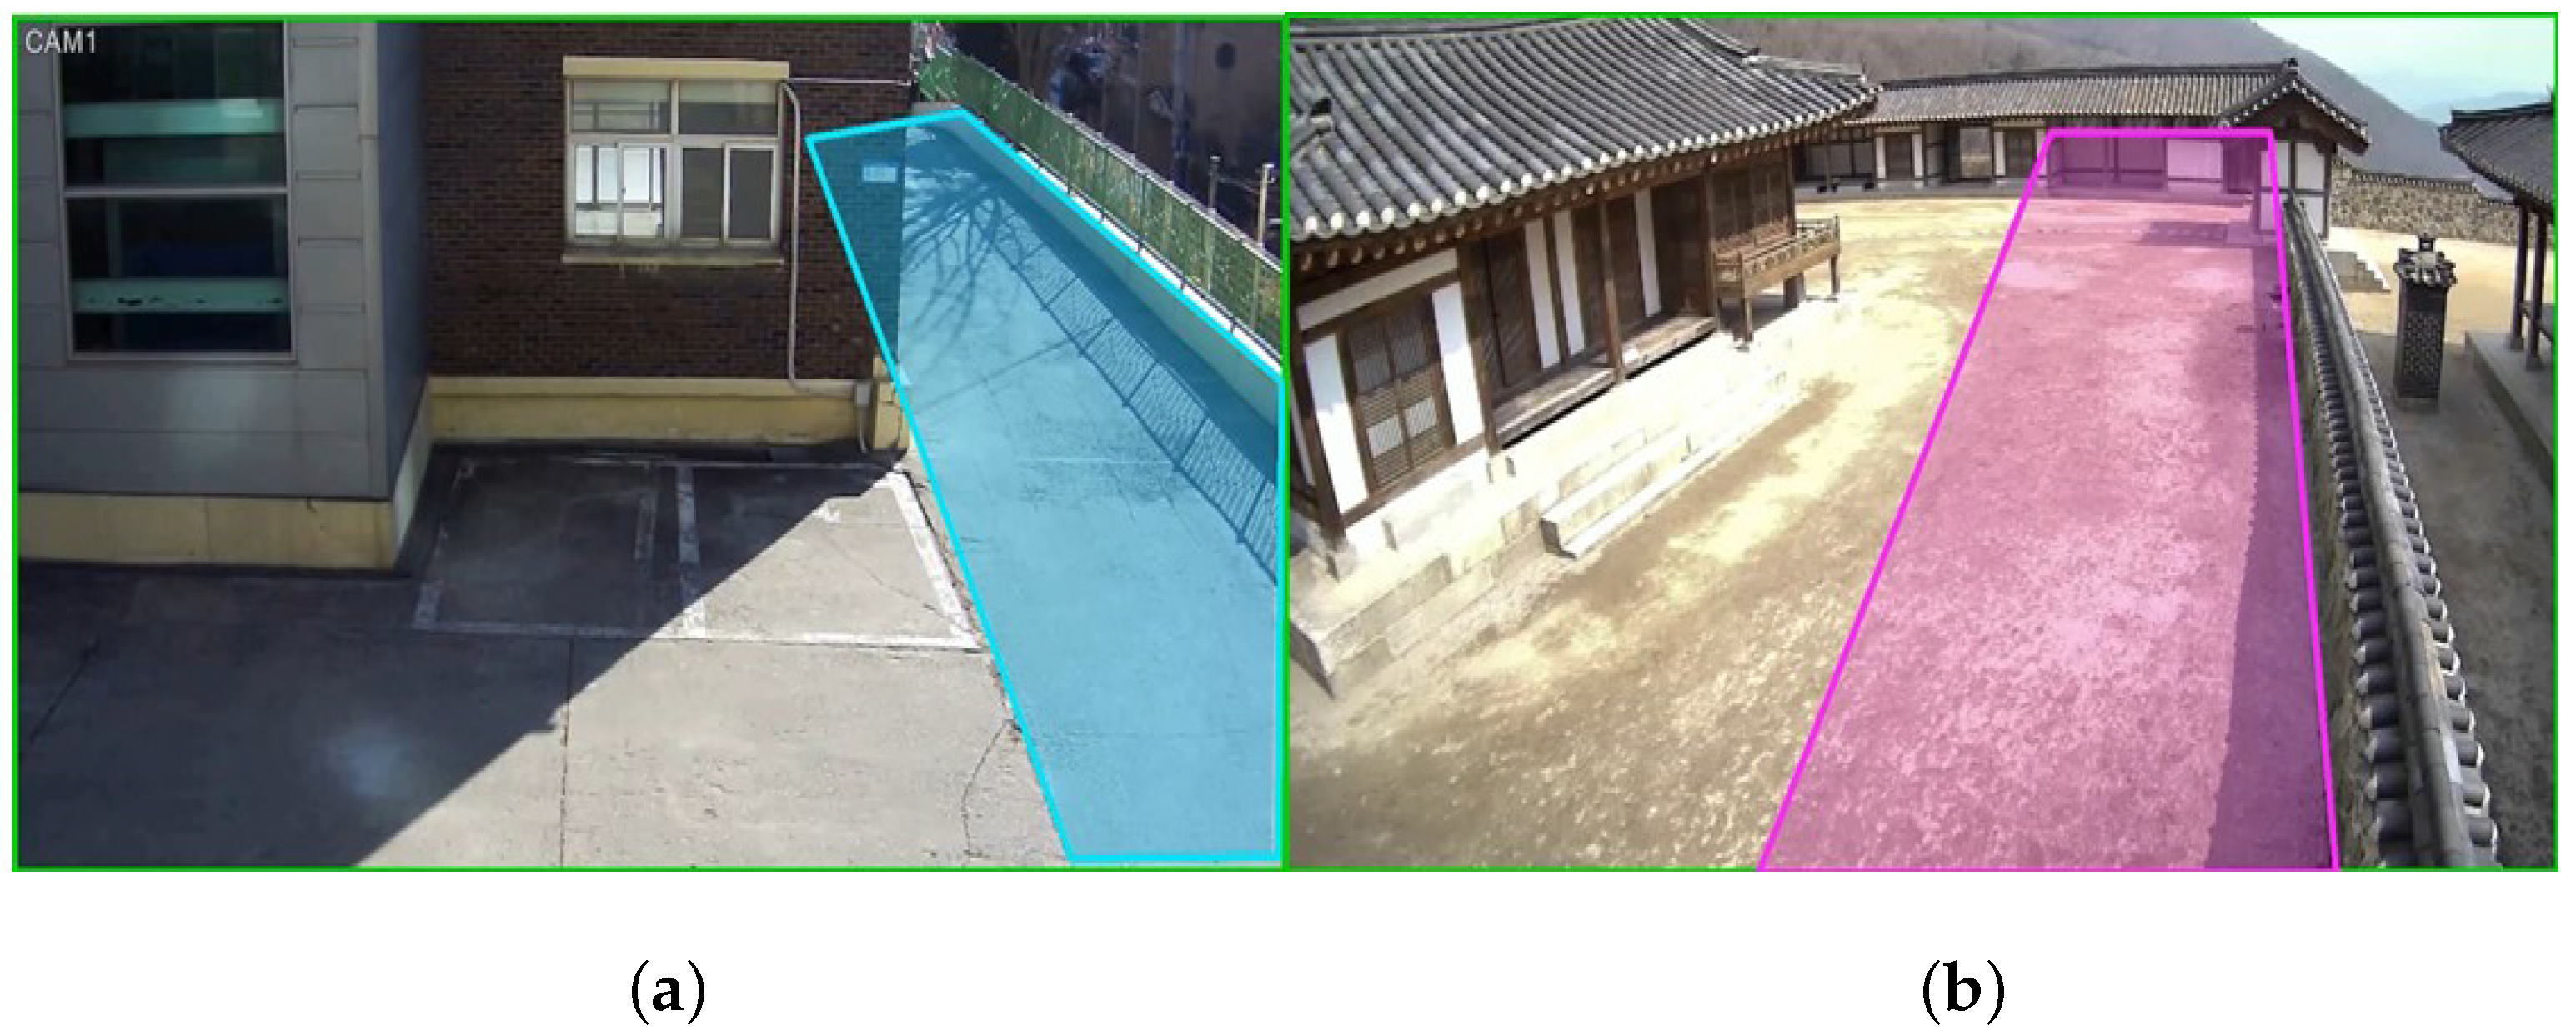
The intrusion and loitering detection process first checks if an interesting object enters the pre-defined ROI. A pedestrian’s action is classified as loitering if one or more people enter a pre-specified ROI for more than 10 seconds. KISA dataset requires 10 s for authentication of loitering, but user can change the time. An action is classified as intrusion if the entire body of one or more people enter a pre-specified ROI. To analyze the abnormal situation for real-time streaming video using a video transmission server, we developed an algorithm that judges the intrusion and loitering situation based on the referenced evaluation criteria only with object tracking information. The coordinate information of the intrusion and roaming area of the image to be determined is obtained from a predefined Extensible Markup Language (XML) file, and the ROI according to the coordinates is set in the input image. Figure 7 shows two ROIs of intrusion and loitering. The green ROI represents the object detection area. This area is predefined, such as intrusion, loitering ROI, and no object is detected outside of this area.
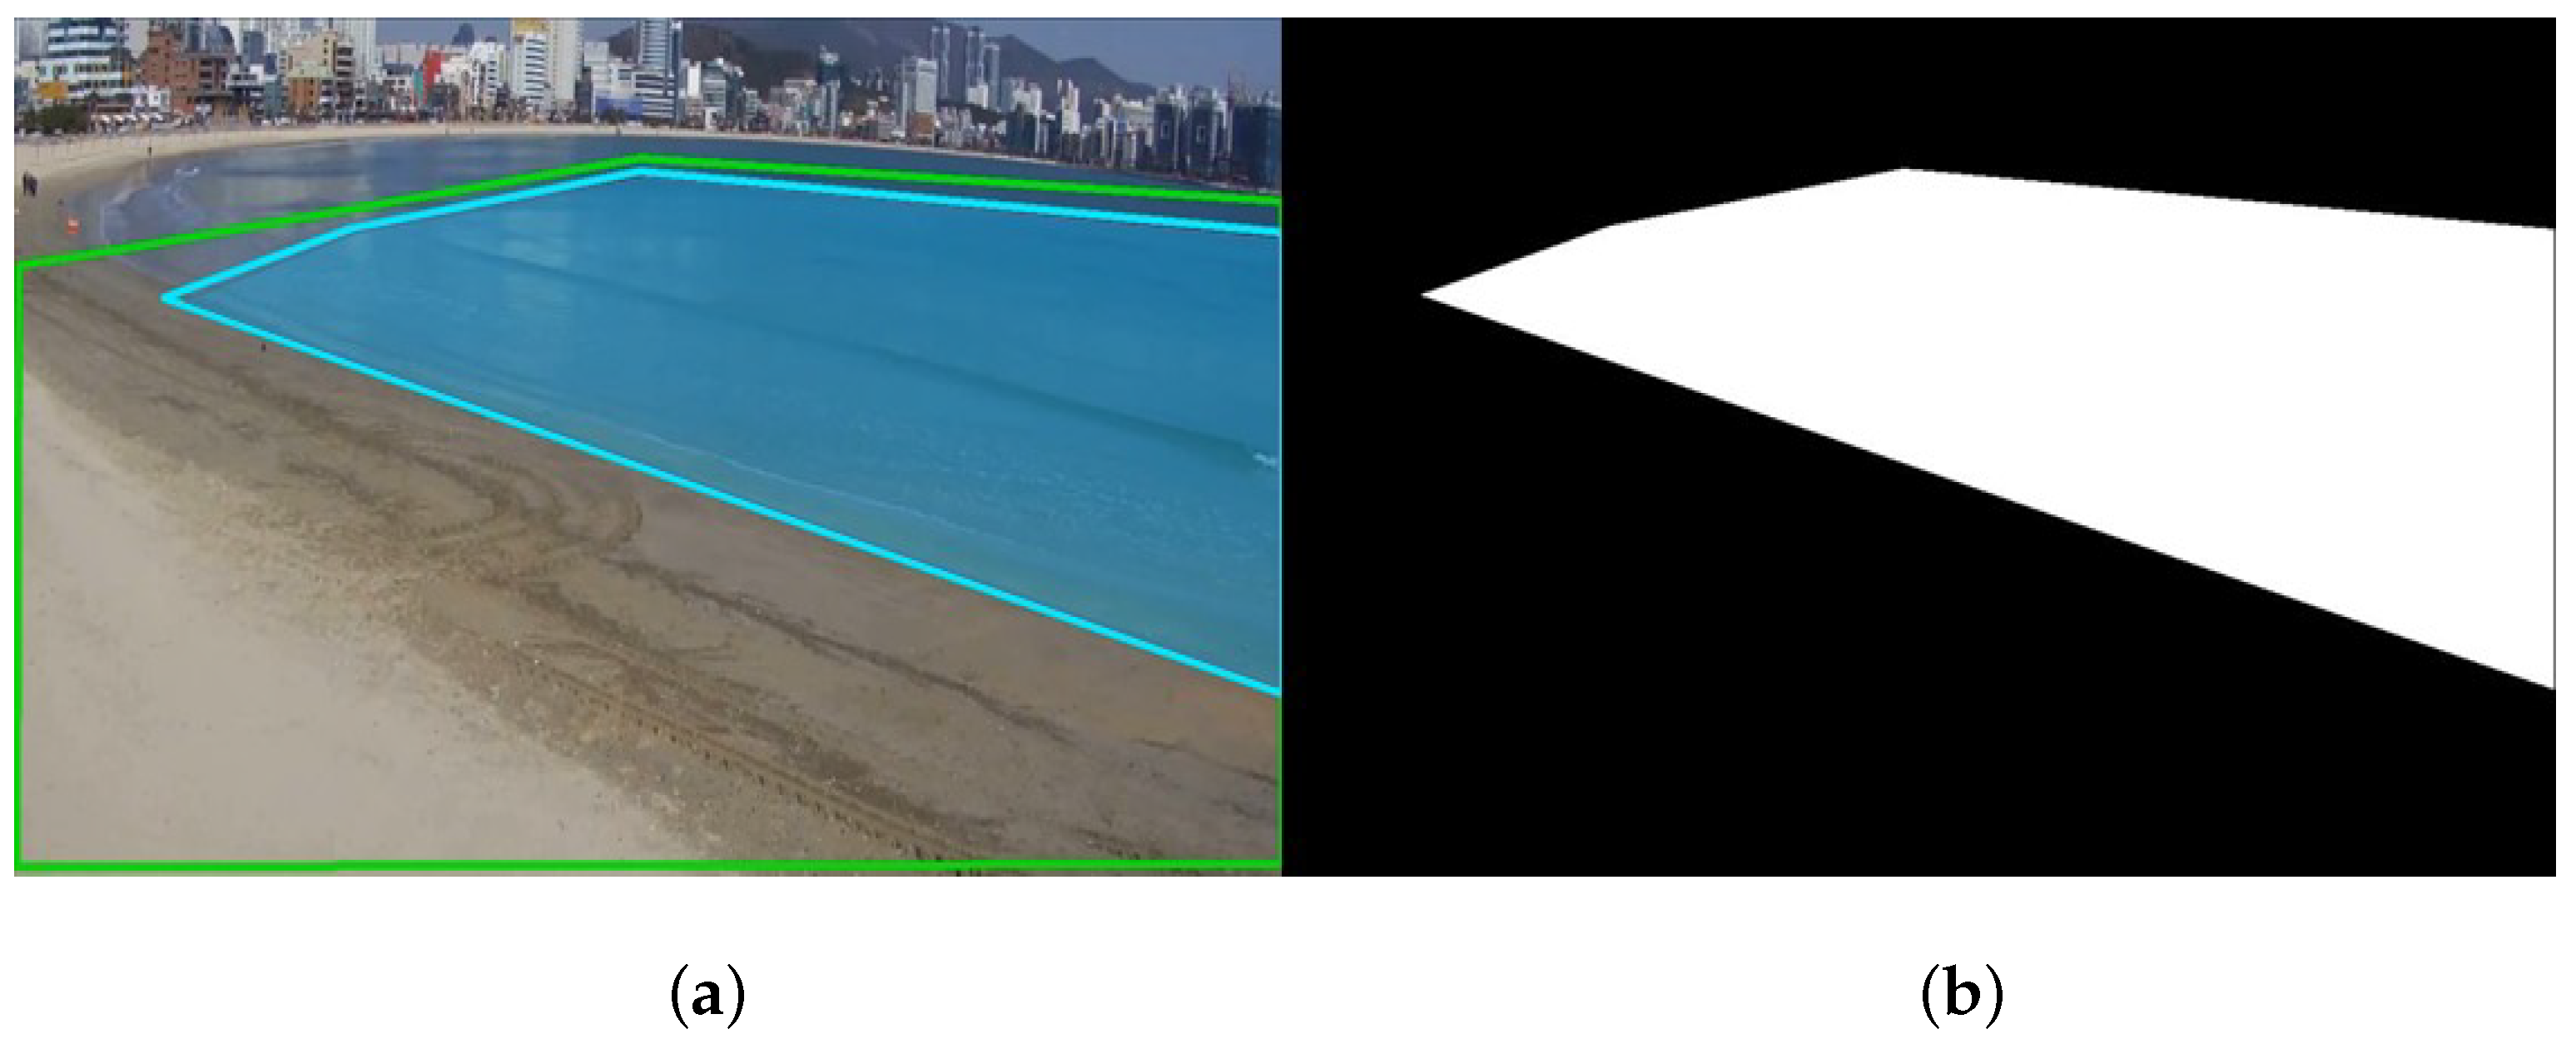
In this paper, we determine object intrusion in the ROI by detecting its coordinate using deep learning. Since existing intrusion detection methods using a polygonal ROI require a large amount of computation, we proposed a computationally efficient method for intrusion detection in a polygonal ROI using background images. As shown in Figure 8, a background image is generated where the ROI of the coordinates estimated by the OpenCV library is set to 1, and the other regions are set to 0. Since the generated background image has the same image size as the input image, it is possible to determine intrusion and loitering if the coordinate of located object exists. The presence or absence of an object in the ROI is calculated using Formula (5).
In Figure 8a, the pre-specified intrusion region is marked in blue, and Figure 8b shows that the inside of the ROI area has a value of 1, and the outside area of the ROI has a value of 0. In the proposed method, the coordinate information of the tracking object is acquired to determine whether the object is inside or outside the ROI area, and based on this, intrusion and loitering are determined.
3.4. Fall-Down and Violence Abnormal Behavior Judgment Algorithm
To determine violence and fall actions, high-dimensional features are needed. In this context, an abnormal situation of an object is analyzed using a 3D convolutional neural network (3D-CNN) based on ResNet.
To train the 3D-CNN, we used stochastic gradient descent with momentum, and created training samples by croppeing 48 training image frames. We used 48 frames for behavior recognition. The result of the network is classified into three classes including: (i) normal, (ii) fall-down, and (iii) violence. Training data of the normal class includes walking, stopping, and background without moving objects. The fall-down class was learned by cropping the moment when more than one object slip. The violence class consisted of two or more objects punching each other, kicking, or shoving. To train the 3D-CNN, the pre-trained ResNet-34 by kinetics data was used with the batch size of 128 and epochs of 200. The training accuracy and loss of the training network are shown in Table 1.
The trained 3D-CNN corresponds to the right block of the behavior analyzer as shown in Figure 1. The bundle of image information cropped to the object center from the left block is received using the TCP/IP protocol, and the corresponding cropped image bundle is inserted as an input to the abnormal behavior analysis network. Afterward, the classification result is output from the abnormal behavior analysis network, and the analyzed result is transmitted to the main module using the TCP/IP protocol. However, when analyzing violence and fall, misclassification problems occur because of some similar behavioral patterns. To prevent the misclassification as violence during the fall-down behavior, we analyzed the fall-down behavior in more detail by comparing the ratio of the bounding box of the object.
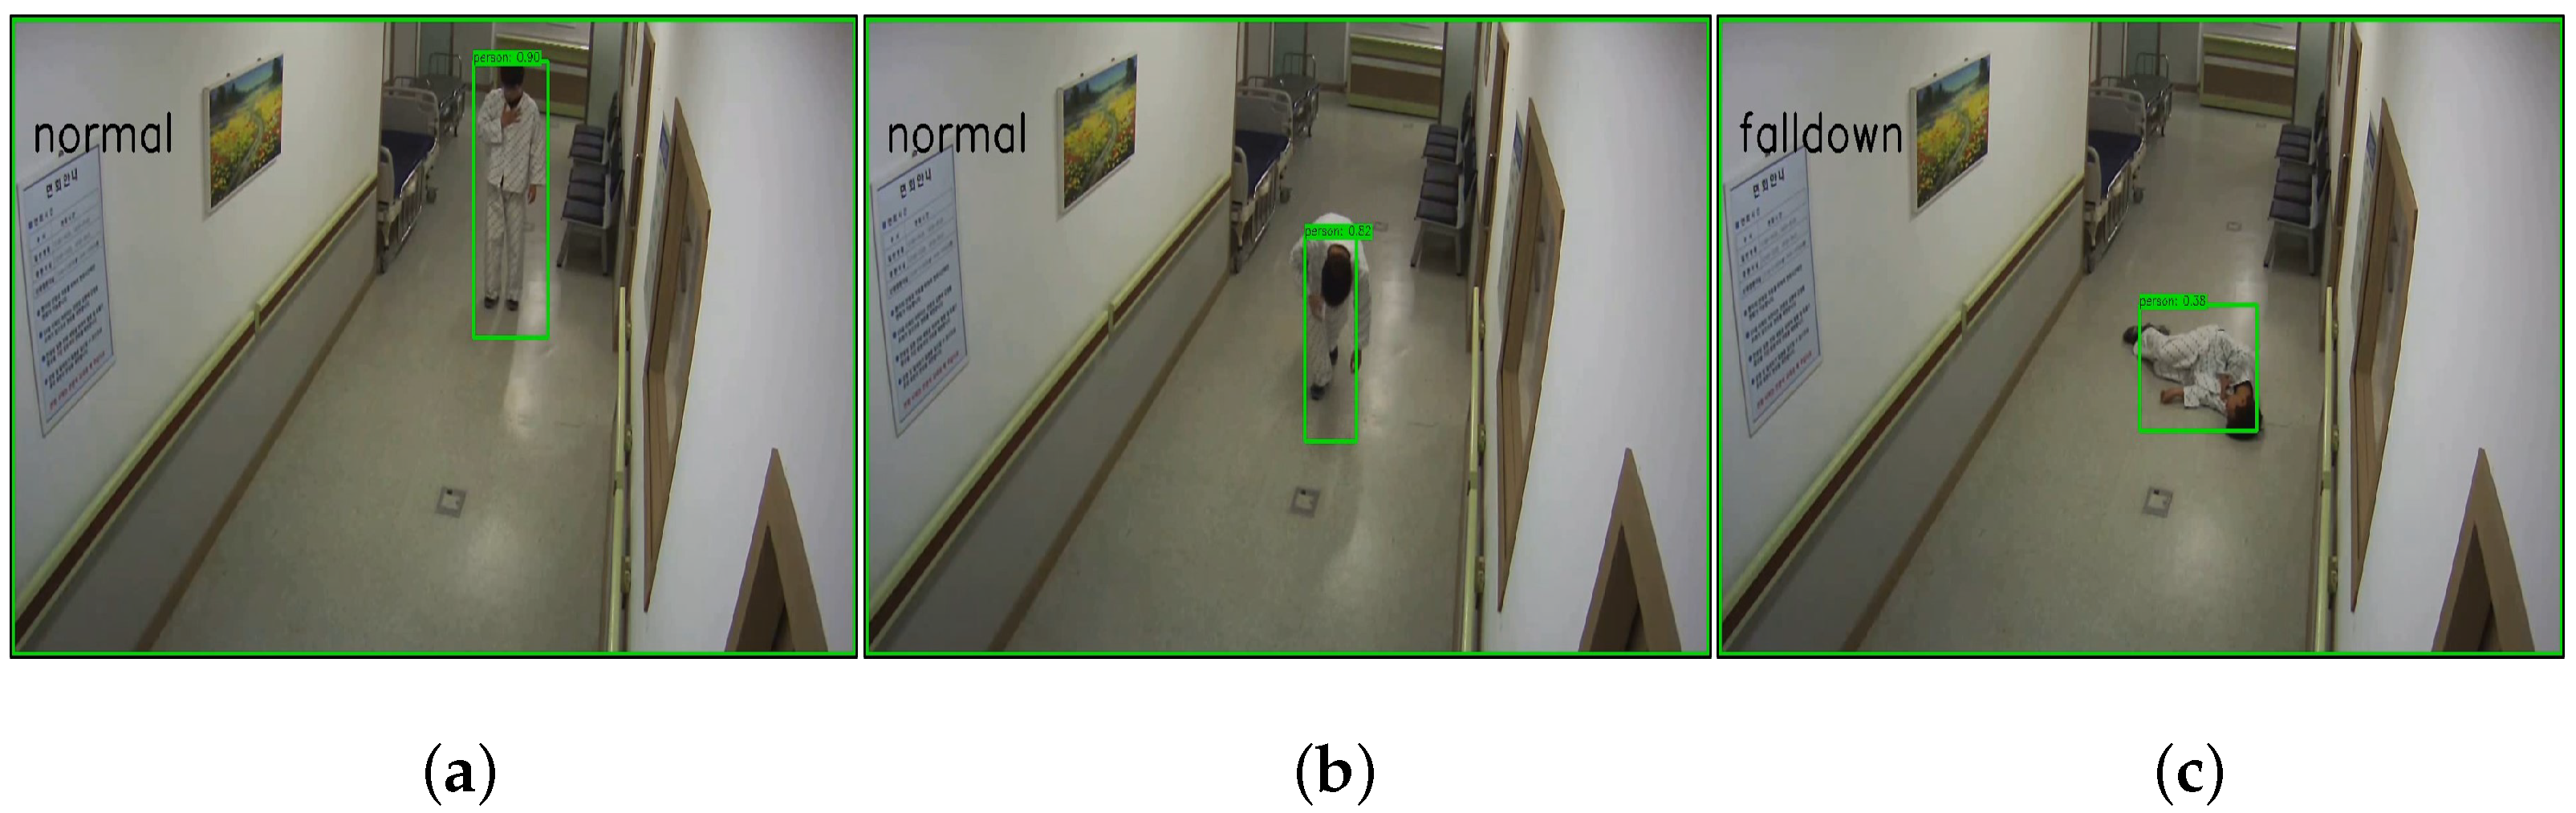
Figure 9 shows a series of processes in which the fall-down behavior occurs. The ratio of the bounding box of the normal behavior is different from that of the fall-down behavior. The bounding box of the normal behavior has a long vertical axis as shown in Figure 9a. However, the bounding box of the fall-down behavior of Figure 9b has a shorter vertical size. Fall-down behavior due to the camera angle in the CCTV-attached environment is detected in the vertical axis shorter than the normal behavior. In this paper, the final fall-down behavior is determined by considering the fall-down behavior recognition result through 3D-ResNet and the ratio of the bounding box of the fallen object. The proposed can minimize the misclassification problem between violence and fall-down behavior.
4. Experimental Results
We proposed an efficient object management system to analyze abnormal behaviors. Figure 10 shows the framework of the proposed system. The proposed system takes image data as input and performs object detection and tracking. Tracked objects are managed through the object manager for correct behavior recognition. Objects managed in the ObjectManager are transmitted to the abnormal behavior recognition module after determining whether they are the same object to analyze the abnormal behavior. In this context, intrusion and loitering are detected in the object detection/tracking module, and fall-down and violence are detected in the action recognition module. We perform a performance evaluation of the system proposed in this section.
The proposed system uses 3D-Resnet to recognize fall-down and violence behaviors. Table 2 shows existing action recognition algorithms, most of which use C3D and I3D feature extraction methods. Performance evaluation of action recognition in Table 2 is based on the UCF-Crime dataset. Since the action recognition algorithm can be used in various environments, it cannot be judged based on the performance in a specific dataset. For a specific system, it should be optimized through heuristic evaluation using several algorithms. Table 3 shows the results obtained by using KTH, UCF11, and KISA Datasets.
Recently, Convolutional 3D (C3D), I3D, and Residual 3D (R3D) methods are mainly used for action recognition algorithms. In Table 3, I3D and C3D showed high performance in the public dataset. However, if we compare the results of C3D, I3D, and Res3D in the dataset we built ourselves in the CCTV environment and the KISA dataset, I3D shows poor results. However, when comparing the results of C3D, I3D, and Res3D in the dataset we built ourselves in the CCTV environment and the KISA dataset, I3D shows poor results. On the other hand, the 3D-Resnet method shows good results. As the method used for comparison, the video was edited based on the pedestrian box, 265 clips were trained, and 97 clips were used as test data. The CCTV dataset including KISA used in the experiment consists of actions with short action times. Therefore, it is expected that there is a limit to the performance of I3D, which requires a lot of frame information. In this context, it can be seen that the performance of the action recognition algorithms is different depending on the behavior to be judged. As the 3D-resnset method requires a small number of frames, it shows excellent results in datasets such as fall-down and violence. Therefore, as the proposed action recognition algorithm, the 3D-Resnet method suitable for detecting the fall-down and violence is used, and the performance evaluation is performed using this 3D-Resnet based action recognition algorithm.
The experiment was conducted using KISA Dataset, which is constructed for the purpose of analyzing abnormal behavior in a CCTV environment, and consists of a total of four scenarios: intrusion, loitering, fall-down, and violence. There are various behavior analysis methods using a specific action recognition dataset. However, in this paper, we propose a system for abnormal behavior analysis rather than an action recognition algorithm. Therefore, the behavior recognition algorithm used in this paper can be replaced by other algorithms, and in this section, comparison with other studies of the behavior recognition algorithm is meaningless. In this context, we evaluated performance using the KISA dataset, which can best represent the proposed contribution. Unlike the existing action recognition dataset, which consists of scenarios by distance, illumination, and situation. For that reason, the KISA dataset is the most appropriate for the proposed work. Table 4 shows the composition of the KISA dataset used in the experiment.
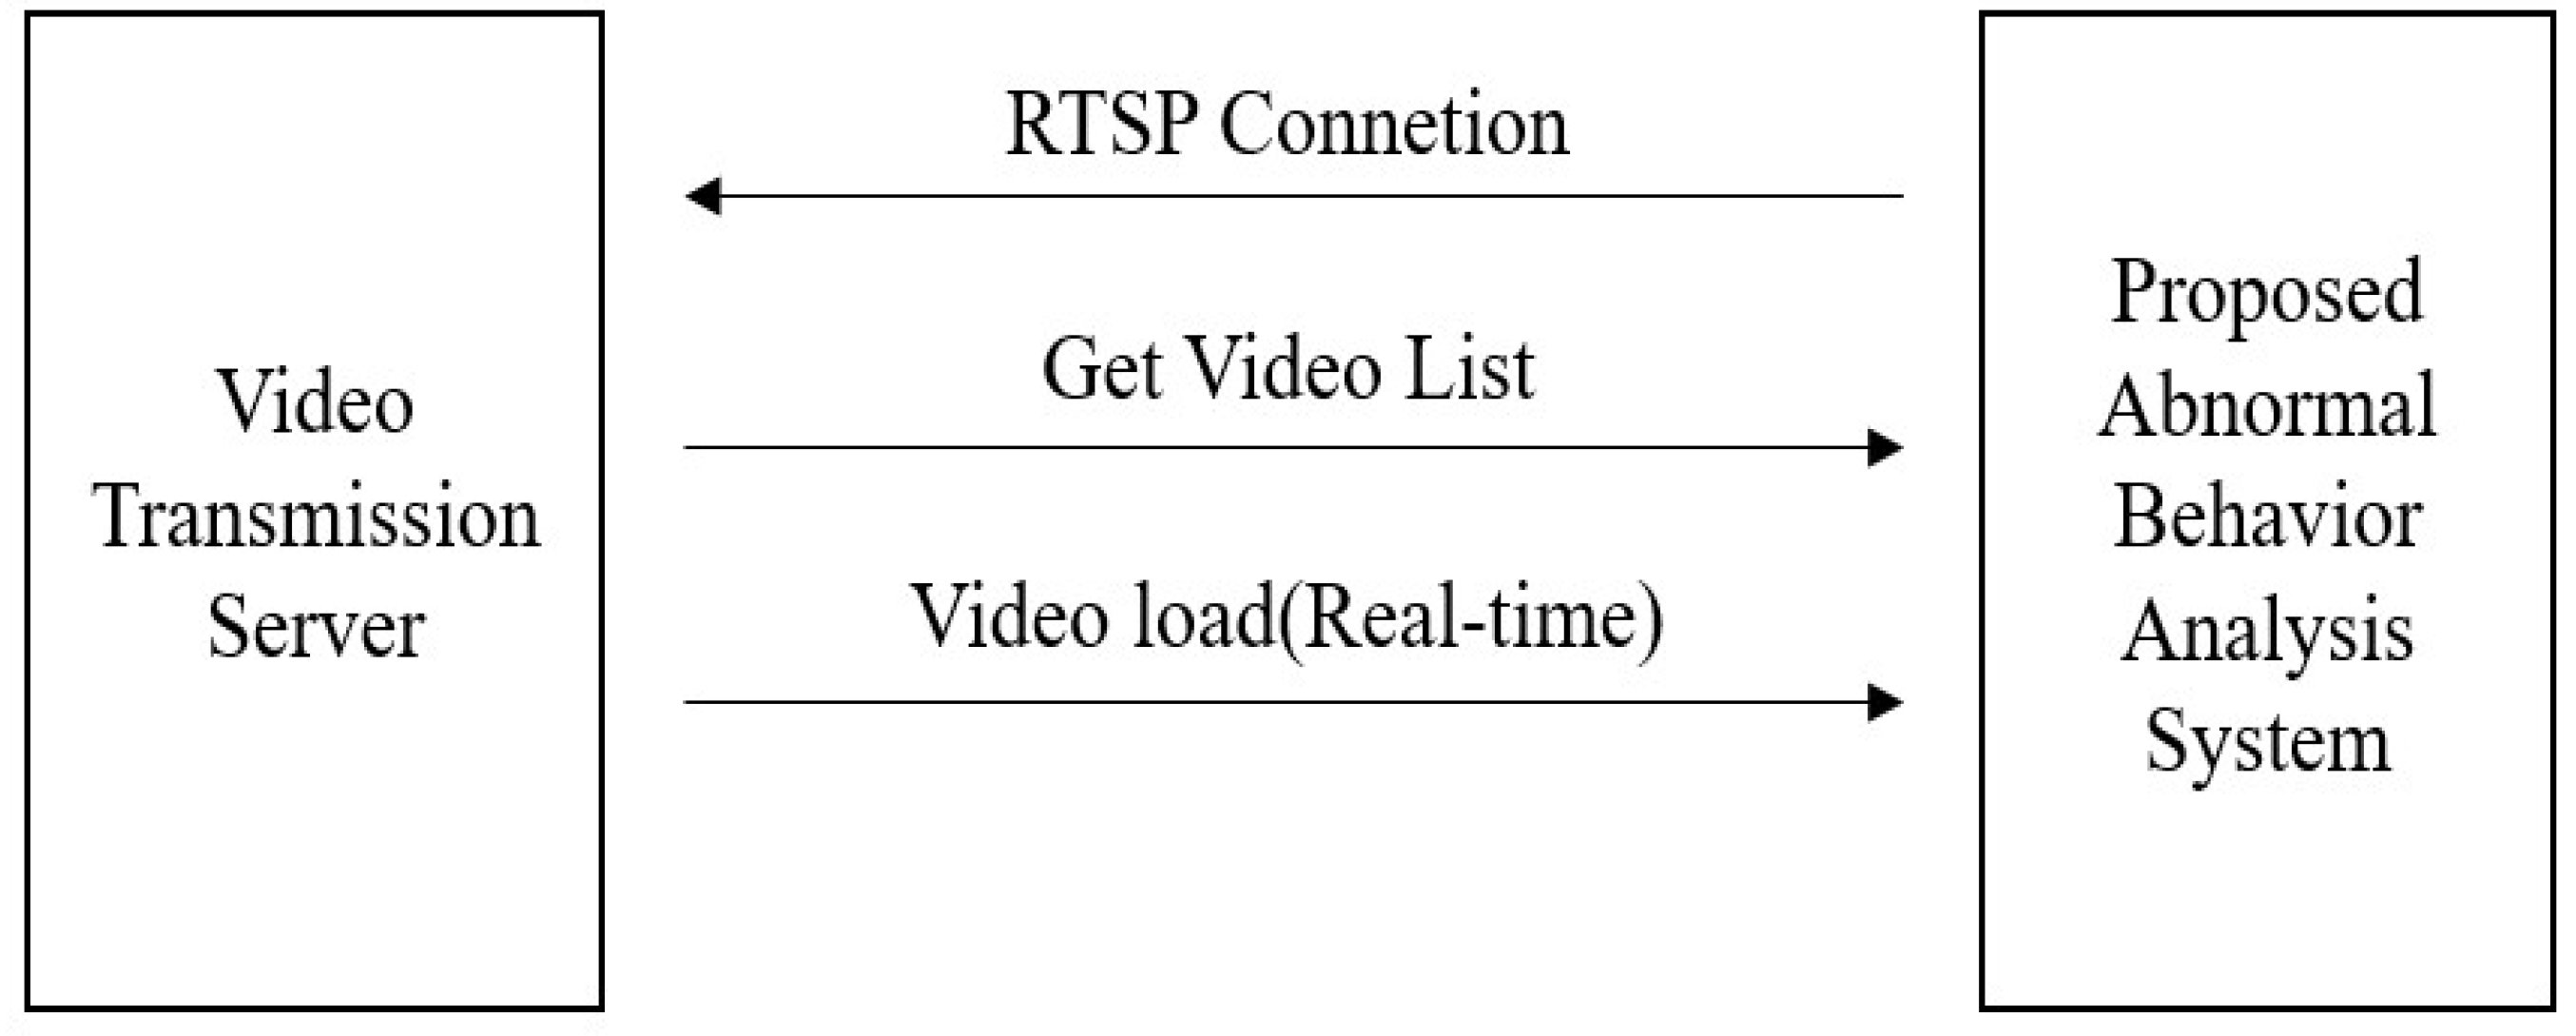
The test image is streamed from the image transmission server to the test computer in real-time using an Real Time Streaming Protocol (RTSP)-based Very Large Cone (VLC) player [37] as shown in Figure 11. We read the video list, and load the video information in an appropriate order. In the xml file in which video information is recorded, there are ROIs and abnormal behavior scenarios to determine intrusion and loitering. Table 5 shows the KISA evaluation criteria for each scenario. The event start time defines the event recording time in each video. When the situation suggested in the scenario occurs, we performed abnormal behavior analysis and recorded the detected result and time. Since abnormal behavior detection performance is evaluated on a real-time basis, there is a detection time, and if this item is violated, it is classified as false detection in the evaluation.
Table 6 shows the evaluation results of four scenarios for KISA Datasets. Performance evaluation was performed using following equations.
The real-time abnormal behavior detection accuracy was 94.65% on average in four scenarios, which is suitable for real applications.
4.1. Intrusion and Loitering
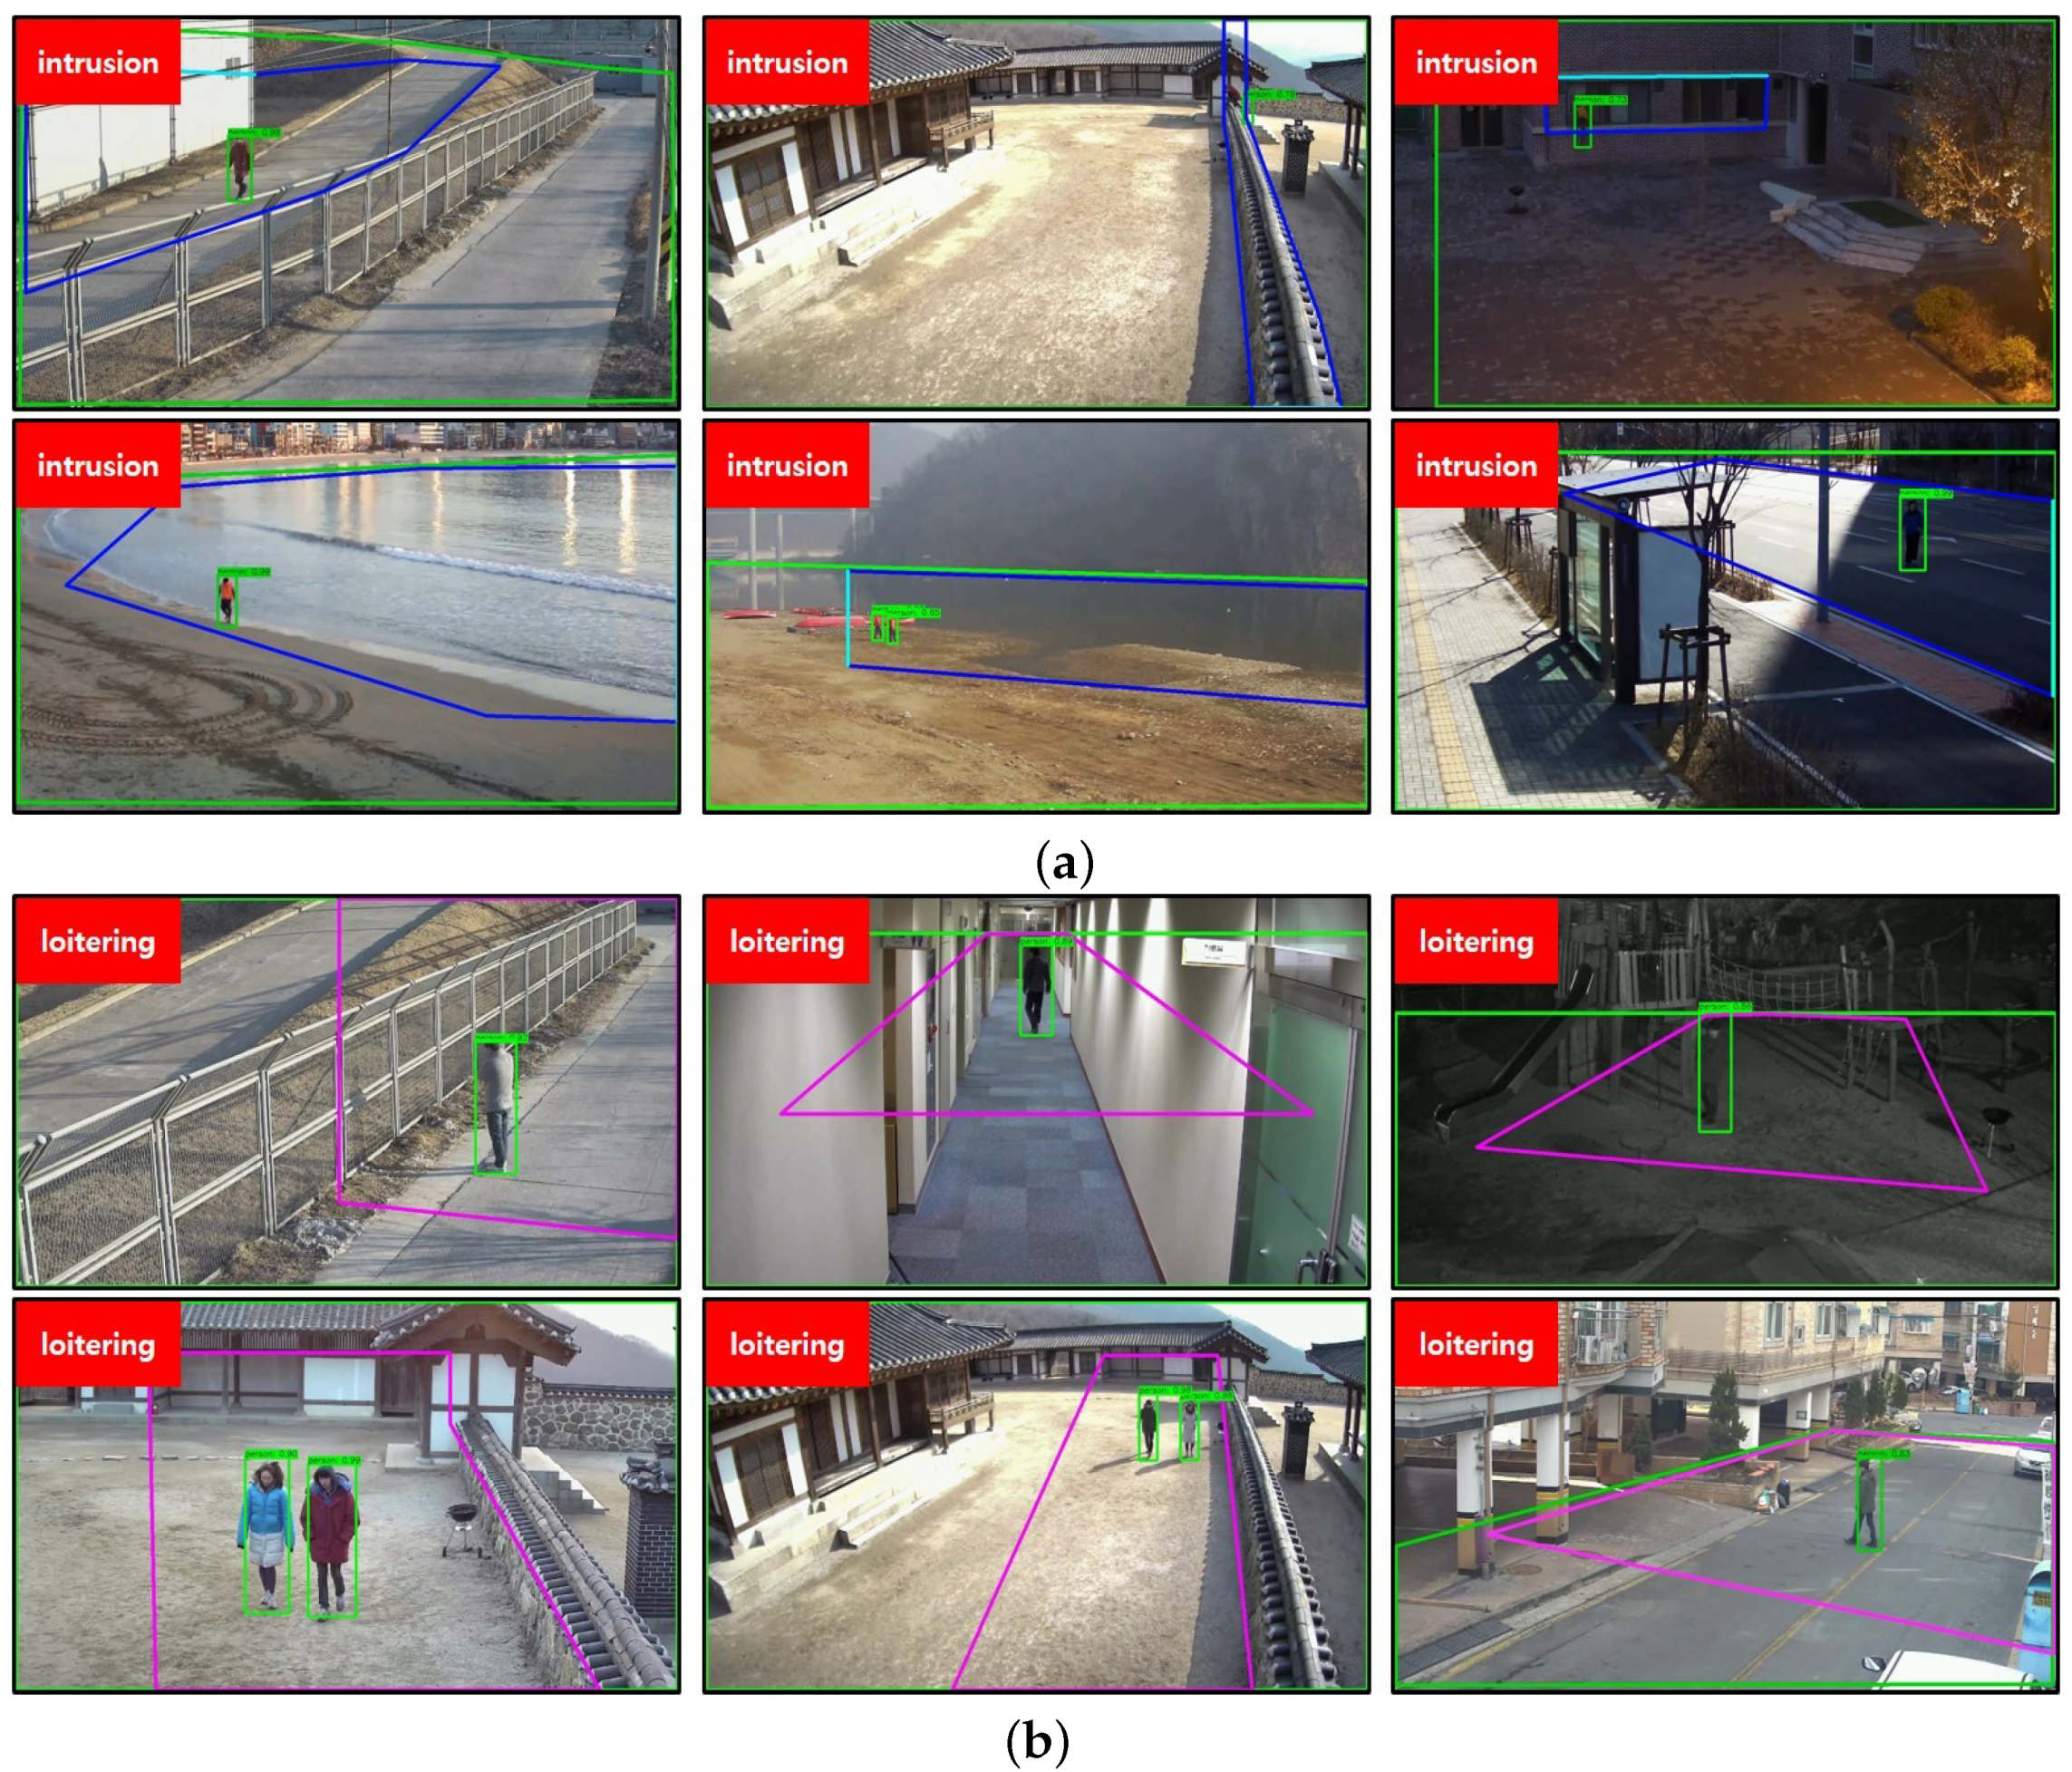
The test result of intrusion succeeded in detecting 144 events out of 150 videos, and an example of the resulting image of the test result of intrusion is shown in Figure 12a. Most of the videos have been successfully detected, but some of the videos have failed due to a false detection in a low-light environment at the ROI. This is a chronic problem of most detection algorithms and can be overcome by additionally improving the performance of the network and training data in a low-light environment in the future.The results of the loitering experiment were successfully detected in 145 out of 150 images, and an example of the resulting image is shown in Figure 12b. In the case of loitering, there is a detection failure in a low-light environment and false detection in the ROI. Since both intrusion and loitering use detection and tracking methods to determine abnormal behavior based on the acquired coordinates, we expect that performance can be improved by improving the performance of the detection network and training additional data as in the case of intrusion.
4.2. Violence and Fall-down
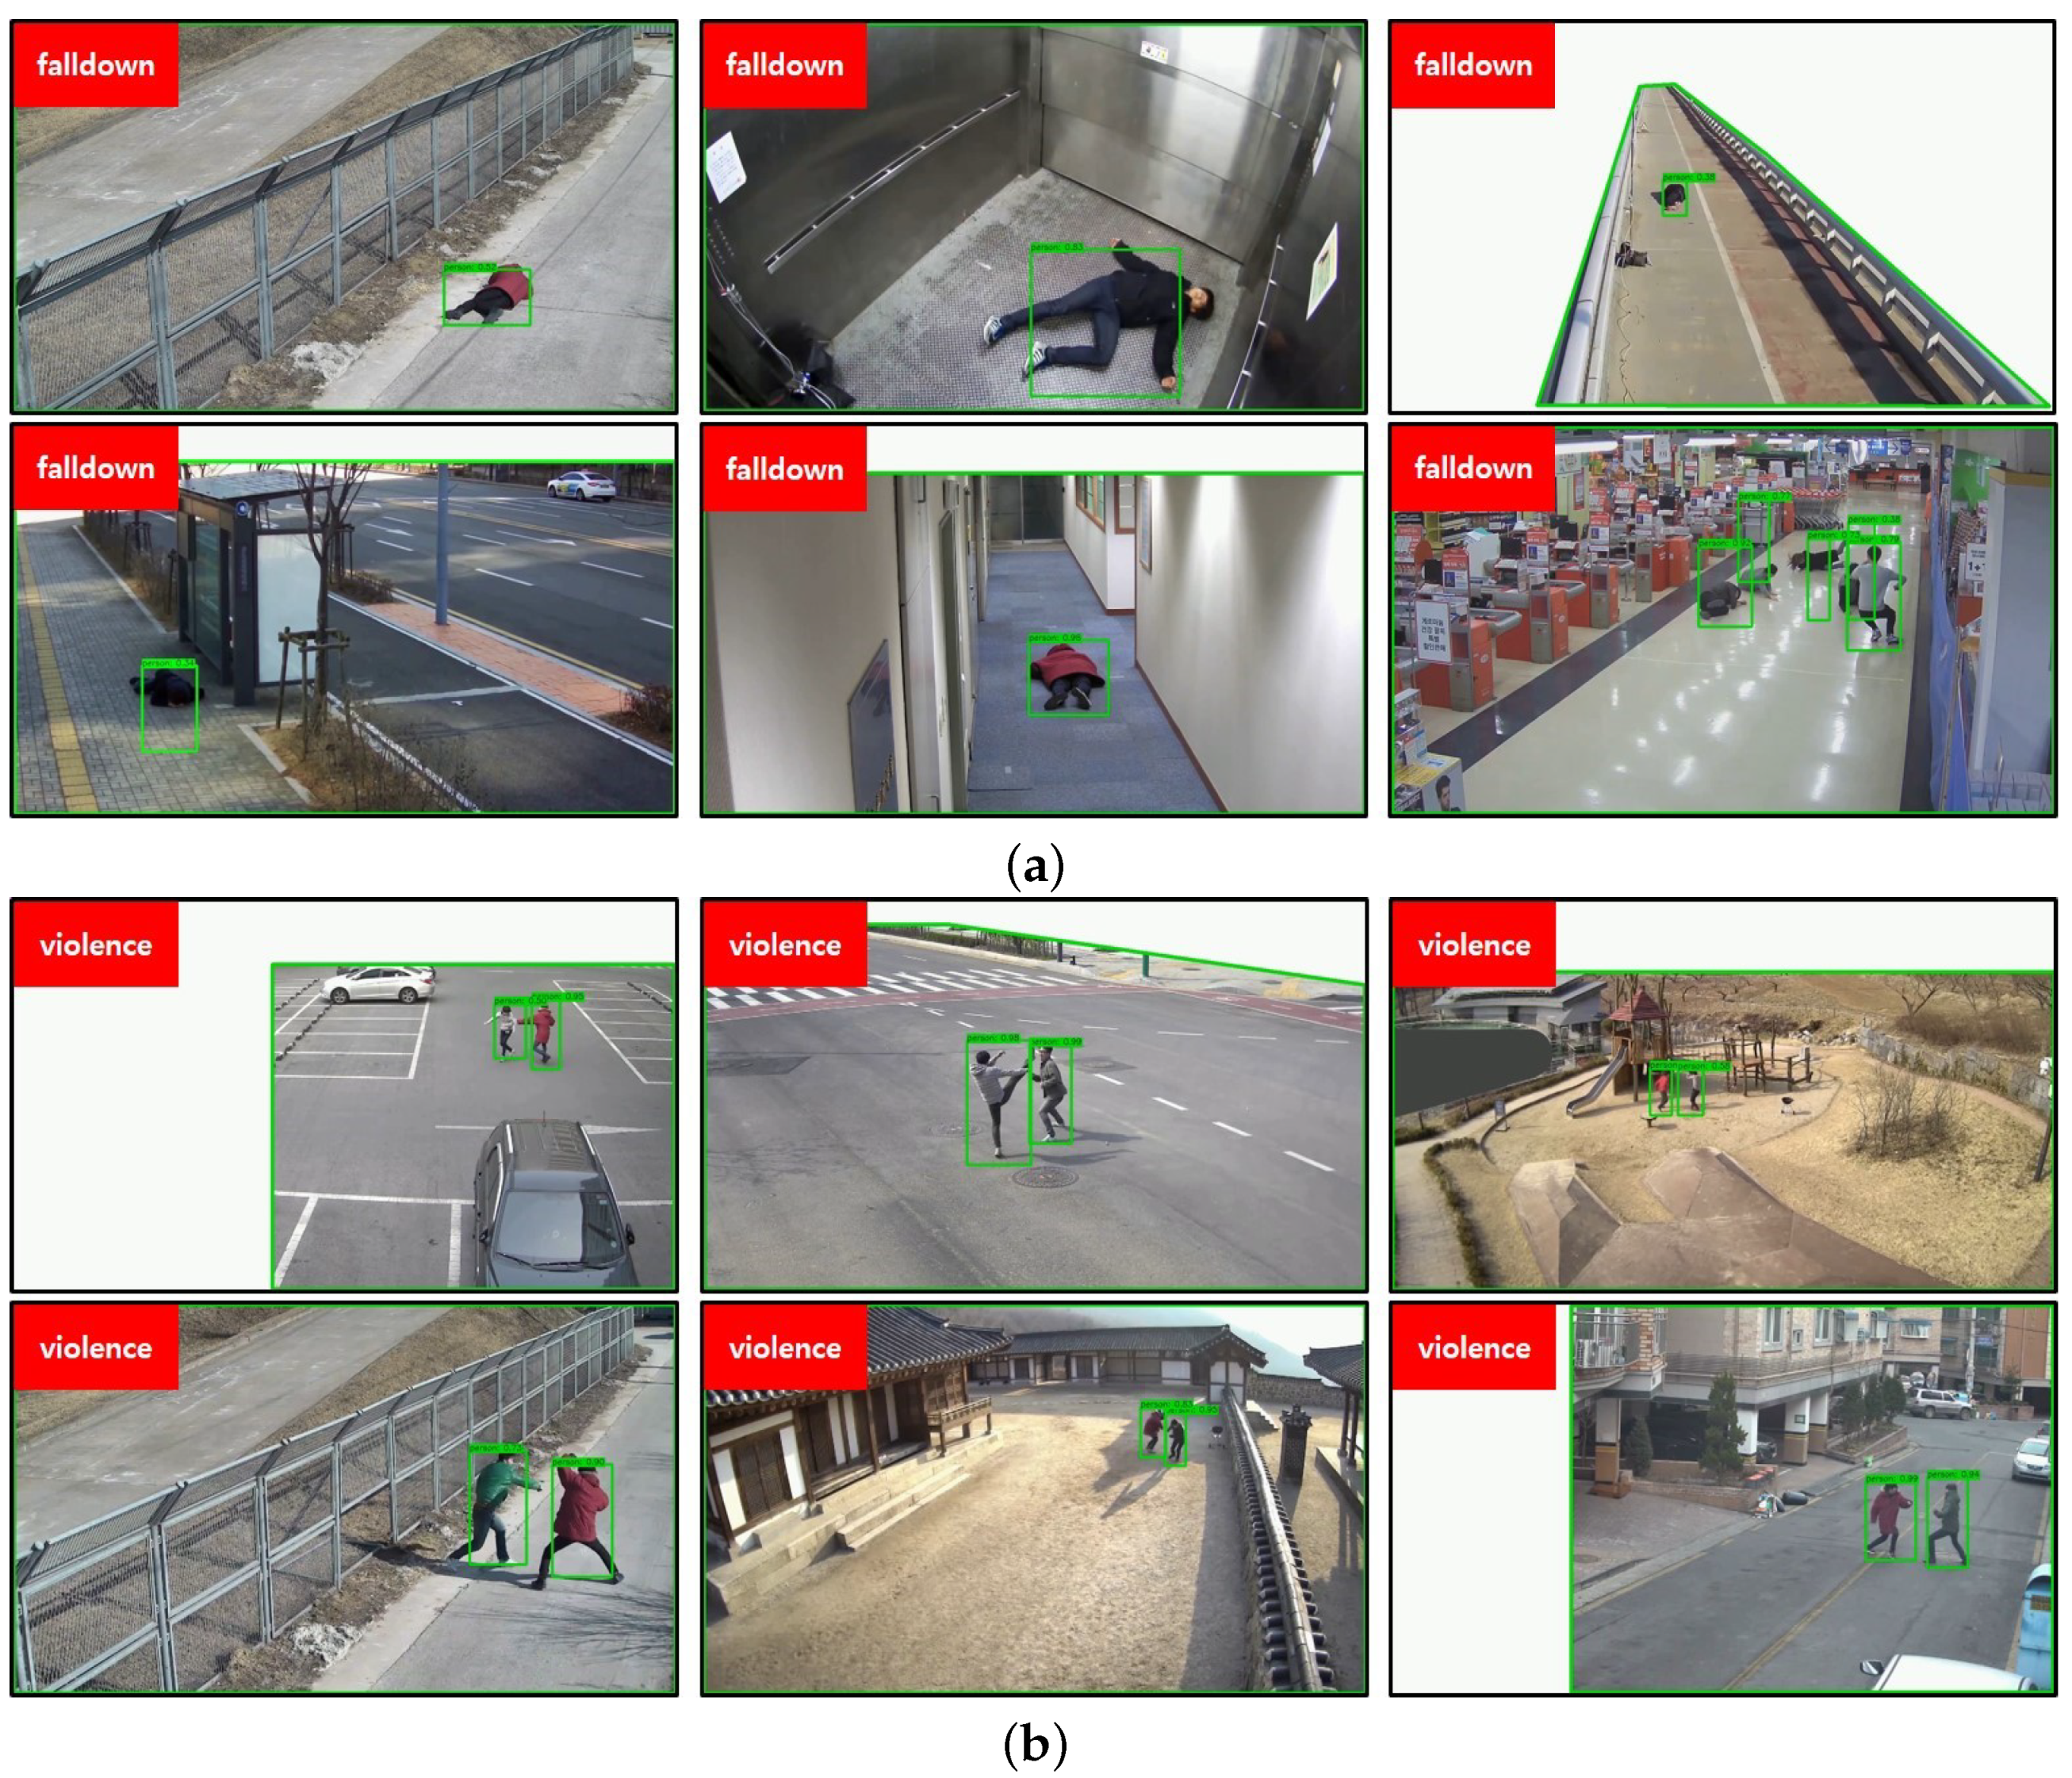
The precision rate of violence detection was 0.960, and an example of the resulting image is shown in Figure 13. In the violence scenario, many personnel appeared, and outstanding results could be derived by showing clear movements. In the failed video, it was detected as violence before the violence behavior took place, and a false detection occurred. However, we expected that performance will be improved if additional dataset configuration and violence definition are added. The precision rate of fall-down was 0.880, which seems insufficient compared with other results. In this paper, training was conducted by dividing behavior recognition into normal behavior, fall-down behavior, and violence behavior. Algorithms were used to compensate for the behavior overlap problem between the acts of violence and fall-down, but they were not completely compensated. In addition, the detection failed because there were parts that were difficult to clearly distinguish the fall-down behavior according to the angle of the image. To clearly judge this and improve the performance, it is expected to show better performance if additional networks such as pose estimation are combined. The performance of the proposed abnormal behavior analysis method shows an outstanding accuracy of 0.941 on average, which is the result of a real-time experiment through VLC streaming. If network improvement and additional data sets are constructed, the performance will be further improved, and the proposed method alone is suitable for use in real environments.
5. Conclusions
In this paper, we proposed a real-time abnormal behavior analysis method of pedestrians on the road based on the detection and tracking of pedestrians. The proposed system determines intrusion and loitering based on detection and tracking, and transmits the cropped image of pedestrians to the abnormal behavior analysis module for abnormal behavior analysis. Instead of detecting a pedestrian every frame, we detect the pedestrian’s location at regular intervals, and tracking it for the rest of frames. The cropped images are transmitted to the analysis module of the abnormal behavior in real-time, and the fall-down and violence are analyzed through the behavior recognition algorithm. Various functions were designed and configured to facilitate information management and communication between the two modules, and the real-time performance and excellent accuracy of the proposed algorithm were confirmed from the experimental results.
In experimental results, the behavior of intrusion, loitering, fall-down, and violence were classified based on the KISA certification criteria, and performance evaluation was conducted in a real-time environment through VLC streaming. Classification performance of intrusion, loitering, and violence was very high. Although that of falls was slightly lower, it can be improved through additional algorithms such as pose estimation and additional dataset configuration. The proposed method is a real-time abnormal behavior analysis system, which is suitable for use in real environments. Intrusion, loitering, violence, and fall-down can be used in the surveillance system because they can be used as important indicators to determine crime prevention or emergency situations. In addition, what this paper proposes is a system for analyzing abnormal behavior in CCTV. If the behavior recognition dataset such as sports, arson, and abandonment is additionally trained according to the intended purpose, and an algorithm suitable for it is used, even the mentioned behavior can be analyzed.
Author Contributions
Conceptualization, D.K. and J.P.; methodology, soft ware, D.K. and H.K.; validation, formal analysis, D.K., Y.M. and H.K.; writing—original draft preparation, D.K. and H.K.; writing—weview and editing, H.K., Y.M. and J.P.; supervision, project administration, J.P. All authors have read and agreed to the published version of the manuscript.
Funding
This work was partly supported by Institute for Information & communications Technology Planning & Evaluation(IITP) grant funded by the Korea government(MSIT)(No.2021-0-01341), by the National R&D Program through the National Research Foundation of Korea(NRF) funded by Ministry of Science and ICT(2020M3F6A1110350) and by the Institute of Civil-Military Technology Cooperation Program funded by the Defense Acquisition Program Administration and Ministry of Trade, Industry and Energy of Korean government under grant No. 19CM5119.
Institutional Review Board Statement
Not applicable.
Informed Consent Statement
Not applicable.
Data Availability Statement
The KISA datasets presented in this study are openly available in [4].
Conflicts of Interest
The authors declare no conflict of interest. The funders had no role in the design of the study; in the collection, analyses, or interpretation of data; in the writing of the manuscript, or in the decision to publish.
References
- Bochkovskiy, A.; Wang, C.Y.; Liao, H.Y.M. Yolov4: Optimal speed and accuracy of object detection. arXiv 2020, arXiv:2004.10934. [Google Scholar]
- Henriques, J.F.; Caseiro, R.; Martins, P.; Batista, J. High-speed tracking with kernelized correlation filters. IEEE Trans. Pattern Anal. Mach. Intell. 2014, 37, 583–596. [Google Scholar] [CrossRef] [PubMed] [Green Version]
- Hara, K.; Kataoka, H.; Satoh, Y. Can Spatiotemporal 3D CNNs Retrace the History of 2D CNNs and ImageNet? In Proceedings of the IEEE Conference on Computer Vision and Pattern Recognition (CVPR), Salt Lake City, UT, USA, 18–23 June 2018; pp. 6546–6555. [Google Scholar]
- KISA Dataset. Available online: https://www.kisa.or.kr (accessed on 10 May 2021).
- Amraee, S.; Vafaei, A.; Jamshidi, K.; Adibi, P. Abnormal event detection in crowded scenes using one-class SVM. Signal Image Video Process. 2018, 12, 1115–1123. [Google Scholar] [CrossRef]
- Kalaivani, P.; Roomi, S.M.M.; Jaishree, B. Video event representation for abnormal event detection. In Proceedings of the 2017 IEEE International Conference on Circuits and Systems (ICCS), San Francisco, CA, USA, 25–27 October 2017; pp. 463–468. [Google Scholar]
- Wang, M.; Zhu, Y.; Sun, Z.; Cao, Z.; Xiong, P.; Zheng, Y.; Song, S. Abnormal Behavior Detection of ATM Surveillance Videos Based on Pseudo-3D Residual Network. In Proceedings of the 2019 IEEE 4th International Conference on Cloud Computing and Big Data Analysis (ICCCBDA), Chengdu, China, 12–15 April 2019; pp. 412–417. [Google Scholar]
- Simonyan, K.; Zisserman, A. Two-stream convolutional networks for action recognition in videos. arXiv 2014, arXiv:1406.2199. [Google Scholar]
- Tran, D.; Bourdev, L.; Fergus, R.; Torresani, L.; Paluri, M. Learning spatiotemporal features with 3d convolutional networks. In Proceedings of the IEEE International Conference on Computer Vision, Santiago, Chile, 7–13 December 2015; pp. 4489–4497. [Google Scholar]
- Feichtenhofer, C.; Pinz, A.; Zisserman, A. Convolutional two-stream network fusion for video action recognition. In Proceedings of the IEEE Conference on Computer Vision and Pattern Recognition, Las Vegas, NV, USA, 27–30 June 2016; pp. 1933–1941. [Google Scholar]
- Crasto, N.; Weinzaepfel, P.; Alahari, K.; Schmid, C. Mars: Motion-augmented rgb stream for action recognition. In Proceedings of the IEEE/CVF Conference on Computer Vision and Pattern Recognition, Long Beach, CA, USA, 16–20 June 2019; pp. 7882–7891. [Google Scholar]
- Karpathy, A.; Toderici, G.; Shetty, S.; Leung, T.; Sukthankar, R.; Fei-Fei, L. Large-scale video classification with convolutional neural networks. In Proceedings of the IEEE Conference on Computer Vision and Pattern Recognition, Columbus, OH, USA, 23–28 June 2014; pp. 1725–1732. [Google Scholar]
- Carreira, J.; Zisserman, A. Quo vadis, action recognition? A new model and the kinetics dataset. In Proceedings of the IEEE Conference on Computer Vision and Pattern Recognition, Honolulu, HI, USA, 21–26 July 2017; pp. 6299–6308. [Google Scholar]
- Wang, L.; Koniusz, P.; Huynh, D.Q. Hallucinating idt descriptors and i3d optical flow features for action recognition with cnns. In Proceedings of the IEEE/CVF International Conference on Computer Vision, Seoul, Korea, 27–28 October 2019; pp. 8698–8708. [Google Scholar]
- Choutas, V.; Weinzaepfel, P.; Revaud, J.; Schmid, C. Potion: Pose motion representation for action recognition. In Proceedings of the IEEE Conference on Computer Vision and Pattern Recognition, Salt Lake City, UT, USA, 18–23 June 2018; pp. 7024–7033. [Google Scholar]
- Zach, C.; Pock, T.; Bischof, H. A duality based approach for realtime tv-l 1 optical flow. In Joint Pattern Recognition Symposium; Springer: Berlin/Heidelberg, Germany, 2007; pp. 214–223. [Google Scholar]
- Yan, A.; Wang, Y.; Li, Z.; Qiao, Y. PA3D: Pose-action 3D machine for video recognition. In Proceedings of the IEEE/CVF Conference on Computer Vision and Pattern Recognition, Long Beach, CA, USA, 16–20 June 2019; pp. 7922–7931. [Google Scholar]
- Kaddah, W.; Gooya, E.S.; Elbouz, M.; Alfalou, A. Securing smart cities using artificial intelligence: Intrusion and abnormal behavior detection system. In Pattern Recognition and Tracking XXXII; International Society for Optics and Photonics: San Diego, CA, USA, 2021; Volume 11735, p. 117350J. [Google Scholar]
- Ji, H.; Zeng, X.; Li, H.; Ding, W.; Nie, X.; Zhang, Y.; Xiao, Z. Human abnormal behavior detection method based on T-TINY-YOLO. In Proceedings of the 5th International Conference on Multimedia and Image Processing, Nanjing, China, 10–12 January 2020; pp. 1–5. [Google Scholar]
- Hu, X.; Dai, J.; Huang, Y.; Yang, H.; Zhang, L.; Chen, W.; Yang, G.; Zhang, D. A weakly supervised framework for abnormal behavior detection and localization in crowded scenes. Neurocomputing 2020, 383, 270–281. [Google Scholar] [CrossRef]
- Mojarad, R.; Attal, F.; Chibani, A.; Amirat, Y. A hybrid context-aware framework to detect abnormal human daily living behavior. In Proceedings of the 2020 International Joint Conference on Neural Networks (IJCNN), Glasgow, UK, 19–24 July 2020; pp. 1–8. [Google Scholar]
- Ren, S.; He, K.; Girshick, R.; Sun, J. Faster r-cnn: Towards real-time object detection with region proposal networks. arXiv 2015, arXiv:1506.01497. [Google Scholar] [CrossRef] [PubMed] [Green Version]
- Lin, T.Y.; Maire, M.; Belongie, S.; Hays, J.; Perona, P.; Ramanan, D.; Dollár, P.; Zitnick, C.L. Microsoft coco: Common objects in context. In European Conference on Computer Vision; Springer: Zurich, Switzerland, 2014; pp. 740–755. [Google Scholar]
- Kim, D.; Kim, H.; Shin, J.; Mok, Y.; Paik, J. Real-Time Multiple Pedestrian Tracking Based on Object Identification. In Proceedings of the 2019 IEEE 9th International Conference on Consumer Electronics (ICCE-Berlin), Berlin/Heidelberg, Germany, 8–11 September 2019; pp. 363–365. [Google Scholar]
- Lu, C.; Shi, J.; Jia, J. Abnormal event detection at 150 fps in matlab. In Proceedings of the IEEE International Conference on Computer Vision, Sydney, Australia, 1–8 December 2013; pp. 2720–2727. [Google Scholar]
- Wang, J.; Cherian, A. Gods: Generalized one-class discriminative subspaces for anomaly detection. In Proceedings of the IEEE/CVF International Conference on Computer Vision, Seoul, Korea, 27–28 October 2019; pp. 8201–8211. [Google Scholar]
- Sultani, W.; Chen, C.; Shah, M. Real-world anomaly detection in surveillance videos. In Proceedings of the IEEE Conference on Computer Vision and Pattern Recognition, Salt Lake City, UT, USA, 18–23 June 2018; pp. 6479–6488. [Google Scholar]
- Dubey, S.; Boragule, A.; Jeon, M. 3D ResNet with Ranking Loss Function for Abnormal Activity Detection in Videos. In Proceedings of the 2019 International Conference on Control, Automation and Information Sciences (ICCAIS), Chengdu, China, 24–27 October 2019; pp. 1–6. [Google Scholar]
- Zhang, J.; Qing, L.; Miao, J. Temporal convolutional network with complementary inner bag loss for weakly supervised anomaly detection. In Proceedings of the 2019 IEEE International Conference on Image Processing (ICIP), Taipei, Taiwan, 22–25 September 2019; pp. 4030–4034. [Google Scholar]
- Kamoona, A.M.; Gosta, A.K.; Bab-Hadiashar, A.; Hoseinnezhad, R. Multiple Instance-Based Video Anomaly Detection using Deep Temporal Encoding-Decoding. arXiv 2020, arXiv:2007.01548. [Google Scholar]
- Zhong, J.X.; Li, N.; Kong, W.; Liu, S.; Li, T.H.; Li, G. Graph convolutional label noise cleaner: Train a plug-and-play action classifier for anomaly detection. In Proceedings of the IEEE/CVF Conference on Computer Vision and Pattern Recognition, Long Beach, CA, USA, 16–20 June 2019; pp. 1237–1246. [Google Scholar]
- Feng, J.C.; Hong, F.T.; Zheng, W.S. Mist: Multiple instance self-training framework for video anomaly detection. In Proceedings of the IEEE/CVF Conference on Computer Vision and Pattern Recognition, Nashville, TN, USA, 21–24 June 2021; pp. 14009–14018. [Google Scholar]
- Wu, P.; Liu, J.; Shi, Y.; Sun, Y.; Shao, F.; Wu, Z.; Yang, Z. Not only Look, but also Listen: Learning Multimodal Violence Detection under Weak Supervision. In European Conference on Computer Vision; Springer: Berlin/Heidelberg, Germany, 2020; pp. 322–339. [Google Scholar]
- Tian, Y.; Pang, G.; Chen, Y.; Singh, R.; Verjans, J.W.; Carneiro, G. Weakly-supervised Video Anomaly Detection with Robust Temporal Feature Magnitude Learning. arXiv 2021, arXiv:2101.10030. [Google Scholar]
- Schuldt, C.; Laptev, I.; Caputo, B. Recognizing human actions: A local SVM approach. In Proceedings of the 17th International Conference on Pattern Recognition, ICPR 2004, Cambridge, UK, 23–26 August 2004; Volume 3, pp. 32–36. [Google Scholar]
- Liu, J.; Luo, J.; Shah, M. Recognizing realistic actions from videos “in the wild”. In Proceedings of the 2009 IEEE Conference on Computer Vision and Pattern Recognition, Miami, FL, USA, 19–25 June 2009; pp. 1996–2003. [Google Scholar]
- VLC Player. Available online: https://www.videolan.org (accessed on 10 May 2021).
Figure 1.
Proposed abnormal behavior analysis network.

Figure 2.
Two examples where the object goes out of image: (a) Objects that disappear from the outside of the image, (b) Objects that disappear within the image.
Figure 2.
Two examples where the object goes out of image: (a) Objects that disappear from the outside of the image, (b) Objects that disappear within the image.

Figure 3.
Object List.

Figure 4.
ObjectManager Flowcharts.

Figure 5.
Same Object Tracking Experimental Results.

Figure 6.
ObjectCropper Flowcharts.

Figure 7.
Intrusion and Loitering Region of Interest (ROI): (a) Intrusion ROI, (b) Loitering ROI.

Figure 8.
Intrusion and Loitering ROI: (a) Pre-defined ROI area, (b) Binary background image of ROI area.
Figure 8.
Intrusion and Loitering ROI: (a) Pre-defined ROI area, (b) Binary background image of ROI area.

Figure 9.
Violence/Fall-down Experimental Results: (a) Normal, (b) Fall-down behavior, (c) Fall-down.
Figure 9.
Violence/Fall-down Experimental Results: (a) Normal, (b) Fall-down behavior, (c) Fall-down.

Figure 10.
Framework of the Proposed System.

Figure 11.
VLC environment video transmission server.

Figure 12.
Intrusion/Loitering Experimental Results: (a) Intrusion Experimental Results, (b) Loitering Experimental Results.
Figure 12.
Intrusion/Loitering Experimental Results: (a) Intrusion Experimental Results, (b) Loitering Experimental Results.

Figure 13.
Fall-down/Violence Experimental Results: (a) Fall-down Experimental Results, (b) Violence Experimental Results.
Figure 13.
Fall-down/Violence Experimental Results: (a) Fall-down Experimental Results, (b) Violence Experimental Results.


Table 1.
Training Accuracy and Loss.
| Epoch = 200 | ResNet-34 | |
|---|---|---|
| Train | Acc | 0.9748 |
| Loss | 0.0689 | |
| Validation | Acc | 0.9433 |
| Loss | 0.1745 | |
Table 2.
Frame-level AUC performance on UCF-Crime.
| Supervision | Method | Feature | AUC (%) |
|---|---|---|---|
| Unsupervised | Lu et al. [25] | C3D RGB | 65.51 |
| BODS [26] | I3D RGB | 68.26 | |
| GODS [26] | I3D RGB | 70.46 | |
| Weakly Supervised | Sultani et al. [27] | C3D RGB | 75.41 |
| 3D ResNet [28] | R3D RGB | 76.67 | |
| Zhang et al. [29] | C3D RGB | 78.66 | |
| Kamoona et al. [30] | C3D RGB | 79.49 | |
| GCN-Annmaly [31] | C3D RGB | 81.08 | |
| MIST [32] | C3D RGB | 81.40 | |
| MlST [32] | I3D RGB | 82.30 | |
| Wu et al. [33] | I3D RGB | 82.44 | |
| Tian et al. [34] | C3D RGB | 83.28 | |
| Tian et al. [34] | I3D RGB | 84.03 |
Table 3.
Action Recognition Evaluation Performance.
| C3D | I3D | R3D | |
|---|---|---|---|
| KTH [35] | 0.79 | 0.96 | 0.82 |
| UCF-11 [36] | 0.84 | 0.98 | 0.84 |
| KISA Datasets | 0.81 | 0.59 | 0.87 |
Table 4.
Configure KISA datasets.
| Event | Video DB | Count |
|---|---|---|
| Intrusion |  | 150 |
| Loitering |  | 150 |
| Violence |  | 50 |
| Fall-down |  | 50 |
| Time: 6 time zones: sunrise, 9 o’clock, 12 o’clock, 15 o’clock, sunset, and night. | ||
| Cameras: short distance (10–15m), medium distance (15-20m), | ||
| Common | and long-distance (20–30 m). | |
| Condition | Weather: sunny, cloudy. | |
| Resolution: 1280 × 720. | ||
| Video File: MP4 file encoded with h.264 codec. | ||
| Video length: within 3–10 min. | ||
Table 5.
KISA performance evaluation criteria.
| Event | Event Start Time | Detection Time |
|---|---|---|
| Intrusion | When invading into the ROI Area | |
| Loitering | When staying in the ROI area for more than 10 s. | 2 seconds before the action occurs, within 10 s after the action. |
| Violence | When an assault occurs between two or more pedestrians. | |
| Fall-down | When a pedestrian falls to the ground. |
Table 6.
KISA Datasets Experimental Results.
| Event | Recall Rate | Precision Rate | F1 Value |
|---|---|---|---|
| Intrusion | 0.947 | 0.959 | 0.953 |
| Loitering | 0.967 | 0.967 | 0.967 |
| Violence | 0.960 | 0.960 | 0.960 |
| Fall-down | 0.880 | 0.880 | 0.880 |
| Average | 0.938 | 0.941 | 0.940 |
Publisher’s Note: MDPI stays neutral with regard to jurisdictional claims in published maps and institutional affiliations. |
© 2021 by the authors. Licensee MDPI, Basel, Switzerland. This article is an open access article distributed under the terms and conditions of the Creative Commons Attribution (CC BY) license (https://creativecommons.org/licenses/by/4.0/).
Share and Cite
MDPI and ACS Style
Kim, D.; Kim, H.; Mok, Y.; Paik, J. Real-Time Surveillance System for Analyzing Abnormal Behavior of Pedestrians. Appl. Sci. 2021, 11, 6153. https://doi.org/10.3390/app11136153
AMA Style
Kim D, Kim H, Mok Y, Paik J. Real-Time Surveillance System for Analyzing Abnormal Behavior of Pedestrians. Applied Sciences. 2021; 11(13):6153. https://doi.org/10.3390/app11136153
Chicago/Turabian StyleKim, Dohun, Heegwang Kim, Yeongheon Mok, and Joonki Paik. 2021. "Real-Time Surveillance System for Analyzing Abnormal Behavior of Pedestrians" Applied Sciences 11, no. 13: 6153. https://doi.org/10.3390/app11136153
Note that from the first issue of 2016, this journal uses article numbers instead of page numbers. See further details here.