
IoT Open-Source Architecture for the Maintenance of Building Facilities
by
 , , and
Valentina Villa
1,* ,
,
Berardo Naticchia
2,
Giulia Bruno
3,
Khurshid Aliev
1, 
Paolo Piantanida
1 and
Dario Antonelli
3 1
Department of Structural, Geotechnical and Building Engineering, Polytechnic of Turin, 10129 Turin, Italy
2
Department of Construction, Civil Engineering and Architecture, Marche Polytechnic University, 60121 Ancona, Italy
3
Department of Management and Production Engineering, Polytechnic of Turin, 10129 Turin, Italy
*
Author to whom correspondence should be addressed.
Appl. Sci. 2021, 11(12), 5374; https://doi.org/10.3390/app11125374
Submission received: 30 April 2021
/
Revised: 26 May 2021
/
Accepted: 30 May 2021
/
Published: 9 June 2021
(This article belongs to the Special Issue Cognitive Buildings)
Abstract
:The introduction of the Internet of Things (IoT) in the construction industry is evolving facility maintenance (FM) towards predictive maintenance development. Predictive maintenance of building facilities requires continuously updated data on construction components to be acquired through integrated sensors. The main challenges in developing predictive maintenance tools for building facilities is IoT integration, IoT data visualization on the building 3D model and implementation of maintenance management system on the IoT and building information modeling (BIM). The current 3D building models do not fully interact with IoT building facilities data. Data integration in BIM is challenging. The research aims to integrate IoT alert systems with BIM models to monitor building facilities during the operational phase and to visualize building facilities’ conditions virtually. To provide efficient maintenance services for building facilities this research proposes an integration of a digital framework based on IoT and BIM platforms. Sensors applied in the building systems and IoT technology on a cloud platform with opensource tools and standards enable monitoring of real-time operation and detecting of different kinds of faults in case of malfunction or failure, therefore sending alerts to facility managers and operators. Proposed preventive maintenance methodology applied on a proof-of-concept heating, ventilation and air conditioning (HVAC) plant adopts open source IoT sensor networks. The results show that the integrated IoT and BIM dashboard framework and implemented building structures preventive maintenance methodology are applicable and promising. The automated system architecture of building facilities is intended to provide a reliable and practical tool for real-time data acquisition. Analysis and 3D visualization to support intelligent monitoring of the indoor condition in buildings will enable the facility managers to make faster and better decisions and to improve building facilities’ real time monitoring with fallouts on the maintenance timeliness.
1. Introduction
Correctly managing the maintenance phase is the pivot to lower costs and energy waste [1] and to preserve the asset value over time and, above all, to maintain the level of performance required by users. Real Estate property managers are now realizing that investing in this activity brings tangible benefits in terms of investment preservation and a strong perception by customers/users. One of the early frameworks used to visualize the collected data was the building management system (BMS), developed in the 1980s [2]. The BMS is a system for controlling and monitoring a building’s facilities, such as heating, lighting, electrical and mechanical services, safety and security [3]. Since the introduction of BIM [4], the industry’s awareness of the importance of adopting digital models for FM is increasing [5]. Thus, there is a need for faster, more efficient, and possibly error-free real-time visualization and analysis of collected data. In fact, building control together with maintenance operators need to analyze both stored and current data measured by sensors to track and monitor the overall performance of the building [6].
Maintenance is generally classified as corrective (run-to-failure), scheduled, preventive, predictive and proactive [7]. Corrective maintenance operates only in case of failures and in the event of interruption of a service; scheduled maintenance uses the estimated life span of each component to provide for its replacement according to predefined schedules [8]. Preventive maintenance involves system inspection and control at fixed intervals to lessen the likelihood of it failing unexpectedly [9]. Predictive maintenance, through sensors and machine learning algorithms, allows detection of abnormal behaviors well before accidents happen [10]. Presently, this is mainly applied in manufacturing industries [11]: out-of-range data [12] are identified, analyzed and intervention procedures are implemented to restore the system’s correct behavior. Proactive maintenance focuses on the root causes of failure, not fault symptoms, in order to improve the system operation.
The breakthrough for improving the efficiency and effectiveness of FM is the integration with IoT technologies, i.e., building environmental data [13] and the use of wireless sensors to collect data from building systems [14].
Several technologies are introduced: for example, data visualization using a BIM platform that helps operators to efficiently navigate through buildings [15], or the use of BIM combined with wireless sensors [16] to monitor temperatures in the subway stations [17], or CO2 levels [18] or occupancy levels [19] in the rooms.
Therefore, the technologies now developed should allow facility managers real-time analysis, optimization, and visualization of large data sets to better manage energy consumption, operation costs, and user comfort. In general, there is still limited research on the application of these new technologies during the building’s service life [20], particularly concerning the FM sector. In most cases, even if the use of automated sensors/devices and databases is present, the information collected is not fully exploited [21,22].
Similar research has already been introduced [23,24,25], where some authors [23] represent automated IoT and BIM-based alert systems for comfort monitoring in buildings. They used humidity and temperature sensors to detect discomfort in rooms, whereas other authors [26] integrated IoT sensor data (temperature, illuminance and power consumption) to monitor indoor conditions of the buildings. The weak point of all the above works is that they do not provide building facility management services. This unavoidably results in laborious and inefficient processes [20].
In addition, FM operators still rely on paper maintenance and control sheets, and this again greatly increases both the time required for compilation and processing of the information [21]. Therefore, the proposal of a stream-lined and technology-integrated workflow methodology is essential for the improvement of FM processes and the effective improvement of the efficiency of plant systems. In the present case study, the proposed methodology will be tested on a HVAC device, specifically on a FC.
The study goal is to create an IoT network for FM in order to monitor components of the HVAC system and detect their failures. This work presents part of a larger research focused on developing a proof-of-concept implementation of a digital framework based on the connection between existing technologies, to support the building data digital transaction. The specific purpose of this paper is to define a data management methodology integrated with fault detection, tailored for the FM. A cloud-based user interface (UI), an integrated IoT and BIM model provides the building 3D model with information on room temperature, humidity and luminosity, and fan coil service condition. On the edge of the system, this integrated fault detection methodology notifies and sends alerts to the facility managers when any anomaly is detected. Moreover, maintenance operators can easily find the location of the faulty component on the building 3D model by room ID or room name, both of them integrated into the application. Using a cloud-based service, building supervisors and facility managers can remotely monitor the thermal condition of fan coils and take necessary actions, e.g., if the operating temperature exceeds the pre-defined thresholds. As a result, this paper is organized as follows: a review of the literature related to the current research topic is reported in Section 2, the design architecture of the framework is presented in Section 3 together with the FM fault detection method. IoT and BIM application with data visualization within the case study is presented in Section 4, and finally the results of the IoT and BIM application for the considered case study are discussed.
2. Literature Review
2.1. Operation and Maintenance in Facility Management
Considering the whole life cycle, operation and maintenance (O&M) is the longest and most costly phase compared to others [27]. Therefore, the efficiency of control and monitoring systems is becoming increasingly important. An overall improvement in operational efficiency will be achieved due to improved technologies for data collection and inter-device communication, besides the decreasing cost of sensors with good data collection capabilities [28]. As the complexity and number of devices in HVAC systems increases, errors due to incorrect system configuration may increase; it is estimated that 40% of buildings have improperly configured devices [29] and there is a potential for 40% energy savings from correcting building errors [30]. This not only results in energy waste, but also in system malfunctions leading to discomfort indoors and also reduces air quality levels [31]. For this reason, fault detection and diagnosis (FDD) is becoming more and more important.
As FM is worth up to 85% of the building’s entire life cycle cost [32], efficiency gains become crucial for cost containment and building quality preservation. Furthermore, facility management is a multidisciplinary topic involving many stakeholders and requires the collaboration and coordination of several different teams [33]. ISO 41011:2017 defines FM as an “organizational function which integrates people, place and process within the built environment with the purpose of improving the quality of life of people and the productivity of the core business” [34]. Most buildings currently do not operate efficiently due to standard procedures, fittings not customized for specific use, that generate a lack of information for operators [35]. In addition, there is habitually no historical data available to compare situations and to properly search for the cause for malfunctions or failures; the tools that come along with digital management are often still manually updated spreadsheets, making performance tracking challenging. Moreover, this mixed process is prone to error and confusion. Sometimes some important information is included in the digital models but they cannot describe the building systems’ operation accurately. On the other hand, understanding and using real-time data is crucial nowadays, especially in high-performance buildings equipped with complex and multiple systems that require dynamic management to optimize their energy performance and provide adequate indoor environmental conditions for a large number of occupants [6].
HVAC systems are essential for efficient building operation and indoor air quality (IAQ) is critical to the habitability and comfort of spaces; many research efforts are now focusing on air quality monitoring for post-COVID-19 recovery [36]. HVAC systems also consume about 30% of primary energy in Europe [37], 14% of primary energy in the United States [38], and about 32% of the total amount of electricity generated in the United States [39]. Calculated energy waste as a result of defects in building HVAC systems is due to inappropriate operating procedures, equipment malfunctions, or design issues [40], while controlled and efficient management of HVAC systems is expected to save an average of 5–15% of total energy consumption if fully adopted in existing buildings [41,42].
2.2. BIM and IoT as Digital Twins
With the introduction of sensing and IoT in the construction industry, a new vision of building management tools has been emerging. In particular, a significant solution taken from the manufacturing sector has arisen: cyber-physical systems (CPS) [33]. CPS, better known as digital twins (DT), are a revolutionary digital vision, where the most innovative technologies come together to create a virtual model that performs exactly like its physical “twin”. This continuous information exchange between the data collected in the real building and those processed by the virtual model through self-learning algorithms, makes it possible to mirror the life of the real twin and the corresponding building, to predict the building components’ health, their useful life, failures [43] and, in general, the building performance [44]. In the Industry 4.0 era, physical and virtual worlds are really growing together [45].
Asghari, Rahmani, and Javadi [46] define IoT as “an ecosystem that contains smart objects equipped with sensors, networking and processing technologies integrating and working together to provide an environment in which smart services are taken to the end-users”.
IoT is an unprecedented disruptive technology that has led to interconnection between people and objects on a scale and pace unimaginable even a decade ago [47]. It enables new strategies to improve the quality of life [48], allows autonomous decisions to connected devices through algorithms and machine learning, and can properly inform users to make the best decisions [49], for example, in case of emergencies or major failures. IoT and data networks have great potential in optimizing FM activities, including document management, historical data cataloging, logistics and material tracking, building component lifecycle monitoring, and building energy controls [20]. Several studies have been conducted on the use of data from IoT devices (e.g., [50]), although many of them do not include any BIM integration, and all smart buildings and homes [51] are examples of IoT technology integration.
Actually, the DT can be simply configured as a dashboard with critical performance indicators (KPIs), e.g., data on temperature, pressure, tilt, power, voltage, etc., representing inputs from sensors located on systems’ components or in specific environments. This allows the DT to actively participate from the design to the functional phase of any product or process. According to [52], the first appearance of the DT was in NASA’s Apollo program. In that case, DT was defined as “an integrated multi-physics, multi-scale, probabilistic simulation of a vehicle or system that uses the best available physical models, sensor updates, fleet history, etc., to mirror the life of its flying twin” [53].
In this situation, NASA needed to reproduce the useful life of its assets in a precise manner through the statistical analysis of the data collected by the sensors [54]. Thus, a DT consists of an entity composed of a physical space, a digital space, and a connection layer.
The digitization permeates across all sectors, including construction, and aims to build systems as well as approaches for helping operators not only in the conceptualization, prototyping, testing, and design optimization phase, but also during the operational phase. The importance of numerical simulation tools in the first phase is unquestionable, however, the potential of real-time data availability in the operational phase is opening new possibilities to monitor and improve operations throughout the life cycle of a product. Grieves [55], in his white-paper, called the presence of this virtual representation a “Digital Twin”.
The digital twin arose from the integration of sensor networks and the digitization of machinery and manufacturing systems in the manufacturing industry [56]. The main difference between a design-phase simulation and a digital twin is that the latter requires a physical asset and sensor network, whereas simulation lives in a completely virtual environment [43]. Accordingly, the study in [56] presented an extended definition: “digital twins will facilitate the means to monitor, understand, and optimize the functions of all physical entities, living and non-living, by enabling seamless transmission of data between the physical and virtual worlds.” Research in [57] described the simulation aspect of digital twins as the collection of relevant digital artifacts involving engineering and operational data, as well as the description of behavior using various simulation models. Digital twins use these specific simulation models based on their ability to solve problems, derive solutions relevant to real-life systems, and describe behavior. In general, the study in [57] defined the digital twin view as “a complete physical and functional description of a component, product, or system along with all available operational data.”
Hicks [58] differentiates a digital twin from a virtual prototype and redefines its concept as an appropriately synchronized object of useful information (structure, function, and behavior) of a physical entity in virtual space, with information flows enabling convergence between the physical and virtual states. According to the authors in [44], digital twins represent real objects or subjects with their data, functions, and communication capabilities in the digital world.
Researchers in [59] defined the digital twin of a building as “the interaction between the real-world indoor environment of the building and a digital but realistic virtual representation model of the building environment, which provides the opportunity for real-time monitoring and data acquisition.” In their definition, an indoor environment indicates information about air temperature, airflow, relative humidity, and lighting conditions, while a digital virtual environment indicates computational fluid dynamics and luminance levels. Furthermore, based on the study presented in [59], some of the notable advantages of creating a building digital twin are as follows: (1) collection, generation, and visualization of the building environment; (2) analysis of data irregularities; and (3) optimization of building services. The digital twin is continuously updated with sensor data in near real-time, and the data can be reprocessed with algorithms that make the data concise and more usable, even for customers or users. In addition, the large amount of collected data makes decision-making more informed, giving the ability to make predictions about how the object will behave in the future [60].
The DT can be applied to an asset for a technical simulation, with the purpose of integrating different model components to simulate almost every aspect of a complex system [45]. In a manufacturing plant in the industrial sector, for example, a DT offers the ability to simulate and improve the production system, considering the logistical aspects and optimization of the production process.
According to an Oracle report [61], the digital twin has many application areas: real-time remote monitoring and control; increased efficiency and safety at work; risk assessment; synergy and collaboration among team members; informed decision support; customization of products and services; better documentation, data collection and communication; and, most importantly for us, predictive maintenance and scheduling. The IoT paradigm is paving the way for smart cities and smart buildings. The definition of a common model of web-based protocols for data exchange allows transferring this data between objects, making the various network parts interactive. This is where the digital twin concept was born, which is a candidate to revolutionize the building management model through predictive analysis and dynamic simulations based on real-time data [62].
A full digital twin will ensure sensors are collecting data and the onset of failures can be detected well in advance through intelligent analysis of that data. This will allow for better maintenance scheduling.
Digital twin is a concept that can be exported from manufacturing to many fields and technologies [63]. Moreover, digital twin is one of the top ten strategic technology trends, and, according to future research predictions, the digital twin market will reach USD 15 billion by 2023 [57,64].
Once DT has been introduced, a look at how it can be linked to BIM methodology is provided. The U.S. National Institute of Building Sciences (NIBS) defines BIM as “The digital representation of the physical and functional characteristics of a structure. As such, it serves as a shared knowledge resource for information about a structure, forming a re-liable basis for decisions throughout its life cycle from inception onward” [65].
BIM, up from DT is widely used in the construction industry. BIM models allow for integrated information management throughout the building life cycle, including the FM phase [66]. BIM provides a collaborative platform to manage not only the project and its components, but also the relationships between stakeholders [67]. The BIM model acts as a collector of all building information, thus for facility managers it is of great support, working on information that is always up-to-date and shared by all team members, overcoming the uncertainty of paper data and information fragmentation.
However, BIM is much more widely used in the design phase, while in the FM phase it is still underutilized.
The most significant causes hindering this integration are: (1) the use of BIM only as a three-dimensional model, which has no added value in the maintenance management phase [68]; (2) FM workers are not involved in the creation of the model so the information contained within the BIM system is not useful [69]; (3) the need for interoperability between BIM and FM technologies and the lack of open systems [70]; (4) the lack of clear roles, responsibilities, contract and accountability framework [70]; and (5) the information contained in BIM models is static and not dynamic, as FM requires. Data is provided during the design phase but is not updated during the building life cycle [71].
Currently, as reported above, the BIM process is mainly used for visualization, construction, coordination, quantity calculation, planning, and project cost evaluation [72]. BIM is basically a repository for project information, with the major limitation of not transferring all this information to the facility management phase [73] and not being able to handle real-time data.
However, the great potential of a three-dimensional BIM model is the integration with all the virtual reality (VR), augmented reality (AR) and mixed reality (MR) systems. Research can be found discussing the development of collaborative BIM approaches based on AR/MR/VR [74,75,76]. One example is the creation of a framework based on building information modeling, mixed reality, and a cloud platform to support information flow in facility management [77].
3. Materials and Methods
3.1. IoT and BIM System Architecture
Automated data acquisition (DAQ) technology has seen significant advancements in hardware and software in recent years, even if the majority of available technologies are still expensive and not open-source, namely, a sort of “black box” where users have no access to alter and modify the implemented algorithms. Furthermore, a free access to the data previously stored is frequently impossible without buying a specific software. To address the aforementioned issues and overcome the limits of commercial technologies, studies were recently carried out to investigate and develop customized design of automated DAQ systems. This chapter proposes an automated data acquisition system within the IoT and BIM integration methodology based on open-source technologies.
All the sensors for building facilities and rooms are hosted by Arduino based microcontrollers and a Raspberry Pi single board computer with integrated Wi-Fi module to acquire the planned data in real time and store them on the server. The collected data is then processed to monitor and detect anomalies in building facilities operation.
A digital twin is next implemented by linking the stored data with a dashboard for trend visualization; a BIM model is used to visualize the component position and to have an overall view of the building.
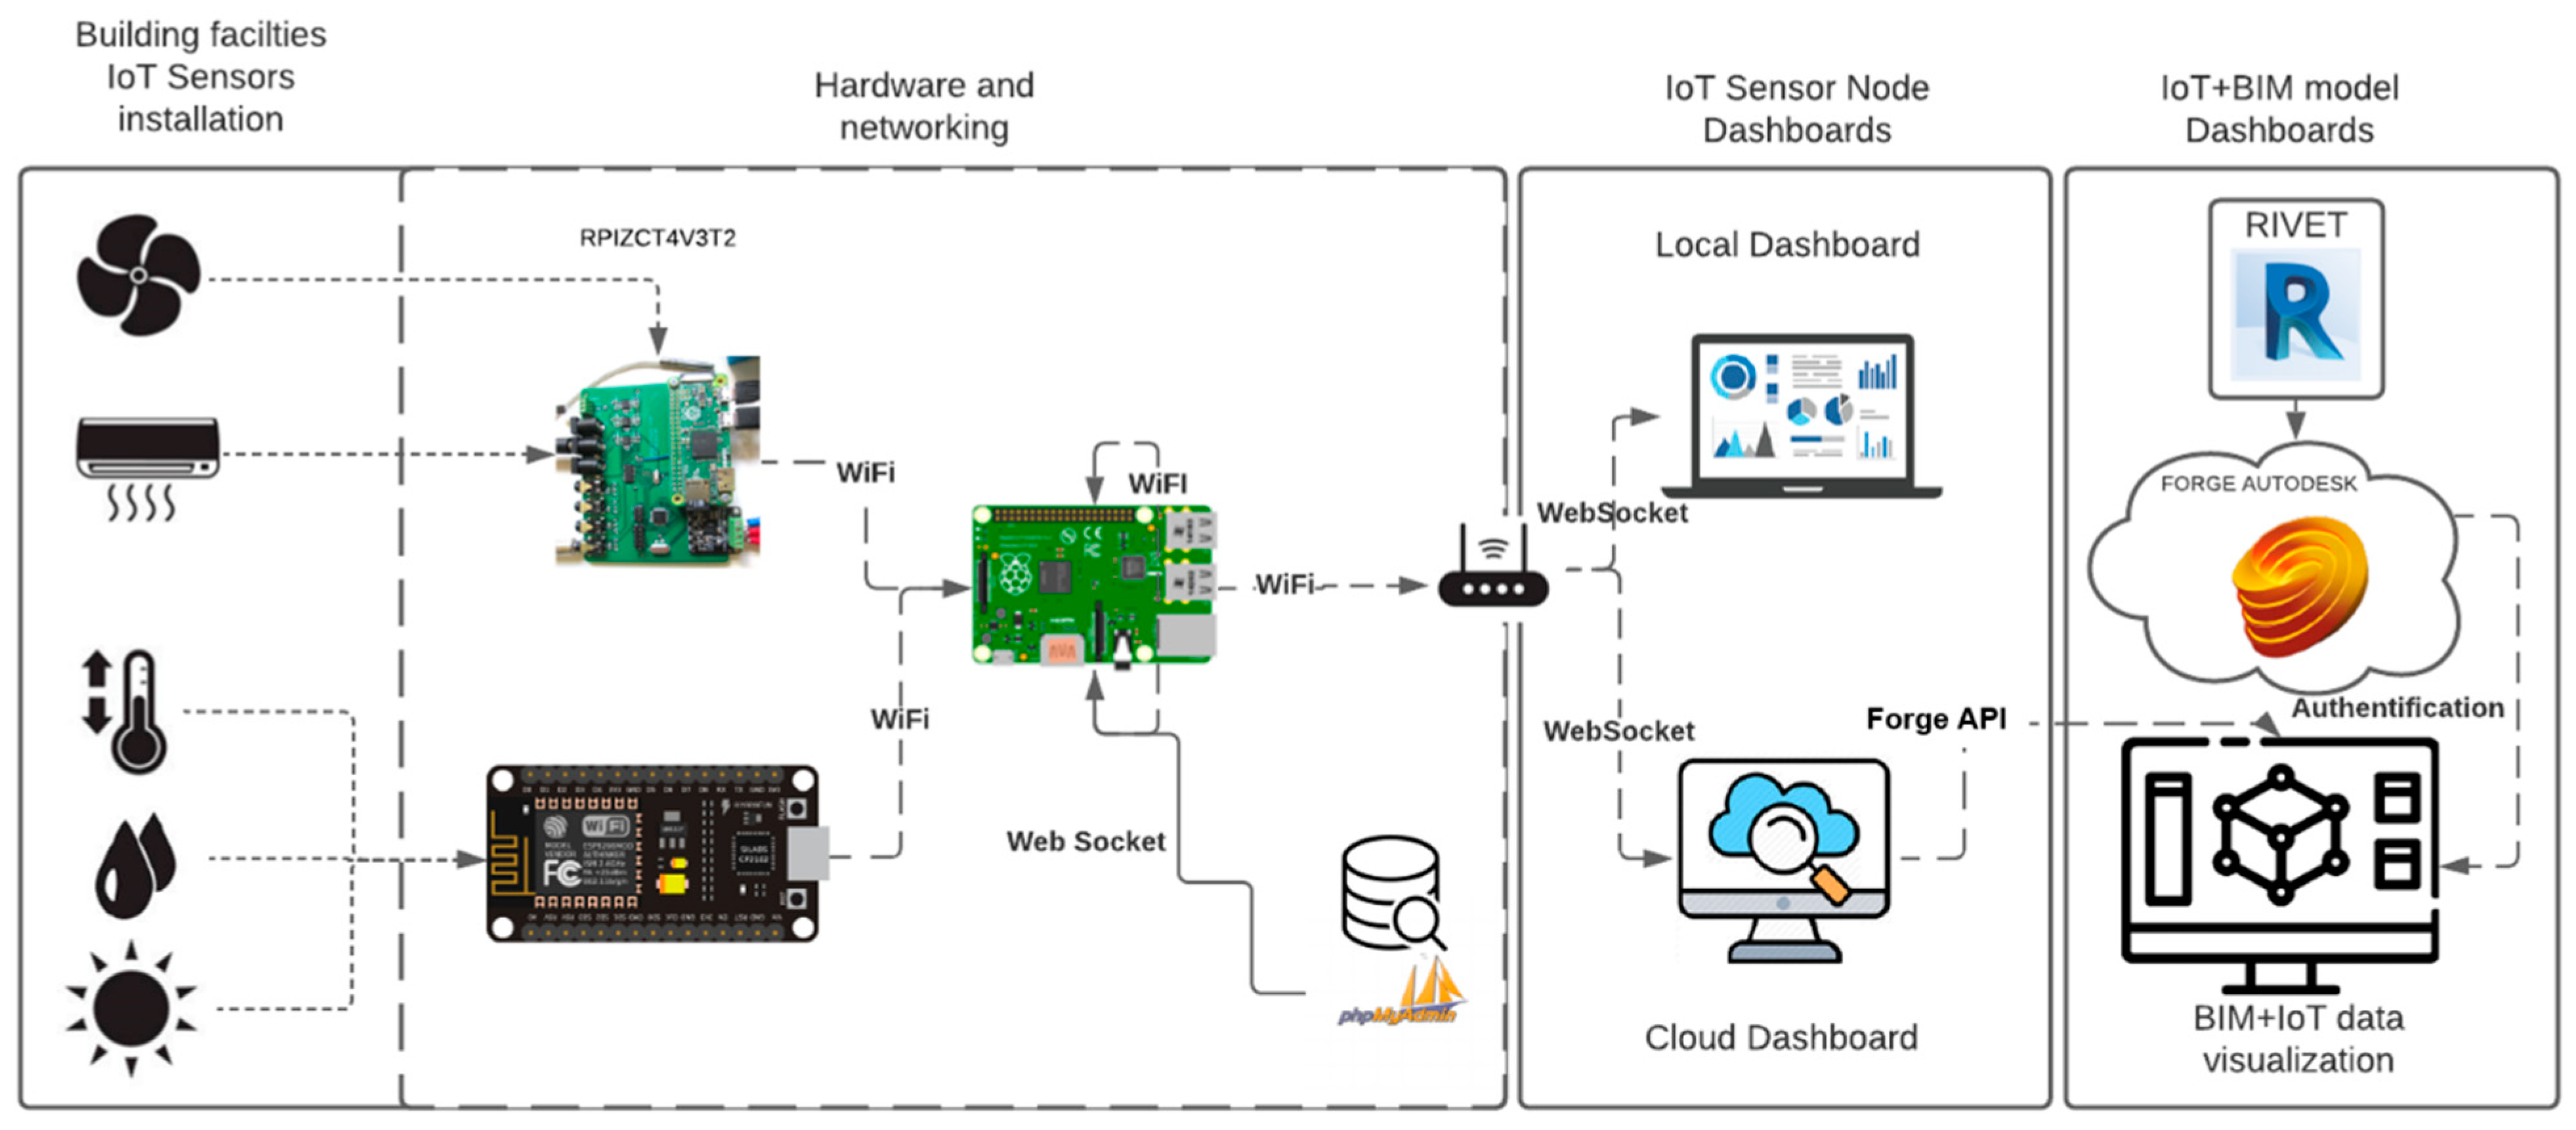
The general architecture of the IoT integrated into the BIM is shown in Figure 1. The architecture exhibits IoT building facilities’ sensors continuously sending data to the sensor nodes. In the hardware and networking section, raw data coming from sensors are processed by the sensor nodes’ microcontroller and raw data becomes human-readable data. The following sensor nodes send processed data to the server that is connected to the gateway. Users can gain access to the local and cloud sensor node dashboards through this gateway providing data visualization and fault detection features. In the last section of the architecture, IoT data is integrated into BIM and combined IoT-BIM data is visualized on the BIM dashboard.
3.2. IoT System Components
The proposed IoT system is based on open-source tools and market components. This system is flexible to set up, to add extra sensors and sensor nodes in real case-building facilities, as well as to add IoT sensors data into the 3D digital model of the building, according to any requirement of end-users.
Coming to the specific application, physical parameters must be acquired to monitor the room’s internal conditions and to control the FC operation. For that reason, sensors shown in Table 1 are placed in the room and connected to their sensor boards.
To oversee the temperature, relative humidity, and illuminance of the room, the DHT22 sensor and a light-dependent resistor (LDR), are connected to the ESP8266 module. FC monitoring sensors are connected to the RPIZCT4V3T2 board. Furthermore, both sensor boards are connected to the server board Raspberry Pi 3B (Rpi3B) to store and display incoming data locally and remotely using wireless sensor nodes (WSN).
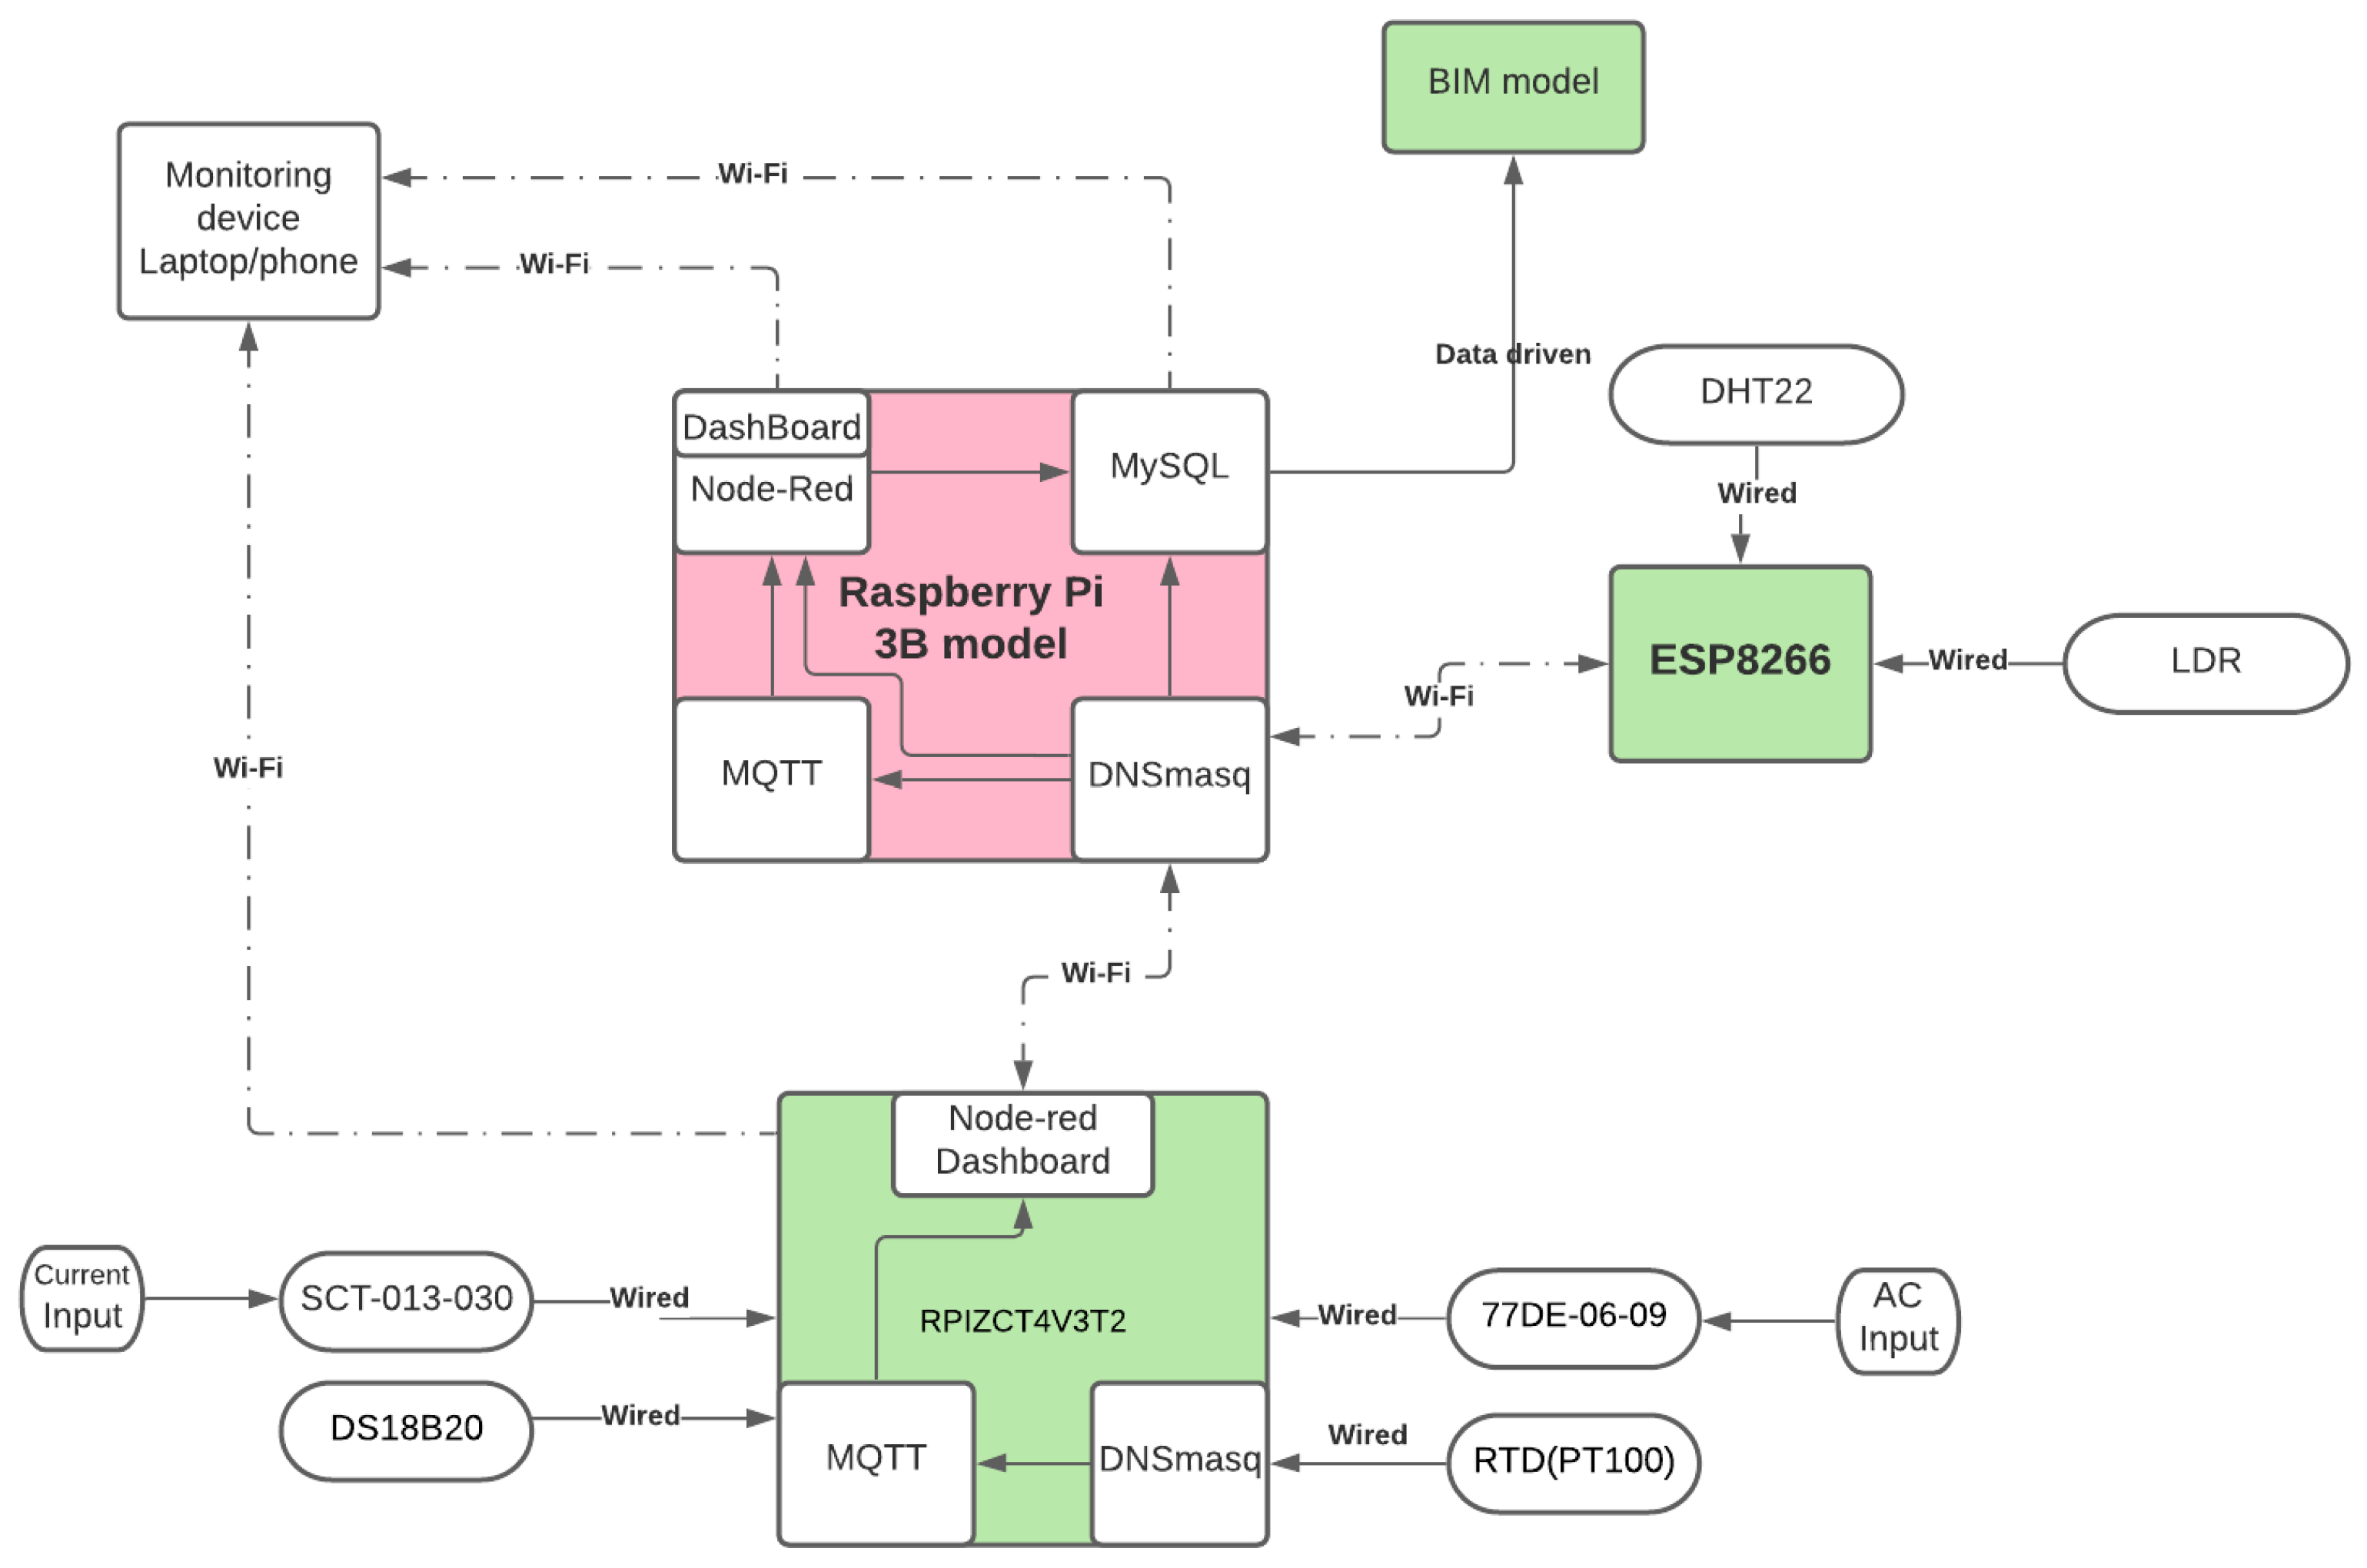
The networking and hardware connectivity block diagram of the system is displayed in Figure 2.
The ESP8266 module is powered by a simple universal serial bus (USB) cable and automatically connects to the Rpi3B by means of installed credentials. In case of wireless network failure or unavailability, the board tries to connect again every five seconds until a successful connection is established. After that, the ESP8266 starts to collect data from the deployed sensors through the defined pins and the acquired data are sent through a serial monitor to the server with a sampling frequency of 1 Hz.
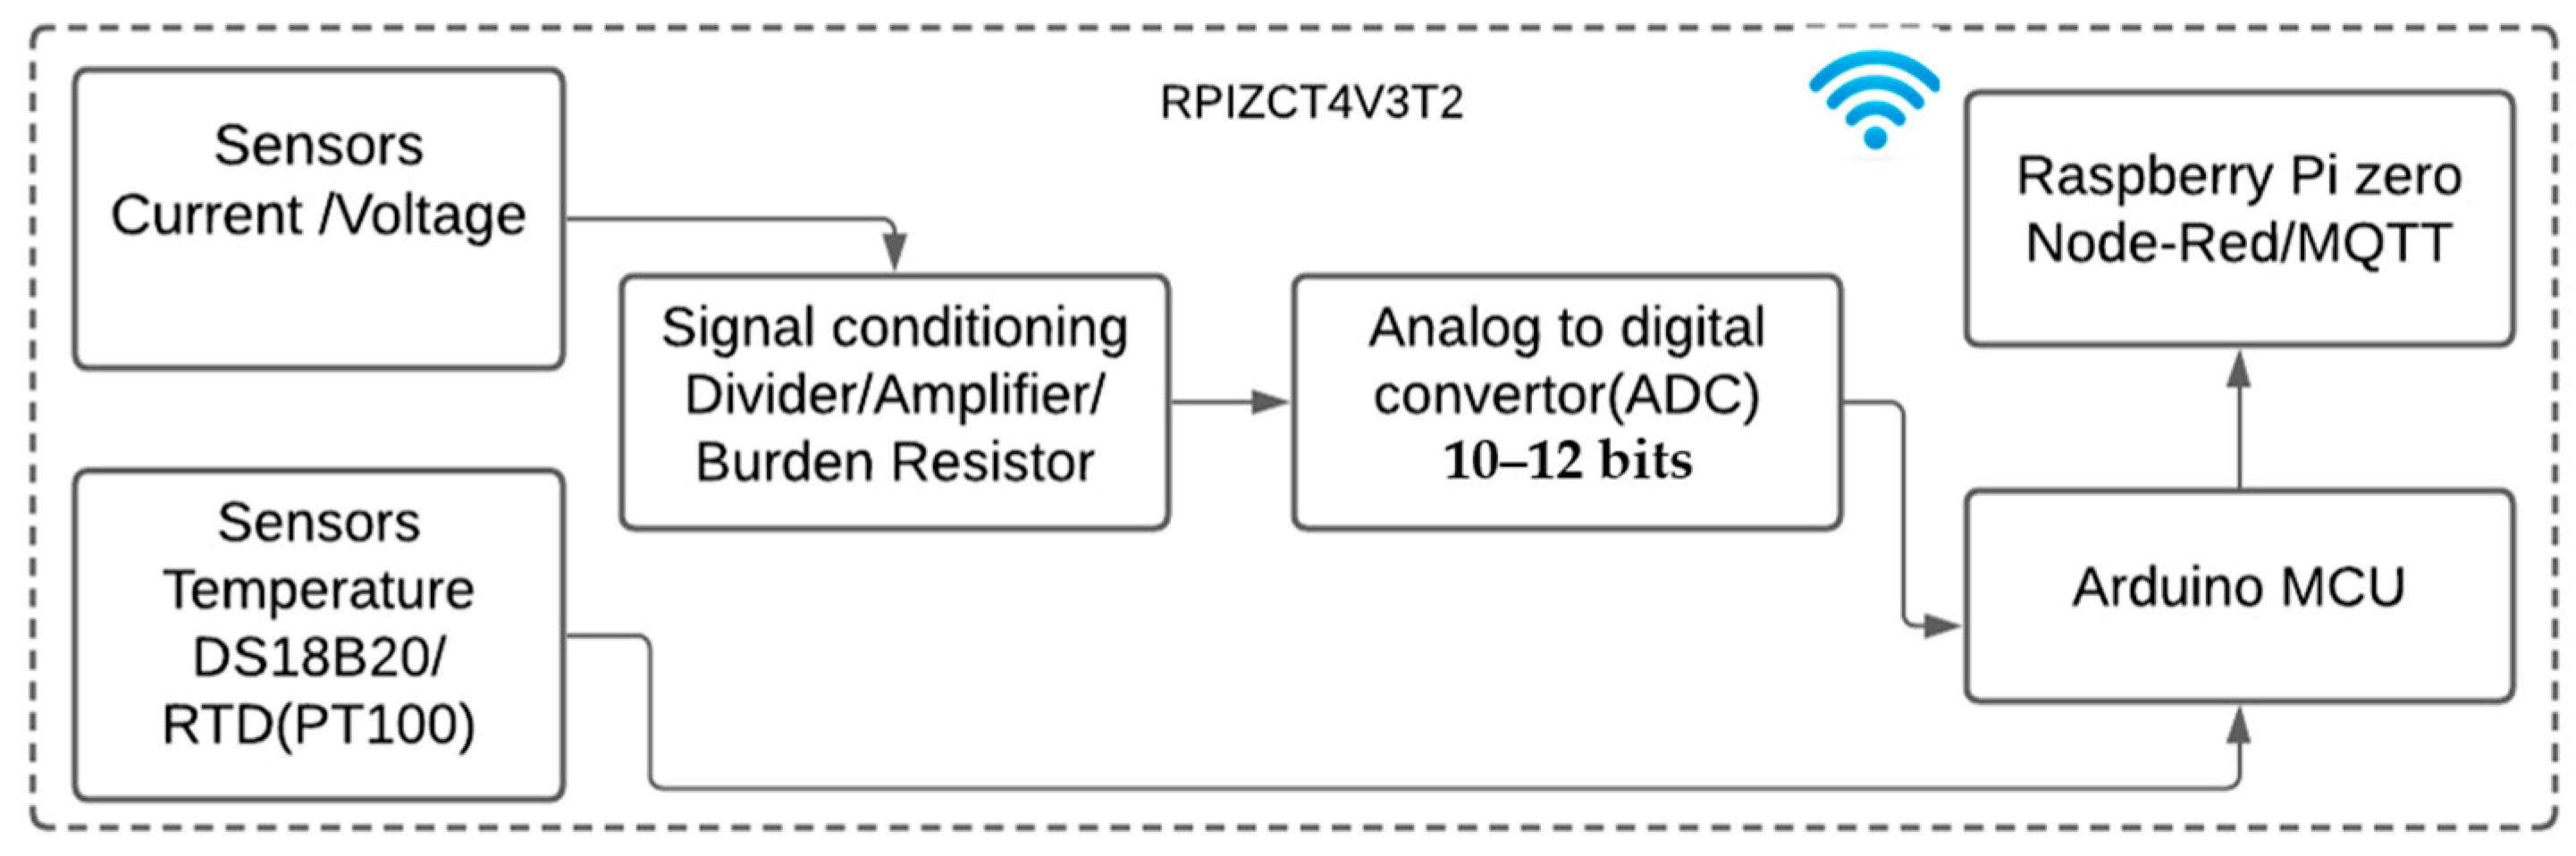
An RPIZCT4V3T2 sensor board is used to monitor the FC of the room; Figure 3 shows a simplified block diagram of the sensor board.
The RPIZCT4V3T2 board hosts an Arduino microcontroller (MCU) that is connected to two types of temperature sensors and current/voltage sensors that are connected to the MCU through an amplifier and analog to digital converter (ADC). Additionally, the RPIZCT4V3T2 board is connected to the Raspberry Pi (Rpi) Zero W. The MCU collects all the raw data, computes necessary values, sending the final computation to the Rpi Zero W using the universal asynchronous receiver-transmitter (UART) serial port; Rpi Zero W supports Wi-Fi and the board connects to the server Rpi3B through IP address. The sampling frequency of each sensor is specific and explained later in the next section.
The main component of the IoT and BIM system is the Rpi3B, which is a small single-board computer; it operates as server, networking router, middle communicator, hosts a dashboard, and a database. The Rpi3B system connects with other sensor nodes through the Wi-Fi network and logs the received data from the sensors to a database. On the Rpi3B system, Node-Red [6] is installed providing the ability to access all the sensor variables through serial protocols and displaying them on its own local dashboard. For each sensor node, a topic is assigned that is responsible for sending (publishing) a message to the main server (Rpi3B) which will act as a receiver (subscriber) using Message Queue Telemetry Transport (MQTT) protocol. MQTT protocol is an OASIS standard messaging protocol for IoT; it is designed as an extremely lightweight publish/subscribe messaging transport that presents as being ideal for connecting remote devices with a small code footprint and minimal network bandwidth [27].
Moreover, DNSmasq free software is installed to use the Rpi3B as a router and to provide a communication bridge between internal (sensor nodes) and external (internet network) components using Internet Protocol (IP) addresses. By setting the SSID, password, and an IP address on the Rpi3B using DNSmasq, the system becomes visible on the network to the publisher and subscriber.
To store sensor data locally on the Rpi3B, MySQL database, PHP interpreter, and Apache web server are utilized. By powering the Rpi3B, MySQL gets the IP address with a configured port number and waits for Node-Red to send the data to be collected; then, MySQL allocates the received data to the linked tables.
Later MQTT, MySQL, and Node-Red utilize the same credentials to background run and connect to the network, getting the IP address from DSNmasq. Communication between sensor nodes being established, the MQTT protocol on the configured port of the server receives all the subscribed topic’s data from publishers through TCP protocol and provides publishing devices access to the port. Simultaneously, Node-Red starts on port 1880 using the same IP address to manage and monitor the data flow to the server and also sends data to the BIM dashboard by using forge nodes in JSON format or using a data driven approach, in CSV format.
Thus, acquired data from sensors will be displayed on the dashboard of the Rpi3B and using MQTT on the internet, and MySQL can be monitored and viewed through any device connected to the same network by opening the IP address followed by the port number.
3.3. FC Fault Detection Methodology
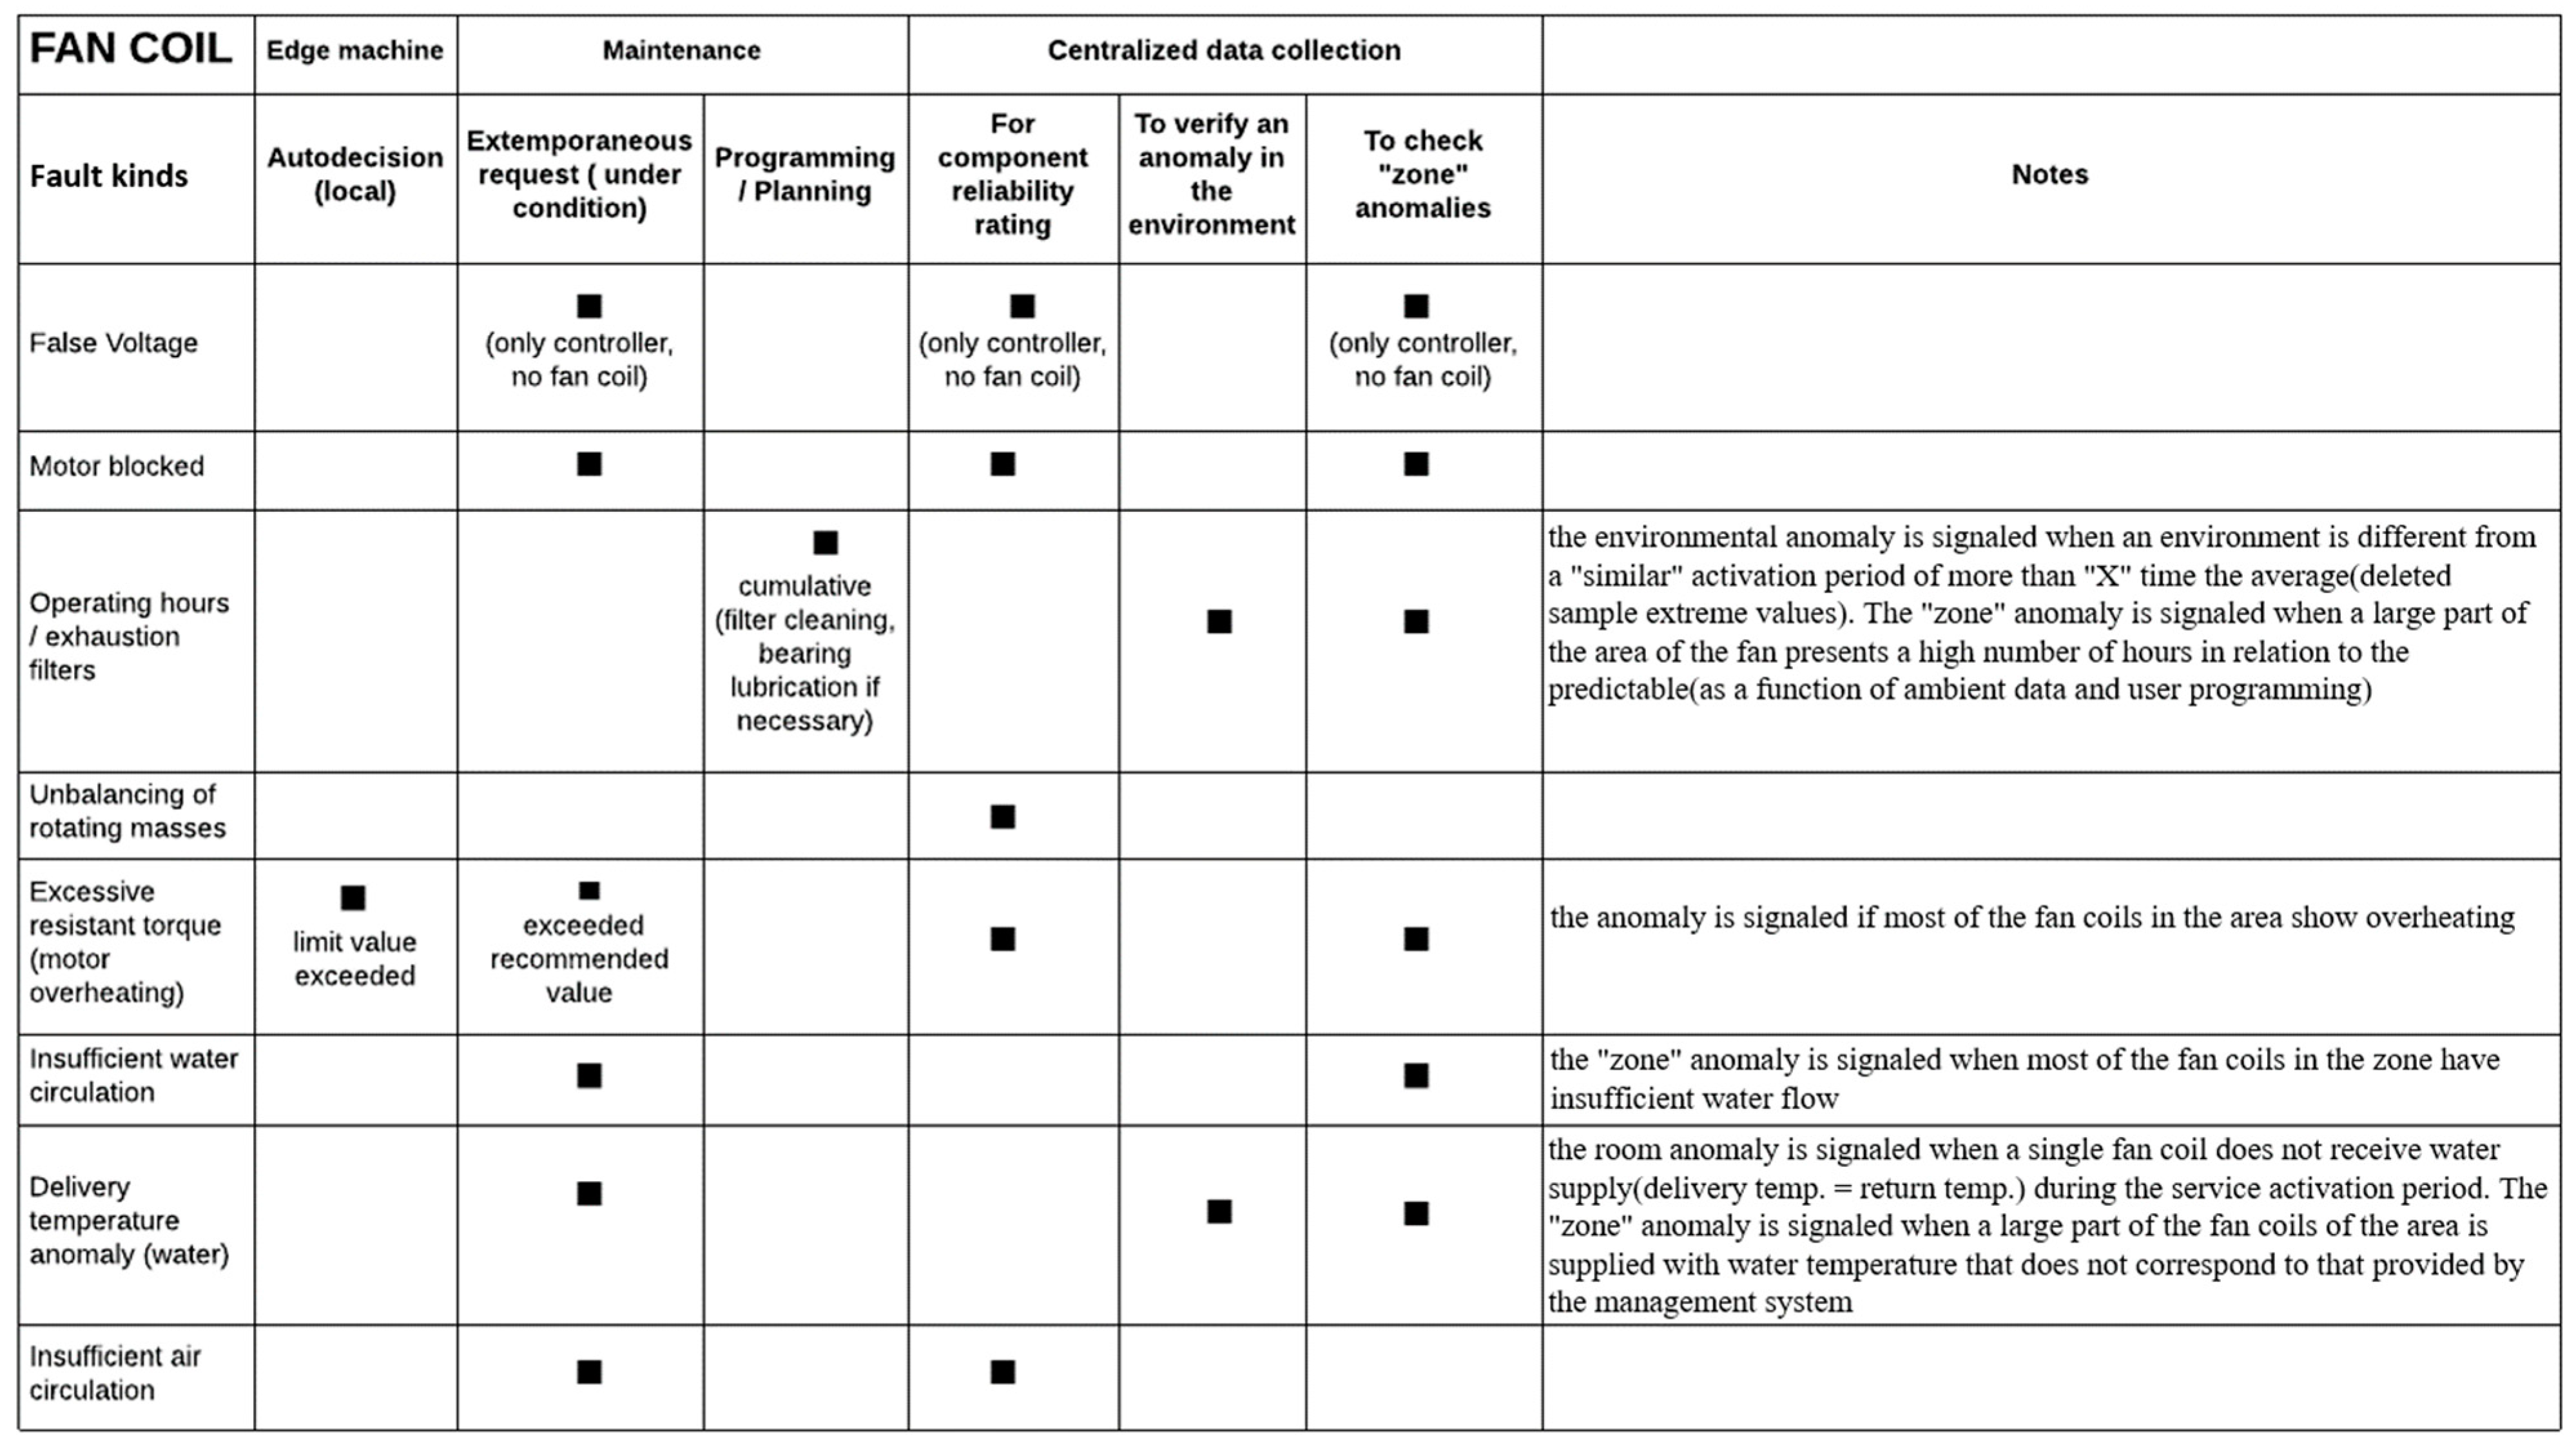
In HVAC systems, FCs are used as heating/cooling elements of rooms, which are a very common systems, especially in office buildings, hospitals, and schools. In order to have precise control of the FC operation, sensors must be inserted in the various components of the FC. The choice of which elements to monitor was made in relation to the identification of anomalies through collected data. Figure 4 shows the methodology for detecting faults in the FC and subsequent maintenance planning according to the condition of the FC. The image also shows the possible failures of the FC linked to the collection of anomaly data of the FC parts. The most common anomalies of the FC system are blocked motor, insufficient air flow, dirty filters, capacitor failure, insufficient water flow, etc. Each of these anomalies require an appropriate action. Particularly, the maintenance actions to be executed by operators are to clean the filter and battery, to change bearings, to replace capacitors, and to check valve adjustment and presence of pipe sediments. Thus, based on the anomaly types and data collected by sensors, a FC condition monitoring system is implemented. In addition, centralized collected data can be used to inform FM about the condition of any FC and provide preventive maintenance services, if needed.
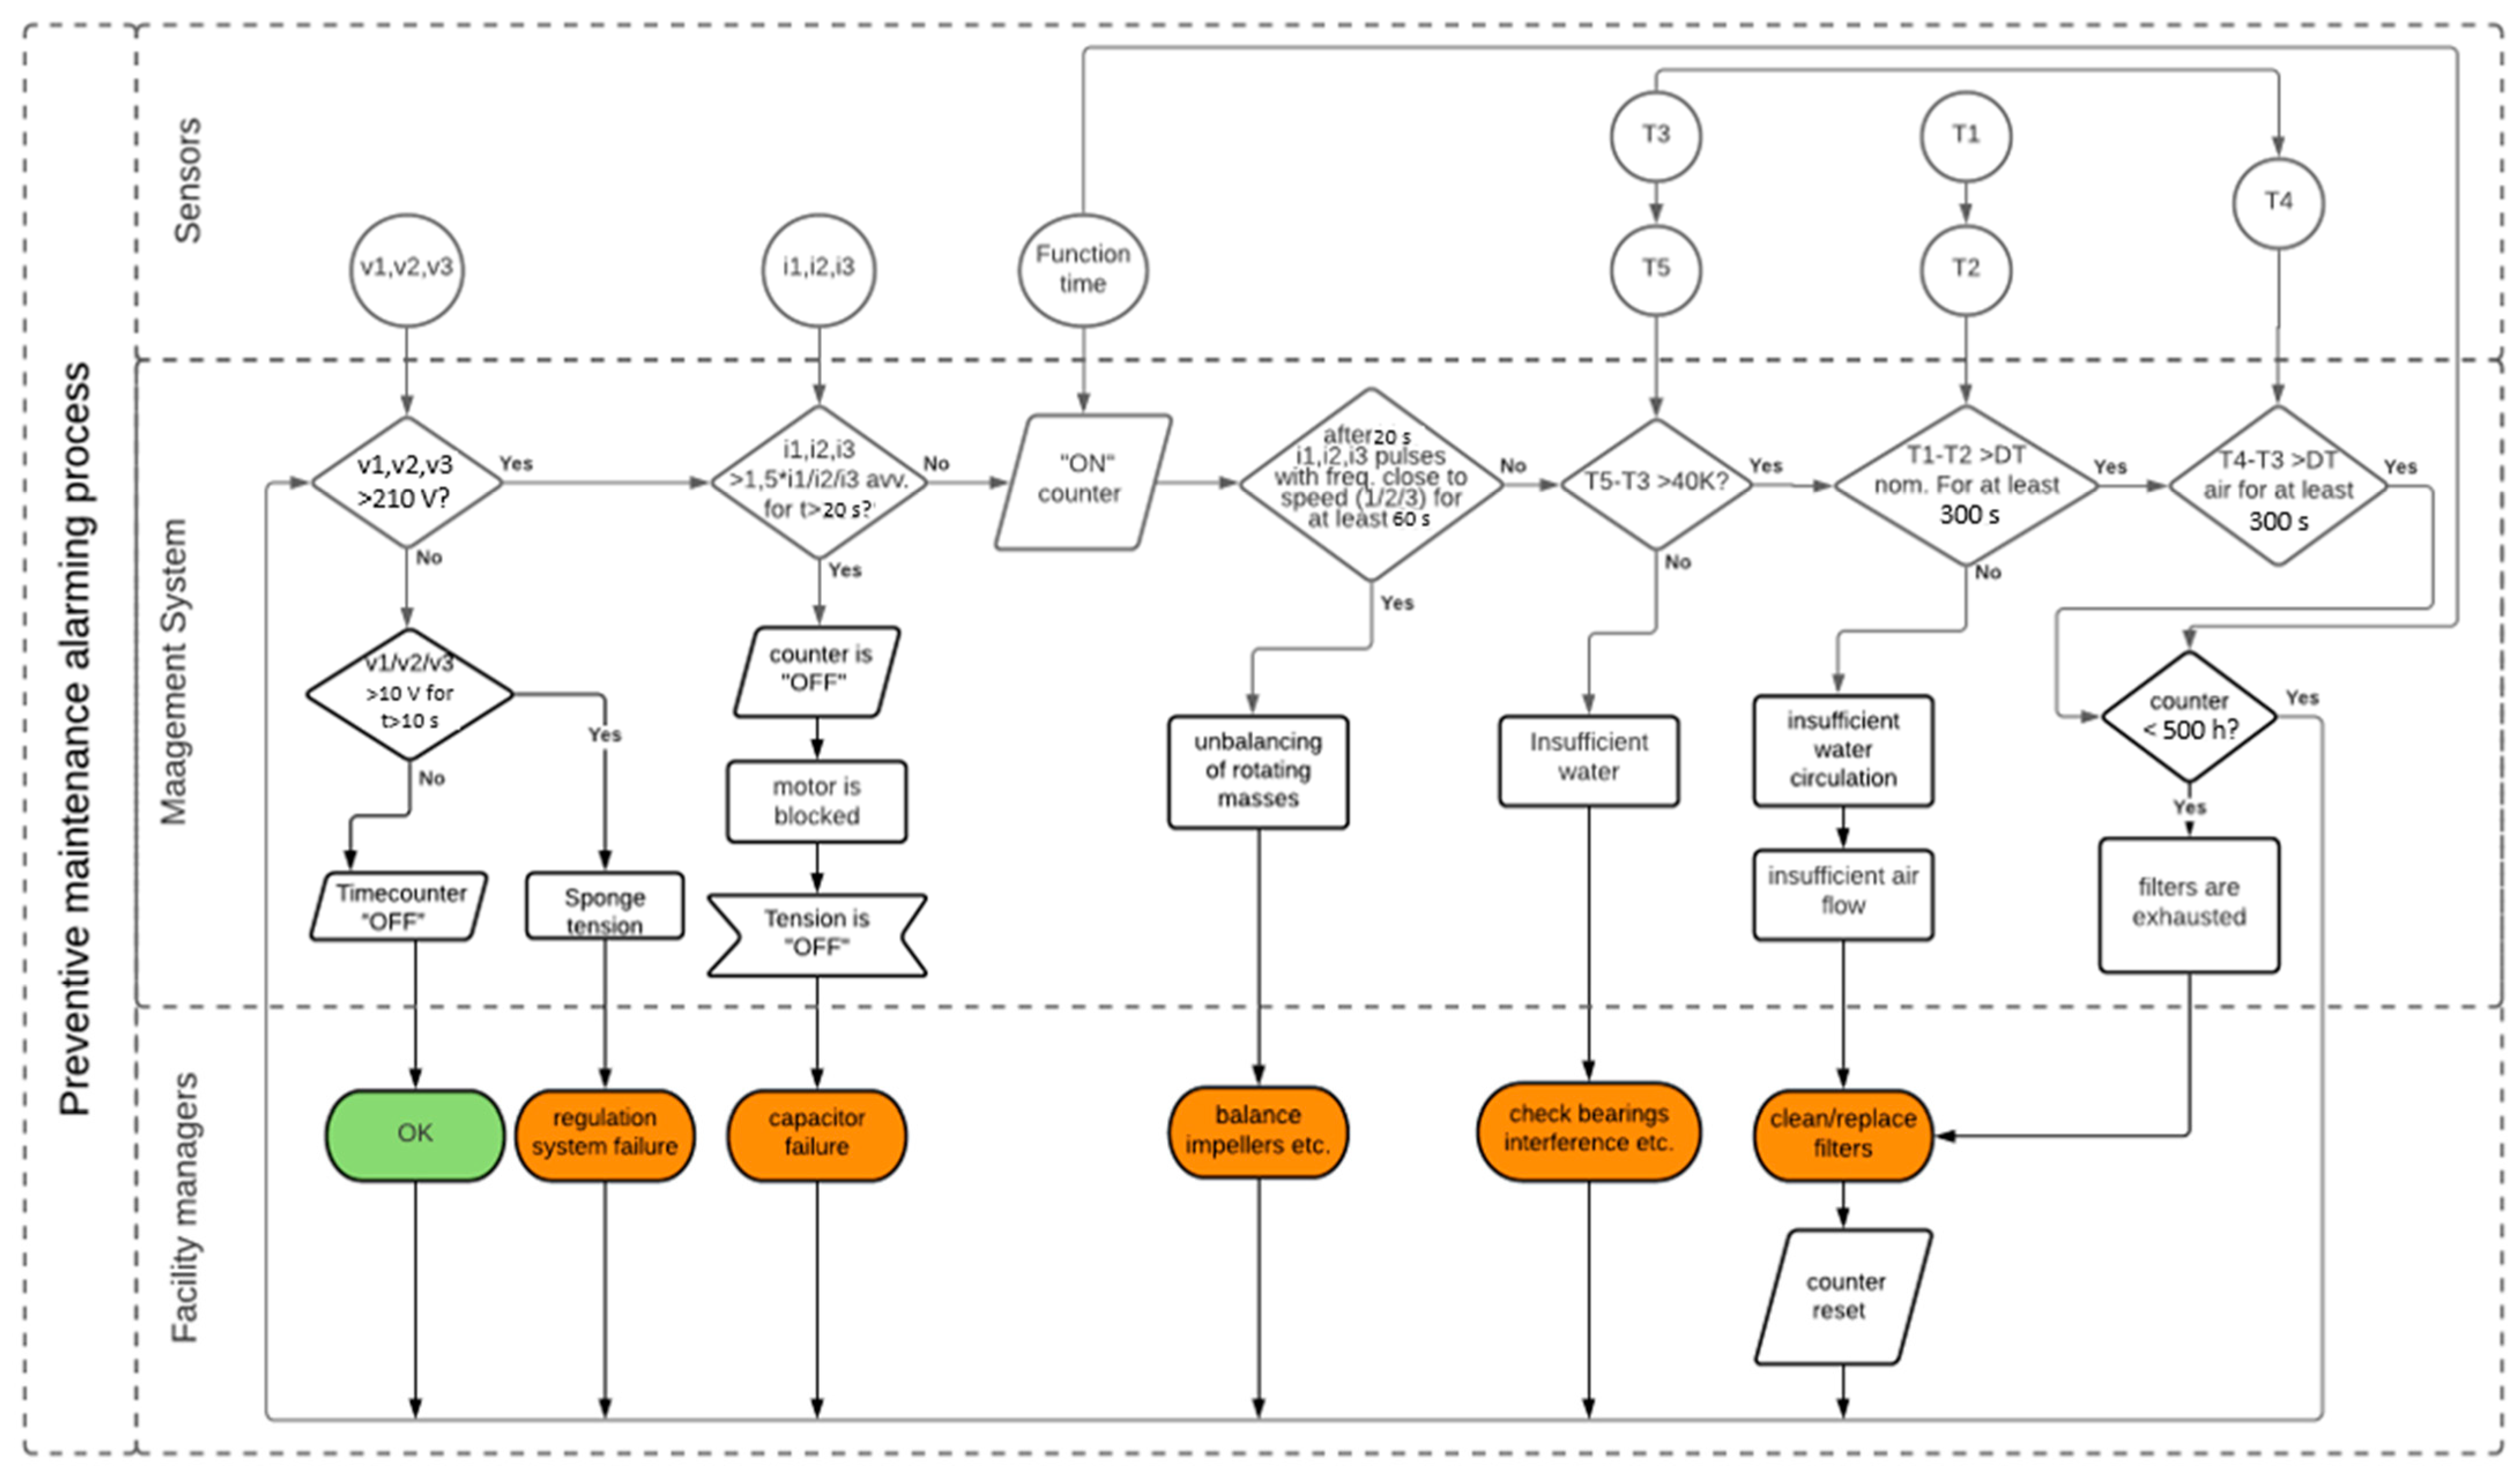
Figure 5 demonstrates the anomaly detection algorithm and alarm system implemented on the RPIZCT4V3T2 sensor board. The maintenance alarming system is composed of three main sections: installed sensors on the FC, management and monitoring system of the FC components, and alarming FMs or end-users when an anomaly has occurred. In the sensors section, three voltage sensors, type EU: 77DE-06-09 are responsible for acquiring data from the three motor speeds (v1, v2, v3); three current sensors SCT-013-000 acquire data (i1, i2, i3) from the three speeds; and temperature sensors DS18B20 are responsible for monitoring T1 (delivery water temperature), T2 (return water temperature), and T4 (outlet air temperature) in the range 0–90 °C and T3 (inlet air temperature) in the range 0–50 °C. T5 (motor case temperature) is monitored with an PT100 temperature sensor in the range of 0–200 °C. On the controller of the RPIZCT4V3T2 sensor board, the management and monitoring algorithm of each component of the FC is implemented. The algorithm makes decisions depending on the sensors’ signal values compared to the installation conditions.
Likewise, Table 2 shows the sampling frequency for each FC component depending on the power condition. For example, on the server side, delivery pipe, return pipe, air inlet, and air outlet components temperatures are monitored every 30 min by sending average values when the voltage is at least 200 V, while the motor temperature must be monitored every 10 s and send average values of 30 min to the server. The motor voltage must be monitored more frequently and the sensor board must send average values to the server every 3 min if the voltage is in the range between 0 and 200 V. On the other side, electric power (current) shall be monitored in the first 10 s, when the voltage is above 200 V. More detailed sampling frequencies on the server-side of the system integrated on the microcontroller of the sensor board and sensor locations in the FC is given in Table 2.
The given measure ranges are implemented on the RPIZCT4V3T2 board using Node-Red flows and displayed on the dashboard too. The system also informs the end-user if any anomaly is detected on the FC.
3.4. Data Transmission and Visualization 3D Model and IoT Data
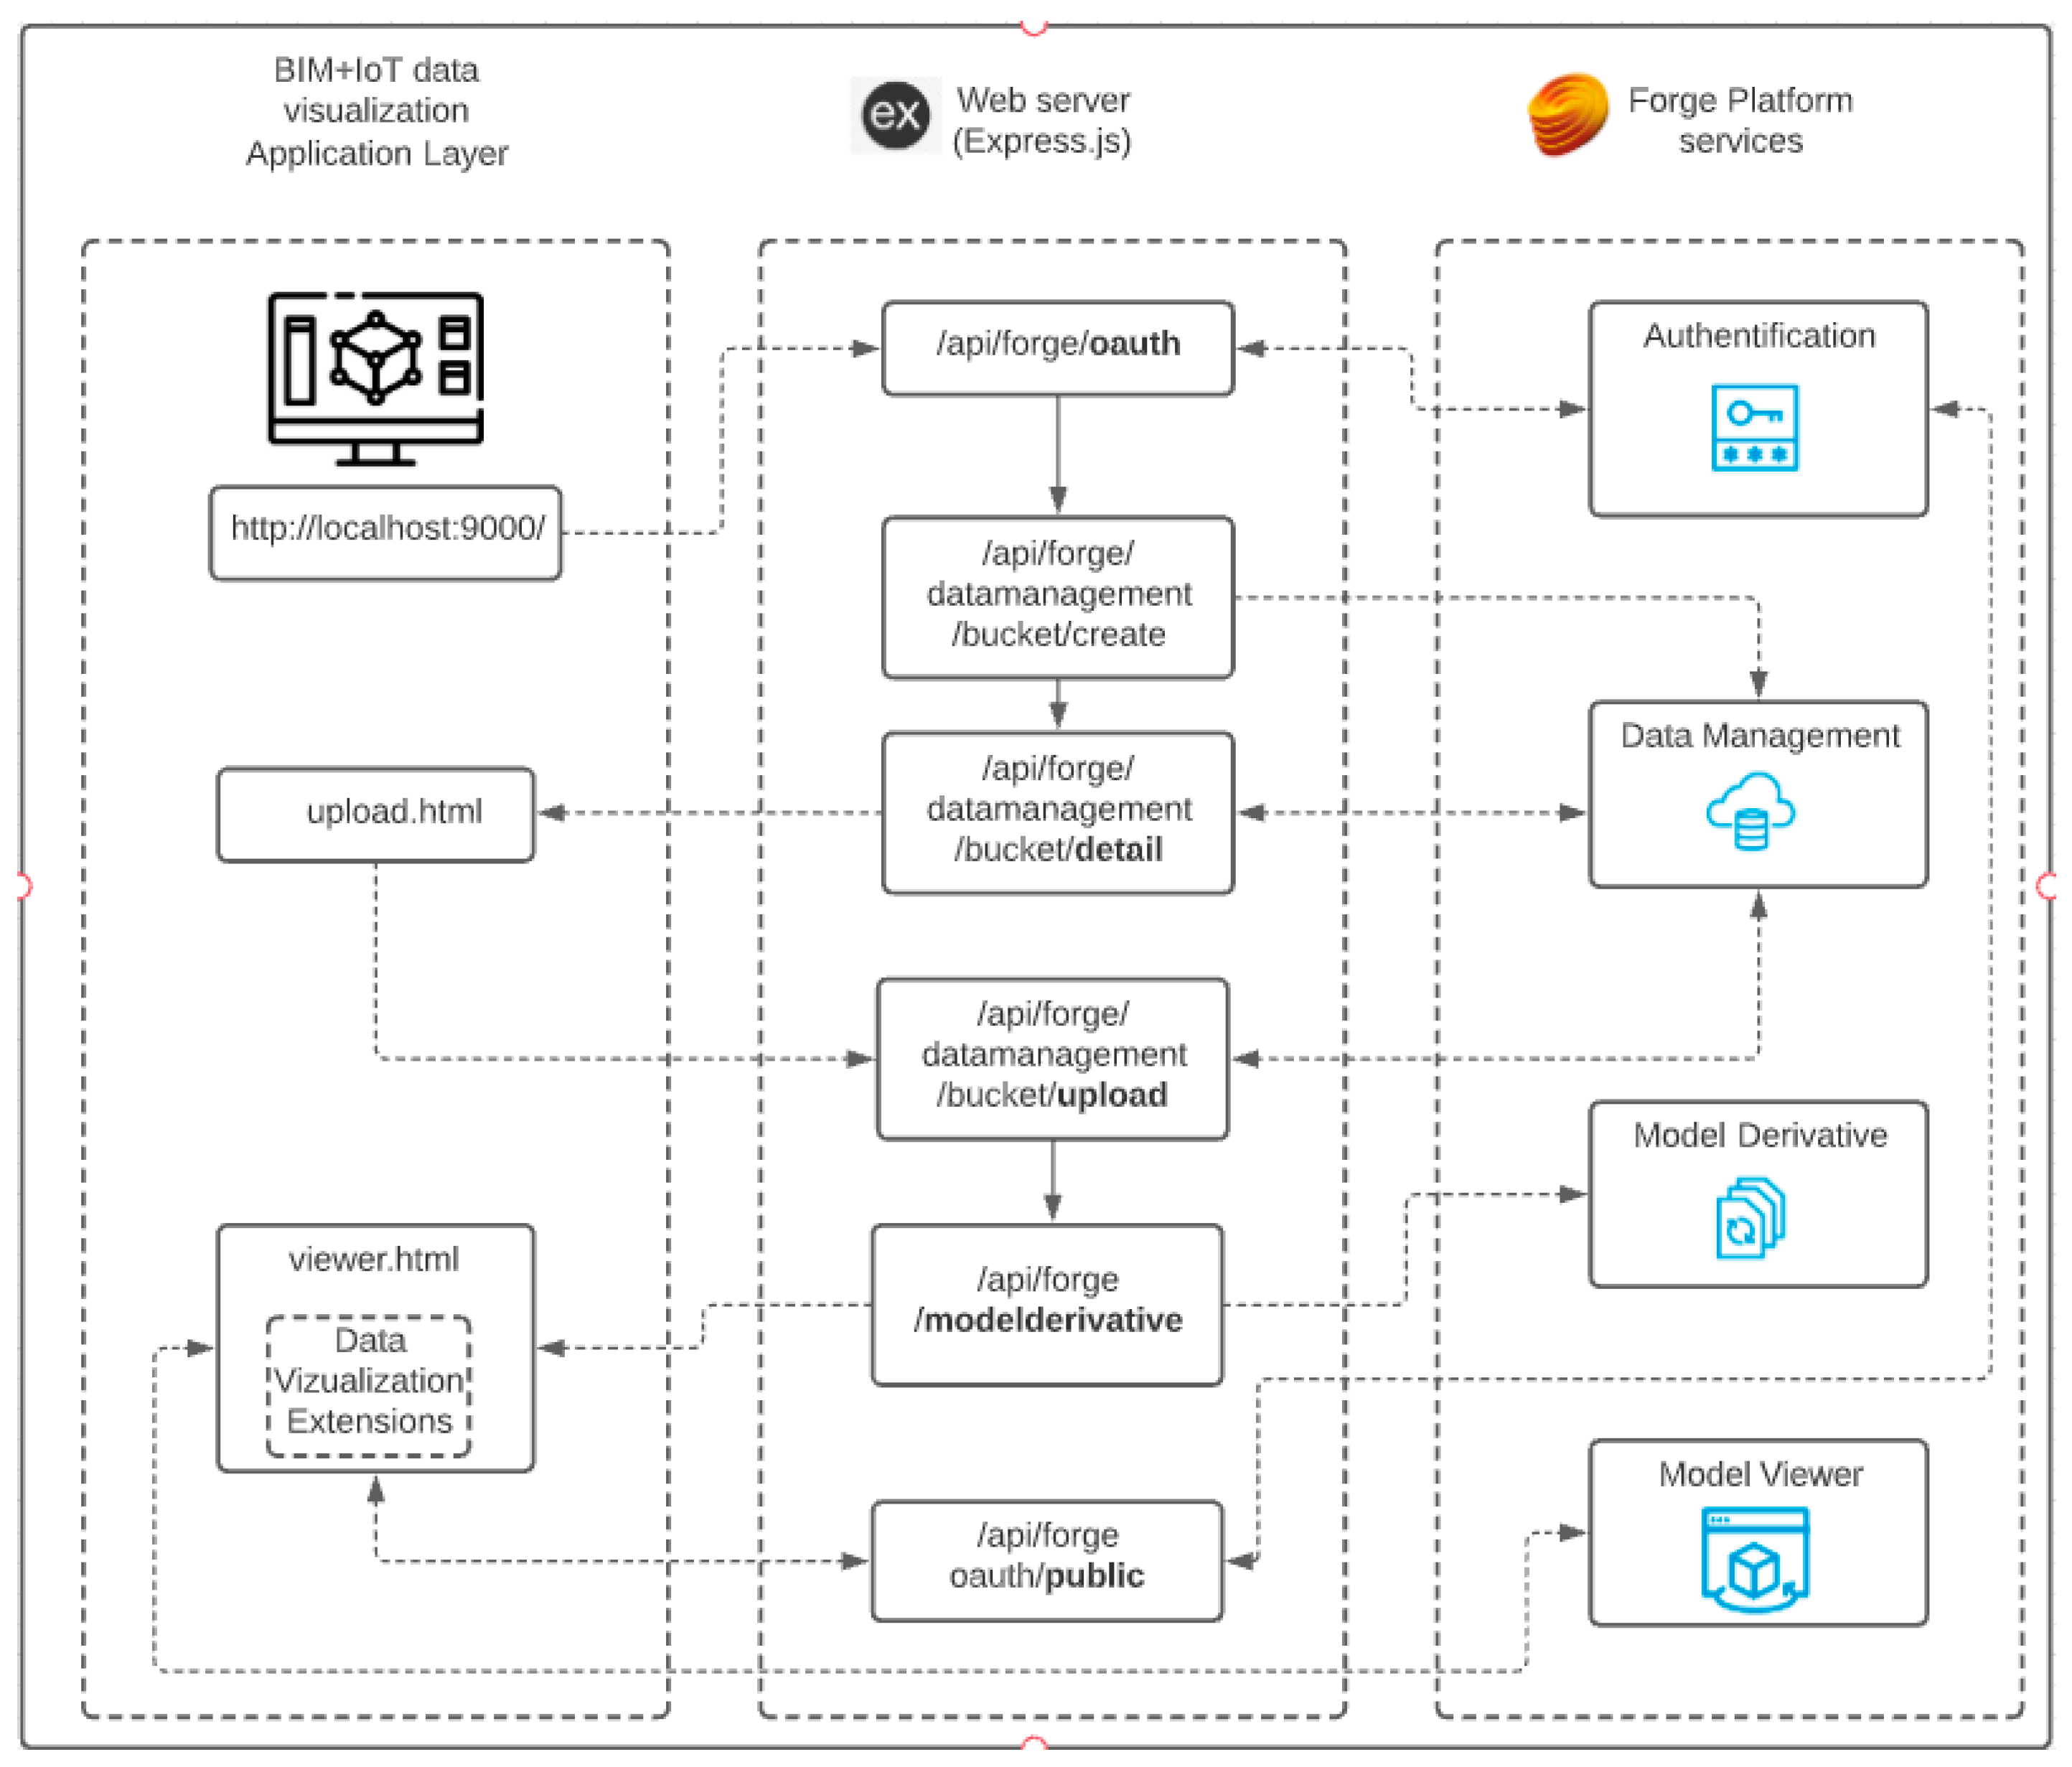
The 2D and 3D models of the fan coil unit and the building model used for this research are both built in Autodesk Revit authoring tool. To connect IoT sensor data with BIM, the Autodesk Forge Platform is utilized: it is a cloud-based platform and provides application programming interface (API) services. A free trial of Forge APIs lasts 90 days and gives access to 100 cloud credits, 5 GB storage, and services such as authentication (two-legged authentication), data management, Model Derivative, Model Viewer, all of them necessary and sufficient to create the customized application. By registering on the Forge platform, the end-user receives a client ID, client password, and all the services necessary for application development. BIM–IoT integration and the visualization process using the Forge platform is described in Figure 6: the right column records the services used for the custom application on the Forge platform, while the left column shows the applications layer.
The 3D building model can be uploaded onto the Forge platform by inserting credentials provided by the authentication API and using the upload.html file. Afterwards, the Model Derivative API translates the uploaded 3D model using the viewer.html file, so the uploaded model can be accessed by typing a static address (e.g., localhost:9000) on any browser.
The middle column of Figure 6 displays the browser visualization on the Forge Viewer: it can be customized by inserting different extensions, buttons, or plots using the JavaScript programming language that supports the Open-source VS Code editor. Furthermore, IoT sensor data in JSON or in CSV formats can be added through plugins to the uploaded 3D building model. The model properties will appear in the viewer as soon the model itself is uploaded on the Forge Viewer.
A custom web application of Forge Viewer can be created by accessing the object’s properties in the model and relying on the database identifier (DbId) for the model objects.
4. Case Study
This section explains the case study setup, the allocation of sensors, the algorithms to monitor and detect anomalies in building facilities, and summarize the achieved results.
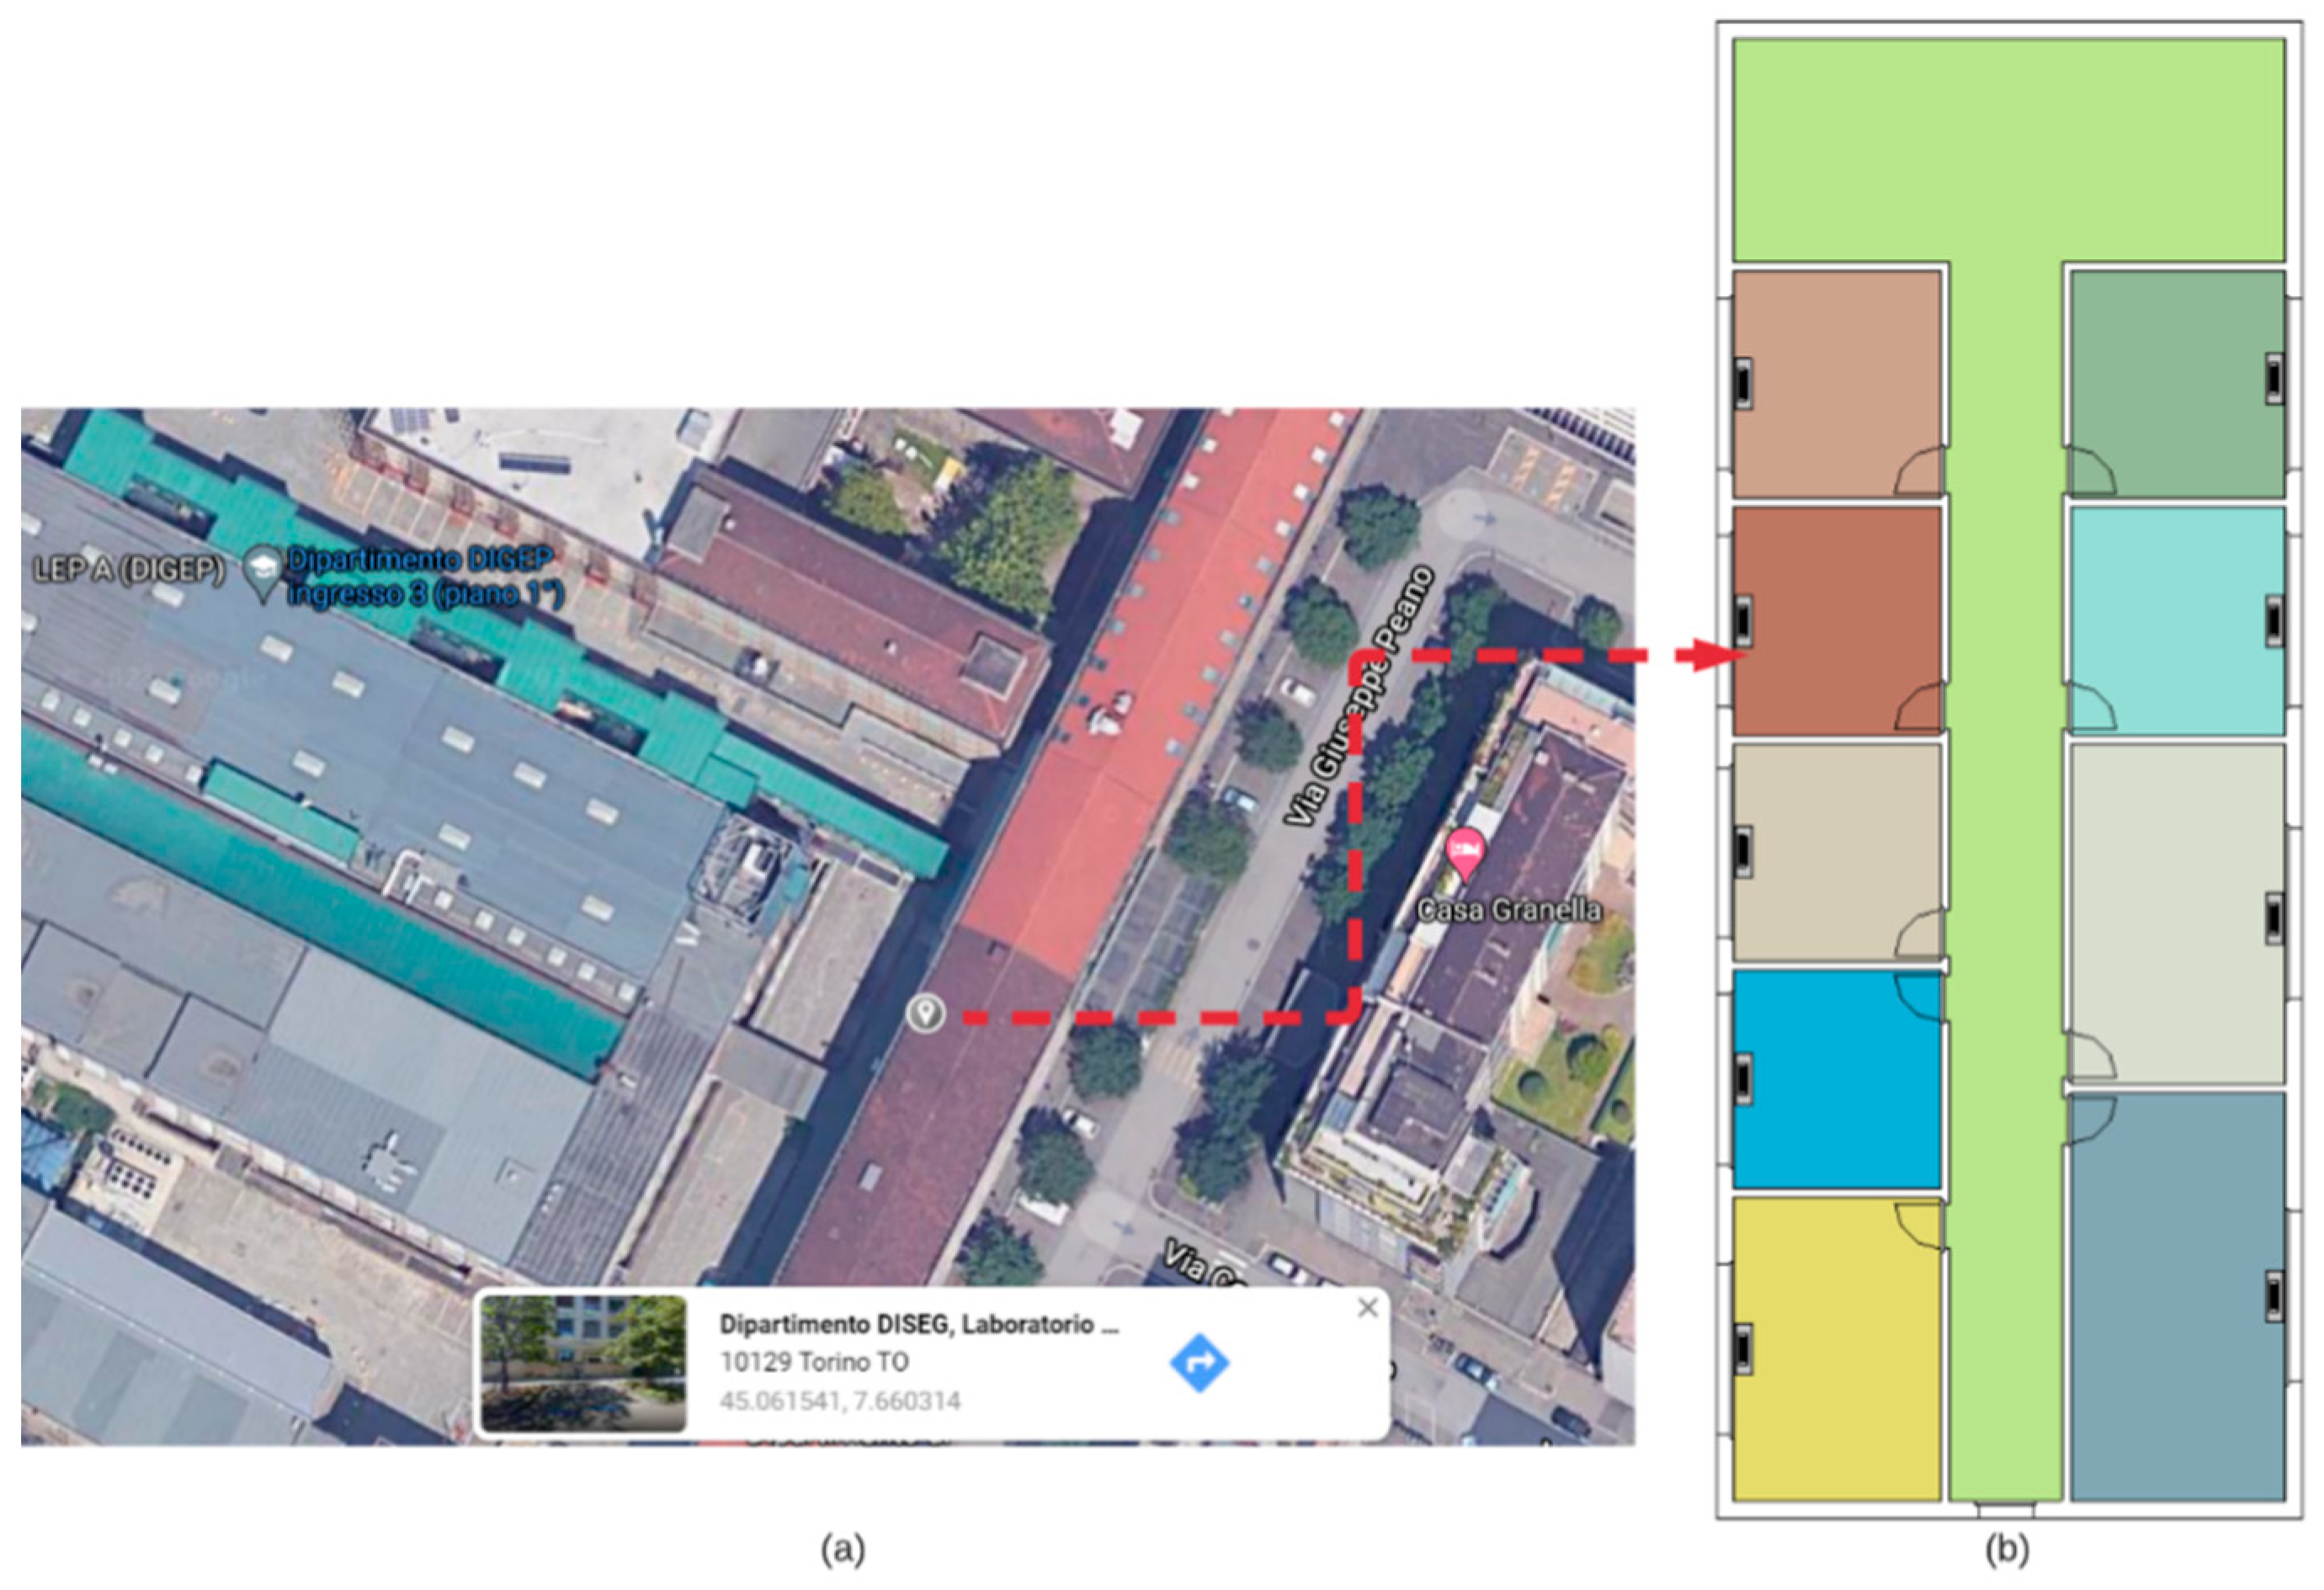
The case study has been operated at the Politecnico di Torino in the DISEG Laboratory. The laboratory room is located below ground in the department. Figure 7 shows the case study building: (a) geolocation and (b) BIM model Revit software representation. In all the rooms, fan coils are located under the windows.
The case study fan-coil motor is made by EMI (EuroMotors Italia), type FC83M-2014/1 with a 4 possible speeds. The FC motor rotates in an anti-clockwise direction at 1100 revolutions per minute (RPM) at maximum speed. Moreover, FC has a cooling or heating battery and a filter that must often be monitored; to provide an automatic preventive maintenance system, the FC is equipped with sensors to acquire real-time data.
More technical details of the FC are provided in Table 3.
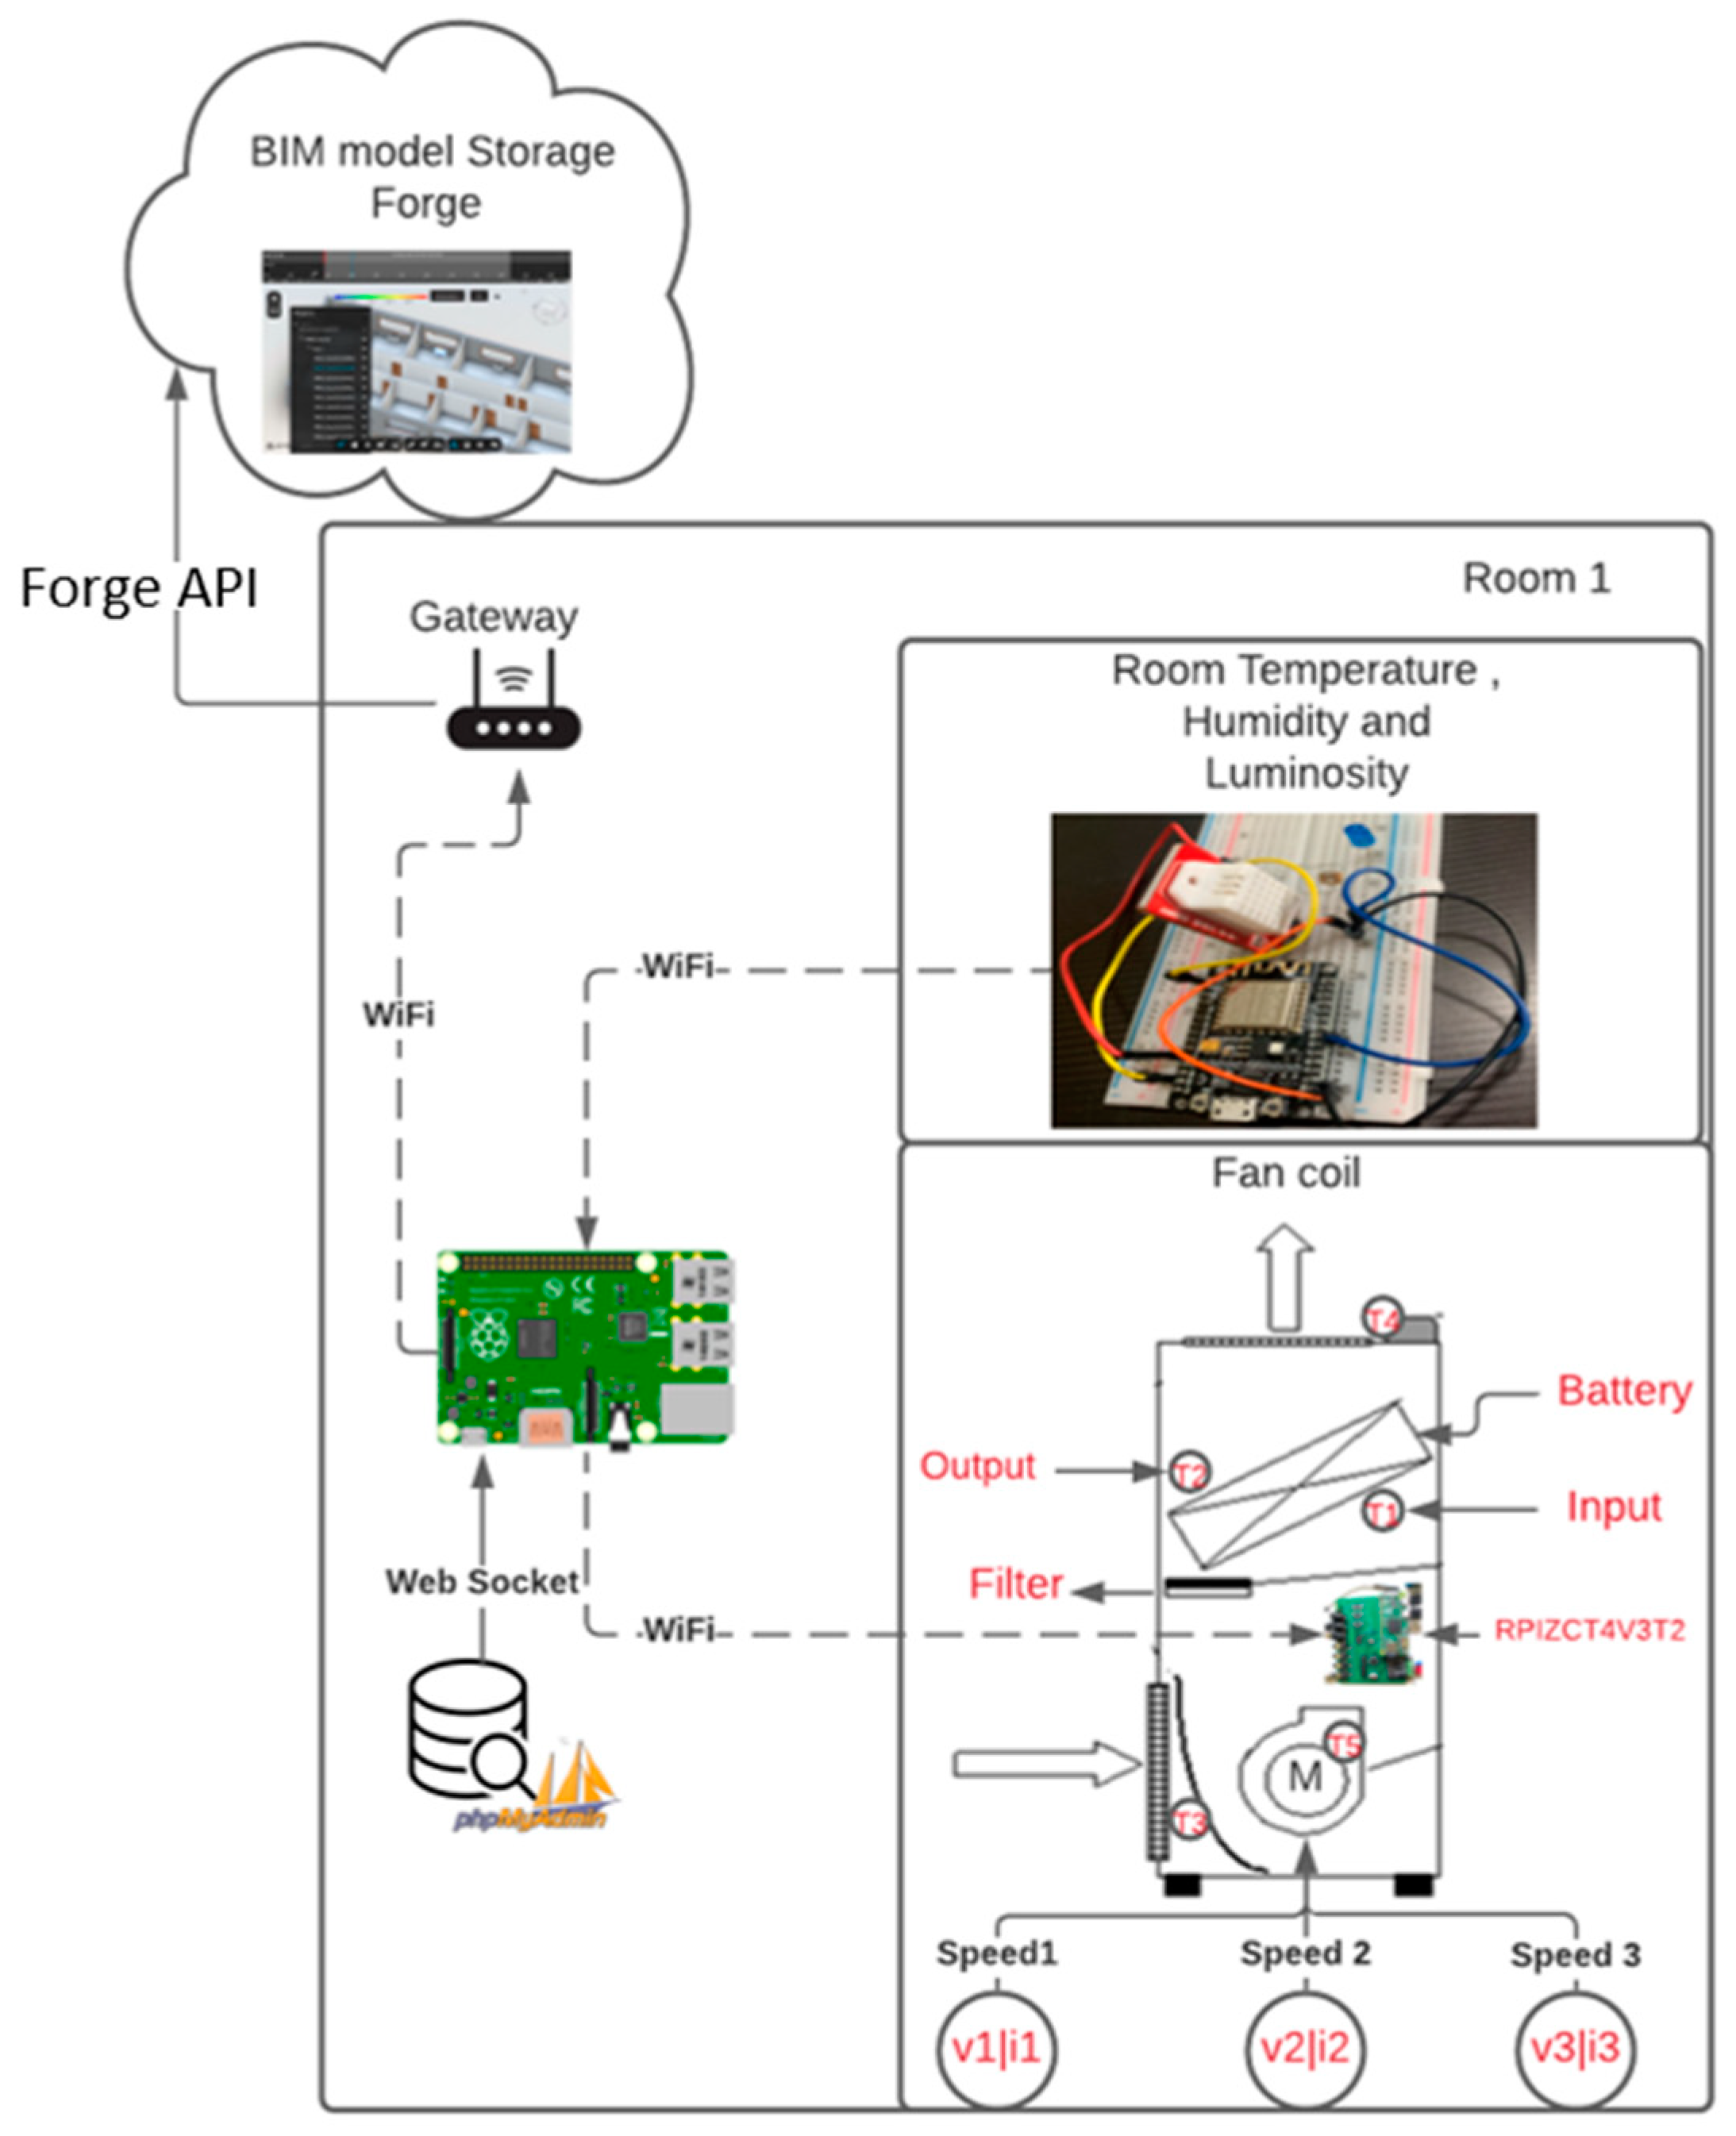
The ESP8266 sensor node is placed on the FC together with sensors. All the collected data from the room facilities are sent to the BIM using the Forge API; Autodesk Forge API provides the client ID and client password to access the uploaded customized BIM on the cloud; using the callback URL everyone can access the IoT-integrated BIM dashboard. A general schematic diagram of sensors’ locations of the FCs, sensor boards, and data acquisition system of the BIM model is showed in Figure 8.
The system is powered with simple USB cables and starts collecting data from the installed sensor nodes in the room. The Rpi3B mainboard then connects to the ESP8266 and RPIZCT4V3T2 sensor nodes and starts acquiring data from sensors and at the same time registers these data to the MySQL database. Using the developed extensions on the Visual Studio Code for Autodesk Forge Viewer, collected IoT data and the 3D building model of Revit can be visualized together on the Forge Viewer through a static URL and port provided by Forge API. The functional flowchart of the whole system is shown in Figure 9.
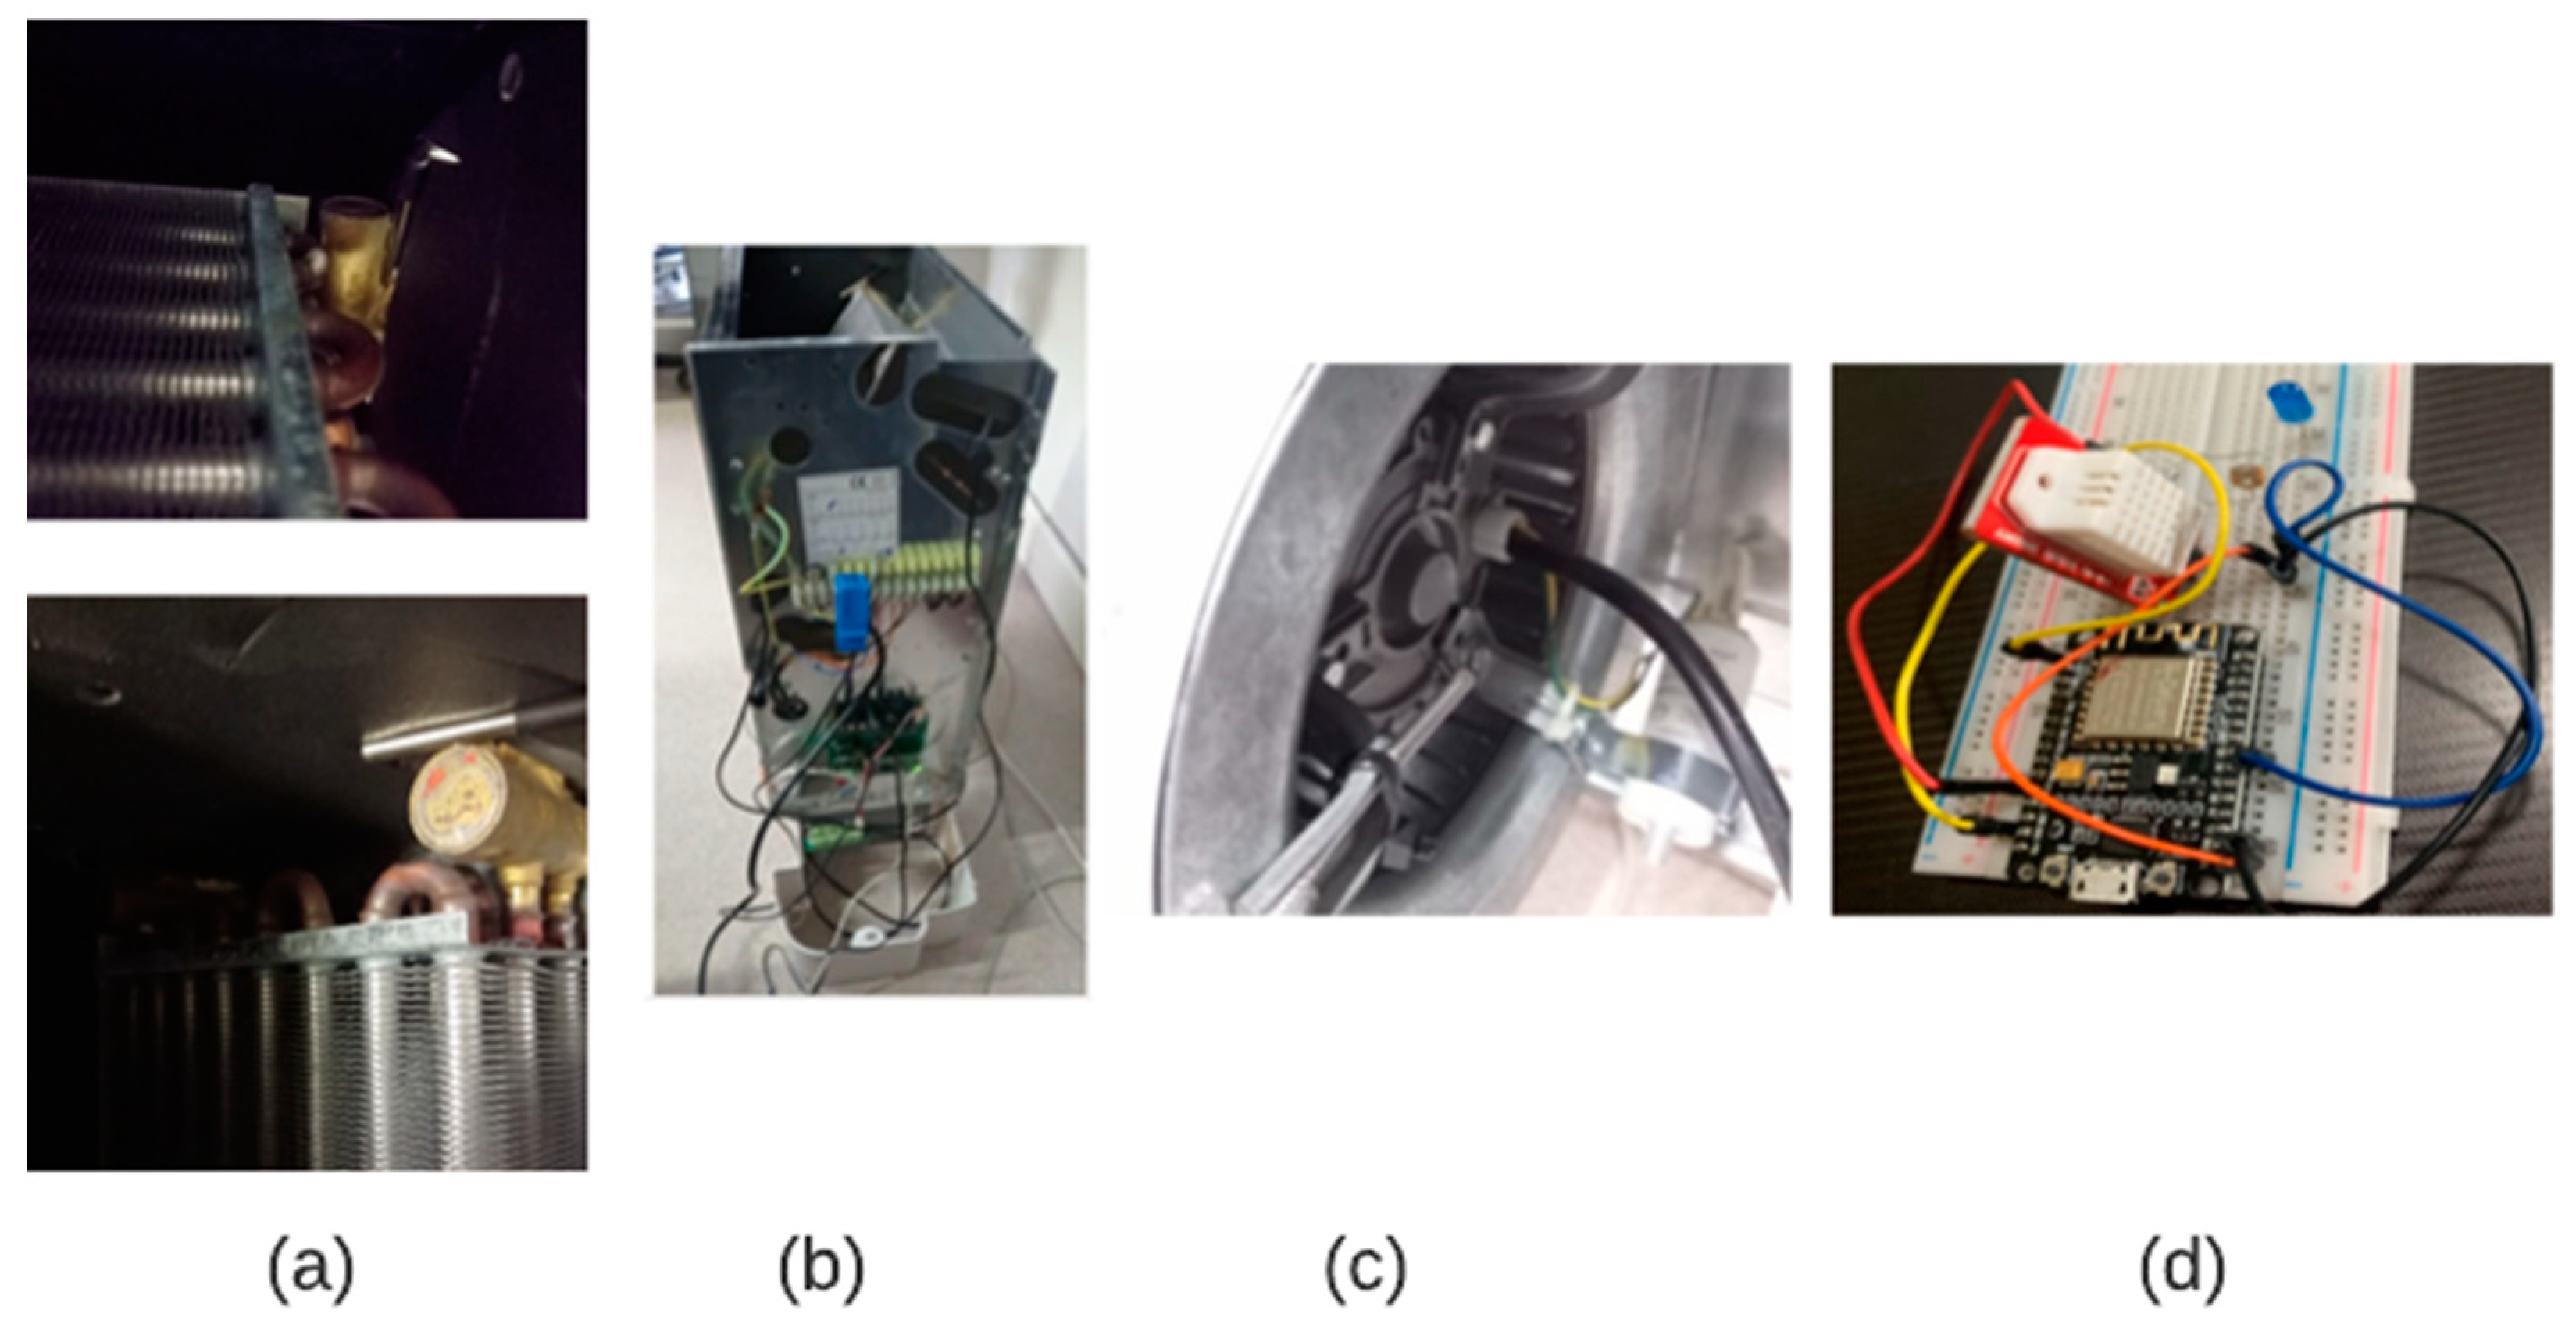
FC with wireless sensor nodes (b), FC battery with installed temperature sensors (a), the motor with a temperature sensor (c), and room sensors with the sensor node (d) are shown in Figure 10.
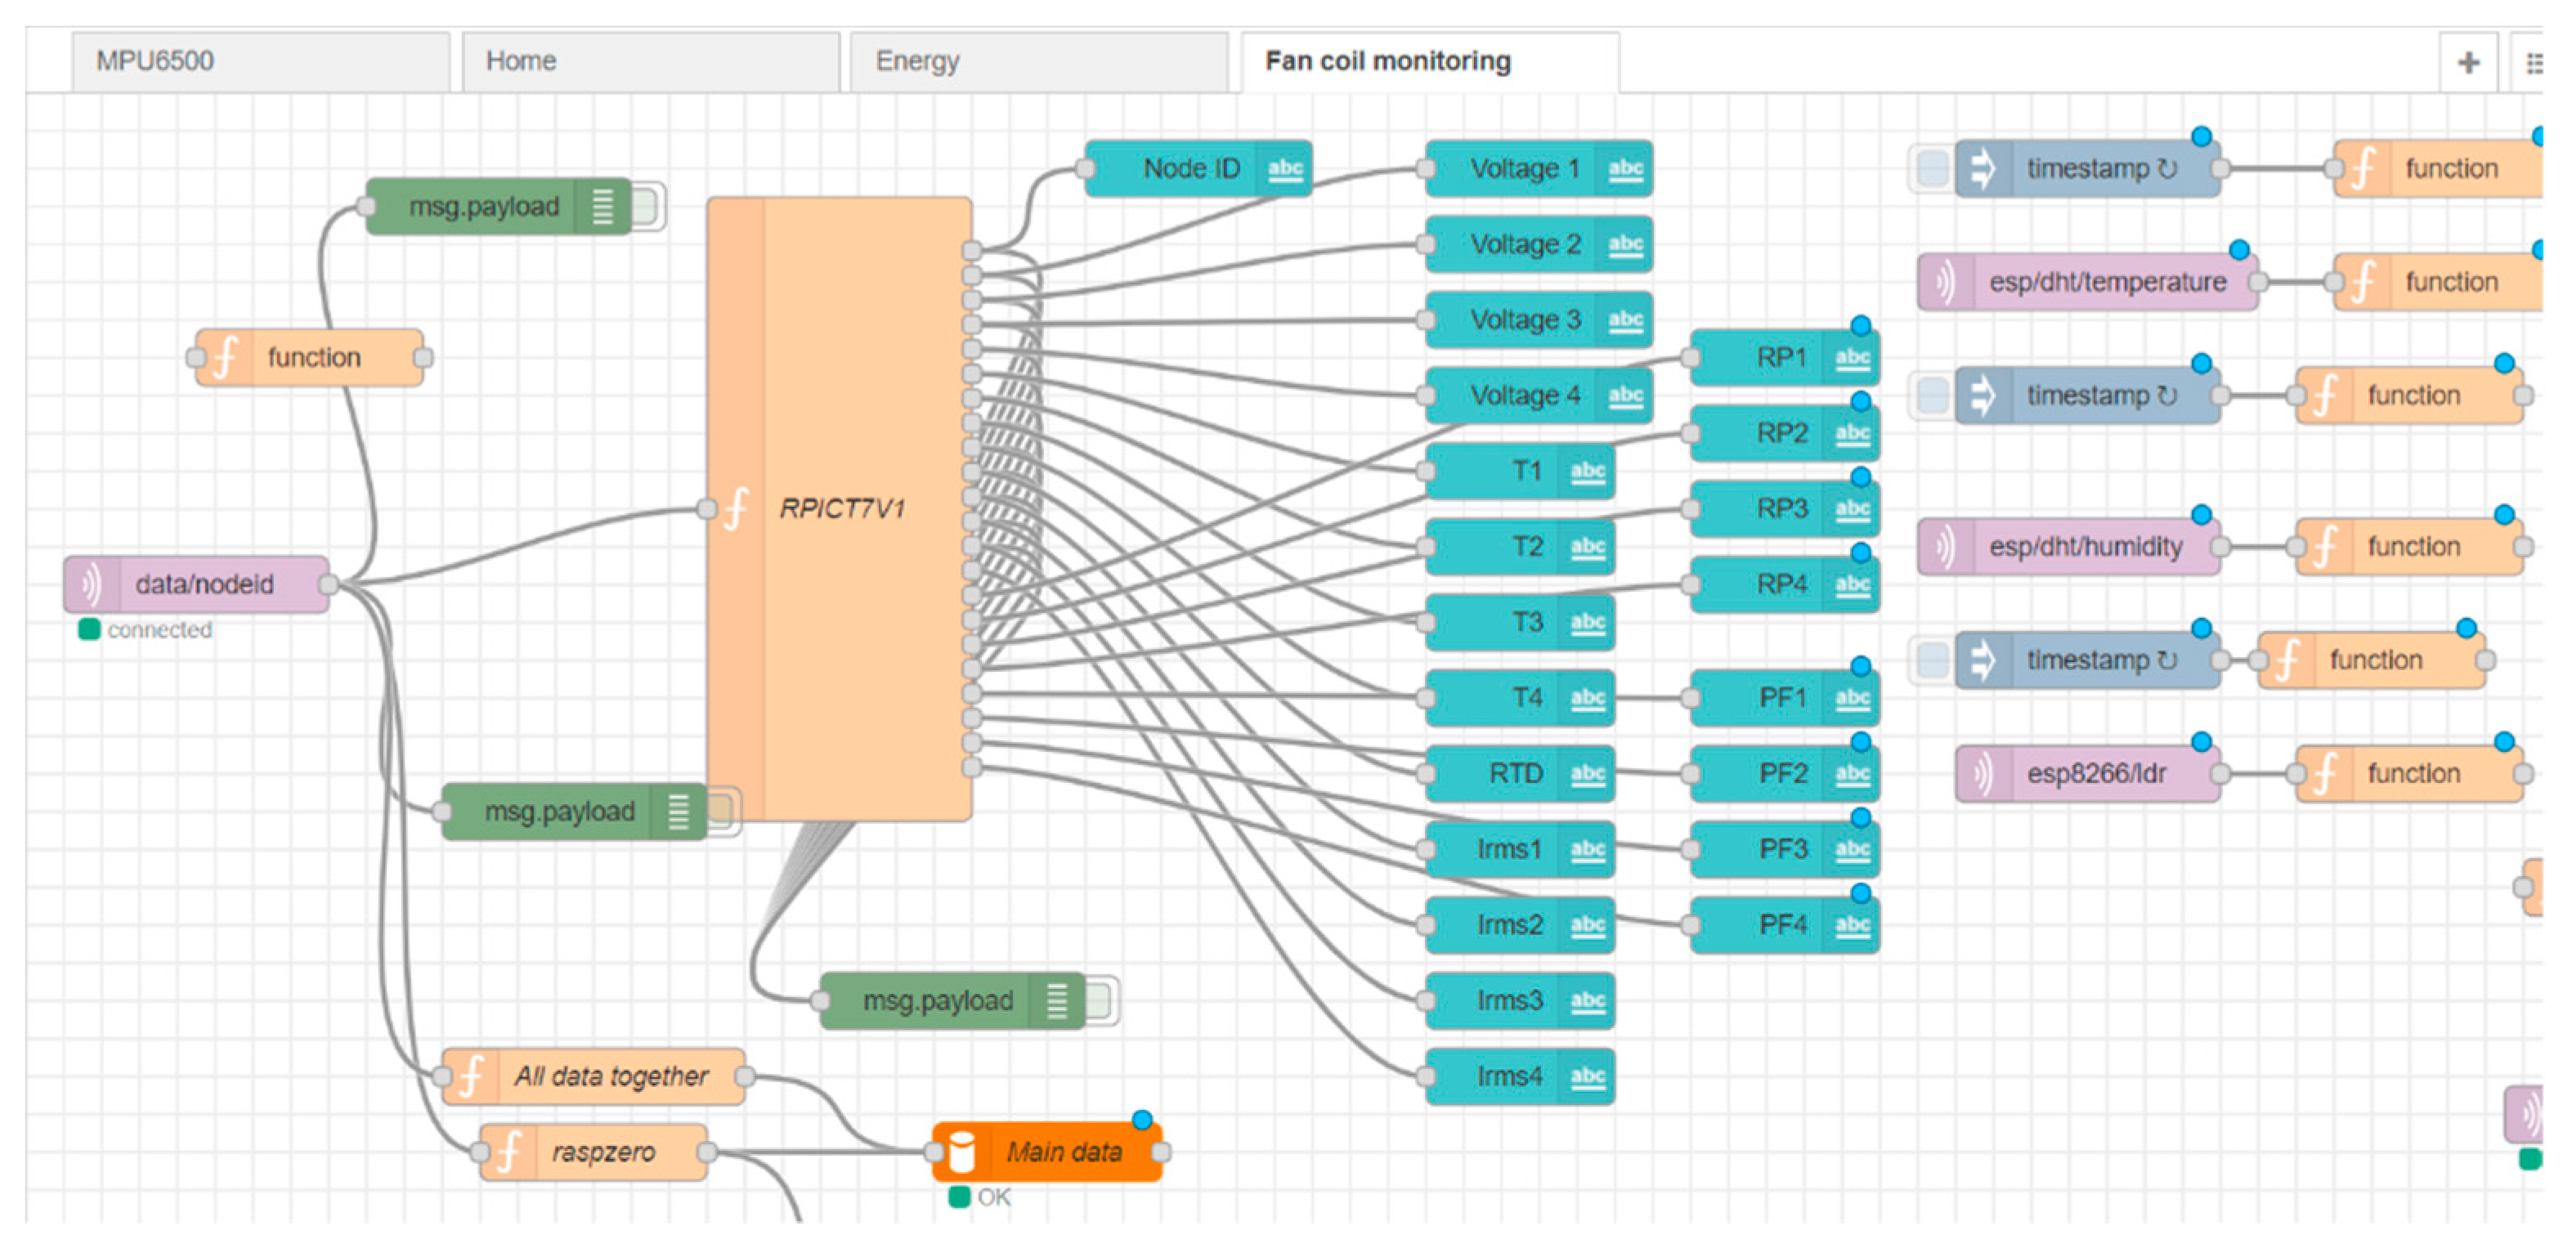
Data are measured by fan coil and room sensors and then displayed on the dashboard of the Rpi3B server using Node-Red flows in Figure 11.
Measured and integrated variables with their descriptions on the Node-Red flow besides the dashboard are provided in Table 4.
To verify the IoT and BIM integrated application dashboard, one voltage (V1) and one current (I1) sensors are connected to the first port of the sensor’s board and all temperature sensors including RTD are allocated to the FC as shown in Figure 8.
5. Results
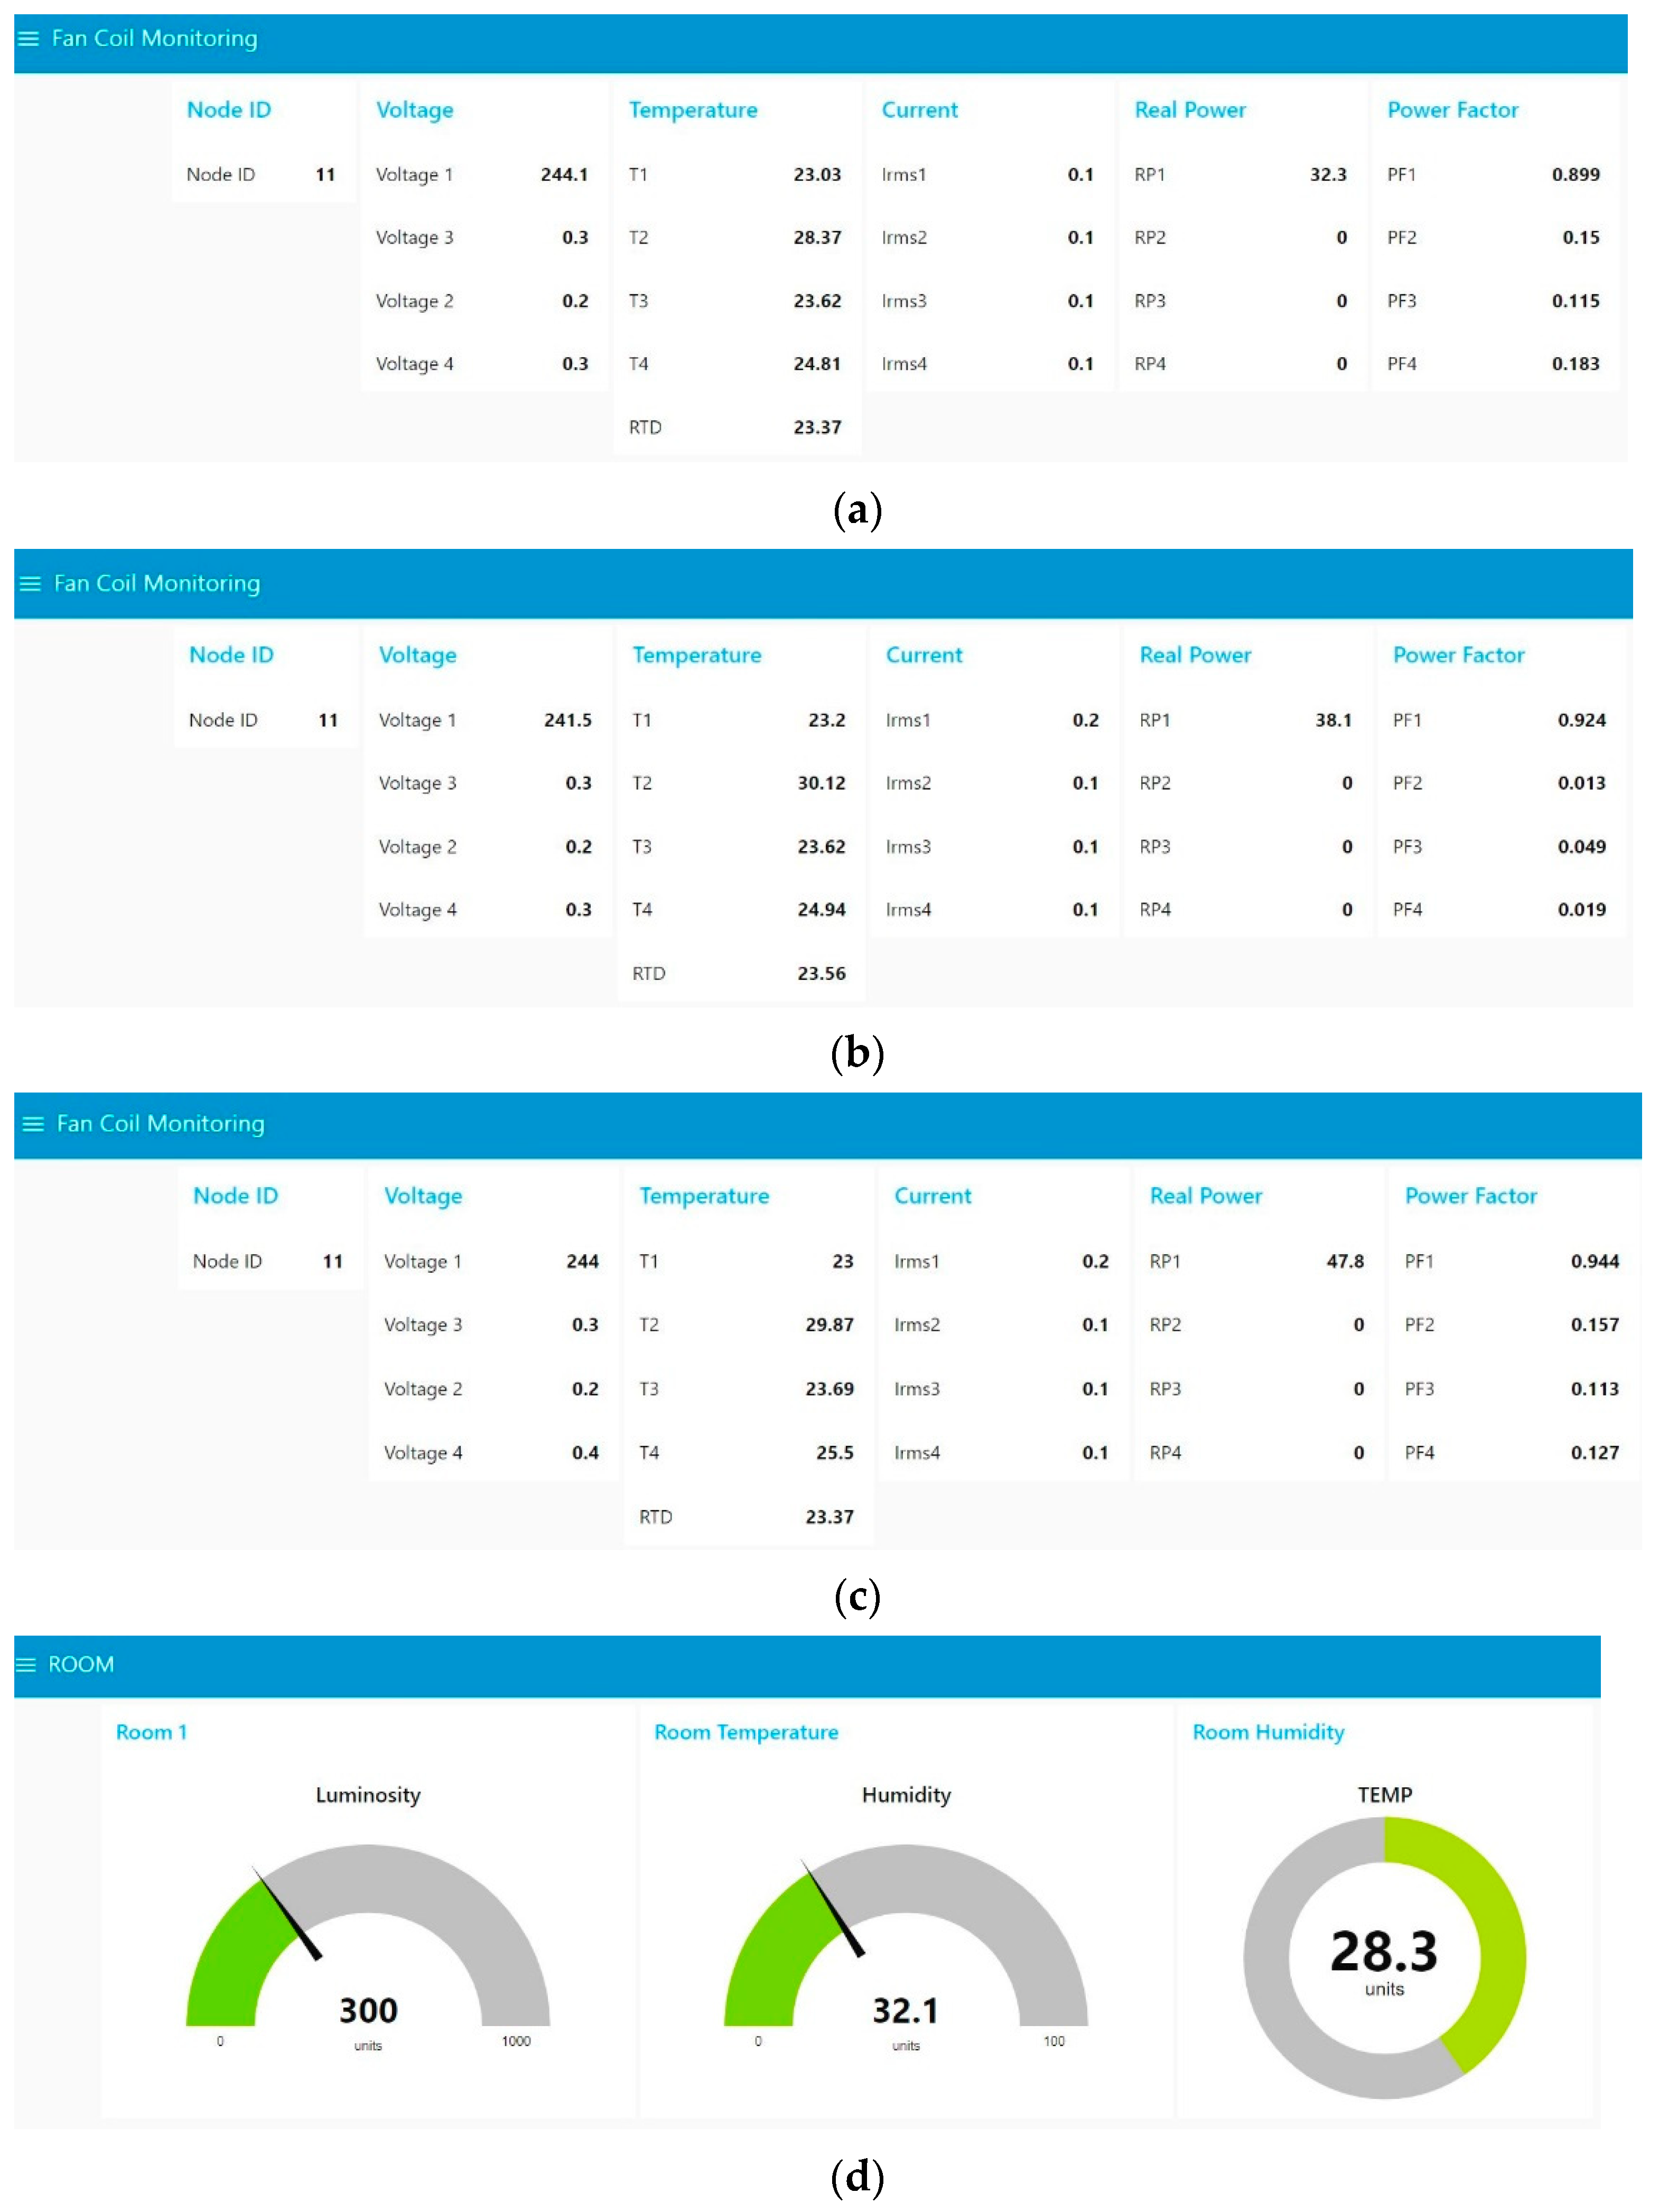
The proposed framework was tested on the fan coil in the room with connected sensors. The FC sensors were linked to the set-up speed and each time the speed was adjusted. The final result of the dashboard with the acquired data at speed 1 is shown in Figure 12a—the motor power consumption values are as follows: V1 = 244.1, I1 = 0.1 A, RP1 = 32.3 and PF = 0.899. Fan coil data at speed 2 on the dashboard are shown in Figure 12b—the motor power consumption values are V1 = 241.5, I1 = 0.2 A, RP1 = 38.1 and PF1 = 0.924. Finally speed 3 on the dashboard is shown in Figure 12c—the motor power was measured as V1 = 244, I1 = 0.2 A, RP1 = 47.8 and PF1 = 0.944. The average temperature of the FC motor was RTD = 23.43 °C and average outlet temperature was indicating as T2 = 29.45 °C because the fan coil was heating the room. Rooms’ dashboards with physical parameters acquired from sensors are visualized in Figure 12d.
The Rpi3B server board memory was not sufficient for the big data storage To avoid overloading the local server memory, only daily maximum and minimum values were sent from the sensor board to the cloud and BIM server. The fault detection methodology described in the previous section was applied to the system. If the values supplied by sensors exceed the predictable ranges, the system sends alarm signals or real-time notifications to the facility managers and operators using Telegram or SMS.
On the Forge platform, IoT data are integrated into the BIM using the Forge reference application (https://github.com/Autodesk-Forge/forge-dataviz-iot-reference-app, accessed on 6 April 2021) and two NPM modules (React UI components and Client-Server Data-Module-Components): NPM is the packet manager for Node.js and it is an open-source project helping to support JavaScript developers.
Installation and running of the Forge reference application started by cloning the application from GitHub repository (git clone https://github.com/Autodesk-Forge/forge-dataviz-iot-reference-app.git, accessed on 6 April 2021) to the VScode using lines in the console of the editor.
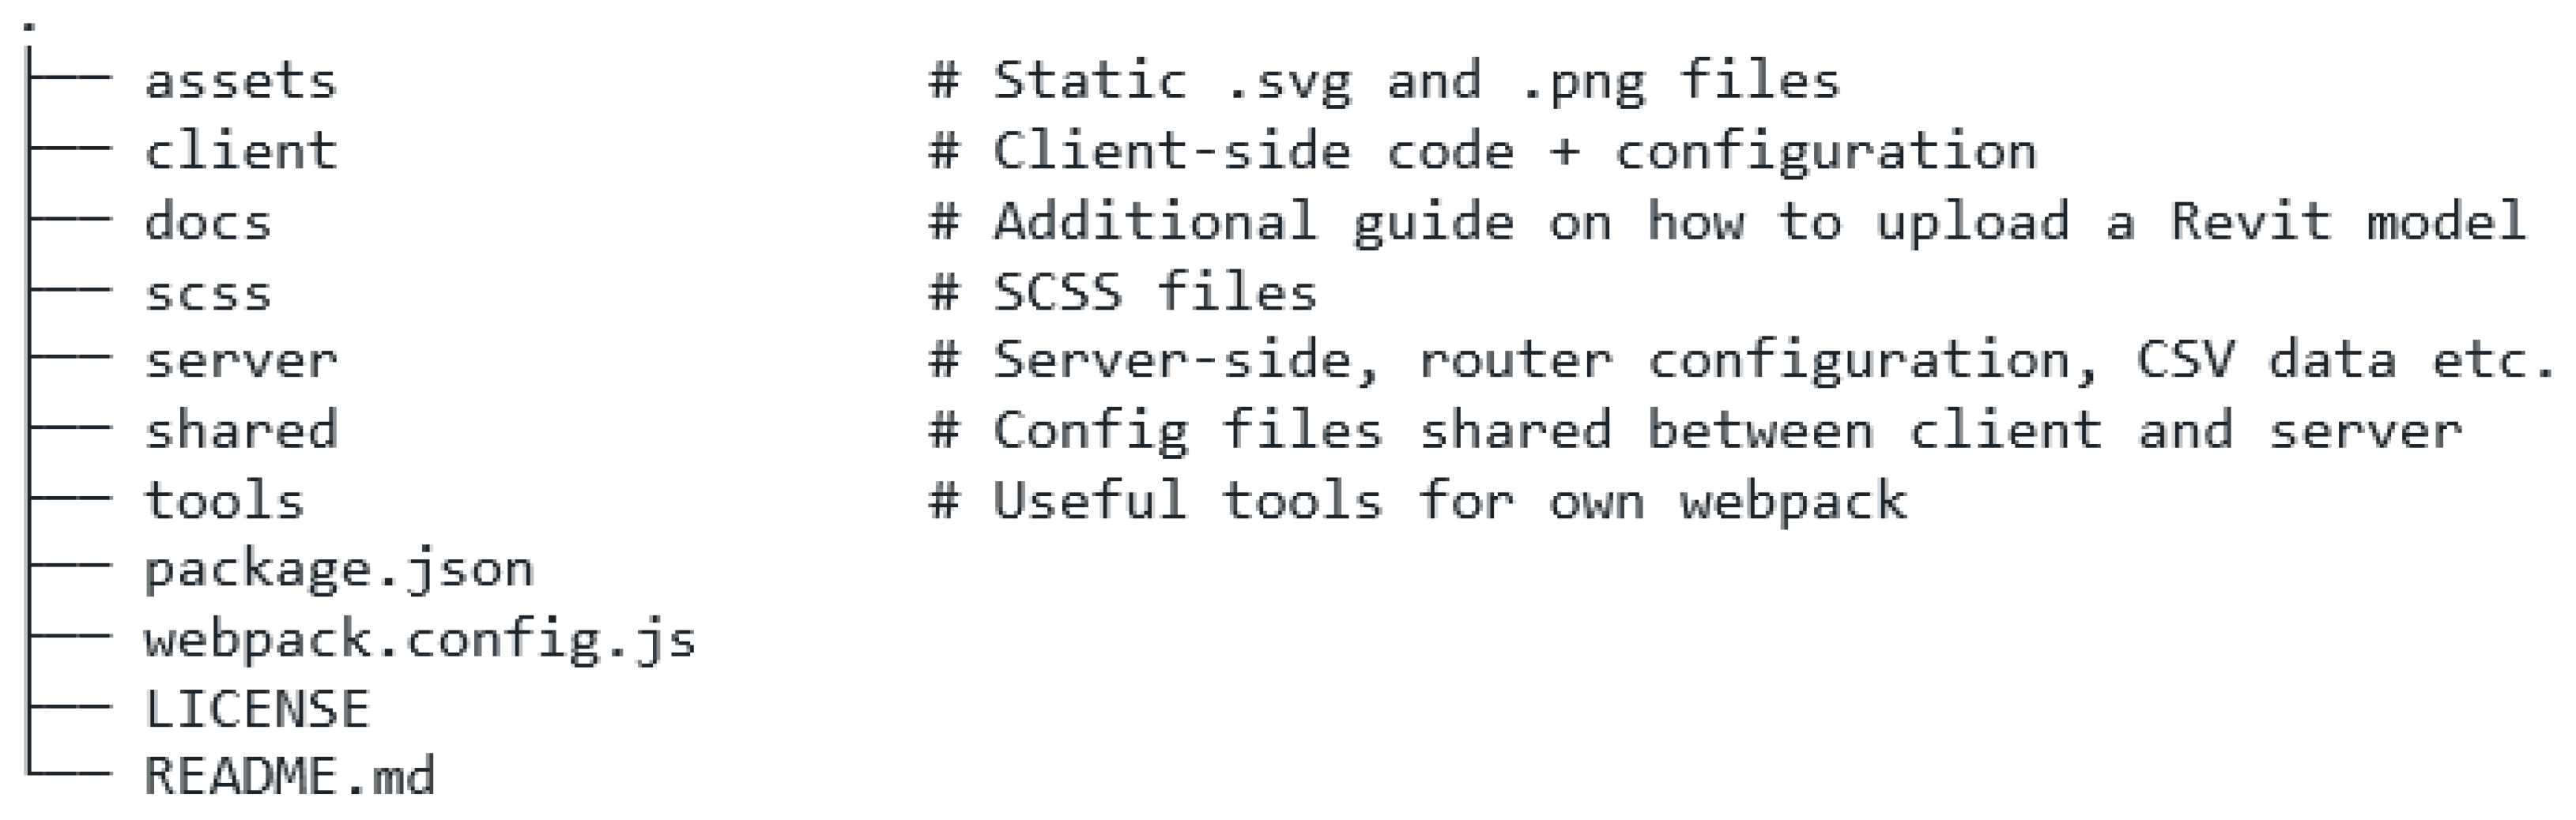
The project folder is composed of client-side codes, a guide on how to upload the Revit model, router configuration, and client-server configuration files that speed up work for developers on their custom applications. The structure of the folders and files of the reference application is shown in Figure 13.
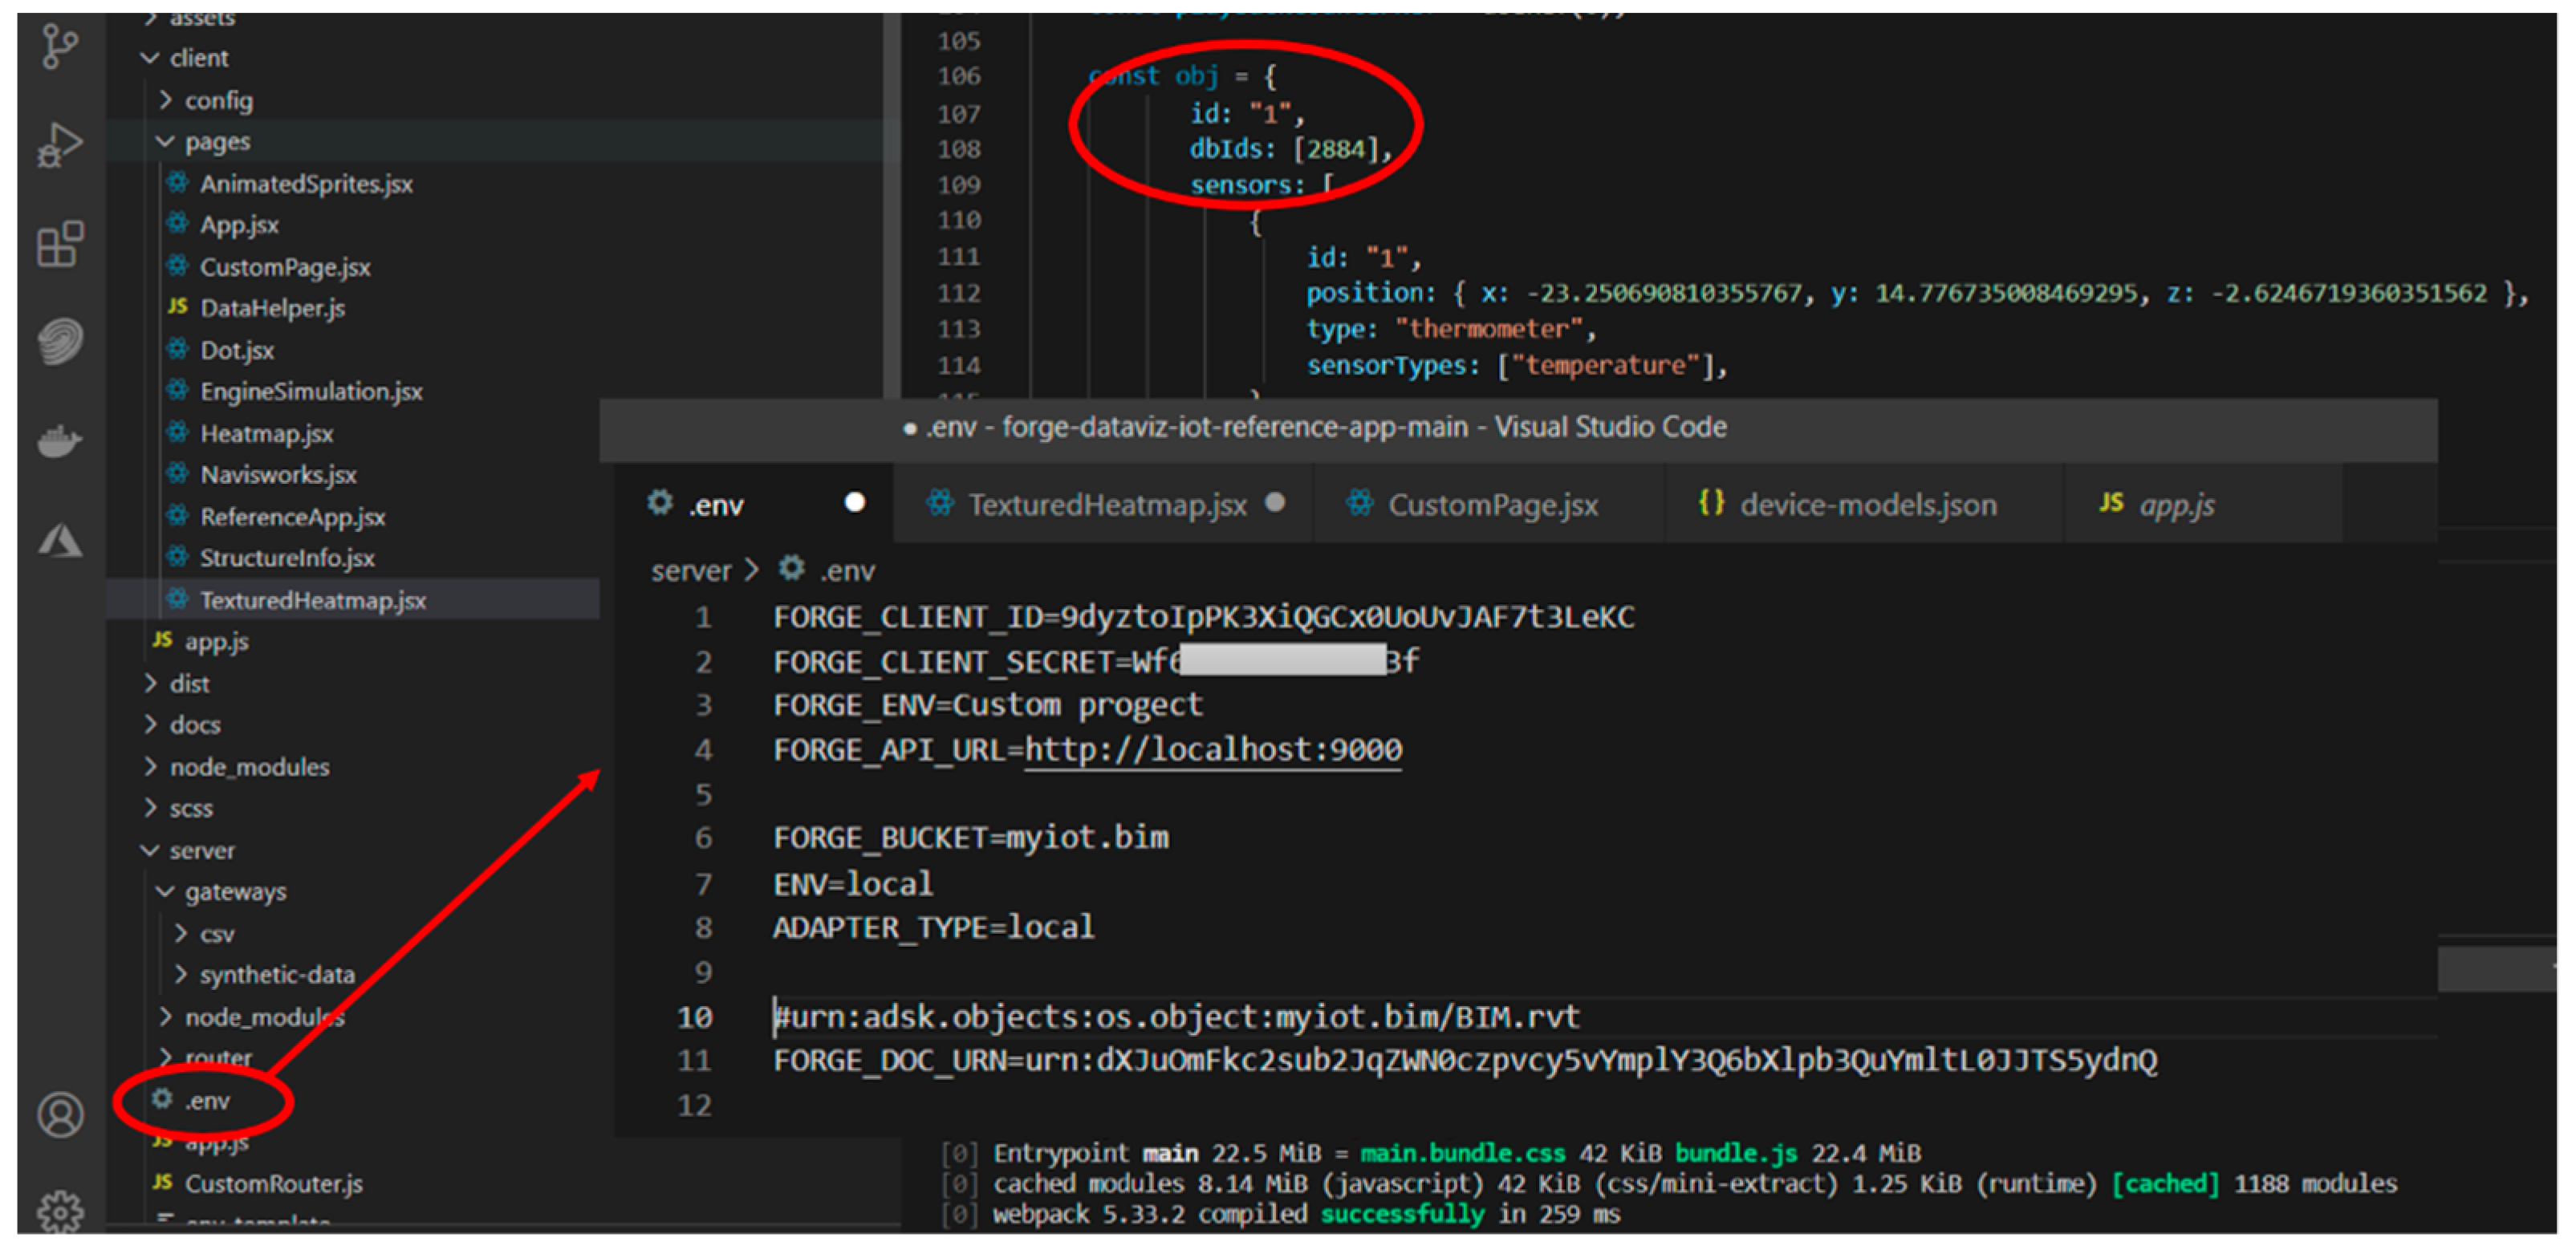
In the reference application an .env file is created and added to Forge CLIENT_ID, CLIENT_SECRET, and Forge_BUCKET; in this way the custom 3D building model is added to the project (Figure 14). By running the project, the custom 3D model is then uploaded in a static browser (http://localhost:9000/upload, accessed on 6 April 2021).
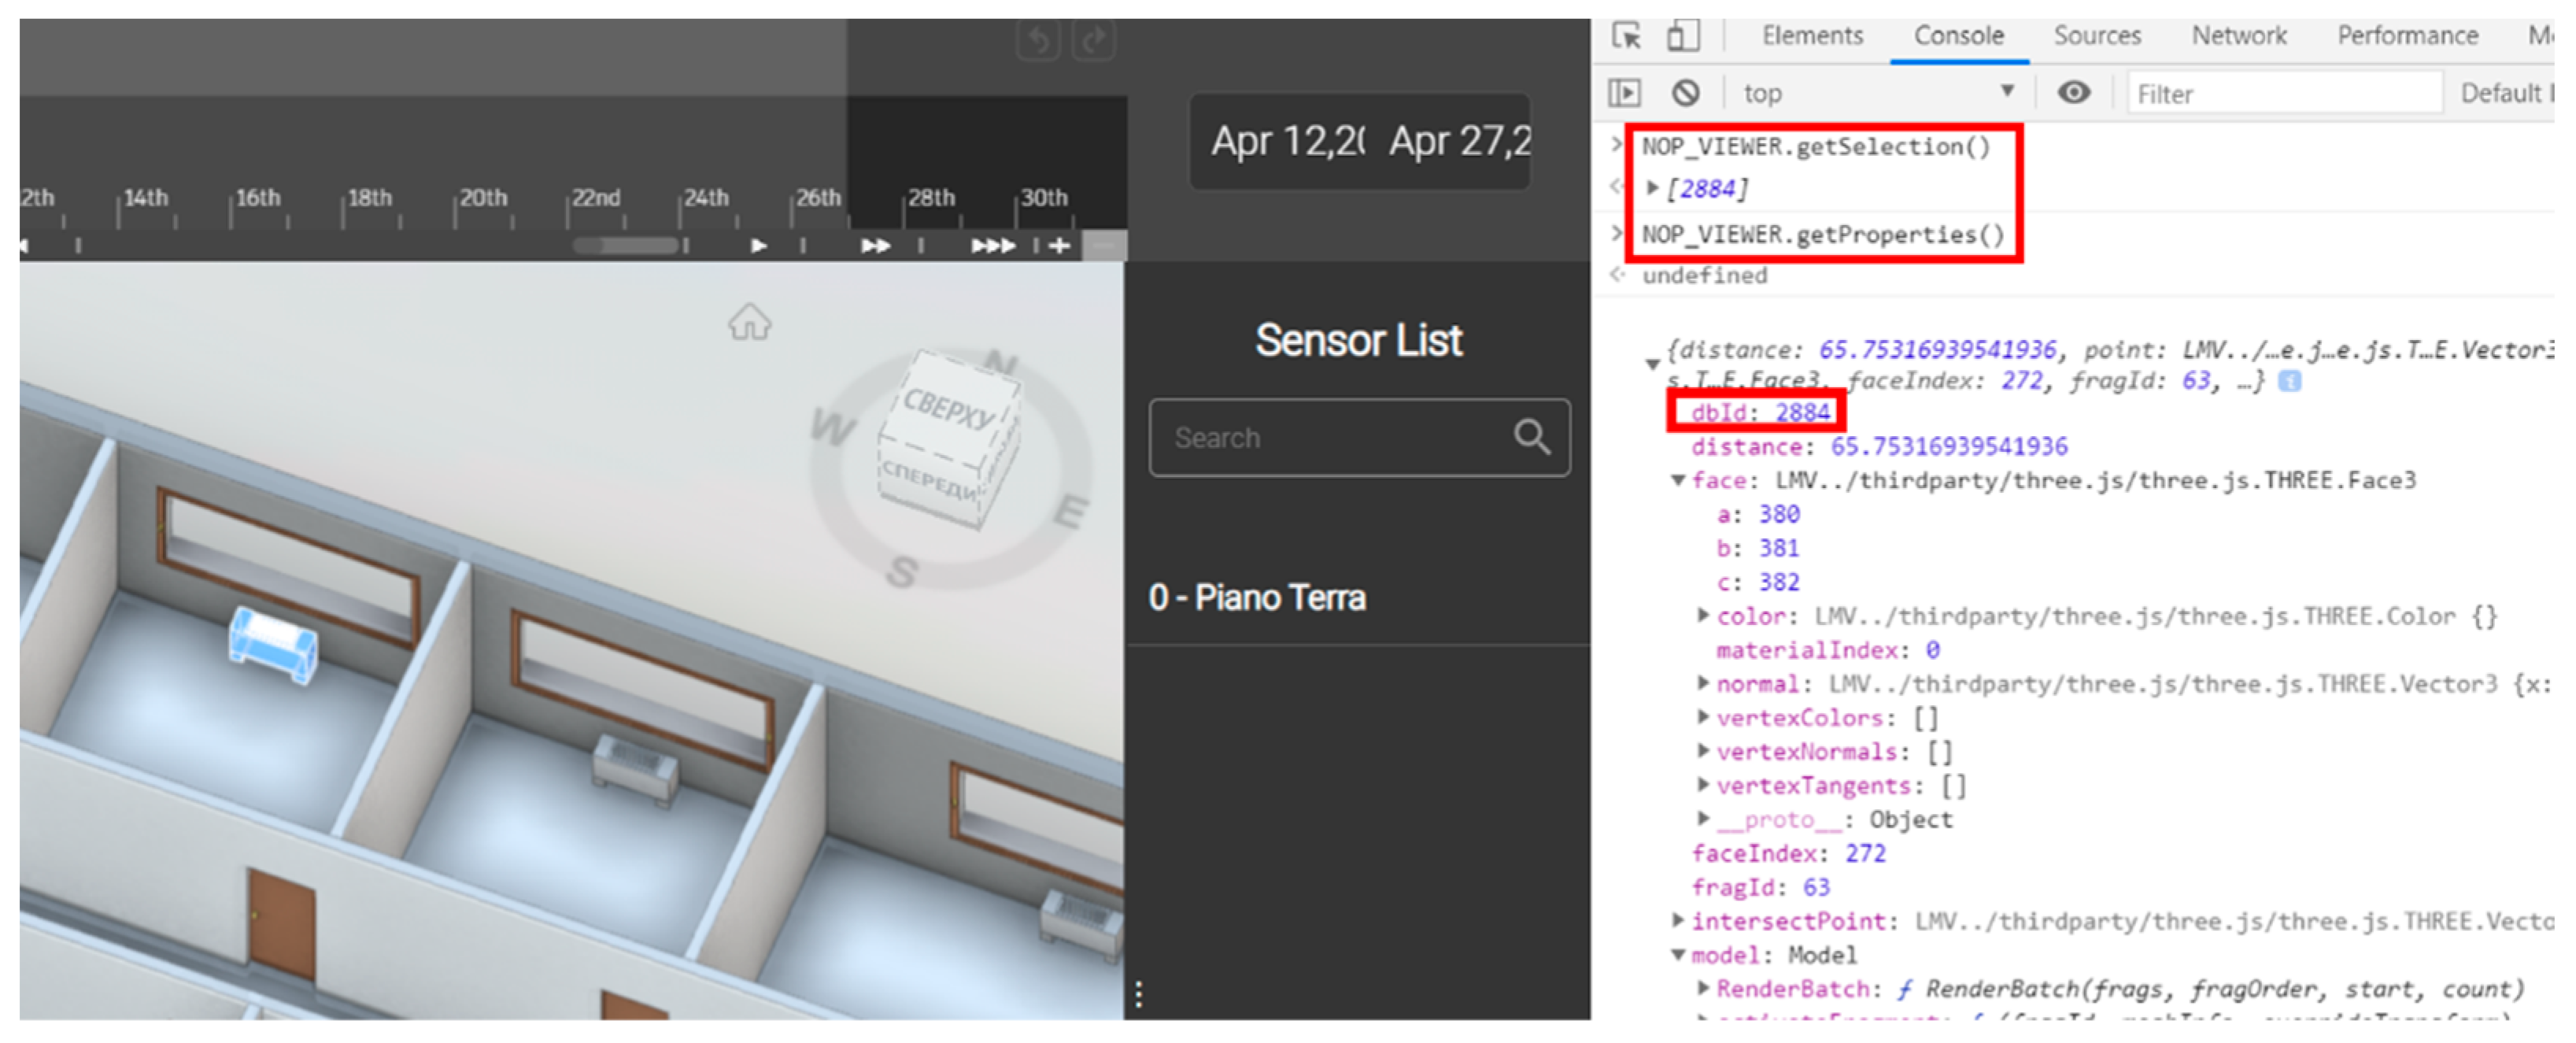
To interact with uploaded model objects on the Forge Viewer, DbIds are required.
This is because most API methods to manipulate entities require the argument DbId (or array), such as isolate, hide, highlight, etc.; knowing the DbId array, a map with the model hierarchy node, a unique ID can be built and then custom functions can be written to connect IoT sensor variables to the BIM model.
The objects; dbIds can be acquired using functions getSelection() that returns a list of DbIds, and getProperties() expecting DbId as input, etc. The extraction process of DbIds from model objects is shown Figure 15.
To identify each fan coil DbId’s was added as a list in customized JavaScript code. It included sensor parameters such as position, type, etc. The added custom IoT sensor data were implemented through additional functions as shown in Figure 15.
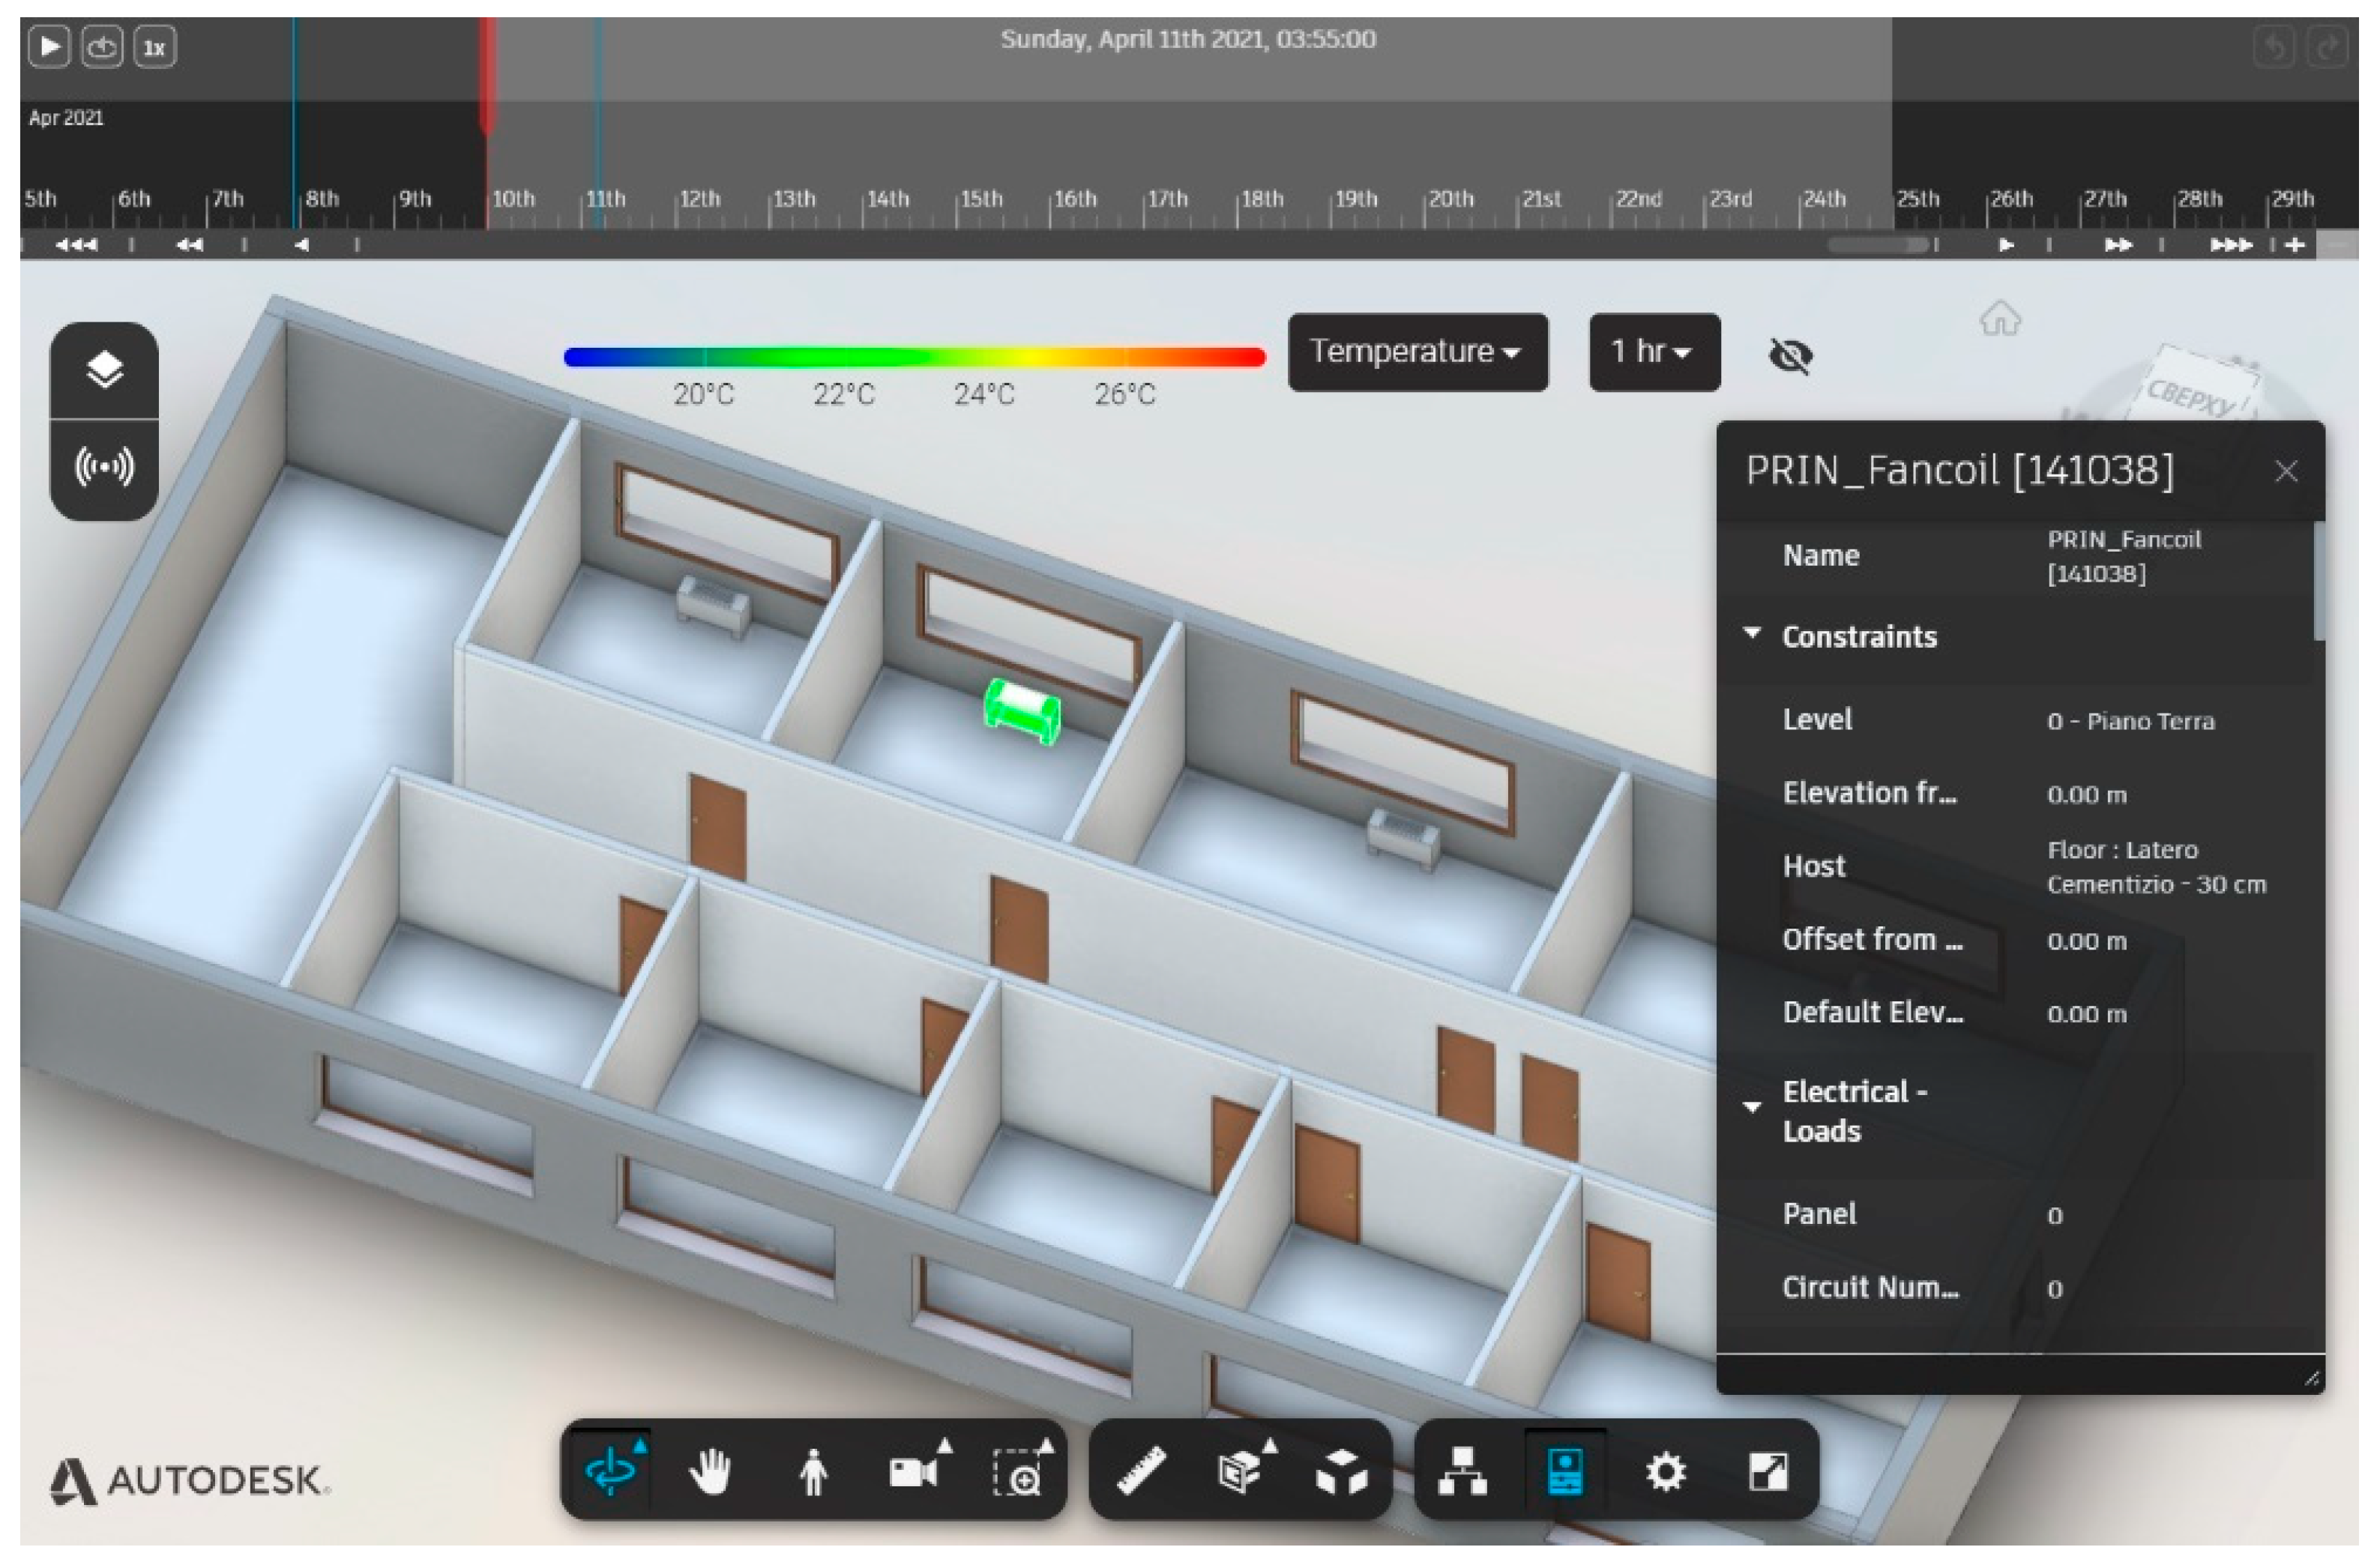
Finally, Figure 16 shows IoT and BIM applications developed on the Forge platform. In the application, the fan coil color changes according to data coming from the sensor nodes. The color is “green” if the fan coil is in a good condition, “red” if overheated, and “blue” if the FC is cooling.
6. Discussion and Conclusions
Cloud services for data analytics, including platforms for data visualization, are now available from providers like Microsoft Azure, Amazon Web Services and Google Cloud. These services can gather data and generate alerts, notifications, and graphs, but they are not flexible and cannot interact with the BIM model or sensor data.
This paper introduced a fully automated integrated framework for the maintenance of building facilities using open source IoT technologies. The IoT part of the proposed framework is composed of sensors to be installed in building facilities and wireless sensor network nodes that continuously send received data through gateways to the local and cloud servers according to configured sampling frequencies. The proposed fault detection methodology was integrated into the server and sends alarms to the end user or managers when any anomaly occurs for it to be fixed effectively; BIM was utilized to view the monitored HVAC FC component’s condition and the room’s physical parameters such as temperature, humidity, and luminosity using wireless-connected remote devices. A case study was used to test the new framework implementation. The integration of an FC monitoring system into the BIM model would improve the building’s maintenance plan by helping the facility managers to inspect the monitored building environments inside the 3D model. Thus, facility managers can profit from the proposed framework to resolve maintenance problems in the following aspects: (a) using building facility anomaly or failure signals, facility managers can plan and schedule maintenance work in advance; (b) conditional and real-time data coming from sensors allow for more accurate maintenance; (c) data visualization and real-time data on the dashboard create the possibility of avoiding the risk of disastrous breakdowns and reduce unplanned forced outages of building components; (d) IoT sensor data for building components within the BIM model makes maintenance work more convenient, e.g., it would be easy to find the location of the failure component in the real-time BIM model; and finally, (e) collected indoor and facility sensor data is the initial tool to perform predictive maintenance actions.
The study conducted in this paper aims to fill the gaps of the following researches: limited number of sensors [23], an absence of automation [24], and lack of data acquisition system [25]. The final results of the fully automated framework composed of IoT sensors, dashboard, IoT and BIM integrated application, and implemented preventive maintenance methodology of the building facilities on the server prove the proposed framework’s applicability.
Nevertheless, this work has several limitations, which are as follows:
- In terms of building monitored facilities, the study is fairly restricted. Additional research is needed to perform a large-scale inquiry by connecting more building facilities and evaluating the system’s integration with facility managers and clients to assess its reliability, repeatability, robustness, and simplicity of use.
- A small number of sensors were used to test the proposed framework in this study. Other sensors, such as indoor air quality sensors (e.g., an oxide gas sensor, a particle dust sensor, etc.) and facility management sensors can be added to the system (e.g., motion sensor, occupancy sensor, etc.). The developed system should also be tested with a larger number and range of sensors.
Future research work will attempt to use collected data from the proposed system for predictive maintenance management of building facilities. Decision support systems for facility predictive maintenance management systems, artificial intelligence (AI), specifically machine learning (ML) tools, and algorithms should be used.
Time series sensor data, either historical failures, anomalies, or both, data can be used as ML inputs. For example, building facility anomalies or failures can be predicted using classification analyses. The use of regression analyses can utilize time series sensor data to forecast physical parameters of the building facilities’ components. Thus, either predicted values, failures, anomalies, or combination, of building facilities offer the FM managers the ability to provide even more effective maintenance services before failures.
Author Contributions
Conceptualization, V.V., B.N., and G.B.; methodology, V.V. and P.P..; software, K.A.; validation, P.P. and D.A.; formal analysis, P.P.; investigation, G.B., B.N. and V.V.; resources, P.P. and K.A.; data curation, D.A. and P.P.; writing—original draft preparation, V.V. and K.A.; writing—review and editing, B.N., D.A. and P.P.; visualization, V.V.; supervision, V.V.; project administration, B.N. and V.V.; funding acquisition, B.N. and V.V. All authors have read and agreed to the published version of the manuscript.
Funding
This research was funded by the Italian government, through the PRIN2017 project of the Ministero dell’Istruzione, dell’Università e della Ricerca (MIUR). The project entitled “Distributed Digital Collaboration Framework for Small and Medium-Sized Engineering and Construction Enterprises” is coordinated at the national level by Berardo Naticchia.
Institutional Review Board Statement
Not applicable.
Informed Consent Statement
Not applicable.
Data Availability Statement
Not applicable.
Conflicts of Interest
The authors declare no conflict of interest.
References
- Lauro, F.; Moretti, F.; Capozzoli, A.; Khan, I.; Pizzuti, S.; Macas, M.; Panzieri, S. Building fan coil electric consumption analysis with fuzzy approaches for fault detection and diagnosis. In Proceedings of the 2014 6th International Conference on Sustainability in Energy and Buildings, SEB-14, Energy Procedia 62, Cardiff, UK, 25–27 June 2014; pp. 411–420. [Google Scholar]
- Allen, P.A. An Integrated Power and Building Services Management System, INTELEC ’86, International Telecommunications Energy Conference; IEEE: Piscataway, NJ, USA, 1986; pp. 525–530. [Google Scholar] [CrossRef]
- Malatras, A.; Asgari, A.H.; Baugé, T. Web Enabled Wireless Sensor Networks for Facilities Management. IEEE Syst. J. 2008, 2, 500–512. [Google Scholar] [CrossRef]
- Pishdad-Bozorgi, P.; Gao, X.; Eastman, C.; Self, A.P. Planning and Developing Facility Management-Enabled Building Information Model (FM-enabled BIM), Automation in Construction; Elsevier: Amsterdam, The Netherlands, 2018; Volume 87, pp. 22–38. ISSN 0926-5805. [Google Scholar] [CrossRef]
- Becerik-Gerber, B.; Jazizadeh, F.; Li, N.; Calis, G. Application Areas and Data Requirements for BIM-Enabled Facilities Management. J. Constr. Eng. Manag. 2012. [Google Scholar] [CrossRef]
- Kazado, D.; Kavgic, M.; Eskicioglu, R. Integrating Building Information Modeling (BIM) and Sensor Technology for Facility Management in 2019. J. Inf. Technol. Constr. 2019, 24, 440–458. Available online: https://www.itcon.org/2019/23 (accessed on 6 June 2021).
- Zhou, X.; Lifeng, X.; Lee, J. Reliability-centered predictive maintenance scheduling for a continuously monitored system subject to degradation. Reliab. Eng. Syst. Saf. 2007, 92, 530–534. [Google Scholar] [CrossRef]
- Shalabi, F.; Turkan, Y. IFC BIM-based facility management approach to optimize data collection for corrective maintenance. J. Perform. Constr. Facil. 2017, 31, 04016081. [Google Scholar] [CrossRef]
- Bousdekis, A.; Magoutas, B.; Apostolou, D.; Mentzas, G. A proactive decision making framework for condition-based maintenance. Ind. Manag. Data Syst. 2015, 115, 1225–1250. [Google Scholar] [CrossRef]
- Bouabdallaoui, Y.; Lafhaj, Z.; Yim, P.; Ducoulombier, L.; Bennadji, B. Predictive Maintenance in Building Facilities: A Machine Learning-Based Approach. Sensors 2021, 21, 1044. [Google Scholar] [CrossRef]
- Aliev, K.; Antonelli, D. Proposal of a Monitoring System for Collaborative Robots to Predict Outages and to Assess Reliability Factors Exploiting Machine Learning. Appl. Sci. 2021, 11, 1621. [Google Scholar] [CrossRef]
- Martí, L.; Sanchez-Pi, N.; Molina, J.M.; Garcia, A.C.B. Anomaly Detection Based on Sensor Data in Petroleum Industry Applications. Sensors 2015, 15, 2774–2797. [Google Scholar] [CrossRef] [PubMed] [Green Version]
- Dave, B.; Buda, A.; Nurminen, A.; Främling, K. A framework for integrating BIM and IoT through open standards. In Automation in Construction; Elsevier: Amsterdam, The Netherlands, 2018; pp. 35–45. [Google Scholar] [CrossRef]
- Krishnamurthy, S.; Anson, O.; Sapir, L.; Glezer, C.; Rois, M.; Shub, I.; Schloeder, K. Automation of facility management processes using machine-to-machine technologies. In Lecture Notes in Computer Science (Including Subseries Lecture Notes in Artificial Intelligence and Lecture Notes in Bioinformatics), 4952 LNCS; Springer: Berlin/Heidelberg, Germany, 2008; pp. 68–86. [Google Scholar] [CrossRef]
- Araszkiewicz, K. Digital technologies in Facility Management–the state of practice and research challenges. Procedia Eng. 2017, 196, 1034–1042. [Google Scholar] [CrossRef]
- Cahill, B.; Menzel, K.; Flynn, D. BIM as a Centre Piece for Optimised Building Operation. In eWork and eBusiness in Architecture, Engineering and Construction: ECPPM 2014; Taylor & Francis Group: London, UK, 2012; pp. 549–555. [Google Scholar] [CrossRef]
- Marzouk, M.; Abdelaty, A. BIM-based framework for managing performance of subway stations. In Automation in Construction; Elsevier B.V.: Amsterdam, The Netherlands, 2014; pp. 70–77. [Google Scholar] [CrossRef]
- Tagliabue, L.C.; Re Cecconi, F.; Rinaldi, S.; Ciribini, A.L.C. Data Driven Indoor Air Quality Prediction in Educational Facilities Based on IoT Network. Energy Build. 2021, 236, 110782. [Google Scholar] [CrossRef]
- Rinaldi, S.; Flammini, A.; Tagliabue, L.C.; Ciribini, A. An IoT Framework for the Assessment of Indoor Conditions and Estimation of Occupancy Rates: Results from a Real Case Study; ACTA IMEKO: Benevento, Italy, 2019. [Google Scholar]
- Wong, J.K.W.; Ge, J.; He, S.X. Digitisation in facilities management: A literature review and future research directions. Autom. Constr. 2018, 92, 312–326. [Google Scholar] [CrossRef]
- Xiao, Y.-Q.; Li, S.-W.; Hu, Z.-Z. Automatically Generating a MEP Logic Chain from Building Information Models with Identification Rules. Appl. Sci. 2019, 9, 2204. [Google Scholar] [CrossRef] [Green Version]
- Mannino, A.; Dejaco, M.C.; Re Cecconi, F. Building Information Modelling and Internet of Things Integration for Facility Management—Literature Review and Future Needs. Appl. Sci. 2021, 11, 3062. [Google Scholar] [CrossRef]
- Valinejadshoubi, M.; Moselhi, O.; Bagchi, A.; Salem, A. Development of an IoT and BIM-based automated alert system for thermal comfort monitoring in buildings. Sustain. Cities Soc. 2021, 66, 102602. [Google Scholar] [CrossRef]
- Wehbe, R.; Shahrour, I. Use of BIM and Smart Monitoring for buildings’ Indoor Comfort Control. In MATEC Web of Conferences; EDP Science: Lille, France, 2019; Volume 295. [Google Scholar]
- Natephra, W.; Motamedi, A. Bim-Based Live Sensor Data Visualization Using Virtual Reality for Monitoring Indoor Conditions; CumInCAD: Wellington, New Zealand, 2019. [Google Scholar]
- Cahill, B.; Menzel, K.; Flynn, D. BIM and IoT Sensors Integration: A Framework for Consumption and Indoor Conditions Data Monitoring of Existing Buildings. Sustainability 2021, 13, 4496. [Google Scholar]
- Guillen, A.; Crespo, A.; Gómez, J.; González-Prida, V.; Kobbacy, K.; Shariff, S. Building Information Modeling as Asset Management Tool. In 3rd IFAC Workshop on Advanced Maintenance Engineering, Services and Technology AMEST 2016; IFAC-PapersOnLine; Elsevier B.V.: Amsterdam, The Netherlands, 2016; pp. 191–196. [Google Scholar] [CrossRef]
- Piette, M.A.; Kinney, S.K.; Haves, P. Analysis of an information monitoring and diagnostic system to improve building operations. Energy Build. 2001, 33, 783–791. [Google Scholar] [CrossRef] [Green Version]
- Piette, M.A.; Nordman, B.; Greenberg, S. Quantifying energy savings from commissioning: Preliminary results from the pacific northwest. In Processings of the Second National Conference on Building Commissioning; Lawrence Berkeley National Laboratory: Berkeley, CA, USA, 1994. [Google Scholar]
- Schein, J.; Bushby, S.T.; Castro, N.S.; House, J.M. A rule-based fault detection method for air handling units. Energy Build. 2006, 38, 1485–1492. [Google Scholar] [CrossRef]
- Mills, E. Building commissioning: A golden opportunity for reducing energy costs and greenhouse-gas emissions. In Lawrence Berkeley National Laboratory; Springer Nature: Cham, Switzerland, 2010. [Google Scholar]
- Cheng, J.C.P.; Chen, K.; Chen, W.; Li, C.T. A Bim-Based Location Aware Ar Collaborative Framework for Facility Maintenance Management. J. Inf. Technol. Constr. 2019, 24, 30–39. Available online: http://www.itcon.org/2019/19 (accessed on 20 February 2021).
- Chung, S.W.; Kwon, S.W.; Moon, D.Y.; Ko, T.K. Smart facility management systems utilising open BIM and augmented/virtual reality. In Proceedings of the 35th International Symposium on Automation and Robotics in Construction (ISARC2018), Berlin, Germany, 20–25 July 2018. [Google Scholar]
- International Standard Facility Management—Vocabulary; ISO: Geneva, Switzerland, 2017.
- Omar, N.S.; Najy, H.I.; Ameer, H.W. Developing of Building Maintenance Management by Using BIM. Int. J. Civ. Eng. Technol. 2018, 9, 1371–1383. Available online: https://www.iaeme.com/MasterAdmin/uploadfolder/IJCIET-09-11-132/IJCIET-09-11-132.pdf (accessed on 20 February 2021).
- Arpaci, I.; Al-Emran, M.; Al-Sharafi, M.A.; Marques, G. Indoor Air Quality Monitoring Systems and COVID-19. Emerg. Technol. COVID-19 Pandemic 2021, 348, 133–147. [Google Scholar] [CrossRef]
- Laustsen, J. Energy efficiency requirements in building codes, energy efficiency policies for new buildings. In International Energy Agency (IEA); IEA Information Paper; IEA: Paris, France, 2008. [Google Scholar]
- DoE, U.S. Buildings Energy Data Book; Energy Efficiency Renewable Energy Department, IEER: Washington, DC, USA, 2011. [Google Scholar]
- Hyvarinen, J.; Karki, S. Building Optimisation and Fault Diagnosis Source Book; IEA Annex; International Energy Agency: Paris, France, 1996. [Google Scholar]
- Haves, P.; Claridge, D.; Lui, M. Report assessing the Limitations of EnergPlus and SEAP with Options for Overcoming Those Limitations; HPCBS #E5P2.3T1; California Energy Commission Public Interest Energy Research Program: Sacramento, CA, USA, 2001. [Google Scholar]
- CIBSE Guide H: Building Control Systems; Butterworth-Heinemann: Oxford, UK, 2000.
- Friedman, H.; Piette, M.A. Comparative Guide to Emerging Diagnostic Tools for Large Commercial HVAC Systems. In Ernest Orlando Lawrence Berkeley National Laboratory, LBNL 48629; Ernest Orlando Lawrence Berkeley National Laboratory, LBNL: Berkeley, CA, USA, 2001. [Google Scholar]
- Glaessgen, E.; Stargel, D. The Digital Twin Paradigm for Future NASA and US Air Force Vehicles. In Proceedings of the 53rd AIAA/ASME/ASCE/AHS/ASC Structures, Structural Dynamics and Materials Conference 20th AIAA/ASME/AHS Adaptive Structures Conference 14th AIAA, Honolulu, HI, USA, 23–26 April 2012. [Google Scholar]
- Bonci, A.; Carbonari, A.; Cucchiarelli, A.; Messi, L.; Pirani, M.; Vaccarini, M. A cyber-physical system approach for building efficiency monitoring. Autom. Constr. 2019, 102, 68–85. [Google Scholar] [CrossRef]
- Schluse, M.; Priggemeyer, M.; Atorf, L.; Rossmann, J. Experimentable digital twins. IEEE Trans. Ind. Inform. 2018, 14, 1722–1731. [Google Scholar] [CrossRef]
- Asghari, P.; Rahmani, A.M.; Javadi, H.H.S. Internet of Things applications: A Systematic Review. Comput. Netw. 2019, 148, 241–261. [Google Scholar] [CrossRef]
- Gubbi, J.; Buyya, R.; Marusic, S.; Palaniswami, M. Internet of Things (IoT): A vision, architectural elements, and future directions. Futur. Gener. Comput. Syst. 2013, 29, 1645–1660. [Google Scholar] [CrossRef] [Green Version]
- Pradeep, S.; Kousalya, T.; Suresh, K.M.A.; Edwin, J. IoT and its connectivity challenges in smart home. Int. Res. J. Eng. Technol. 2016, 3, 1040–1043. Available online: http://www.indjst.org/index.php/indjst/article/view/109387 (accessed on 20 February 2021).
- Rizal, R.; Hikmatyar, M. Investigation Internet of Things (IoT) Device using Integrated Digital Forensics Investigation Framework (IDFIF). J. Phys. Conf. Ser. 2019, 1179, 012140. [Google Scholar] [CrossRef]
- Rafsanjani, H.N.; Ghahramani, A. Towards utilising internet of things (IoT) devices for understanding individual occupants’ energy usage of personal and shared appliances in office buildings. J. Build. Eng. 2020, 27, 100948. [Google Scholar] [CrossRef]
- Wang, M.; Zhang, G.; Zhang, C.; Zhang, J.; Li, C. An IoT-based appliance control system for smart homes. In Proceedings of the IEEE 4th International Conference on Intelligent Control and Information Processing (ICICIP), Beijing, China, 9–11 June 2013; pp. 744–747. [Google Scholar]
- Schleich, B.; Anwer, N.; Mathieu, L.; Wartzack, S. Shaping the digital twin for design and production engineering. CIRP Ann. 2017, 66, 141–144. [Google Scholar] [CrossRef] [Green Version]
- Negri, E.; Fumagalli, L.; Macchi, M. A review of the roles of digital twin in cps-based production systems. Procedia Manuf. 2017, 11, 939–948. [Google Scholar] [CrossRef]
- Luo, W.; Hu, T.; Zhu, W.; Tao, F. Digital twin modeling method for cnc machine tool. In 2018 IEEE 15th Int Conf in Networking; Sensing and Control; IEEE: Zhuhai, China, 2018; pp. 1–4. [Google Scholar]
- Grieves, M. Digital Twin: Manufacturing Excellence Through Virtual Factory Replication. Available online: https://www.researchgate.net/publication/329311603_digital_twin_manufacturing_excellence_through_virtual_factory_replication (accessed on 6 June 2021).
- Saddik, A.E. Digital twins: The convergence of multimedia technologies. IEEE Multimed. 2018, 25, 87–92. [Google Scholar] [CrossRef]
- Boschert, S.; Rosen, R. Digital twin_The simulation aspect. In Mechatronic Futures; Springer: Cham, Switzerland, 2016; pp. 59–74. [Google Scholar]
- Hicks, B. Industry 4.0 and Digital Twins: Key Lessons from NASA. Available online: https://www.thefuturefactory.com/blog/24 (accessed on 6 June 2021).
- Nasaruddin, A.N.; Ito, T.; Tuan, T.B. Digital twin approach to building information management. In Proceedings of the Manufacturing Systems Division Conference, Stockholm, Sweden, 16–18 May 2018; p. 304. [Google Scholar]
- Rasheed, A.; San, O.; Kvamsdal, T. Digital Twin: Values, Challenges and Enablers from a Modeling Perspective. IEEE Access 2020, 8, 21980–22012. [Google Scholar] [CrossRef]
- Digital Twins for IoT Applications: A Comprehensive Approach to Implementing IoT Digital Twins. Available online: https://pdf4pro.com/view/digital-twins-for-iot-applications-oracle-5b4880.html (accessed on 6 June 2021).
- Villa, V.; Chiaia, B. Digital Twin for Smart School Buildings: State of the Art, Challenges, and Opportunities. In Handbook of Research on Developing Smart Cities Based on Digital Twins; Del Giudice, M., Osello, A., Eds.; IGI Global: Hershey, PA, USA, 2021; pp. 320–340. [Google Scholar] [CrossRef]
- Daily, J.; Peterson, J. Predictive maintenance: How big data analysis can improve maintenance. In Supply Chain Integration Challenges in Commercial Aerospace; Springer: Cham, Switzerland, 2017; pp. 267–278. [Google Scholar]
- Market Research Future. Global Digital Twin Market Is Estimated to Grow at a Cagr of 37% from 2017 to 2023. Available online: https://www.marketresearchfuture.com/reports/digital-twin-market-4504 (accessed on 23 January 2019).
- NIBS. National BIM Guide for Owners. Available online: https://www.nibs.org/files/pdfs/NIBS_BIMC_NationalBIMGuide.pdf (accessed on 20 February 2021).
- Hilal, M.; Maqsood, T.; Abdekhodaee, A. A hybrid conceptual model for BIM in FM. Constr. Innov. 2019, 19, 531–549. [Google Scholar] [CrossRef]
- Tagliabue, L.C.; Villa, V. Il Bim per le Scuole. In Analisi del Patrimonio Scolastico e Strategie Di Intervento; Il BIM per le Scuole: Hoepli, Italy, 2017. [Google Scholar]
- Munir, M.; Kiviniemi, A.; Jones, S.W. Business value of integrated BIM-based asset management. Eng. Constr. Arch. Manag. 2019, 26, 1171–1191. [Google Scholar] [CrossRef] [Green Version]
- Dixit, M.K.; Venkatraj, V.; Ostadalimakhmalbaf, M.; Pariafsai, F.; Lavy, S. Integration of facility management and building information modeling (BIM). Facilities 2019, 37, 455–483. [Google Scholar] [CrossRef]
- Pärn, E.A.; Edwards, D.J.; Sing, M.C.P. The building information modelling trajectory in facilities management: A review. Autom. Constr. 2017, 75, 45–55. [Google Scholar] [CrossRef] [Green Version]
- Patacas, J.; Dawood, N.; Vukovic, V.; Kassem, M. BIM for facilities management: Evaluating BIM standards in asset register creation and service life planning. J. Inf. Technol. Constr. 2015, 20, 313–331. [Google Scholar]
- Gerrish, T.; Ruikar, K.; Cook, M.; Johnson, M.; Phillip, M. Using BIM capabilities to improve existing building energy modelling practices. Eng. Constr. Archit. Manag. 2017, 24, 190–208. [Google Scholar] [CrossRef] [Green Version]
- Thabet, W.; Lucas, J.D. A 6-Step Systematic Process for Model-Based Facility Data Delivery. J. Inf. Technol. Constr. 2017, 22, 104–131, ITcon, New Zealand. Available online: http://www.itcon.org/2017/6 (accessed on 6 June 2021).
- Wang, X.; Love, P.E.D.; Kim, M.J.; Park, C.S.; Sing, C.P.; Hou, L. A conceptual framework for integrating building information modeling with augmented reality. Autom. Constr. 2013, 34, 37–44. [Google Scholar] [CrossRef]
- El Ammari, K.; Hammad, A. Remote interactive collaboration in facilities management using BIM-based mixed reality. Autom. Constr. 2019, 107, 102940. [Google Scholar] [CrossRef]
- Saar, C.C.; Klufallah, M.; Kuppusamy, S.; Yusof, A.; Shien, L.C.; Han, W.S. Bim integration in augmented reality model. Int. J. Technol. 2019, 10, 1266–1275. [Google Scholar]
- Naticchia, B.; Corneli, A.; Carbonari, A. Framework based on building information modeling, mixed reality, and a cloud platform to support information flow in facility management. Front. Eng. Manag. 2020, 7, 131–141. Available online: https://doi.org/10.1007/s42524-019-0071-y (accessed on 6 June 2021). [CrossRef]
Figure 1.
IoT and BIM integration system architecture.

Figure 2.
Hardware and connectivity block diagram.

Figure 3.
Simplified block diagram of the RPIZCT4V3T2 sensor board.

Figure 4.
Kinds of faults and data collection for preventive maintenance of the FC.

Figure 5.
Integrated anomaly detection flow chart.

Figure 6.
BIM–IoT data integration and visualization approach diagram.

Figure 7.
Case study building: (a) geolocation on the maps.google.it and (b) 2D view of the case study room with the location of the FC.
Figure 7.
Case study building: (a) geolocation on the maps.google.it and (b) 2D view of the case study room with the location of the FC.

Figure 8.
Sensors’ location in the FC and building facilities.

Figure 9.
Functional flowchart of the system.

Figure 10.
Case study sensor nodes placement to the room and FC: (a) FC battery and temperature sensor, (b) FC with RPIZCT4V3T2 board, (c) motor with temperature sensor, and (d) room equipped with ESP8266 sensor node.
Figure 10.
Case study sensor nodes placement to the room and FC: (a) FC battery and temperature sensor, (b) FC with RPIZCT4V3T2 board, (c) motor with temperature sensor, and (d) room equipped with ESP8266 sensor node.

Figure 11.
Node-Red flows of the FC and room sensors data acquisition system.

Figure 12.
Node-Red dashboard results: (a) FC at speed 1; (b) FC at speed 2; (c) FC at speed 3; and (d) room dashboard values coming from the ESP8266 sensor node.
Figure 12.
Node-Red dashboard results: (a) FC at speed 1; (b) FC at speed 2; (c) FC at speed 3; and (d) room dashboard values coming from the ESP8266 sensor node.

Figure 13.
Reference application directory structure.

Figure 14.
The .env file with authentication credentials and the added sensor values in the model DbId objects in JavaScript.
Figure 14.
The .env file with authentication credentials and the added sensor values in the model DbId objects in JavaScript.

Figure 15.
Uploaded custom model DbId’s extraction.

Figure 16.
Final result of implemented heatmap function to the fan coil data and BIM.


Table 1.
Applied sensors with technical specifications.
| Sensor Board | Sensor Name | Accuracy | Measuring Ranges | Units |
|---|---|---|---|---|
| RPIZCT4V3T2 | Current (SCT-013-000) | ±3 | 0–100 A | Ampere (A) |
| Voltage (EU: 77DE-06-09) | ±5 | 0–230 (50 Hz) | Volt (V) | |
| Temperature (DS18B20) | ±0.5 | 0–90 °C | Celsius (C) | |
| Temperature (PT100) | ±0.05 | −200 to 550 °C | Celsius (C) | |
| ESP8266 | Ambient temperature (DHT22) | ±0.5 | −40 to 80 °C | Celsius (C) |
| Humidity (DHT22) | ±2 | 0–100% RH | Relative Humidity (%RH) | |
| Photoresistor (LDR) | Resistant dependent | 0–1 MΩ | lx |
Table 2.
Sampling frequency and FC sensor allocation.
| Sensors | Frequency | Sensor Allocation | Note |
|---|---|---|---|
| T1 | 180″ | delivery pipe | every 1800″ send to the server the average detected values in the interval in which one of the values is at least 200 volts |
| T2 | 180″ | return pipe | every 1800″ send to the server the average detected values in the interval in which one of the values is at least 200 volts |
| T3 | 180″ | air inlet | every 1800″ send to the server the average detected values in the interval in which one of the values is at least 200 volts |
| T4 | 180″ | air outlet | every 1800″ send to the server the average detected values in the interval in which one of the values is at least 200 volts |
| T5 | 10″ | motor case | every 1800″ send to the server the average detected values in the interval in which one of the values is at least 200 volts |
| v1 | 0.1″ | motor voltage | send voltage value to the server only if for at least 180″ v1 is greater than 0 and less than 200 volts |
| v2 | 0.1″ | motor voltage | send voltage value to the server only if for at least 180″ v1 is greater than 0 and less than 200 volts |
| v3 | 0.1″ | motor voltage | send voltage value to the server only if for at least 180″ v1 is greater than 0 and less than 200 volts |
| i1 | 0.05″/3″ | motor current | 0.05″ for the first 10′ from v1 equal to at least 200 volts (anti-unbalance)/3″ in normal operation/no fields-on if v1 < 200 volts/send to the server the integral of i1 ×dt on the range where v1 is at least 200 volts (power consumption control)/send to alarm server if i1 > 1.5 × i1 rated for more than 6″ |
| i2 | 0.05″/3″ | motor current | 0.05″ for the first 10′ from v2 equal to at least 200 volts (anti-unbalance)/3″ in normal operation/no fields-on if v2 < 200 volts/send to the server the integral of i1 × dt on the range where v2 is at least 200 volts (power consumption control)/send to alarm server if i2 > 1.5 × i2 rated for more than 6″ |
| i3 | 0.05″/3″ | motor current | 0.05″ for the first 10′ from v3 equal to at least 200 volts (anti-unbalance)/3″ in normal operation/no fields-on if v3 < 200 volts/send to the server the integral of i3 × dt on the range where v3 is at least 200 volts (power consumption control)/send to alarm server if i3 > 1.5 × i1 rated for more than 6″ |
Table 3.
Technical specifications of FC Motor FC 83M-2014/1.
| Model Number | V/HZ | Ampere | Num Speeds | Power | RPM |
|---|---|---|---|---|---|
| FC 83M-2014/1 | 230–240V/50 | 0.23 A | 4 | 14/53 W | 1100 |
Table 4.
FC Measured physical parameters.
| Measured Parameters | Formulas with Measuring Units |
|---|---|
| Real Power (RP) | RP (W) |
| Apparent Power (AP) | AP = Irms × Vrms (W) |
| Vrms | Rms Voltage (V) |
| Irms | Rms current (mA) |
| Estimated Power (EP) | EP = Irms × Vest (W) |
| Power Factor (PF) | PF = RP/AP (no units) |
| Temperature | Temperature (°C) |
| Frequency | Frequency (Hz) |
| RTD Temperature | Temperature (°C) |
Publisher’s Note: MDPI stays neutral with regard to jurisdictional claims in published maps and institutional affiliations. |
© 2021 by the authors. Licensee MDPI, Basel, Switzerland. This article is an open access article distributed under the terms and conditions of the Creative Commons Attribution (CC BY) license (https://creativecommons.org/licenses/by/4.0/).
Share and Cite
MDPI and ACS Style
Villa, V.; Naticchia, B.; Bruno, G.; Aliev, K.; Piantanida, P.; Antonelli, D. IoT Open-Source Architecture for the Maintenance of Building Facilities. Appl. Sci. 2021, 11, 5374. https://doi.org/10.3390/app11125374
AMA Style
Villa V, Naticchia B, Bruno G, Aliev K, Piantanida P, Antonelli D. IoT Open-Source Architecture for the Maintenance of Building Facilities. Applied Sciences. 2021; 11(12):5374. https://doi.org/10.3390/app11125374
Chicago/Turabian StyleVilla, Valentina, Berardo Naticchia, Giulia Bruno, Khurshid Aliev, Paolo Piantanida, and Dario Antonelli. 2021. "IoT Open-Source Architecture for the Maintenance of Building Facilities" Applied Sciences 11, no. 12: 5374. https://doi.org/10.3390/app11125374
Note that from the first issue of 2016, this journal uses article numbers instead of page numbers. See further details here.