
A Procedure to Prepare Sand–Clay Mixture Samples for Soil–Structure Interface Direct Shear Tests
by
 , ,
, ,
Kexin Yin
1,
Jiangxin Liu
2,* ,
,
Andreea-Roxana Vasilescu
3,
Eugenia Di Filippo
1,4 and
Khaoula Othmani
1 1
Institut de Recherche en Génie Civil et Mécanique (GeM), Ecole Centrale de Nantes, UMR 6183 CNRS, 1 Rue de la Noë, CEDEX 3, 44321 Nantes, France
2
Research Institute of Highway Ministry of Transport, Beijing 100088, China
3
PINTO SAS, 48 Rue Jules Verne, 35300 Fougères, France
4
Department of Civil and Environmental Engineering, University of Perugia, via G. Duranti, 93-06125 Perugia, Italy
*
Author to whom correspondence should be addressed.
Appl. Sci. 2021, 11(12), 5337; https://doi.org/10.3390/app11125337
Submission received: 26 May 2021
/
Revised: 7 June 2021
/
Accepted: 7 June 2021
/
Published: 8 June 2021
(This article belongs to the Section Civil Engineering)
Abstract
:A large number of experimental studies on sand–clay mixtures are well documented in the literature; however, the preparation protocol is rarely clearly detailed or varies a lot according to the authors. Variations in the preparation technique obviously increases the challenge of comparing different test results. As a consequence, sample preparation for sand–clay mixtures should be kept as constant as possible to ensure homogeneity and uniformity of samples and limit result variability. This paper develops a detailed procedure on how to prepare sand–clay samples for interface direct shear tests. Sand–clay mixtures are prepared with Fontainebleau sand, kaolinite clay and distilled water by the S1 (sand–water–clay) protocol. The uniformity of the reconstituted specimens is assessed by measuring the water content and density on three slices from the top to the bottom across the specimens. The repeatability of the samples is checked with oedometer and interface direct shear tests. This sample preparation procedure can be used for preparing sand–clay mixture for interface direct shear tests to investigate the influence of clay content or other effects (e.g., temperature) on the mechanical behavior of soil–structure interface. It has demonstrated great performance in preparing samples with good homogeneity and shape, compared to other traditional reconstitution techniques. With the sample preparation procedure, we can obtain repeatable test results as well.
1. Introduction
The behavior between soil and construction materials is of major concern in soil–structure interaction problems including deep foundations, retaining walls, nuclear waste disposal, heat storage, geothermal piles, cutoff structures, coal mine shaft failure, marine energy foundations, earth reinforcement, etc. [1,2,3,4,5,6,7,8,9,10]. The loading transfers from the structural component to the soil through a contact zone, called the interface, where significant strain localization occurs [11,12,13,14,15,16,17,18,19]. In fact, shear stresses and strains occur at the interface between the soil and the structure due to the difference in mechanical properties of the materials. Studying the characteristics of the soil–structure interface is important for researchers and practitioners, it therefore requires the characterization of parameters at the interface with appropriate laboratory or field tests to develop relevant constitutive models. Interface direct shear tests have often been adopted to study the behavior of soil–structure interfaces [14,17,20,21,22,23,24]. Several factors such as soil properties, materials, loading conditions, temperature effect, and surface roughness have been investigated to study their effects on the interface characteristics [7,13,17,18,22,25,26,27,28,29,30,31].
Natural clayey soils, containing gravel, sand, and silt or clay, have been studied both in situ and in the laboratory. The mechanical behavior of these soils is strongly affected by their intrinsic properties, especially heterogeneity, anisotropy, and the geological history among others [32,33,34,35]. The complexity of soil specimens can therefore sometimes lead to inconsistent testing results, which increases the challenge to determine a finite set of intrinsic parameters characterizing their main features.
Experimental and theoretical studies of soil behavior have often concentrated on ideal soils (pure clays or uniform sands), and soil mechanics have mainly been developed based on the test results of pure sand or pure clay [7,13,17,18,23,36]. However, as mentioned above, natural soils usually consist of coarse granular grains in a matrix of silt or clay. To better understand the mechanical behavior of natural soils, simplified and controlled soils are often used in laboratory testing instead of natural ones. The simplified soils can be reconstituted sand–clay mixtures with fabric similar to natural soils. The properties of such simplified mixtures are, thus, expected to be intermediate or transitional between the properties of the constituent materials (i.e., sand and clay).
Although there are a lot of studies on sand–clay mixtures [37,38,39,40,41,42] and on the interface for typical sand or clay [7,8,9,14,17,19], there is a lack of data on the interface mechanical behavior between sand–clay mixtures and structure materials. Particularly, information is missing on how the clay content influences the interface direct shear behavior, i.e., shear strength, volumetric deformation, interface friction angle, adhesion, etc., and how the particles arrangement changes with changes in the clay content. These questions are significant for geotechnical engineering design since they play a critical role in the bearing capacity, the deformation and the failure of foundations [17,43,44], therefore implementing interface direct shear tests on sand–clay mixtures with different clay content is necessary to better understand natural soil–structure interface problems.
Sample preparation is a key factor that influences the mechanical behavior of reconstituted soils in laboratory experiments [33,45,46,47,48,49,50]. This effect becomes more prominent for sand–clay mixture samples due to the clay fraction within the mixture. A high diversity of sample preparation methods is available in the literature [45,46,51,52,53,54,55], such as dry pluviation [49,55,56], dry tamping [7,8,9,57,58], wet tamping [55,59,60], and slurry deposition [45,46,47,48,51,52,53]. The slurry deposition method can overcome the inherent problems of the other sample preparation methods, it can create homogeneous saturated sand or sand–silt/clay samples with respect to void ratio and particle size distribution [52]. In addition, soil sample is easy to be replicated by the slurry deposition technique, possessing similar fabric to natural soils at the same time.
To our knowledge, so far in geotechnical studies, there is a clear lack of detailed procedures for the sample preparation of sand–clay mixtures, especially for interface direct shear tests. This paper presents a detailed procedure on how to prepare sand–clay samples for interface direct shear tests. This sample preparation procedure can be used to reconstitute clay samples for interface as well. It can provide samples with good homogeneity and shape, and ensure repeatable test results.
2. Materials
2.1. Fontainebleau Sand
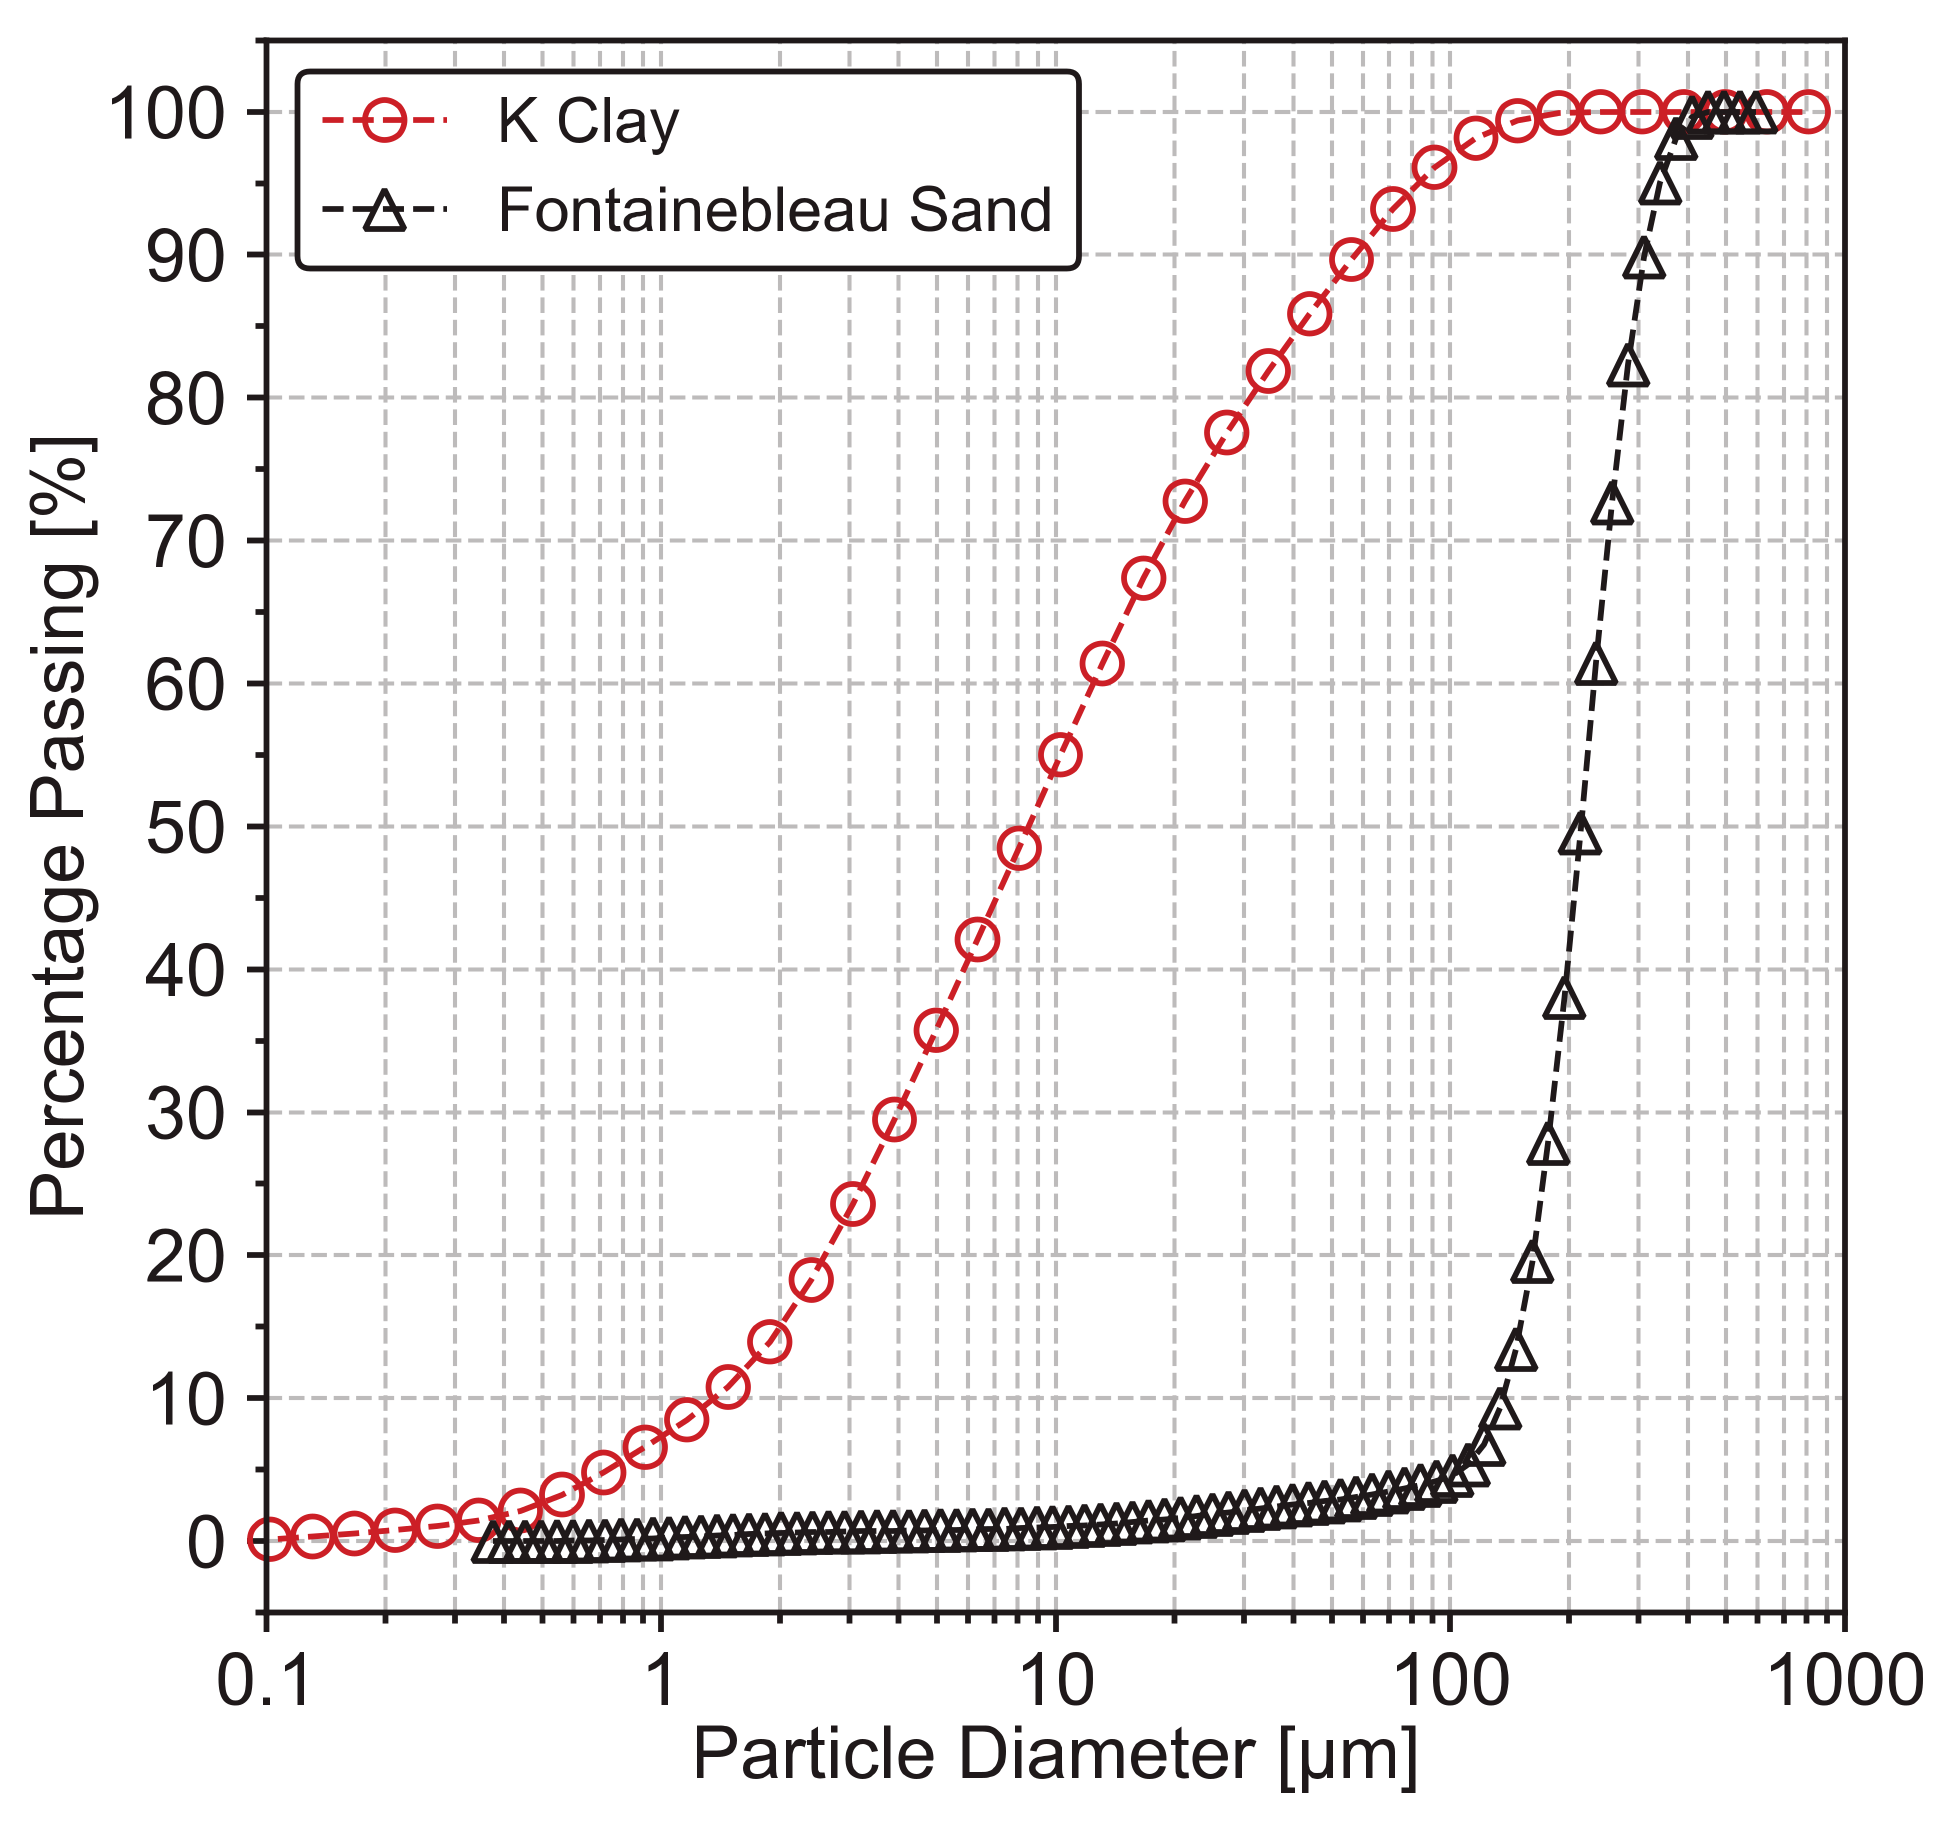
Fontainebleau sand NE34 was selected to prepare the sand–clay mixture samples, this is widely used in many geotechnical researches in the laboratory [7,8,9,13,61]. Fontainebleau sand NE34 is composed of 99% quartz [8,9,62]. The grain size distribution of the Fontainebleau sand is presented in Figure 1. It is characterized with a mean grain size (d50) of 0.21 mm, a coefficient of uniformity (Cu) of 1.72. The maximum and minimum void ratios of this sand are equal to 0.866 and 0.545, respectively [57].
2.2. Kaolinite Clay
An industrial kaolinite clay from Argeco company (Fumel, France) was used to prepare the sand–clay mixtures. The kaolin used in this study corresponds to the clay material K3 in [63], it contains 55% of pure kaolinite minerals [57,63,64]. The chemical composition is summarized in Table 1, according to the XRD results from [63]. Minerals other than kaolinite are essentially small quartz, calcite, and others in small amounts (Table 1). The grain size distribution of this clay is also presented in Figure 1. The mean grain size d50 of the clay is 8.56 μm [57].
3. Reconstitution Procedure
3.1. Mixing Protocol of Sand and Clay
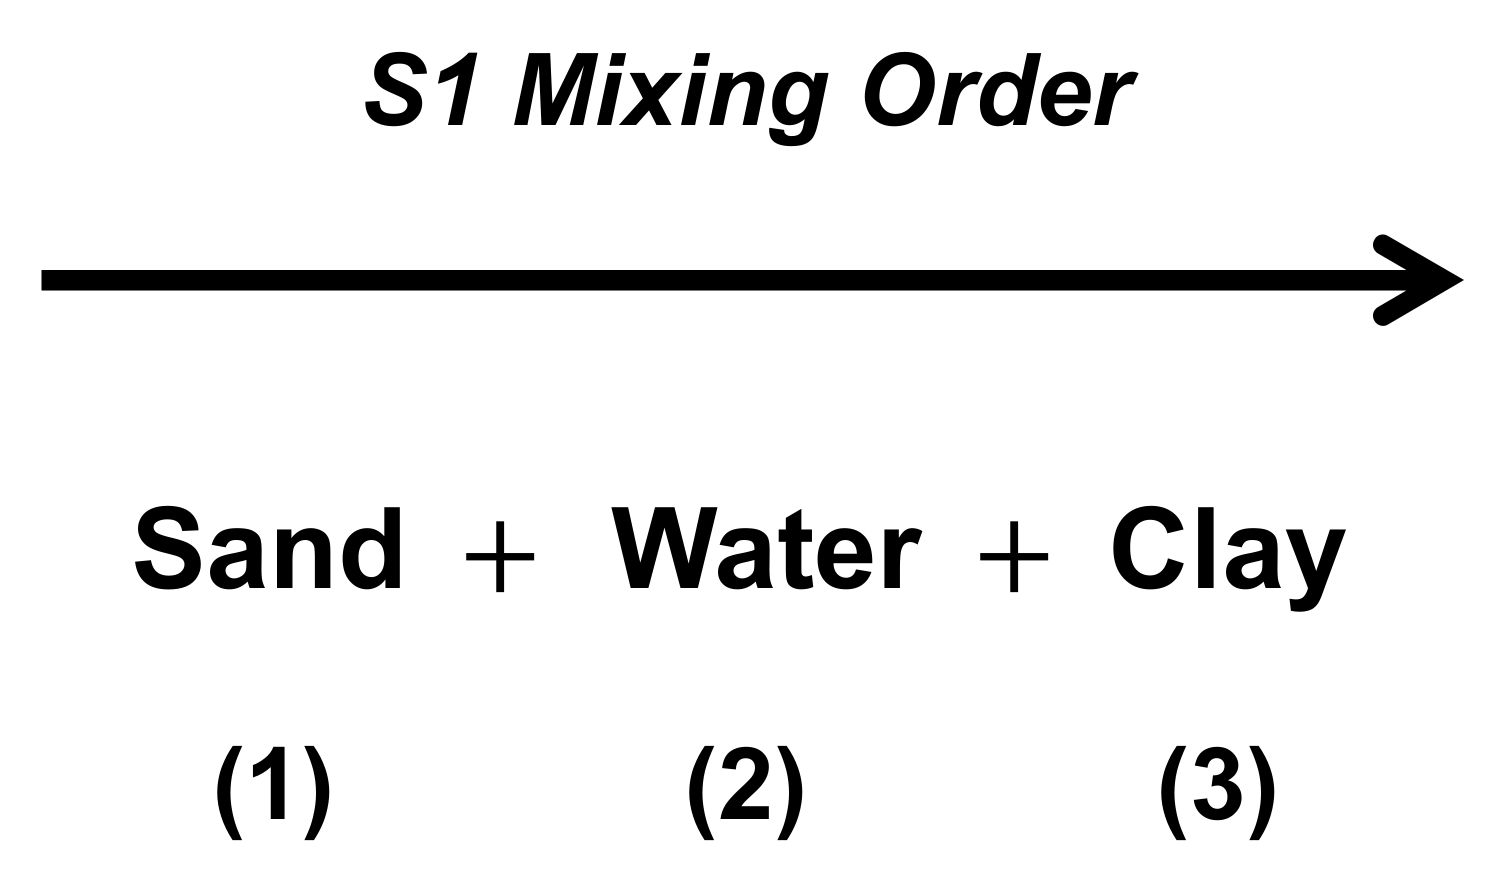
A sand clay mixing protocol named S1 was utilized to prepare the sand–clay mixture slurry. As illustrated in Figure 2, the S1 protocol consists of mixing dry Fontainebleau sand, dry clay, and distilled water in the order of sand-water-clay. Sand–clay mixture samples were prepared with different clay content by weight. The initial water content (w0) for mixing was 1.5 times of the liquid limit (wL) of the sand–clay mixture at each clay content. The liquid limit values as a function of clay content are detailed in Table 2. These were obtained using the Casagrande apparatus in the laboratory. During mixing, the dry clay powder was added progressively into the sand–water mixture, by 5 to 10 g per step and then mixing for 1 min. After adding all clay, the slurry samples were mixed by rotating a stirring glass stick in a container for 10 min until visual homogenization. After mixing, the sand–clay mixture slurry specimens were placed in a vacuum device for 1 h to remove the potential air bubbles inside. This S1 mixing order can provide homogeneous samples from macro-to microstructure, which has been verified before [57,61].
3.2. Requirements of the Sample Preparation for the Shear Box
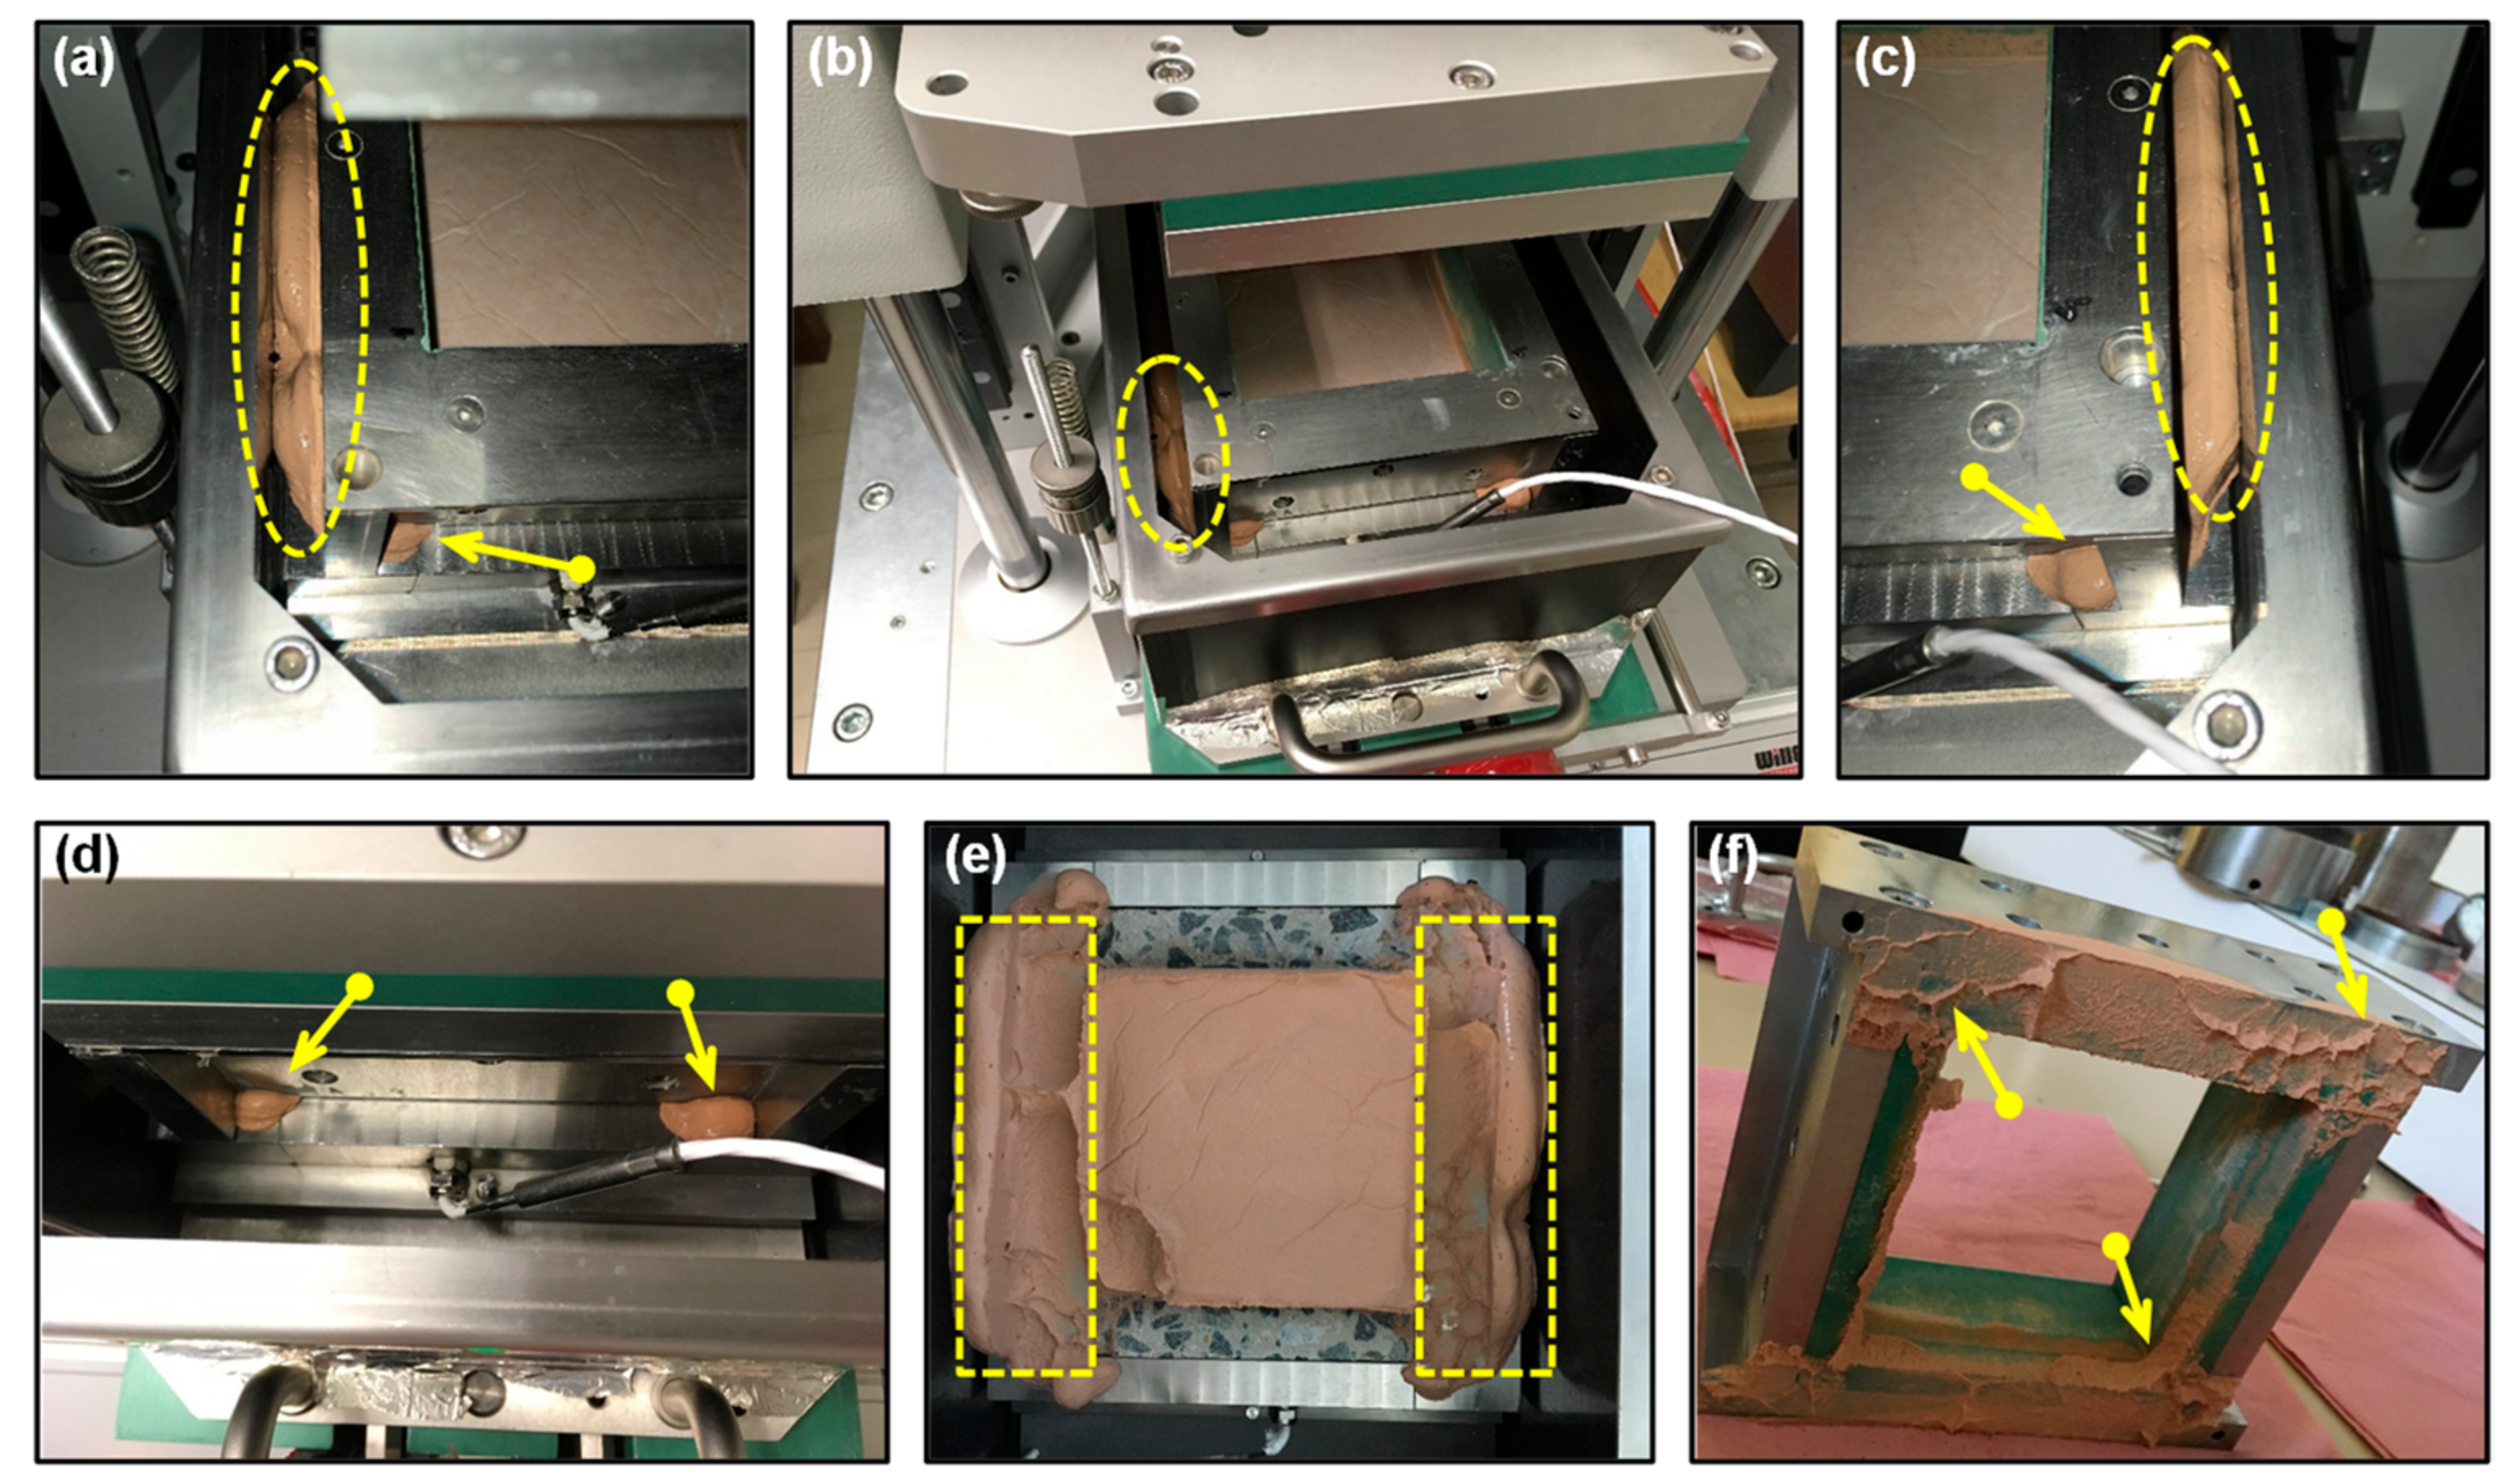
The dimensions of the reconstituted sand–clay mixture samples should have definite restrictions due to the dimensions and shape of the interface direct shear box. In this paper, the required dimension (100 mm × 100 mm) of the sand–clay mixture sample was quite large in comparison to those in classical direct shear tests (e.g., 60 mm × 60 mm). Particular attention must be taken during sample preparation to avoid working with unconsolidated soil samples, which may lead to leakages from the space (0.1~0.6 mm) between the upper and bottom parts of the shear box (see Figure 3). The sample must be preconsolidated before putting it into the shear box, it must be the least viscous possible and must have a planar surface for the piston to stay correctly in contact with it. Moreover, the sample must be as homogeneous as possible.
All these requirements necessitate a non-trivial protocol for the sample preparation. Three different mixing orders of the soil components were studied. Also, considering the large size of the sample (100 mm × 100 mm), a sufficiently large cylindrical consolidometer cell had to be developed (with a diameter at least of 141.42 mm) to ensure proper preconsolidation.
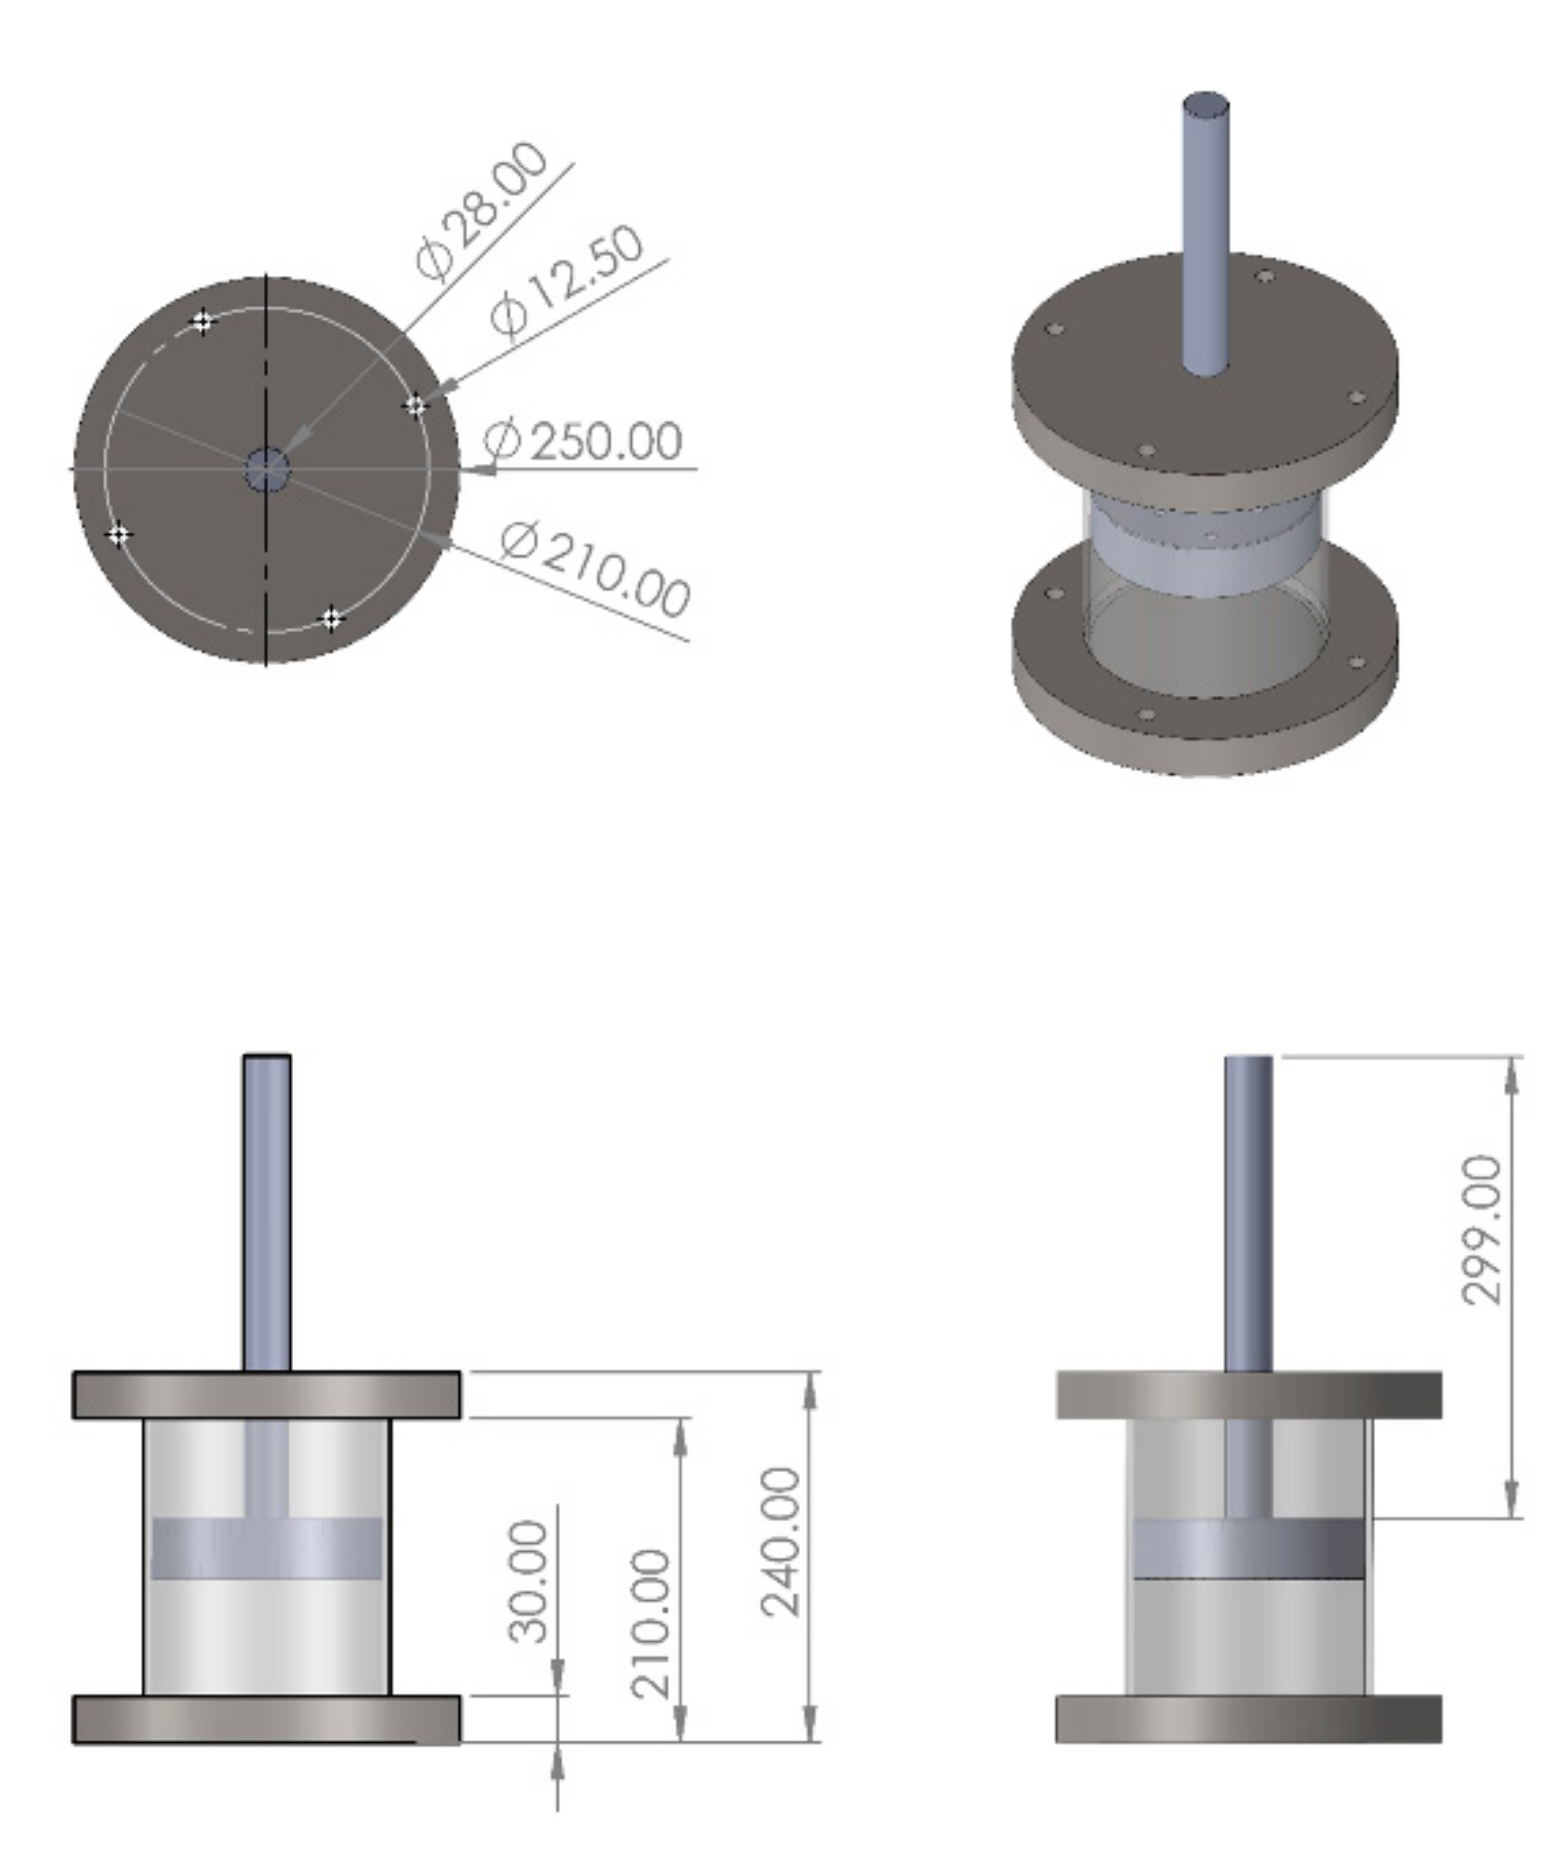
The oedometer test was first performed, then the specimen was trimmed and put into the direct shear device. In our case, it was not possible to use the sample with the same shape for both preconsolidation and interface tests, the sample should be trimmed to fit the interface direct shear box. The conventional cylindrical oedometer cell (with a diameter of 70 mm) is smaller than the squared interface shear box (100 mm × 100 mm). A new cylindrical cell was thus required, having a larger diameter than the diagonal of the shear box. A new oedometer cell was designed and manufactured for the sample preconsolidation, as shown in Figure 4. The designed oedometer cell consisted of a piston with small holes (7 mm in diameter), a cylindrical cell of stainless steel, two porous stone discs, a cap, and a base. These parts were fixed with some bolts after installation. The inside diameter of the cell was 150 mm, which is larger than the squared shear box diagonal (141.42 mm). The other details and dimensions of the designed preconsolidation cell can be referred to in Yin [57].
This cell was calibrated with an oedometer test on Fontainebleau sand. The results were compared and validated with the test results of the classical standard oedometric cell. The validation showed that the cell worked well and had consistent results with the classical cell.
3.3. Preconsolidation and Sample Cutting
To reconstitute sand–clay mixture samples with good uniformity for the interface direct shear box, the S1 mixing order was chosen as mentioned above. After the sand, distilled water, and clay were mixed into a slurry with the S1 protocol, the slurry samples were subjected to a preconsolidation process where constant normal loadings were applied on the sample step by step. Once having experienced a preconsolidation phase in the designed oedometer cell (Figure 4 and Figure 5b,c), the sand–clay mixture specimen was consolidated into a solid phase (Figure 5d).
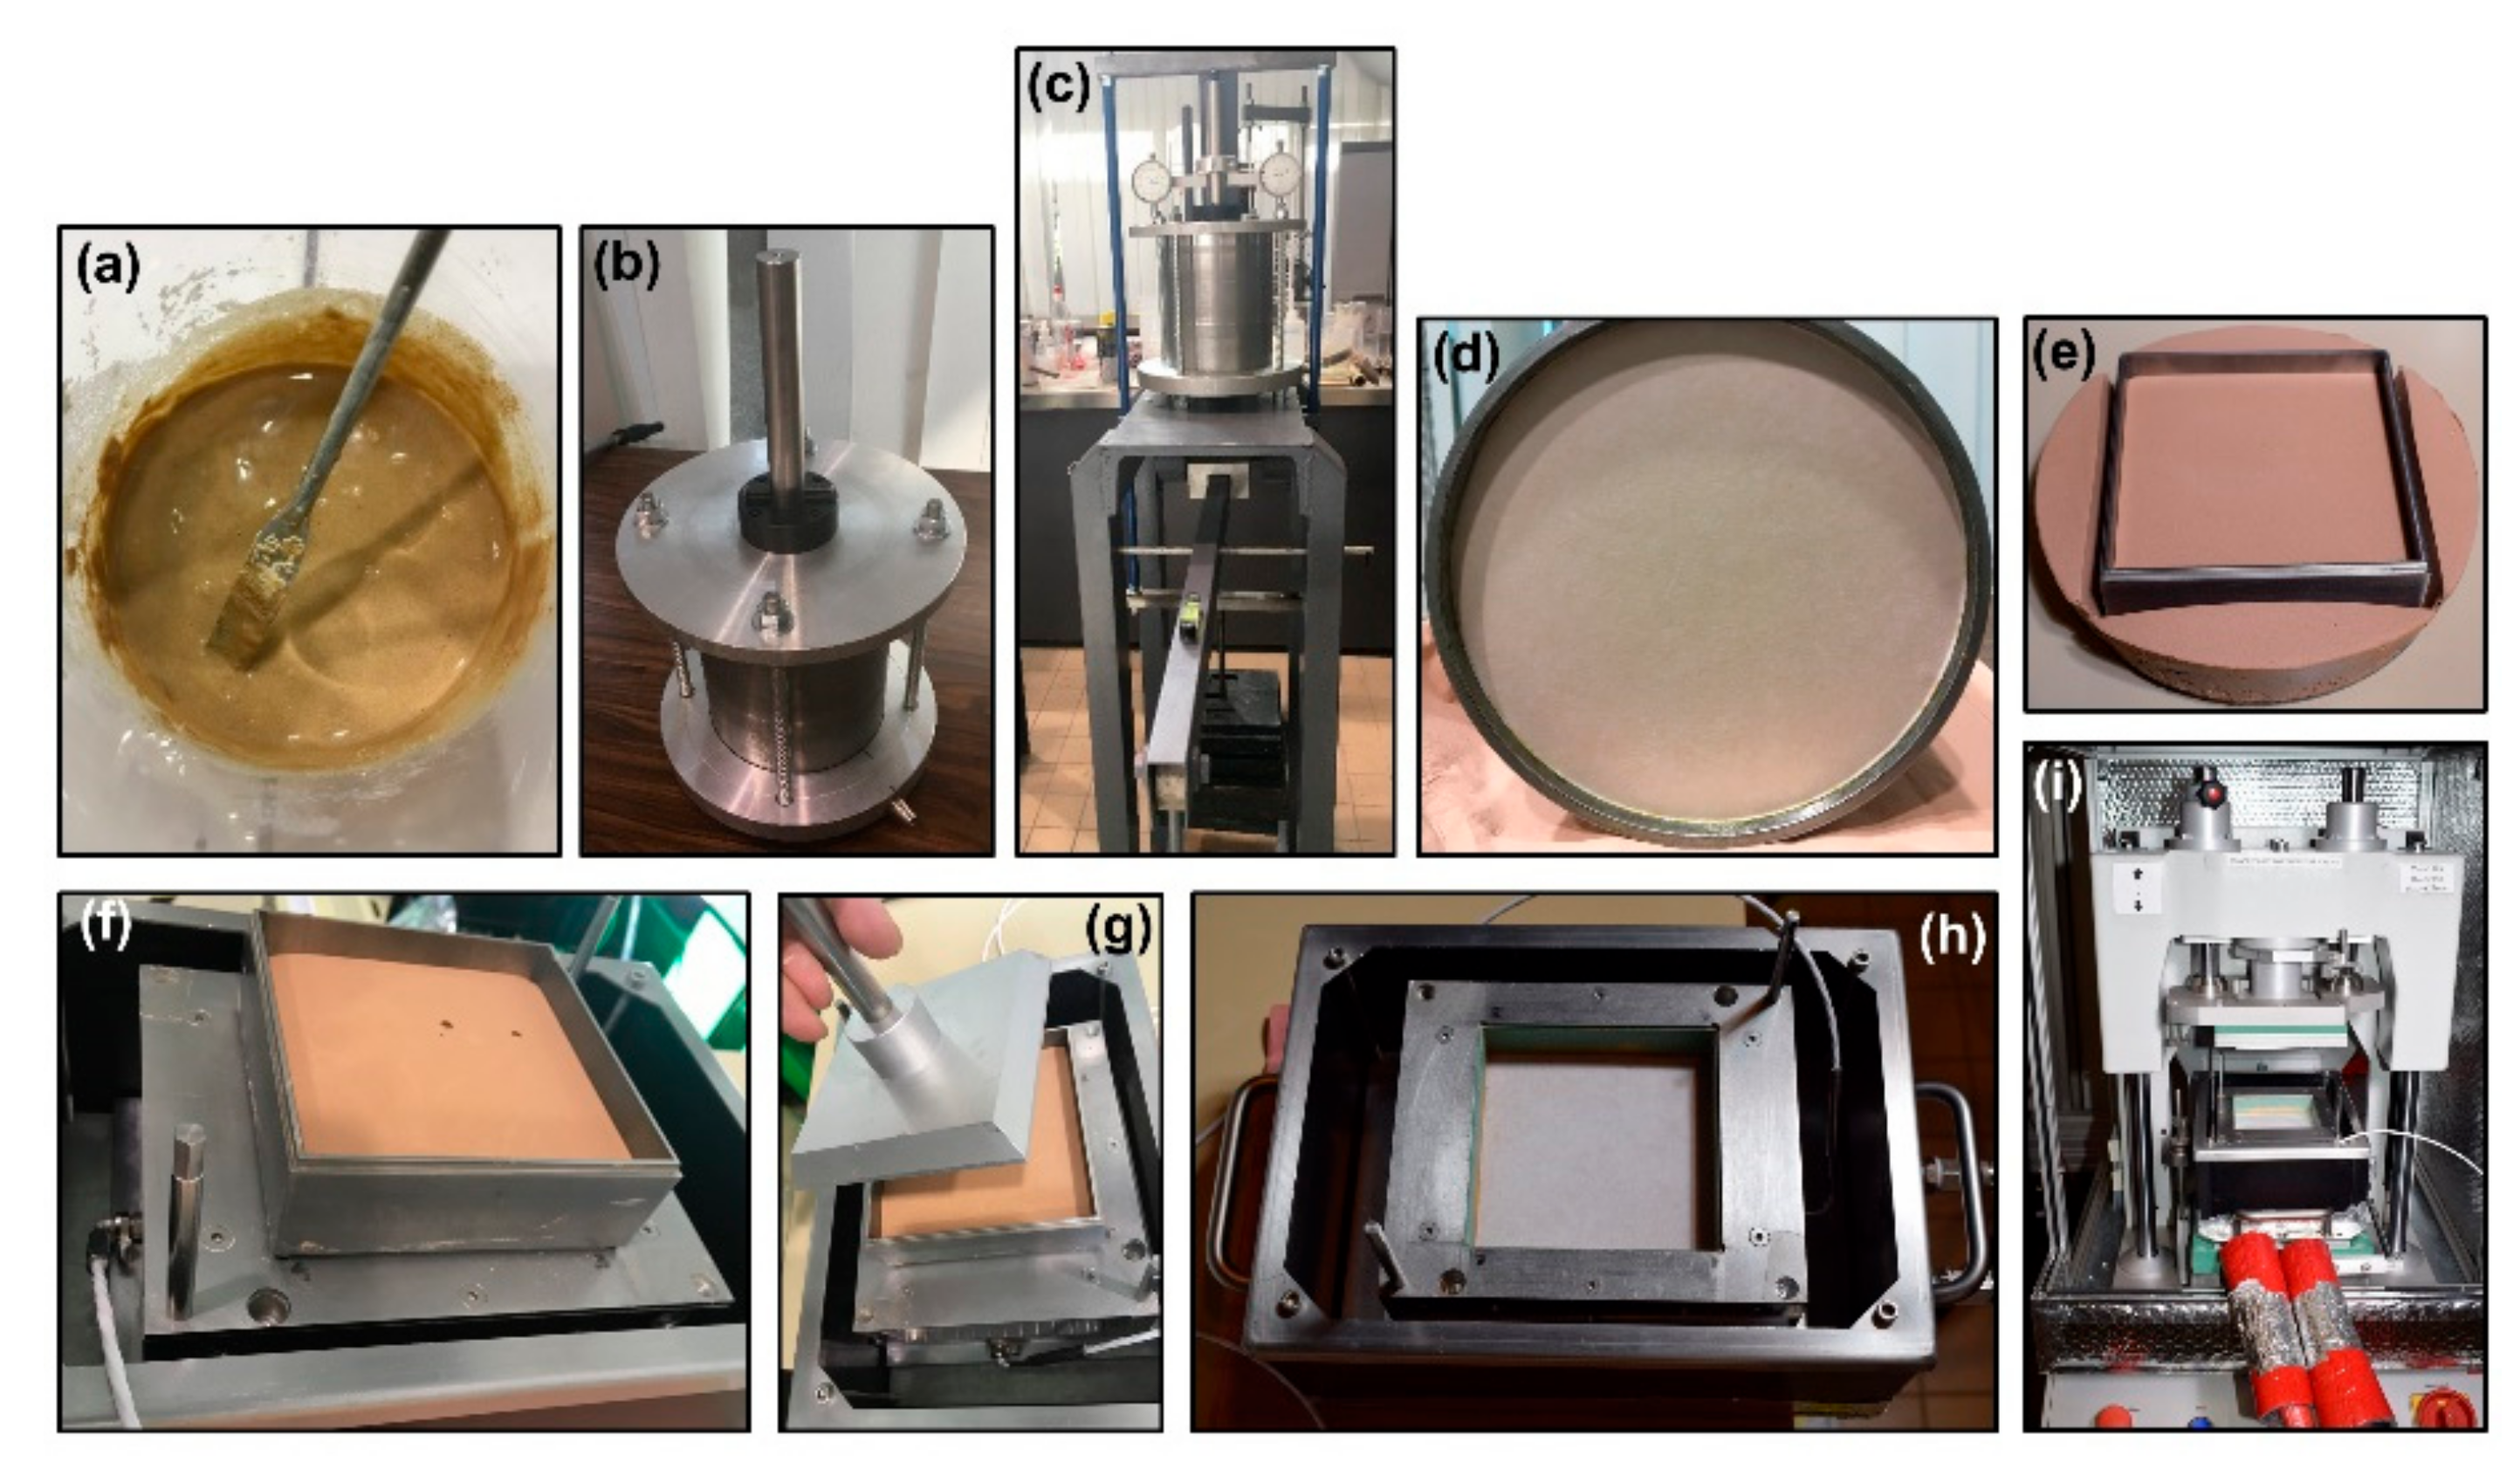
The whole sample preparation procedure is illustrated in Figure 5 and detailed hereafter. Fontainebleau sand, clay and distilled water were mixed with S1 mixing protocol (sand-water-clay at 1.5 wL). After the sample mixing and a vacuum process, it was transferred to the oedometer cell with two porous stone discs lying on the top and bottom, respectively. Each porous stone was pasted with a filter paper on its surface, and both the two stones and filter paper were saturated with distilled water in advance. Then the cell was installed on an oedometer frame, the normal loading steps were 5.59 kPa (weight of frame and piston), 25 kPa, 37.5 kPa, and 50 kPa. A subsequent loading step could be started after the vertical deformation of the sample in previous step is stable. Generally, the consolidation time for each step should last at least 24 h.
When the final preconsolidation phase ends, a trimming tool was needed for trimming the preconsolidated sample down to the dimensions of the shear box with a minimum of disturbance on the specimen. Thus, a trimming cutter was designed with the same size (100 mm × 100 mm) as the upper shear box of the interface direct shear machine. This cutter has a sharp edge, a highly polished surface, and had been coated with a low-friction material for corrosion prevention (Figure 5e,f). Alternatively, a trimming platform or working table is also preferable for cutting the sand–clay mixture sample. During cutting, the cutter must be aligned appropriately to keep the specimen with precisely the same dimension as the shear box. The water content and sample mass were measured at this step with an oven and a balance.
With the help of a squared aluminum rod (Figure 5g), the sample was moved to the interface shear box, flattening the surface and adding a piece of filter paper, then measuring the initial height of the sample. Finally, the shear box was set within the container, then installed in the interface direct shear machine, and the following test was performed (Figure 5g,h). The S1 order (sand-water-clay), plus the preconsolidation cell that was used to prepare sand–clay mixture samples, is called the S1 protocol hereafter.
4. Assessment of Sample Uniformity
4.1. Water Content
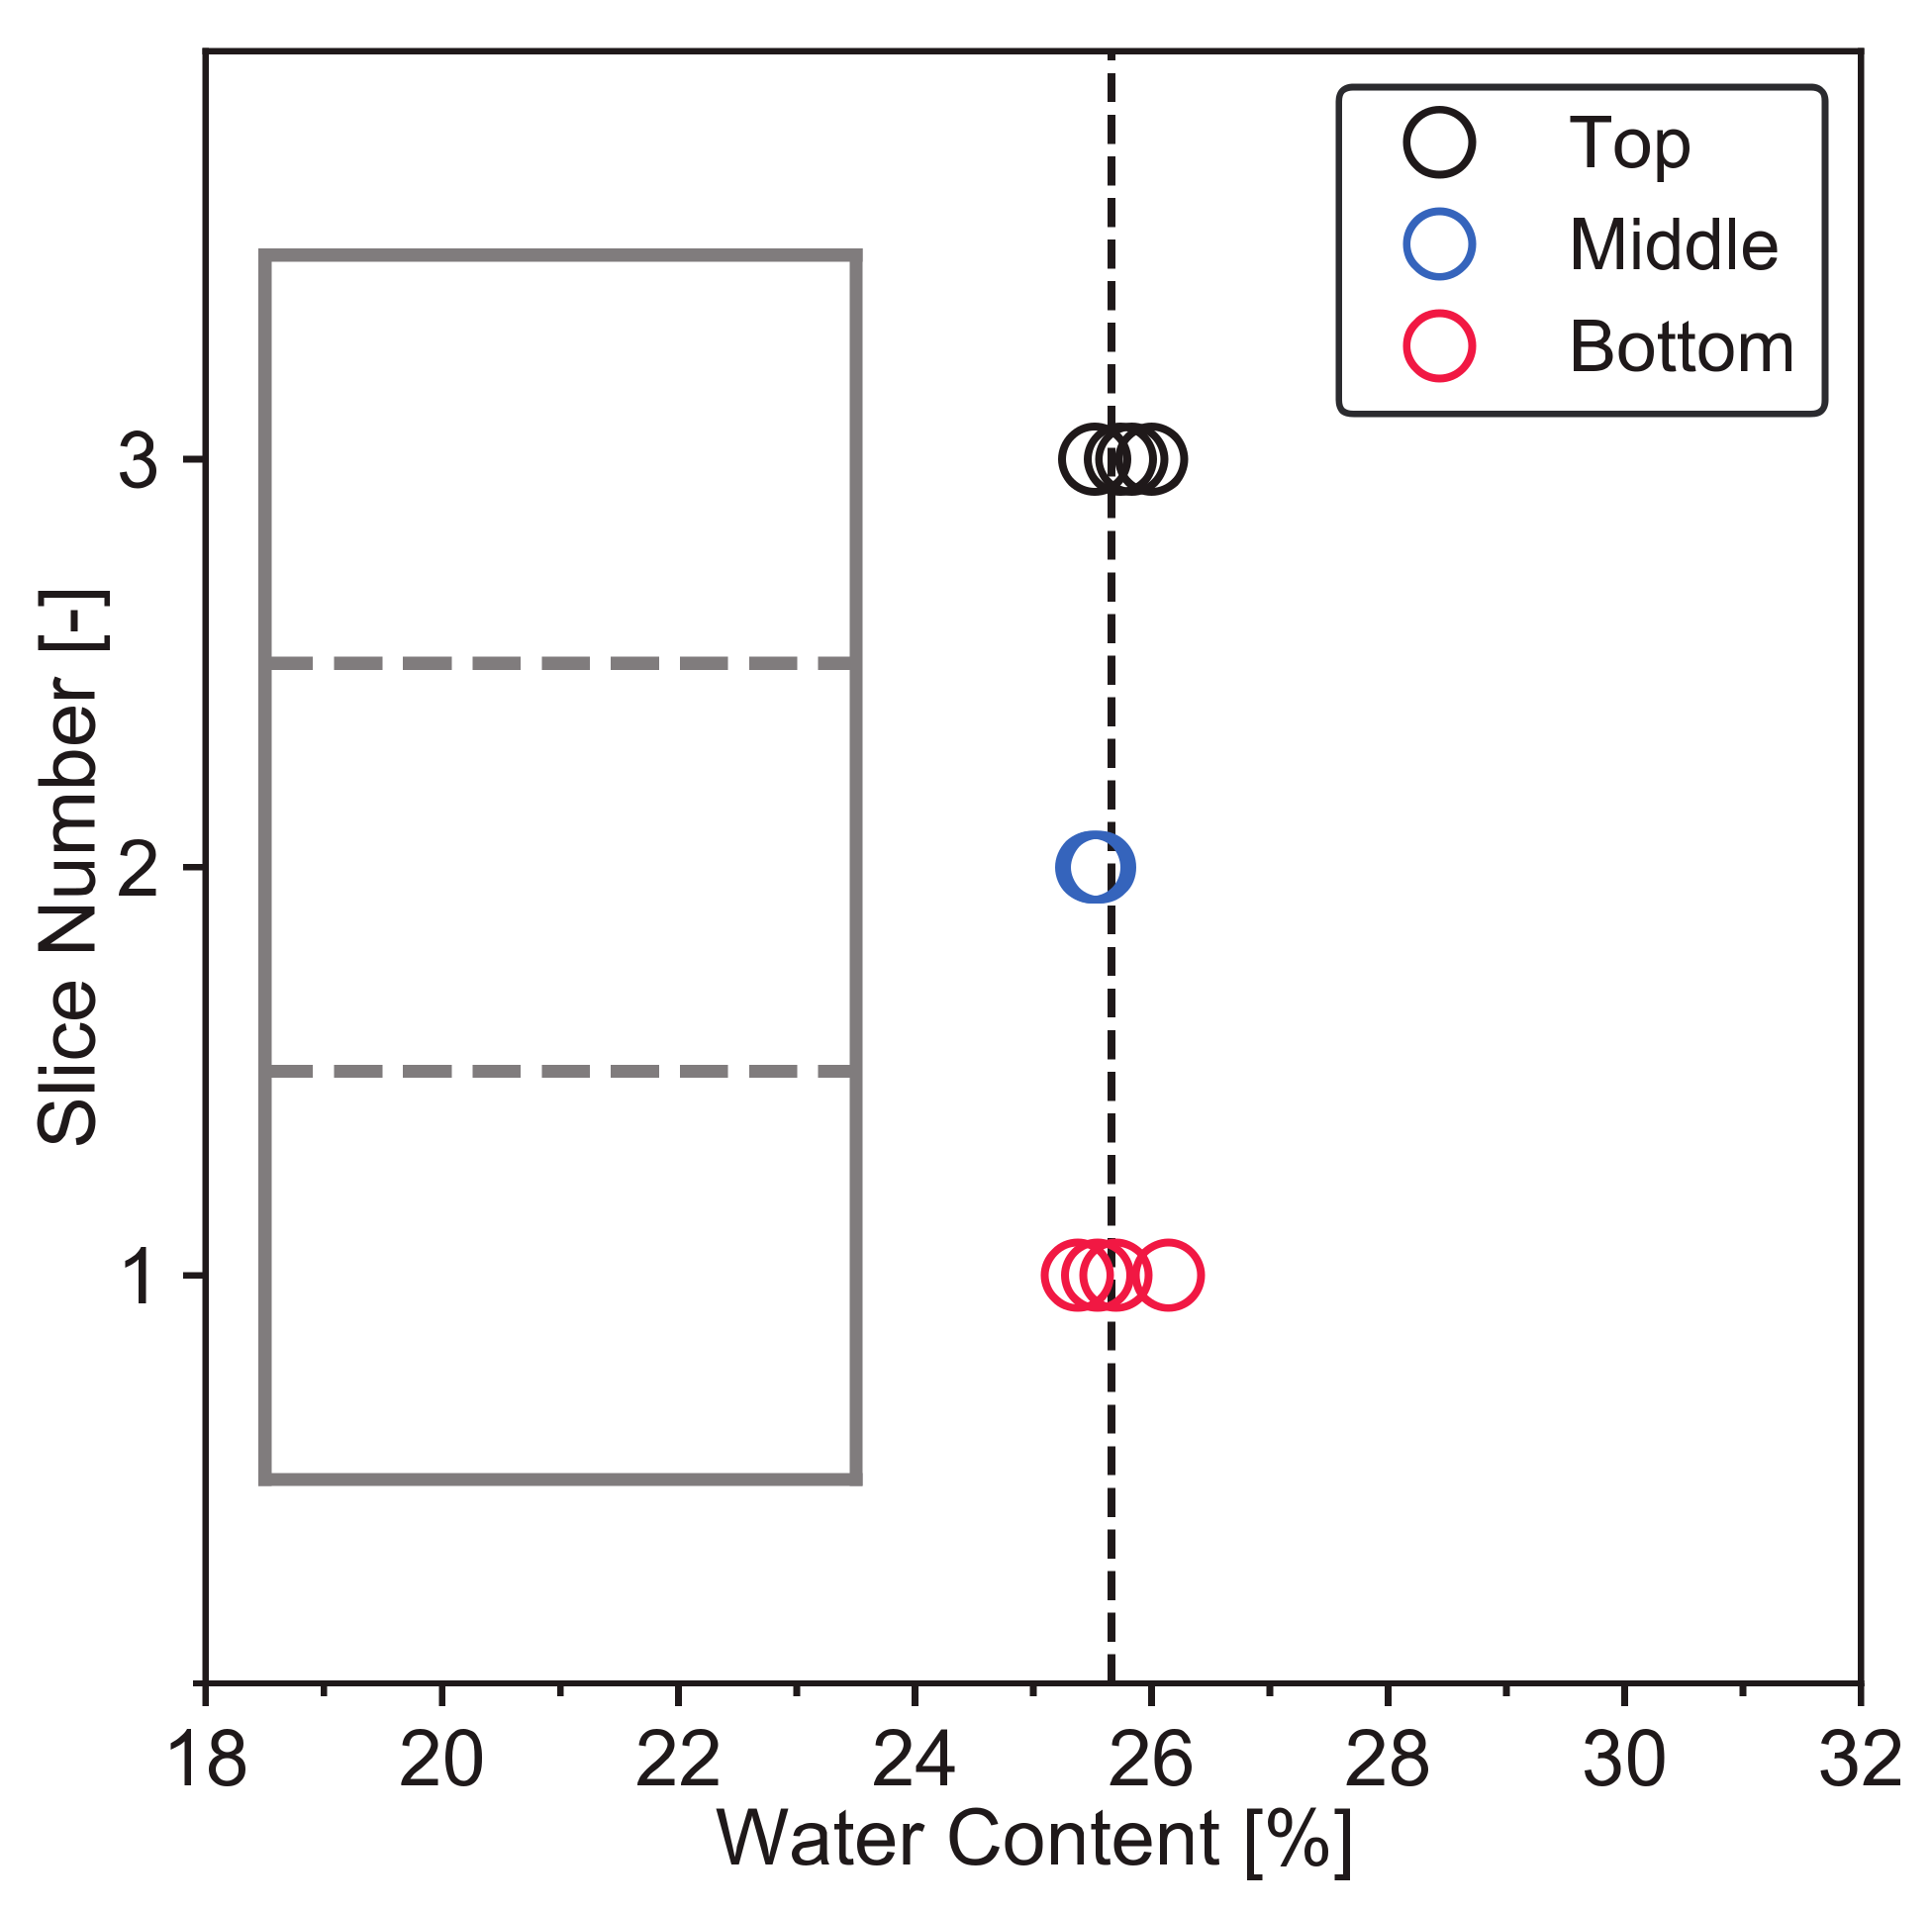
To check whether the water was homogeneously distributed inside the specimen, a sand–clay mixture sample with 75% clay content was prepared by the S1 protocol. The uniformity of the sample can be evaluated by the water content (w). After the S1 preconsolidation was finished, the sand–clay mixture sample was cut into three slices, i.e., bottom, middle, and upper slices. Each slice was cut into four parts, the water content of each part was measured, finally, there were four points of water content on each slice, see Figure 6.
It can be seen from Figure 6 that the water content throughout the sand–clay specimen was identical and the specimen was homogeneous. From the top slice to the bottom slice, the maximum difference (Δw) in average water content throughout the three slices was only 0.25%, which is much lower than the Δw in [47] (1.02%) and in [48] (1.12%, 1.15% and 1.20%). In terms of the water content, we can conclude that the void ratio (e) of the sand–clay mixture prepared by the S1 protocol was extremely uniform throughout the specimen. This is due to the void ratio being revealed by the water content if the samples are fully saturated [47,48].
4.2. Sample Density
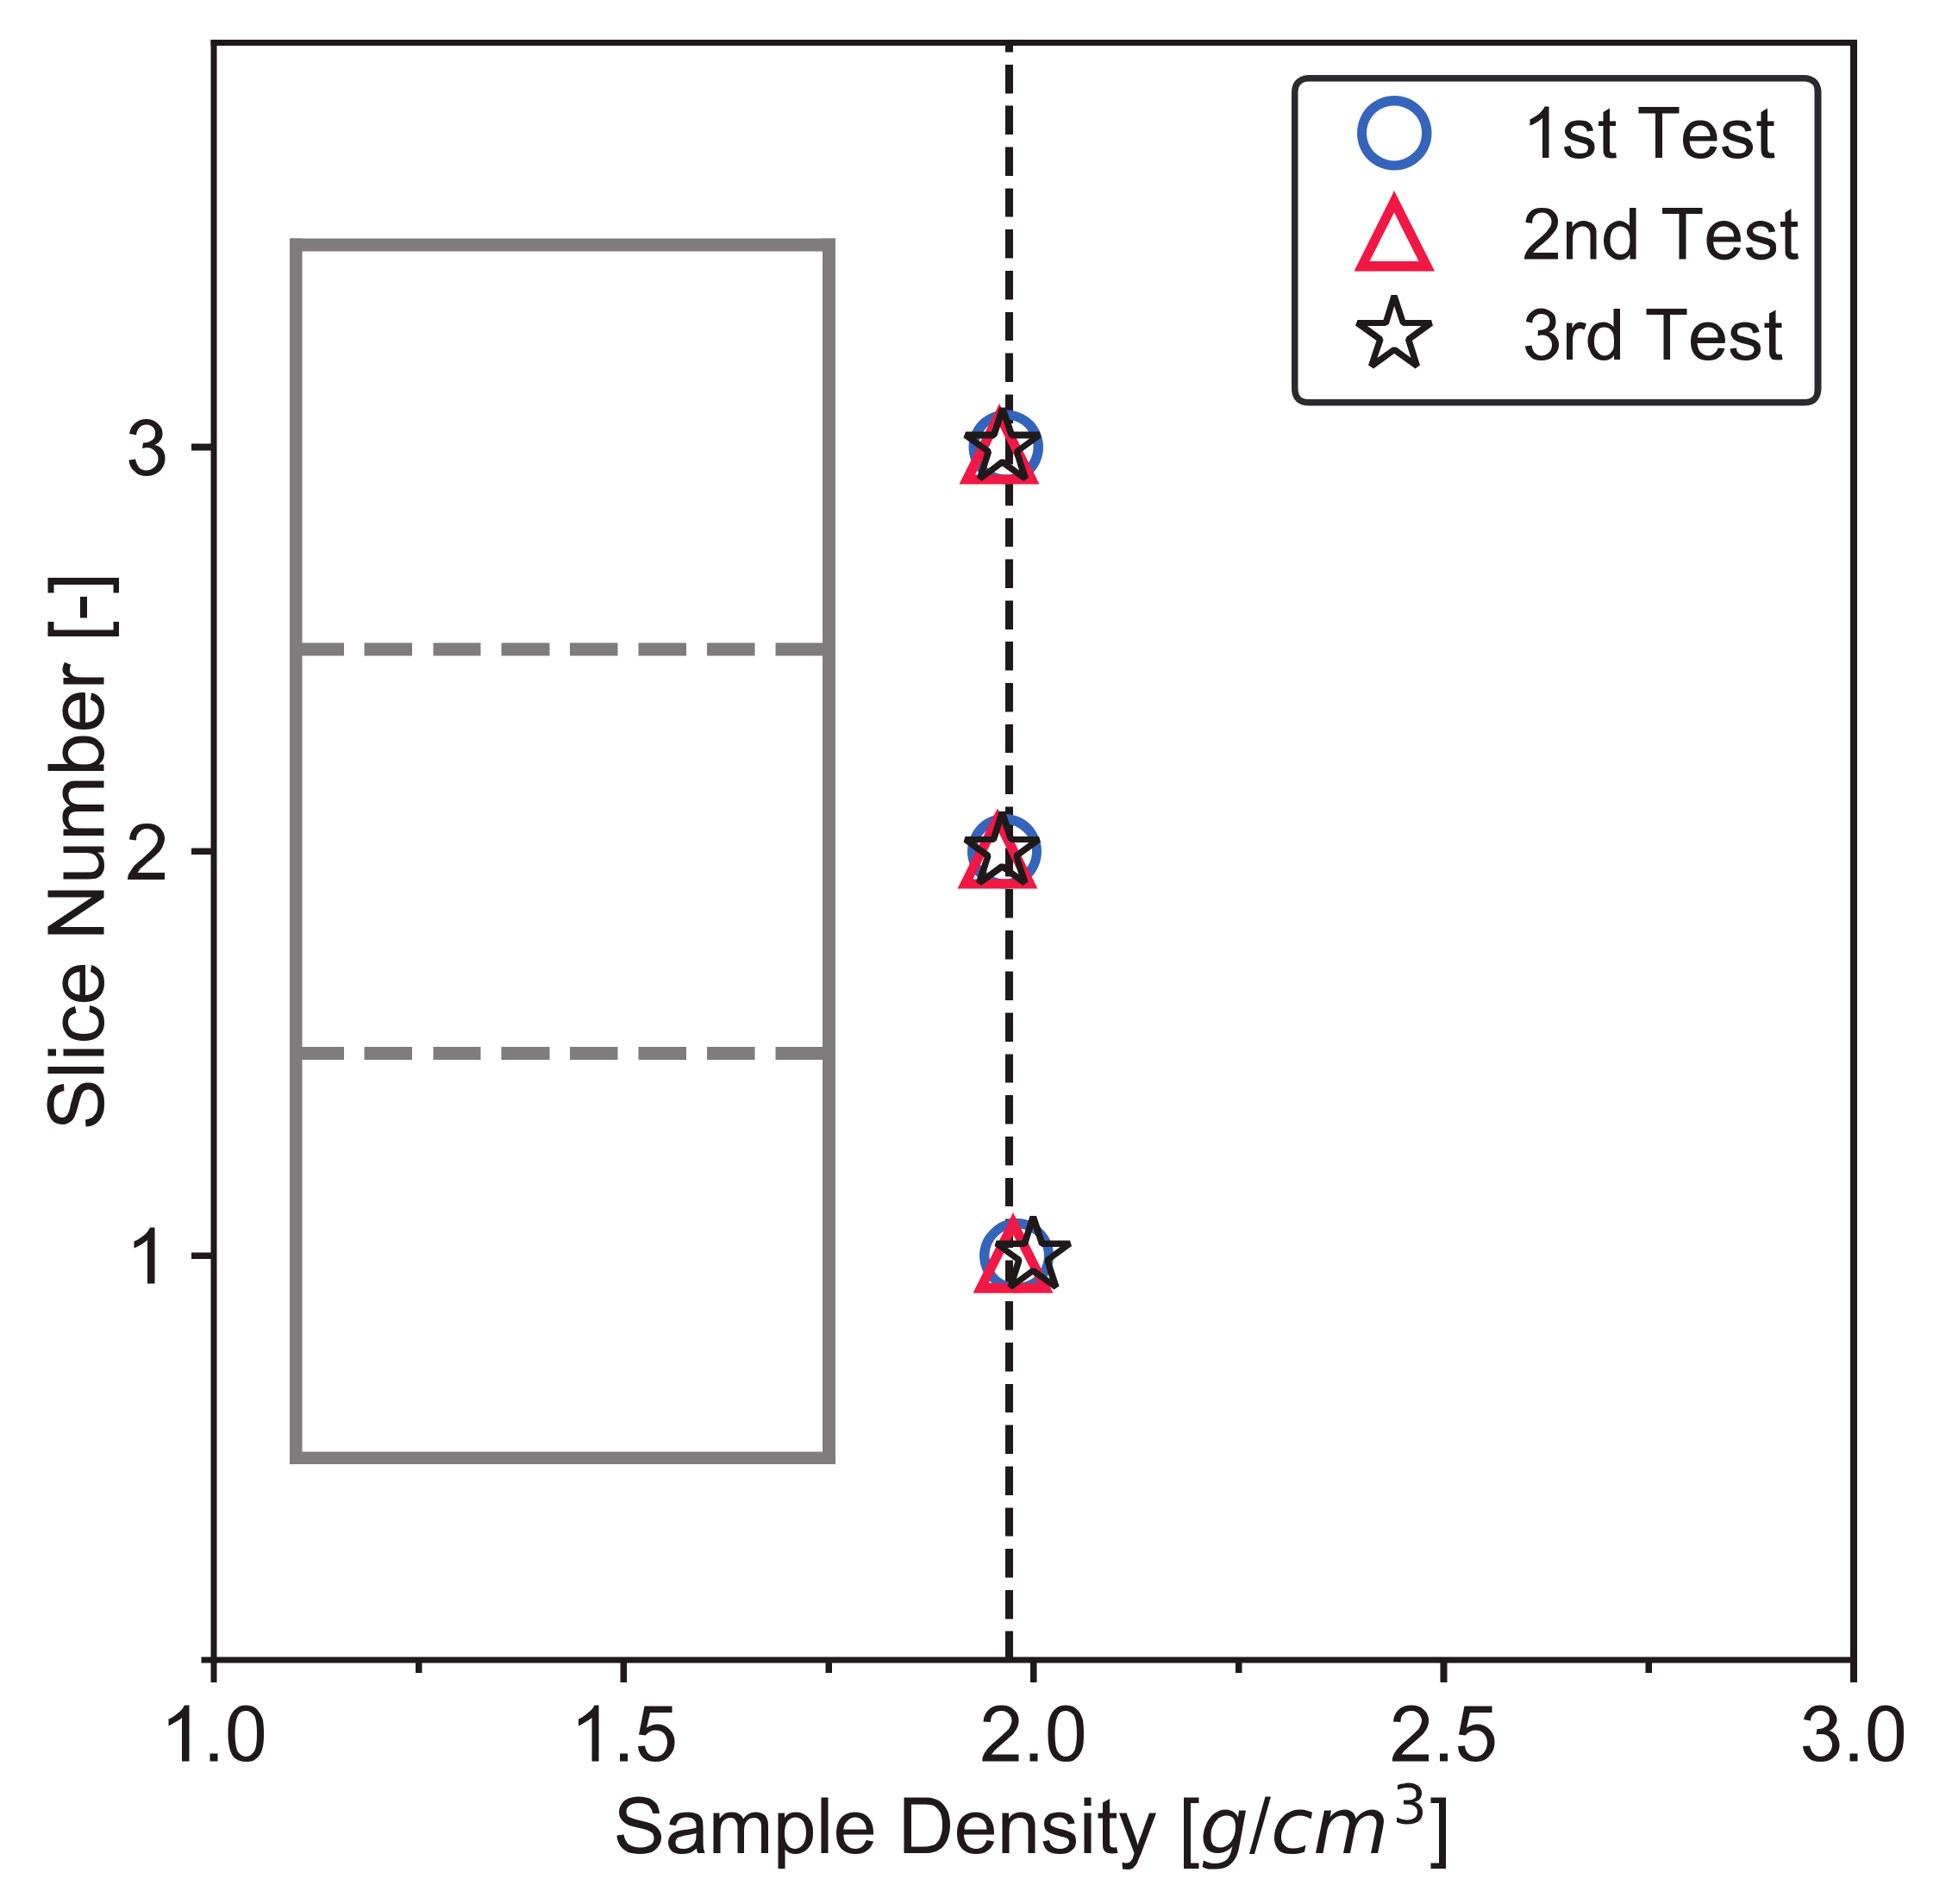
The uniformity of the S1 samples was also verified by the density (ρa) measurement in different slices from top to bottom. Three sand–clay mixture samples with 75% K clay were prepared by the S1 method. Figure 7 shows the density of each slice for the three samples. From the top to the bottom, the average density ranks as 1.96, 1.96, and 1.98 g/cm3, respectively. This small difference is attributed to the fact that the bottom zone of the sand–clay mixture specimen is consolidated more sufficiently due to a shorter path for water drainage. Moreover, the small difference (i.e., 0.02 g/cm3) indicates that the consolidation time (about 24 h for each loading step) is enough to obtain a uniform specimen.
5. Assessment of Samples’ Repeatability
After checking the water content and density in sand–clay mixture specimens of 75% K clay content, the average water content, void ratio, and density of the whole samples at different K clay contents (from 0% to 100%) were measured to check the repeatability of the sample preparation. The oedometer and interface direct shear tests were selected to further verify the ability of the S1 protocol for preparing identical sand–clay mixture samples. The K clay contents of the specimens for oedometer and interface direct shear tests were 50% and 75%, respectively.
5.1. Water Content, Void Ratio and Density after Sample Preparation
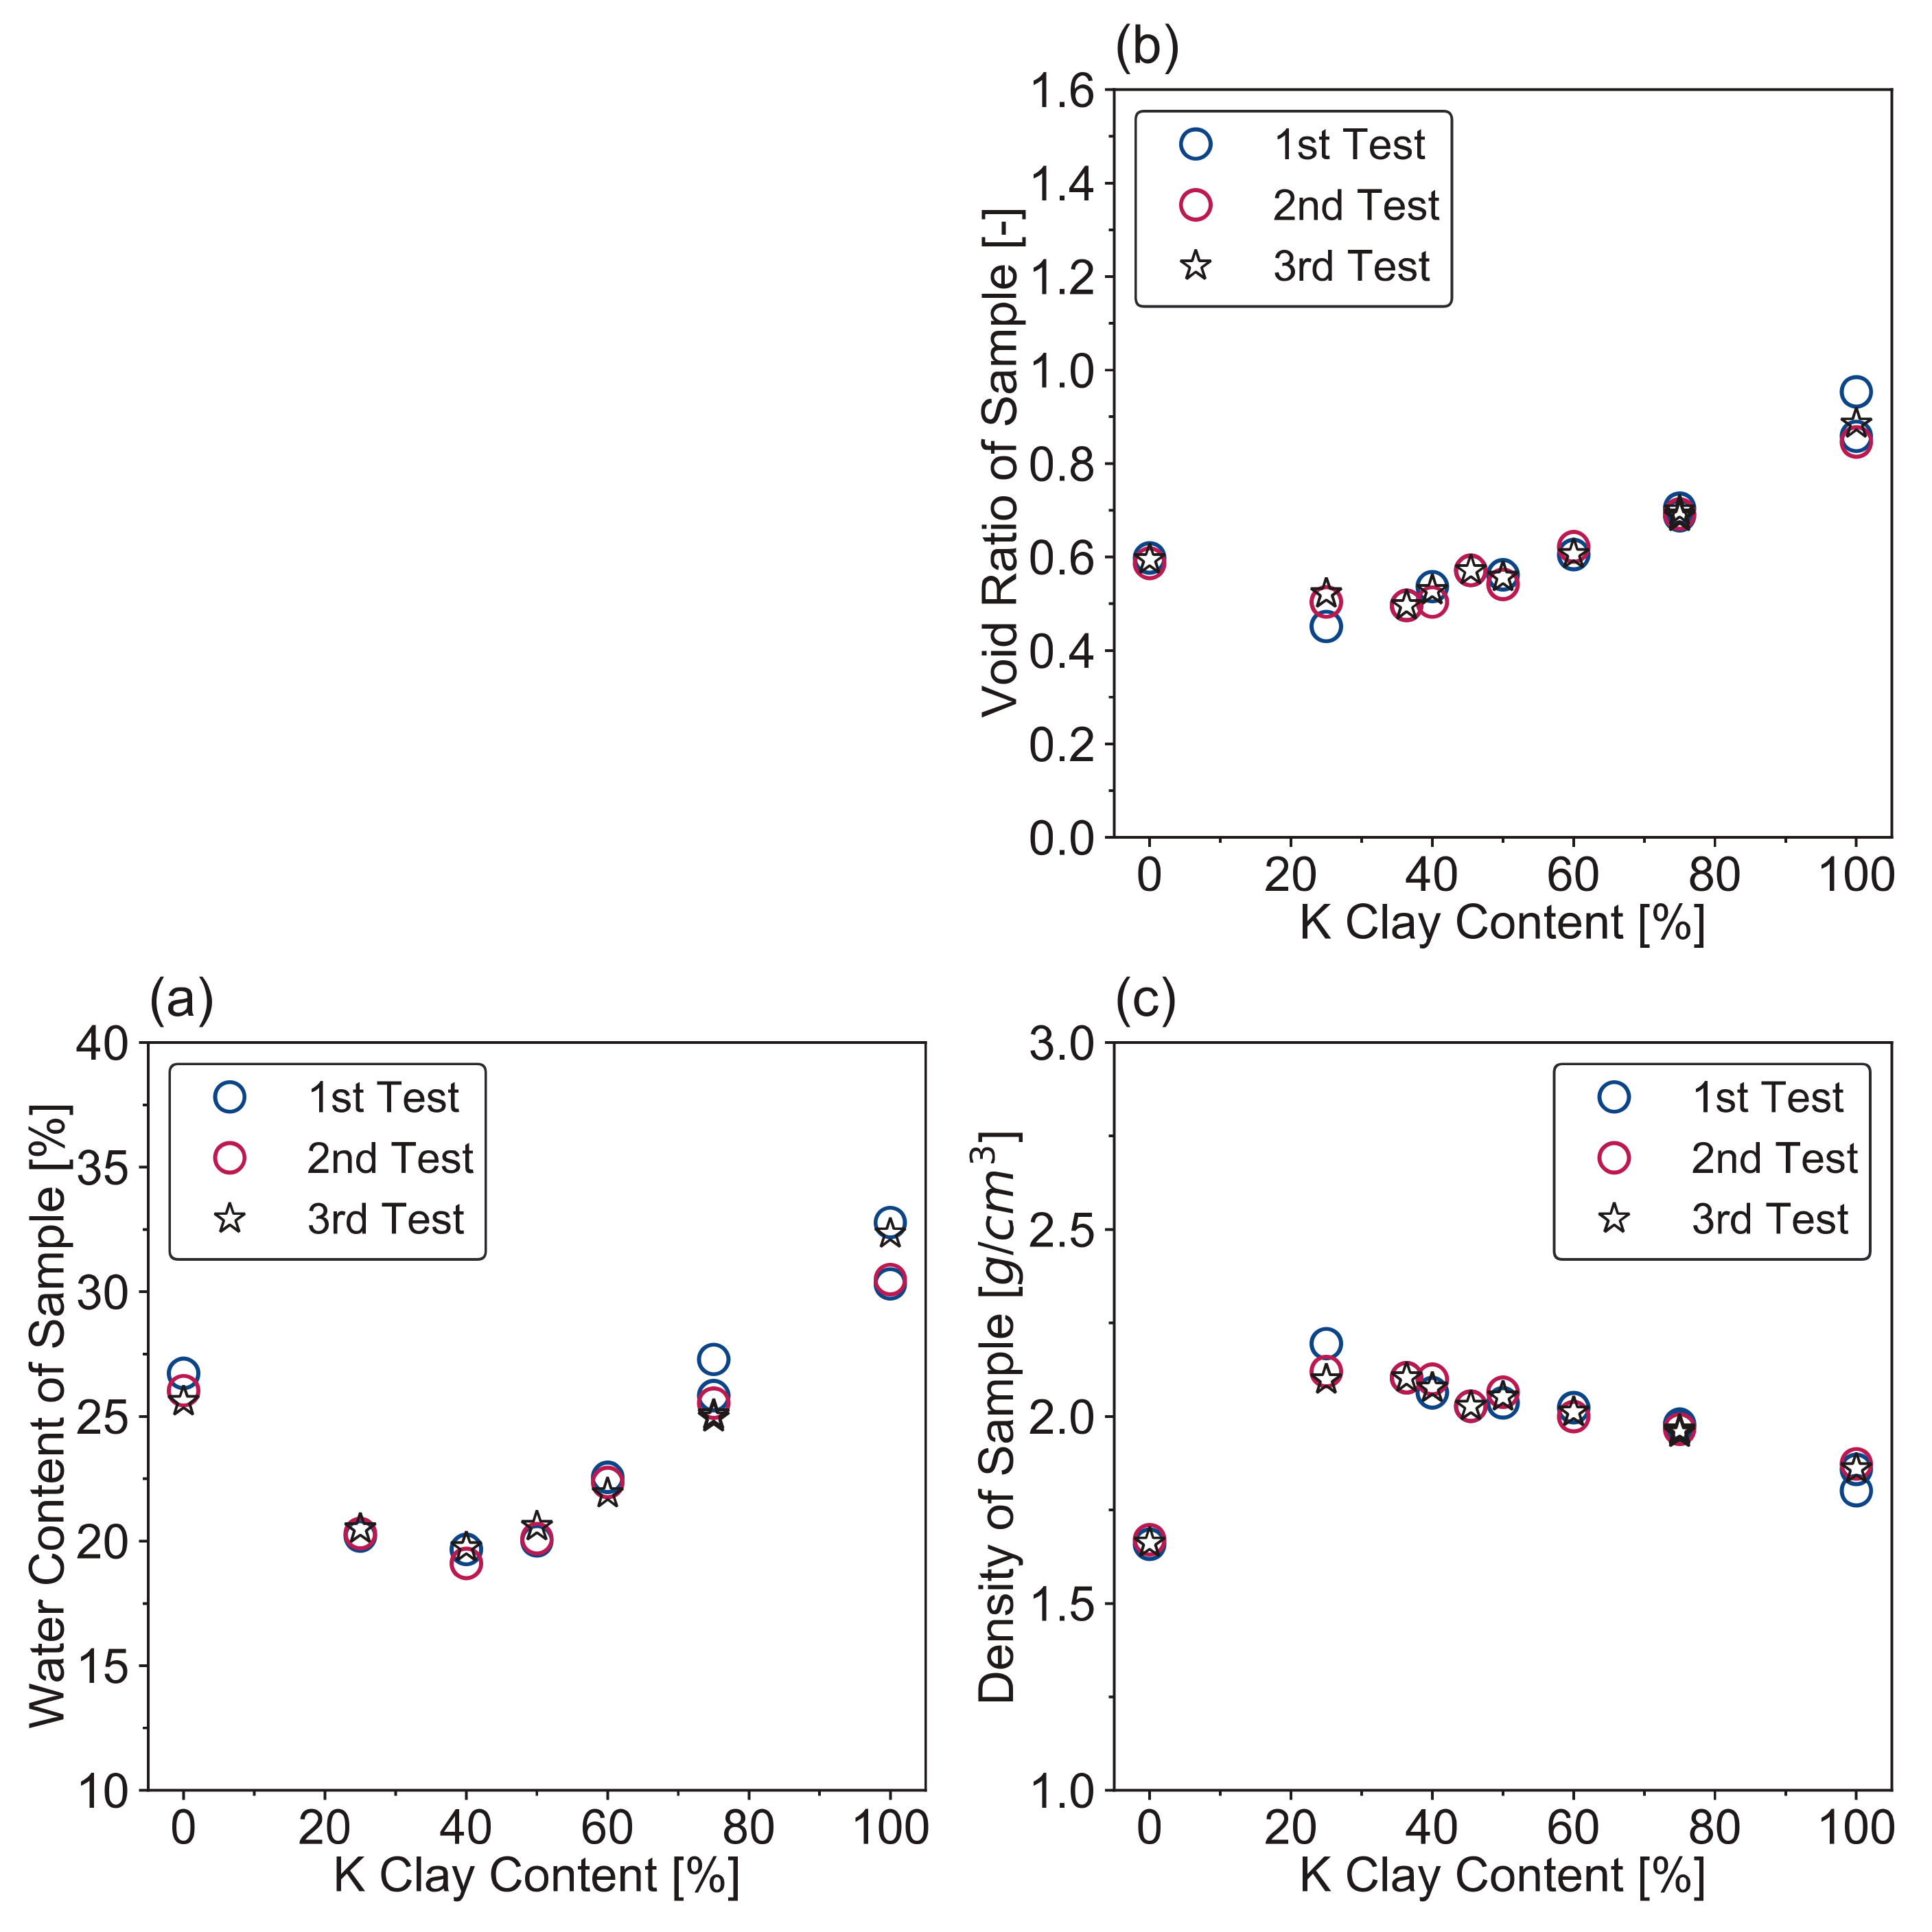
The repeatability of the S1 sand–clay mixture samples was evaluated and verified by the average water content, global void ratio and density after sample preparation. At each clay fraction, at least three sand–clay mixture samples were prepared. The variation of the three parameters as a function of the K clay content is shown in Figure 8.
The water content, global void ratio and density data points are overlapping for the specimens of each clay fraction (Figure 8b,c). This reveals that the S1 protocol can offer reproducible sand–clay mixture specimens. It should be noted that at clay fraction of 75% or 100%, there were larger differences between the samples tested, since with more clay inside the mixture, the sample is slower to be consolidated in the preconsolidation cell. However, it can be argued that this difference tends to disappear as the preconsolidation time increases.
5.2. Odometrical Response
5.2.1. Experimental Setup
The repeatability in terms of the mechanical behavior of the sand–clay mixtures prepared according to the S1 protocol was verified by performing classical one-dimensional oedometer tests. The goal of this type of test is to provide a first insight into understanding what will happen when using the designed preconsolidation cell. The results of the oedometer tests performed hereafter also give an understanding on S1 samples’ mechanical behavior and the response when the vertical stress reaches 800 kPa (maximum limit of the device).
Samples (50% clay by weight) in the oedometer tests were prepared with the S1 technique at an initial water content of 1.5 wL. After the specimens were prepared in the oedometer cell without any vertical stress loaded, the water contents were measured and the initial void ratio values were calculated, then an incremental loading oedometer device was used to perform the oedometer tests. The vertical stress loading steps were 12.5 kPa, 25 kPa, 50 kPa, 100 kPa, 200 kPa, 400 kPa, 800 kPa, then unloaded to 50 kPa. A loading step was started only when the vertical displacement in the previous step was stable. After that, the test was stopped and the water content of the specimen was measured. In total, three samples were prepared and performed on with the oedometer test.
5.2.2. Results of Oedometer Test
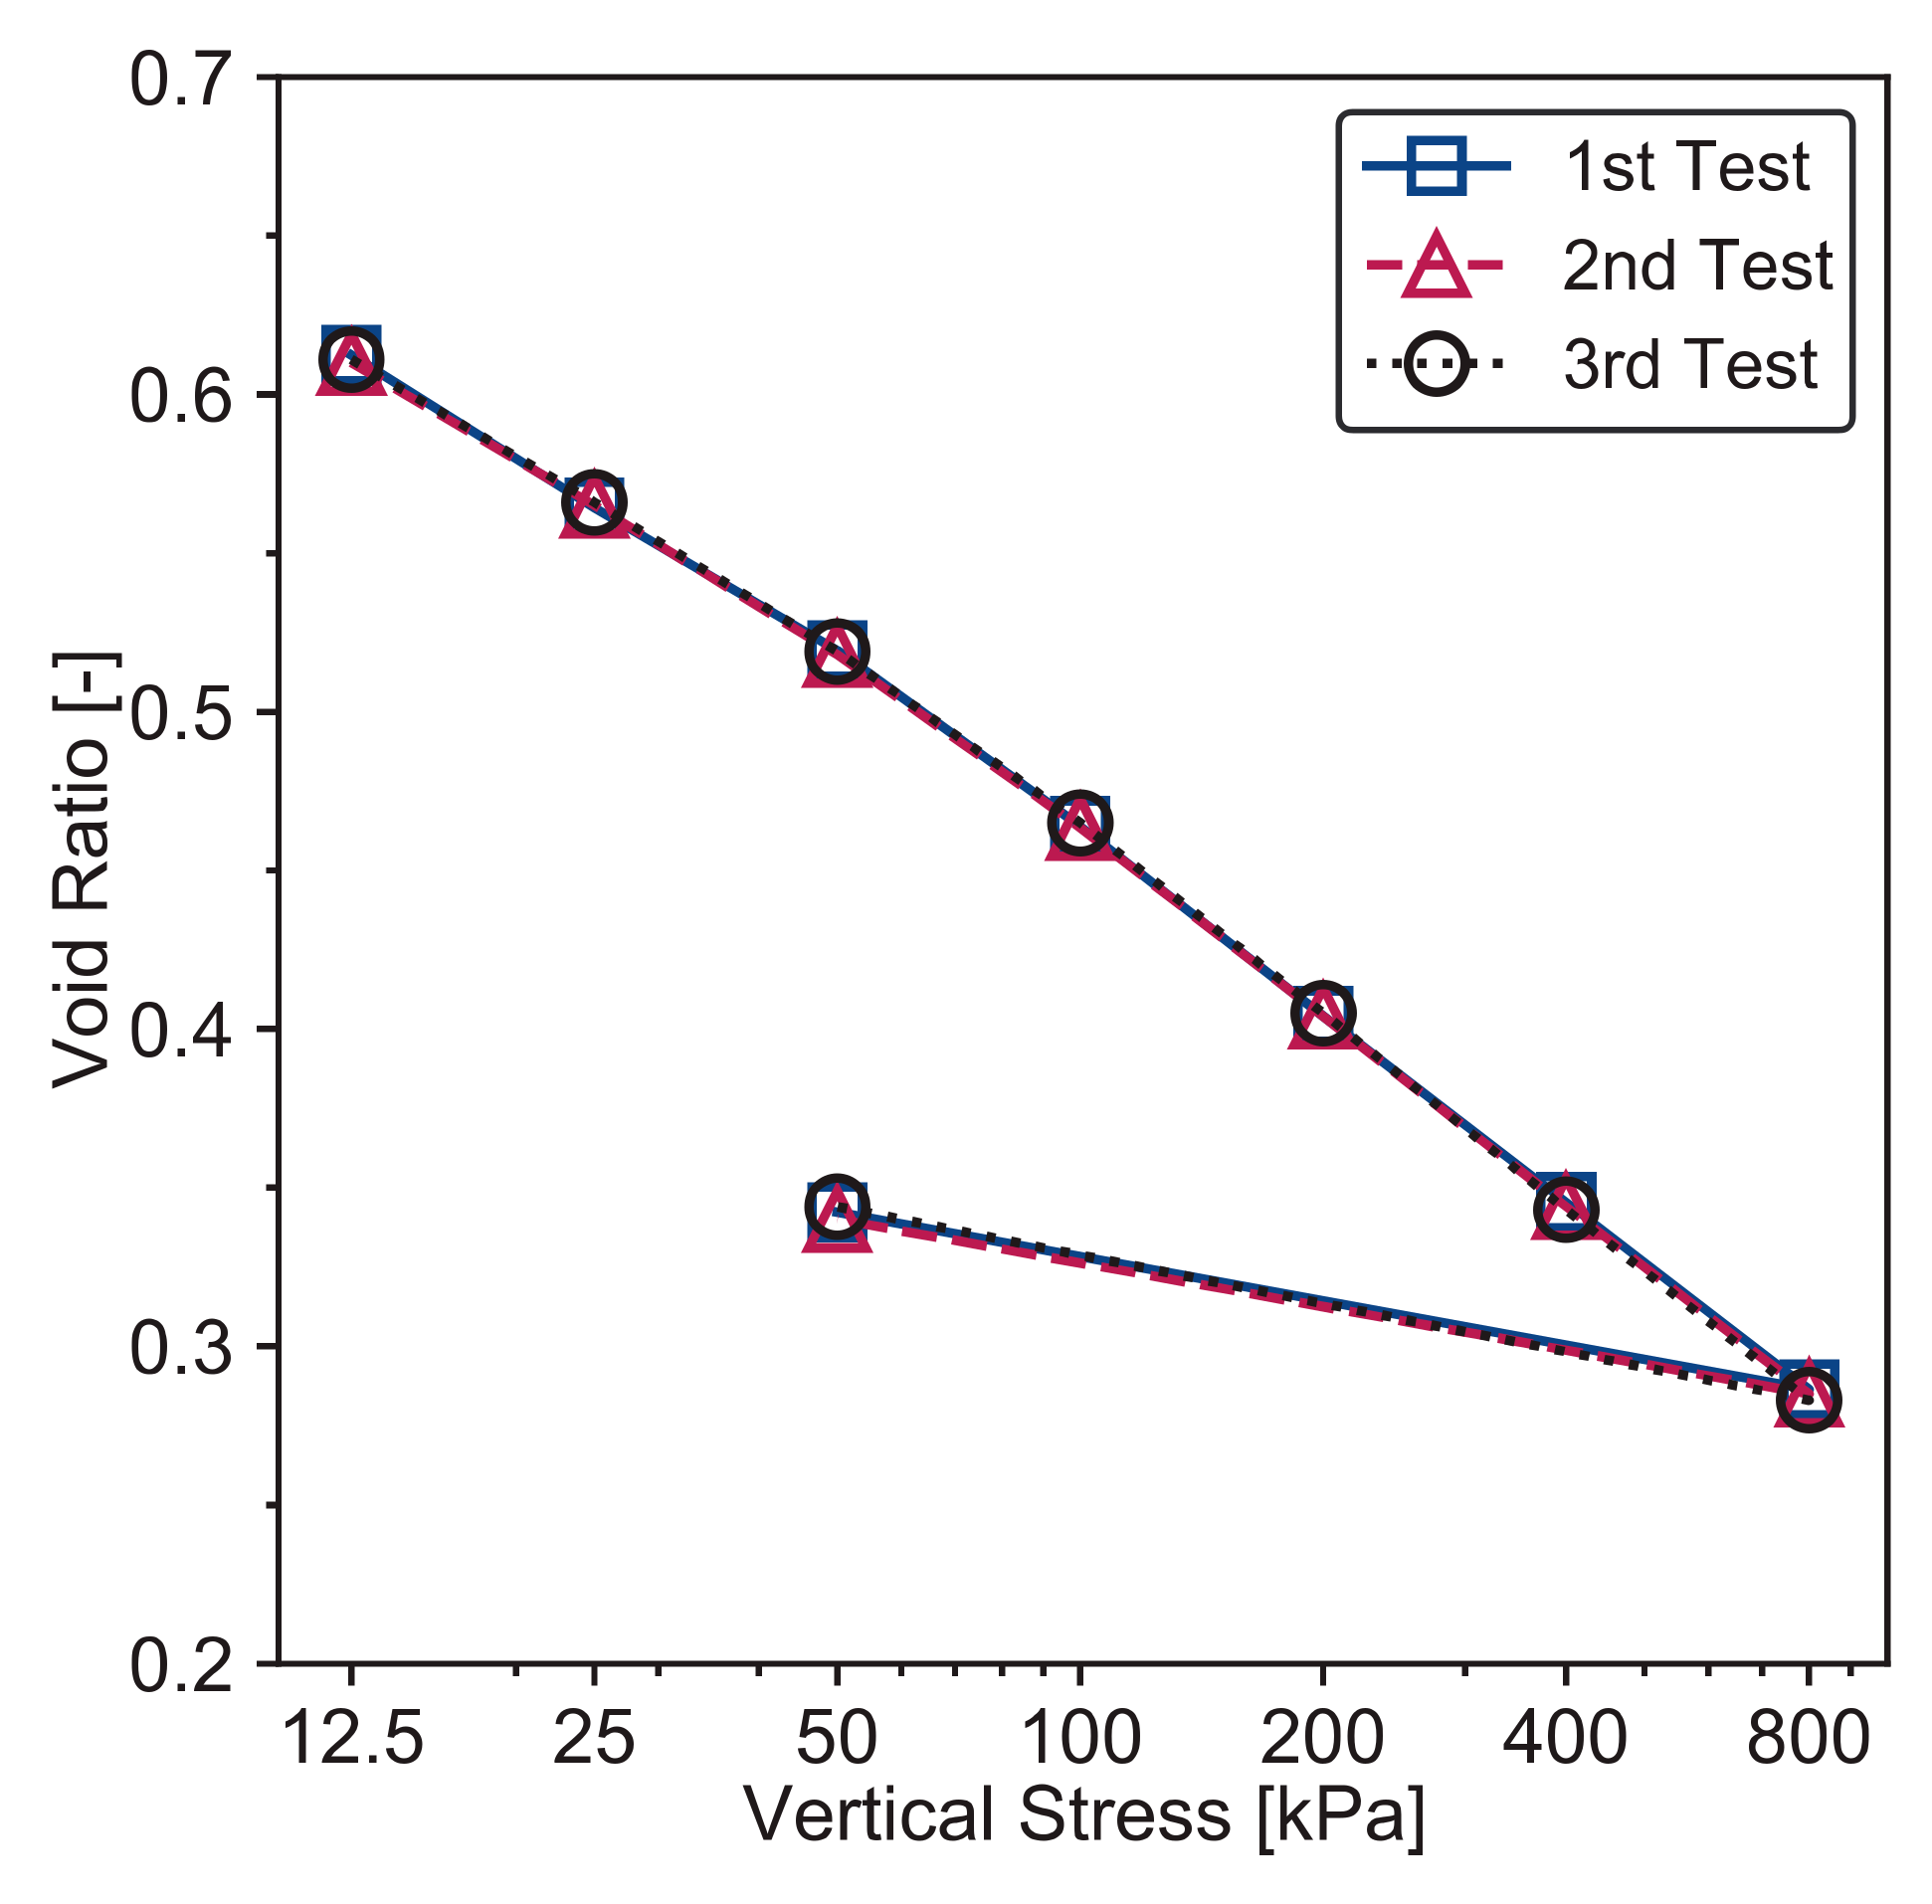
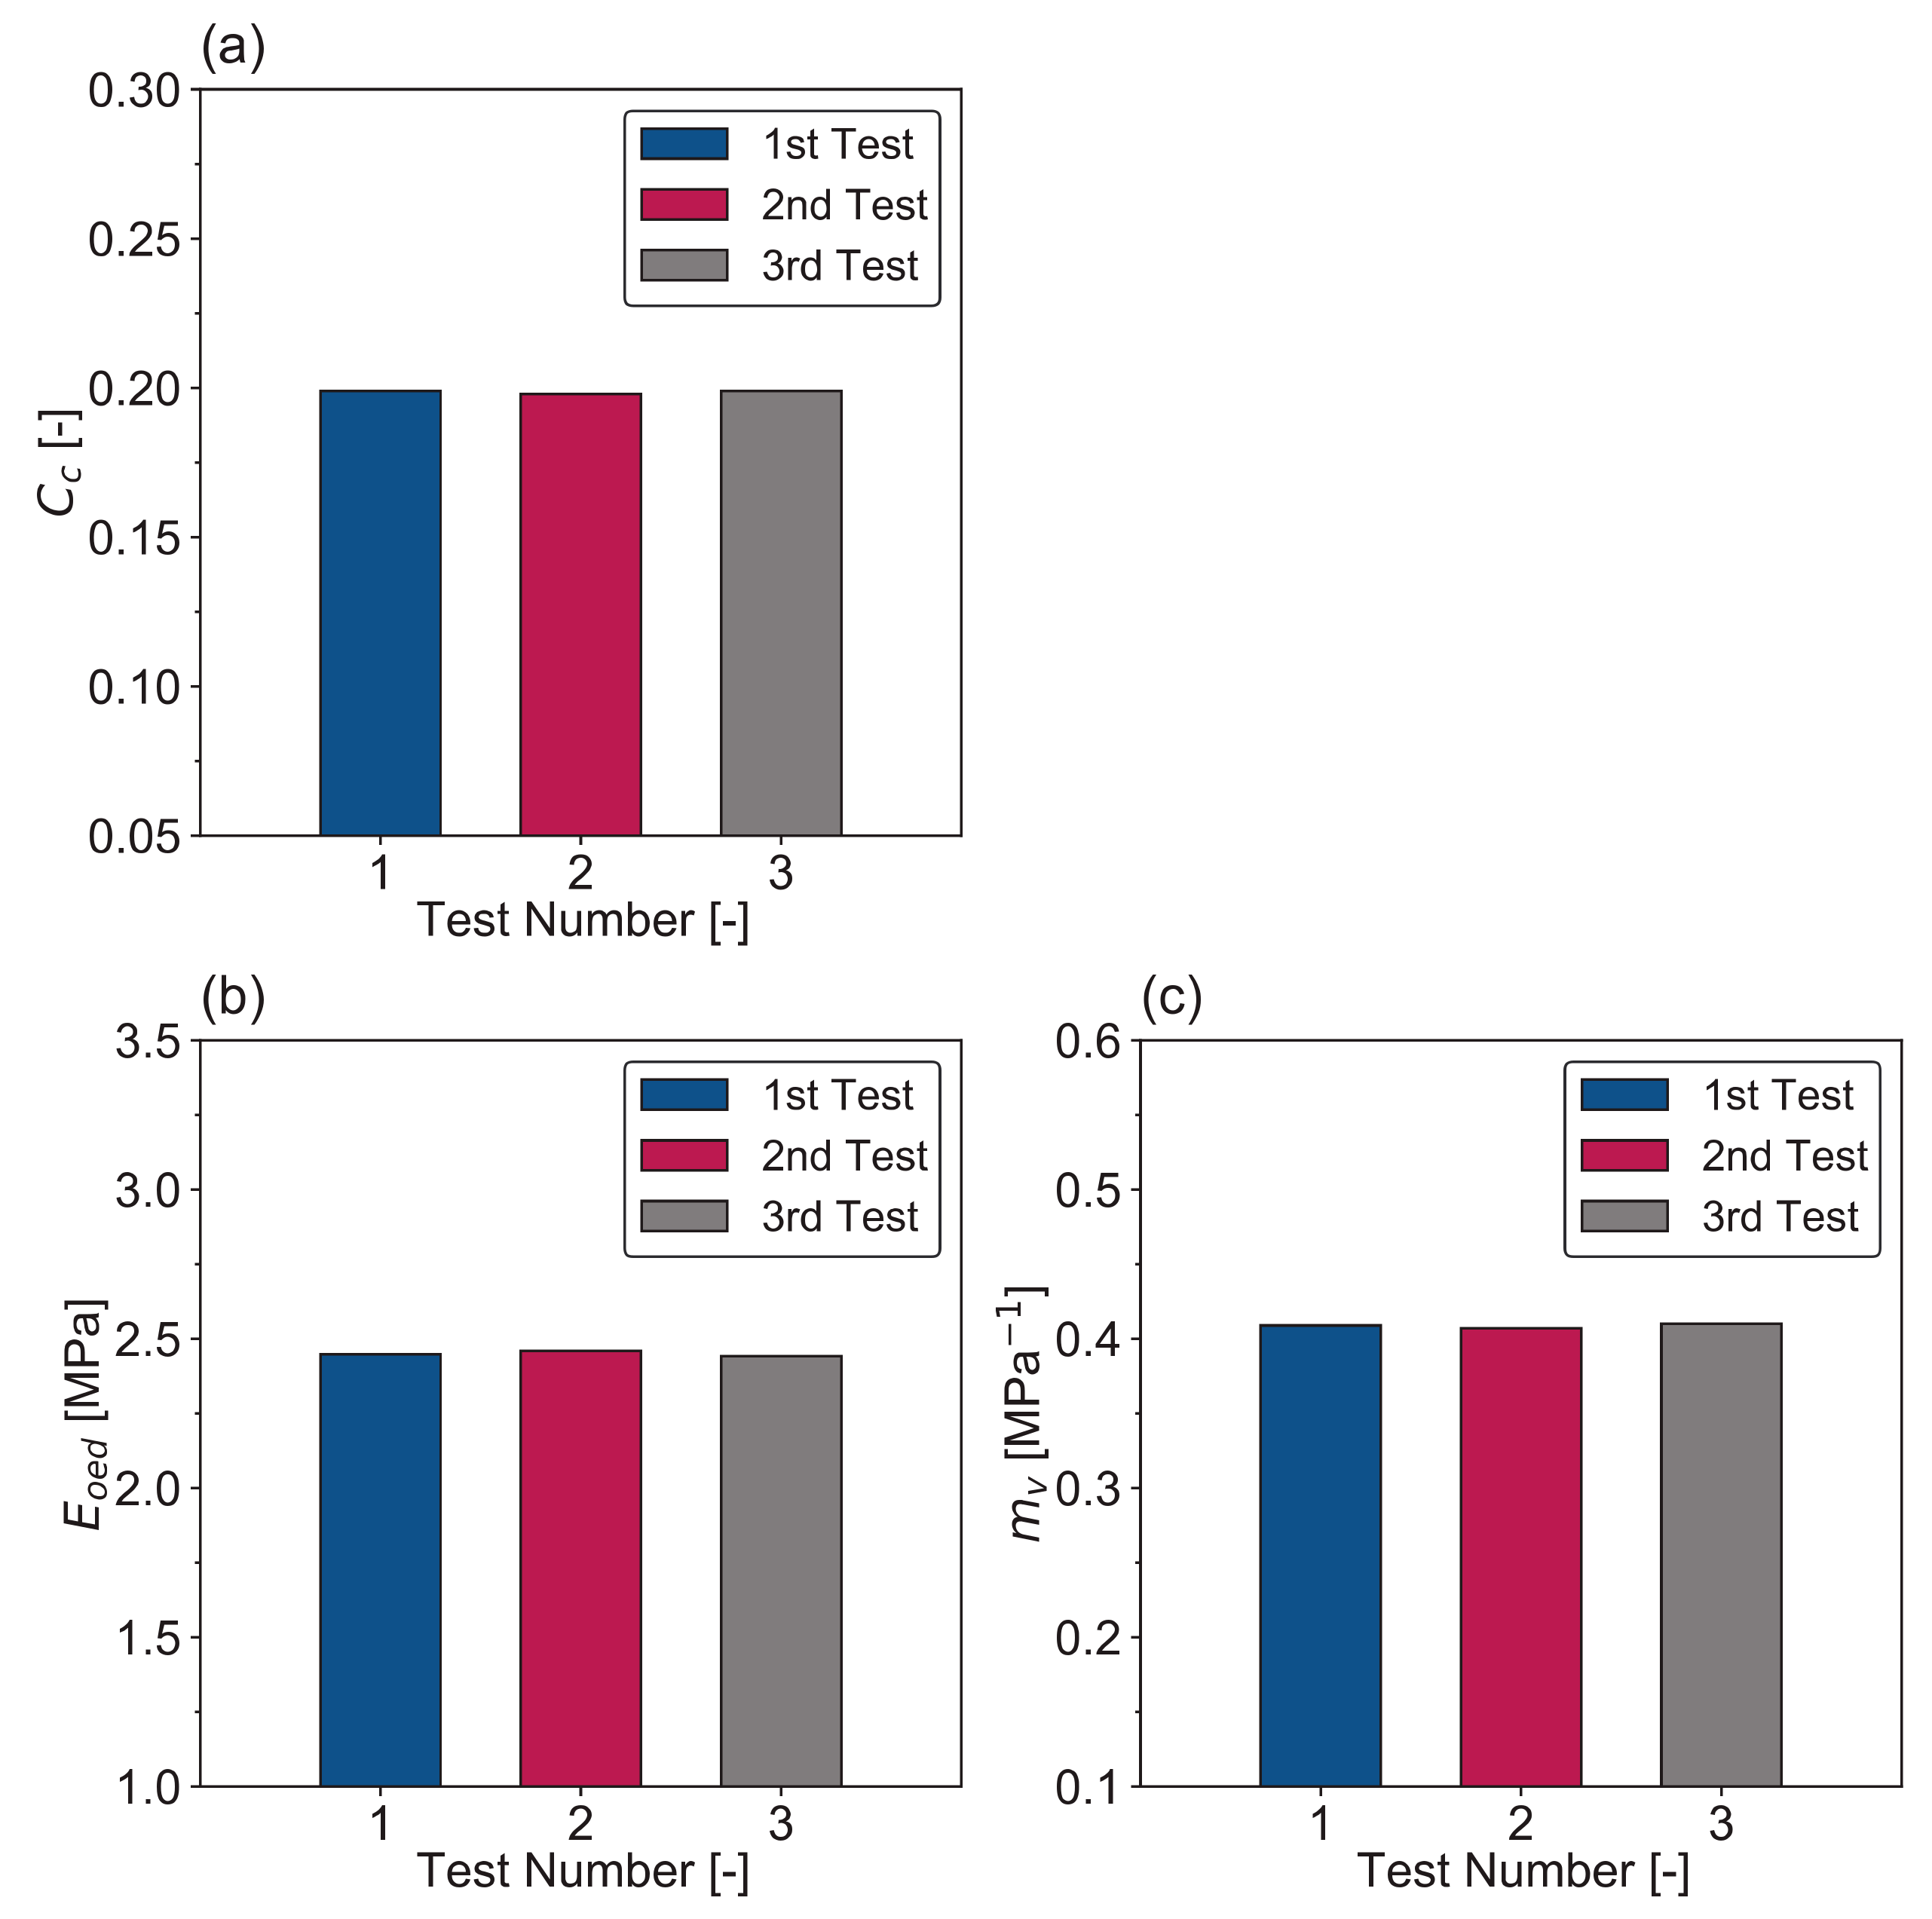
To evaluate the main characteristics of the mixtures’ compressibility in the 1D oedometer test, basic oedometric curves and parameters have to be delineated. The compressibility curves for the three specimens are shown in Figure 9. The initial void ratio after the sample mixed is not included, the data in Figure 9 starts from the vertical stress of 12.5 kPa. As can be seen, the three S1 samples show similar behavior; the values of the void ratio at each loading step are very close. The overall slopes of the three curves are nearly the same, and independent on the sample number. From the compressibility curves, the most important parameters can be calculated and analytical differences between the samples can be evaluated. The compression index Cc, the oedometer modulus Eoed and the coefficient of volume compressibility mv are calculated and outlined in a bar chart, as presented in Figure 10. The three S1 samples have similar values of the parameters and no significant differences can be observed among them. The results of the three samples are: 0.198 ± 0.001 for compression index Cc, 2.45 ± 0.01 MPa for the oedometer modulus Eoed, 0.409 ± 0.001 MPa−1 for the coefficient of volume compressibility mv.
In conclusion, what can be pointed out from the mechanical behavior of oedometer tests on the three S1 samples is that no clear differences between them can be highlighted. The oedometrical behavior reveals that the S1 method can generate repeatable sand–clay mixture samples.
5.3. Interface Direct Shear Response
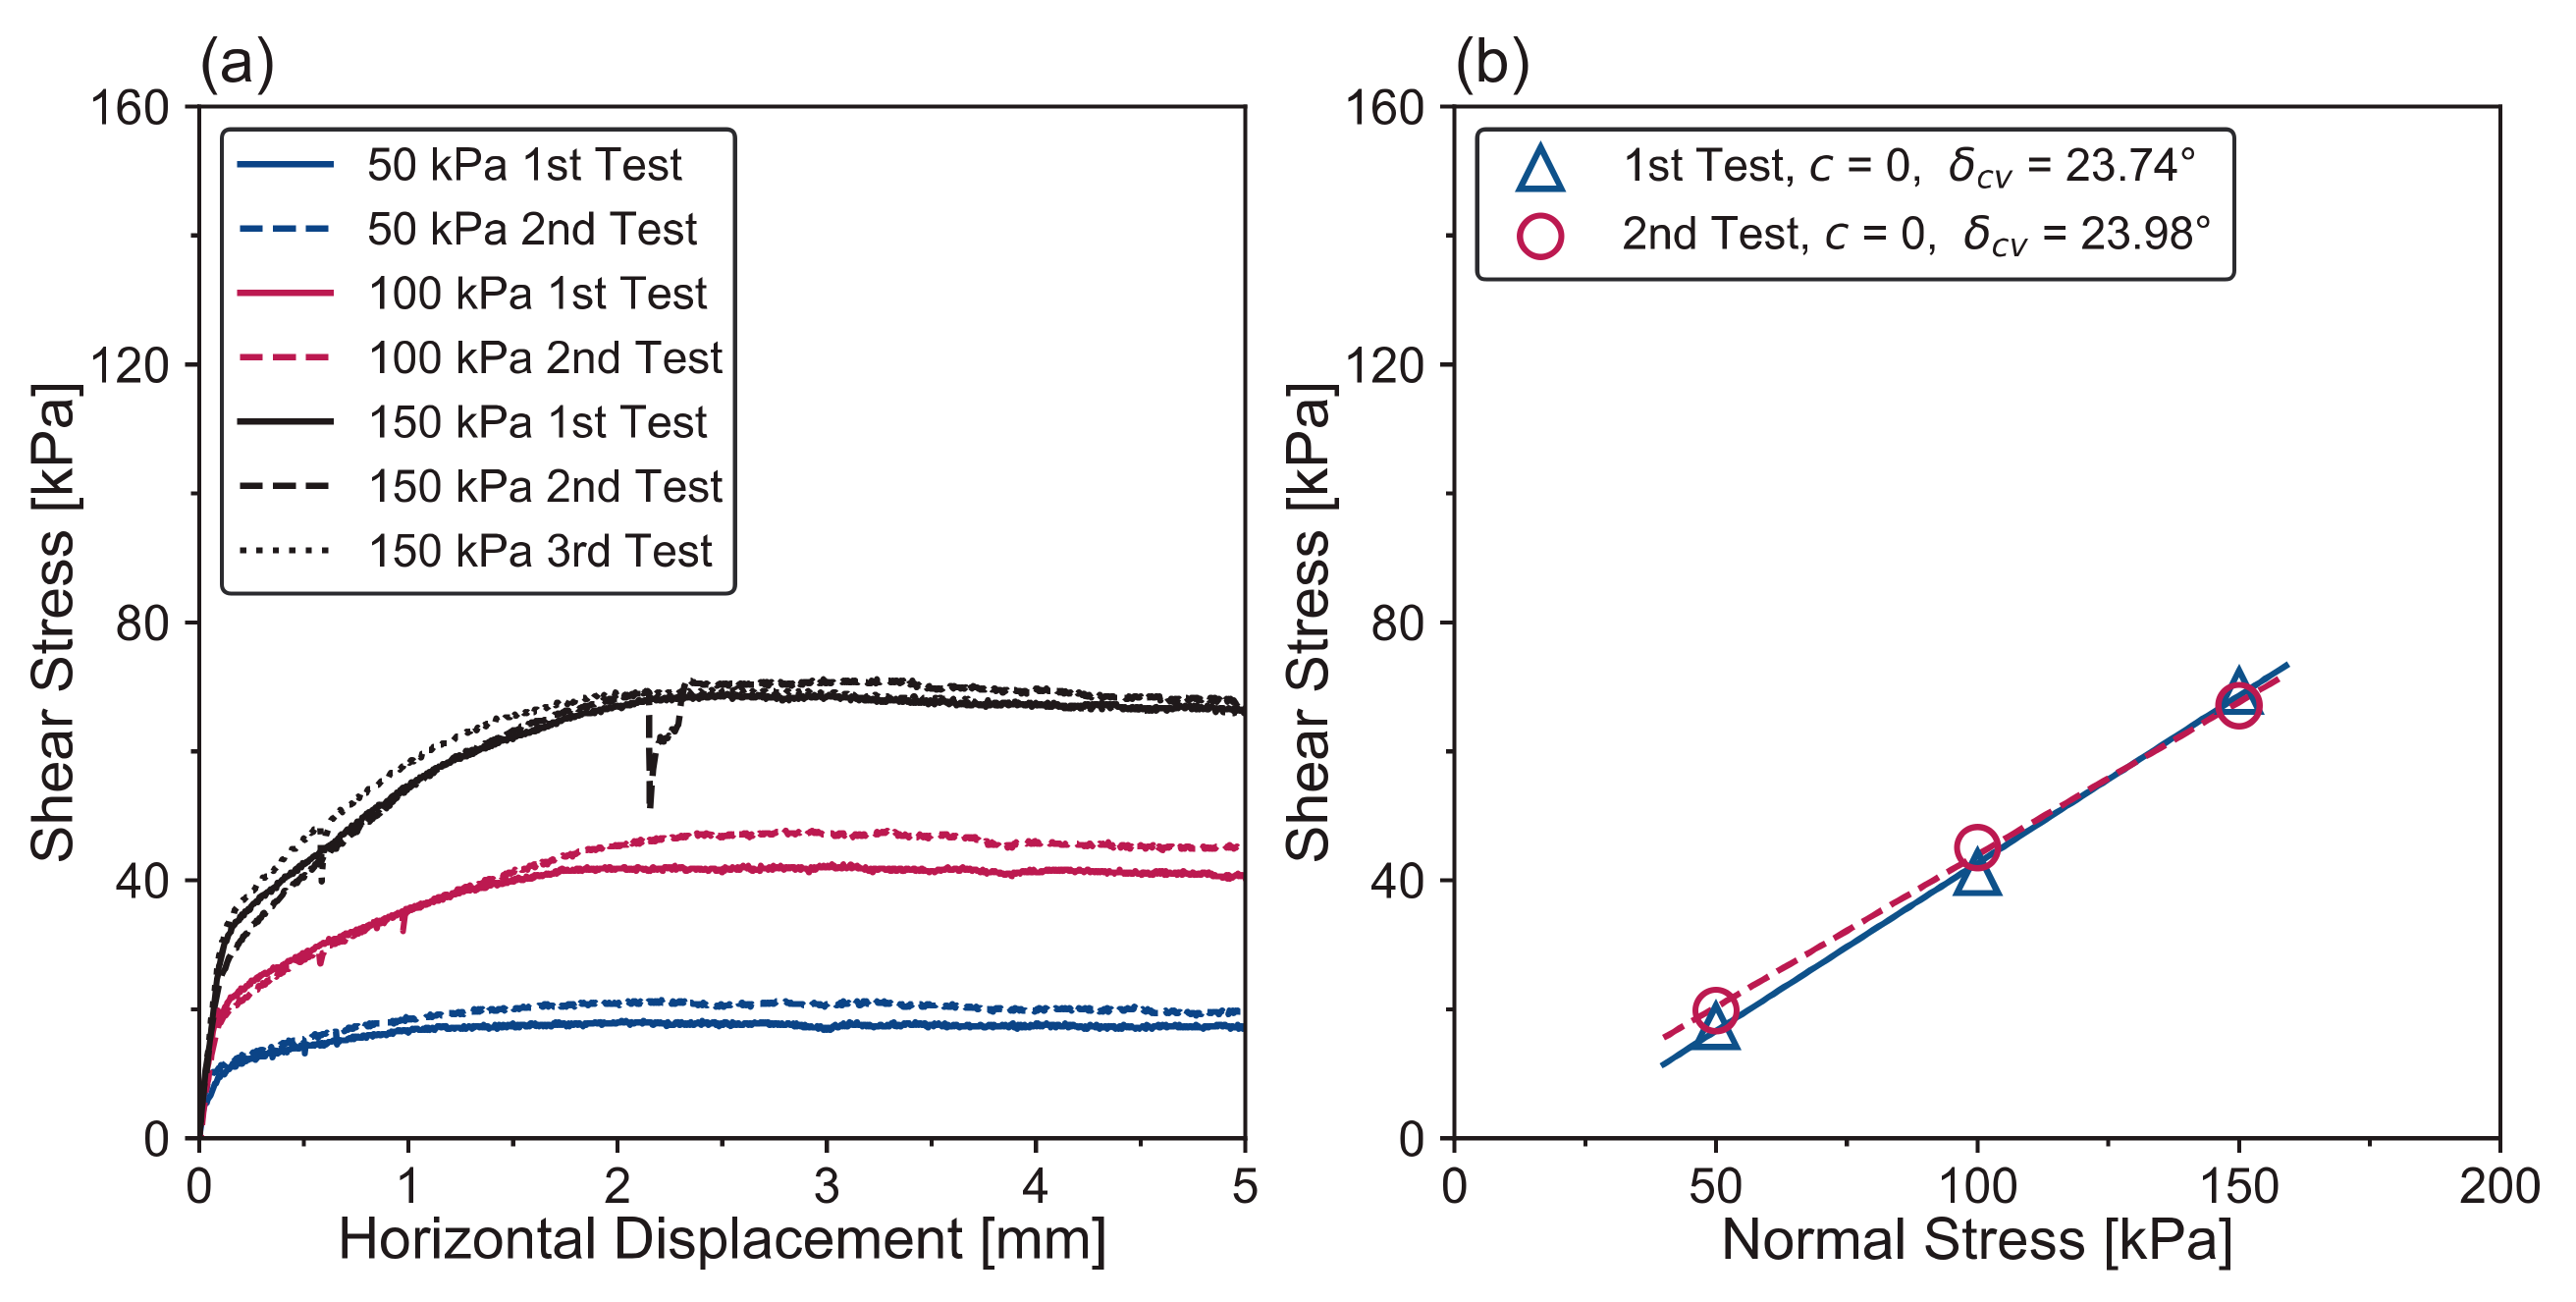
The S1 samples with 75% K clay content and a concrete plate (140 mm × 100 mm × 11 mm) were used for the interface direct shear test. The samples were sheared with a rate of 0.005 mm/min under three normal stresses, i.e., 50, 100, and 150 kPa, until a critical state (maximum horizontal displacement of 5 mm). This small shear rate ensured a total drained shearing according to [65]. The shear tests were repeated at least one time for each normal stress. Shear stress versus horizontal displacement of the interface direct shear tests are plotted in Figure 11a, which verifies the repeatability of the tests.
The curves at each normal stress overlap with each other at the beginning phase of the shearing (Figure 11a), which indicates that the samples have good repeatability. The different critical shear strengths are characterized with values of 2.43 kPa, 4.45 kPa, and 0.81 kPa (average value), at the normal stress of 50 kPa, 100 kPa, and 150 kPa. The difference among the critical shear strength is in good agreement with the previous publication [7]. The critical adhesion (c) and interface friction angles (δcv) of the first and second tests are shown in Figure 11b. Both the first and second tests are characterized with the same critical adhesion of zero (Figure 11b). The critical δcv for the 1st and 2nd interface direct shear tests are 23.74° and 23.98°, respectively, with a small difference of 0.24°. The shear stress curves, critical shear strength, critical adhesion, and interface friction angles of the interface direct shear tests demonstrate great repeatability of the samples generated by the S1 technique.
It is worth noting that, though there is a sudden shear stress drop on the curve of 150 kPa normal stress (see Figure 11), the overall trend and the critical state are not affected. This collapse is caused by the fact that the soil particles go into the small pits on the concrete surface during shearing, and similar phenomena can be also found in [7,57].
6. Conclusions
This study presents a method to prepare sand–clay mixture samples for interface direct shear tests. The procedure for the presented method should be performed with three main phases as follows:
- Mixing sand, clay, and distilled water into a sand–clay mixture slurry with the S1 (sand-water-clay at 1.5 wL) scheme;
- Performing a preconsolidation on the slurry sample with the designed oedometer cell;
- Trimming the preconsolidated sample down to a square sand–clay mixture solid and move it into the shear box.
Regarding the high number of experimental studies involving very variable preparations of soil samples, mixtures consisting of Fontainebleau sand, kaolinite clay, and water were prepared by the S1 protocol (sand-water-clay) to verify the uniformity and repeatability of the samples. This kind of sand–clay mixture specimens can be used to study the influence of clay content or other different effects (e.g., temperature) on the mechanical behavior of soil–structure interface. The conclusions are summarized as following:
- The water content and density of different slices confirm that the S1 sand–clay mixture samples are uniform;
- The water content, global void ratio, and density of samples with clay content from 0% to 100% indicate that the S1 samples are repeatable. Moreover, the oedometer and interface direct shear tests confirm this repeatability;
- The sand–clay mixture samples are well suitable for the interface direct shear tests.
The S1 sample preparation can avoid some inherent problems which exist in other traditional methods so that it is more suitable for preparing sand–clay mixture specimens for interface direct shear tests. For instance, the dry pluviation method cannot guarantee a homogeneous and saturated specimen of sand–clay mixture or well-graded sand; the wet pluviation cannot be used for well-graded soil or sands containing fine particles because of the particle segregation [52]; dry tamping sample preparation can successfully avoid the honeycomb structure [66,67] induced by the capillary forces, but it enhances the heterogeneities and uncertainty of physical properties in the sand–clay mixture specimens due to the possible segregation effect; consolidation of the sand–clay mixture slurry on the interface direct shear device may result in soil leakage.
Furthermore, as well as the advantages mentioned above, after a sand–clay mixture specimen has been obtained successfully by this method and the tools and preconsolidation cell are available, then another specimen can be prepared with the same procedure. Hence, it is more efficient than traditional specimen reconstitution procedures since the sample preparation can be preformed in parallel with the interface direct shear test.
However, it should be noted that when using this method to prepare a sand–clay mixture with a low clay content (e.g., <15%), the prepared specimen may be not in a good shape. Future studies of repeatability assessments are suggested to examine the differences of the microstructure of the samples.
Author Contributions
Conceptualization, methodology, data curation, writing—original draft preparation, K.Y.; formal analysis, K.Y., J.L.; writing—review and editing, J.L., A.-R.V., E.D.F., K.O.; All authors have read and agreed to the published version of the manuscript.
Funding
This research was funded by the China Scholarship Council.
Institutional Review Board Statement
Not applicable.
Informed Consent Statement
Not applicable.
Data Availability Statement
All data generated or used during the study appear in the submitted article.
Acknowledgments
The authors would like to express their acknowledgment to M. Mathias Marcel for his important technical assistance.
Conflicts of Interest
The authors declare that they have no conflict of interest.
References
- Abed, Y.; Bouzid, D.A.; Bhattacharya, S.; Aissa, M.H. Static impedance functions for monopiles supporting offshore wind turbines in nonhomogeneous soils-emphasis on soil/monopile interface characteristics. Earthq. Struct. 2016, 10, 1143–1179. [Google Scholar] [CrossRef]
- Burger, A. Thermique des Nappes Souterraines; Presses Polytechniques Romandes: Lausanne, Switzerland, 1985. [Google Scholar]
- Dixon, D.; Gray, M.; Baumgartner, P.; Rigby, G. Pressures acting on waste containers in bentonite-based materials. In Proceedings of the 2nd International Conference on Radioactive Waste Management, Winnipeg, MB, Canada, 7–11 September 1986. [Google Scholar]
- Dupray, F.; François, B.; Laloui, L. Analysis of the FEBEX multi-barrier system including thermoplasticity of unsaturated bentonite. Int. J. Numer. Anal. Methods Geomech. 2013, 37, 399–422. [Google Scholar] [CrossRef]
- Graham, J.; Oswell, J.; Gray, M. The effective stress concept in saturated sand-clay buffer. Can. Geotech. J. 1992, 29, 1033–1043. [Google Scholar] [CrossRef]
- Laloui, L.; Di Donna, A. Energy Geostructures: Innovation in Underground Engineering; John Wiley & Sons: Hoboken, NJ, USA, 2013. [Google Scholar]
- Vasilescu, A.-R. Design and Execution of Energy Piles: Validation by In-Situ and Laboratory Experiments. Ph.D. Thesis, École Centrale de Nantes, Nantes, France, 7 August 2019. [Google Scholar]
- Vasilescu, A.R.; Fauchille, A.-L.; Dano, C.; Kotronis, P.; Manirakiza, R.; Gotteland, P. Impact of Temperature cycles at Soil-Concrete Interface for Energy Piles. In Proceedings of the International Symposium on Energy Geotechnics, Cham, Switzerland, 24 August 2018; pp. 35–42. [Google Scholar]
- Vasilescu, R.; Yin, K.; Fauchille, A.-L.; Kotronis, P.; Dano, C.; Manirakiza, R.; Gotteland, P. Influence of thermal cycles on the deformation of soil-pile interface in energy piles. In Proceedings of the E3S Web of Conferences, Glasgow, UK, 25 June 2019; p. 13004. [Google Scholar]
- Yu, Q.; Yin, K.; Ma, J.; Shimada, H. Vertical Shaft Support Improvement Studies by Strata Grouting at Aquifer Zone. Adv. Civ. Eng. 2018, 2018, 1–10. [Google Scholar] [CrossRef]
- Rouaiguia, A. Residual shear strength of clay-structure interfaces. Int. J. Civ. Environ. Eng. 2010, 10, 6–18. [Google Scholar]
- Pra-ai, S. Behaviour of Soil-Structure Interfaces Subjected to a Large Number of Cycles. Application to Piles. Ph.D. Thesis, Université de Grenoble, Grenoble, France, 2013. [Google Scholar]
- Pra-ai, S.; Boulon, M. Soil-structure cyclic direct shear tests: A new interpretation of the direct shear experiment and its application to a series of cyclic tests. Acta Geotech. 2017, 12, 107–127. [Google Scholar] [CrossRef]
- Maghsoodi, S.; Cuisinier, O.; Masrouri, F. Thermal effects on mechanical behaviour of soil-structure interface. Can. Geotech. J. 2020, 57, 32–47. [Google Scholar] [CrossRef] [Green Version]
- Maghsoodi, S.; Cuisinier, O.; Masrouri, F. Effect of Temperature on the Cyclic Behavior of Clay-Structure Interface. J. Geotech. Geoenviron. Eng. 2020, 146, 04020103. [Google Scholar] [CrossRef]
- Porcino, D.; Fioravante, V.; Ghionna, V.N.; Pedroni, S. Interface behavior of sands from constant normal stiffness direct shear tests. Geotech. Test. J. 2003, 26, 289–301. [Google Scholar]
- Hu, L.; Pu, J. Testing and modeling of soil-structure interface. J. Geotech. Geoenviron. Eng. 2004, 130, 851–860. [Google Scholar] [CrossRef]
- Di Donna, A.; Ferrari, A.; Laloui, L. Experimental investigations of the soil-concrete interface: Physical mechanisms, cyclic mobilization, and behaviour at different temperatures. Can. Geotech. J. 2016, 53, 659–672. [Google Scholar] [CrossRef]
- Di Donna, A. Thermo-Mechanical Aspects of Energy Piles. Ph.D. Thesis, École Polytechnique Fédérale de Lausanne (EPFL), Lausanne, Switzerland, 2014. [Google Scholar]
- Chen, X.; Zhang, J.; Xiao, Y.; Li, J. Effect of roughness on shear behavior of red clay-concrete interface in large-scale direct shear tests. Can. Geotech. J. 2015, 52, 1122–1135. [Google Scholar] [CrossRef]
- DeJong, J.T.; White, D.J.; Randolph, M.F. Microscale observation and modeling of soil-structure interface behavior using particle image velocimetry. Soils Found. 2006, 46, 15–28. [Google Scholar] [CrossRef] [Green Version]
- Xiao, S.; Suleiman, M.T.; Al-Khawaja, M. Investigation of effects of temperature cycles on soil-concrete interface behavior using direct shear tests. Soils Found. 2019, 59, 1213–1227. [Google Scholar] [CrossRef]
- Yavari, N.; Tang, A.M.; Pereira, J.-M.; Hassen, G. Effect of temperature on the shear strength of soils and the soil-structure interface. Can. Geotech. J. 2016, 53, 1186–1194. [Google Scholar] [CrossRef]
- Yazdani, S.; Helwany, S.; Olgun, G. Influence of temperature on soil-pile interface shear strength. Geomech. Energy Environ. 2019, 18, 69–78. [Google Scholar] [CrossRef]
- Boukpeti, N.; White, D.J. Interface shear box tests for assessing axial pipe-soil resistance. Géotechnique 2017, 67, 18–30. [Google Scholar] [CrossRef] [Green Version]
- DeJong, J.T.; Westgate, Z.J. Role of initial state, material properties, and confinement condition on local and global soil-structure interface behavior. J. Geotech. Geoenviron. Eng. 2009, 135, 1646–1660. [Google Scholar] [CrossRef]
- Dove, J.E.; Frost, J.D. Peak friction behavior of smooth geomembrane-particle interfaces. J. Geotech. Geoenviron. Eng. 1999, 125, 544–555. [Google Scholar] [CrossRef]
- Dove, J.E.; Jarrett, J.B. Behavior of dilative sand interfaces in a geotribology framework. J. Geotech. Geoenviron. Eng. 2002, 128, 25–37. [Google Scholar] [CrossRef]
- Martinez, A.; Frost, J. The influence of surface roughness form on the strength of sand-structure interfaces. Géotech. Lett. 2017, 7, 104–111. [Google Scholar] [CrossRef]
- Martinez, A.; Stutz, H.H. Rate effects on the interface shear behaviour of normally and overconsolidated clay. Géotechnique 2019, 69, 801–815. [Google Scholar] [CrossRef]
- Potyondy, J.G. Skin friction between various soils and construction materials. Geotechnique 1961, 11, 339–353. [Google Scholar] [CrossRef]
- Bennett, R.; Hulbert, M. Clay Microstructure; Springer Science & Business Media: Berlin/Heidelberg, Germany, 2012. [Google Scholar]
- Mitchell, J.K.; Soga, K. Fundamentals of Soil Behavior; John Wiley & Sons: New York, NY, USA, 2005; Volume 3. [Google Scholar]
- Muir Wood, D.; Kumar, G. Experimental observations of behaviour of heterogeneous soils. Mech. Cohesive-Frict. Mater. Int. J. Exp. Model. Comput. Mate. Struct. 2000, 5, 373–398. [Google Scholar] [CrossRef]
- Thevanayagam, S.; Shenthan, T.; Mohan, S.; Liang, J. Undrained fragility of clean sands, silty sands, and sandy silts. J. Geotech. Geoenviron. Eng. 2002, 128, 849–859. [Google Scholar] [CrossRef]
- Slaný, M.; Jankovič, Ľ.; Madejová, J. Structural characterization of organo-montmorillonites prepared from a series of primary alkylamines salts: Mid-IR and near-IR study. Appl. Clay Sci. 2019, 176, 11–20. [Google Scholar] [CrossRef]
- Balaban, E.; Smejda, A.; Onur, M. An Experimental Study on Shear Strength Behavior of Soils Under Low Confining Pressure. In Proceedings of the 4th World Congress on Civil, Structural, and Environmental Engineering, Rome, Italy, 7–9 April 2019; pp. 1–8. [Google Scholar]
- Dafalla, M.A. Effects of clay and moisture content on direct shear tests for clay-sand mixtures. Adv. Mater. Sci. Eng. 2013, 2013, 1–8. [Google Scholar] [CrossRef] [Green Version]
- Kim, D.; Nam, B.H.; Youn, H. Effect of clay content on the shear strength of clay-sand mixture. Int. J. Geo-Eng. 2018, 9, 19. [Google Scholar] [CrossRef]
- Monkul, M.M.; Ozden, G. Compressional behavior of clayey sand and transition fines content. Eng. Geol. 2007, 89, 195–205. [Google Scholar] [CrossRef]
- Shahin, M.; Khan, M.M.H.; Bari, M.N. A Disaster Resilient Road: Effects of Fines on Density and Shear Strength of Sands. Int. J. Transp. Eng. Technol. 2020, 6, 38. [Google Scholar] [CrossRef]
- Vallejo, L.E.; Mawby, R. Porosity influence on the shear strength of granular material-clay mixtures. Eng. Geol. 2000, 58, 125–136. [Google Scholar] [CrossRef]
- Zhang, Z.-L.; Cui, Z.-D.; Zhao, L.-Z. Shear Strength of Sand–Clay Interfaces through Large-Scale Direct Shear Tests. Arab. J. Sci. Eng. 2020, 45, 4343–4357. [Google Scholar] [CrossRef]
- Martinez, A.; Palumbo, S.; Todd, B.D. Bioinspiration for anisotropic load transfer at soil–structure interfaces. J. Geotech. Geoenviron. Eng. 2019, 145, 04019074. [Google Scholar] [CrossRef]
- Krage, C.P.; Price, A.B.; Lukas, W.G.; DeJong, J.T.; DeGroot, D.J.; Boulanger, R.W. Slurry Deposition Method of Low-Plasticity Intermediate Soils for Laboratory Element Testing. Geotech. Test. J. 2020, 43, 1269–1285. [Google Scholar] [CrossRef]
- Carraro, J.A.H.; Prezzi, M. A new slurry-based method of preparation of specimens of sand containing fines. Geotech. Test. J. 2008, 31, 1–11. [Google Scholar]
- Liu, W.; Tang, X.; Yang, Q. A slurry consolidation method for reconstitution of triaxial specimens. KSCE J. Civ. Eng. 2017, 21, 150–159. [Google Scholar] [CrossRef]
- Wang, S.; Luna, R.; Stephenson, R.W. A slurry consolidation approach to reconstitute low-plasticity silt specimens for laboratory triaxial testing. Geotech. Test. J. 2011, 34, 288–296. [Google Scholar]
- Wichtmann, T.; Steller, K.; Triantafyllidis, T. On the influence of the sample preparation method on strain accumulation in sand under high-cyclic loading. Soil Dyn. Earthq. Eng. 2020, 131, 106028. [Google Scholar] [CrossRef]
- Yamamuro, J.A.; Wood, F.M. Effect of depositional method on the undrained behavior and microstructure of sand with silt. Soil Dyn. Earthq. Eng. 2004, 24, 751–760. [Google Scholar] [CrossRef]
- Bendahmane, F.; Marot, D.; Alexis, A. Experimental parametric study of suffusion and backward erosion. J. Geotech. Geoenviron. Eng. 2008, 134, 57–67. [Google Scholar] [CrossRef]
- Kuerbis, R.; Vaid, Y. Sand sample preparation-the slurry deposition method. Soil. Found. 1988, 28, 107–118. [Google Scholar] [CrossRef] [Green Version]
- Marot, D.; Bendahmane, F.; Rosquoët, F.; Alexis, A. Internal flow effects on isotropic confined sand-clay mixtures. Soil Sediment Contam. 2009, 18, 294–306. [Google Scholar] [CrossRef] [Green Version]
- Polidori, E. Relationship between the Atterberg limits and clay content. Soils Found. 2007, 47, 887–896. [Google Scholar] [CrossRef] [Green Version]
- Raghunandan, M.; Juneja, A.; Hsiung, B. Preparation of reconstituted sand samples in the laboratory. Int. J. Geotech. Eng. 2012, 6, 125–131. [Google Scholar] [CrossRef]
- Kodicherla, S.P.K.; Gong, G.; Fan, L.; Moy, C.K.; He, J. Effects of preparation methods on inherent fabric anisotropy and packing density of reconstituted sand. Cogent Eng. 2018, 5, 1533363. [Google Scholar] [CrossRef]
- Yin, K. Influence of Clay Fraction on the Mechanical Behavior of a Soil-Concrete Interface. Ph.D. Thesis, École Centrale de Nantes, Nantes, France, 2021. [Google Scholar]
- Yang, J.; Liu, X. Shear wave velocity and stiffness of sand: The role of non-plastic fines. Géotechnique 2016, 66, 500–514. [Google Scholar] [CrossRef] [Green Version]
- Vaid, Y.P.; Sivathayalan, S.; Stedman, D. Influence of specimen-reconstituting method on the undrained response of sand. Geotech. Test. J. 1999, 22, 187–195. [Google Scholar]
- Sze, H.; Yang, J. Failure modes of sand in undrained cyclic loading: Impact of sample preparation. J. Geotech. Geoenviron. Eng. 2014, 140, 152–169. [Google Scholar] [CrossRef] [Green Version]
- Yin, K.; Fauchille, A.-L.; Othmani, K.; Sciarra, G.; Kotronis, P.; Benoit, Y.; Bertrand, F.; Branchu, S. Influence of sample preparation on the multi scale structure of sand-clay mixtures. In Proceedings of the E3S Web of Conferences, Glasgow, UK, 25 June 2019; p. 01007. [Google Scholar]
- Feia, S.; Sulem, J.; Canou, J.; Ghabezloo, S.; Clain, X. Changes in permeability of sand during triaxial loading: Effect of fine particles production. Acta Geotech. 2016, 11, 1–19. [Google Scholar] [CrossRef]
- San Nicolas, R.; Cyr, M.; Escadeillas, G. Characteristics and applications of flash metakaolins. Appl. Clay Sci. 2013, 83, 253–262. [Google Scholar] [CrossRef]
- Aboulayt, A.; Jaafri, R.; Samouh, H.; El Idrissi, A.C.; Roziere, E.; Moussa, R.; Loukili, A. Stability of a new geopolymer grout: Rheological and mechanical performances of metakaolin-fly ash binary mixtures. Constr. Build. Mater. 2018, 181, 420–436. [Google Scholar] [CrossRef]
- ASTM. ASTM-D3080. In Standard Test Method for Direct Shear Test of Soils under Consolidated Drained Conditions; D3080/D3080M; ASTM: West Conshohocken, PA, USA, 2011. [Google Scholar]
- Casagrande, A. Liquefaction and cyclic deformation of sands: A critical review. In Proceedings of the Lecture at 5th Panamerican Conference on Soil Mechanics and Foundation Engineering, Buenos Aires, Argentina, 17–22 November 1975; pp. 80–133. [Google Scholar]
- Meunier, A. Clays; Springer Science & Business Media: Berlin/Heidelberg, Germany, 2005. [Google Scholar]
Figure 1.
Grain size distribution of Fontainebleau sand NE34 and kaolinite clay.

Figure 2.
The S1 mixing scheme: sand-distilled water-clay.

Figure 3.
Improper sample preparation brings about soil specimen leakage from the space of the interface direct shear box: (a) leakage on the left of the shear box, (b) shear box and container, (c) leakage on the right of the shear box, (d) leakage in the front view, (e) soil sample without a good shape after dismantled and (f) soil leakage around upper part of the shear box.

Figure 4.
The schematic diagram of the whole designed oedometer cell after installation.

Figure 5.
The procedure of preparing sand–clay mixture samples for interface direct shear tests: (a) slurry prepared by S1 mixing protocol, (b) installation of the sample into of the designed preconsolidation cell, (c) step preconsolidation on the oedometer frame, (d) uninstall the cell, (e) trimming the specimen with a cutter, (f) move to the shear box, (g) put the sample into the shear box with a rod, (h) after flatting put a filter paper and (i) move the shear box and container to the interface apparatus.

Figure 6.
Water content (w) at different layers of the sand–clay mixture sample after S1 preconsolidation (75% K clay content).
Figure 6.
Water content (w) at different layers of the sand–clay mixture sample after S1 preconsolidation (75% K clay content).

Figure 7.
Sample density at different layers of the sand–clay mixture sample (75% K clay content) after S1 preconsolidation.
Figure 7.
Sample density at different layers of the sand–clay mixture sample (75% K clay content) after S1 preconsolidation.

Figure 8.
Assessment of samples’ repeatability by: (a) water content, (b) void ratio, and (c) density after S1 preconsolidation as function of K clay content.
Figure 8.
Assessment of samples’ repeatability by: (a) water content, (b) void ratio, and (c) density after S1 preconsolidation as function of K clay content.

Figure 9.
Void ratio as a function of vertical stress during oedometer tests.

Figure 10.
The compressibility parameters of samples during oedometer tests: (a) Cc, (b) Eoed and (c) mv.
Figure 10.
The compressibility parameters of samples during oedometer tests: (a) Cc, (b) Eoed and (c) mv.

Figure 11.
Repeatability of the interface direct shear test on S1 sand–clay mixture samples of 75% clay content: (a) shear stress as a function of horizontal displacement and (b) Mohr–Coulomb envelope, critical adhesion and interface friction angles of the 1st and 2nd tests.
Figure 11.
Repeatability of the interface direct shear test on S1 sand–clay mixture samples of 75% clay content: (a) shear stress as a function of horizontal displacement and (b) Mohr–Coulomb envelope, critical adhesion and interface friction angles of the 1st and 2nd tests.


Table 1.
Chemical composition of K Clay.
| Composition | CaO | SiO2 | Al2O3 | Fe2O3 | Na2O | K2O | MgO | LOI 1 |
|---|---|---|---|---|---|---|---|---|
| Mass% | 1.13 | 68.44 | 26.93 | 2.57 | 0.01 | 0.12 | 0.11 | 0.68 |
1 LOI: loss on ignition.
Table 2.
The liquid limit of sand–clay mixture as a function of clay content.
| K Clay Content (%) | 25 | 50 | 60 | 75 | 100 |
|---|---|---|---|---|---|
| Liquid limit (%) | 17.93 | 22.41 | 26.77 | 31.01 | 37.30 |
Publisher’s Note: MDPI stays neutral with regard to jurisdictional claims in published maps and institutional affiliations. |
© 2021 by the authors. Licensee MDPI, Basel, Switzerland. This article is an open access article distributed under the terms and conditions of the Creative Commons Attribution (CC BY) license (https://creativecommons.org/licenses/by/4.0/).
Share and Cite
MDPI and ACS Style
Yin, K.; Liu, J.; Vasilescu, A.-R.; Di Filippo, E.; Othmani, K. A Procedure to Prepare Sand–Clay Mixture Samples for Soil–Structure Interface Direct Shear Tests. Appl. Sci. 2021, 11, 5337. https://doi.org/10.3390/app11125337
AMA Style
Yin K, Liu J, Vasilescu A-R, Di Filippo E, Othmani K. A Procedure to Prepare Sand–Clay Mixture Samples for Soil–Structure Interface Direct Shear Tests. Applied Sciences. 2021; 11(12):5337. https://doi.org/10.3390/app11125337
Chicago/Turabian StyleYin, Kexin, Jiangxin Liu, Andreea-Roxana Vasilescu, Eugenia Di Filippo, and Khaoula Othmani. 2021. "A Procedure to Prepare Sand–Clay Mixture Samples for Soil–Structure Interface Direct Shear Tests" Applied Sciences 11, no. 12: 5337. https://doi.org/10.3390/app11125337
Note that from the first issue of 2016, this journal uses article numbers instead of page numbers. See further details here.