Article

Application of Visible/Near Infrared Spectrometers to Quickly Detect the Nitrogen, Phosphorus, and Potassium Content of Chemical Fertilizers

1
College of Biosystems Engineering and Food Science, Zhejiang University, Hangzhou 310058, China
2
Shanghai Wuling Optics Co., Ltd., Shanghai 200431, China
3
State Key Laboratory of Rice Biology, China National Rice Research Institute, Hangzhou 310006, China
4
Huanan Industrial Technology Research Institute, Zhejiang University, Guangzhou 510700, China
*
Author to whom correspondence should be addressed.
Appl. Sci. 2021, 11(11), 5103; https://doi.org/10.3390/app11115103
Submission received: 29 April 2021 / Revised: 24 May 2021 / Accepted: 26 May 2021 / Published: 31 May 2021
(This article belongs to the Section Agricultural Science and Technology)

Abstract

:
The rapid determination of nitrogen, phosphorus, potassium and other major nutrient elements is an important technical guarantee in the quality control of chemical fertilizers. In this study, a small visible spectrometer and a small near-infrared spectrometer were used to collect spectrum information of 33 different common chemical fertilizers including compound fertilizers, blended fertilizers and controlled-release fertilizers. The 550~950 nm and 1050~1640 nm spectra with stable signals were intercepted as the analysis spectrum, and the competitive adaptive reweighted sampling algorithm (CARS) was used to select 161, 229, and 161 spectral characteristic wavelengths for the three nutrient contents of N, P2O5, and K2O respectively. The partial least squares (PLS) and extreme learning machine (ELM) models of N, P2O5, and K2O were established based on the 550~950 nm waveband, 1050~1640 nm waveband, full spectrum, and characteristic wavelength, respectively. The coefficient of determination ( R 2 ), root mean square error (RMSE), and residual predictive deviation (RPD) were used to evaluate the effect of the model. With the optimal prediction models, the values of R p 2 for N, P2O5, and K2O were 0.989, 0.963, 0.981, and for RPD were 9.71, 5.09, 7.29, respectively. The research results show that Vis/NIR spectroscopy can predict the content of nitrogen, phosphorus, and potassium nutrients in fertilizers, and the near-infrared band from 1050 nm to 1640 nm has a better prediction effect. The characteristic wavelength selection reduces the spectral variables by 9/10, and the performance of the model based on the characteristic wavelength is close to that of the full-spectrum model.

1. Introduction

In modern agriculture, chemical fertilizer is applied to provide necessary nutrients for crops to improve the quality and yield of crops. Commonly used chemical fertilizers mainly include compound fertilizer, controlled-release fertilizer, blended fertilizer, etc. Controlled-release fertilizer can regulate the release of nutrient elements in chemical fertilizer for a long time. Compound fertilizer and blended fertilizer contain two or more kinds of nutrient elements, which have the advantages of high nutrient content, less subsidiary ingredients and good physical properties. Most of the compound fertilizers in actual use are inorganic compound fertilizers, which use phosphoric acid, ammonia, etc. as raw materials, and are produced through mechanical processing, drying, screening, and cooling. Different from fertilizers with a single nutrient element such as urea, compound fertilizers and blended fertilizers can simultaneously apply multiple nutrient elements to achieve balanced fertilization and improve fertilizer utilization efficiency. Therefore, they are more and more widely used in agricultural production.
Inorganic compound fertilizers mainly contain three macronutrient elements: nitrogen (N), phosphorus (P), and potassium (K). The three macronutrient elements have different effects on the growth of plants. Nitrogen is the main nutrient element in plants and the main element that constitutes plant proteins and enzymes. Nitrogen application can not only increase yield, but also increase photosynthesis, leaf area yield, and net assimilation rate [1]. Phosphorus is an important element for plant growth and production, and its content in the plant is about 0.05~0.5% of the total dry weight of the plant. At the whole plant level, phosphorus can stimulate seed germination, increase root and stem development and stem strength, promote the formation of flowers and seeds, and increase crop yields [2]. Potassium is a very active element in plants, generally in the form of K ions, shuttled inside and outside plant cells. Although potassium is not part of the main chemical structure of plants such as proteins, nucleic acids, lipids, peptides, amino acids, etc., it plays many important regulatory roles in the process of enzyme activation, sugar transport, protein synthesis, etc. It can improve crop yield and quality, and is necessary for many plant growth processes [3].
Most chemical fertilizers can apply multiple nutrient elements at the same time, but the percentage of each nutrient element in a single fertilizer is fixed. Therefore, it is necessary to accurately know the specific nutrient element composition of the fertilizer when using it. The inaccurate content of nutrient elements in the fertilizer will directly cause plant growth problems and pollution of the soil environment. Although national standards and industry standards have been established for chemical fertilizers, there are some chemical fertilizer products on the market that do not meet the standards due to substandard raw materials, backward production processes, storage and transportation losses, and other reasons. Traditionally, the content of nitrogen, phosphorus, and potassium in fertilizers is detected by chemical methods, such as the potassium tetraphenylborate gravimetric method [4], quinoline phosphomolybdate gravimetric method [5], temperature titration method [6], etc. Chemical methods can accurately measure the content of nutrient elements in fertilizers, but it usually has complex pretreatment processes and harsh detection conditions. Samples need to be sent to a special laboratory for measurement, resulting in high economic and time costs, and cause secondary pollution during the detection process. In the process of chemical fertilizer use, a method that can quickly detect the content of various nutrients in fertilizers is needed to determine whether the quality of fertilizers meets the standards and whether there are problems such as spoilage.
The visible/near-infrared (Vis/NIR) spectroscopy technology measures the content of components in substances through the selective absorption of visible/near-infrared light by the functional groups of the substances. It has the characteristics of fast analysis speed, low cost, being non-destructive, requiring fewer samples, fast preparation, and that multiple characteristics can be analyzed from a single spectral scan. It is widely used in the quantitative detection and qualitative identification of inorganic, organic, and biological components in complex mixtures and matrices. In recent years, there has been more and more research on the use of Vis/NIR spectroscopy to detect the content of various nutrients in fertilizers. Lin et al. used Vis/NIR spectroscopy to quickly analyze the organic matter content, total nitrogen content, pH value in the soil and the main nutrient element content in the fertilizers [7]. Wang et al. quantitatively analyzed the total nitrogen content of ammonium phosphate fertilizer based on Vis/NIR spectroscopy and least square support vector machine. The R2 and the root mean square error (RMSEP) of the validation set are 0.91 and 0.101 respectively [8]. Wang et al. used NIR spectroscopy and partial least squares to quickly assess the quality of organic fertilizers. It was found that the predictions of total organic matter, water-soluble organic nitrogen, pH, and germination rate are more accurate, while the results of water content, total nitrogen, electrical conductivity, and water-soluble organic carbon are less accurate [9]. These researchers have well explored the value of Vis/NIR spectroscopy in fertilizer quality detection. However, they all used high-precision spectrometers, which are expensive in practical application and difficult to popularize. At the same time, the fertilizer samples collected in research are generally of a single variety, and the distribution gradient of nutrient element content in different samples is not sufficiently dispersed, and cannot well cover the nutrient content range of most chemical fertilizers on the market. In this research, some chemical fertilizer samples which have good gradient of N, P2O5, and K2O nutrient content were gained, and the spectral signals of the fertilizer samples were collected using small visible/near-infrared spectrometers. Based on the spectral signal, different spectral detection models for the three nutrient contents of N, P2O5, and K2O in common fertilizers were established so as to provide a reliable basis and method for the rapid detection of nutrient contents in actual chemical fertilizer applications.

2. Materials and Methods

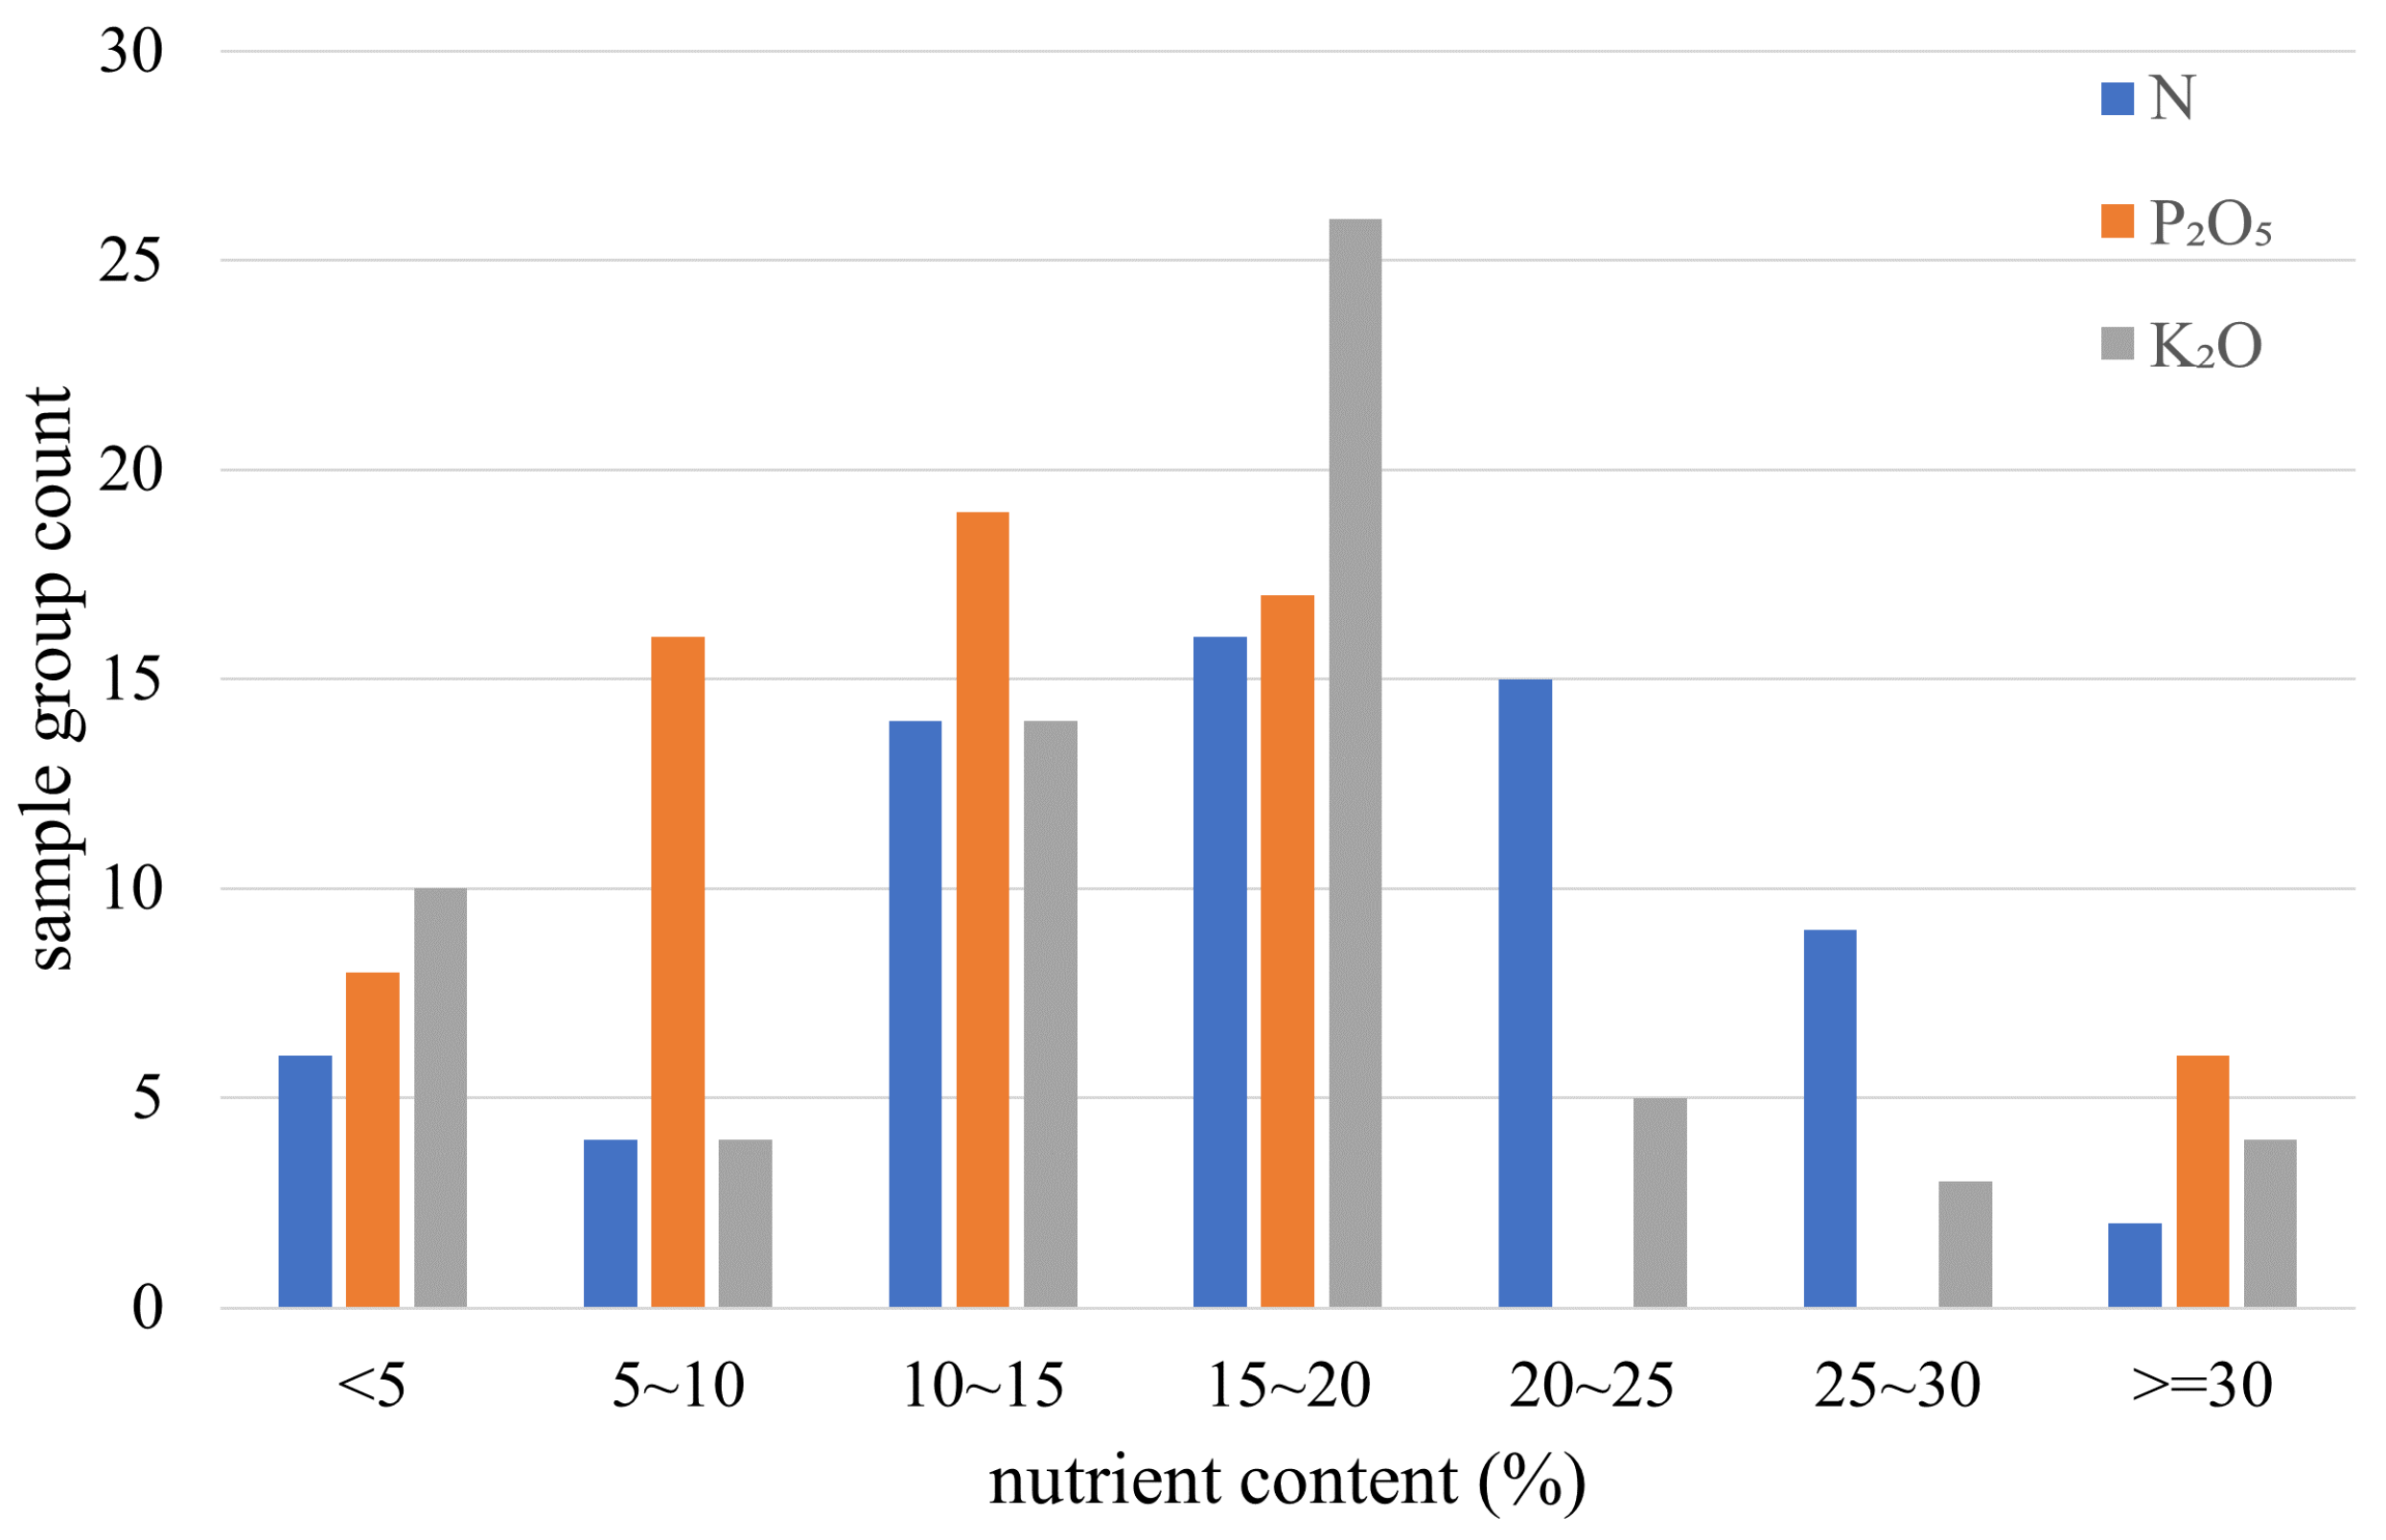
2.1. Sample Preparation

This research collected 33 representative different chemical fertilizers. These fertilizers included compound fertilizers, controlled-release fertilizers, and blended fertilizers, which have different colors, particle sizes, surface roughness, and other characteristics in the original appearance. The 33 kinds of fertilizers contained two or more effective nutrient elements of nitrogen, phosphorus, and potassium, which are reflected in the three equivalent detection indicators of N, P2O5, and K2O. For each fertilizer, 2 different batches of 2 kg each were randomly selected as the A and B groups, forming 66 independent sample groups. For each independent sample group, fertilizers were detected for N, P2O5, and K2O content according to the method described in the national standard GB 15063-2009. The detection results of the nutrient content in fertilizers are shown in Table 1.
The distribution of N, P2O5, and K2O content detected in all sample groups is shown in Figure 1. Combined with Table 1, the N content of fertilizers in this research is mainly distributed between 0% and 30%, the P2O5 content is mainly distributed between 0% and 20%, and the K2O content is mainly distributed between 0% and 25%. From the average value and standard deviation of the three nutrient contents, it can be seen that the nutrient contents between the sample groups have an obvious gradient distribution, which can well represent most chemical fertilizers in practical applications.
In each sample group, 16 independent samples were randomly sampled; each sample was about 100 g. Since there were 66 chemical fertilizer sample groups, a total of 1056 samples were formed. The calibration set and the prediction set were randomly divided at a ratio of 3:1, with 792 samples in the calibration set and 264 samples in the prediction set. Each sample was ground with a blade grinder which has a maximum speed of 29,000 rpm and then passed through a standard sieve with an aperture of 0.355 mm to form a powdery sample with uniform particle size.

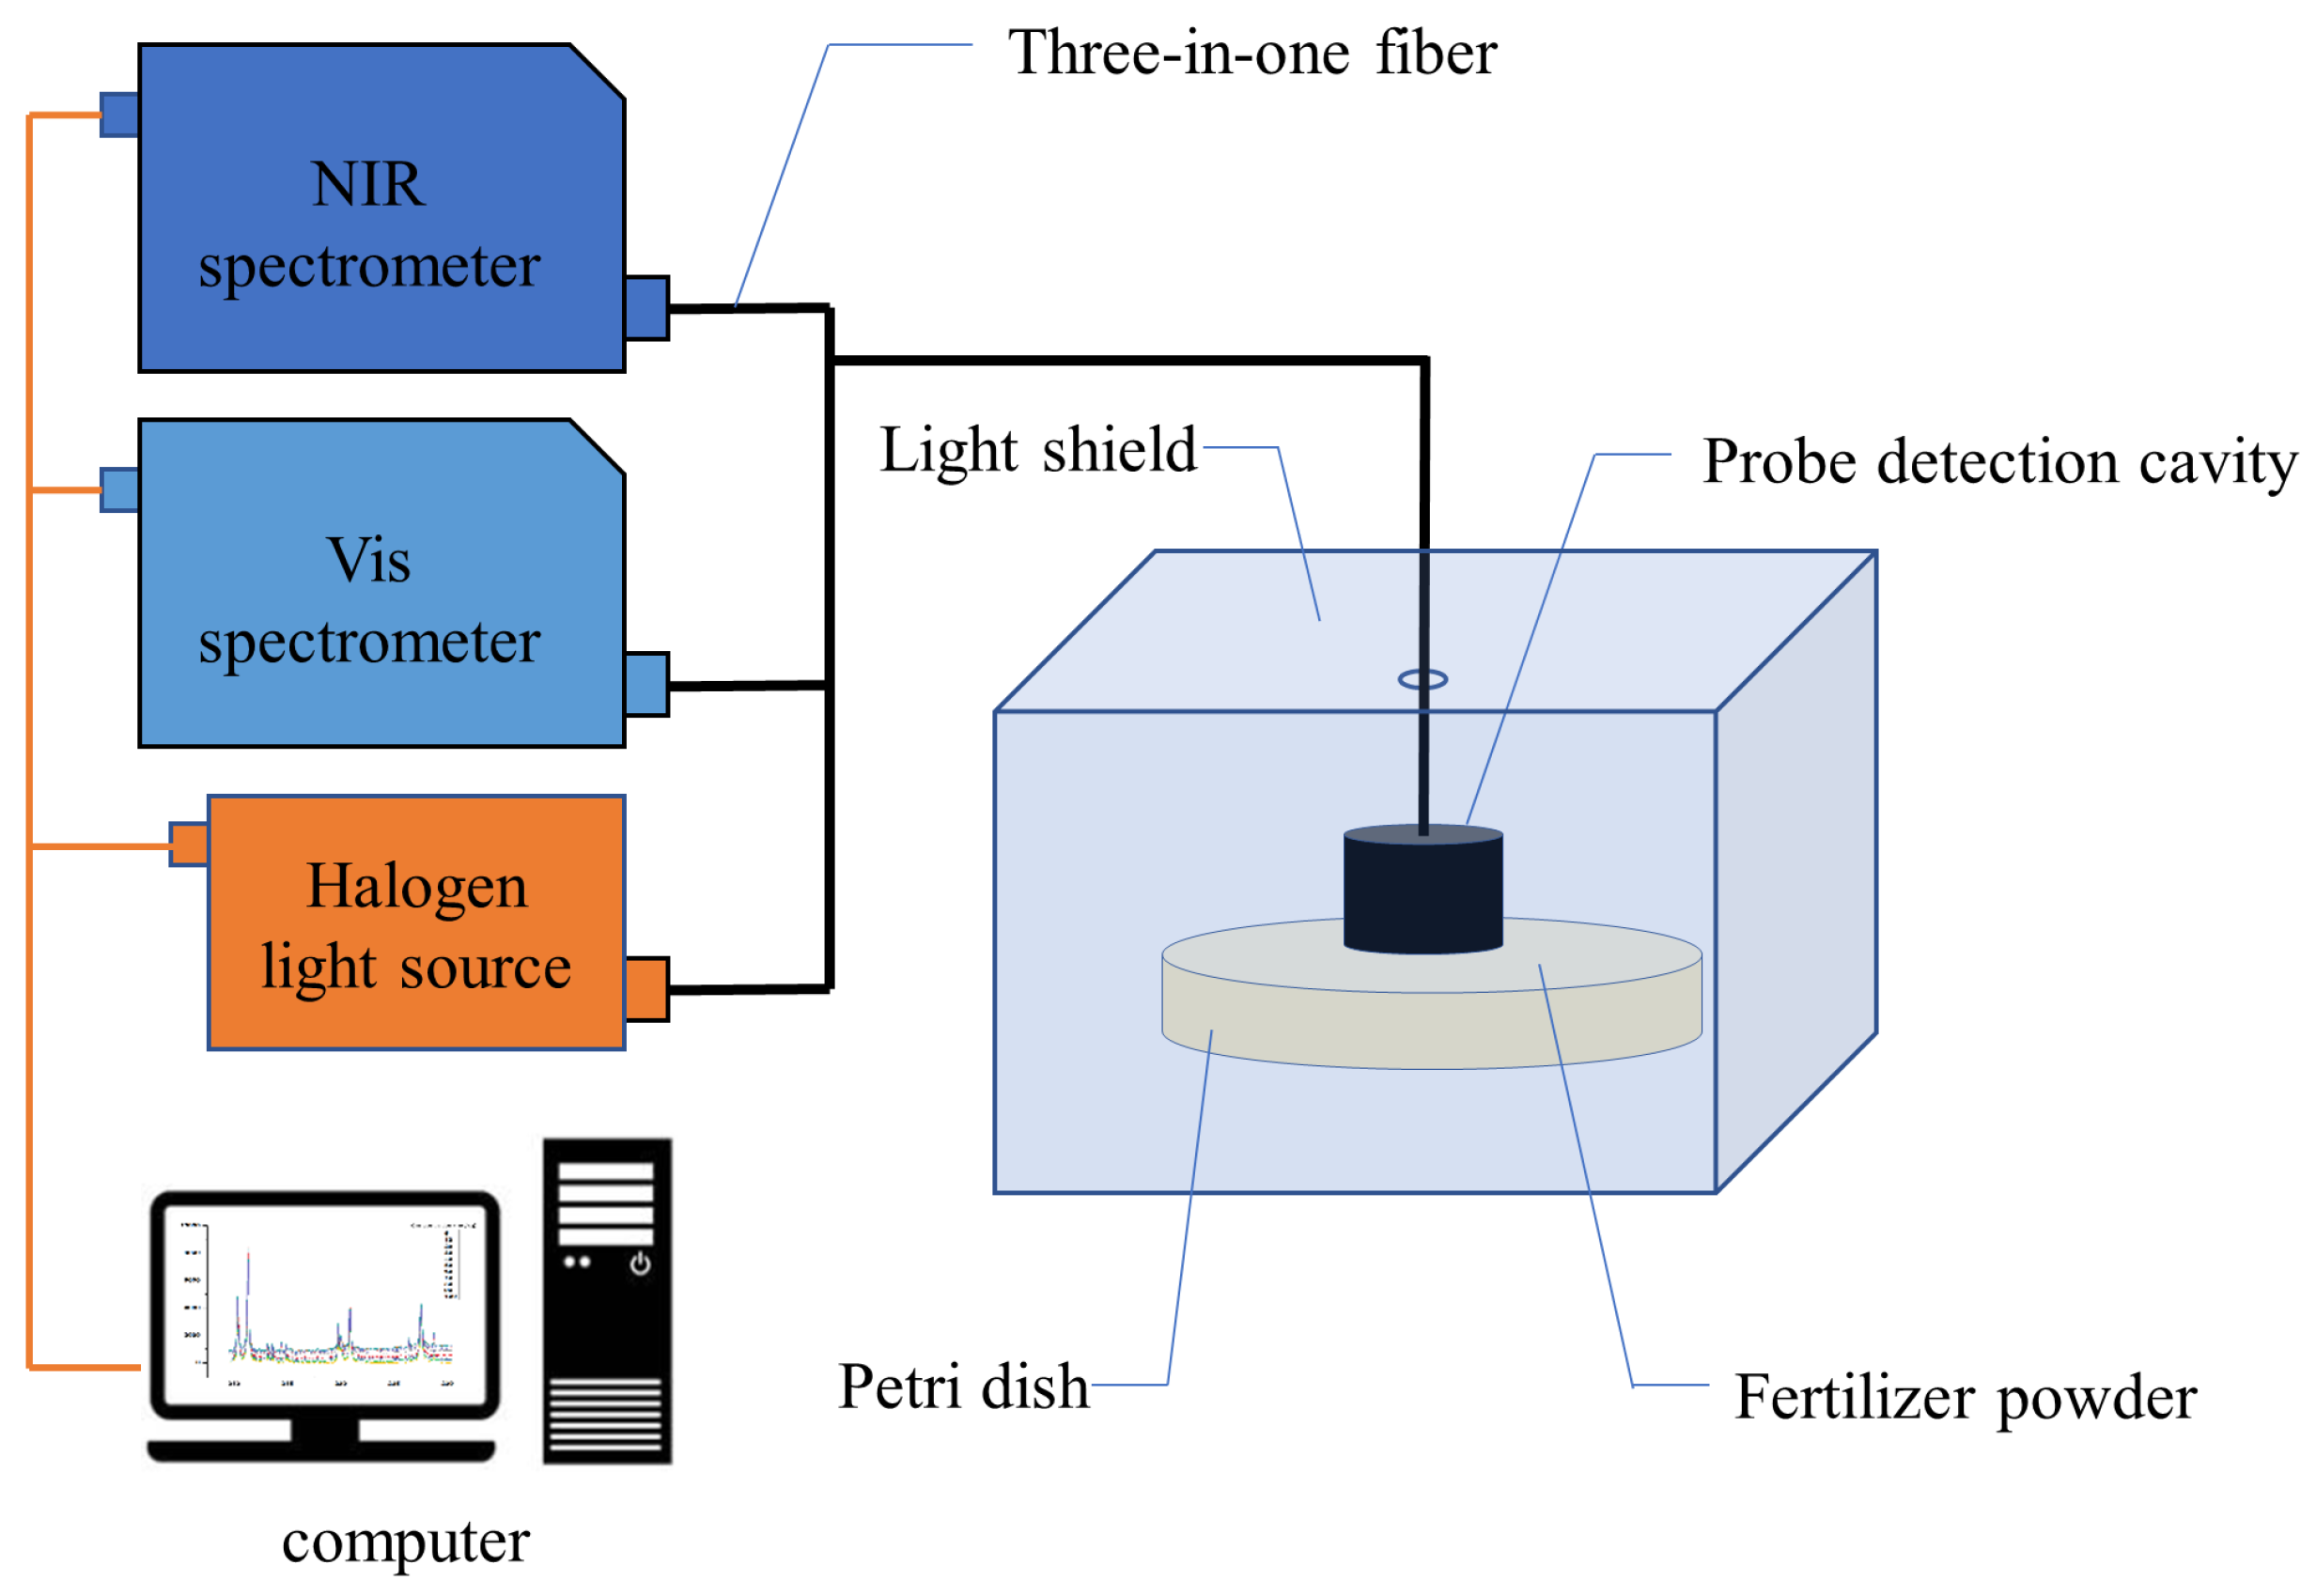
2.2. Vis/NIR Spectroscopy Instrumentation

The equipment for collecting spectral signals is shown in Figure 2. It included a portable NIR spectrometer, a portable Vis spectrometer, and a halogen lamp. The NIR spectrometer (SW2520, Wuling Optics Co., Ltd., Shanghai, China) has a measurement wavelength range of 950~1700 nm, and the highest optical resolution is 8.0 nm. The Vis spectrometer (EE2063, Wuling Optics Co., Ltd., Shanghai, China) has a measurement wavelength range of 180~1100 nm, and the highest optical resolution is 0.2 nm. The two spectrometers and the halogen lamp were connected to each other through a three-in-one optical fiber. The halogen light source was emitted from the end of the optical fiber to the probe detection cavity. After the light was reflected on the sample surface, it entered the NIR/Vis spectrometers through the optical fiber. The two spectrometers collected spectral signals synchronously, and both were set to automatically save the average value of 5 consecutive spectral signals. Both spectrometers were set to save the spectrum signal with 0.5 nm accuracy in order to unify the data processing. For the case where the highest optical resolution of the spectrometer was lower than 0.5 nm, the software automatically performed interpolation operations.

2.3. Data Analysis

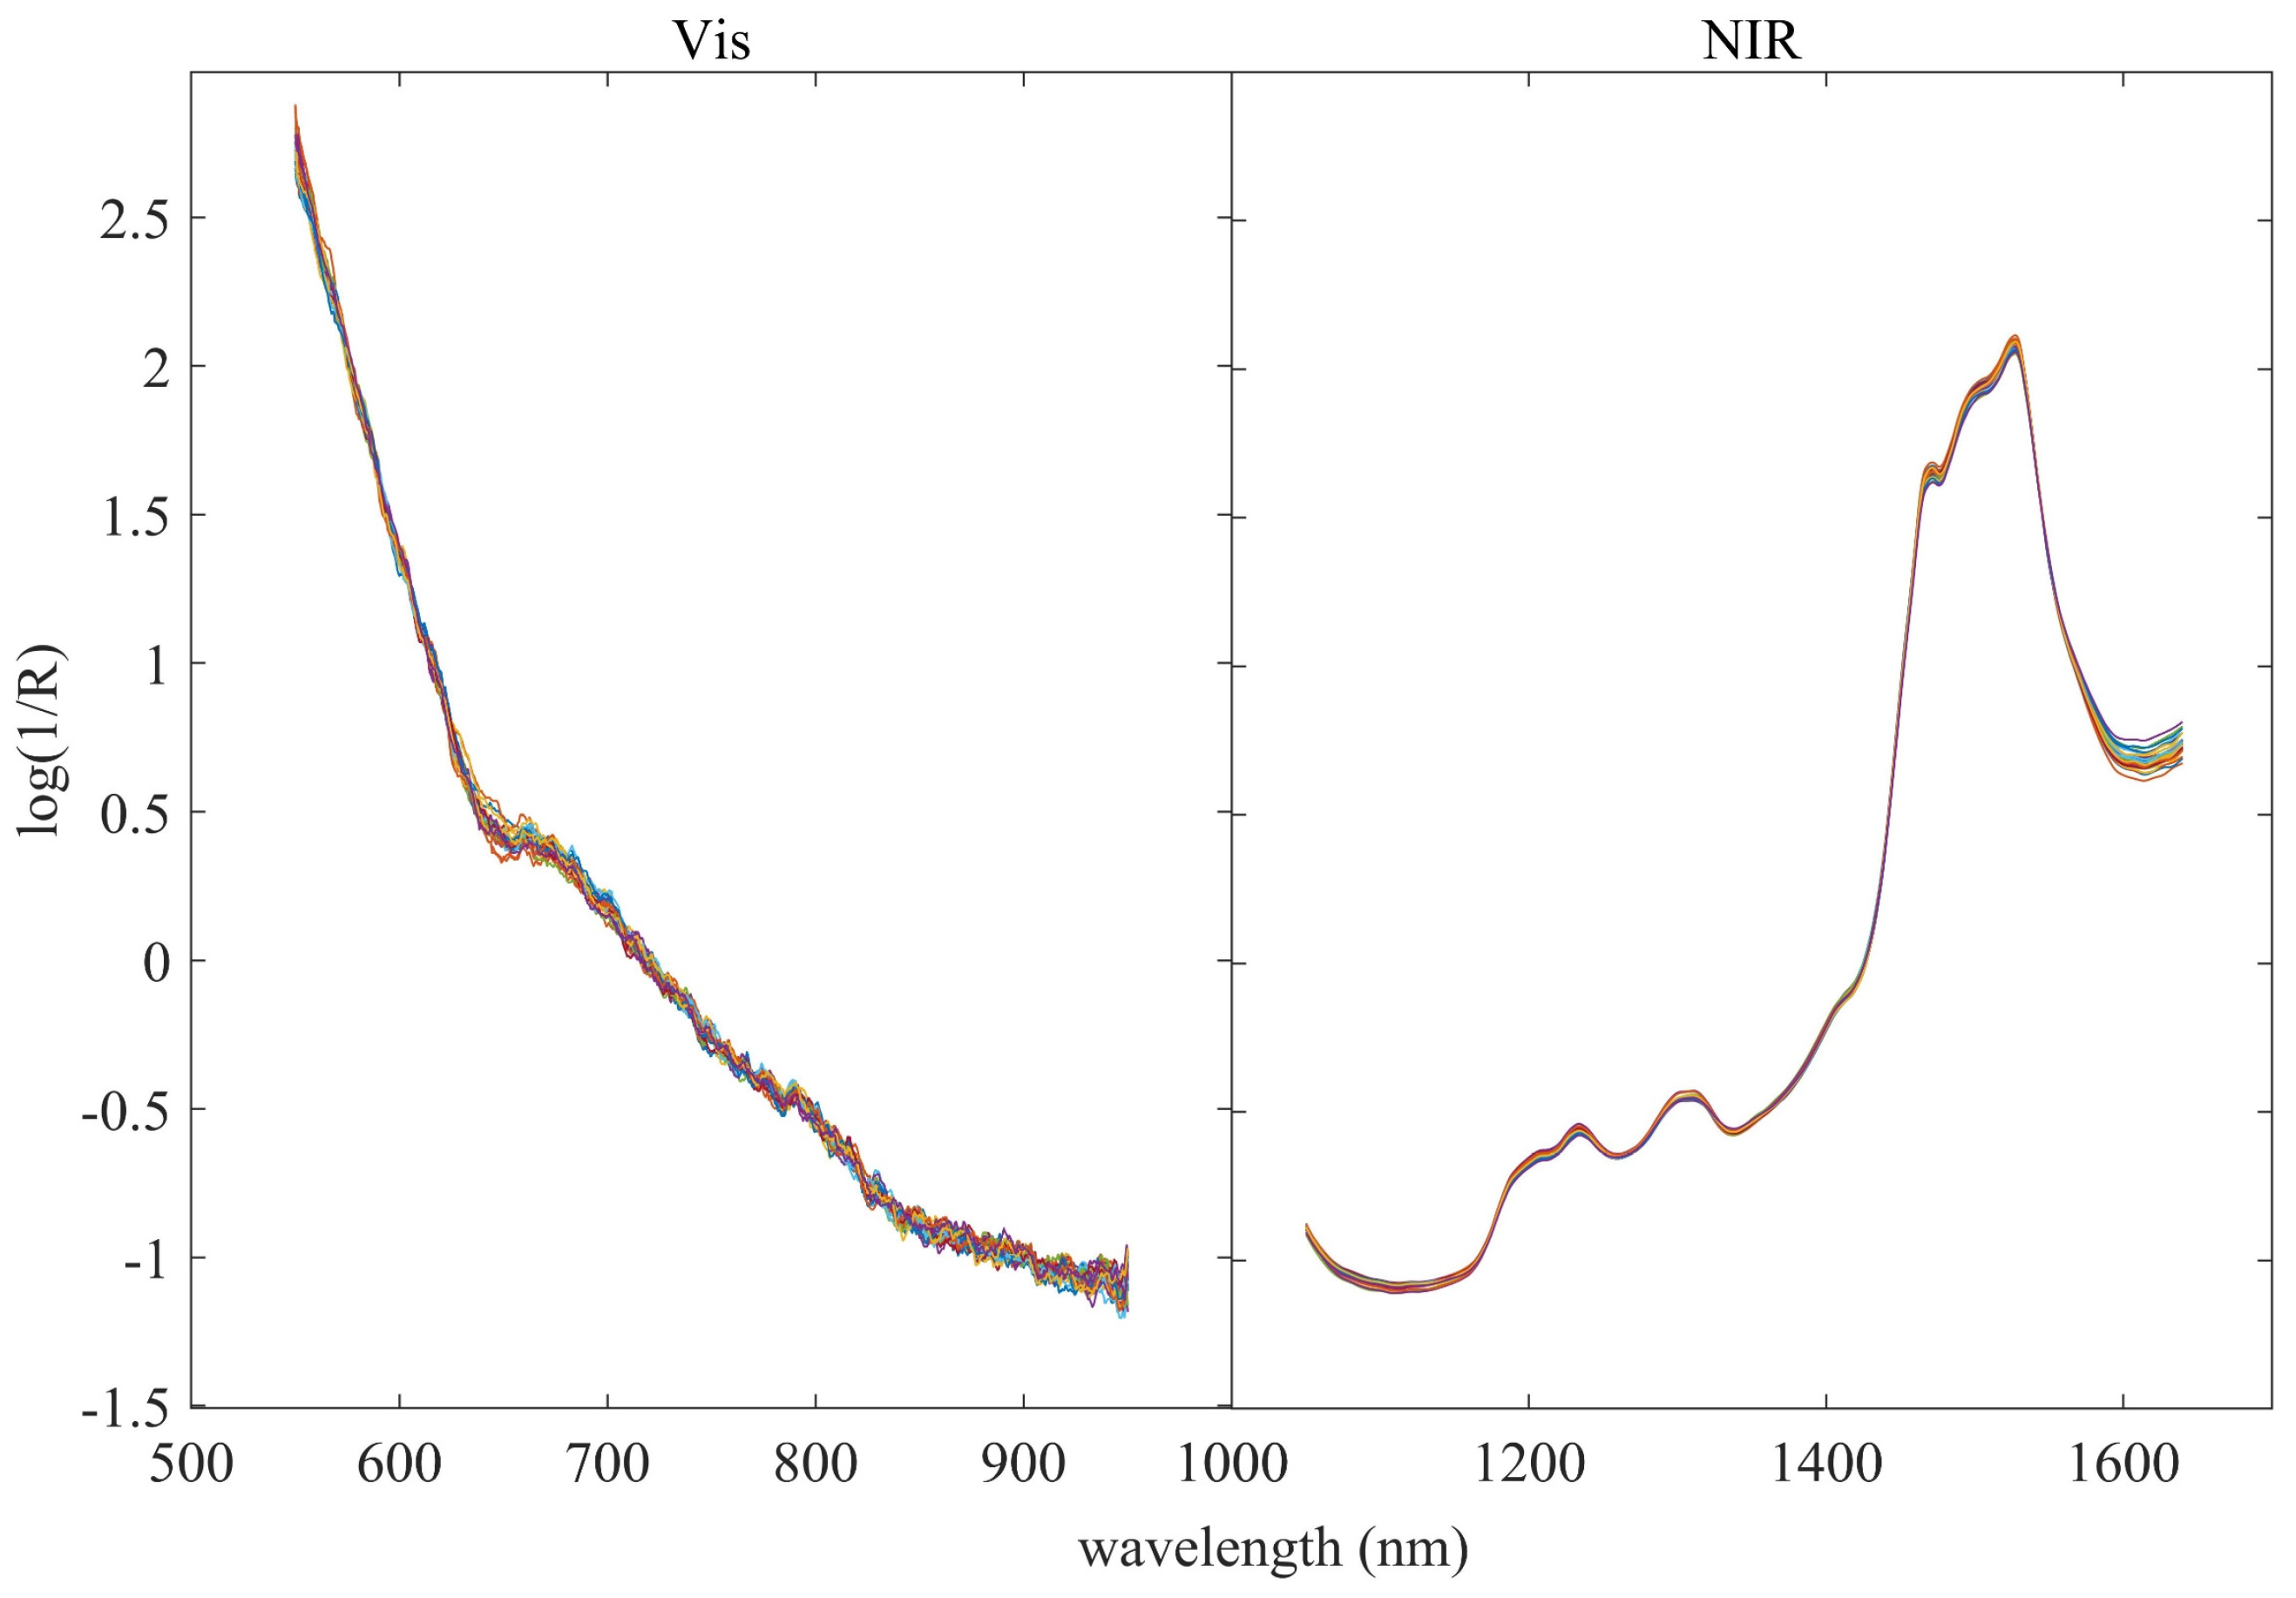
2.3.1. Data Preprocessing

Vis/NIR spectroscopy is generally affected by the overlapping spectral response of sample components, as well as interference from sources of error including instrument noise and drift, light scattering, and optical path changes during measurement [10]. Many researchers have shown that data preprocessing methods can effectively reduce the possible fluctuations in the Vis/NIR spectrum and improve the stability of the signal. Proper preprocessing can reduce the system and random errors of the instrument and the environment to gain better models [11,12]. The preprocessing methods commonly used in spectral analysis generally include smoothing, derivative [13], standard normal variate (SNV), and multivariate scattering correction [14], etc.
This research used the Savitzky–Golay (S–G) smoothing algorithm and standard normal variate (SNV) for preprocessing. S–G smoothing increases the signal-to-noise ratio without causing significant distortion to the spectrum [15]. It is a convolution process that uses the least squares method to fit a continuous subset of adjacent points with a low-order polynomial. SNV is widely used to eliminate random errors and fluctuations caused by equipment and external factors such as temperature, pressure, and pulse energy. It uses the standard deviation of the response to normalize each spectrum value to correct the spectrum. The formula is as follows:
SNV   correction :   X s n v = X i x ¯ σ
where X i is the spectral value of the i-th wavelength point, x ¯ is the average spectrum value of all wavelength points, and σ is the standard deviation of all wavelength points.

2.3.2. Statistical Analysis

After preprocessing the spectrum, the calibration set was input into the multiple regression model for analysis. According to the generated regression model, the nutrient content of the prediction set was predicted, so as to evaluate the performance of the model. The models used include partial least squares (PLS) and extreme learning machines (ELM). The competitive adaptive reweighted sampling algorithm (CARS) was used to select the characteristic wavelength of the spectral data.
PLS is a universal chemometric modeling method proposed by O. A. Wold in 1983. PLS can not only decompose the spectral information matrix and the concentration matrix, but also greatly reduce the interference of noise signals on the effective spectral signals [16]. PLS respectively projects the predictor variable X and the observed variable Y into a new space, and tries to find the multidimensional direction of the X space to explain the multidimensional direction of the largest variance in the Y space. The number of principal components in the PLS is directly related to the prediction performance of the regression model. Too few principal components will lose the effective information in the spectrum, and too many principal components will cause the noise to be retained and reduce the prediction accuracy.
ELM is a machine learning method based on feedforward neural network (FNN), which can be used for supervised learning and unsupervised learning problems [17]. Its characteristic is that the weights of hidden layer nodes are randomly or artificially given and do not need to be updated. The learning process only calculates the output weights [18]. In many cases, ELM shows better generalization performance than gradient-based machine learning methods, and because ELM does not require gradient operations, it has a very fast training speed.
CARS is an efficient variable selection method, whose main idea is derived from the principle of “survival of the fittest” in Darwin’s theory of evolution. Regarding each variable as an independent unit, adaptive reweighting sampling technology is used to select variables with larger absolute values of regression coefficients in the model, and variables with small weights are eliminated to obtain a series of subsets containing multiple variables. Finally, RMSE is calculated for each subset interactive verification, and the subset with the smallest RMSE value is selected and output [19]. Usually the CARS method uses the PLS model for modeling calculations, and the CARS method has been widely used in the selection of characteristic wavelengths of spectral data.

2.3.3. Performance Evaluation

The coefficient of determination ( R 2 ), root mean square error (RMSE), and residual predictive deviation (RPD) are used to comprehensively evaluate the effect of the trained model on the prediction of N, P2O5, and K2O content in fertilizers. R 2 represents the goodness of fit between the predicted value and the experimental value. R c 2 and R p 2 are used as the coefficients of determination for the calibration set and the prediction set, respectively. The closer the value of R 2 is to 1, the better the fit of the model. RMSE is used to measure the deviation between the predicted value and the experimental value. RMSECV and RMSEP are the root mean square error of the calibration set and the predicted set, respectively. The smaller the value of RMSECV and RMSEP, the smaller the deviation between the predicted value and the experimental value, and the higher the accuracy of model prediction. RPD is defined as the standard deviation of the predicted value divided by the RMSEP, which is a measure of the effectiveness and overall predictability of the regression model. The larger the RPD, the better. The calculation of these parameters is as follows:
R 2 = 1 i = 1 N ( y i ^ y i ) 2 i = 1 N ( y i y ¯ ) 2 ,
R M S E = i = 1 N ( y i y i ^ ) 2 N 1 ,
R P D = σ P R M S E P ,
where y i and y i ^ are the experimental value and predicted value of the nutrient content of the i-th sample, y ¯ is the average value of the experimental value, N is the number of samples, and σ P is the standard deviation of the predicted value. A model with excellent predictive performance has a higher R 2 and RPD.

3. Results

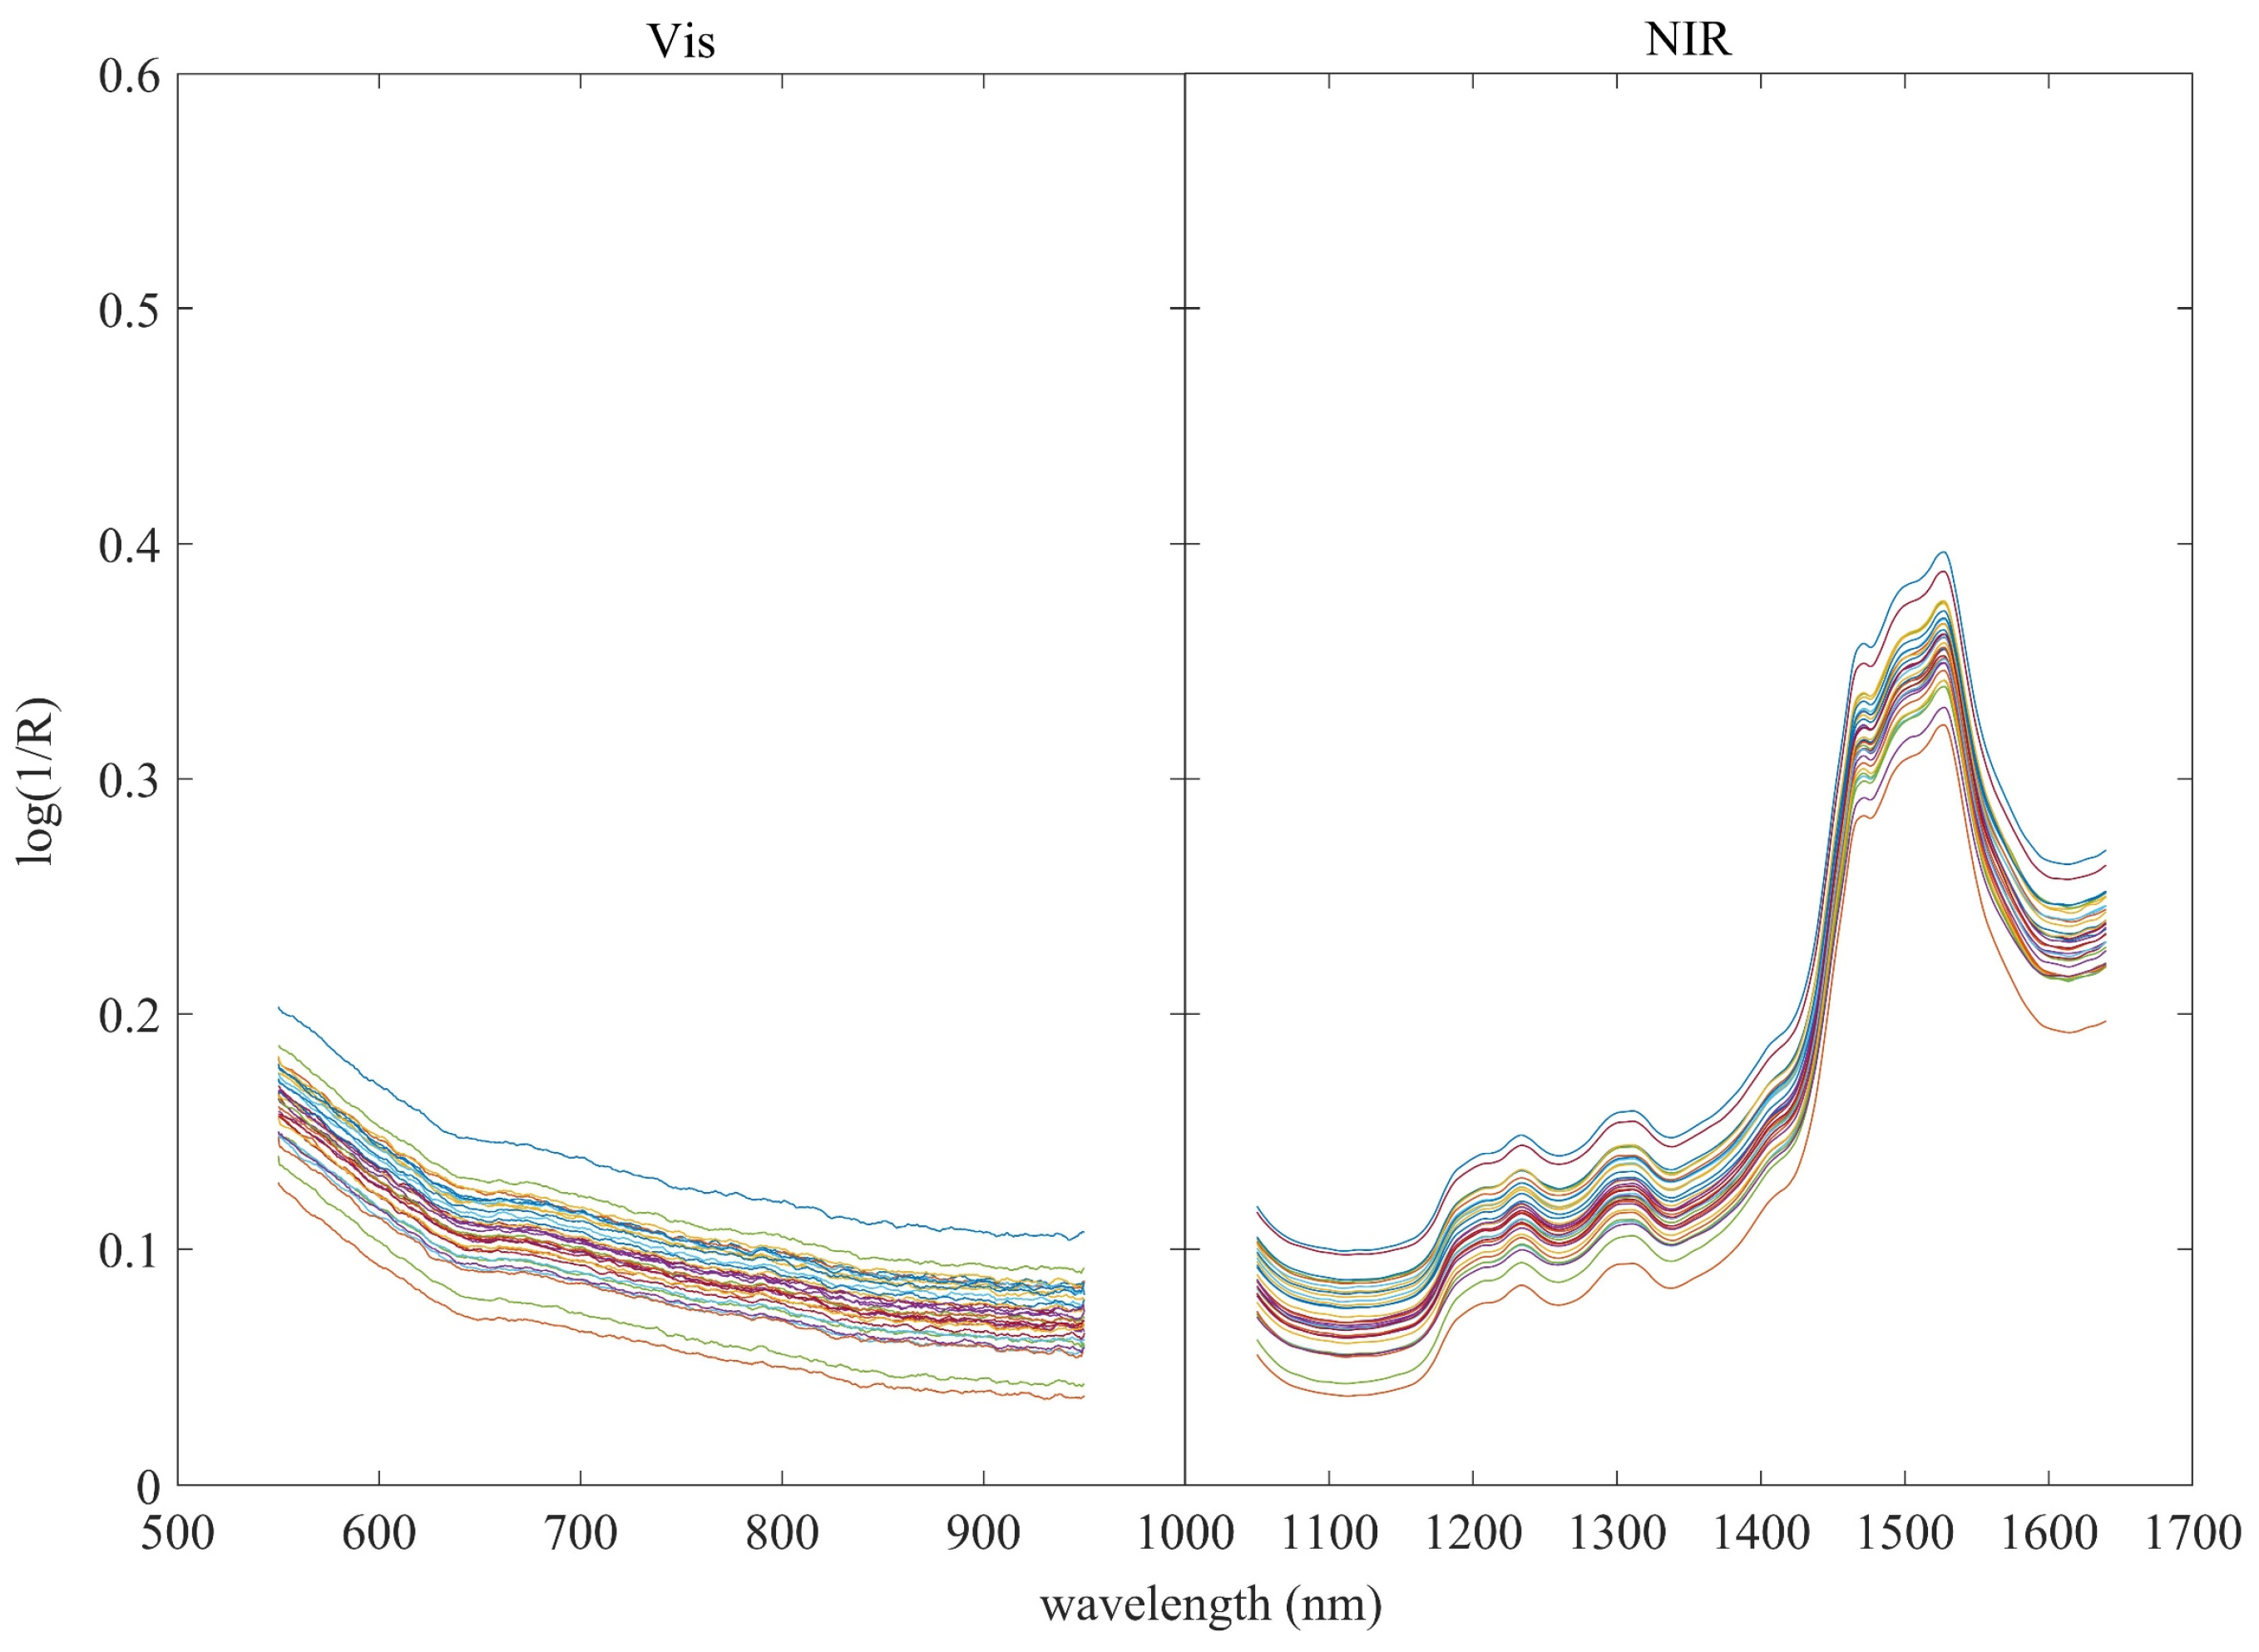
3.1. Spectral Analysis

This research collected the spectral signals of fertilizer samples in powder form. The specific process was as follows. The fertilizer powder was spread in a Petri dish with a diameter of 75 mm and the surface was smoothed with a glass plate, the probe detection cavity was connected at the end of the three-in-one optical fiber, and the probe detection cavity was placed on the flat surface of the fertilizer powder for measurement. The light source and spectrometers were turned on, and after the temperature of the light source and spectrometers stabilized, the spectral signals were collected. The whole experiment process was carried out under shaded conditions. Combining the band coverage of the light source and the performance of the spectral signals in different bands, the spectral band with large noise was removed, and finally the spectral signals of 550~950 nm in the Vis spectrometer, and 1050~1640 nm in the NIR spectrometer were intercepted, as the original spectrum for subsequent analysis. The spectral curves of one sample group is shown in Figure 3.
Although spectra were collected by two different portable spectrometers, the spectral curves of the two spectrometers had relatively good continuity. In the original spectral curves, different fertilizers show obvious differences in the visible light band and the near-infrared band. Since the content of each nutrient element in the samples collected in this experiment had a large span, the spectral morphology between different fertilizer types also showed obvious difference. After obtaining the original spectra, the S–G smoothing and SNV methods were used to preprocess the spectra, and the final spectral curves are shown in Figure 4.

3.2. Selection of Characteristic Wavelength

There are often multiple correlations between different bands of the spectrum. These correlated band signals have redundancy, which increases the amount of calculation but hardly provides more effective information. At the same time, it may introduce noise signals or cause overfitting of the model. In spectral analysis, characteristic wavelengths are often extracted to reduce redundant variables. In this research, the CARS method was used to select characteristic wavelengths for the prediction of N, P2O5, and K2O content. The final results are shown in Table 2.
After the characteristic wavelengths were selected, the spectral variables were reduced to about one-tenth of the original, which greatly reduces invalid information. The characteristic wavelengths selected for N, P2O5, and K2O were all concentrated in 1050~1640 nm, indicating that the near-infrared band had a greater contribution to detection than the visible light band.

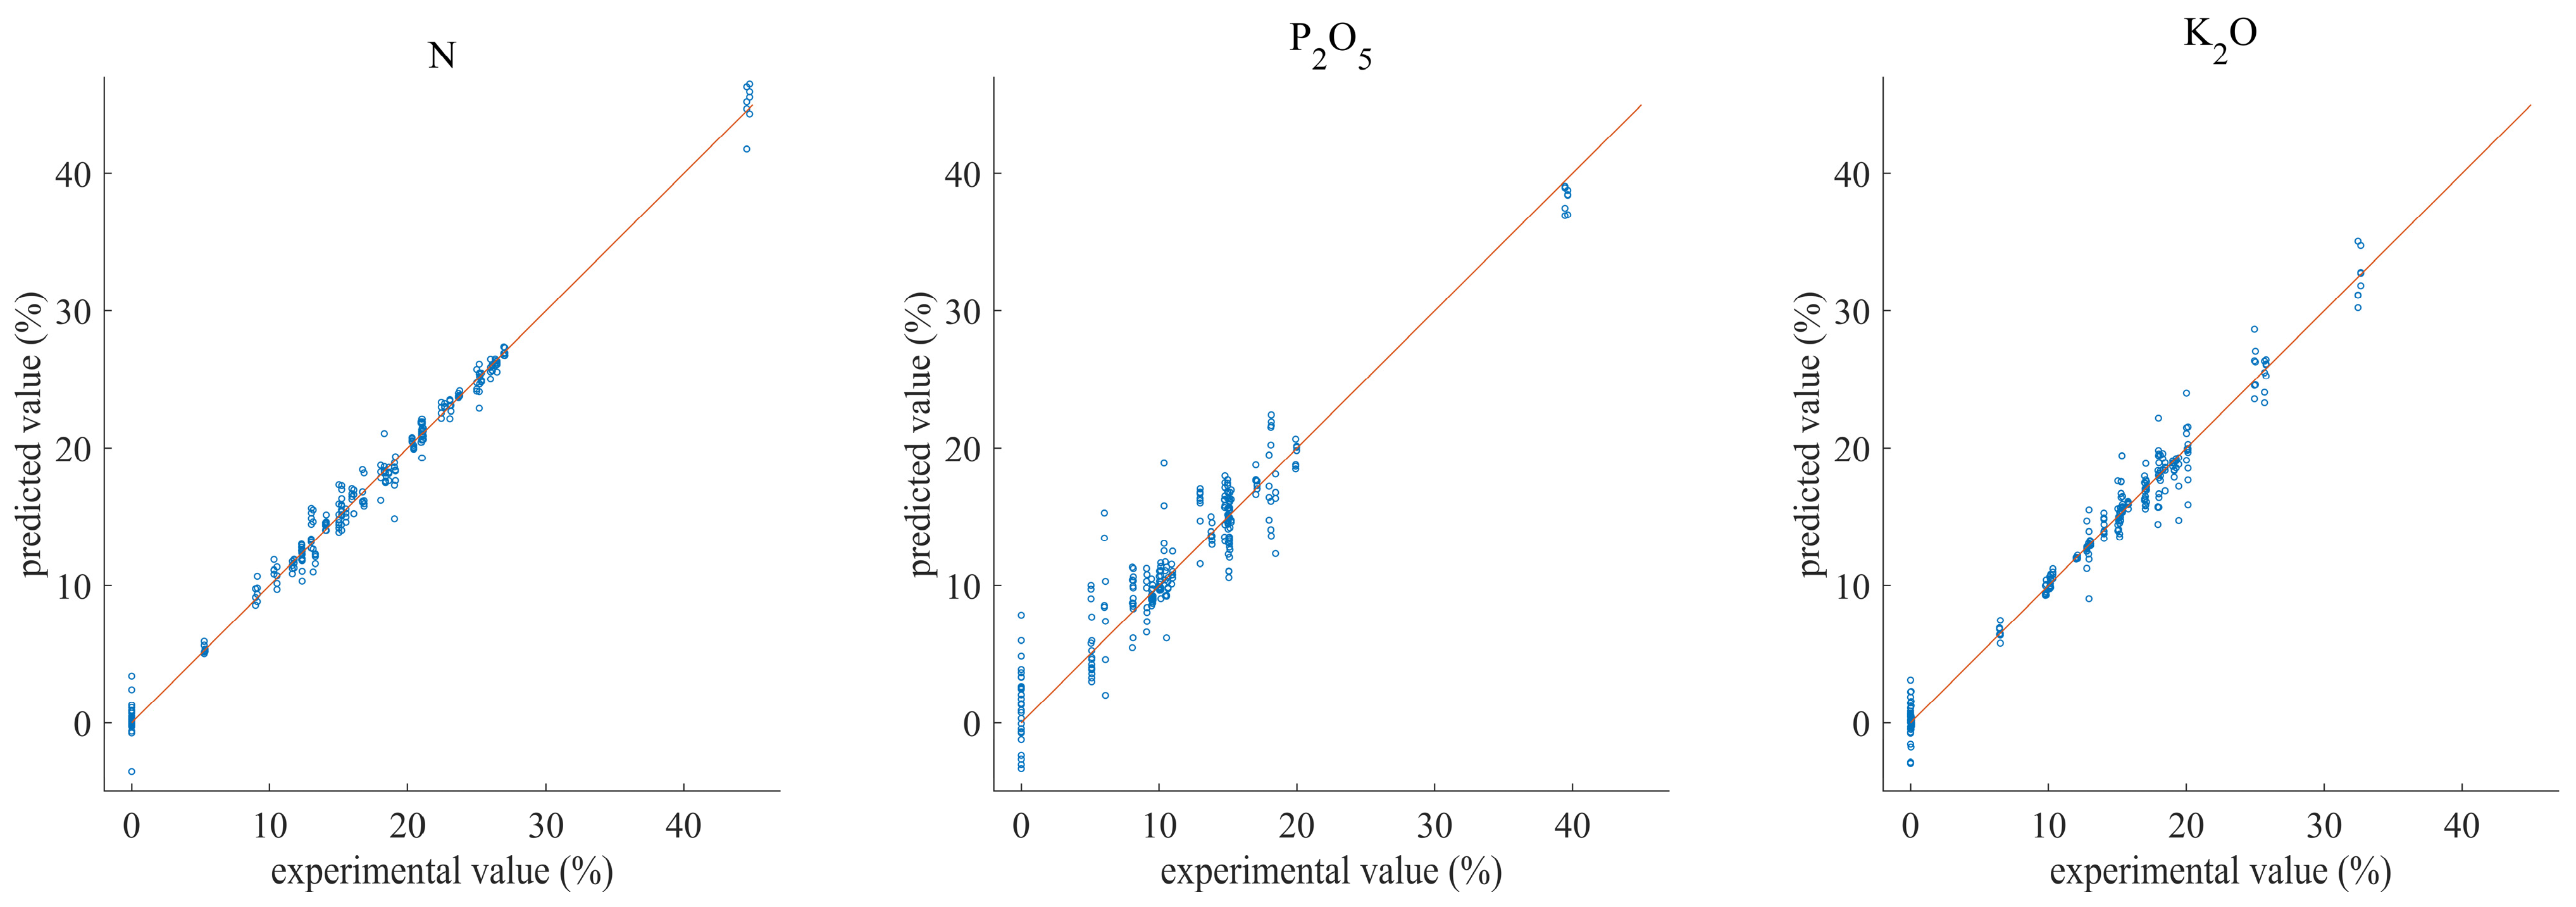
3.3. Multivariate Analysis

After spectra were preprocessed and the characteristic wavelength was selected, the PLS model and ELM model were established for 550~950 nm, 1050~1640 nm, full spectrum and characteristic wavelength, respectively. The maximum number of principal components in PLS was set to 25, the calibration set data was used to find the optimal number of principal components, and the model obtained by it was used to predict the prediction set data. The maximum number of hidden layer nodes of ELM was set to 200. In particular, for the characteristic wavelength, since the number of variables was reduced, the maximum number of hidden layer nodes of the ELM was set to 100. The final evaluation data of the regression model is shown in Table 3.
The results in Table 3 show that the full spectrum had a relatively good predictive effect on the content of N, P2O5, and K2O. The ELM model had a stronger nonlinear fitting ability, and had a better prediction performance for different nutrients than the PLS model. For example, with the full spectrum, the R p 2 of ELM was 0.945, while of PLS it was 0.853. Spectra of 1050~1640 nm had better predictive ability than those of 550~950 nm. For the three contents of N, P2O5, and K2O, although there were generally good fitting effects, the highest R p 2 of N content was 0.989, while the highest R p 2 values of P2O5 and K2O were 0.963 and 0.981, respectively. In general, the predictive ability of Vis/NIR spectroscopy for P2O5 was slightly worse than that of N and K2O. The model established based on the characteristic wavelength was basically the same as the full-spectrum model in terms of performance, and the gap was very small. Even the R p 2 of the characteristic wavelength was higher than the full spectrum in terms of P2O5. Therefore, the characteristic wavelength selected by CARS can well represent the original spectrum. The characteristic wavelength greatly reduces the number of spectral variables and model calculations while retaining effective information.
For N, P2O5, and K2O, the models with the highest RPD were selected to predict the prediction set, and a scatter plot of the experimental value and predicted value of each nutrient content was drawn. The result is shown in Figure 5.
It can be seen from Figure 5 that the correlation between the experimental and predicted values of the N content and K2O content in the prediction set was relatively good, and the prediction deviation of the nutrient content was basically within 5%, while the P2O5 content was not so ideal, with a maximum of 5~10% content prediction deviation.

4. Discussion

In this study, a small Vis spectrometer and a small NIR spectrometer were connected to each other through a three-in-one optical fiber. The two spectrometers jointly collected the spectrum information of 33 different fertilizers in powder state. S–G smoothing and the SNV method were used to preprocess the spectra, and then the CARS method was used to select the characteristic wavelength corresponding to N, P2O5, and K2O nutrient elements, respectively. The PLS and ELM models were established for 550~950 nm, 1050~1640 nm, full spectrum, and characteristic wavelength, respectively. The results of the study show that the near-infrared waveband from 1050 nm to 1640 nm has better prediction effects on fertilizer nutrient content than the visible light waveband from 550 nm to 950 nm. The characteristic wavelength and the full spectrum have almost equal prediction effects, and the characteristic wavelength reduces the spectral variables to the original by about 1/10 of that, effectively improving the quality of information in the spectra and reducing the amount of model calculations. In the end, the RPD values of the optimal prediction models for N, P2O5, and K2O were 9.71, 5.09, 7.29, and for R p 2 were 0.989, 0.963, and 0.981, respectively.
The experimental results show that for the commonly used chemical fertilizers such as compound fertilizers, blended fertilizers and controlled-release fertilizers, the small Vis/NIR spectrometer can accurately predict the nitrogen, phosphorus, and potassium content, and the effect is better in the near-infrared band. Feature wavelength selection can be used as an effective means to reduce calculation variables. The above content verifies the feasibility of using small spectrometers to predict the content of main nutrient elements in common chemical fertilizers. Especially for end users of chemical fertilizers, low-cost equipment that can quickly predict the nutrient content of different types of chemical fertilizers has important practical application value. In the future, at the same time it can be used as an important means to inspect and supervise the quality of chemical fertilizers in the market, and promote more scientific and reasonable use of chemical fertilizers.

Author Contributions

Conceptualization, J.S. and F.L.; methodology, J.S.; software, J.S.; validation, J.S., J.Z., and F.L.; formal analysis, J.Z.; investigation, H.C.; resources, H.C. and W.Q.; data curation, J.S.; writing—original draft preparation, J.S.; writing—review and editing, J.Z.; visualization, J.S., W.Q.; supervision, F.L.; project administration, F.L.; funding acquisition, F.L. All authors have read and agreed to the published version of the manuscript.

Funding

This research was funded by the Science and Technology Department of Guangdong Province, grant number 2019B020216001, and a cooperation project of Zhejiang University and Shanghai Wuling Optics Co., Ltd.

Institutional Review Board Statement

Not applicable.

Informed Consent Statement

Not applicable.

Data Availability Statement

The data presented in this study are available on request from the corresponding author. The data are not publicly available due to privacy.

Conflicts of Interest

The authors declare no conflict of interest.

References

  1. Leghari, S.J.; Wahocho, N.A.; Laghari, G.M.; HafeezLaghari, A.; MustafaBhabhan, G.; HussainTalpur, K.; Bhutto, T.A.; Wahocho, S.A.; Lashari, A.A. Role of nitrogen for plant growth and development: A review. Adv. Environ. Biol. 2016, 10, 209–219. [Google Scholar]
  2. Malhotra, H.; Sharma, S.; Pandey, R. Phosphorus nutrition: Plant growth in response to deficiency and excess. In Plant Nutrients and Abiotic Stress Tolerance; Springer: Berlin/Heidelberg, Germany, 2018; pp. 171–190. [Google Scholar]
  3. Prajapati, K.; Modi, H. The importance of potassium in plant growth—A review. Indian J. Plant Sci. 2012, 1, 177–186. [Google Scholar]
  4. Fan, B.; Chu, D.; Shang, Z. Improvement on determination of water-soluble potassium content in fertilizers by potassium tetraphenylborate gravimetric method and development of related international standard. Sci. Technol. Rev. 2014, 32, 32–38. [Google Scholar]
  5. Xu, B. Rapid determination of phosphorus pentoxide in fertilizer by quinoline phosphomolybdate volumetric method. Phosphate Compd. Fertil. 2012, 27, 87. [Google Scholar]
  6. Sun, H.; Li, T.; Tao, L.; Gong, Y. Study on the determination of potassium ion concentration in compound fertilizer by temperature titration. Soil Fertil. Sci. China 2012, 4, 95–98. [Google Scholar]
  7. Lin, Z.; Wang, R.; Wang, Y.; Wang, L.; Lu, C.; Liu, Y.; Zhang, Z.; Zhu, L. Accurate and rapid detection of soil and fertilizer properties based on visible/near-infrared spectroscopy. Appl. Opt. 2018, 57, D69–D73. [Google Scholar] [CrossRef] [PubMed]
  8. Wang, L.; Wang, R.; Lu, C.; Wang, J.; Huang, W.; Jian, Q.; Wang, Y.; Lin, L.; Song, L. Quantitative analysis of total nitrogen content in monoammonium phosphate fertilizer using visible-near infrared spectroscopy and least squares support vector machine. J. Appl. Spectrosc. 2019, 86, 465–469. [Google Scholar] [CrossRef]
  9. Wang, C.; Huang, C.; Qian, J.; Xiao, J.; Li, H.; Wen, Y.; He, X.; Ran, W.; Shen, Q.; Yu, G. Rapid and accurate evaluation of the quality of commercial organic fertilizers using near infrared spectroscopy. PLoS ONE 2014, 9, e88279. [Google Scholar] [CrossRef] [PubMed]
  10. Sun, X.-L. Errors induced by spectral measurement positions and instrument noise in soil organic carbon prediction using vis-NIR on intact soil. Geoderma 2021, 382, 114731. [Google Scholar] [CrossRef]
  11. Bian, X.; Wang, K.; Tan, E.; Diwu, P.; Zhang, F.; Guo, Y. A selective ensemble preprocessing strategy for near-infrared spectral quantitative analysis of complex samples. Chemom. Intell. Lab. Syst. 2020, 197, 103916. [Google Scholar] [CrossRef]
  12. Alrezj, O.A.; Patchava, K.C.; Benaissa, M.; Alshebeili, S. Coupling scatter correction with bandpass filtering for preprocessing in the quantitative analysis of glucose from near infrared spectra. In Proceedings of the 2017 39th Annual International Conference of the IEEE Engineering in Medicine and Biology Society (EMBC), Jeju, Korea, 11–15 July 2017; pp. 1800–1803. [Google Scholar]
  13. Huang, J.; Shi, T.; Gong, B.; Li, X.; Liao, G.; Tang, Z. Fitting an optical fiber background with a weighted Savitzky–Golay smoothing filter for Raman spectroscopy. Appl. Spectrosc. 2018, 72, 1632–1644. [Google Scholar] [CrossRef] [PubMed]
  14. Chen, H.; Song, Q.; Tang, G.; Feng, Q.; Lin, L. The combined optimization of Savitzky-Golay smoothing and multiplicative scatter correction for FT-NIR PLS models. Int. Sch. Res. Not. 2013, 2013, 1–9. [Google Scholar] [CrossRef] [Green Version]
  15. Roy, I.G. On computing first and second order derivative spectra. J. Comput. Phys. 2015, 295, 307–321. [Google Scholar] [CrossRef]
  16. Lin, Z. Research on the Rapid Detection Models of Fertilizer and Soil Parameters Based on the Visible/Near Infrared Spectral; University of Science and Technology of China: Hefei, China, 2016. [Google Scholar]
  17. Huang, G.; Huang, G.-B.; Song, S.; You, K. Trends in extreme learning machines: A review. Neural Netw. 2015, 61, 32–48. [Google Scholar] [CrossRef] [PubMed]
  18. Huang, G.-B.; Zhu, Q.-Y.; Siew, C.-K. Extreme learning machine: Theory and applications. Neurocomputing 2006, 70, 489–501. [Google Scholar] [CrossRef]
  19. Li, H.; Liang, Y.; Xu, Q.; Cao, D. Key wavelengths screening using competitive adaptive reweighted sampling method for multivariate calibration. Anal. Chim. Acta 2009, 648, 77–84. [Google Scholar] [CrossRef] [PubMed]
Figure 1. Distribution of N, P2O5, K2O content in samples.
Applsci 11 05103 g001
Figure 2. Spectral acquisition instrument.
Applsci 11 05103 g002
Figure 3. Original spectral curves of fertilizers (each color of the curve in the figure represents a sample).
Applsci 11 05103 g003
Figure 4. Spectral curves of fertilizers after preprocess (each color of the curve in the figure represents the spectrum of a sample).
Applsci 11 05103 g004
Figure 5. Scatter plot of the experimental value and predicted value.
Applsci 11 05103 g005
Table 1. Test results of N, P2O5, and K2O content in fertilizer samples.
Detection IndicatorN (%)P2O5 (%)K2O (%)
Max value44.7760.2252.12
Min value000
Average value17.0614.2415.09
Standard deviation79.38170.75102.09
Table 2. The result of characteristic wavelength selection.
Nutrient550~950 nm1050~1640 nmFull Spectrum
N44117161
P2O532197229
K2O59102161
Table 3. The results of N, P2O5, and K2O content models based on different band spectra.
NutrientSpectral BandAlgorithmCalibration SetPrediction Set
R c 2 RMSECV % R p 2 RMSEP %RPD
N550~950 nmPLS0.6535.2110.5965.6201.29
ELM0.8543.3820.7844.1112.02
1050~1640 nmPLS0.8912.9200.8813.0562.74
ELM0.9910.8230.9841.1167.91
full spectrumPLS0.9332.2840.9082.6763.159
ELM0.9960.5370.9890.9109.71
characteristic wavelengthPLS0.9312.3170.9062.7093.10
ELM0.9950.6590.9861.0338.59
P2O5550~950 nmPLS0.33310.5870.33010.6180.69
ELM0.9213.6490.8415.1792.38
1050~1640 nmPLS0.7796.1000.7456.5531.76
ELM0.9801.8500.8974.1703.18
full spectrumPLS0.8994.1230.8534.6362.55
ELM0.9682.3240.9452.9334.45
characteristic wavelengthPLS0.9053.9870.8445.1242.46
ELM0.9741.4390.9631.7245.09
K2O550~950 nmPLS0.5956.3830.5226.9321.16
ELM0.8803.4680.7305.2142.00
1050~1640 nmPLS0.8254.1890.8044.4342.01
ELM0.9960.6670.9751.5656.70
full spectrumPLS0.9552.1170.9063.0703.23
ELM0.9900.9990.9811.3937.29
characteristic wavelengthPLS0.9132.9590.9013.1533.05
ELM0.9940.7090.9801.2377.17
Publisher’s Note: MDPI stays neutral with regard to jurisdictional claims in published maps and institutional affiliations.

