1. Introduction
Understanding the human brain is one of the greatest challenges still open. There are a number of factors that limit progress in this field. The first one is the brain’s overwhelming complexity, which comes from the combination of a set of factors: First, the number of significant components is huge (around
neurons and
synapses in the human brain [
1]); furthermore, other elements such as glia and vasculature are also relevant. Second, the morphology of each of these elements is far from trivial, as many details that determine important aspects of their behavior exist. Third, morphology alone is not enough, since it is necessary to understand also each element’s function. Fourth, the brain is not just a collection of complex elements working on their own, but a network of elements, and the network topology is also central for understanding how the brain works. Finally, it is necessary to consider not only a stationary network; its dynamic behavior is also central for understanding the brain’s behavior and how it adapts to changing stimuli.
In order to cope with this complexity, the brain has been studied at many different levels and from many disciplines and points of view (morphology, physiology, etc.), using a diversity of techniques for getting meaningful data at each specific level and perspective. Despite the task’s difficulty, interest in understanding the brain can be tracked back to the very beginning of science, among other reasons, because of its influence on human healthy life. The improvement of laboratory equipment and techniques, the availability of powerful computers and dedicated software, and the appearance of ambitious collaborative research programs has strongly accelerated the pace at which new advances are being produced. Nevertheless, there are still many issues where progress is needed, such as in understanding the brain as a unified system that spans multiple levels of organization (covering all levels from the molecular to the behavior and cognitive).
The human brain can be seen as a complex processing system that can be structured into different organizational levels, allowing it to be studied at different scales, among other reasons, because of the availability of techniques that can provide information at each specific scale. This approach has provided a good knowledge about each of the individual levels, but there is still a lack of understanding about the interactions and causal chains of events among the different levels of the hierarchy needed to result in cognitive and behavioral processes. One of the reasons for this is the lack of tools that facilitate moving smoothly across the hierarchy; with respect to this, one of the goals of this paper is to present a visualization approach that can help in bridging this gap by facilitating users to combine data and descriptions from different levels of abstraction and standpoints (restricted so far to morphology and physiology, to soon include connectivity).
Presenting information across the hierarchy of levels at which the brain can be studied is not easy. The available knowledge and information is by no means comprehensive; there are still many missing pieces in the puzzle, which makes smooth transitions difficult. Going down in the hierarchy often means increasing the volume of data by orders of magnitude. This stands in the way of a well-established principle for information visualization: overview first, zoom and filter, then details-on-demand [
2]), since getting one level down in the hierarchical description of a region easily results in cluttering the visualization with huge amounts of information that often prevents getting a global view of the data being analyzed.
This paper presents a framework for the visual exploration of neuroscience data that can facilitate the analysis of complex scenarios, based on a multilevel approach designed to follow closely the brain organizational levels which are relevant for a particular task. In order to remove clutter from visualizations, this framework uses schematic or iconic symbols that have higher expressive capabilities than realistic (morphologically correct) representations of the relevant entities. Being based on the possibility of combining schematic representations of higher order abstractions with other lower level descriptions, this method can effectively decrease the visual complexity of the scenes presented to the user. This, in turn, facilitates the analysis task in extensive scenarios, where other visual representations would be cluttered with unnecessary details. Last, this framework takes into consideration many of the complexity aspects that hamper neuroscience data analysis, proposing a visual approach that has proved to be helpful for the exploration and understanding of massive data and scenarios. A preliminary implementation is also presented, focused on the morphological aspects of neuronal circuits within the brain cortex and on certain features of the dendritic spines of cortical pyramidal neurons. This gives rise to an integrative framework that combines different tools, with complementary approaches that work in a coordinated manner to provide a multiview interactive environment in which it is possible to explore data at different levels of abstraction while applying different representation techniques.
The paper is organized as follows. After this introduction and a brief review of previous work, the main aspects of the proposed visualization framework are described, together with two case studies: a first application for the multilevel navigation around medium to high complexity neocortex neuronal circuits and a second one for the analysis of the morphological features of dendritic spines in pyramidal neurons, also within the neocortex. These two use cases work at different scales, from cortical columns to dendritic spines. The difficulties associated to the visualization of each of them are different and require distinct techniques to address their respective challenges. However, the proposed solution allows the combination of specialized tools, providing a single framework which allows transversing the entire range of scales, linking the knowledge obtained from each of them and, therefore, facilitating advancing toward the unraveling of the complete system. Last, some illustrative results are described and discussed.
2. Visualization in Neuroscience
There are many areas in neuroscience that can benefit from the availability of tools designed for helping researchers perform typical analysis operations (such as characterize, compare, select, model, predict, hypothesize, validate, etc.). For example, in a large collaborative framework such as the Human Brain Project, there are research groups working on neuron morphology, neuronal circuit simulation, neuromorphic hardware design, neuroinspired robotics, etc. Usually, many of the analysis operations in these fields have to be performed on extensive data sets, being impossible for anyone to get a global overview together with the fine detail needed at a specific region unless the analysis system provides the possibility of combining representations of different scale or level of detail. This paper presents a visualization approach based on the combination of symbolic and realistic views of different expressive power, designed specifically for this purpose.
Figure 1 and
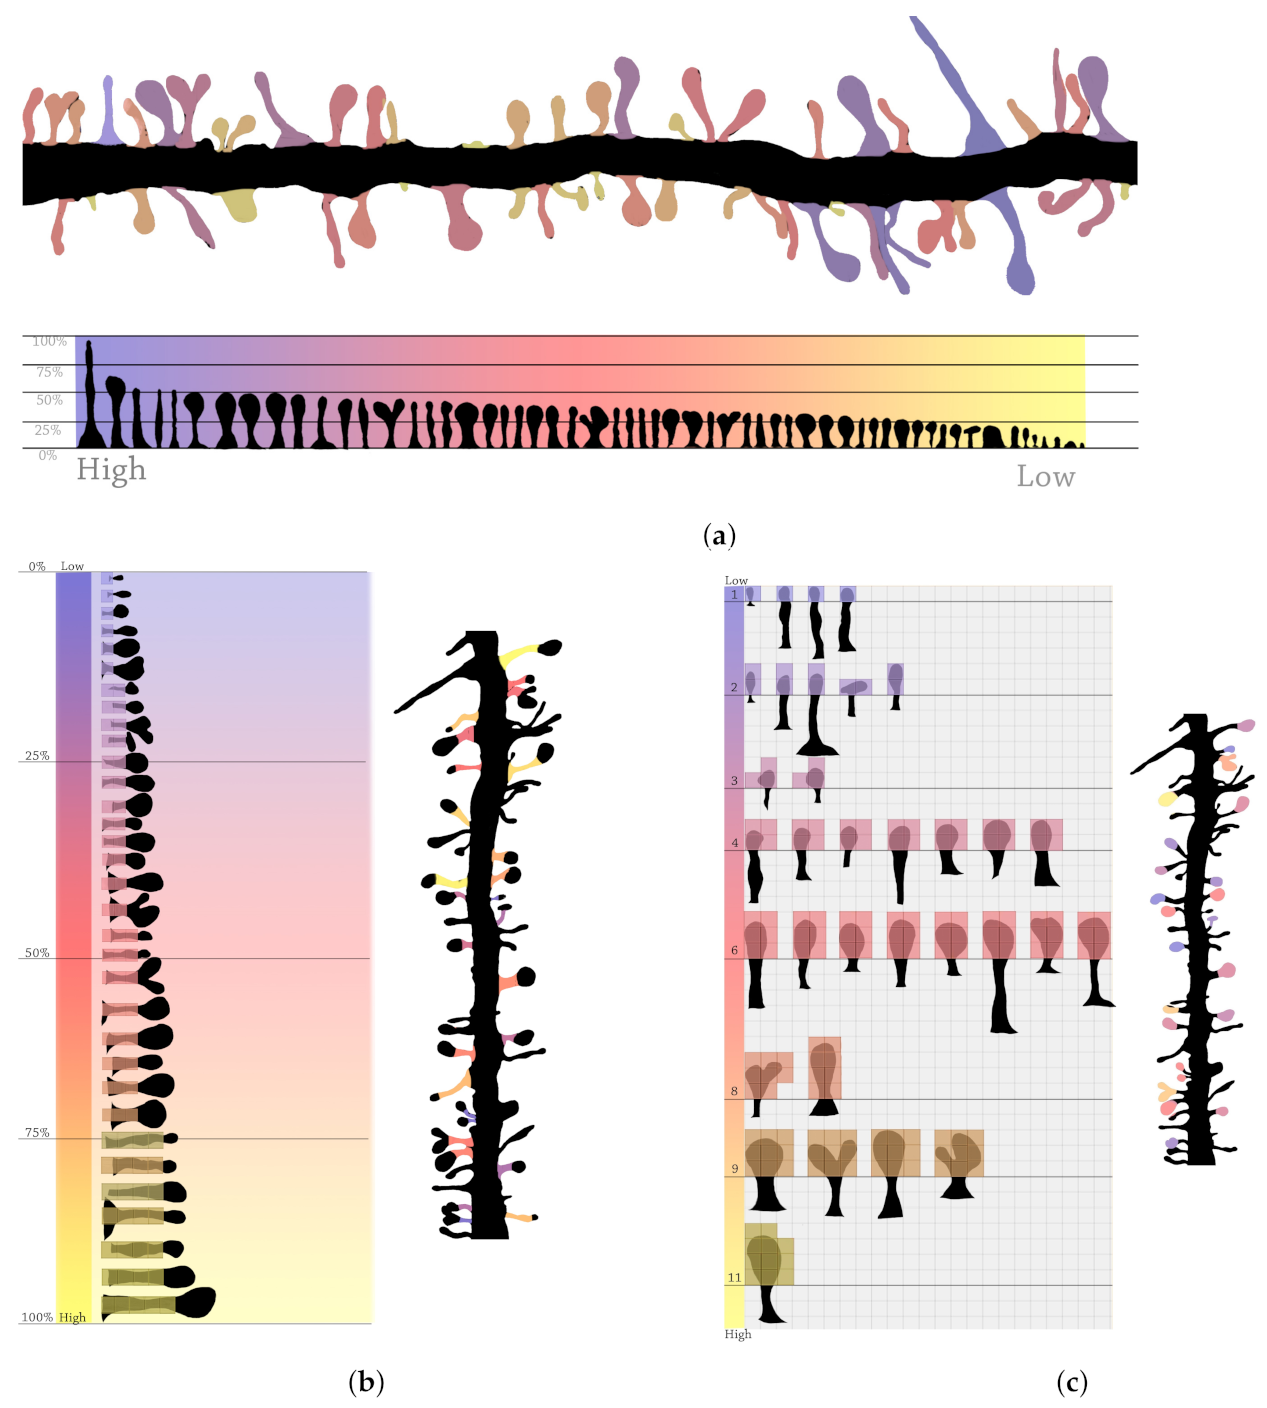
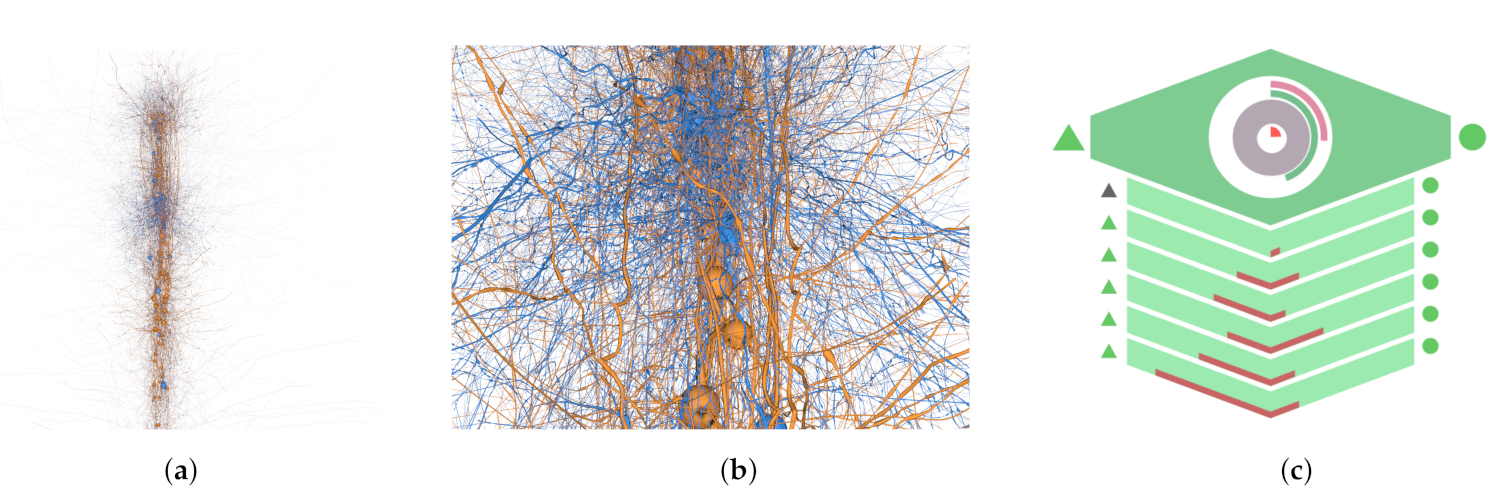
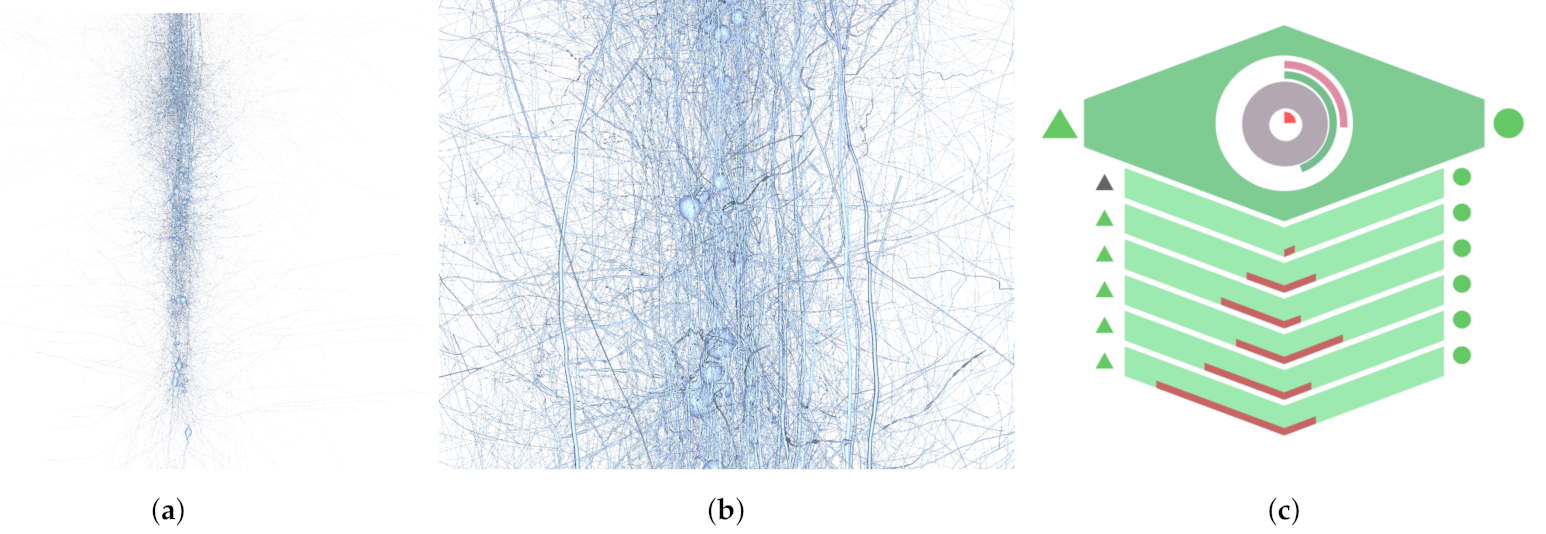
Figure 2 present a series of sketches that summarize the main idea proposed in this paper. For example, let us suppose that a user wants to analyze certain morphological features of the spines located in a dendrite fragment of a pyramidal cell, within a large collection of neurons.
Figure 1a–c illustrate the sequence of navigation steps followed by the user in order to select that neuron’s specific area of interest. The spines of the selected dendrite segment are presented afterwards, ranked according to the user selected features in
Figure 2a–c, using a color code to enhance the variation of the desired morphological features. These sketches highlight two points:
The advantage of using abstract representations, which allows condensing large portions of complex geometry in order to simplify the representation of a scenario, composed in this case by a potentially large number of neurons within a specific brain area.
The benefits obtained by using transformed domains. In this case, representing the spines extracted out of the dendrite, ranked by the value of the features under analysis, helps during the analysis stage by providing users with a clear overview of the spines’ morphological variability (an ordered set of elements is easier to understand, characterize, and compare than a randomly disordered set).
Specifically, the framework presented here merges three tools that cooperatively enable the combination of abstract and realistic representations spanning the organizational levels of the cerebral cortex, from the scale of cortical columns to dendritic spines: NeuroScheme, NeuroTessMesh, and PyramidalExplorer. Neuroscheme provides the visualization of abstract representations at different levels of abstraction, as well as useful functionalities for filtering, sorting, and selecting elements. These operations can be performed at any level of abstraction, being automatically propagated to the rest of the organizational levels. The second tool, NeuroTessMesh, is oriented to the efficient visualization of neuronal anatomy, rendering the morphology of cells at different levels of detail. This tool provides realistic representations of neurons, allowing the (interactive, under conditions) visualization of complex cortical circuits thanks to the on-the-fly refinement of the polygonal mesh that approximates the neuronal membrane. Last, PyramidalExplorer has been designed for the visual exploration and discovery of the detailed structure of the cell microanatomy. This tool supports the examination of the dendritic spines of a neuronal cell and provides useful analysis techniques, such as filtering, sorting, or content-based retrieval operations.
These tools are integrated into the framework and can share data interaction operations such as selection, filtering, or camera movements in coordinated views. For example, filtering out a cortical layer in NeuroScheme can be automatically propagated to NeuroTessMesh, so that all the morphologies of the neurons belonging to that layer disappear from the realistic view.
The next section shows the results of applying the proposed framework on two practical examples involving the visual exploration of complex data sets.
3. Results
The proposed framework has been used to perform two different tasks of exploratory data analysis of neural data. Each of them addresses the visualization of data sets at different levels of abstraction and requires specific tools that can collaborate within the proposed framework, thus providing an environment that supports the visual analysis of neural morphology at different organizational scales.
3.1. Case Study 1: Navigation Around the Neocortex
The first case study addresses the visual exploration of a set of cortical neurons. This task can be performed using the multilevel schematic cell depiction features provided by NeuroScheme, a tool for multilevel navigation around the neocortex designed for facilitating the analysis of the morphology, topology, and simulation results of relatively complex synthetic neocortical neuronal circuits (up to a few million neurons) [
27]. For that purpose, this method uses a multilevel structure where each level corresponds to a different neocortical organizational level. In this case, the entities that compose the multilevel structure are: column, microcolumn, neuron, neurite, and (neurite) branch entities, with each of them having a different symbolic representation (the first three ones are presented in
Figure 3). The selection of any of them involves the selection of all of the lower level elements included in the entity. As commented before, mixing visualizations of data and structures at different levels allows users to gain access to the global picture and the desired fine detail when needed, facilitating also the selection of the part of the circuit to be displayed at each moment. Neuroscheme can be combined with NeuroTessMesh, in order to show a coordinated view with the detailed geometry of the neurons (
Figure 4).
The geometrical and the abstract representations provided here are connected, so that a selection or modification in the abstract representation is automatically updated in the geometrical representation. For example, focusing at the neuronal level, if a neuroscientist is interested in knowing the characteristics of the neurons included in a circuit, their schematic representation allows him to see at a glance the main circuit’s neuron types and their most relevant features. Additionally, the schematic neuron representations can be ranked according to different criteria (such as the value of specific features, like soma volume or dendritic length), or they can be displayed occupying their real position within the circuit. After a set of neurons is ranked, groups of neurons can be selected for studying them in more detail or for analyzing their detailed morphology and circuit location. It has to be noted that, just like the geometrical and abstract windows, the organizational levels are also connected. A selection in one level, such as the selection of a group of neurons at the neuron level, results in displaying only the minicolumns containing the selected neurons when going one level up in the hierarchy. Whenever a column or microcolumn layer is selected, only the neurons from that layer are highlighted in the abstract and geometrical windows and when going down in the hierarchy.
Figure 5 and
Figure 6 show images of a column and a microcolumn; please note that the column symbolic representation has been expanded to show the microcolumns that compose it.
Regarding the symbolic representations for each organizational level, the highest one in the hierarchy is the column, being represented by a blue pentagonal shape containing the average information of the neurons belonging to it (which are depicted according to the neuron entity, described below). A column can be expanded to view the most relevant information of each of its layers, showing both the number or pyramidal cells and the number or interneurons per layer. For each layer, this number is represented using the length of a red bar growing leftward for pyramidal cells and rightward for interneurons. The triangles or circles drawn next to each layer allow selecting all the pyramidal or interneuron cells of that column layer. A triangle (or a circle) painted in gray represents that, for that column, there are no pyramidal cells (or interneurons) in that particular layer.
The next organizational level down in the hierarchy corresponds to microcolumns. They are represented by green hexagonal shapes, containing also information about the average neurons in that microcolumn. Just like before, microcolumns can be expanded to inspect layer information. Going another step down the hierarchy, neurons are represented by circles, having their color encode whether it is an excitatory neuron (blue circle) or inhibitory neuron (red circle). At the neuron center, a triangle in the pictogram denotes that it refers to a pyramidal neuron, and a circle denotes that it refers to an interneuron. Other symbols show degree of dendritic arborization and soma and dendrite area and volume.
The lowest two levels in the hierarchy correspond to the neurite and branch entities. Just like before, relevant information is graphically presented, letting users select also how much neurite detail is presented. Additional details can be found in [
27].
3.2. Case Study 2: Analysis of Dendritic Spines in Pyramidal Neurons in the Neocortex
The second case of study shows the potential of mapping different quantitative features across the neurons’ morphological representation. This option facilitates the study of the features’ spatial distribution, bridging also the gap between the bare statistical analysis of feature distributions and the performance of visual analysis processes, which allow studying spatial distributions and detecting the occurrence of patterns in the features’ spacial distribution.
This case of study is based on PyramidalExplorer [
42], an interactive tool designed for exploring and analyzing the organization and architecture of pyramidal neurons. It should be noted that previously existing tools like Connectome Explorer [
17] study aspects such as if an axon connects with the same dendrite or with different dendrites, as well as whether synapses are sequential or not within the same dendrite. By contrast, PyramidalExplorer allows the detection of possible regional differences through the combination of implemented functional models and structural quantitative morphological information. The tool accepts as input different data, such as electron microscopic reconstructions or confocal microscopy stacks of high-resolution images. Based on these input data, a model of the neuron is obtained.
Figure 7 presents the 3D reconstruction of a human pyramidal neuron. In this case, the goal is to analyze the volume of the spines along the dendrites. For that, the tool provides the following widgets with the aim of:
Obtaining a list with all the dendritic spines. The spines in this list can be ordered according to different criteria.
Allowing the selection of analysis criteria by interacting with the set of considered spine characteristics.
Allowing a 3D visualization of the details of each individual spine within the neuron.
Using the histogram distribution to filter the results and allowing to select the most adequate color range in order to improve the results visualization.
For the same pyramidal neuron,
Figure 8 shows how different morphological characteristics are distributed along the whole neuron, which allows the detection of possible differences in the regions of the neuron architecture. The extracted morphological features are spine length, spine area, spine volume, spine neck mean diameter, and spine maximum diameter.
The selection of the minimum spine neck mean diameter and the maximum spine diameter, for example, makes it easy to spot where are the spines that have the narrowest necks with the largest heads (
Figure 8a). As can be seen, the distribution of these spines in the arbor differs from those with other characteristics (
Figure 8b). Additionally, the tool allows linking other types of information to each spine. For example, it is possible to combine functional models (generated offline) with morphology structural quantitative information to visualize a membrane potential peak estimation for each spine.
Figure 8c) shows how the membrane potential peak values are distributed along the neuron. Differences in specific dendritic segments, even within the same dendrite, can be easily spotted.
Last, PyramidalExplorer could be used in combination with other tools, for example, for the visual analysis of functional information, which requires also the availability of neuron anatomical details.
4. Discussion
The two use cases presented in this article are just two examples that illustrate different tasks for the exploratory analysis of neuronal data. The first one deals with the navigation across a visually complex set of neurons, where complexity comes both from the number of cells that compose it (in the order of thousands) and from the intricate anatomy of the neurons themselves. The visualization of a neuronal forest composed of hundreds or thousands of cells yields cluttered, visually complex images where it is difficult to distinguish one element from another. In this context, the use of abstract representations that simplify neuron anatomy decreases drastically visual clutter, displaying the most relevant information while eliminating minor details. Additionally, structuring these schematic representations at different levels of abstraction significantly simplifies the amount of information associated with the different organizational levels of the brain, taking therefore advantage of the benefits of encapsulation when analyzing complex systems. Overall, the combination of schematic representations with the exploitation of the levels of abstraction concept makes it possible to reduce both visual and cognitive complexity when visually exploring complex neural scenes.
However, the visualization of the real neuron anatomy is still necessary for studying their morphological features. For that reason, the approach presented here combines schematic representation at different levels of abstraction with the visualization of morphologically correct representations. This generates clean and compact views that are efficiently rendered at rates suitable for interactivity. Additionally, this approach provides combinations of schematic representations that provide overall views with more detailed data, obtained at lower levels of abstraction, when and where needed. For example, in
Figure 4, it is easy to see that layer 6 in the column contains far more pyramidal neurons than interneurons. Since the abstraction levels are connected, a simple click on the red bar representing the number of interneurons would allow to display these cells instantly, descending to the minicolumn level or the cell level as desired. Furthermore, since the abstract view and the geometrically realistic view are also connected, once a particular object has been spotted in the abstract representation, clicking on it can automatically highlight it in the realistic view and zoom in for an easy location (
Figure 4b).
Being able to go from abstract to realistic views provides many additional advantages, mainly because it lets users to select the kind of representation better suited to a particular task. For example, abstract views facilitate arranging data according to different criteria, since in these representations the objects spatial positions do not necessarily have to correspond to their real anatomical positions. This way, objects in the abstract image can be reordered according to size, volume, or any meaningful feature, facilitating filtering and ranking operations. After some elements are selected, it is always possible to display them in their original locations.
The proposed framework facilitates creating more powerful tools. For example, use cases 1 and 2 can be connected, so that the exploration of a region of the neocortex can provide a selection of pyramidal neurons from which the dendritic spines will be later on analyzed. In general, once certain particular objects have been spotted through the interaction with the tools, as in the first use case, the framework allows to go beyond and focus on one of them, descending to a lower level and combining information from different nature, as it happens in the second use case with functional and morphological information. This way,
Figure 8 shows regional differences based on morphological information (spines’ neck diameter) and functional models (membrane potential).
However, it should be emphasized that complex experimental data sets are not yet available at present to enable the performance of exploration activities linking all levels of abstraction. In this sense, our prototype constitutes a pioneering proposal and its ability to cover all organizational levels of the brain sets the basis for the integration of the specific knowledge acquired at each of the scales. The tools integrated in the initial prototype are mainly focused on the visualization of anatomical information; in order to build a fully integrative framework, it will be necessary to incorporate techniques for the visualization of neural activity and connectivity data, thereby providing a tool that helps to link the different brain study domains.
5. Conclusions and Future Work
The analysis of neuroscience data will require, sooner rather than later, the availability of powerful analysis tools that can help cope with the continuous increase in complexity found in the data sets provided by new experimental and computational techniques and infrastructures. In this sense, using symbolic or schematic representations allows summarizing nonessential details, letting users concentrate on relevant information while analyzing massive scenarios.
Additionally, the establishment of large multidisciplinary research initiatives will demand the availability of tools that can integrate data and models stemming from different disciplines. In order to meet these demands, new representation models and techniques will be needed; these models, together with the development of appropriate analysis techniques, will allow researchers to gain insight into the brain as a unified system, even though it will be studied from many different perspectives.
The unified framework proposed in this paper, based on the design of symbolic representations and the use of transformed domains, has been developed having these two problems in mind. This framework also facilitates the integration of specific tools, by providing a multiview environment where they can be run in a coordinated manner. Using this approach, information provided by different techniques and experiments can be displayed coordinately, at different levels of abstraction, allowing users to navigate among them, while decreasing the level of visual clutter provided to users through the exploitation of schematic representations.
With respect to the methods presented here, the possibility of having schematic representations alleviates the amount of visual clutter provided to users, facilitating the generation of global views that summarize the most relevant information. At the same time, having this schematic representation linked to the morphologically detailed information allows the selection of objects to view in full detail in the 3D space whenever needed.
The representations described in this article, not necessarily linked to any particular discipline, can be designed for facilitating the fusion of information from different origins (such as morphological and functional, for instance), because their symbolic or abstract nature can facilitate combining information and data from multiple sources. Having a rich variety of representations at different scales can simplify condensing an otherwise overwhelming amount of detail. The early feedback received from end users, so far, is positive, since this kind of tools allows them to access to information that was unavailable until now, or because it facilitates analysis tasks by speeding up the navigation process around large data sets, allowing them also to combine information gathered at different scales.
Future work includes the application of these techniques to the navigation around large data sets and repositories, facilitating finding the localization of the desired information. An additional line of work is the development of new workflows for improving the productivity of neuroscientists by providing early insight on the data being collected.
Author Contributions
Investigation, L.P., S.B., J.P.B., I.F., S.E.G., J.J.G.-C., F.G.d.Q., S.M., O.D.R., A.R. and P.T.; Visualization, J.P.B., I.F., M.C., S.E.G., J.J.G.-C., P.T. and A.Z.; Writing—original draft, L.P., S.B., I.F., S.E.G., S.M., O.D.R., A.R. and P.T.; Writing—review and editing, L.P., S.B., J.P.B., F.G.d.Q., S.M., O.D.R. and P.T. All authors have read and agreed to the published version of the manuscript.
Funding
The research leading to these results received funding from the Spanish Ministry of Economy and Competitiveness under grants C080020-09 (Cajal Blue Brain Project, Spanish partner of the Blue Brain Project initiative from EPFL) and TIN2017-83132, as well as from the European Union’s Horizon 2020 Framework Programme for Research and Innovation under the Specific Grant Agreements No. 785907 (Human Brain Project SGA2) and 945539 (Human Brain Project SGA3).
Data Availability Statement
The data used in some of the examples were provided by the Blue Brain Project.
Acknowledgments
Development of PyramidalExplorer was done in collaboration with the Cortical Circuits Laboratory (UPM-CSIC), specially Javier deFelipe and Ruth Benavides-Piccione.
Conflicts of Interest
The authors declare no conflict of interest. The funders had no role in the design of the study; in the collection, analyses, or interpretation of data; in the writing of the manuscript, or in the decision to publish the results.
References
- Sporns, O.; Tononi, G.; Kötter, R. The human connectome: A structural description of the human brain. PLoS Comput. Biol. 2005, 1. [Google Scholar] [CrossRef]
- Shneiderman, B. The Eyes Have It: A Task by Data Type Taxonomy for Information Visualizations. In Proceedings of the IEEE Symposium on Visual Languages, Boulder, CO, USA, 3–6 September 1996; pp. 336–343. [Google Scholar] [CrossRef]
- Fuchs, R.; Hauser, H. Visualization of Multi-variate Scientific Data. Comput. Graph. Forum 2009, 28, 1670–1690. [Google Scholar] [CrossRef]
- Keim, D.A.; Kohlhammer, J.; Ellis, G.; Mannsmann, F. Mastering the Information Age: Solving Problems with Visual Analytics; Eurographics Association: Allaville, Switzerland, 2010; ISBN 978-3-905673-77-7. [Google Scholar]
- Munzner, T.; Maguire, E. Visualization Analysis and Design; AK Peters Visualization Series; CRC Press: Boca Raton, FL, USA, 2015. [Google Scholar]
- Laney, D. 3D Data Management: Controlling Data Volume, Velocity, and Variety; Technical Report; META Group: Brussels, Belgium, 2001. [Google Scholar]
- Chittaro, L. Information visualization and its application to medicine. Artif. Intell. Med. 2001, 22, 81–88. [Google Scholar] [CrossRef]
- Tory, M.; Möller, T. Human Factors in Visualization Research. IEEE Trans. Vis. Comput. Graph. 2004, 10, 72–84. [Google Scholar] [CrossRef] [PubMed]
- Yufit, V.; Tariq, F.; Eastwood, D.S.; Biton, M.; Wu, B.; Lee, P.D.; Brandon, N.P. Operando Visualization and Multi-scale Tomography Studies of Dendrite Formation and Dissolution in Zinc Batteries. Joule 2019, 3, 485–502. [Google Scholar] [CrossRef] [Green Version]
- Parulek, J.; Jönsson, D.; Ropinski, T.; Bruckner, S.; Ynnerman, A.; Viola, I. Continuous Levels-of-Detail and Visual Abstraction for Seamless Molecular Visualization. Comput. Graph. Forum 2014, 33, 276–287. [Google Scholar] [CrossRef]
- Muzic, M.L.; Autin, L.; Parulek, J.; Viola, I. cellVIEW: A Tool for Illustrative and Multi-Scale Rendering of Large Biomolecular Datasets. In Proceedings of the Eurographics Workshop on Visual Computing for Biology and Medicine, Chester, UK, 14–15 September 2015; Bühler, K., Linsen, L., John, N.W., Eds.; The Eurographics Association: Geneva, Switzerland, 2015. [Google Scholar] [CrossRef]
- Orengo, H.A.; Petrie, C.A. Multi-scale relief model (MSRM): A new algorithm for the visualization of subtle topographic change of variable size in digital elevation models. Earth Surf. Process. Landforms 2018, 43, 1361–1369. [Google Scholar] [CrossRef] [Green Version]
- Dudzic, S.; Godwin, J.A.; Kilgore, R.M. Visualization of temporal relationships within coordinated views. In Proceedings of the 2010 IEEE Symposium on Visual Analytics Science and Technology, Salt Lake City, UT, USA, 25–26 October 2010; pp. 219–220. [Google Scholar] [CrossRef]
- Langner, R.; Kister, U.; Dachselt, R. Multiple Coordinated Views at Large Displays for Multiple Users: Empirical Findings on User Behavior, Movements, and Distances. IEEE Trans. Vis. Comput. Graph. 2019, 25, 608–618. [Google Scholar] [CrossRef]
- Widjaja, I.; Russo, P.; Pettit, C.; Sinnott, R.; Tomko, M. Modeling coordinated multiple views of heterogeneous data cubes for urban visual analytics. Int. J. Digit. Earth 2015, 8, 558–578. [Google Scholar] [CrossRef] [Green Version]
- Paszkiel, S. Characteristics of Question of Blind Source Separation Using Moore-Penrose Pseudoinversion for Reconstruction of EEG Signal. In Automation 2017; Szewczyk, R., Zieliński, C., Kaliczyńska, M., Eds.; Springer International Publishing: Cham, Switzerland, 2017; pp. 393–400. [Google Scholar]
- Beyer, J.; Al-Awami, A.; Kasthuri, N.; Lichtman, J.; Pfister, H.; Hadwiger, M. ConnectomeExplorer: Query-Guided Visual Analysis of Large Volumetric Neuroscience Data. IEEE Trans. Vis. Comput. Graph. 2013, 19, 2868–2877. [Google Scholar] [CrossRef] [PubMed] [Green Version]
- Bruckner, S.; Soltészová, V.; Gröller, M.E.; Hladůvka, J.; Bühler, K.; Yu, J.; Dickson, B. BrainGazer—Visual Queries for Neurobiology Research. IEEE Trans. Vis. Comput. Graph. 2009, 15, 1497–1504. [Google Scholar] [CrossRef] [Green Version]
- Lin, C.Y.; Tsai, K.L.; Wang, S.C.; Hsieh, C.H.; Chang, H.M.; Chiang, A.S. The Neuron Navigator: Exploring the information pathway through the neural maze. In PacificVis, Proceedings of the 2011 IEEE Pacific Visualization Symposium, Hong Kong, China, 1–4 March 2011; Battista, G.D., Fekete, J.D., Qu, H., Eds.; IEEE: Piscataway, NJ, USA, 2011; pp. 35–42. [Google Scholar]
- Abdellah, M.; Hernando, J.; Eilemann, S.; Lapere, S.; Antille, N.; Markram, H.; Schürmann, F. NeuroMorphoVis: A collaborative framework for analysis and visualization of neuronal morphology skeletons reconstructed from microscopy stacks. Bioinformatics 2018, 34. [Google Scholar] [CrossRef] [PubMed]
- Bitplane. Imaris for Neuroscientists. Available online: https://imaris.oxinst.com/products/imaris-for-neuroscientists (accessed on 18 May 2021).
- Glaser, J.R.; Glaser, E.M. Neuron imaging with Neurolucida—A PC-based system for image combining microscopy. Comput. Med. Imaging Graph. Off. J. Comput. Med Imaging Soc. 1990, 14, 307–317. [Google Scholar] [CrossRef]
- Gleeson, P.; Steuber, V.; Silver, R.A. neuroConstruct: A Tool for Modeling Networks of Neurons in 3D Space. Neuron 2007, 54, 219–235. [Google Scholar] [CrossRef] [PubMed] [Green Version]
- Brito, J.; Mata, S.; Bayona, S.; Pastor, L.; DeFelipe, J.; Benavides Piccione, R. Neuronize: A tool for building realistic neuronal cell morphologies. Front. Neuroanat. 2013, 7. [Google Scholar] [CrossRef] [Green Version]
- Velasco, I.; Toharia, P.; Benavides-Piccione, R.; Fernaud-Espinosa, I.; Brito, J.P.; Mata, S.; DeFelipe, J.; Pastor, L.; Bayona, S. Neuronize v2: Bridging the Gap Between Existing Proprietary Tools to Optimize Neuroscientific Workflows. Front. Neuroanat. 2020, 14, 1–13. [Google Scholar] [CrossRef]
- Garcia-Cantero, J.J.; Brito, J.P.; Mata, S.; Bayona, S.; Pastor, L. NeuroTessMesh: A Tool for the Generation and Visualization of Neuron Meshes and Adaptive On-the-Fly Refinement. Front. Neuroinform. 2017, 11, 38. [Google Scholar] [CrossRef] [Green Version]
- Pastor, L.; Mata, S.; Toharia, P.; Beriso, S.B.; Brito, J.P.; Garcia-Cantero, J.J. NeuroScheme: Efficient Multiscale Representations for the Visual Exploration of Morphological Data in the Human Brain Neocortex. In Proceedings of the XXV Spanish Computer Graphics Conference, CEIG 2015, Benicàssim (Castellón), Spain, 1–3 July 2015; Sbert, M., Lopez-Moreno, J., Eds.; Eurographics Association: Geneva, Switzerland, 2015. [Google Scholar] [CrossRef]
- Hernando, J.B.; Schurmann, F.; Markram, H.; de Miguel, P. RTNeuron, An Application for Interactive Visualization of Detailed Cortical Column Simulations. In Proceedings of the Jornadas de Paralelismo XVIII, Zaragoza, Spain, 12–14 September 2007; ISBN 978-84-9732-593-6. [Google Scholar]
- Senk, J.; Carde, C.; Hagen, E.; Kuhlen, T.W.; Diesmann, M.; Weyers, B. VIOLA—A Multi-Purpose and Web-Based Visualization Tool for Neuronal-Network Simulation Output. Front. Neuroinform. 2018, 12, 75. [Google Scholar] [CrossRef] [Green Version]
- Galindo, S.E.; Toharia, P.; Robles, O.D.; Ros, E.; Pastor, L.; Garrido, J.A. Simulation, visualization and analysis tools for pattern recognition assessment with spiking neuronal networks. Neurocomputing 2020, 400, 309–321. [Google Scholar] [CrossRef] [Green Version]
- Anderson, D.; McNeill, G. Artificial Neural Networks Technology; Technical Report; Kaman Sciences Corporation: Utica, NY, USA, 1992. [Google Scholar]
- Bower, J.M.; Beeman, D. The Book of GENESIS: Exploring Realistic Neural Models with the GEneral NEural SImulation System; TELOS: Santa Clara, CA, USA, 1995; p. 409. [Google Scholar]
- Garrouch, A.A.; Smaoui, N. Application of Artificial Neural Network for Estimating Tight Gas Sand Intrinsic Permeability. Energy Fuels 1996, 10, 1053–1059. [Google Scholar] [CrossRef]
- Pham, D.T.; Chan, A.B. Control chart pattern recognition using a new type of self-organizing neural network. Proc. Inst. Mech. Eng. Part I-J Syst. Control Eng. 1998, 212, 115–127. [Google Scholar] [CrossRef]
- Kremkow, J.; Kumar, A.; Rotter, S.; Aertsen, A. Emergence of population synchrony in a layered network of the cat visual cortex. Neurocomputing 2007, 70, 2069–2073. [Google Scholar] [CrossRef]
- Rebesco, J.M. Rewiring neural interactions by micro-stimulation. Front. Syst. Neurosci. 2010, 4, 39. [Google Scholar] [CrossRef] [PubMed] [Green Version]
- Aliaga Maraver, J.J.; Mata, S.; Benavides-Piccione, R.; DeFelipe, J.; Pastor, L. A Method for the Symbolic Representation of Neurons. Front. Neuroanat. 2018, 12, 106. [Google Scholar] [CrossRef] [PubMed]
- Choudhury, A.I.; Parker, S.G. Ray tracing NPR-style feature lines. In Proceedings of the NPAR ’09: Proceedings of the 7th International Symposium on Non-Photorealistic Animation and Rendering, New Orleans, Lousiana, USA, 1–2 August 2009; ACM: New York, NY, USA; pp. 5–14. [CrossRef] [Green Version]
- Conturo, T.E.; Lori, N.F.; Raichle, M.E. Tracking Neuronal Fiber Pathways in the Living Human Brain. Proc. Natl. Acad. Sci. USA 1999, 96, 10422. [Google Scholar] [CrossRef] [PubMed] [Green Version]
- Everts, M.H.; Bekker, H.; Roerdink, J.B.T.M.; Isenberg, T. Depth-Dependent Halos: Illustrative Rendering of Dense Line Data. IEEE Trans. Vis. Comput. Graph. 2009, 15, 1299–1306. [Google Scholar] [CrossRef] [PubMed]
- Al-Awami, A.K.; Beyer, J.; Strobelt, H.; Kasthuri, N.; Lichtman, J.W.; Pfister, H.; Hadwiger, M. NeuroLines: A Subway Map Metaphor for Visualizing Nanoscale Neuronal Connectivity. IEEE Trans. Vis. Comput. Graph. 2014, 20, 2369–2378. [Google Scholar] [CrossRef] [Green Version]
- Toharia, P.; Robles, O.D.; Fernaud, I.; Makarova, J.; Galindo, S.E.; Rodríguez, A.; Pastor, L.; Herreras, O.; deFelipe, J.; Benavides-Piccione, R. PyramidalExplorer: A new interactive tool to explore morpho-functional relations of pyramidal neurons. Front. Neuroanat. 2016, 9. [Google Scholar] [CrossRef] [Green Version]
| Publisher’s Note: MDPI stays neutral with regard to jurisdictional claims in published maps and institutional affiliations. |
© 2021 by the authors. Licensee MDPI, Basel, Switzerland. This article is an open access article distributed under the terms and conditions of the Creative Commons Attribution (CC BY) license (https://creativecommons.org/licenses/by/4.0/).


 ,
, 


