Article

United Approach to Modelling of the Hot Deformation Behavior, Fracture, and Microstructure Evolution of Austenitic Stainless AISI 316Ti Steel

by
Alexander Yu. Churyumov
1,*,
Svetlana V. Medvedeva
1,
Olga I. Mamzurina
1,
Alena A. Kazakova
1 and
Tatiana A. Churyumova
2
1
Department of Physical Metallurgy of Non-Ferrous Metals, National University of Science and Technology “MISiS”, Leninskiy Prospekt 4, 119049 Moscow, Russia
2
JSC “VNIINM”, Rogova str. 5a, 123098 Moscow, Russia
*
Author to whom correspondence should be addressed.
Appl. Sci. 2021, 11(7), 3204; https://doi.org/10.3390/app11073204
Submission received: 17 March 2021 / Revised: 26 March 2021 / Accepted: 1 April 2021 / Published: 2 April 2021
(This article belongs to the Special Issue Metal Forming)

Abstract

:

Featured Application

The supposed united approach of hot deformation modelling allows us to significantly decrease the development and optimization of the industrial production processes of steels, multiprincipal element alloys, and titanium alloys.

Abstract

Hot deformation is one of the main technological stages of products made from metallic materials. It is strictly required to decrease the costs of developing optimized technologies at this stage without a significant decrease in the products’ quality. The present investigation offers an algorithm to unite three different models to predict the hot deformation behavior, fracture, and microstructure evolution. The hot compression and tension tests of the AISI 316Ti steel were conducted using the thermomechanical simulator Gleeble 3800 for the models’ construction. The strain-compensated constitutive model and the Johnson–Mehl–Avrami–Kolmogorov (JMAK)-type model of the grain structure evolution show a satisfactory accuracy of 4.38% and 6.9%, respectively. The critical values of the modified Rice and Tracy fracture criteria were determined using the experimental values of the relative cross-section reduction and finite element calculation of the stress triaxiality. The developed models were approved for the stainless AISI 316Ti steel by the hot torsion with tension test.

1. Introduction

Austenitic stainless steels are necessary constructional materials in the nuclear industry [1,2]. The hot deformation stage is an essential part of the technological process for most of the products made from steel [3,4]. At this stage, the fine grain microstructure is formed and subsequently controls the steel’s mechanical properties, especially impact and tensile strength [5]. The obtaining of the fine microstructure provides an elevated level of the properties. However, obtaining the fine microstructure requires applying hard deformation schemes at a lower temperature, leading to failure during hot forming even for such well-deformable materials as austenitic stainless steels [6,7]. Evaluating the optimal hot deformation conditions that provide the required microstructure without material losses is essential for materials scientists and technologists. This fact requires developing a united approach for modelling hot deformation behavior, fracture, and microstructure evolution.
The constitutive modelling of hot deformation behavior is one of the essential parts for developing optimal technology. Such models were constructed for 00Cr23Ni4N [8], 18Cr-5Ni-4Cu-N [9], AISI 304L [10], 317LN–Cu [11], and AISI 310S [12] stainless steels. The constitutive models’ parameters strictly depended on the chemical composition and initial microstructural characteristics of the steel. As a result, it is required to create a constitutive model for each considered steel to increase the accuracy and predictability.
The second step of the united model development is a mathematical description of the fracture conditions during the ductile materials’ deformation at high temperatures. By now, the fracture process can be described in two ways: using models of nucleation and the growth of pores and cracks [13,14,15] and phenomenological models of the relationship between the fracture criterion and the processing parameters. The first approach involves complex models of pore formation and evolution at the microstructural level. The second approach does not imply modelling the material flow at the microlevel, considering only the effect of deformation conditions on macroscopic fracture. Even though the first type of model has a greater physical justification, the second has simple regularities and a significantly smaller number of unknown parameters, making it more attractive for practical application. One of the first phenomenological models was the Johnson–Cook model [16], which describes the dependence of critical strain ε f on stress triaxiality (σ*), strain rate ( ε ˙ ,   s 1 ) and deformation temperature ( T ,   K ):
ε f = D 1 + D 2 e D 3 σ * 1 + D 4 l n ε ε 0 ˙ ˙ 1 + D 5 T 298 T m 298
where D 1 D 5 are material’s constants, ε 0 ˙   (s−1) and T m (K) are reference strain rate and temperature, respectively. Stress triaxiality may be determined as:
σ * = σ m σ ¯
where hydrostatic stress σ m (MPa) and equivalent stress σ ¯   (MPa) are calculated by the following formulas:
σ m = 1 / 3 σ 1 + σ 2 + σ 3
σ ¯ = σ 1 σ 2 2 + σ 2 σ 3 2 + σ 3 σ 1 2 2
where σ 1 , σ 2 , σ 3 are the principal stresses, MPa.
However, the Johnson–Cook model demonstrates a low accuracy at small and negative stress triaxiality values [17,18,19], and the scientists have supposed another fracture criterion. Therefore, Bao and Wierzbicki used a system of equations for different levels of stress triaxiality [20]:
ε f = A σ * + 1 / 3 B for σ * = 0.33 0
ε f = C σ * 2 D σ * + E for σ * = 0 0.4
ε f = F σ * 1 for σ * = 0.4 0.95
where A, B, C, D, E, and F are the material’s constants.
Hu-Chen has developed a plastic fracture criterion that includes two coupled fracture mechanisms and has demonstrated its high accuracy in predicting ductile fracture over a wide range of stress triaxiality [21]:
σ 1 σ 3 σ ¯ C 1 + σ * 1 3 C 2 ε f = C 3
where C 1 , C 2 , C 3 are material’s constants.
In addition to models that describe the critical value of plastic deformation, accumulated energy models were also developed. Thus, Cockcroft and Latham [22] have proposed a criterion defining the integral accumulation of damage during deformation:
C L = 0 ε ¯ f σ 1 d ε ¯
where ε ¯ is equivalent deformation, ε ¯ f is its critical value, σ 1 is the first principal stress.
Rice and Tracy have modified this criterion by using stress triaxiality instead of principal stress [23]:
R T = 0 ε ¯ f e σ * d ε ¯
This model has demonstrated good predictability for fracture behavior of FeMnAlCMo steel [24] and the Ti40 titanium alloy [25]. Additionally, the Rice and Tracy model was modified to consider the nonlinear influence of accumulated strain on the fracture criteria [26]:
m R T = 0 ε ¯ f e σ * e γ ε ¯   d ε ¯
where γ is a material’s constant. The modified Rice and Tracy model has shown high accuracy in predicting fracture behavior of stainless AISI 310S [27] and ferritic/martensitic 13CrMoNbV [28] steels.
The integral dependence of the critical value of accumulated energy on hydrostatic stress was assumed by the Oyane [29] Equation (12) and Norris [30] Equation (13):
K = 0 ε ¯ f 1 + σ m B σ ¯ d ε ¯
K = 0 ε ¯ f 1 1 σ m d ε ¯
where B and k are materials’ constants.
Another critical stage of the united approach to modelling is the development of the microstructure evolution model. The stainless steels’ microstructure during hot deformation is determined by the dynamic recrystallization process [31,32]. It is known that kinetics of the dynamic recrystallization may be described by Johnson–Mehl–Avrami–Kolmogorov (JMAK) equation [33,34,35]:
X D R X = 1 e x p β   ·   ε ε c ( ε 0.5 ε c ) k d
where X D R X is a volume fraction of the dynamically recrystallized grains, βd = ln(2) = 0.693. ε c is a critical strain for the beginning of the dynamic recrystallization. The strain ε c proportional to strain at the maximum stress value ( ε p ) on the deformation curve:
ε c = a 1 ε p
Peak strain is dependent on the Zener–Hollomon parameter:
ε p = a p Z p m p
where Z p is described by strain rate compensated temperature dependence:
Z p = ε ˙ e x p Q p R T
ε 0.5 is a strain related to 50% of recrystallized grains in the microstructure. Its value may also be determined empirically:
ε 0.5 = a 3 Z 0.5 m 0.5
Z 0.5 = ε ˙ e x p Q 0.5 R T
The values of the materials constants ap, a0.5, mp, m0.5, Qp(J·mol−1), Q0.5(J·mol−1), kd are determined experimentally using the true stress–true strain curves obtained at different strain rates and temperatures. Constant a 1 has a value of about 0.83 in accordance with Shen et al. [36].
The size of the dynamically recrystallized grains at the stage of steady-state flow is practically independent of the strain and is determined only by the strain rate and deformation temperature:
d D R X = a d Z d m d
Z d = ε ˙ e x p Q d R T
where ad, md, Qd(J·mol−1) are material constants that are determined empirically using microstructural investigations. By now, the microstructure evolution models for the different types of stainless steels were constructed. Some of such models are listed in Table 1.
Three considered stages of the technology development may be united by the finite element (FE) approach. At the current state, the finite element simulation of hot deformation and heat treatment processing is the most powerful tool providing the optimal thermomechanical parameters without any sufficient material expenses [40,41,42,43,44]. This approach to calculating deformation and fracture processes has been successfully applied for the conditions of cutting [45], cold [46], and hot plastic deformation [47,48].
Despite many of the works devoted to investigating and modelling the hot deformation behavior, fracture and microstructure evolution of metallic materials, all of the models were described independently of each other. The simultaneous realization and approbation of such models were not presented up to now in the literature. In the present work, the united finite element approach considering hot deformation behavior, fracture conditions, and microstructure evolution was developed and approved for the 316Ti stainless steel. The realization of the developed united approach for different materials in semi-industrial conditions should be done as a next step of the investigation and may approve its applicability.

2. Materials and Methods

The chemical composition of the investigated steel AISI 316Ti is given in Table 2. The as-received state of materials was annealing after hot deformation. The initial microstructure of the steel, which is shown in Figure 1, was fully recrystallized. As one can see from XRD-pattern (Figure 1b), the microstructure mainly consists of austenite grains with an average size of 54 ± 4 µm (Figure 1a).
The mechanical testing at elevated temperatures (tension, compression, and torsion with tension) was carried out using the thermomechanical simulator Gleeble 3800 (DSI Systems, Dallas, TX, USA). Samples for compression were cylinders with a height of 15 mm and a diameter of 10 mm. The specimens with cylindrical deformation zone with a diameter of 5 and 10 mm and lengths of 10 and 20 mm were used for tensile and torsion with tension tests, respectively. A high vacuum of 10−3 Pa was created in the chamber before heating to prevent oxidation at high temperatures. The heating rate up to the deformation temperature was 5 K·s−1. Hot deformation was carried out in the temperature range of 1173–1473 K and at strain rates of 0.1–10 s−1. The samples were immediately quenched after the deformation by compressed air. Compression stress–strain curves were recalculated to consider the friction and adiabatic heating during deformation [49,50].
The grain microstructure of the samples was investigated using a scanning electron microscope (SEM) Tescan-VEGA3 LMH (TESCAN, Czech Republic) equipped with an energy dispersive X-ray spectrometer (EDS) (X-MAX80), and an EBSD–HKL detector (NordlysMax EBSD) and light microscope Carl Zeiss Axiovert 200 (Carl Zeiss, Germany). The microstructure investigation samples were mechanically polished and electrochemically etched at 5 V for 110–120 s in the 10% solution of oxalic acid in water. The average grain size was measured by the linear intercept method at three images for each deformation condition. Diffractometer Bruker Advance D8 (Bruker, Germany) was used to investigate the phase composition of the steel. The X-ray scanning was done in the range of the 2θ angle of 20–90° with a step of 0.1° and a holding time of 10 s.
Setaram LabSys calorimeter (Setaram, France) was used for the determination of the phase transformation temperatures. Differential thermal analysis (DTA) was performed at heating and cooling rates of 0.33 K·s−1 in the temperature range of 1273–1773 K. Thermodynamic calculations were carried out using thermodynamic database TCFe7 of the Thermocalc software.
FE calculations of the deformation behavior, fracture, and microstructure evolution were performed using the Deform 3D software. The FE simulation objects have the same sizes, such as real samples for mechanical testing using thermomechanical simulation. The objects were meshed into 30,000 and 100,000 tetrahedral elements for the tension and torsion with tension tests, respectively. During calculation, the deformation conditions completely followed the actual testing process: the movement boundary conditions were applied to one of the simulated sample edges, while another edge was fixed.

3. Results

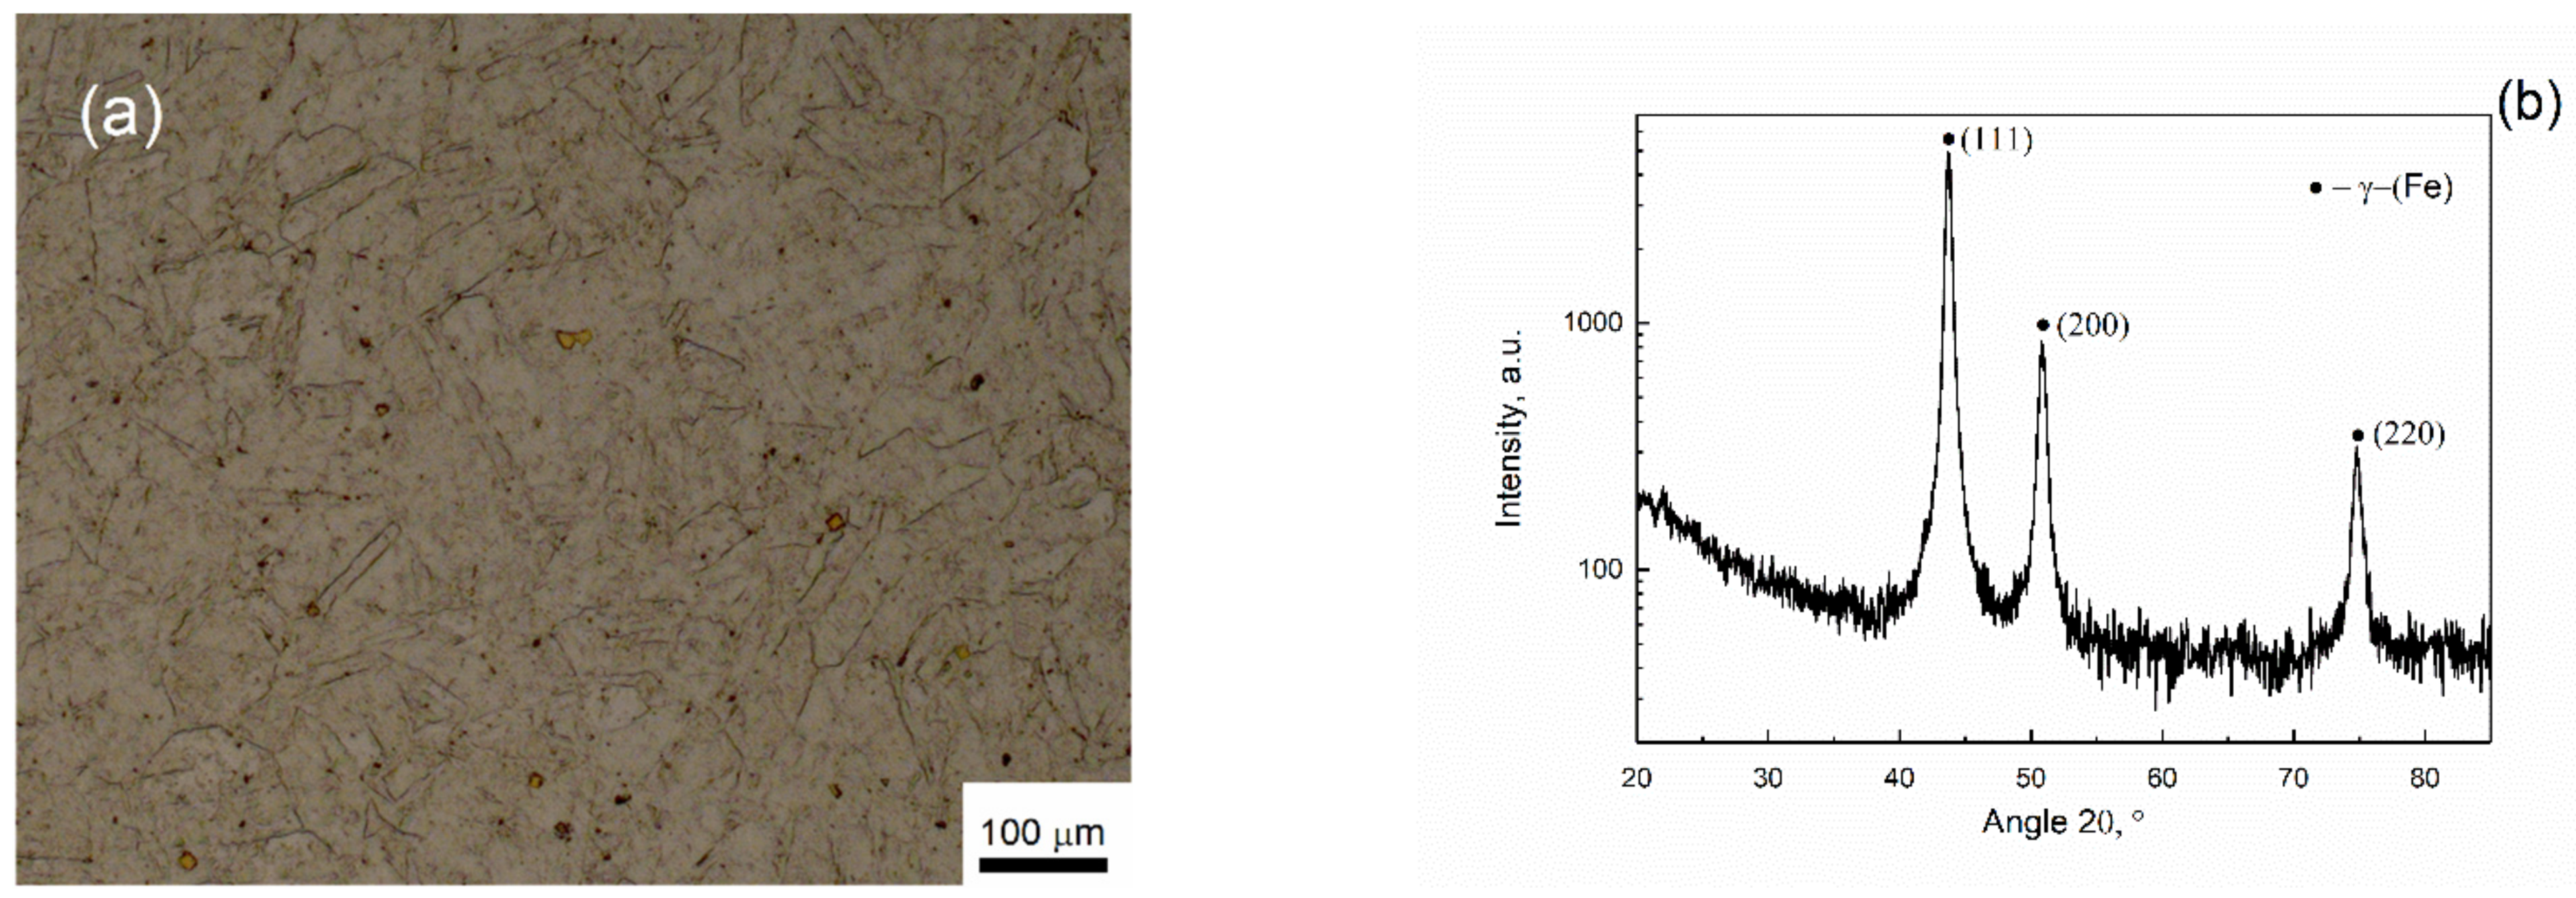
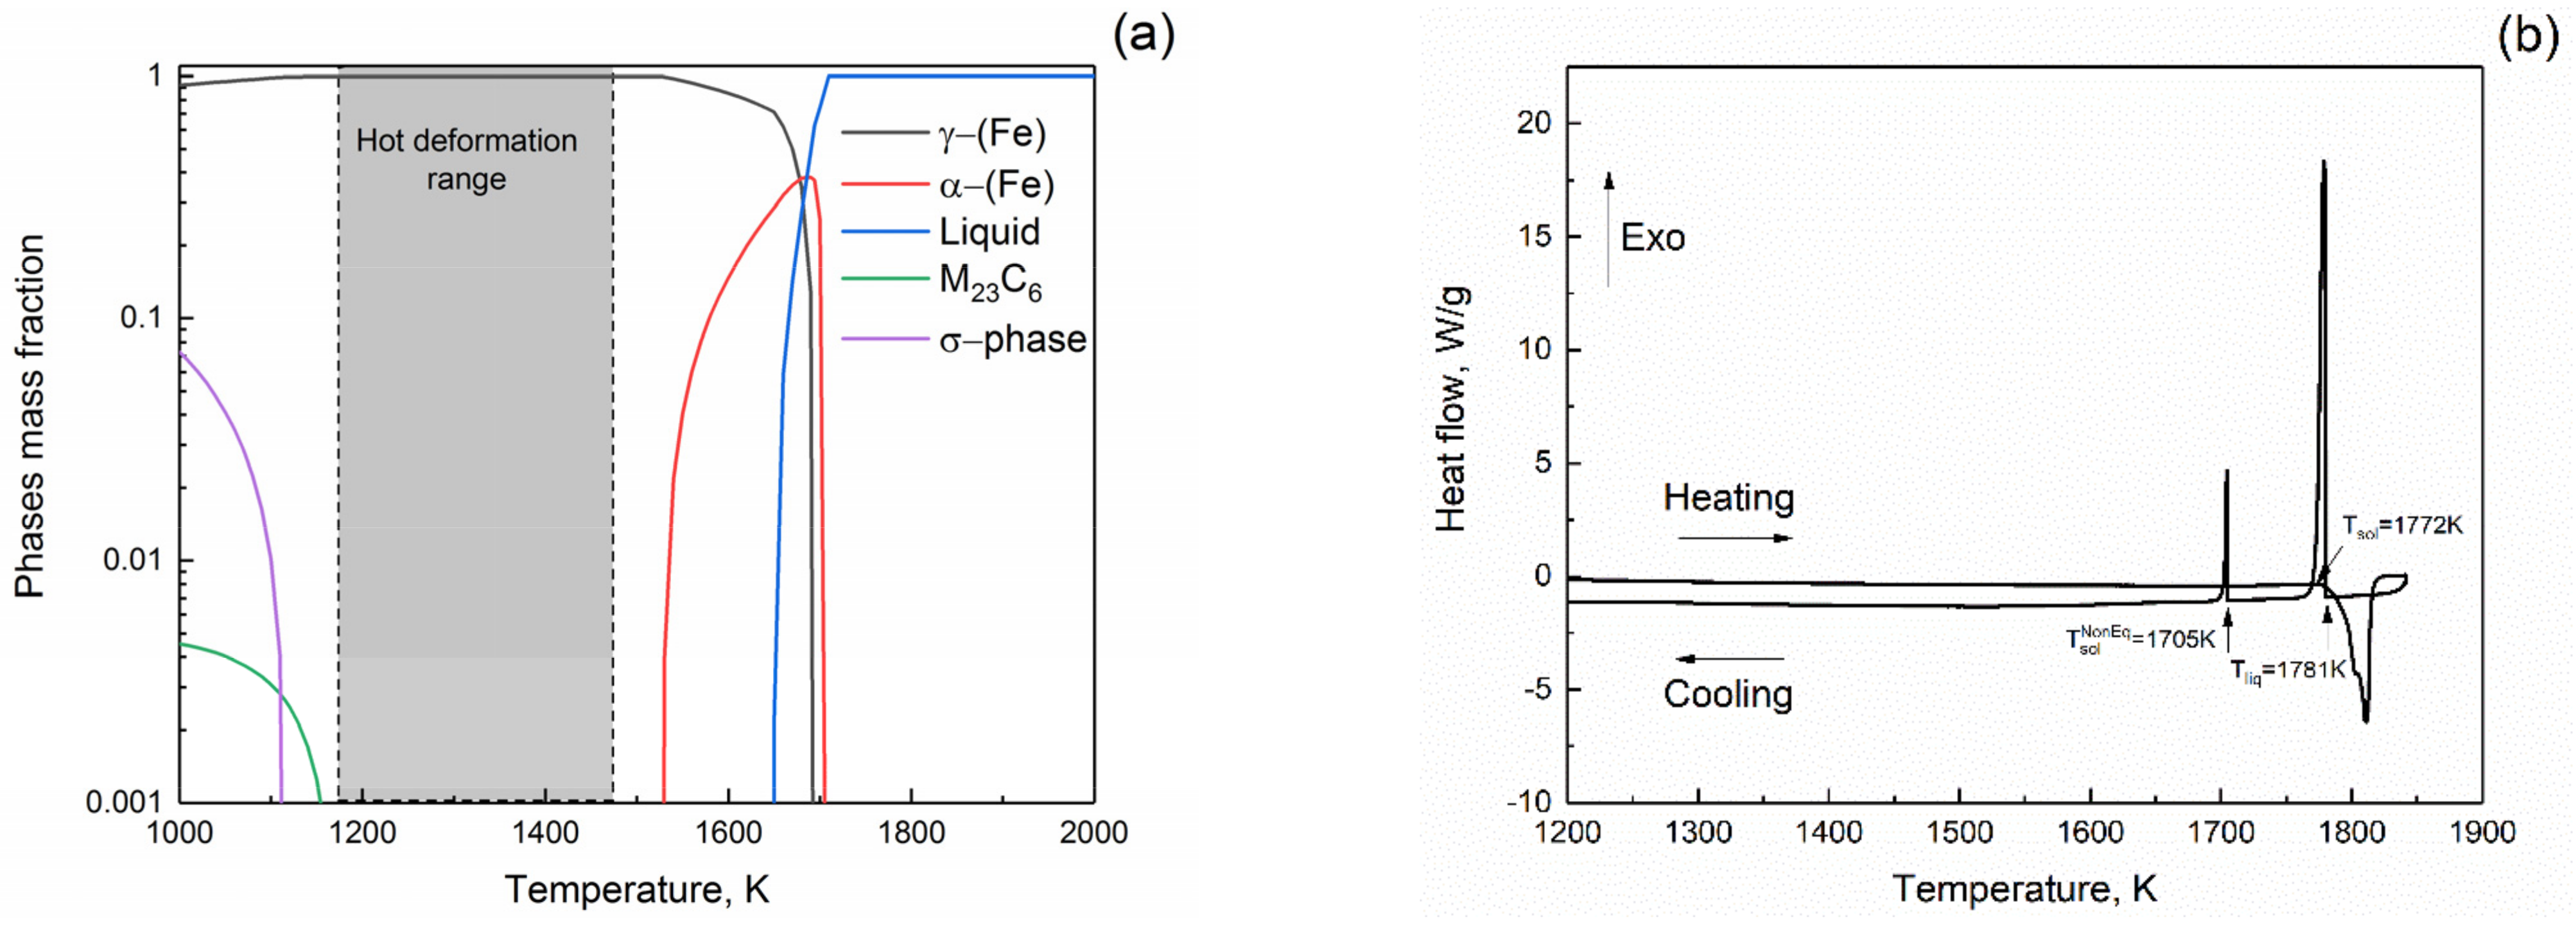
3.1. Thermodynamic Calculations and Phase Transformation Temperatures

The temperature range for hot deformation of 1173–1473 K was chosen accordingly to thermodynamic calculations. The dependence of the mass fraction of the phases on temperature is shown in Figure 2a. The austenite is the only phase present in the temperature range of 1173–1473 K. This fact was approved experimentally: as one can see from Figure 2b, there are no significant effects in the chosen temperature diapason on the DTA-curve.

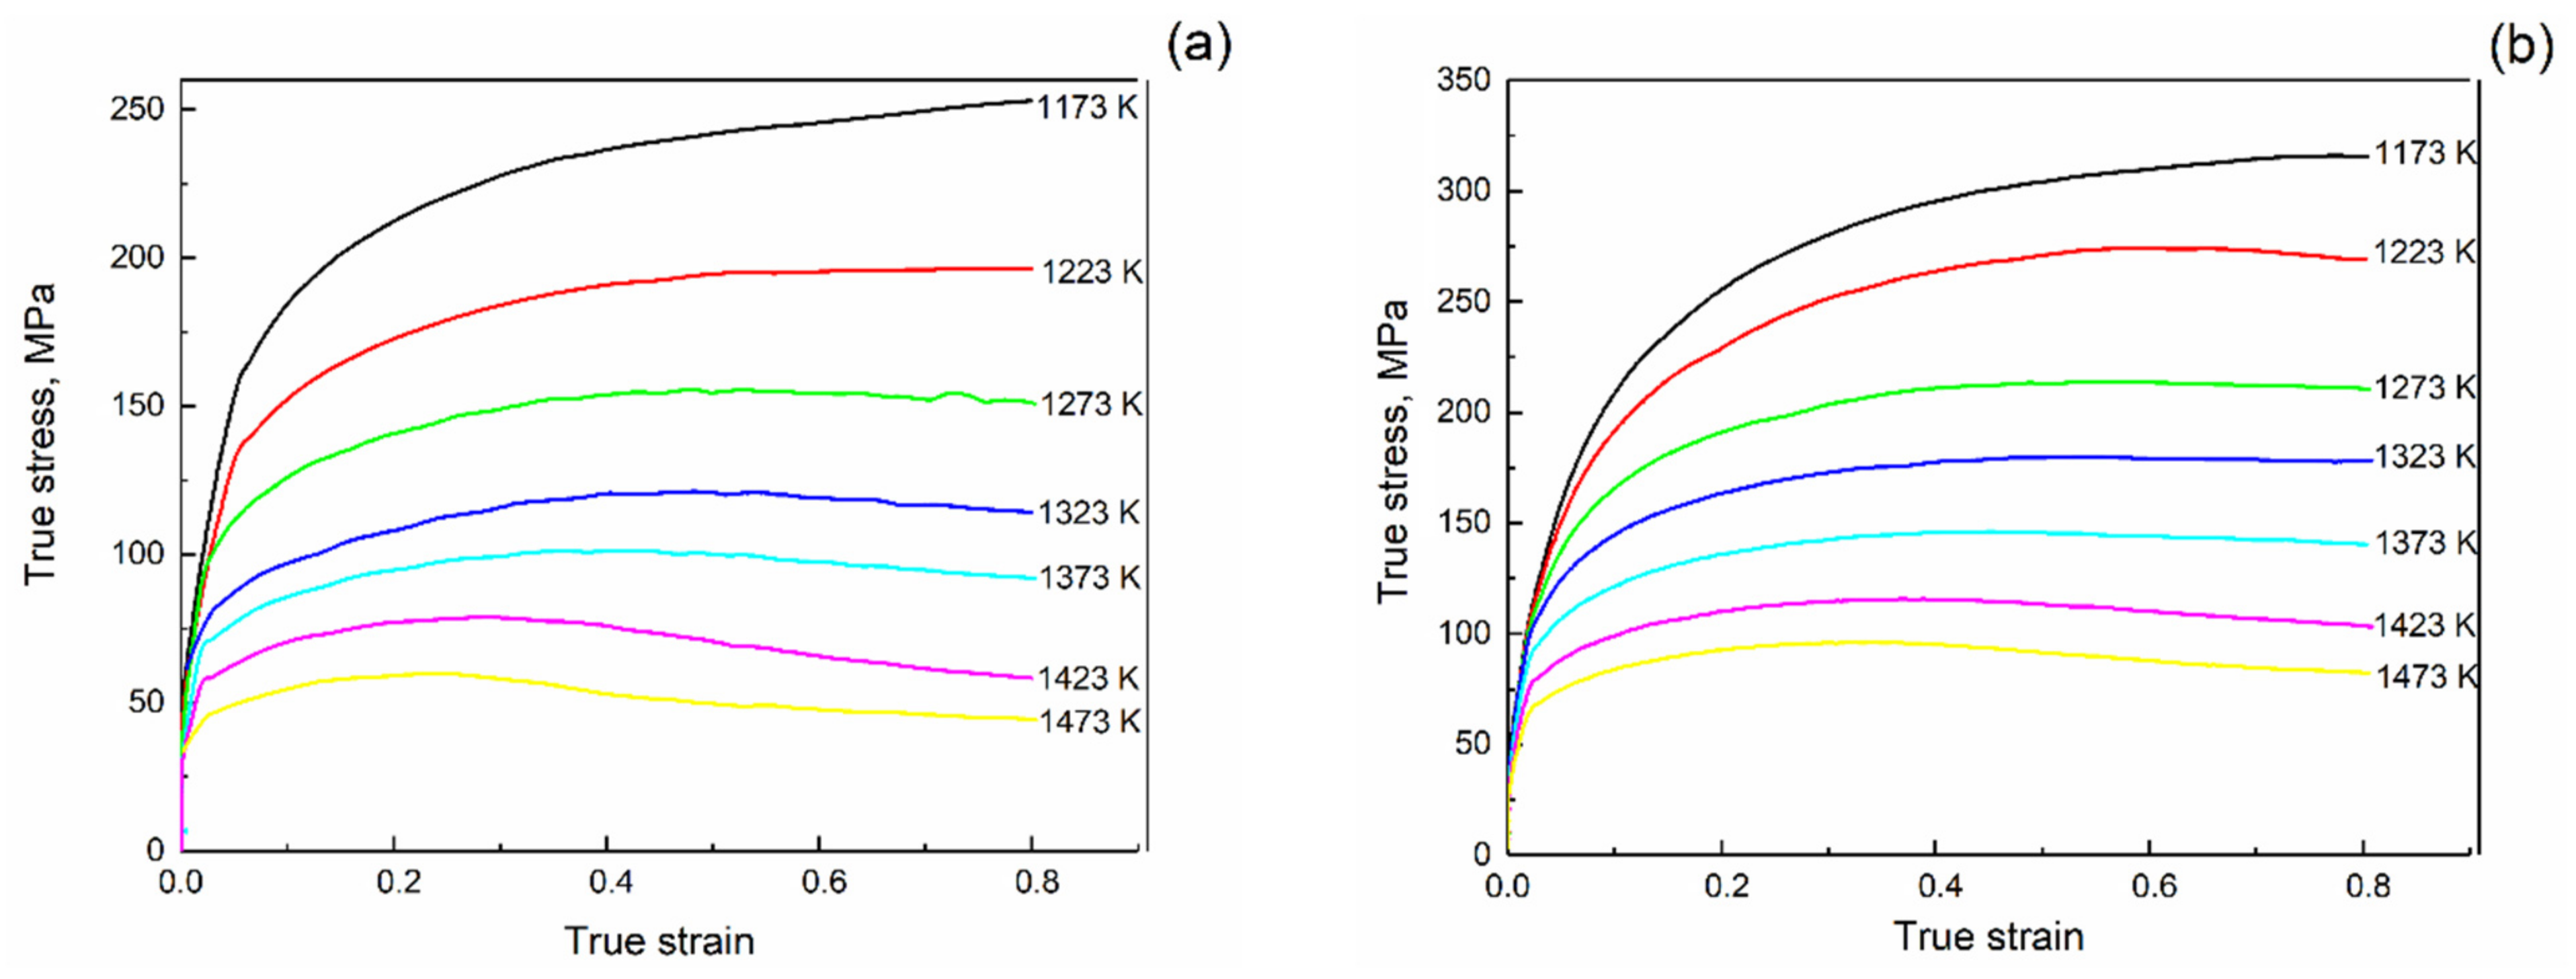
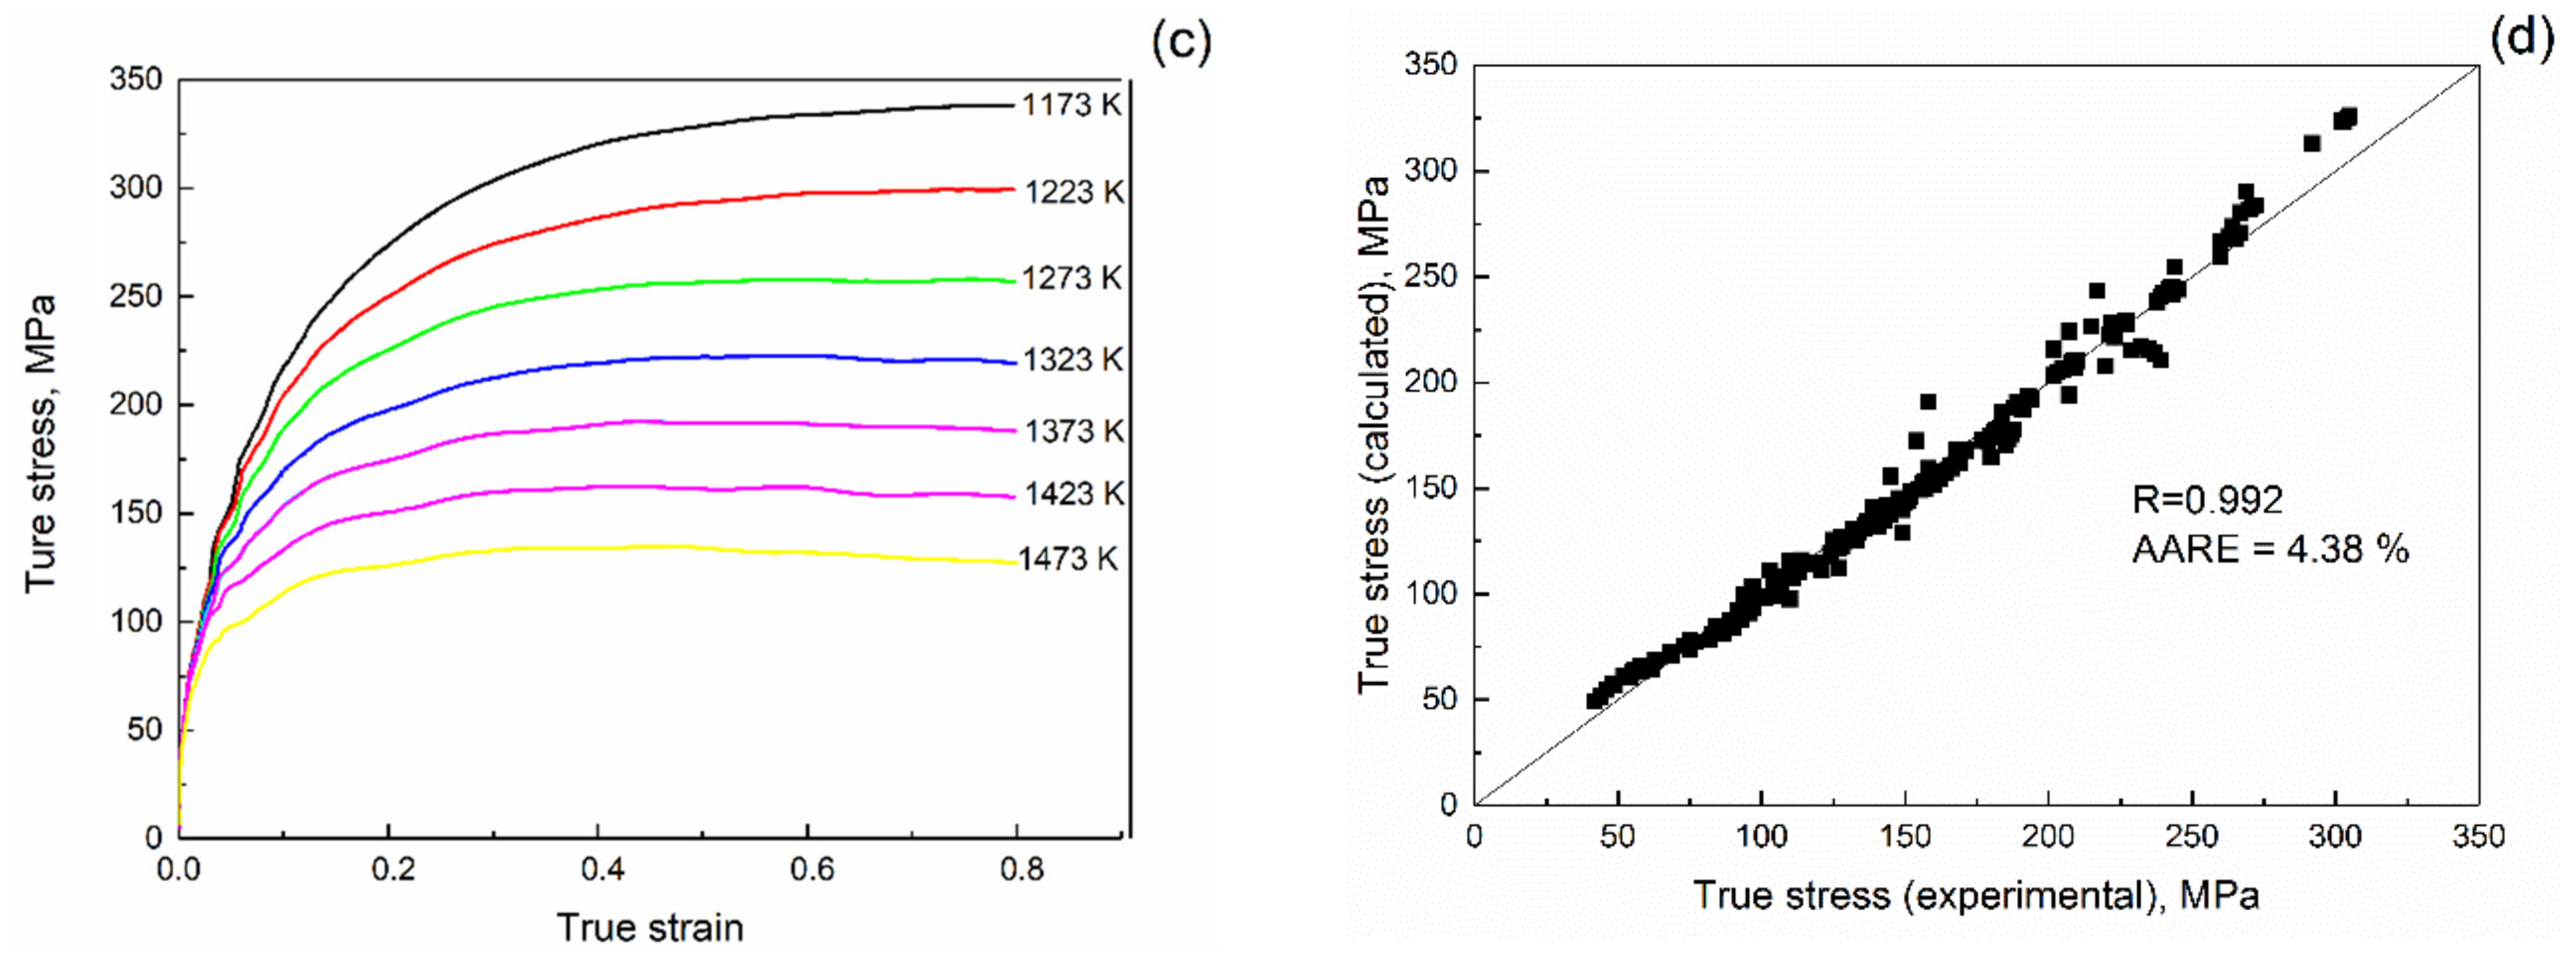
3.2. Hot Deformation Behavior Modelling

The hot deformation of the steel in the austenitic phase range proceeds in two main stages. At the first stage, two main structural changes are strain hardening (SH) and dynamic recovery (DRV). During this stage, the stress increases with a strain and achieves saturation. At the second stage of the deformation, dynamic recrystallization (DRX) is added to the SH and DRV processes. This stage appears by the maximum on the stress–strain curve when the increase of the SH’s stress is compensated by softening from the annihilation of the dislocations (DRV) and nucleation of new undeformed grains (DRX). However, it is known that the DRX process begins at the strain, which is lower than the peak strain at the deformation curve. Usually, the critical strain may be determined as a minimum on the dθ/dσ vs. σ graph where θ = dσ/dε is a strain hardening coefficient [51]. As shown in Figure 3, the stage of the DRX in the AISI 316Ti may be achieved only at high temperatures in the range of 1373–1473 K due to high stacking fault energy (SFE). The calculated SFE value accordingly [52] is about 49 mJ·m−2, which is higher than for the AISI 304 (19 mJ·m−2) [53] and AISI 301 (6.7 mJ·m−2) [54] austenitic steels. The high value of the SFE makes the dissociation of the dislocations in the slip plane difficult. The dislocations cross-slip proceeds more easily, leading to the annihilation of the dislocations without nucleation of new grains.
The Zener–Hollomon parameter-based constitutive model was constructed using the experimental data. The universal hyperbolic sine law was used to describe stress dependence on the strain rate ( ε ˙   s 1 ) and temperature (T, K):
Z = A HS sinh α σ n HS
where Z is the Zener–Hollomon parameter:
Z = ε ˙ e Q H S R T
where A HS , n HS and α are experimentally determined parameters, Q H S is the effective activation energy of the hot deformation, J/mol, R is the universal gas constant (8.314 J·mol−1∙K−1).
However, the description of special cases of the constitutive models is required to determine the α parameter’s value. The power-law form of the constitutive model is applicable for low stresses:
Z = A P σ n P
The exponential form is usually used for a high level of stress:
Z = A E e β σ
where A P , n P , A E , and β are experimentally determined parameters.
Parameter α may be approximately determined as:
α β n P
It is known that the materials constants’ values are dependent on the strain [55,56]. The fourth-order polynomial dependences were used to determine the value of the coefficients at different strains to increase the accuracy of the constitutive model:
l n ( A H S ) = 20.8 + 136.8 ε 471.4 ε 2 + 685.4 ε 3 352.6 ε 4
α = 0.014 0.066 ε + 0.222 ε 2 + 14.52 ε 3 6.11 ε 4
Q H S = 274 + 1282.7 ε 4375.9 ε 2 + 6441 ε 3 3373 ε 4
n H S = 6.05 + 0.17 ε 10.49 ε 2 + 14.52 ε 3 14.52 ε 4
The accuracy of the strain-compensated constitutive model was quantified using average absolute relative error (AARE) and Pearson’s correlation coefficient (R), which are expressed as [57]:
A A R E % = 100 N i = 1 N E i P i E i
R = i = 1 N E i E ¯ ¯ P i P ¯ i = 1 N ( E i E ¯ ¯ ) 2 i = 1 N ( P i P ¯ ) 2
Here, E is the experimental value and P is the predicted by the model stress, and E ¯ ¯ and P ¯ are those mean values. N is the number of experimental points used for model construction. As shown in Figure, the model’s accuracy is high (R = 0.992 and AARE = 4.38%). It means that obtained dependences may be used for the FE simulation of the tension and torsion with tension tests.

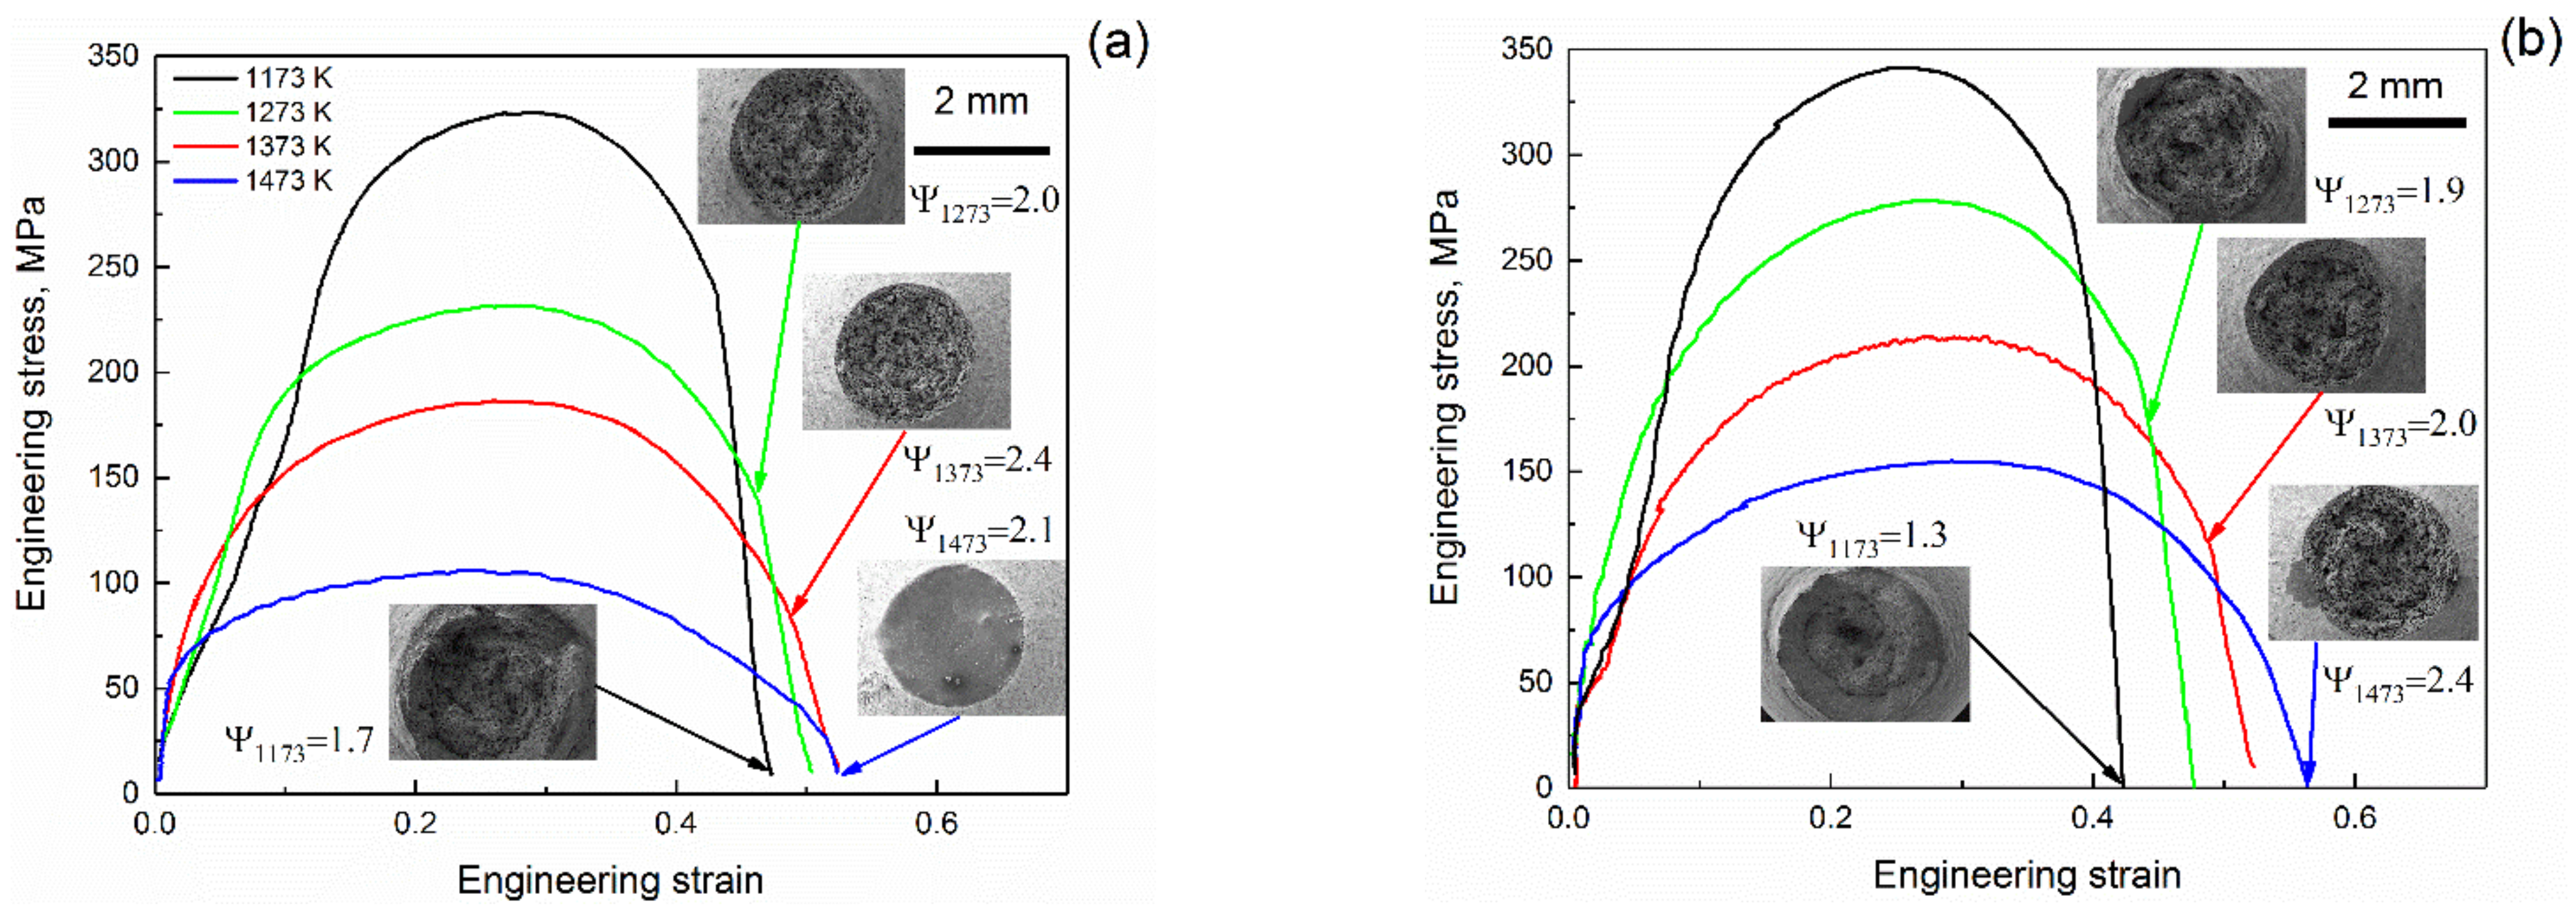
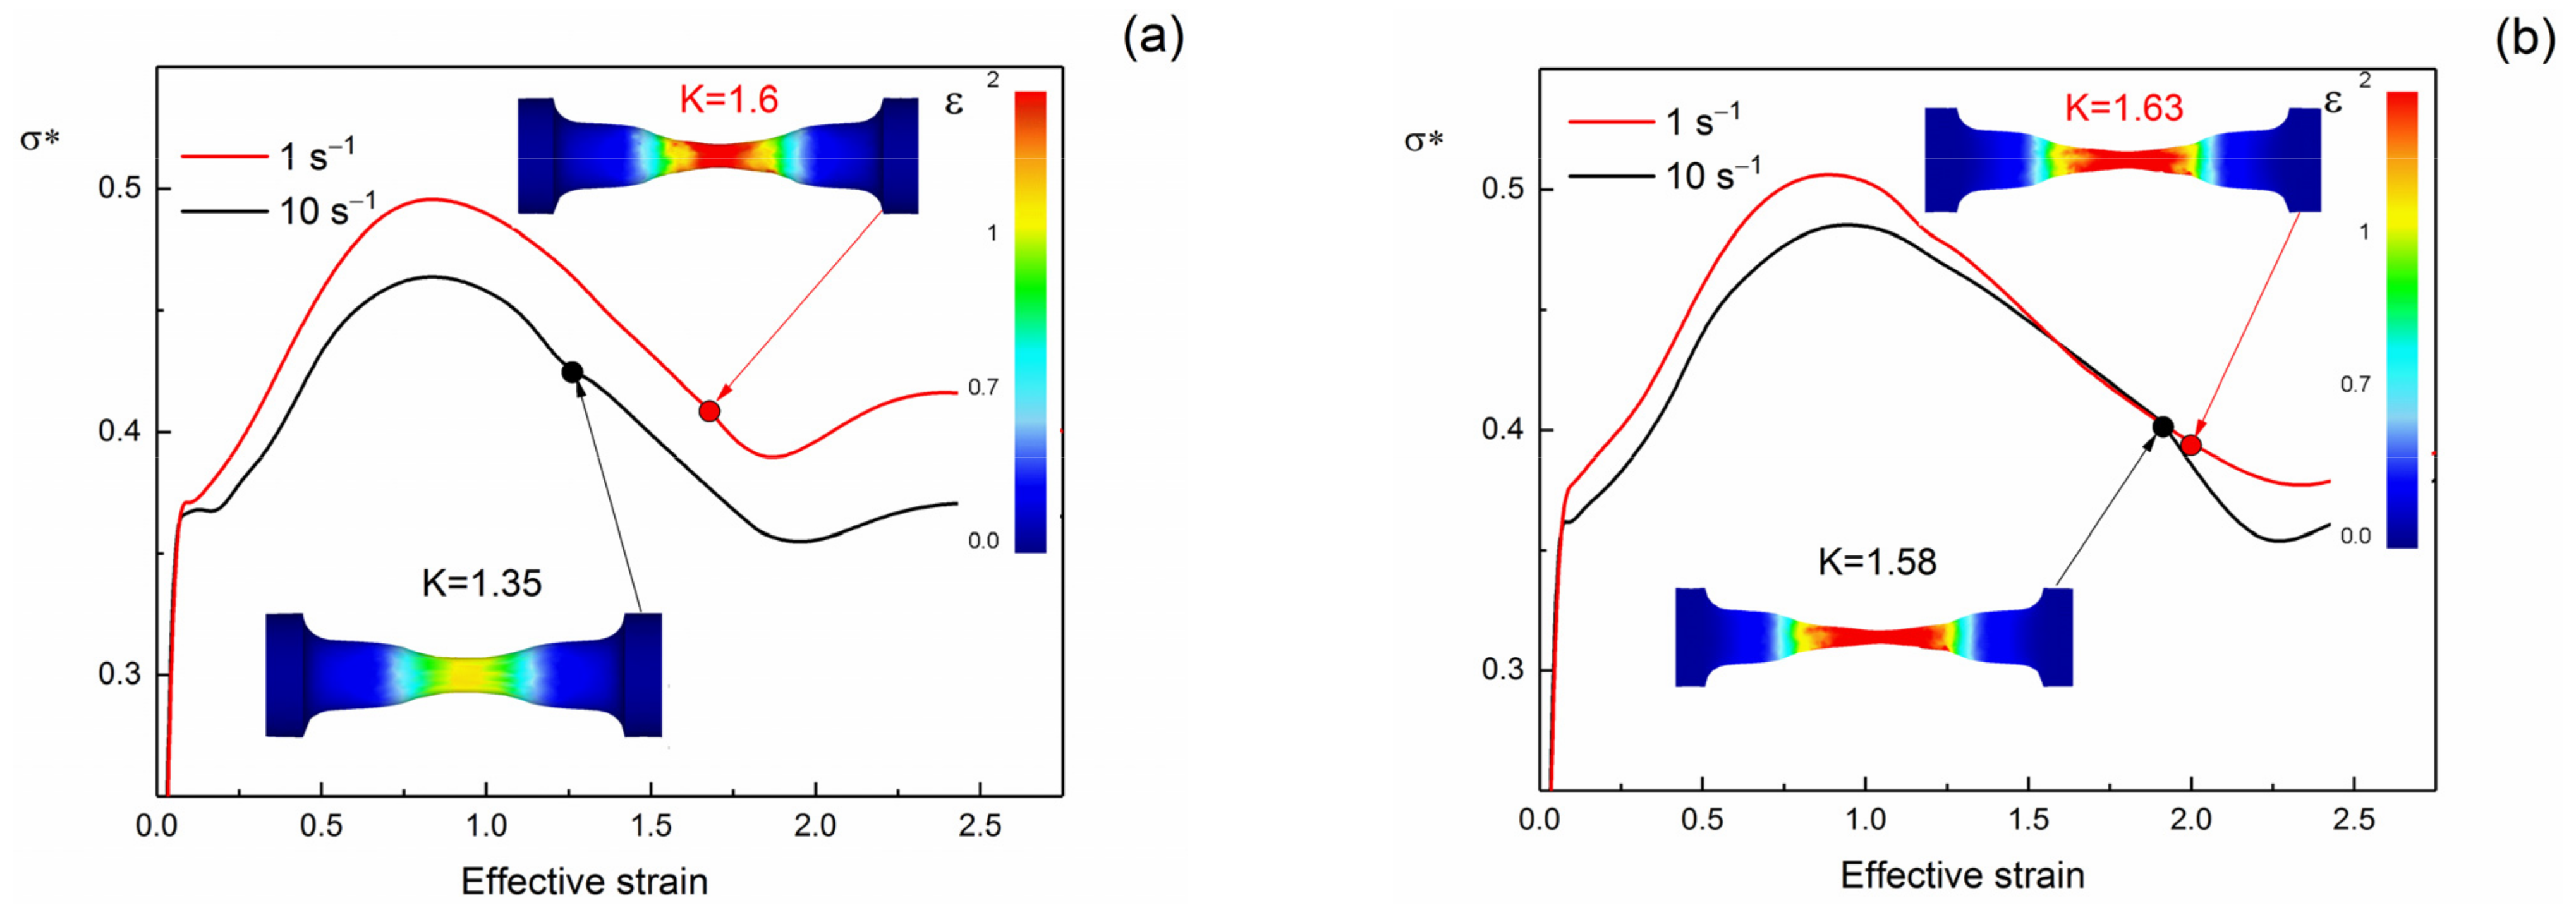
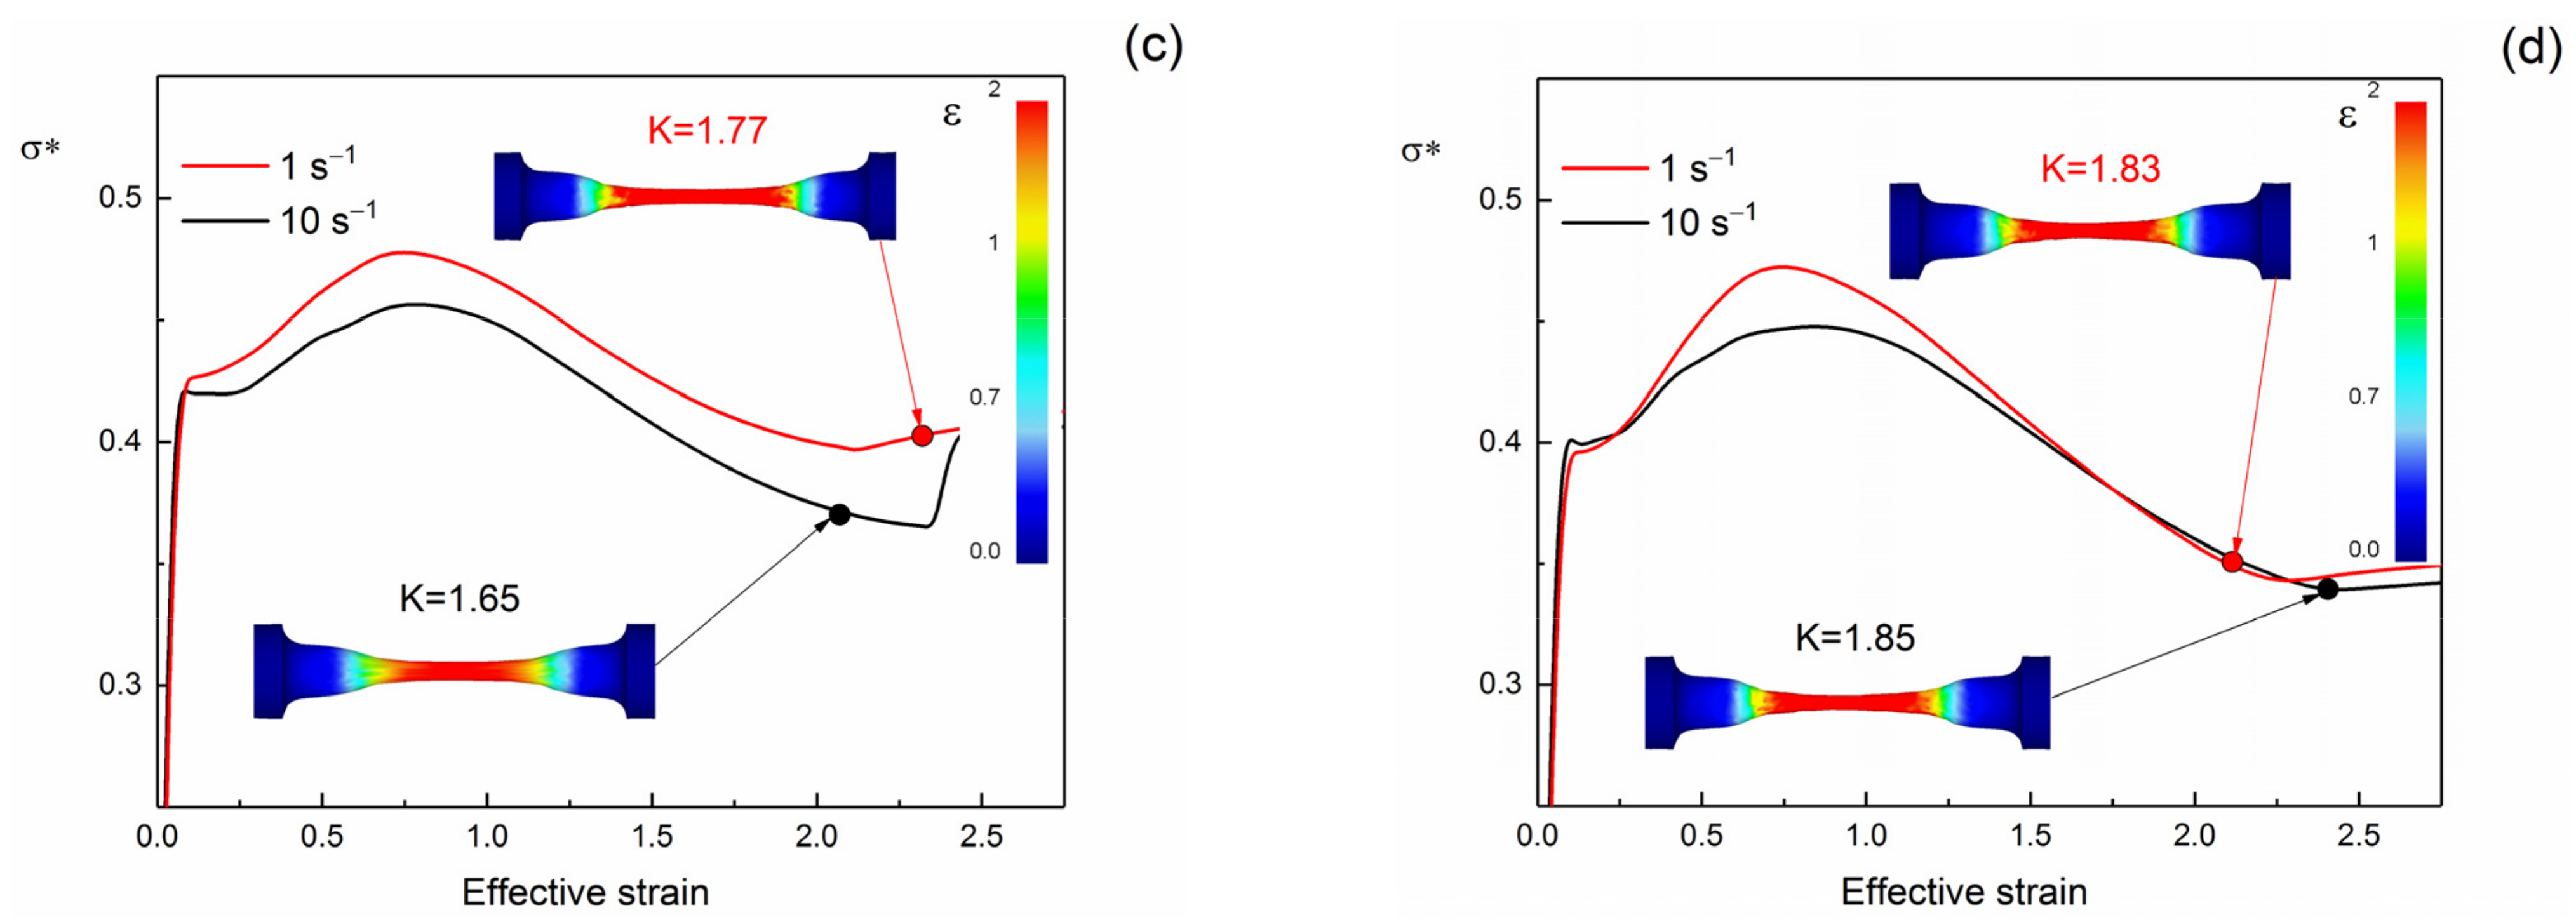
3.3. Hot Fracture Modelling

Tensile tests at temperatures of 1173, 1273, 1373, and 1473 K and strain rates of 1 s−1 and 10 s−1 were carried out to determine the fracture strain (the relative cross-section reduction (Ψ) after failure). The engineering stress–strain curves, the fracture surface of the samples, and the values of Ψ are shown in Figure 4.
The modified Rice and Tracy fracture model in conformity with Equation (11) was used to simulate the fracture process. The dependences of the stress triaxiality ( σ * ) on the strain in the center of the samples were calculated using the FE simulation of the tension process. As shown in Figure 5, the dependences have a similar tendency for all simulation conditions. The value of the stress triaxiality increases up to the beginning of the deformation localization. After the necking, σ * decreases up to experimental fracture strain (circles at the plots). The obtained dependences were integrated to determine the critical values of the modified Rice and Tracy criteria at each test temperature and strain rate following Equation (11). As one can see in Figure 6, the critical values are dependent on the Zener–Hollomon parameter by a power law:
m R T c r = A Z n = 4.2 ε ˙ e 345,900 R T 0.03
The strain rate sensibility of the critical values is low, and the deformation temperature has a crucial influence on fracture behavior. The effective activation energy of the fracture 345.9 kJ·mol−1 has a lower value in comparison with the Q H S value (420 kJ·mol−1 for a strain rate of 0.8). It may be explained by a lower energy barrier for the appearance and coalescence of the voids during hot deformation compared to the process of the dislocations’ generation and movement.

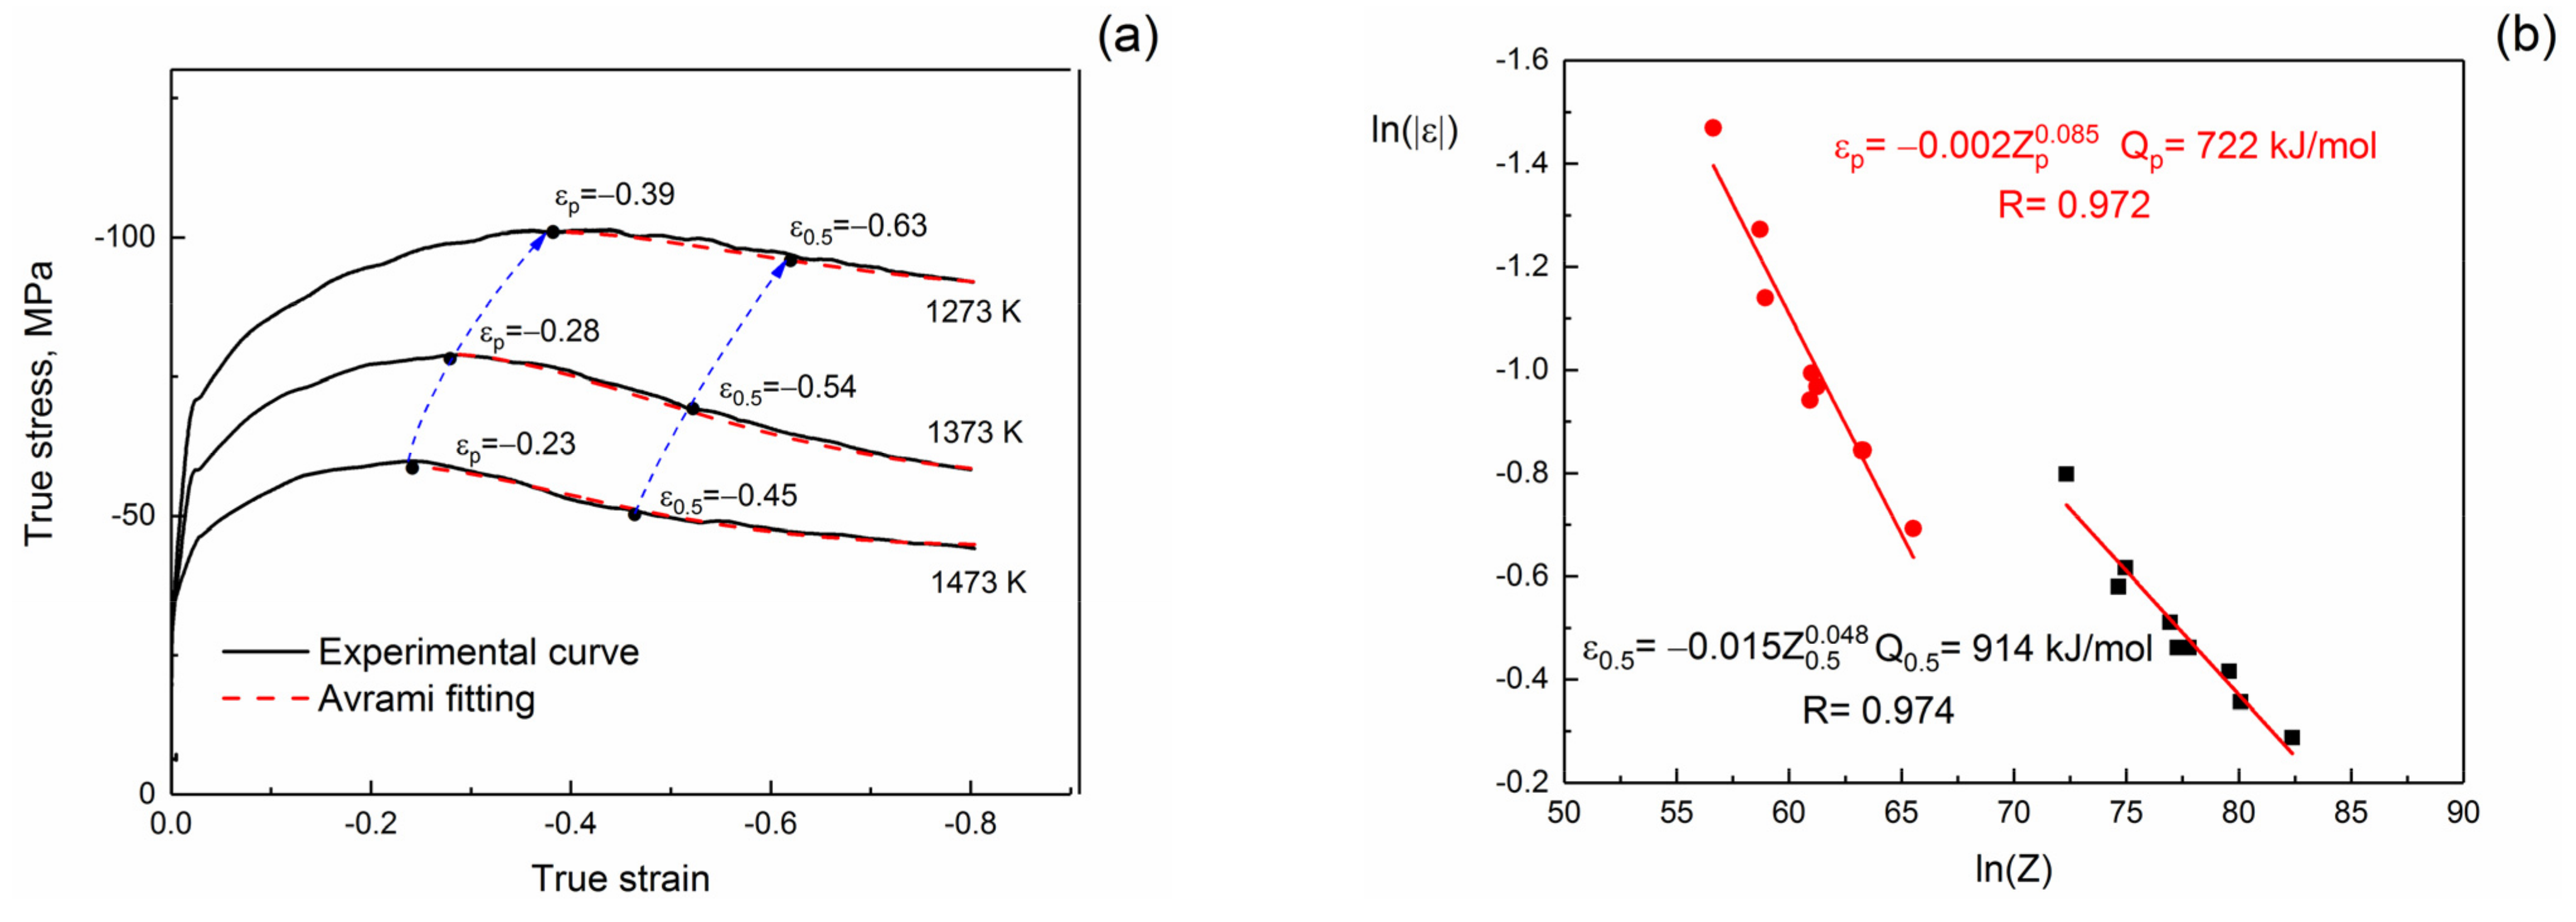
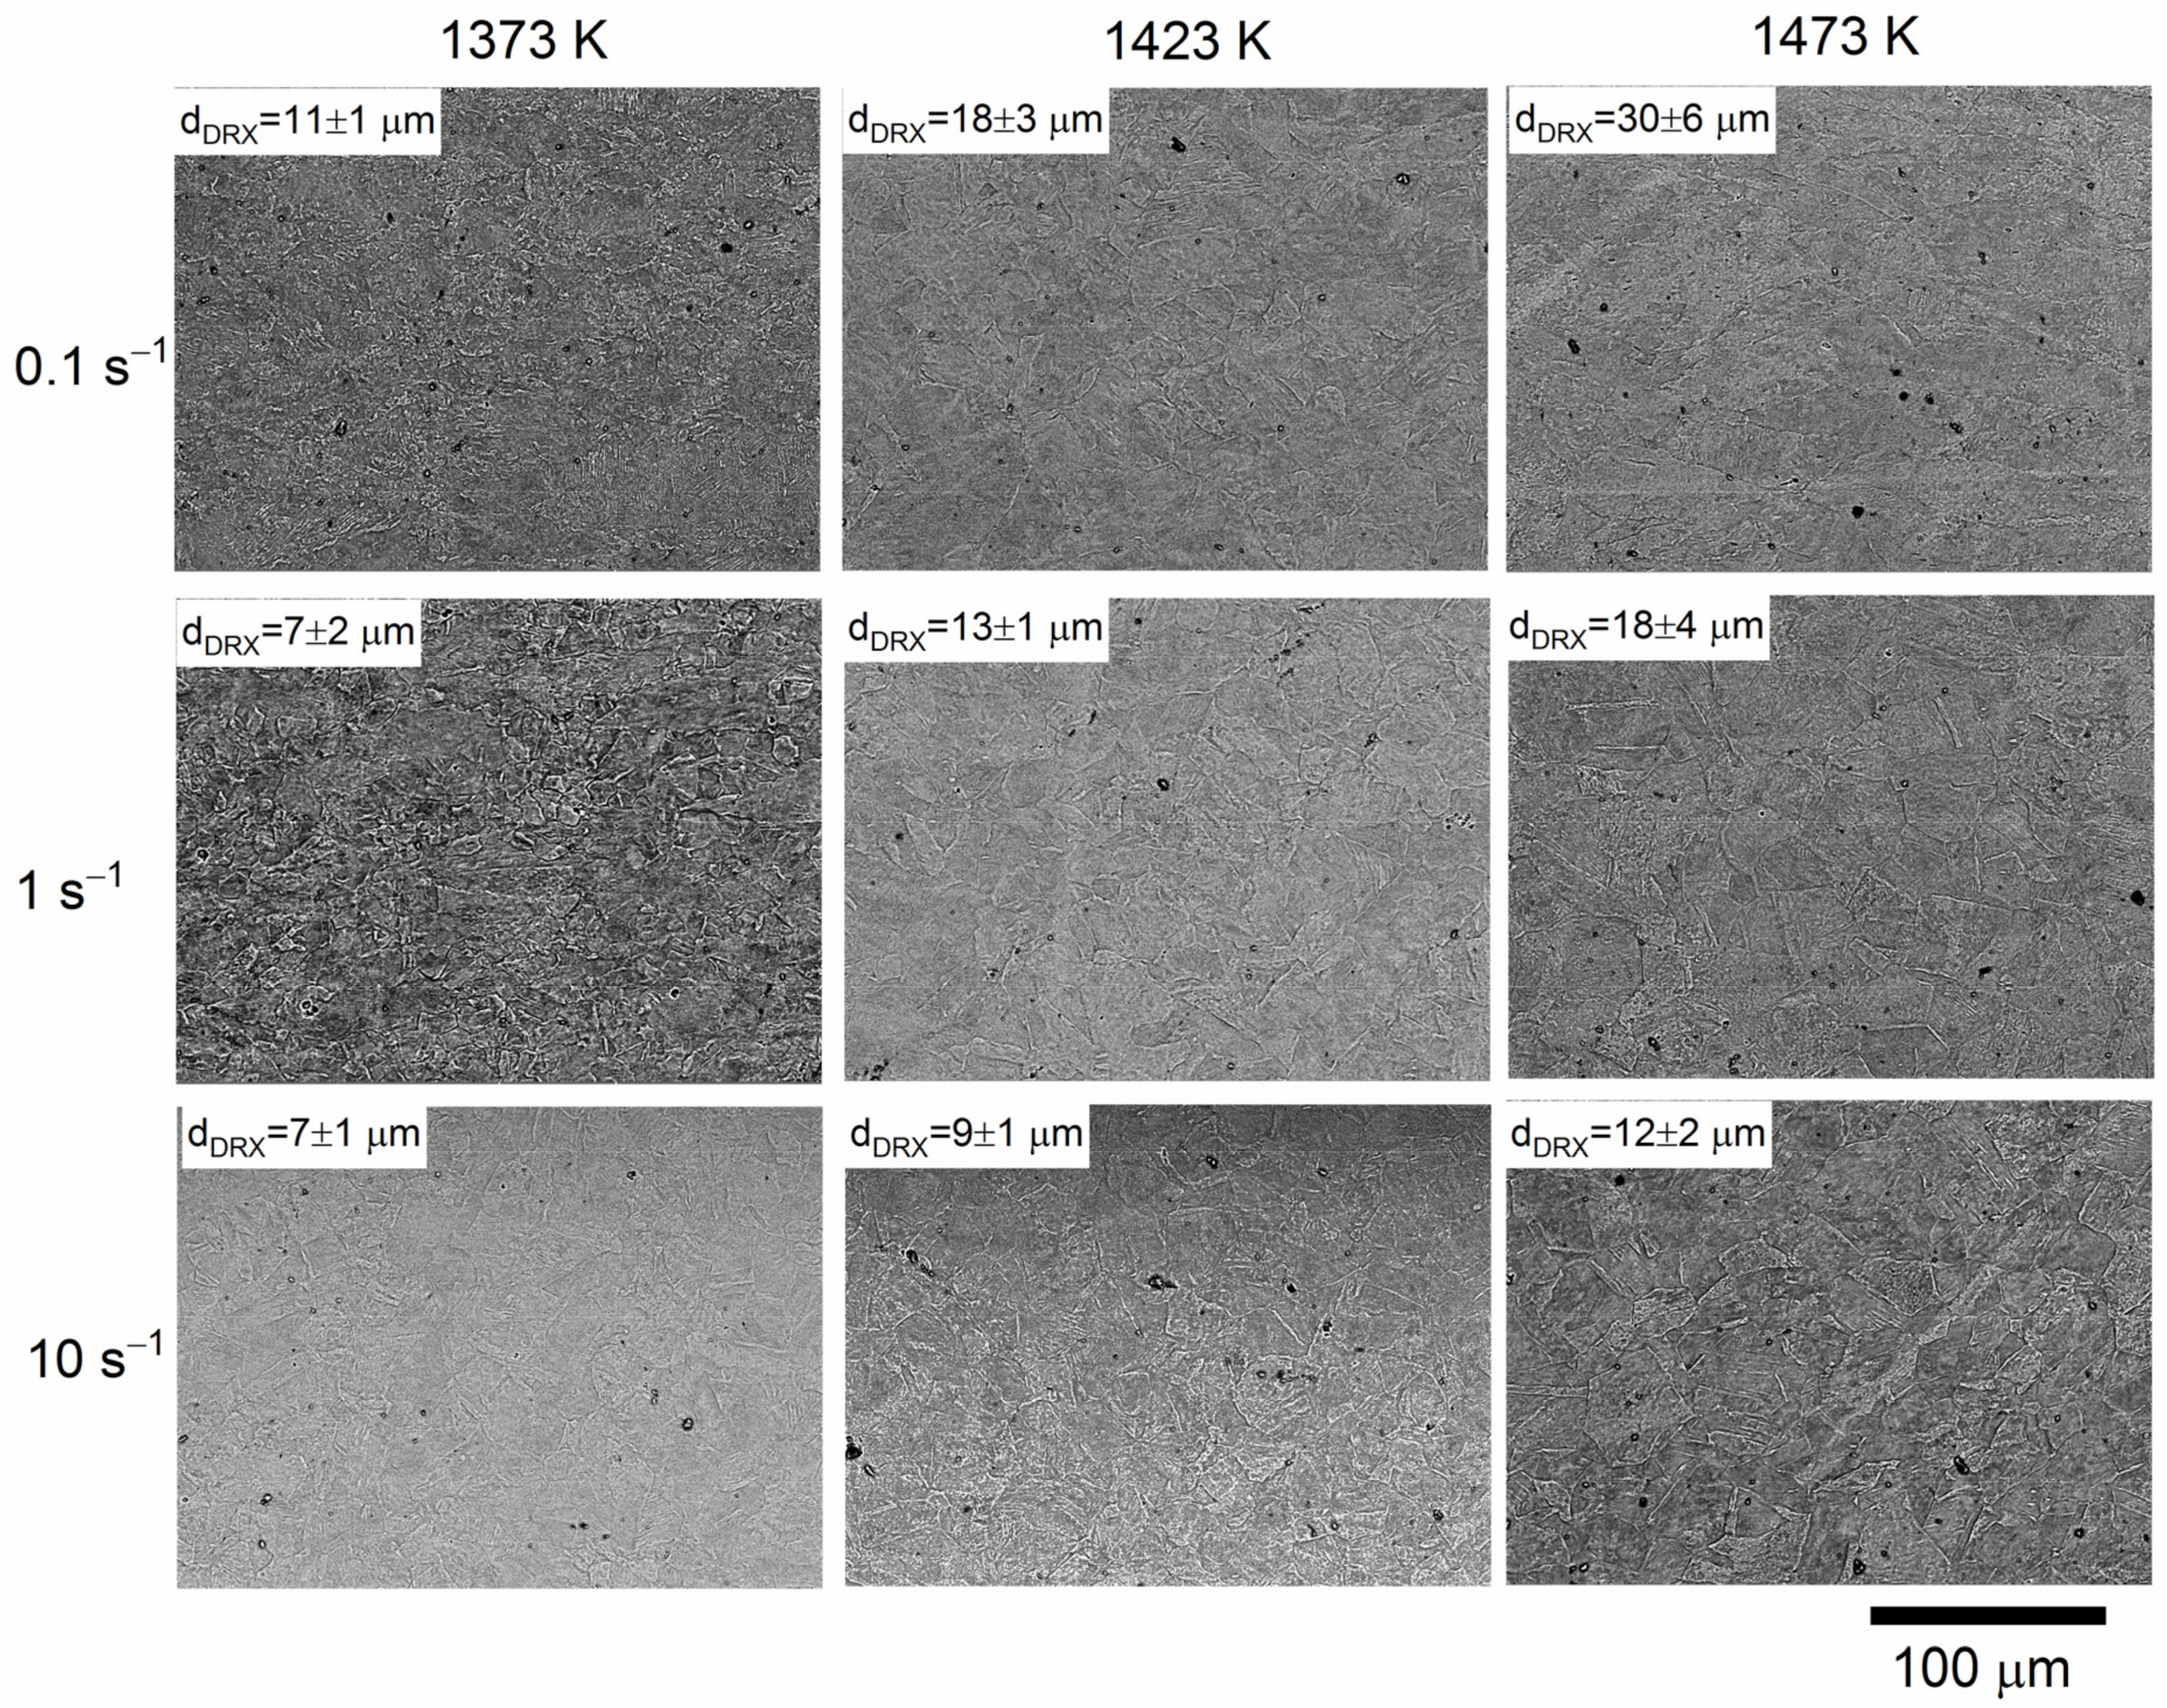
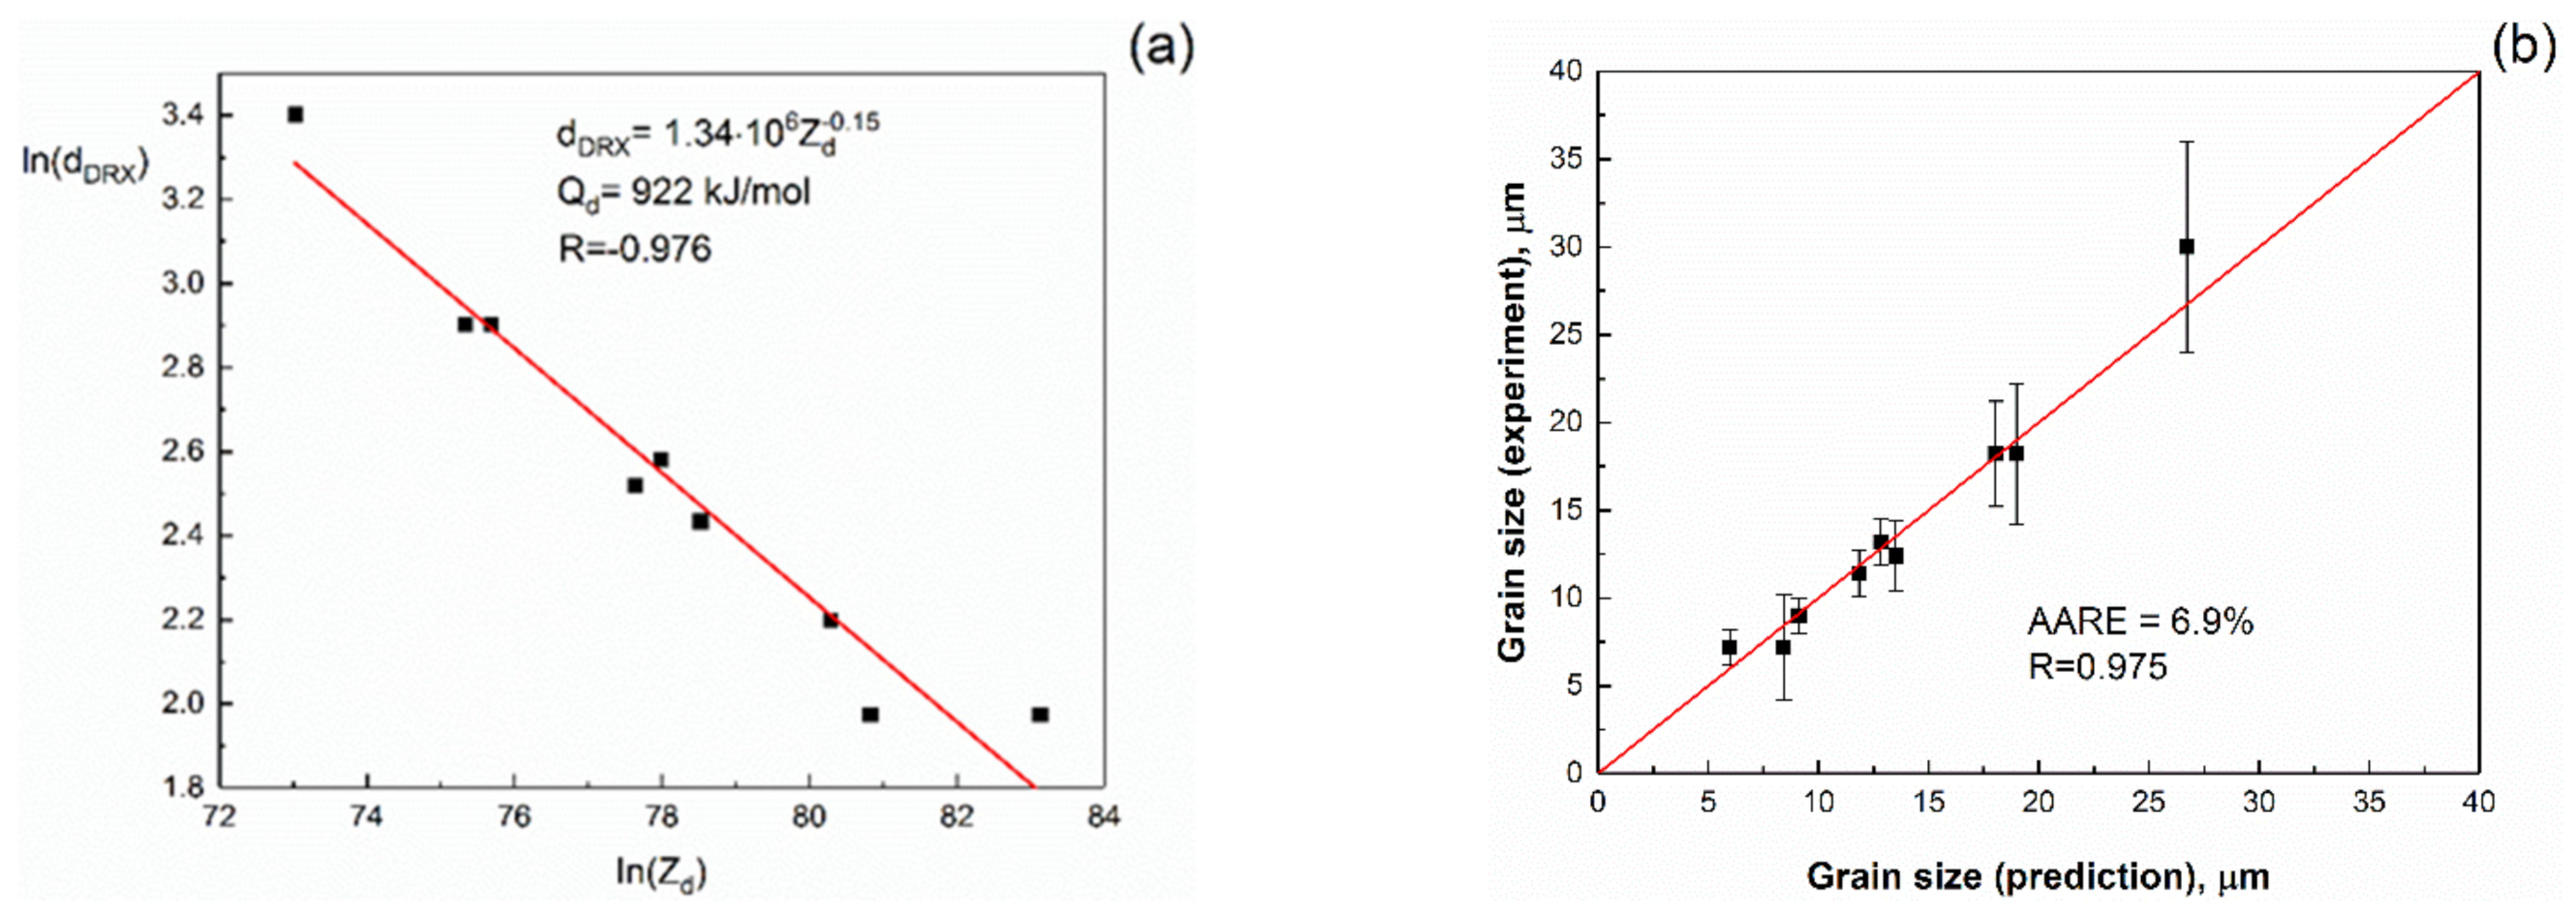
3.4. Dynamic Recrystallization Model

The DRX kinetics parameters of the AISI 316Ti steel were determined using true stress–true strain curves from the maximum stress to steady-state mode. The volume fraction of the DRX grains was assumed from the additive contributions of the deformed and recrystallized grains to overall stress value:
X DRX = σ p σ σ p σ ss ,
where σ p is the peak stress which corresponds to the stress of the deformed grains, σ s s is the steady-state stress characterizing the deformation resistance of the recrystallized grains, and σ is the current stress value. Examples of the fittings using the JMAK model (14) and Equation (34) are shown in Figure 7a. The kd parameter has a value of about 1.7 for all compression tests conducted at the temperatures of 1373, 1423, and 1473 K and the strain rates of 0.1, 1, and 10 s−1. This value approximately correspondent to the ones obtained earlier [36,58].
The dependences of the ε p and ε 0.5 from the Zener–Hollomon parameter are presented in Figure 7b. We can see good accordance of the ε p and ε 0.5 experimental values with the Equations (16)–(19). The values of both effective activation energies of recrystallization at the beginning and in the middle of the DRX are significantly larger than the values for the effective activation energy of the deformation. It may be described by the significant influence of the dynamic recovery on the microstructural changes due to high SFE value. Some of the dislocations annihilate before new grains’ nucleation, and the energetic barrier of the DRX increases.
The microstructures of the AISI 316Ti steel after hot plastic deformation are shown in Figure 8. The average grain size is in the range of 7–30 μm. Its value is significantly dependent on the deformation conditions and decreases with increasing the strain rate and decreasing the temperature. The experimental grain size values were used for the determination of the unknown material’s constants in Equations (20) and (21). The dependence ln(dDRX) vs. ln(Zd) is shown in Figure 9a. The effective activation energy Qd = 922 kJ·mol (steady stage) has a value almost equal to a value of Q0.5 = 915 kJ·mol (middle of the DRX process) and higher than the value at the beginning of the DRX (QP = 722 kJ·mol). It means that the new grains’ growth in the deformed matrix is the limiting process of dynamic recrystallization. The comparison of the calculated and experimental grain size values is shown in Figure 9b. The average absolute relative error was 6.9%, comparable with the mean grain size value’s measurement error. This fact allows us to include the constructed model in the united scheme of modelling the hot deformation behavior, fracture, and microstructure evolution.

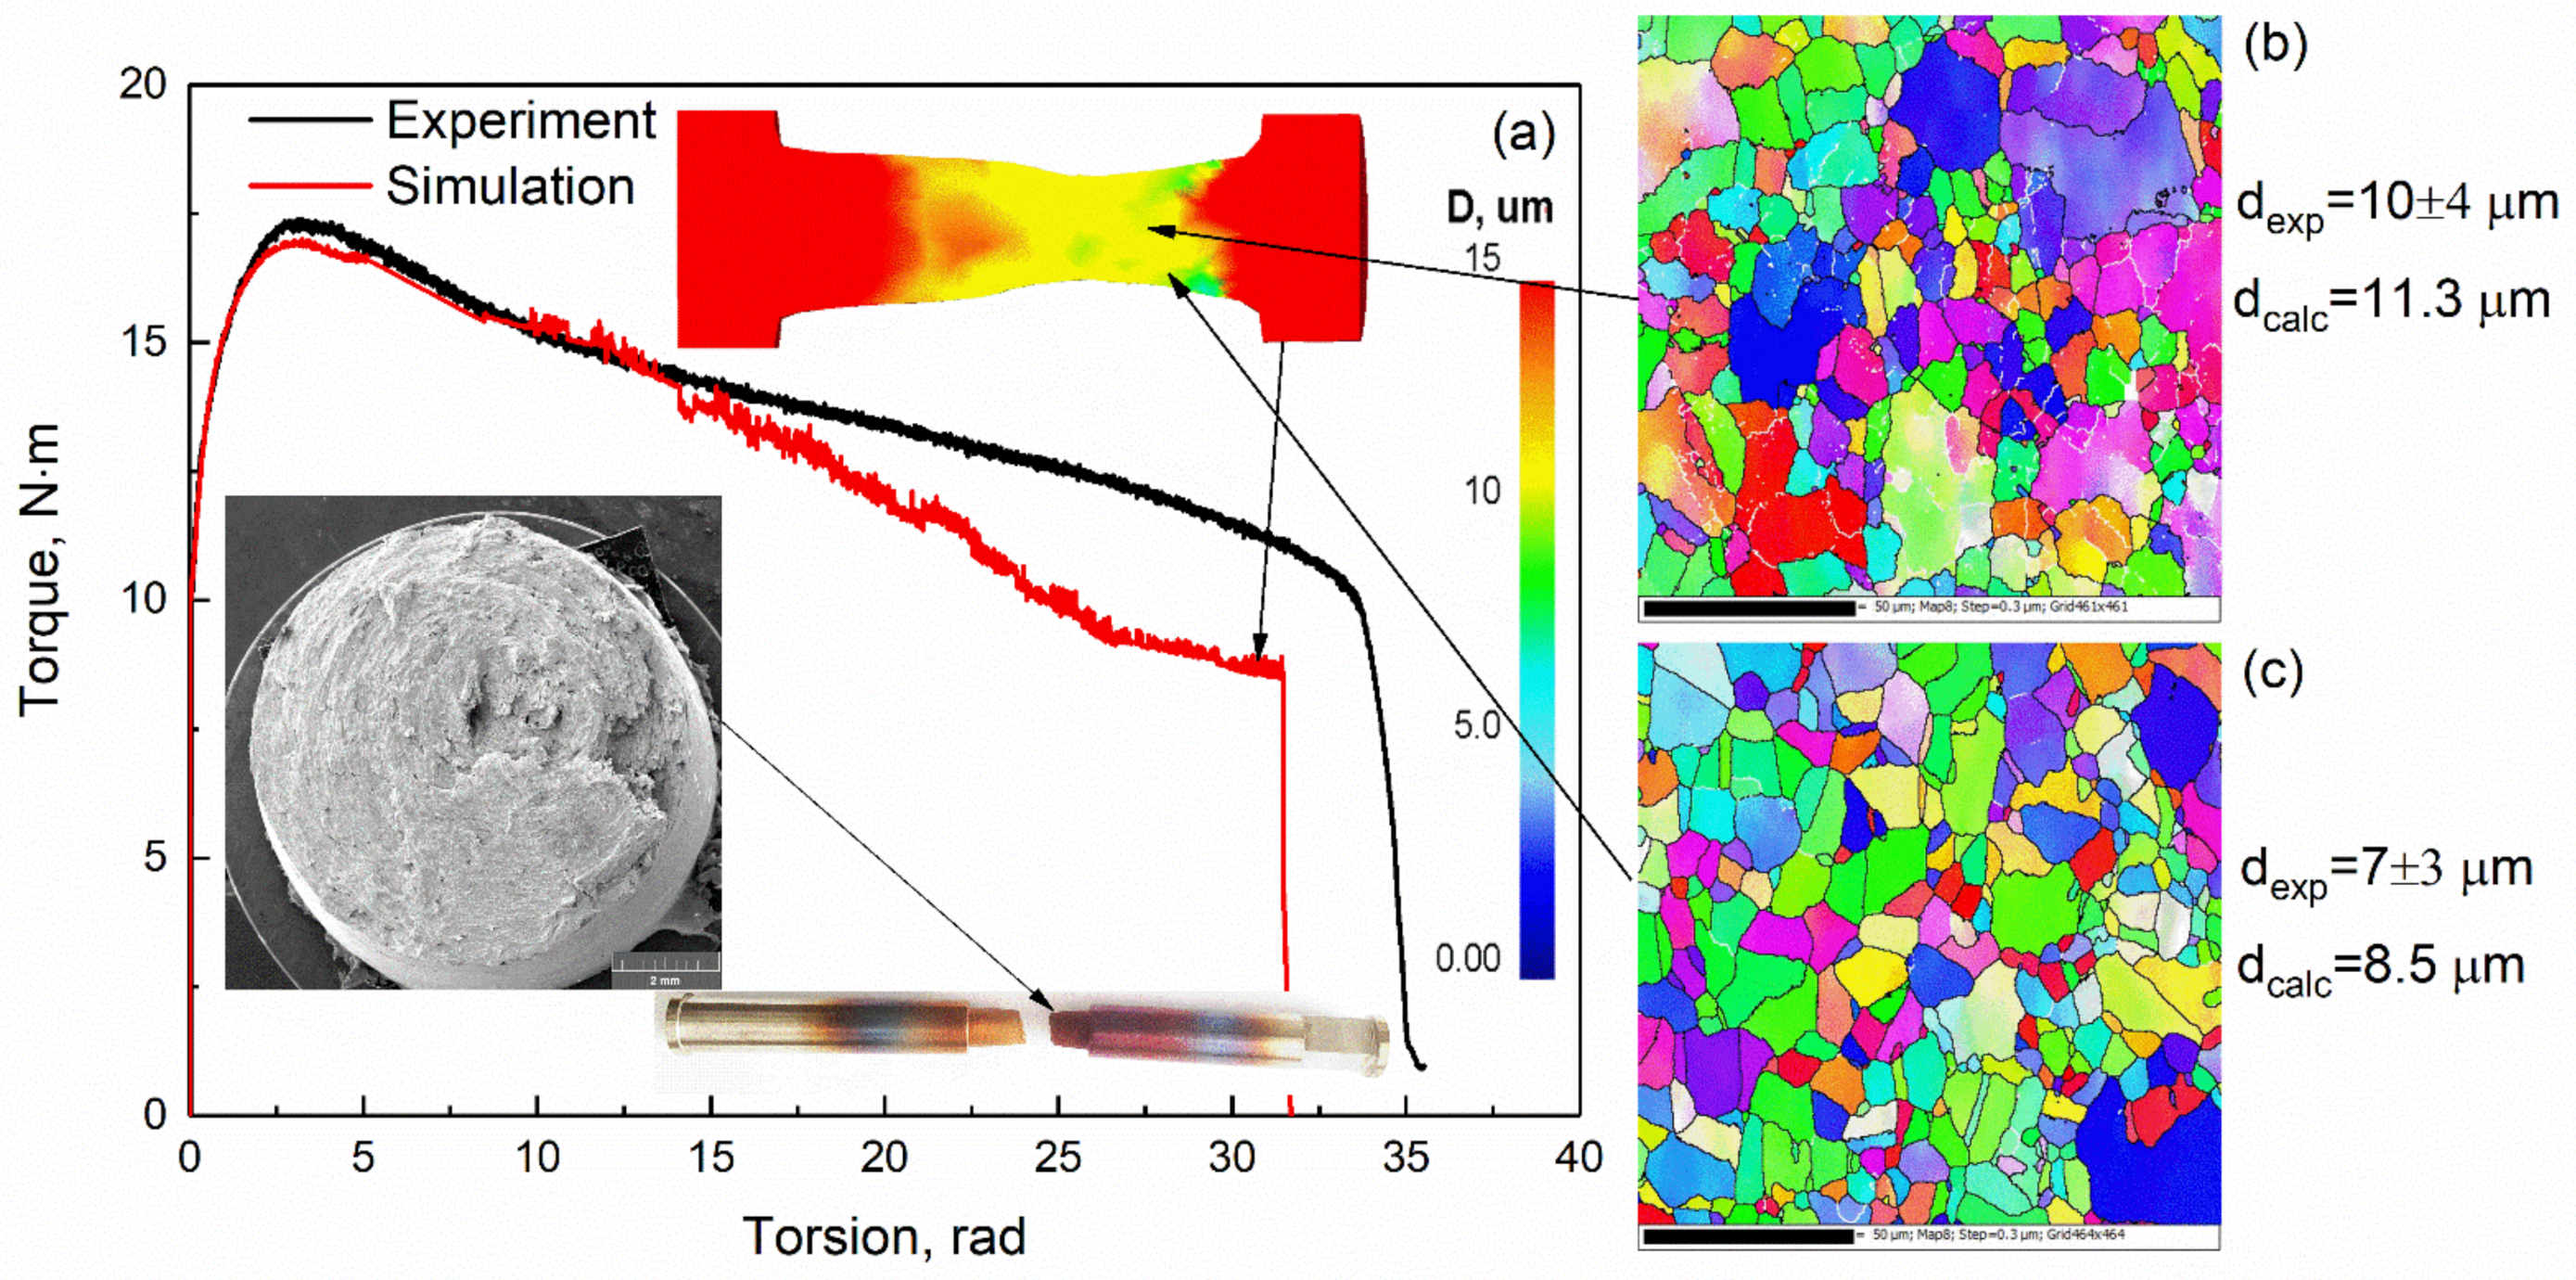
3.5. Approving of the Constructed Models

The torsion with tension test was conducted experimentally and simulated using the FE method to approve the constructed models. As shown in Figure 10a, the experimental and calculated torque vs. torsion curves are in good accordance (the average absolute relative error was 6.9%). The traces of the severe plastic deformation are seen on the fracture surface. The failure proceeded after large plastic deformation by torsion and with insignificant localization due to tension forces.
After the deformation, the microstructure is fully recrystallized due to large plastic deformation before the fracture (Figure 10b,c). The average grain size was 10 ± 4 and 7 ± 3 µm in the center and near the surface of the sample, respectively. These values are in good accordance with the calculated values. The grain size value obtained by FE simulation changed from 11.3 to 8.5 µm in the samples’ cross-section’s radial direction.

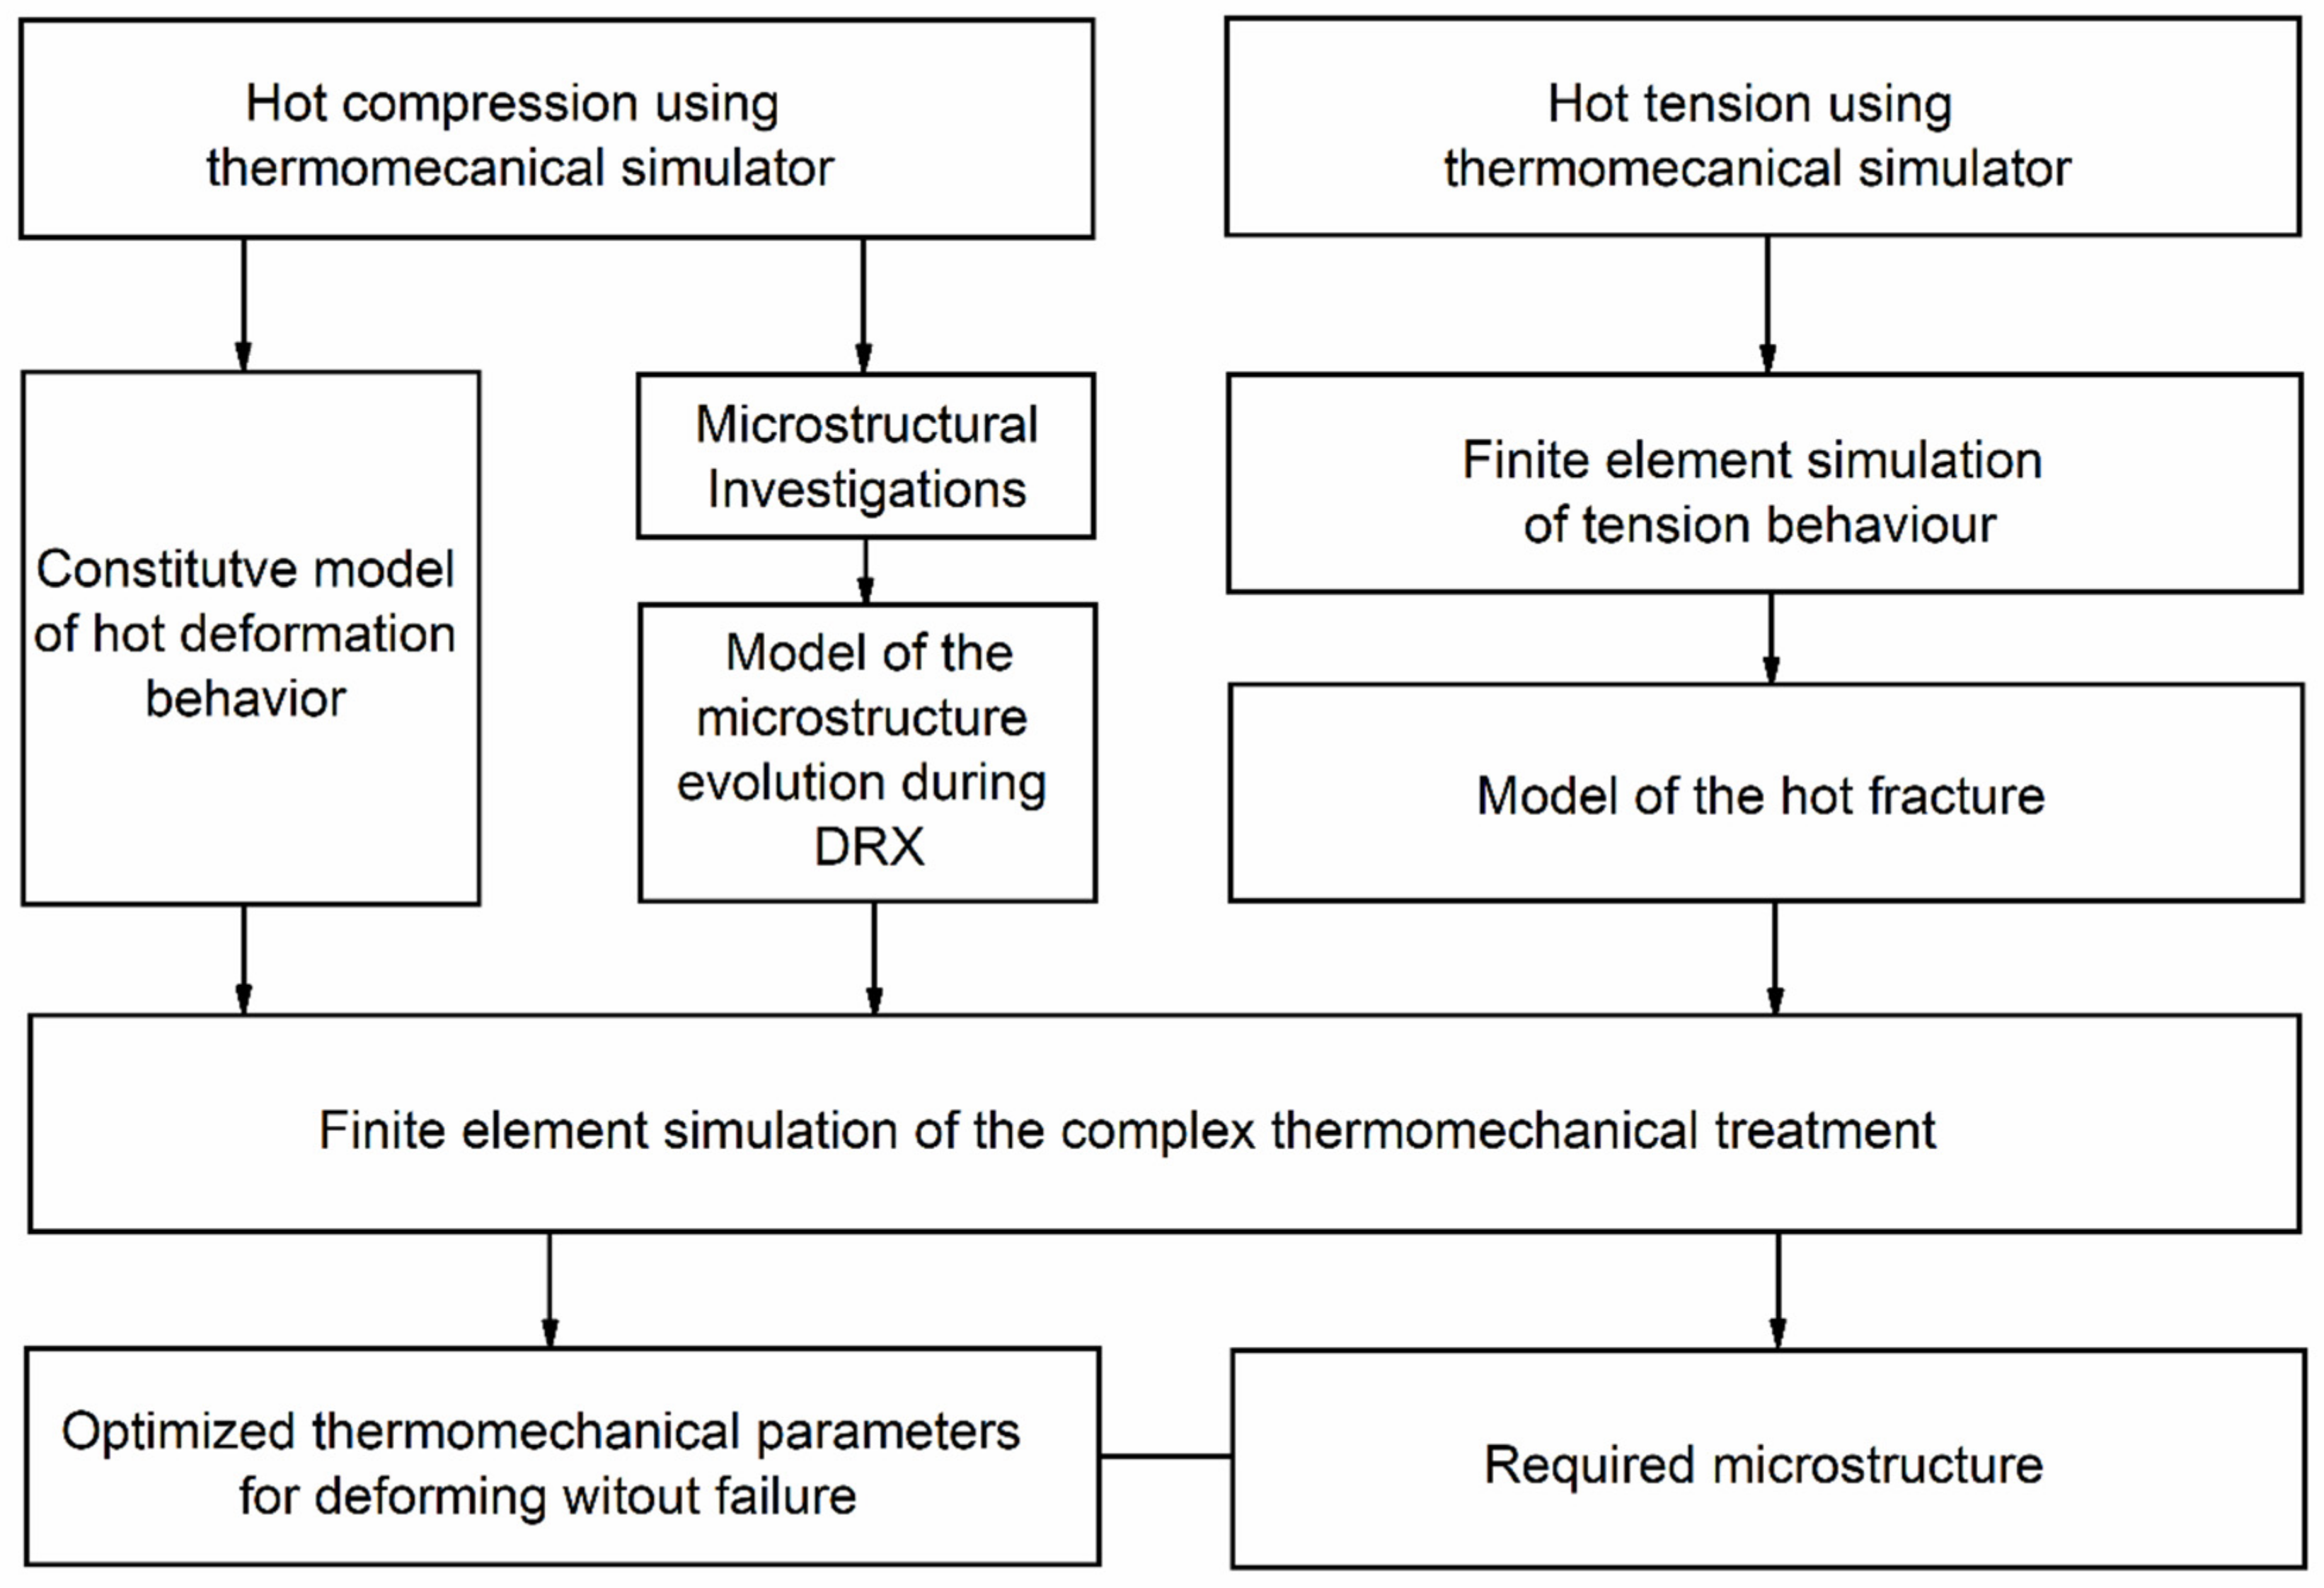
3.6. Algorithm for the United Approach Realization

The constructed models may be united to the one algorithm and realized through FE calculation of the complex deformation processes. The scheme of the algorithm is shown in Figure 11. Such an algorithm gives information about the conditions of the material’s possible failure. It also forecasts the grain size, which is the most important microstructural characteristic of the material after hot deformation. The iterative realization of the FE simulation step of the algorithm may give recommendations about optimal deformation parameters that do not lead to the products’ failure and provide the required microstructure.
The united approach to the modelling of the hot deformation behavior may be useful for the development of the optimal technologies not only for the stainless steels but for a wide range of the new metallic materials, such as heat-resistant steels, multiprincipal element alloys (so-called high-entropy alloys), titanium alloys and other hard deformable materials.

4. Conclusions

  • The united approach for modelling the hot deformation behavior, fracture, and microstructure evolution was developed and approved for the AISI 316Ti steel.
  • The constructed strain compensated constitutive model of hot deformation behavior for the AISI 316Ti steel in the temperature range of 1173–1473 K and at the strain rate of 0.1, 1, and 10 s−1 showed a high accuracy with an average absolute relative error of 4.38%.
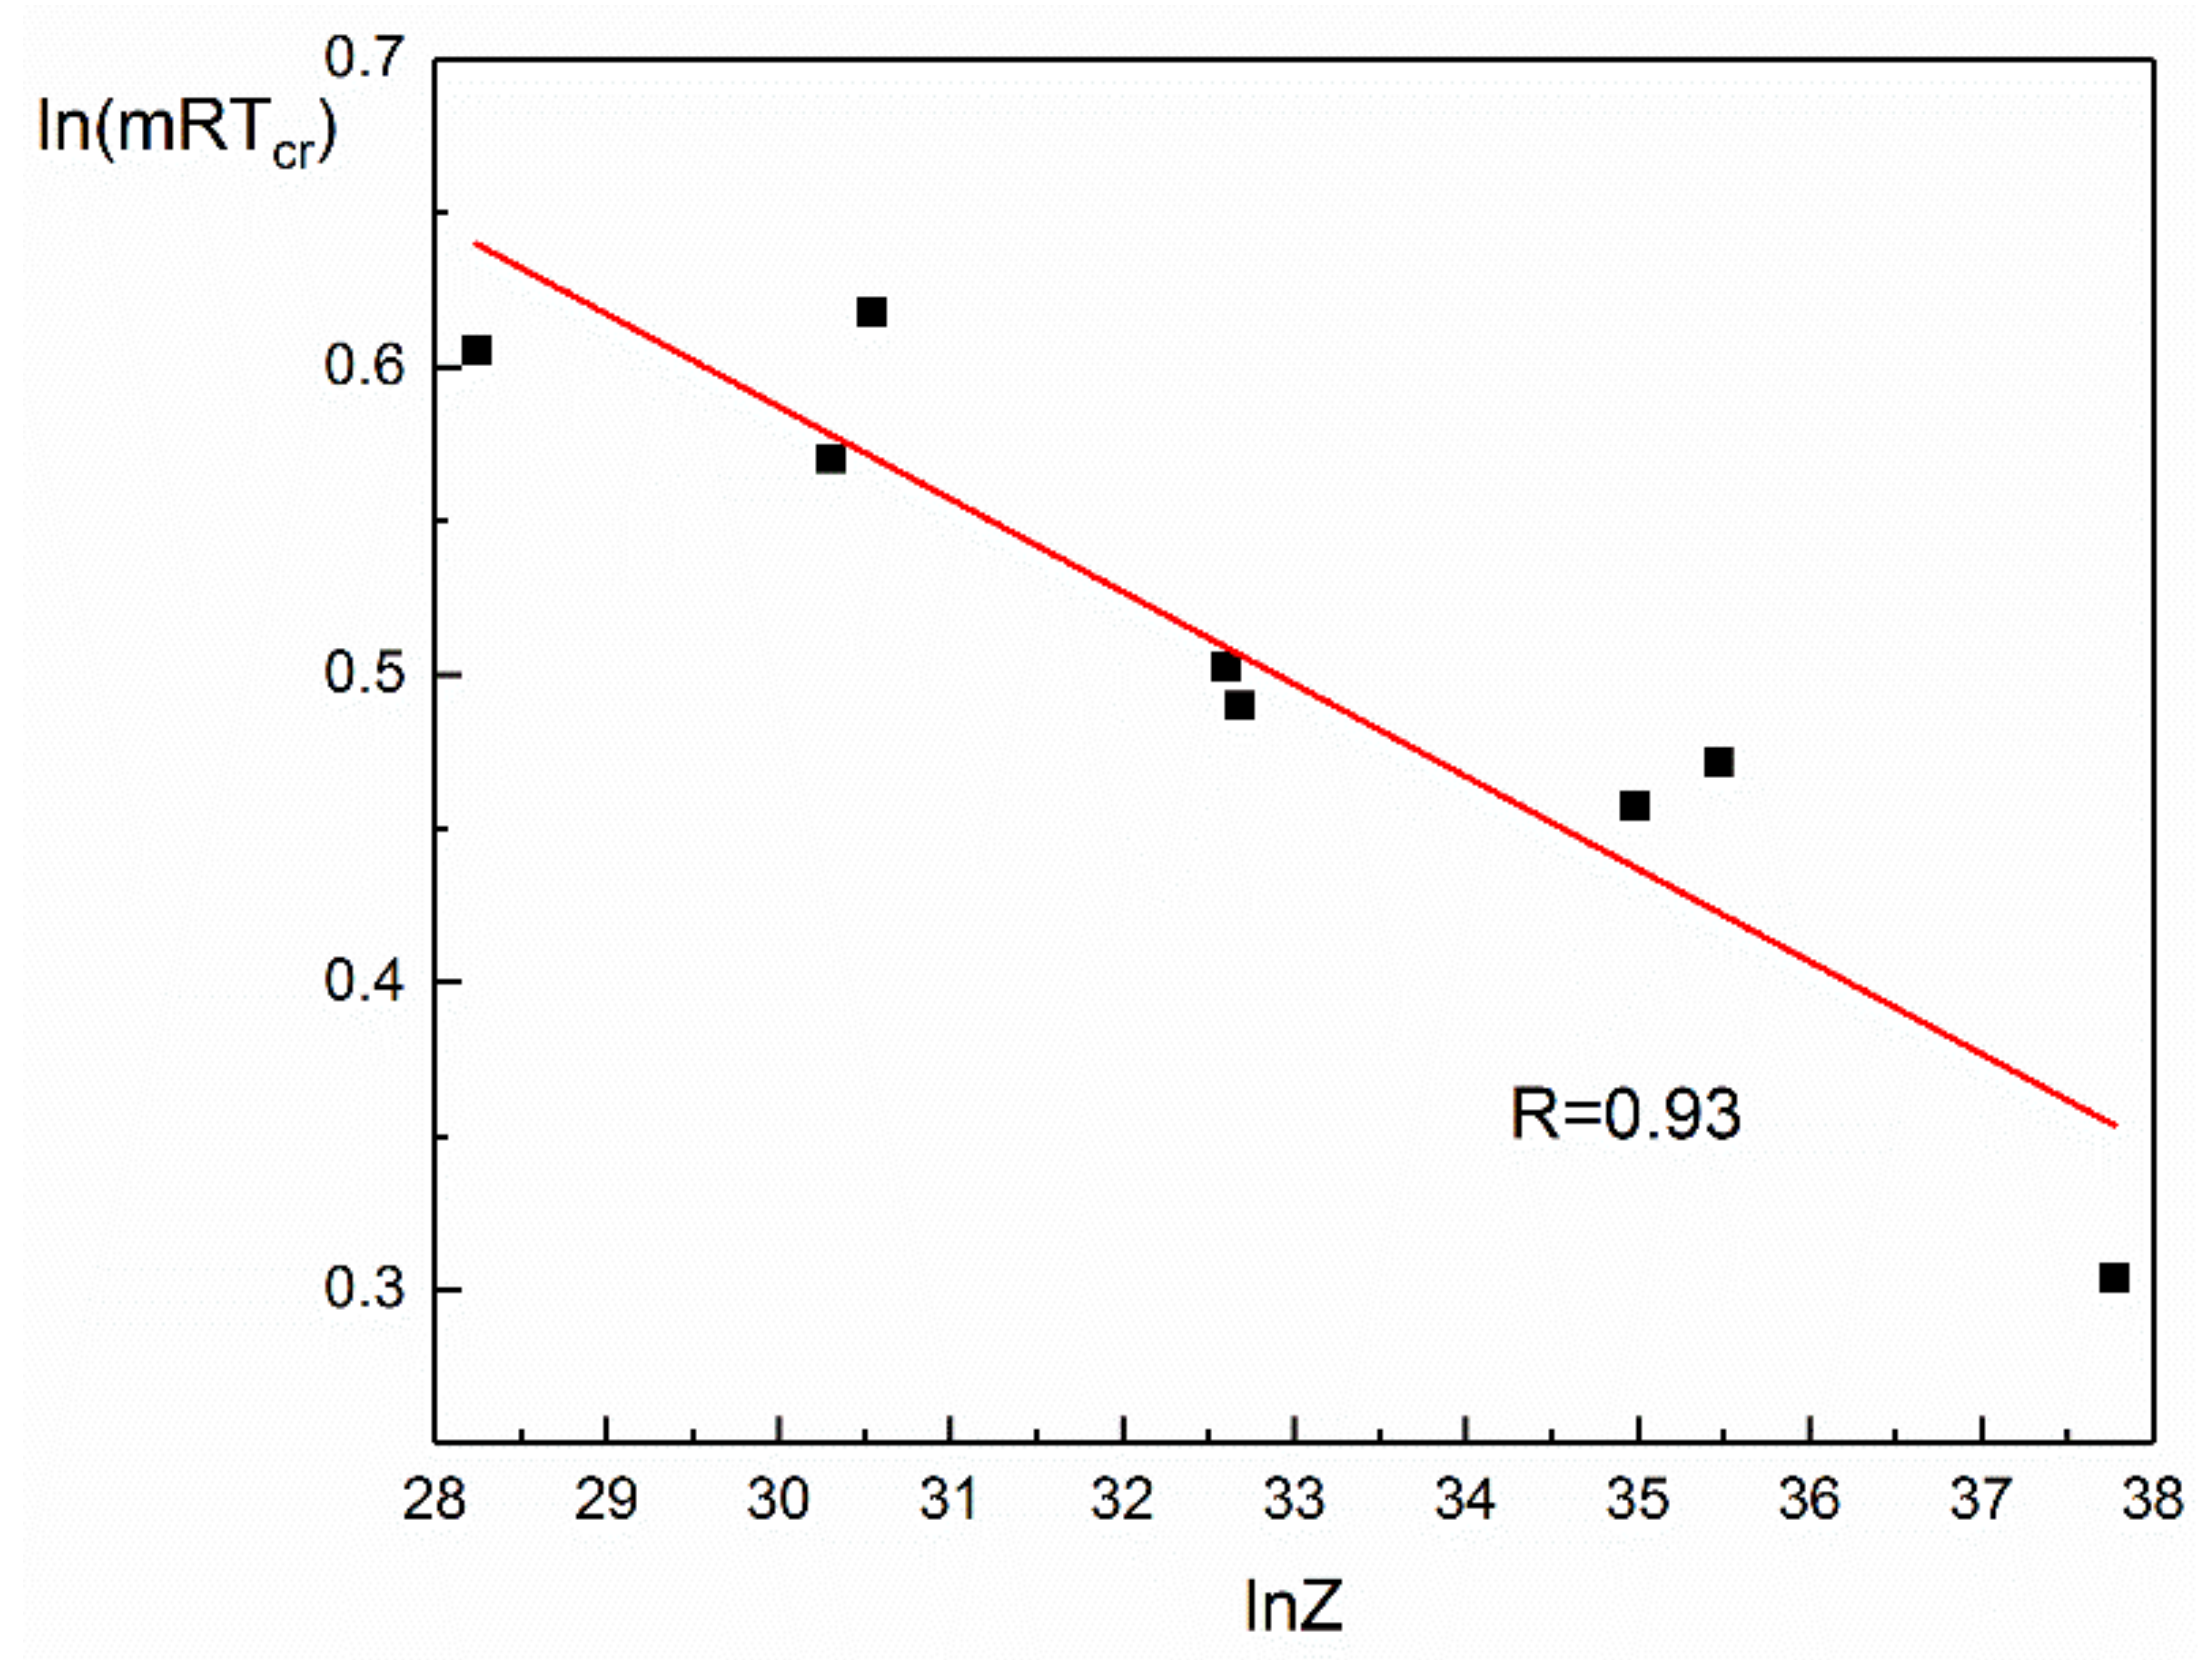
  • The modified Rice and Tracy fracture model was realized to predict the investigated steel’s fracture behavior. It was shown that the critical value of the fracture criteria is dependent on the Zener–Hollomon parameter by a power law.
  • The model of the AISI 316Ti steel microstructure evolution during dynamic recrystallization was constructed. The comparison of the effective activation energies’ values shows that the limiting factor of the dynamic recrystallization proceeding is the growth of the new grains in the deformed matrix.

Author Contributions

Conceptualization, A.Y.C.; methodology, A.Y.C.; investigation, S.V.M., O.I.M., A.A.K.; writing—original draft preparation, T.A.C., A.Y.C.; writing—review and editing, A.Y.C. All authors have read and agreed to the published version of the manuscript.

Funding

This research was funded by the Russian Science Foundation (project №18-79-10153).

Institutional Review Board Statement

Not applicable.

Informed Consent Statement

Not applicable.

Data Availability Statement

Data is contained within the article.

Conflicts of Interest

The authors declare no conflict of interest.

References

  1. Kamaya, M. Failure assessment curve for austenitic stainless steel pipes of nuclear power plants. Eng. Fract. Mech. 2020, 238, 107283. [Google Scholar] [CrossRef]
  2. Tan, J.; Zhang, Z.; Zheng, H.; Wang, X.; Gao, J.; Wu, X.; Han, E.-H.; Yang, S.; Huang, P. Corrosion fatigue model of austenitic stainless steels used in pressurized water reactor nuclear power plants. J. Nucl. Mater. 2020, 541, 152407. [Google Scholar] [CrossRef]
  3. Ghazani, M.S.; Eghbali, B. Characterization of the hot deformation microstructure of AISI 321 austenitic stainless steel. Mater. Sci. Eng. A 2018, 730, 380–390. [Google Scholar] [CrossRef]
  4. Rout, M.; Biswas, S.; Ranjan, R.; Pal, S.K.; Singh, S.B. Deformation Behavior and Evolution of Microstructure and Texture During Hot Compression of AISI 304LN Stainless Steel. Met. Mater. Trans. A 2017, 49, 864–880. [Google Scholar] [CrossRef]
  5. Hermant, A.; Suzon, E.; Petit, P.; Bellus, J.; Georges, E.; Cortial, F.; Sennour, M.; Gourgues-Lorenzon, A.-F. Hot Deformation and Recrystallization Mechanisms in a Coarse-Grained, Niobium Stabilized Austenitic Stainless Steel (316Nb). Met. Mater. Trans. A 2019, 50, 1625–1642. [Google Scholar] [CrossRef]
  6. Xiao, Z.; Huang, Y.; Liu, H.; Wang, S. Hot Tensile and Fracture Behavior of 35CrMo Steel at Elevated Temperature and Strain Rate. Metals 2016, 6, 210. [Google Scholar] [CrossRef] [Green Version]
  7. Lee, B.J.; Song, J.S.; Hong, S.I. High-Temperature Deformability of a Fe-Cr-Mn-Ni Austenite Stainless Steel with High Nitrogen and High Carbon Contents. Metals 2018, 8, 608. [Google Scholar] [CrossRef] [Green Version]
  8. Han, Y.; Zou, D.; Chen, Z.; Fan, G.; Zhang, W. Investigation on hot deformation behavior of 00Cr23Ni4N duplex stainless steel under medium–high strain rates. Mater. Charact. 2011, 62, 198–203. [Google Scholar] [CrossRef]
  9. Fu, X.-Y.; Bai, P.-C.; Yang, J.-C. Hot Deformation Characteristics of 18Cr-5Ni-4Cu-N Stainless Steel Using Constitutive Equation and Processing Map. Metals 2020, 10, 82. [Google Scholar] [CrossRef] [Green Version]
  10. Mirzadeh, H.; Parsa, M.; Ohadi, D. Hot deformation behavior of austenitic stainless steel for a wide range of initial grain size. Mater. Sci. Eng. A 2013, 569, 54–60. [Google Scholar] [CrossRef]
  11. Xi, T.; Yang, C.; Shahzad, M.B.; Yang, K. Study of the processing map and hot deformation behavior of a Cu-bearing 317LN austenitic stainless steel. Mater. Des. 2015, 87, 303–312. [Google Scholar] [CrossRef]
  12. Churyumov, A.Y.; Pozdnyakov, A.V.; Churyumova, T.A.; Cheverikin, V.V. Hot plastic deformation of heat-resistant austenitic aisi 310s steel. Part 1. simulation of flow stress and dynamic recrystallization. Chernye Met. 2020, 2020, 48–55. [Google Scholar]
  13. Tvergaard, V.; Needleman, A. Analysis of the cup-cone fracture in a round tensile bar. Acta Met. 1984, 32, 157–169. [Google Scholar] [CrossRef]
  14. Wang, L.-Y.; Li, L. Parameter Identification of GTN Model Using Response Surface Methodology for High-Strength Steel BR1500HS. J. Mater. Eng. Perform. 2017, 26, 3831–3838. [Google Scholar] [CrossRef]
  15. Yan, S.; Zhao, X. A fracture criterion for fracture simulation of ductile metals based on micro-mechanisms. Theor. Appl. Fract. Mech. 2018, 95, 127–142. [Google Scholar] [CrossRef]
  16. Johnson, G.R.; Cook, W.H. Fracture characteristics of three metals subjected to various strains, strain rates, temperatures and pressures. Eng. Fract. Mech. 1985, 21, 31–48. [Google Scholar] [CrossRef]
  17. Yang, F.P.; Luo, J.H.; Zhang, H.; Zhang, G.L.; Zhang, Y. Evaluation of ductile fracture criterions. Suxing Gongcheng Xuebao J. Plast. Eng. 2011, 18, 103–106. [Google Scholar]
  18. Kubík, P.; Šebek, F.; Hůlka, J.; Petruška, J. Calibration of ductile fracture criteria at negative stress triaxiality. Int. J. Mech. Sci. 2016, 108-109, 90–103. [Google Scholar] [CrossRef]
  19. Kõrgesaar, M. The effect of low stress triaxialities and deformation paths on ductile fracture simulations of large shell structures. Mar. Struct. 2019, 63, 45–64. [Google Scholar] [CrossRef]
  20. Bao, Y.; Wierzbicki, T. On fracture locus in the equivalent strain and stress triaxiality space. Int. J. Mech. Sci. 2004, 46, 81–98. [Google Scholar] [CrossRef]
  21. Hu, Q.; Li, X.; Han, X.; Chen, J. A new shear and tension based ductile fracture criterion: Modeling and validation. Eur. J. Mech. A Solids 2017, 66, 370–386. [Google Scholar] [CrossRef]
  22. Cockroft, M.G.; Latham, D.J. Ductile and workability of metals. J. Inst. Met. 1968, 96, 33–39. [Google Scholar]
  23. Rice, J.; Tracey, D. On the ductile enlargement of voids in triaxial stress fields∗. J. Mech. Phys. Solids 1969, 17, 201–217. [Google Scholar] [CrossRef] [Green Version]
  24. Renault, C.; Churyumov, A.Y.; Pozdniakov, A.V.; Churyumova, T.A. Microstructure and hot deformation behavior of FeMnAlCMo steel. J. Mater. Res. Technol. 2020, 9, 4440–4449. [Google Scholar] [CrossRef]
  25. Zhu, Y.; Zeng, W.; Zhang, F.; Zhao, Y.; Zhang, X.; Wang, K. A new methodology for prediction of fracture initiation in hot compression of Ti40 titanium alloy. Mater. Sci. Eng. A 2012, 553, 112–118. [Google Scholar] [CrossRef]
  26. Churyumov, A.Y. Deformation and Fracture of 13CrMoNbV Ferritic-Martensitic Steel at Elevated Temperature. Phys. Met. Met. 2019, 120, 1228–1232. [Google Scholar] [CrossRef]
  27. Churyumov, A.Y.; Pozdnyakov, A.V.; Churyumova, T.A.; Cheverikin, V.V. Hot plastic deformation of heat-resistant austenitic aisi 310s steel. Part 2. tensile torsional fracture simulation. Chernye. Met. 2020, 2020, 32–38. [Google Scholar]
  28. Shaikh, A.; Churyumov, A.; Pozdniakov, A.; Churyumova, T. Simulation of the Hot Deformation and Fracture Behavior of Reduced Activation Ferritic/Martensitic 13CrMoNbV Steel. Appl. Sci. 2020, 10, 530. [Google Scholar] [CrossRef] [Green Version]
  29. Oyane, M.; Sato, T.; Okimoto, K.; Shima, S. Criteria for ductile fracture and their applications. J. Mech. Work. Technol. 1980, 4, 65–81. [Google Scholar] [CrossRef]
  30. Norris, D.M.; Reaugh, J.E.; Moran, B.; Quiñones, D.F. A Plastic-Strain, Mean-Stress Criterion for Ductile Fracture. J. Eng. Mater. Technol. 1978, 100, 279–286. [Google Scholar] [CrossRef]
  31. Chen, L.; Zhang, Y.; Li, F.; Liu, X.; Guo, B.; Jin, M. Modeling of dynamic recrystallization behavior of 21Cr-11Ni-N-RE lean austenitic heat-resistant steel during hot deformation. Mater. Sci. Eng. A 2016, 663, 141–150. [Google Scholar] [CrossRef]
  32. Churyumov, A.Y.; Pozdniakov, A.V. Simulation of Microstructure Evolution in Metal Materials under Hot Plastic Deformation and Heat Treatment. Phys. Met. Met. 2020, 121, 1064–1086. [Google Scholar] [CrossRef]
  33. Johnson, W.A. Reaction Kinetics in Processes of Nucleation and Growth. Trans. Am. Inst. Minning Metall. Eng. 1939, 135, 416–458. [Google Scholar]
  34. Avrami, M. Kinetics of Phase Change. II Transformation-Time Relations for Random Distribution of Nuclei. J. Chem. Phys. 1940, 8, 212–224. [Google Scholar] [CrossRef]
  35. Deming, W.E.; Birge, R.T. On the Statistical Theory of Errors. Rev. Mod. Phys. 1934, 6, 119–161. [Google Scholar] [CrossRef]
  36. Shen, G.; Semiatin, S.L.; Shivpuri, R. Modeling microstructural development during the forging of Waspaloy. Met. Mater. Trans. A 1995, 26, 1795–1803. [Google Scholar] [CrossRef]
  37. Khomutov, M.G.; Churyumov, A.Y.; Pozdnyakov, A.V.; Voitenko, A.G.; Chereshneva, A.A. Simulation of the Kinetics of Dynamic Recrystallization of Alloy KhN55MBYu-VD During Hot Deformation. Met. Sci. Heat Treat. 2019, 60, 606–610. [Google Scholar] [CrossRef]
  38. Kim, S.-I.; Lee, Y.; Jang, B.-L. Modeling of recrystallization and austenite grain size for AISI 316 stainless steel and its application to hot bar rolling. Mater. Sci. Eng. A 2003, 357, 235–239. [Google Scholar] [CrossRef]
  39. Wang, S.; Zhang, M.; Wu, H.; Yang, B. Study on the dynamic recrystallization model and mechanism of nuclear grade 316LN austenitic stainless steel. Mater. Charact. 2016, 118, 92–101. [Google Scholar] [CrossRef]
  40. Dwivedi, S.; Rana, R.; Rana, A.; Rajpurohit, S.; Purohit, R. Investigation of Damage in Small Deformation in Hot Rolling Process Using FEM. Mater. Today Proc. 2017, 4, 2360–2372. [Google Scholar] [CrossRef]
  41. Yao, D.; Cai, L.; Bao, C. A new fracture criterion for ductile materials based on a finite element aided testing method. Mater. Sci. Eng. A 2016, 673, 633–647. [Google Scholar] [CrossRef]
  42. Lou, Y.; Yoon, J.W. Alternative approach to model ductile fracture by incorporating anisotropic yield function. Int. J. Solids Struct. 2019, 164, 12–24. [Google Scholar] [CrossRef]
  43. Mirnia, M.J.; Vahdani, M. Calibration of ductile fracture criterion from shear to equibiaxial tension using hydraulic bulge test. J. Mater. Process. Technol. 2020, 280, 116589. [Google Scholar] [CrossRef]
  44. Lemesle, J.; Hubert, C.; Bigerelle, M. Numerical Study of the Toughness of Complex Metal Matrix Composite Topologies. Appl. Sci. 2020, 10, 6250. [Google Scholar] [CrossRef]
  45. Kaczmarczyk, J.; Grajcar, A. Numerical Simulation and Experimental Investigation of Cold-Rolled Steel Cutting. Materials 2018, 11, 1263. [Google Scholar] [CrossRef] [Green Version]
  46. Hubert, C.; Dubar, L.; Dubar, M.; Dubois, A. Finite Element simulation of the edge-trimming/cold rolling sequence: Analysis of edge cracking. J. Mater. Process. Technol. 2012, 212, 1049–1060. [Google Scholar] [CrossRef]
  47. Nioi, M.; Pinna, C.; Celotto, S.; Swart, E.; Farrugia, D.; Husain, Z.; Ghadbeigi, H. Finite element modelling of surface defect evolution during hot rolling of Silicon steel. J. Mater. Process. Technol. 2019, 268, 181–191. [Google Scholar] [CrossRef]
  48. Marashi, J.; Yakushina, E.; Xirouchakis, P.; Zante, R.C.; Foster, J. An evaluation of H13 tool steel deformation in hot forging conditions. J. Mater. Process. Technol. 2017, 246, 276–284. [Google Scholar] [CrossRef] [Green Version]
  49. Wan, Z.; Hu, L.; Sun, Y.; Wang, T.; Li, Z. Hot deformation behavior and processing workability of a Ni-based alloy. J. Alloys Compd. 2018, 769, 367–375. [Google Scholar] [CrossRef]
  50. Churyumov, A.Y.; Khomutov, M.G.; Tsar’Kov, A.A.; Pozdnyakov, A.V.; Solonin, A.N.; Efimov, V.M.; Mukhanov, E.L. Study of the structure and mechanical properties of corrosion-resistant steel with a high concentration of boron at elevated temperatures. Phys. Met. Met. 2014, 115, 809–813. [Google Scholar] [CrossRef]
  51. Poliak, E.; Jonas, J. A one-parameter approach to determining the critical conditions for the initiation of dynamic recrystallization. Acta Mater. 1996, 44, 127–136. [Google Scholar] [CrossRef]
  52. Lo, K.; Shek, C.; Lai, J. Recent developments in stainless steels. Mater. Sci. Eng. R Rep. 2009, 65, 39–104. [Google Scholar] [CrossRef]
  53. Hedayati, A.; Najafizadeh, A.; Kermanpur, A.; Forouzan, F. The effect of cold rolling regime on microstructure and mechanical properties of AISI 304L stainless steel. J. Mater. Process. Technol. 2010, 210, 1017–1022. [Google Scholar] [CrossRef]
  54. Talonen, J.; Nenonen, P.; Pape, G.; Hänninen, H. Effect of strain rate on the strain-induced γ, → α′-martensite transformation and mechanical properties of austenitic stainless steels. Metall. Mater. Trans. A Phys. Metall. Mater. Sci. 2005, 36, 421–432. [Google Scholar] [CrossRef]
  55. Xiao, B.; Xu, L.; Zhao, L.; Jing, H.; Han, Y.; Tang, Z. Strain dependent constitutive model and microstructure evolution of a novel 9Cr martensitic steel during high-temperature deformation. Mater. Sci. Eng. A 2019, 756, 336–345. [Google Scholar] [CrossRef]
  56. Churyumov, A.; Khomutov, M.; Solonin, A.; Pozdniakov, A.; Churyumova, T.; Minyaylo, B. Hot deformation behaviour and fracture of 10CrMoWNb ferritic–martensitic steel. Mater. Des. 2015, 74, 44–54. [Google Scholar] [CrossRef]
  57. Mandal, S.; Sivaprasad, P.; Venugopal, S.; Murthy, K. Artificial neural network modeling to evaluate and predict the deformation behavior of stainless steel type AISI 304L during hot torsion. Appl. Soft Comput. 2009, 9, 237–244. [Google Scholar] [CrossRef]
  58. Chen, L.; Sun, W.; Lin, J.; Zhao, G.; Wang, G. Modelling of constitutive relationship, dynamic recrystallization and grain size of 40Cr steel during hot deformation process. Results Phys. 2019, 12, 784–792. [Google Scholar] [CrossRef]
Figure 1. Initial microstructure of the investigated steel: (a) light microscopy (LM) image and (b) X-ray diffraction (XRD) pattern.
Applsci 11 03204 g001
Figure 2. Phase composition of the investigated steel accordingly thermodynamic calculations (a) and experimental DTA-curve (b).
Applsci 11 03204 g002
Figure 3. True stress vs. true strain curves for hot deformation of the AISI 316Ti steel at a strain rate of (a) 0.1 s−1, (b) 1 s−1, and (c) 10 s−1. The comparison between the predicted and the experimental values of the flow stress (d).
Applsci 11 03204 g003aApplsci 11 03204 g003b
Figure 4. Experimental tensile curves of the AISI 316Ti steel at (a) 1 s−1 and (b) 10 s−1 (the values ΨT is the relative cross-section reduction at the correspondent temperature).
Applsci 11 03204 g004
Figure 5. Calculated dependence of the stress triaxiality σ * on the strain of the AISI 316Ti steel at (a) 1173 K, (b) 1273 K, (c) 1373 K, and (d) 1473 K and the distribution of the strain in the samples at the value which correspondent the experimental fracture strain (circles).
Applsci 11 03204 g005aApplsci 11 03204 g005b
Figure 6. The dependence of the critical values of the modified Rice and Tracy criteria on the Zener–Hollomon parameter.
Applsci 11 03204 g006
Figure 7. Kinetics of the dynamic recrystallization of the AISI 316Ti steel during compression at 0.1 s−1 (a) and plots ln(|εp|) и ln(|ε0.5|) vs. lnZ (b).
Applsci 11 03204 g007
Figure 8. The microstructure of the AISI 316Ti steel after hot deformation.
Applsci 11 03204 g008
Figure 9. Dependence of ln(dDRX) on lnZ (a) and (b) a comparison of the experimental and calculated grain size after hot deformation of the AISI 316Ti steel.
Applsci 11 03204 g009
Figure 10. A comparison of the experimental and calculated hot deformation curve during simultaneous torsion (3.14 rad/s) and tension (5 mm/s) (a). Insets are the sample’s appearance after testing, fracture surface, and grain size distribution in the cross-section after failure. The EBSD mapping of the steel microstructure after fracturing in the center (b) and near the surface (c).
Applsci 11 03204 g010
Figure 11. Algorithm of the realization of the united approach for the optimization of the hot deformation technology.
Applsci 11 03204 g011
Table 1. Models of dynamic recrystallization of stainless steels.
Steel X D R X d D R X Reference
21Cr-11Ni-N-RE k d = 1.503, β = 0.952
ε c = 0.062 ε ˙ 0.0255 e x p 11,501 R T
10,971 ε ˙ 0.136 exp 70,626 R T [31]
Ni55CrMoNbAl k d = 1.76, β = 0.693
ε c = 0.014 ε ˙ 0.06 e x p 28,930 R T
ε 0.5 = 0.053 ε ˙ 0.05 e x p 27,200 R T
8826 ε ˙ 0.01 exp 69,800 R T [37]
AISI 316 k d = 0.029 ε ˙ 0.04 exp 16,550 R T
β = 0.693
ε c = 1.97 ε ˙ 0.06 exp 23,590 R T
ε 0.5 = 71 ε ˙ 0.124 exp 51,300 R T
0.3 ε ˙ 0.123 exp 50,900 R T [38]
AISI 310S k d = 1.78 ,   β = 0.693
ε c = 0.0175 ε ˙ 0.063 exp 33,390 R T
ε 0.5 = 0.05 ε ˙ 0.056 exp 28,900 R T
3062 ε ˙ 0.067 exp 60,970 R T [12]
AISI 316LN k d = 3.417 ,   β = 0.887
ε c = 0.09 ε ˙ 0.12 exp 15,209 R T
ε 0.5 = 0.216 d 0 0.24 ε ˙ 0.1 exp 17,214 R T
20,975.5 ε ˙ 0.193 exp 81,292 R T [39]
Table 2. Chemical composition of the AISI 316Ti steel (wt. %).
CSiMnCrNiMoTiCoFe
0.080.51.916.810.52.00.240.16Balance
Publisher’s Note: MDPI stays neutral with regard to jurisdictional claims in published maps and institutional affiliations.

