
Analyzing the Performance of WBAN Links during Physical Activity Using Real Multi-Band Sensor Nodes


1
B105 Electronic Systems Lab, ETSI Telecomunicación, Universidad Politécnica de Madrid, Avenida Complutense 30, 28040 Madrid, Spain
2
Berkeley Wireless Research Center, Department of Electrical Engineering and Computer Sciences, University of California Berkeley, Berkeley, CA 94704, USA
*
Author to whom correspondence should be addressed.
Appl. Sci. 2021, 11(7), 2920; https://doi.org/10.3390/app11072920
Submission received: 27 January 2021
/
Revised: 1 March 2021
/
Accepted: 22 March 2021
/
Published: 25 March 2021
(This article belongs to the Special Issue Wireless Sensor Networks: Technologies, Applications, Prospects)
Abstract
:Wireless body area networks (WBANs) present unique challenges due to their specific characteristics of mobility and over-the-body radio propagation. A huge amount of factors—both internal and external to the network—affect WBAN channel conditions, so a reliable and comprehensive theoretical model of these communications is unfeasible and impractical in real scenarios. Thus, an empirical performance analysis of several WBAN channels is presented in this work, based on the receiver signal strength indicator (RSSI) and packet reception rate (PRR) metrics. Four different static and dynamic activities have been characterized: standing, sitting, cycling and walking. This analysis confirms the theoretical notions of path attenuation due to body parts obstructing the signal path, while serving as a benchmark for the design of future algorithms. The experiments have been carried out with real hardware nodes with wireless interfaces in three ISM bands: 433 MHz, 868 MHz and 2.4 GHz, evaluating the effect of the transmit power and node placement for different subjects. In all scenarios, the PRR metric reaches its maximum of 100% for both sub-GHz bands. Finally, our study concludes that the RSSI metric is sufficient to exploit the periodicity of dynamic activities, without the need for any extra hardware resources.
1. Introduction
The continuous development of wireless communications, in addition to the miniaturization and reductions in cost of electronic devices have enabled the advance of Wireless Body Area Networks (WBANs). These networks are a subset of Wireless Sensor Networks (WSNs) and consist of low-power and lightweight sensor nodes placed along the human body to monitor its vital functions and other relevant data [1]. WBANs are primarily applied to healthcare and the biomedical field, but they have potential for use in several other areas, such as enhancing the human experience, sport training or even entertainment. In this latter broader sense, this paradigm has been called the Human Intranet [2].
One of the main challenges faced by WBANs is energy efficiency given that sensor nodes are generally autonomous and, thus, battery-powered. Several approaches have been studied to reduce energy consumption in WBANs, in all layers of the communication stack. Perhaps the most researched ones are those at the data link layer, mainly consisting of medium access control (MAC) protocols [3]. These strategies reduce the energy spending by decreasing the duty cycle of sensor nodes, thus, having their radio interfaces turned off for as long as possible, while also minimizing packet retransmissions.
At the physical layer, transmission power control (TPC) mechanisms have been widely introduced to the WBAN field, having been a classical research topic of WSNs for years [4]. Very frequently, a WBAN has a star topology with one sink node in the middle section of the body and several sensor nodes placed along the limbs or at important body organs [5]. With body movements and posture changes, wireless link conditions between the sensor nodes and the sink change rapidly, creating fading and shadowing effects caused by body parts interrupting the signal path [6]. TPC protocols adapt the transmit power of sending nodes according to the received signal strength indicator (RSSI) recorded at receivers in order to respond to these changes [7].
Along with reducing energy waste these schemes also have the desired consequence of increasing reliability in WBAN links. This is a particularly important challenge in WBANs given the highly dynamic and changing nature of its channels and links. In order to have reliable communications between the sensors and the sink, transmitters must use a high enough transmit power to ensure the RSSI at the desired receiver is above its sensitivity at all times. When this is not achieved, packets are lost and the application quality-of-service (QoS) is dramatically reduced [8]. This is particularly worrying considering the critical nature of some WBAN applications such as prosthesis control, heart monitoring or medication dose management [9].
Research studies generally use the packet reception rate (PRR) or packet delivery rate (PDR) to measure the reliability of WSNs and WBANs. In some cases, authors use the complement of these metrics, referring to the packet loss rate (PLR), packet error rate (PER), packet delivery failure rate (PDFR) or a number of alternative names [7,8,10].
As can be inferred, the PRR is closely related to the RSSI measured at receiving nodes. When the RSSI is lower than the receiver sensitivity, packets are lost or some of their bits get corrupted. Some authors even go as far as discarding packets that actually arrive at their destination but with a RSSI lower than a pre-defined threshold [5]. The correlation between the PRR and the RSSI has been widely demonstrated in the literature, both for WSNs and WBANs [4,11]. However, there are some scenarios where an increase in RSSI is not guaranteed to provide a higher PRR. This happens when interference between links is the main contributor to packet loss, as opposed to simple path loss [7].
Given the specific features of WBANs, i.e., node mobility and radio propagation around the human body, several research studies have attempted to characterize or model their effect on the different wireless links of the network [6,12]. Postural changes modify the distance between nodes and affect the path loss due to body obstructions, affecting the RSSI and PRR [13]. These body movements can rapidly turn a wireless link from being in line-of-sight (LOS) to non-line-of-sight (NLOS), giving WBAN channels a distinctive time-variant characteristic [14].
This time-variance is very noticeable during some physical activities, such as walking or running, given the periodic characteristic of these movements. Thus, several research studies have exploited the periodicity of WBAN channels during physical activity, particularly adapting their MAC scheduling strategies [5,14] or their TPC mechanisms [4,15] to the gait cycle of the user.
However, several of these papers are based only on simulated conditions [12]. Others only work with a single frequency band [7,15] or custom transceivers and antennas that can be impractical in real WBAN applications [16]. Finally, several strategies make use of extra resources, such as accelerometers, that are not always readily available in WBAN nodes or, if available, incur in additional power consumption and overhead [6].
A comprehensive theoretical model for WBAN communications would be a much-desired tool for researchers and algorithm designers in this field. However, an enormous number of factors—both internal and external to the network—affect WBAN communications and its channel conditions. Primarily, body movements and posture changes modify the signal paths, creating fading and shadowing effects due to body parts obstructing the line-of-sight between nodes. While free-space path loss has been sufficiently modeled and quantitated via the Friis equation for decades, the same cannot be said for the attenuation caused by the different layers and composition of body tissues. Different types of radio propagation occur in the inside layers of body parts, through their surface, and/or even in the immediately surrounding air: space waves, superficial waves, creeping waves, body coupled communication, etc. All of them are heavily influenced by the kind of antennas used, their positioning, and mainly by the body composition and structure of the WBAN subject. A theoretical model that takes all these aspects into account and quantifies them into a reliable and utilizable on-body path loss equation is impractical and possibly unrealistic.
Secondly, multipath transmission plays a huge role in WBAN communications, both in indoor and outdoor scenarios. The authors in [17] go as far as to say that the strongest signal path in WBAN communications is the one that comes from ground reflections, rather than the one corresponding to the straight line between nodes (either in LOS or NLOS). Modeling all these multipath effects is also unfeasible and impractical, given the mobility aspects and the huge variety of scenarios and locations in which WBAN communications take place.
Finally, foreign interferers—either external devices or other nodes in the network—also affect WBAN communications and degrade their reliability. For instance, WBAN communications on the 2.4 GHz band, e.g., Bluetooth devices, can be heavily affected by the presence of Wi-Fi access points and devices in the vicinity. It would also be impractical to consider and integrate all these external interferences into a possible theoretical model for WBAN. In the same way, many common human activities are not solitary, but are rather shared among various individuals or at least occur in the presence of other surrounding people, e.g., going for a walk, working out, etc. If modeling the WBAN characteristics of one single isolated person is at best impractical, doing so for multiple people in motion becomes practically impossible.
In summary, given the amount and variety of factors impacting WBAN channel conditions, a comprehensive and applicable theoretical model is unfeasible in this context, and an empirical approach should be taken to analyze their characteristics in real scenarios and activities. In this work we have performed an extensive characterization of WBAN links using real hardware nodes with commercial wireless transceivers in the following ISM bands: 433 MHz, 868 MHz and 2.4 GHz. Our experiments have systematically and comprehensively measured the RSSI and PRR metrics in several scenarios, both static and dynamic, with different node placements along the body. These metrics are obtained from regular data packets exchanged by the network nodes, without the need for any additional hardware or extra resources. The paper focuses on the impact of body movements and posture changes on the performance of particular channels formed between two nodes of the WBAN, specifically in terms of reliability.
The main contribution of this work is an extensive dataset of real measurements of wireless link conditions obtained by different test subjects, spanning more than 6 h of recorded time. This dataset is accessible in the Supplementary Materials section at the end of this article. The study allows us to establish a correspondence between these wireless link variations and the particular motions and postures that caused them. In particular, our experiments are able to detect the attenuation caused by body parts interrupting the signal path and increasing the NLOS portion of wireless links, empirically confirming the theoretical assumption derived from path loss equations. Additionally, this work provides researchers with an empirical performance benchmark of WBAN channels so that they can adapt their strategies and mechanisms to their characteristics. For instance, TPC protocols and MAC scheduling schemes can greatly benefit from a more detailed knowledge of the time-variance of WBAN channels in real scenarios and activities.
The rest of the article is structured as follows. Section 2 explains the experiment conditions in detail, including a description of the hardware used and the different test scenarios. Section 3 presents and discusses the results of these experiments. A broader more general discussion is presented in Section 4. Finally, the conclusions drawn from this work are included in Section 5.
2. Materials and Methods
2.1. Test Platform
All the tests performed within this work were carried out with YetiMote nodes, a custom hardware platform developed at B105 Electronic Systems Lab [18]. This node is based on a high-performance, low-power STM32L4 microcontroller that runs at 48 MHz and is equipped with 512 KB of flash memory and 128 KB of RAM memory. It has several input/output interfaces—UART, SPI, I2C, USB, microSD slot—in order to support the connection of all kinds of sensors.
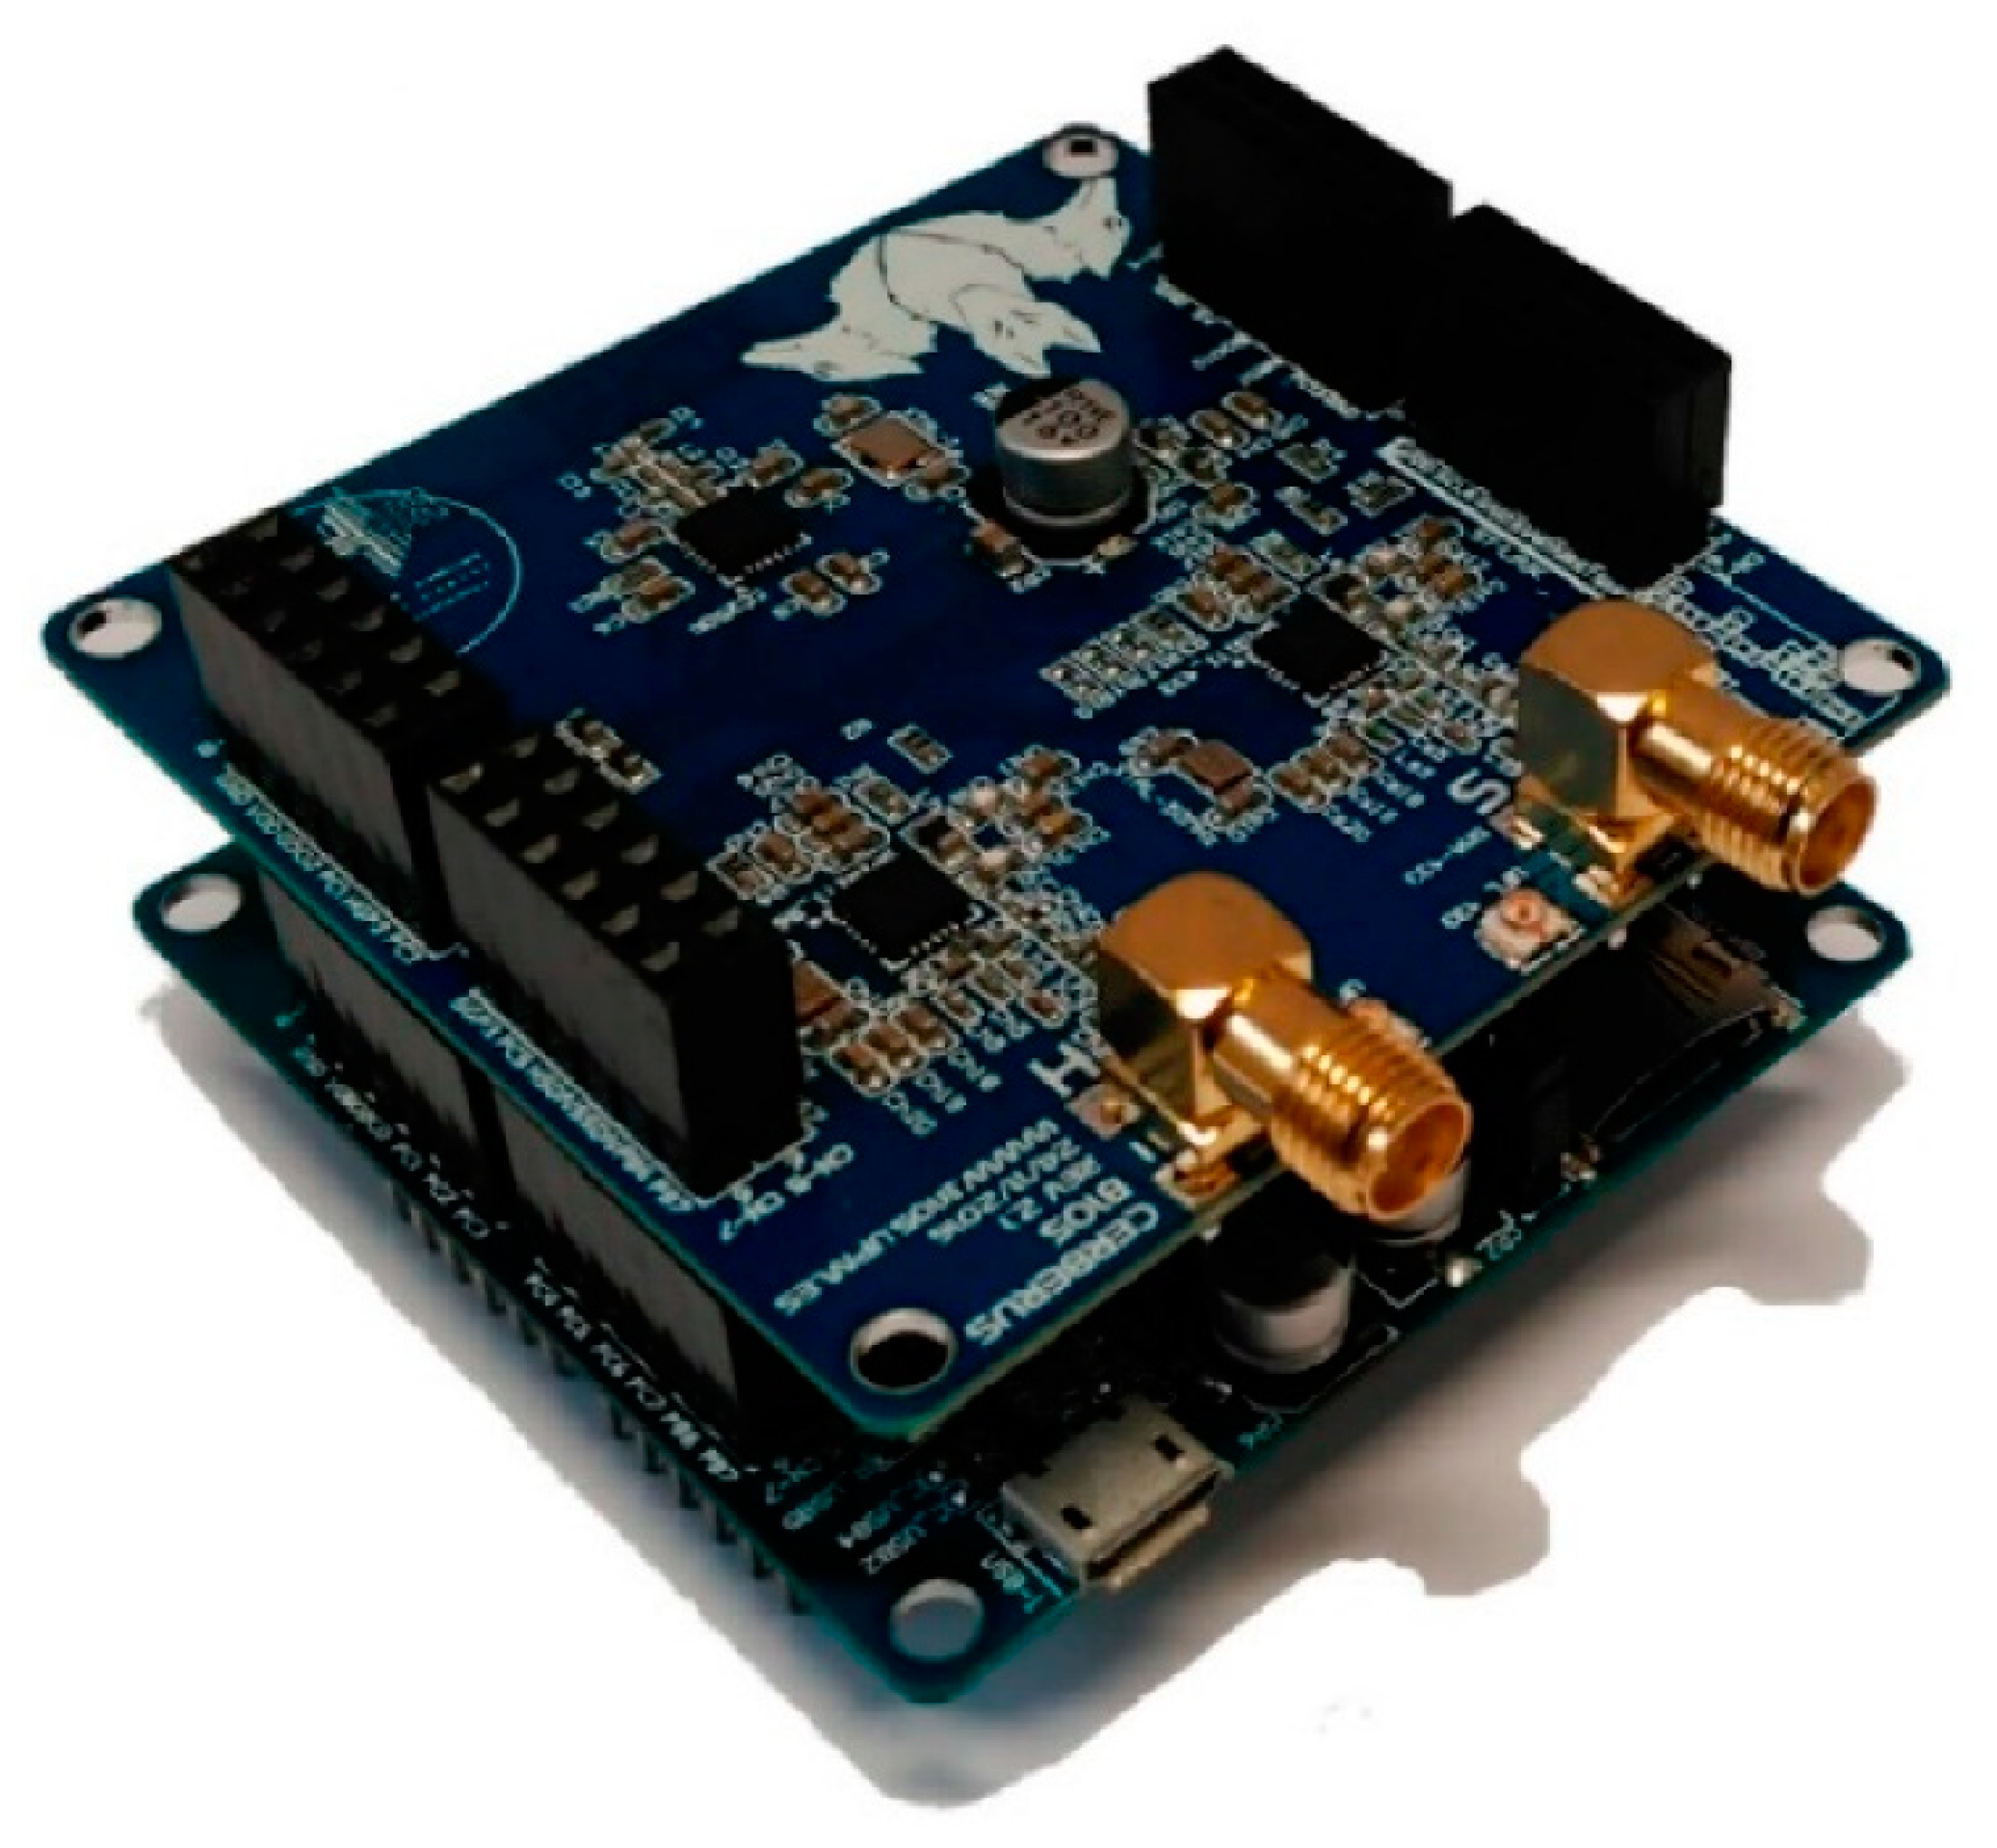
For the purposes of this work, the most important feature of YetiMotes is a wireless interface module with transceivers and antennas in three different frequency bands. This shield has two STMicroelectronics SPIRIT1 transceivers and their corresponding RF adaptation hardware for the frequency bands centered in 433 MHz and 868 MHz, respectively. These two sub-1 GHz interfaces end in two connectors for external antennas. On the other hand, the 2.4 GHz wireless interface consists of a CC2500 transceiver from Texas Instruments, its corresponding RF adaptation stage and a built-in printed circuit board (PCB) antenna. Figure 1 shows a YetiMote node with the wireless shield in the foreground.
YetiMotes include a custom operating system called YetiOS that is based on the well-known real-time system FreeRTOS. It is equipped with a layered network stack that is in charge of the sending and reception of packets and supports several network topologies. All layers of the stack are fully configurable, including all the wireless parameters from the physical layer that are accessible in the corresponding transceivers. Table 1 lists the values set for these physical wireless parameters in all the tests performed in this work.
All the experiments described during the remainder of the article have been carried out with two or more YetiMote nodes, where one of them acts as a receiver and the other(s) as sender(s). There is absolutely no difference in terms of hardware between a sender node and a receiver node. Out of all the above parameters, the only one that will be modified during tests is the output power of sending nodes.
2.2. Scenarios
Since the objective of this work is to provide a performance analysis of WBAN channels under real conditions, all the characterized scenarios represent usual everyday activities and postures. First, two static scenarios are analyzed to observe the effect of frequency, node placement and body posture on WBAN channels, for an unmoving subject. In these scenarios, the signal paths are comprised a particular configuration of body tissue and free space that remains unchanged for the duration of the experiments.
Next, two dynamic activities are studied to analyze the effect of body movements on the WBAN links condition, particularly in terms of nodes being in LOS or NLOS. The periodicity of these activities’ motions is also extracted and analyzed.
2.2.1. Static Scenarios
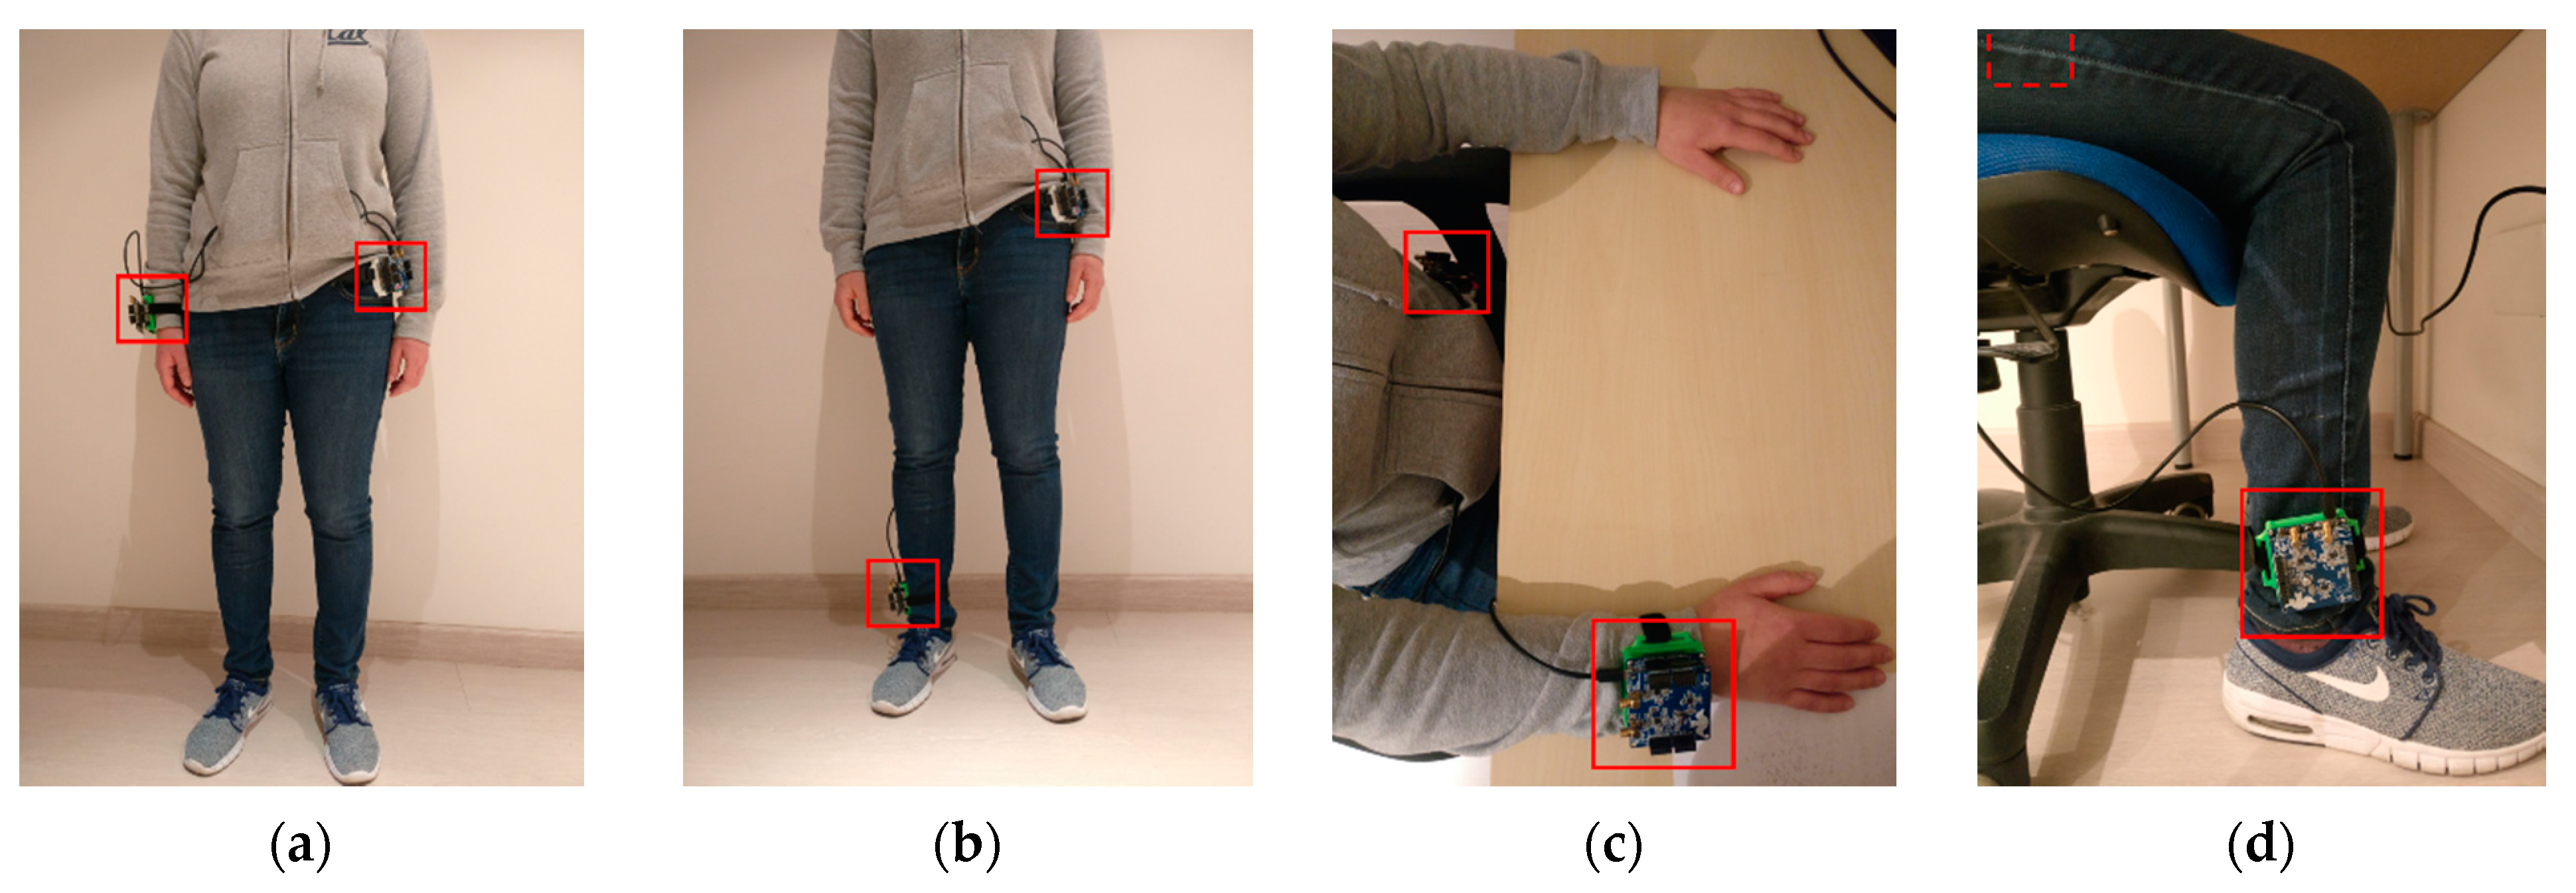
Two static scenarios have been tested where two regular body postures have been characterized: standing and sitting on a desk. In both of them, the subject has a receiver node on the left hip and sender nodes on the right wrist and right ankle. This is in line with other studies in the field, where sink/hub nodes have a central body position. In a real WBAN this is the most usual position for a smartphone, which is a usual hub in these kinds of networks [19]. The wrist is also the usual spot for a sensor node in WBANs, such as a smartband for motion sensing, SpO2 measuring or pulse rate monitoring. In turn, the ankle is a regular position for motion tracking in sports or physical activity monitoring. The nodes’ placement on the subject’s body can be seen in Figure 2.
In the first scenario, the subject stands still with both arms in a resting position at her sides, palms facing inward. The straight distance between the receiver node on the left hip (LH) and the sender node on the right wrist (RW), LH-RW, is 48 cm, with the subject’s arm and abdomen partially obstructing the signal path so they are not completely in line-of-sight. The straight distance from the left hip node to the one in the right ankle (RA), LH-RA is 95 cm, both being only partially in LOS.
The second scenario has the subject sitting on a desk with both arms placed on the table, elbows flexed and palms facing down. The hip node is partially under the table so both nodes are NLOS, with the table—made of particle board with a thickness of 3.5 cm—fully obstructing the signal path. The straight distance LH-RW in this scenario is 62 cm. In case of the ankle node, the distance LH-RA is 75 cm, with parts of the subject’s legs and the chair obstructing the signal path. This scenario could represent an office worker or a student, and its characterization can potentially be used to improve body posture or ergonomics.
For each sender node position in each scenario the experiment consists of the sender node iterating through the three frequency bands, and for each frequency iterating through all the possible transmit power levels in steps of two dBm. In the case of the 433 and 868 MHz bands, the output power ranges from −30 dBm to 11 dBm, so there are 22 possible levels:
TxPower(@ 433/868 MHz) ∈
(−30, −28, −26, −24, −22, −20, −18, −16, −14, −12, −10, −8, −6, −4, −2, 0, 2, 4, 6, 8, 10, 11) dBm.
(−30, −28, −26, −24, −22, −20, −18, −16, −14, −12, −10, −8, −6, −4, −2, 0, 2, 4, 6, 8, 10, 11) dBm.
In the case of the 2.4 GHz band, the output power range is smaller, so there are only 17 possible levels:
TxPower(@ 2.4 GHz) ∈
(−30, −28, −26, −24, −22, −20, −18, −16, −14, −12, −10, −8, −6, −4, −2, 0, 1) dBm.
(−30, −28, −26, −24, −22, −20, −18, −16, −14, −12, −10, −8, −6, −4, −2, 0, 1) dBm.
For each of these power levels, the sender sends 500 packets to the receiver at a rate of 50 packets/s, so each power level takes 10 s of measurements. Since the packets’ payload is 64 bytes long, this results in an effective data rate of 25.6 kbps. For each sender node position in each scenario, the whole experiment takes 610 s, corresponding to 22 × 10 = 220 s for each of the 433 and 868 frequencies and 17 × 10 = 170 s for the 2.4 GHz band. The RSSI value for each of the received packets is recorded from the corresponding transceiver, as well as the PRR calculated for each power level and frequency. The results from these experiments will be presented in the following section.
2.2.2. Dynamic Scenarios
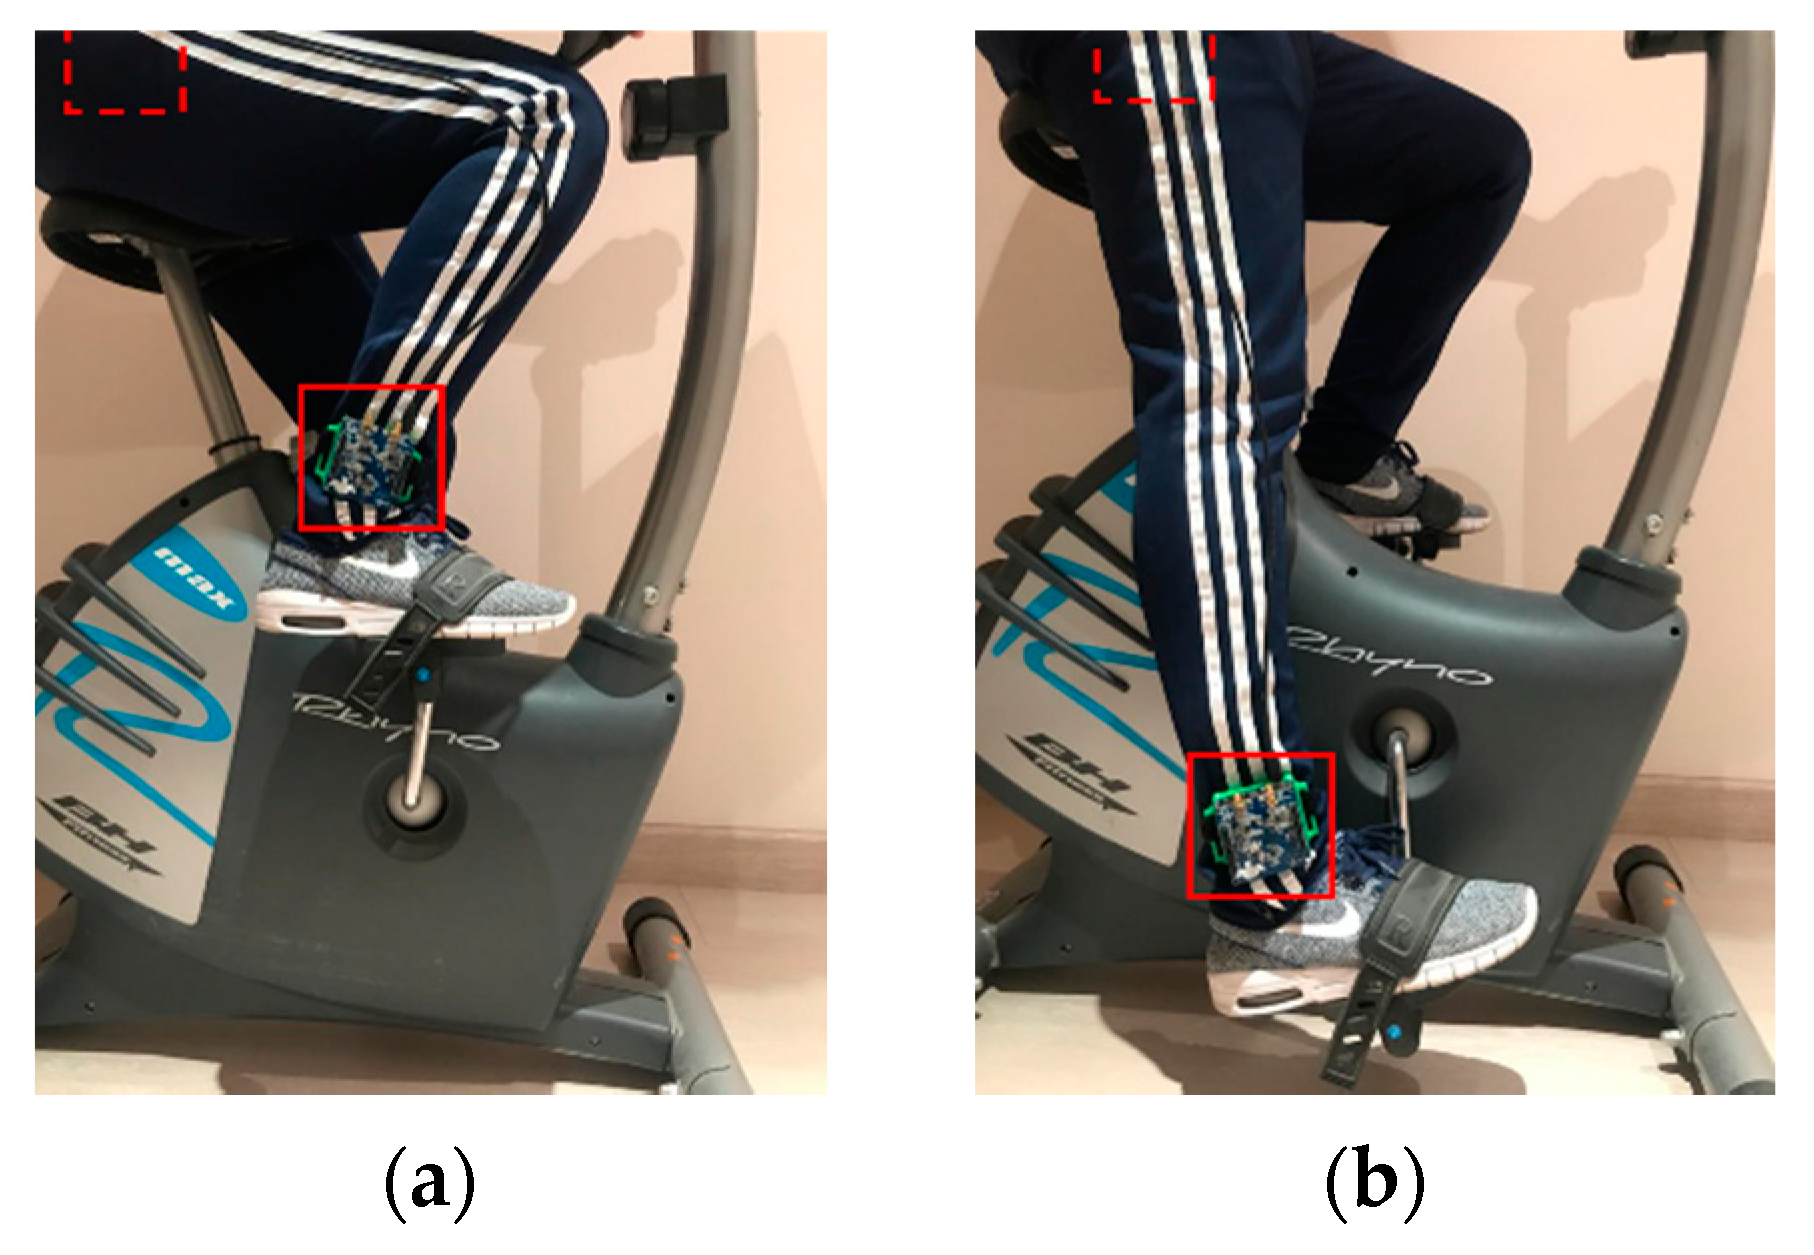
Two dynamic scenarios have been characterized in this work: cycling and walking. For the cycling experiment, a stationary bicycle has been used in order to provide a more controlled and safe experiment, where a constant speed can be maintained. This is a good representation of the real activity since the distances between nodes and body movements are equivalent. In this scenario, the subject has the receiver node on her left hip and the sender node on her right ankle as can be seen in Figure 3. As the subject pedals, the percentage of free space and body tissue on the signal path changes, as well as the straight distance between both nodes, which varies from a minimum of 72 to a maximum of 97 cm. Since it is the result of the pedal turn, this distance variation has a periodic pattern can be exploited by algorithms and strategies to adapt the transmit power or schedule the sending of packets [14,15].
In this scenario, the wrist node position was not measured since the subject’s hand remains motionless in the handlebar for the whole exercise. Thus, it maintains a constant distance with the hip node and does not take part in the body movements being tested. The subject pedals with a constant cadence of 62 ± 2 rpm, roughly equivalent to 23 km/h, for the whole duration of the experiment.
Analogously to the static scenarios, the sender node iterates through all the transmit power levels of the three frequency bands referred in (1) and (2). While the subject cycles, the sender node sends 1000 packets to the receiver for each level, at a rate of 50 packets/s, so each power level is measured for 20 s. Thus, the complete experiment for this scenario takes 1220 s, corresponding to 22 × 20 = 440 s for each of the two sub-1 GHz frequencies and 17 × 20 = 340 s for the 2.4 GHz band. The receiver node registers the RSSI level of each packet and calculates the PRR for each power level and frequency.
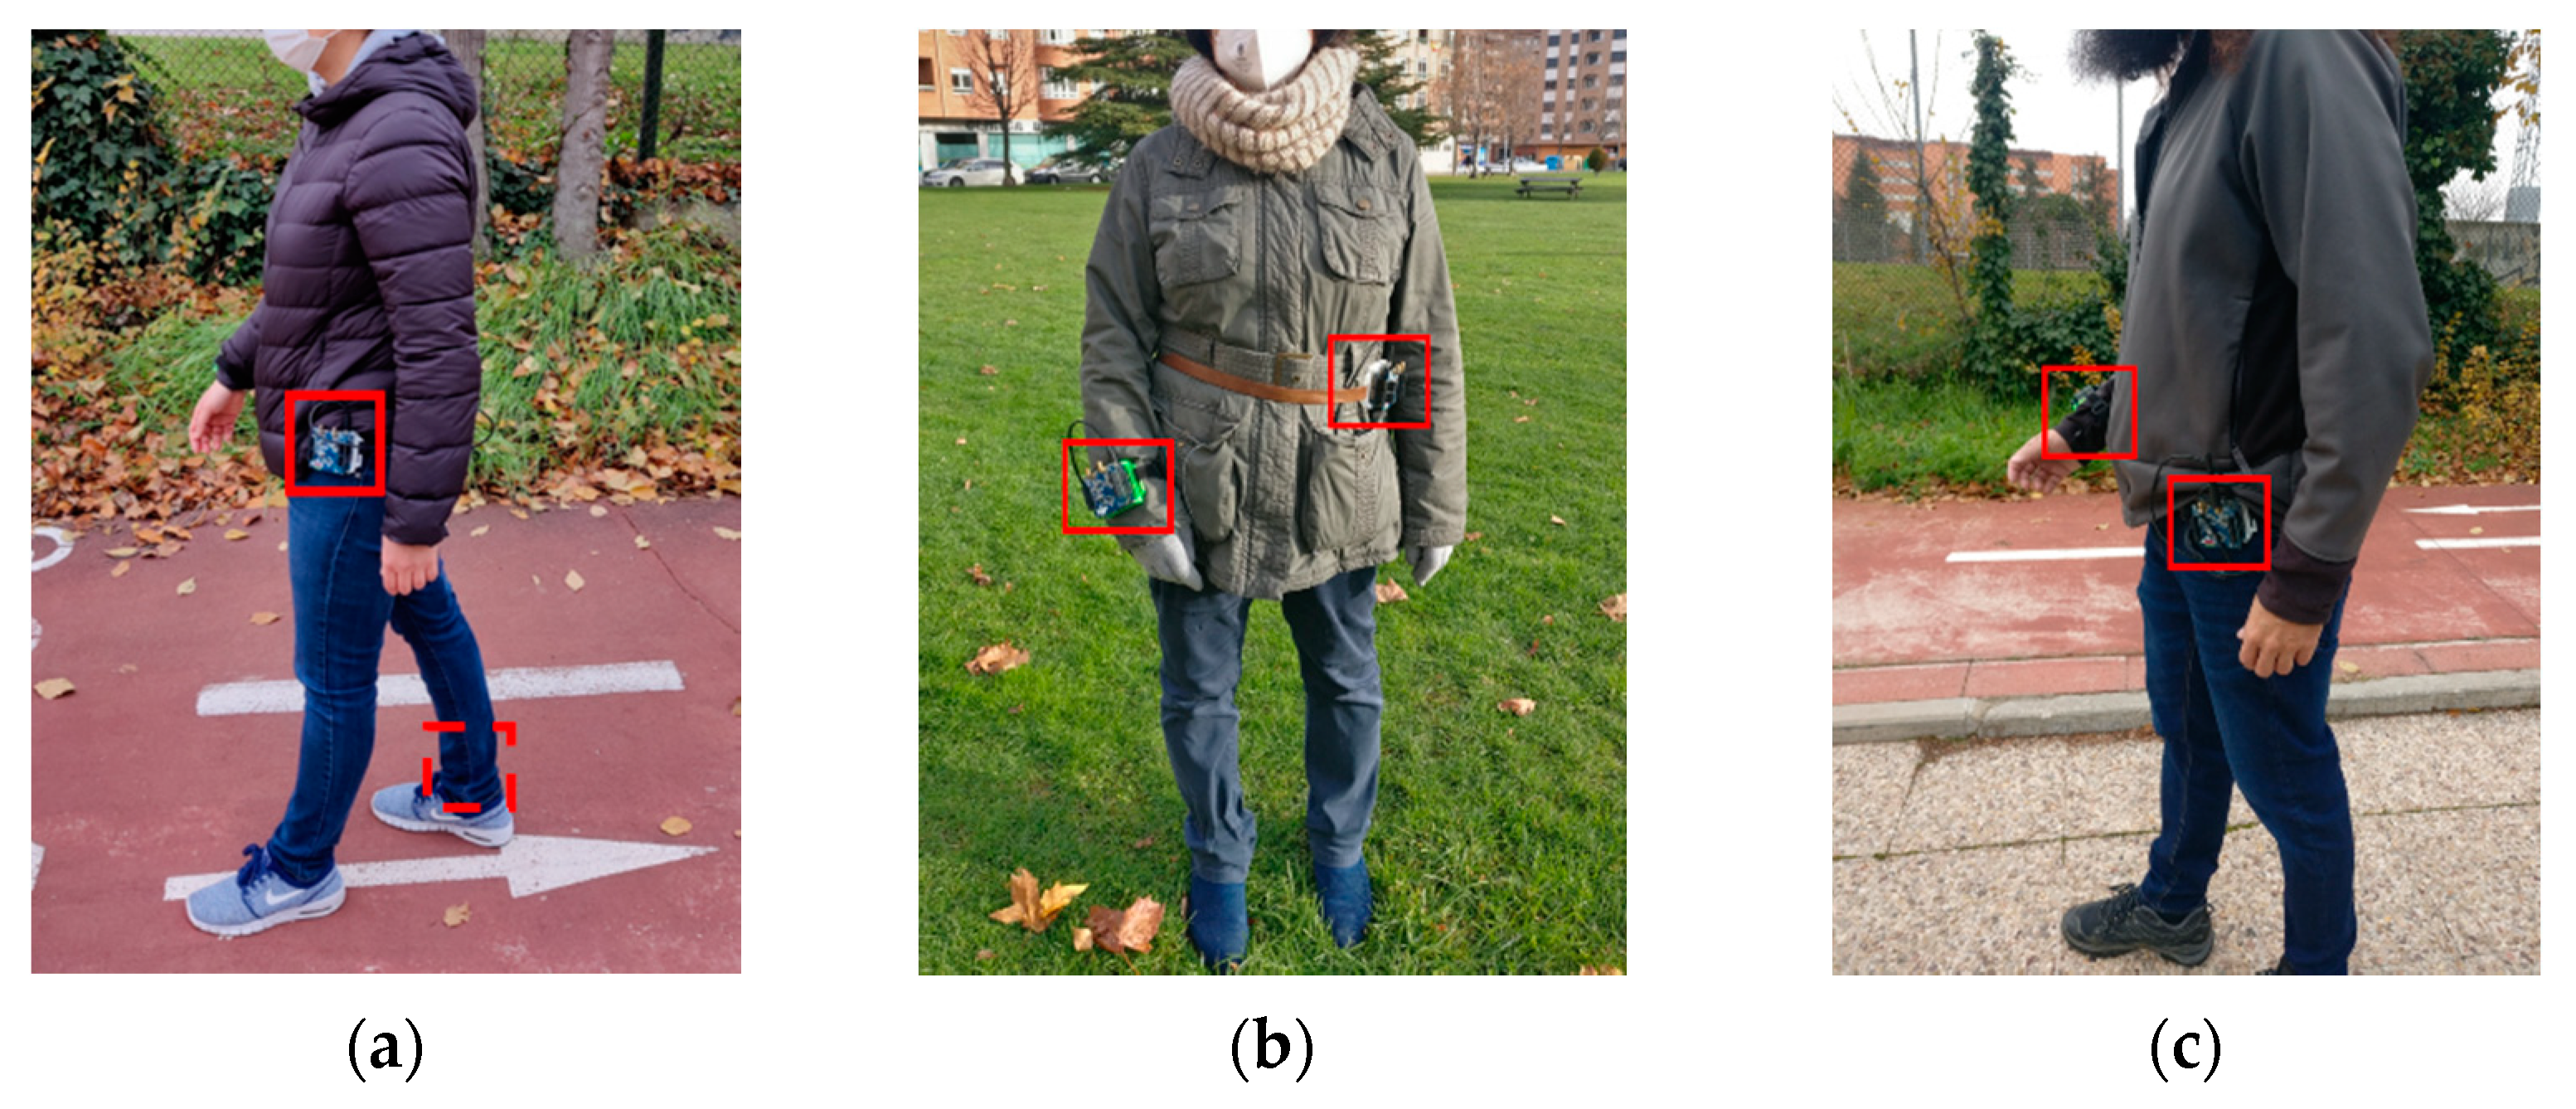
For the walking scenario, all experiments were performed outdoors. Given that the walking speed and gait cycle are very dependent on the subject, three people were asked to participate in the experiments. They were asked to walk at their usual walking speed on a flat path while wearing the test nodes in the same configuration of the static scenarios: a receiver node on their left hip and sender nodes on their right wrist and right ankle. With the regular body movements of the gait cycle, nodes change from being in LOS to NLOS, as the signal path is obstructed by parts of the subject’s body [5,15]. Figure 4 shows the three test subjects at different points in the experiment.
Since the subjects’ physical characteristics—height, age, etc.—have a strong influence on their gait cycle and consequently on the distances between nodes, some length measurements were taken prior to starting the measurements. Specifically, the height at which each of the three nodes was placed with respect to the ground was noted for the three subjects. After finishing the experiments, the average walking speed and cadence were also calculated for each of the subjects. All these data can be seen in Table 2.
The measurements in the walking scenario followed the same procedure as the previous ones. While the subject walks, the sender nodes (on each of the wrist and ankle locations) send 1000 packets to the receiver on the hip at a rate of 50 packets/s, for each of the possible transmit power levels of each of the frequency bands. Thus, each subject was recorded walking for 2440 s, corresponding to 440 s for each of the sub-1 GHz frequencies and 340 s for the 2.4 GHz band, for each of the sender node positions. The wrist position was selected because it is a usual spot for motion sensors, such as smartbands, with step counting capabilities. This is not the case for the ankle position, so its characterization is useful in order to analyze its potential in this application.
3. Results
3.1. Standing Scenario
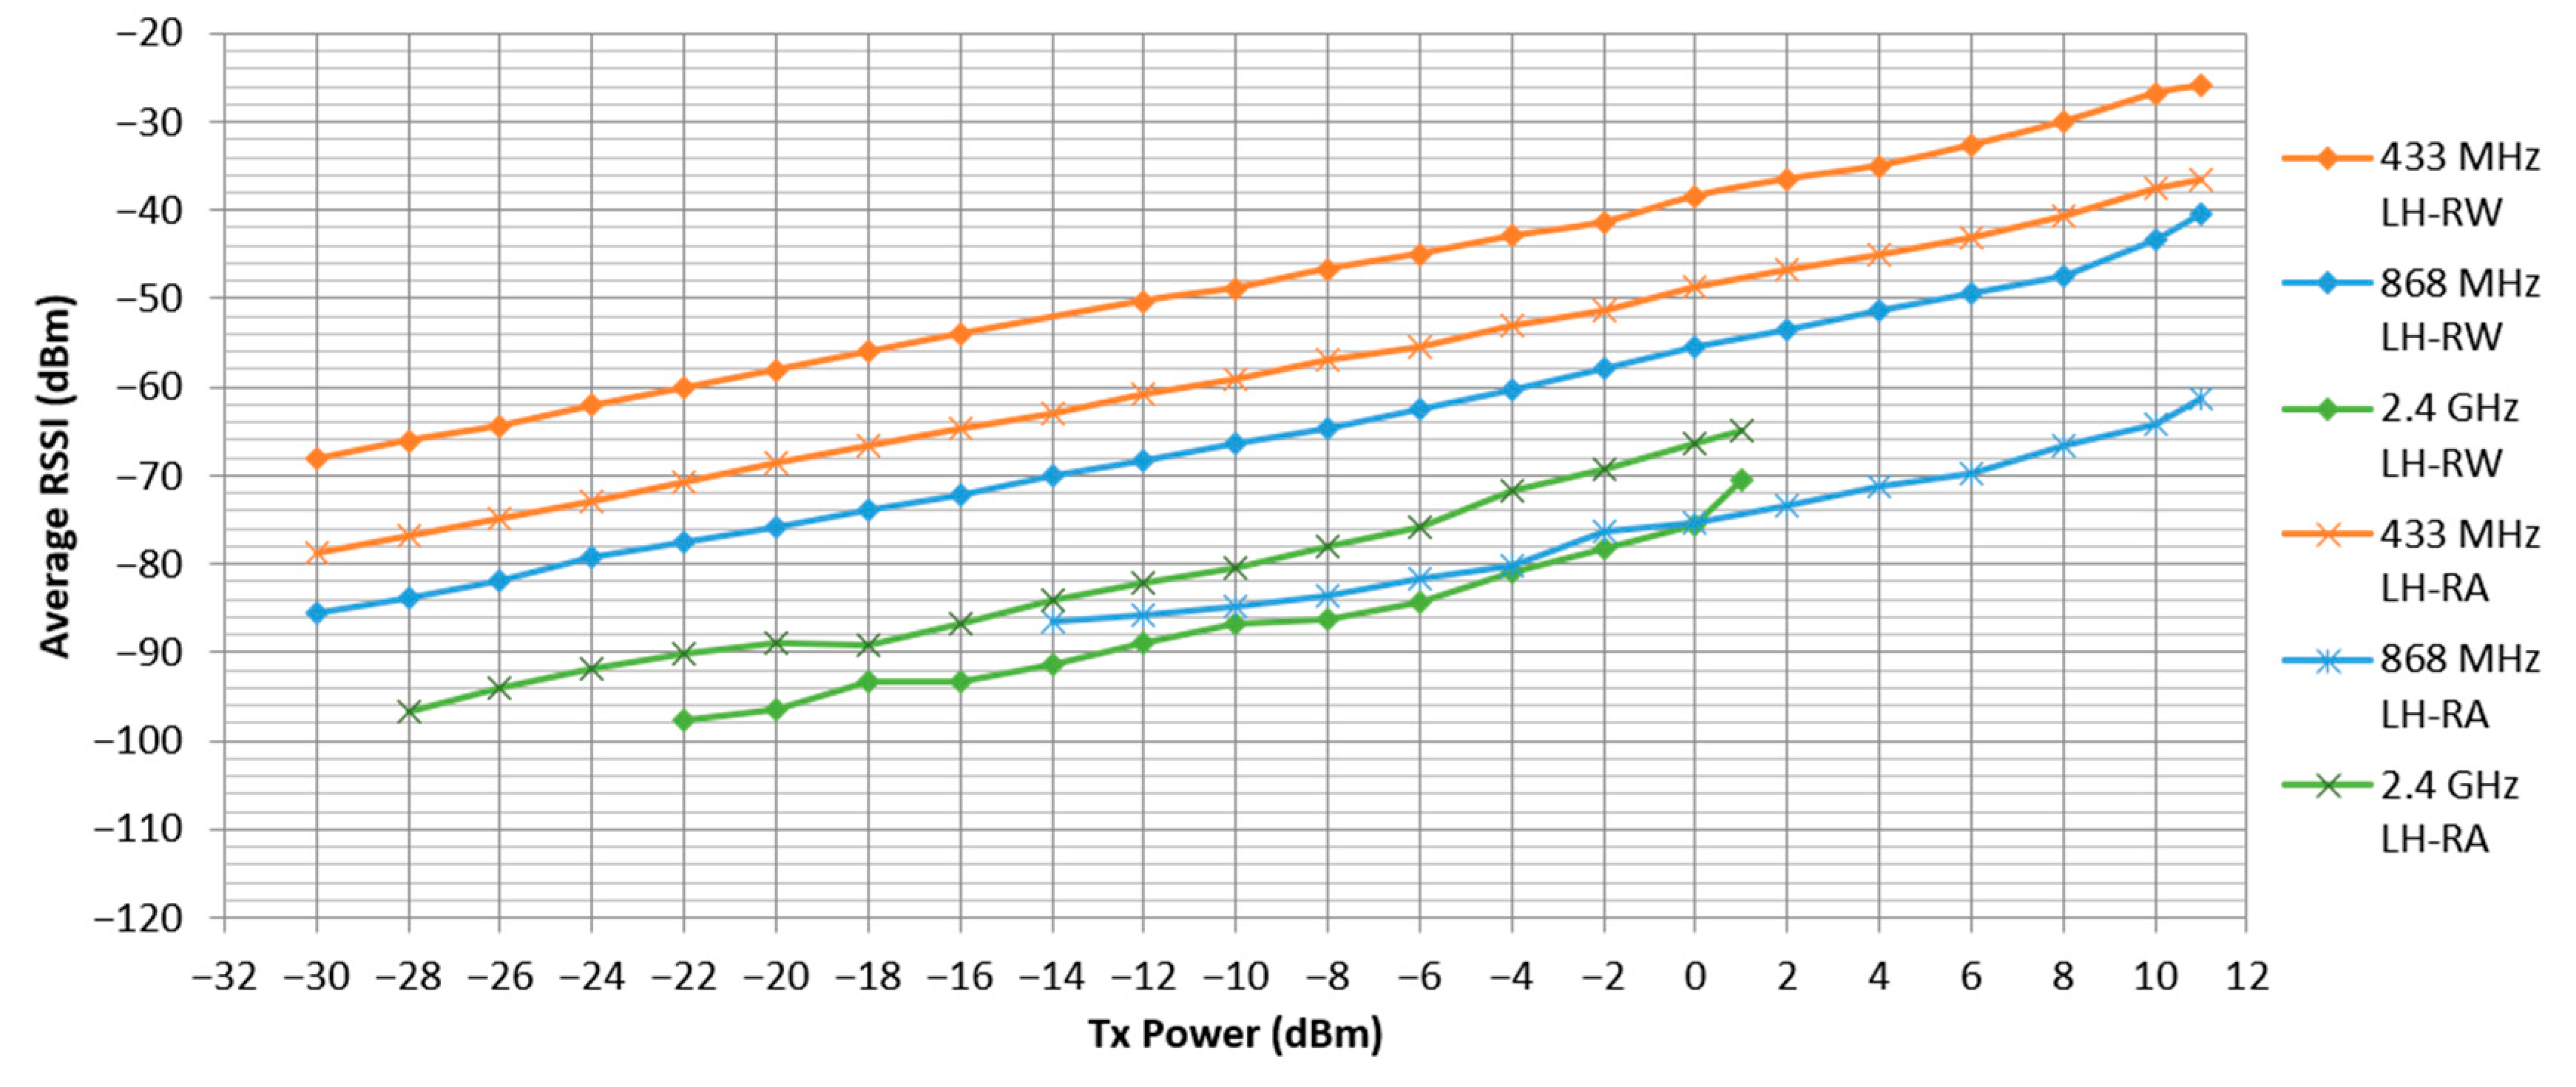
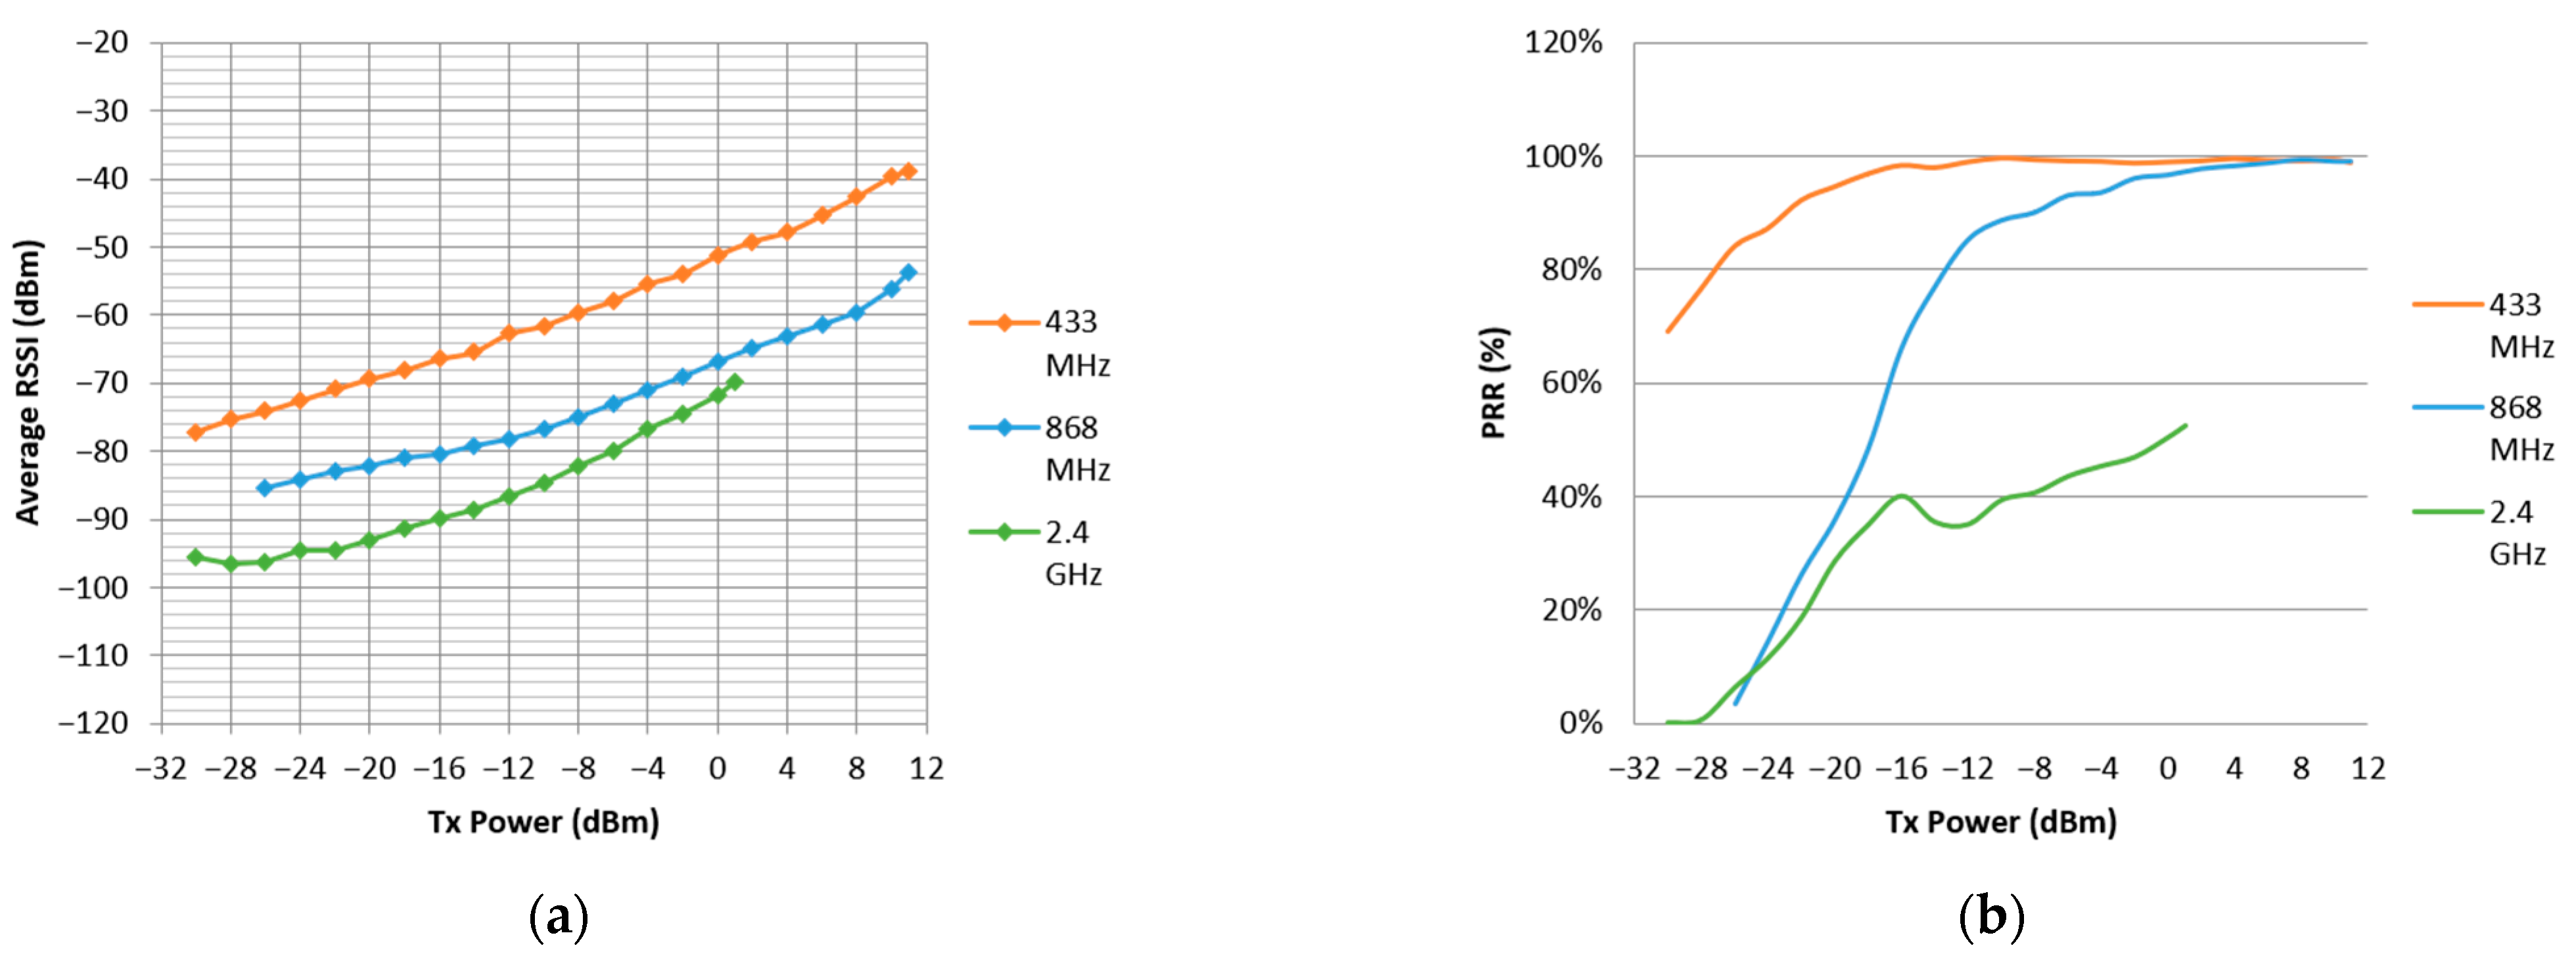
The results obtained from the measurements of the standing scenario can be seen in the following figures. Figure 5 shows the average RSSI of the received packets at the hip node from sender nodes on both locations—right wrist (LH-RW) and right ankle (LH-RA)—for all the transmit power levels of all the frequency bands. It is important to remember from (1) and (2) that while all three frequency bands have a transmit power range that starts on the −30 dBm level, the 433 and 868 MHz transceivers have a maximum transmit power of 11 dBm but the maximum transmit power of the 2.4 GHz band is only 1 dBm. When some transmit power levels are not represented for a particular configuration, e.g., the values below −14 dBm for the 868 MHz ankle position, it means that no packets were received for that particular level. This is also reflected in the corresponding PRR value in the following graph.
The graph shows that the RSSI value is roughly inversely proportional to the frequency band, as expected from path loss equations. Additionally, for both sub-1 GHz bands, the ankle location results in a lower RSSI than the wrist location. The reason for this is a longer distance between both nodes. However, the opposite occurs for the 2.4 GHz frequency, where the ankle location gives a better performance in terms of RSSI than the wrist location. This is probably due to the fact that the signal path between the subject’s hip and wrist is mostly obstructed by body tissue, whereas the hip–ankle link has a much higher proportion of free space and both nodes are partially in LOS.
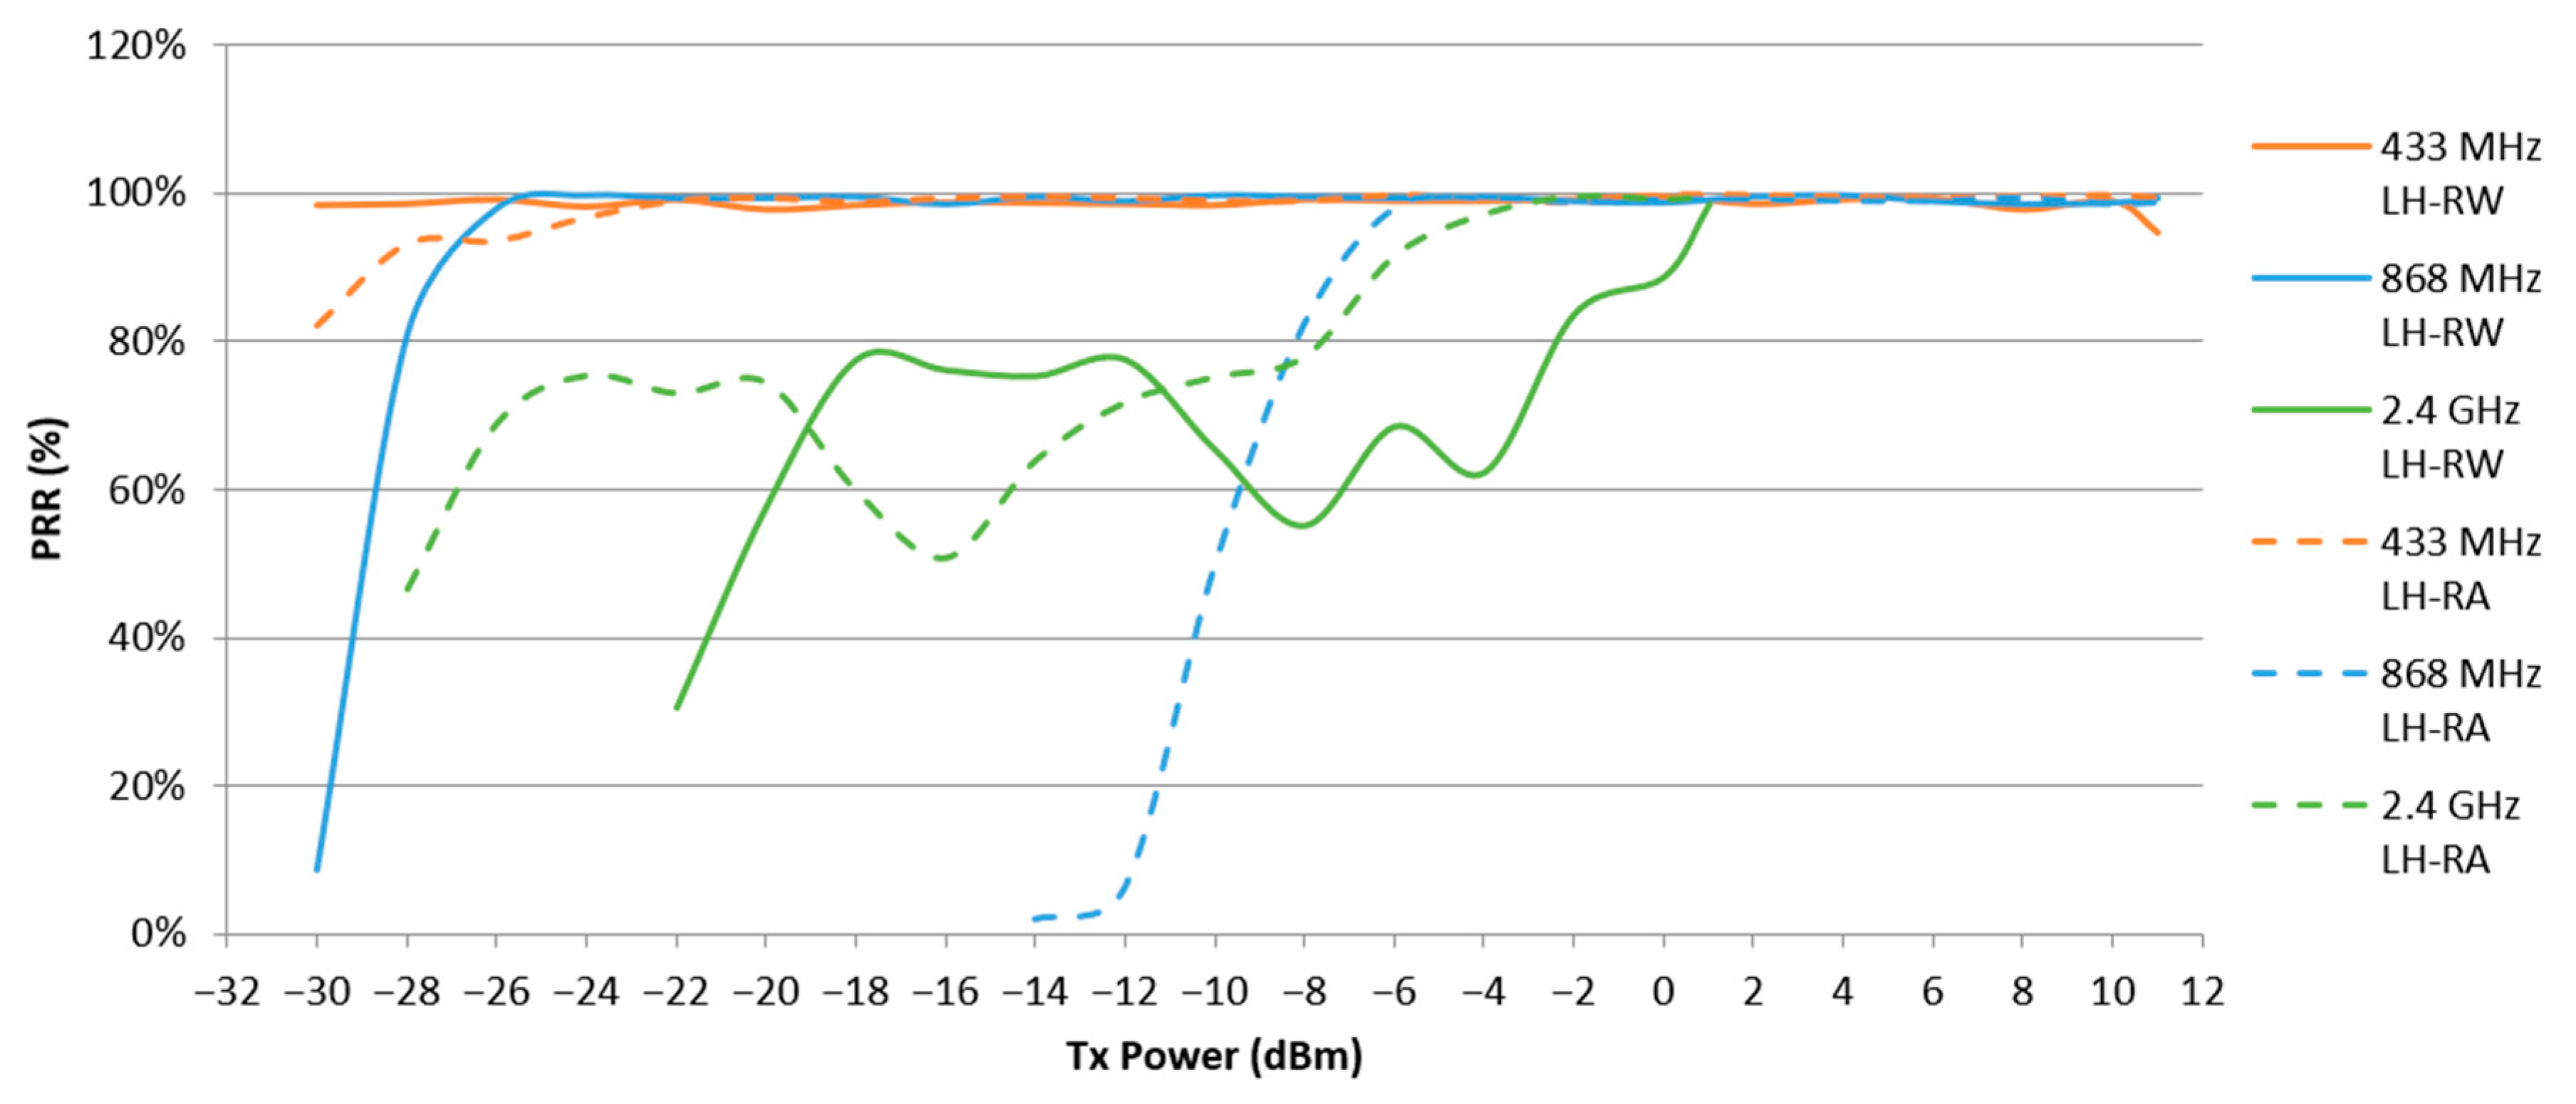
In turn, Figure 6 shows the PRR calculated for each of the transmit power levels of each frequency transceiver. It can be seen that for the 433 MHz band, the PRR is very close to 100% for almost all power levels. On the other hand, for the 868 MHz band, the curves are much more similar to the ones that could be expected theoretically, where PRR increases along with the increase in transmit power—and consequently RSSI—until it saturates near the 100% level, when the RSSI sufficiently surpasses the sensitivity level of the receiver. This is also in agreement with other empirical studies in the field [11,13]. In concordance with the measured RSSI from the previous figure, for the 868 MHz band, the ankle location results in a much worse performance than the wrist. For the first nine power values no packet arrives at the receiver with a sufficient RSSI value to surpass its sensitivity, so the PRR is 0%.
Additionally, in agreement with the recorded RSSI values, the 2.4 GHz band has a better performance in terms of PRR for the ankle location than that of the wrist location. It is interesting to note that while the 2.4 GHz PRR curves have the expected increasing tendency until saturating near the 100% level, they have some depressions at some power values. Since the measurements were taken sequentially in order of increasing power level and the curve depressions involve contiguous power values, a temporal component for this phenomenon can be inferred. Given that the experiment took place indoors and in an environment with other equipment operating on the 2.4 GHz band, these intermittent losses could be caused by interference or by multipath fading due to slight subject movements or foreign changes [20].
3.2. Sitting Scenario
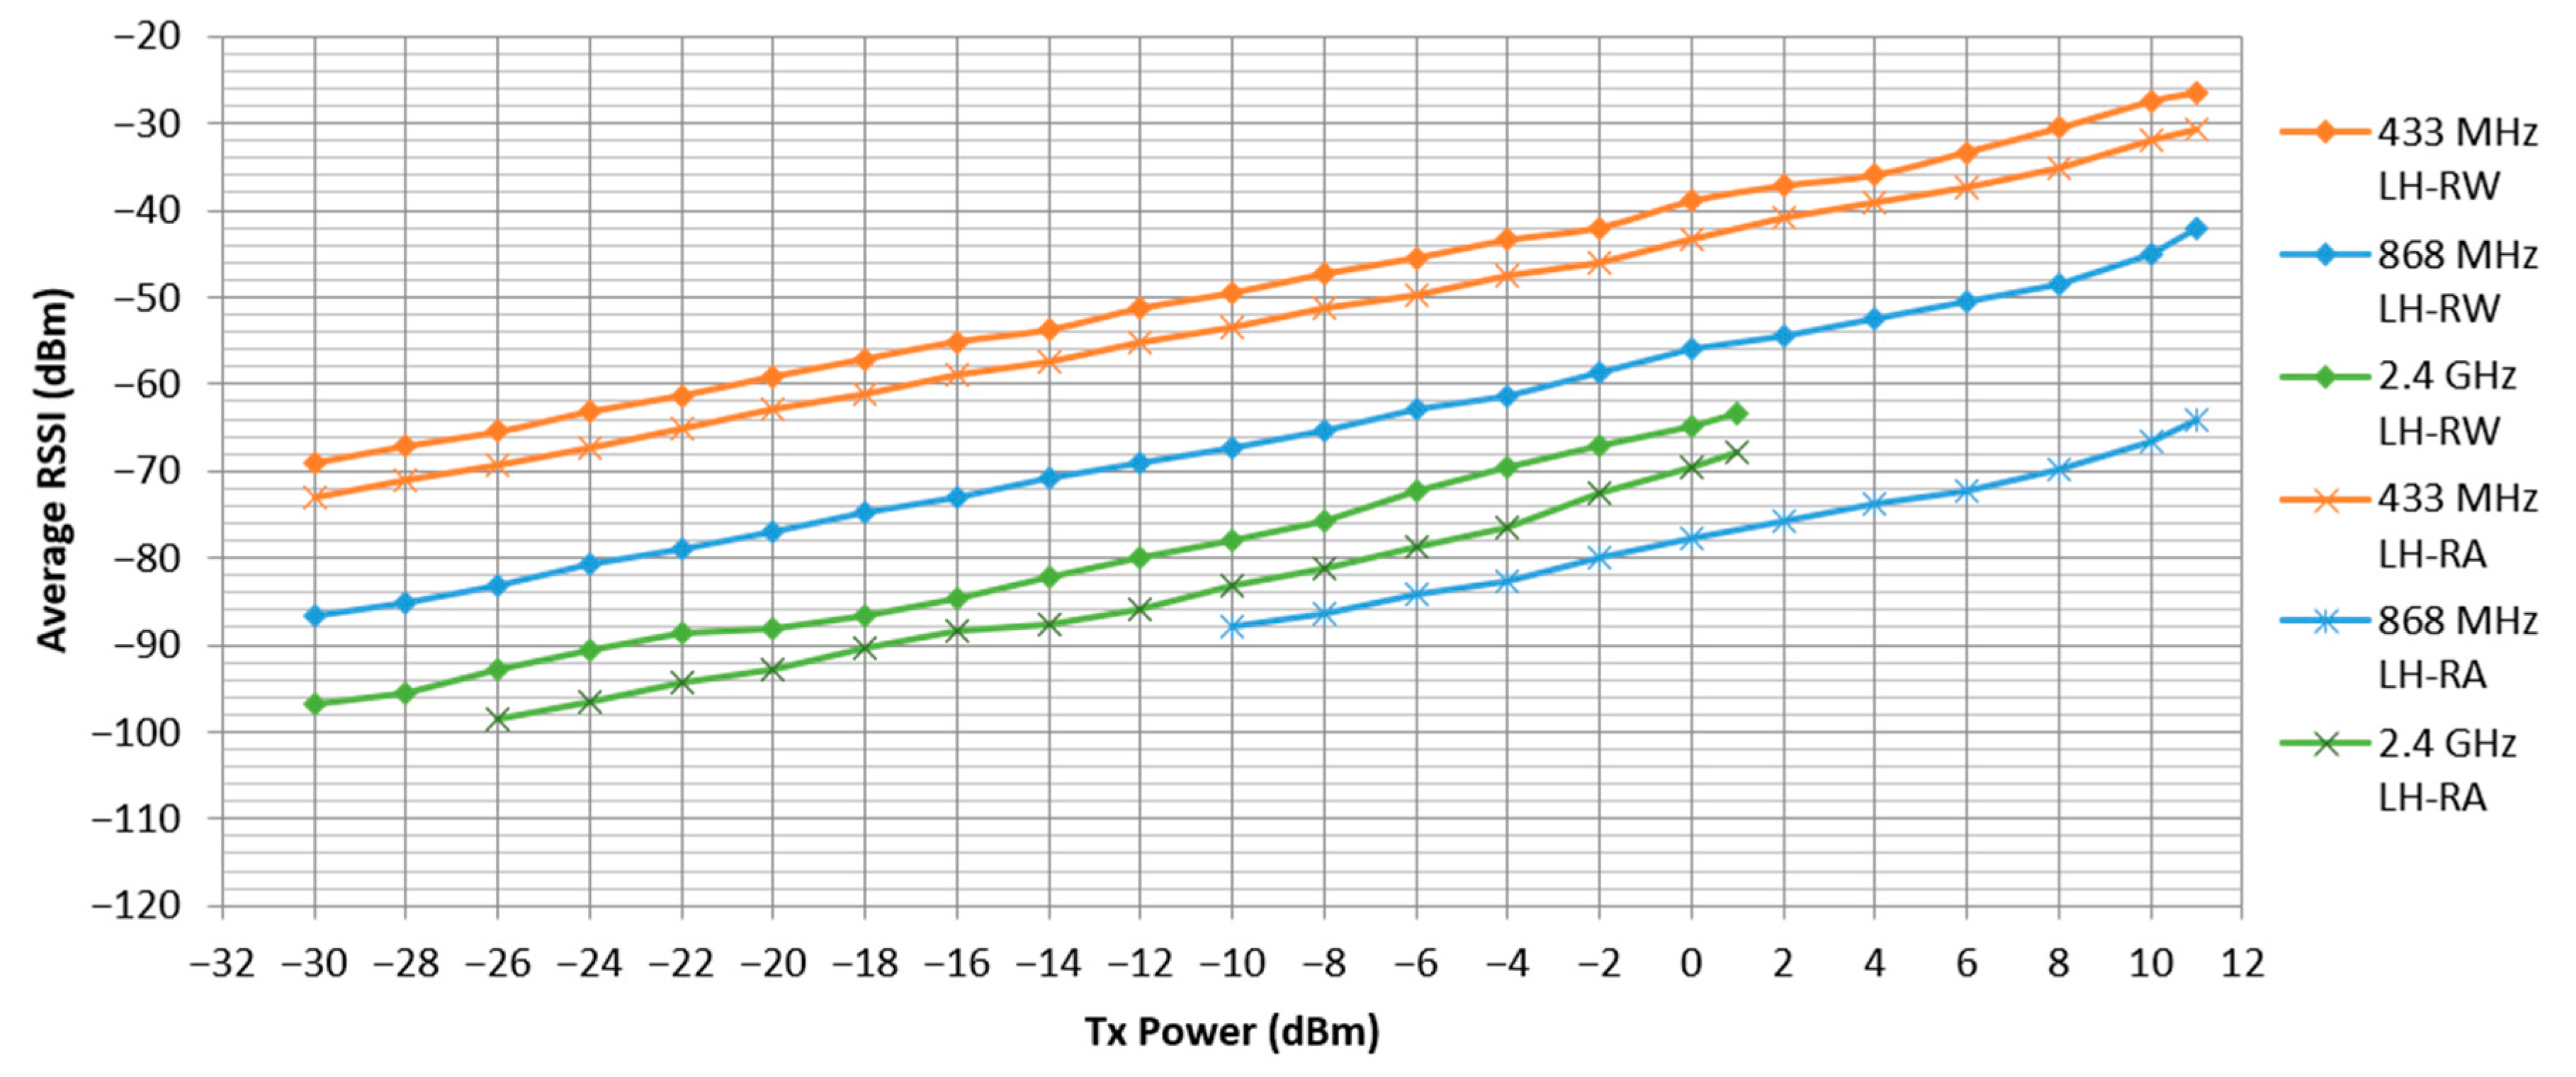
The same measurements as in the standing scenario are presented for the sitting scenario in the following figures. Figure 7 shows the average RSSI of all received packets for each of the transmit power levels of the different transceivers and sender node locations. The sub-1 GHz bands perform very similarly to the standing scenario, with the 868 MHz frequency being more affected by the increase in distance of the ankle location. However, for the 2.4 GHz band, in this scenario, the wrist location gives a better performance in terms of RSSI than the ankle one, oppositely to the standing case. This is because, in this scenario, the wrist is placed on top of a desk and there is no body tissue obstructing the signal path, only the table material. This supports the hypothesis given in the previous section: the 2.4 GHz band is much more negatively affected by body parts in the signal path than the other frequencies, at least in this indoor environment and these experiment conditions.
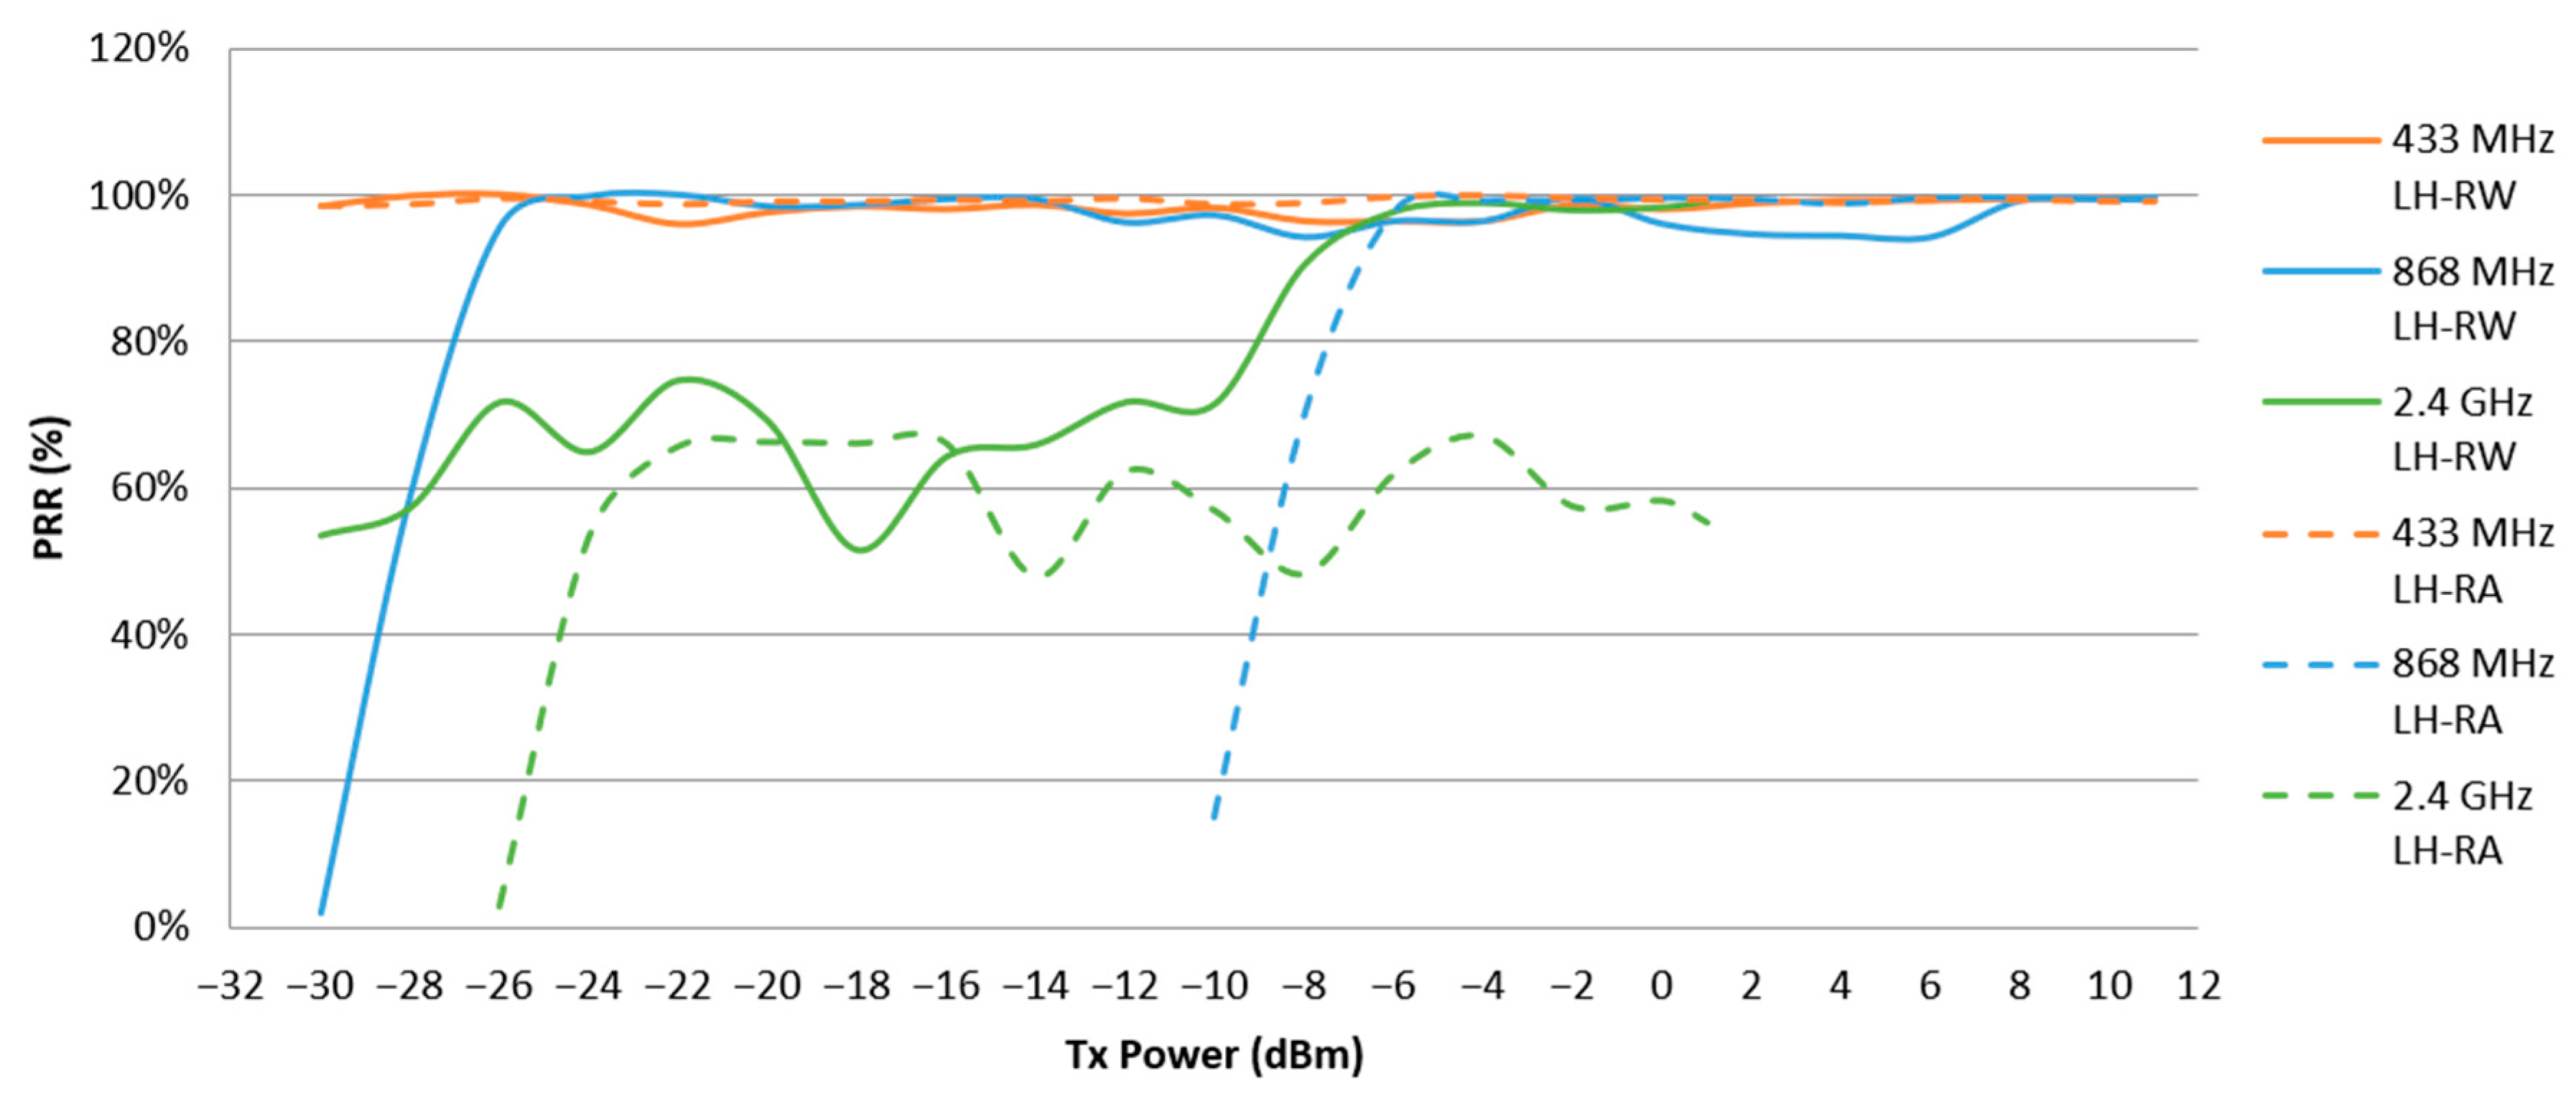
The calculated PRR metric of the sitting scenario is presented in Figure 8. As can be inferred from the RSSI graph, both sub-1 GHz bands perform as expected and similarly to the standing scenario. On the other hand, the 2.4 GHz PRR curves show the intermittent losses referred to in the standing scenario, with the ankle location performing much worse in terms of PRR. This is in line with the aforementioned hypothesis that the 2.4 GHz band is more negatively affected by body tissue in the signal path. In the sitting scenario, the hip–ankle path is partially obstructed by the subject’s legs and chair, whereas in the standing scenario the path between the nodes is clearer. Additionally, multipath fading is likely to have a strong impact on this scenario and sender location, given the experiment environment in which the desk is close to two walls (Figure 2d).
3.3. Cycling Scenario
Since the RSSI of all received packets is averaged for each power level of each frequency band, this metric has a similar performance in this dynamic scenario as in the static ones. The PRR curves have also the expected tendency, as shown in Figure 9.
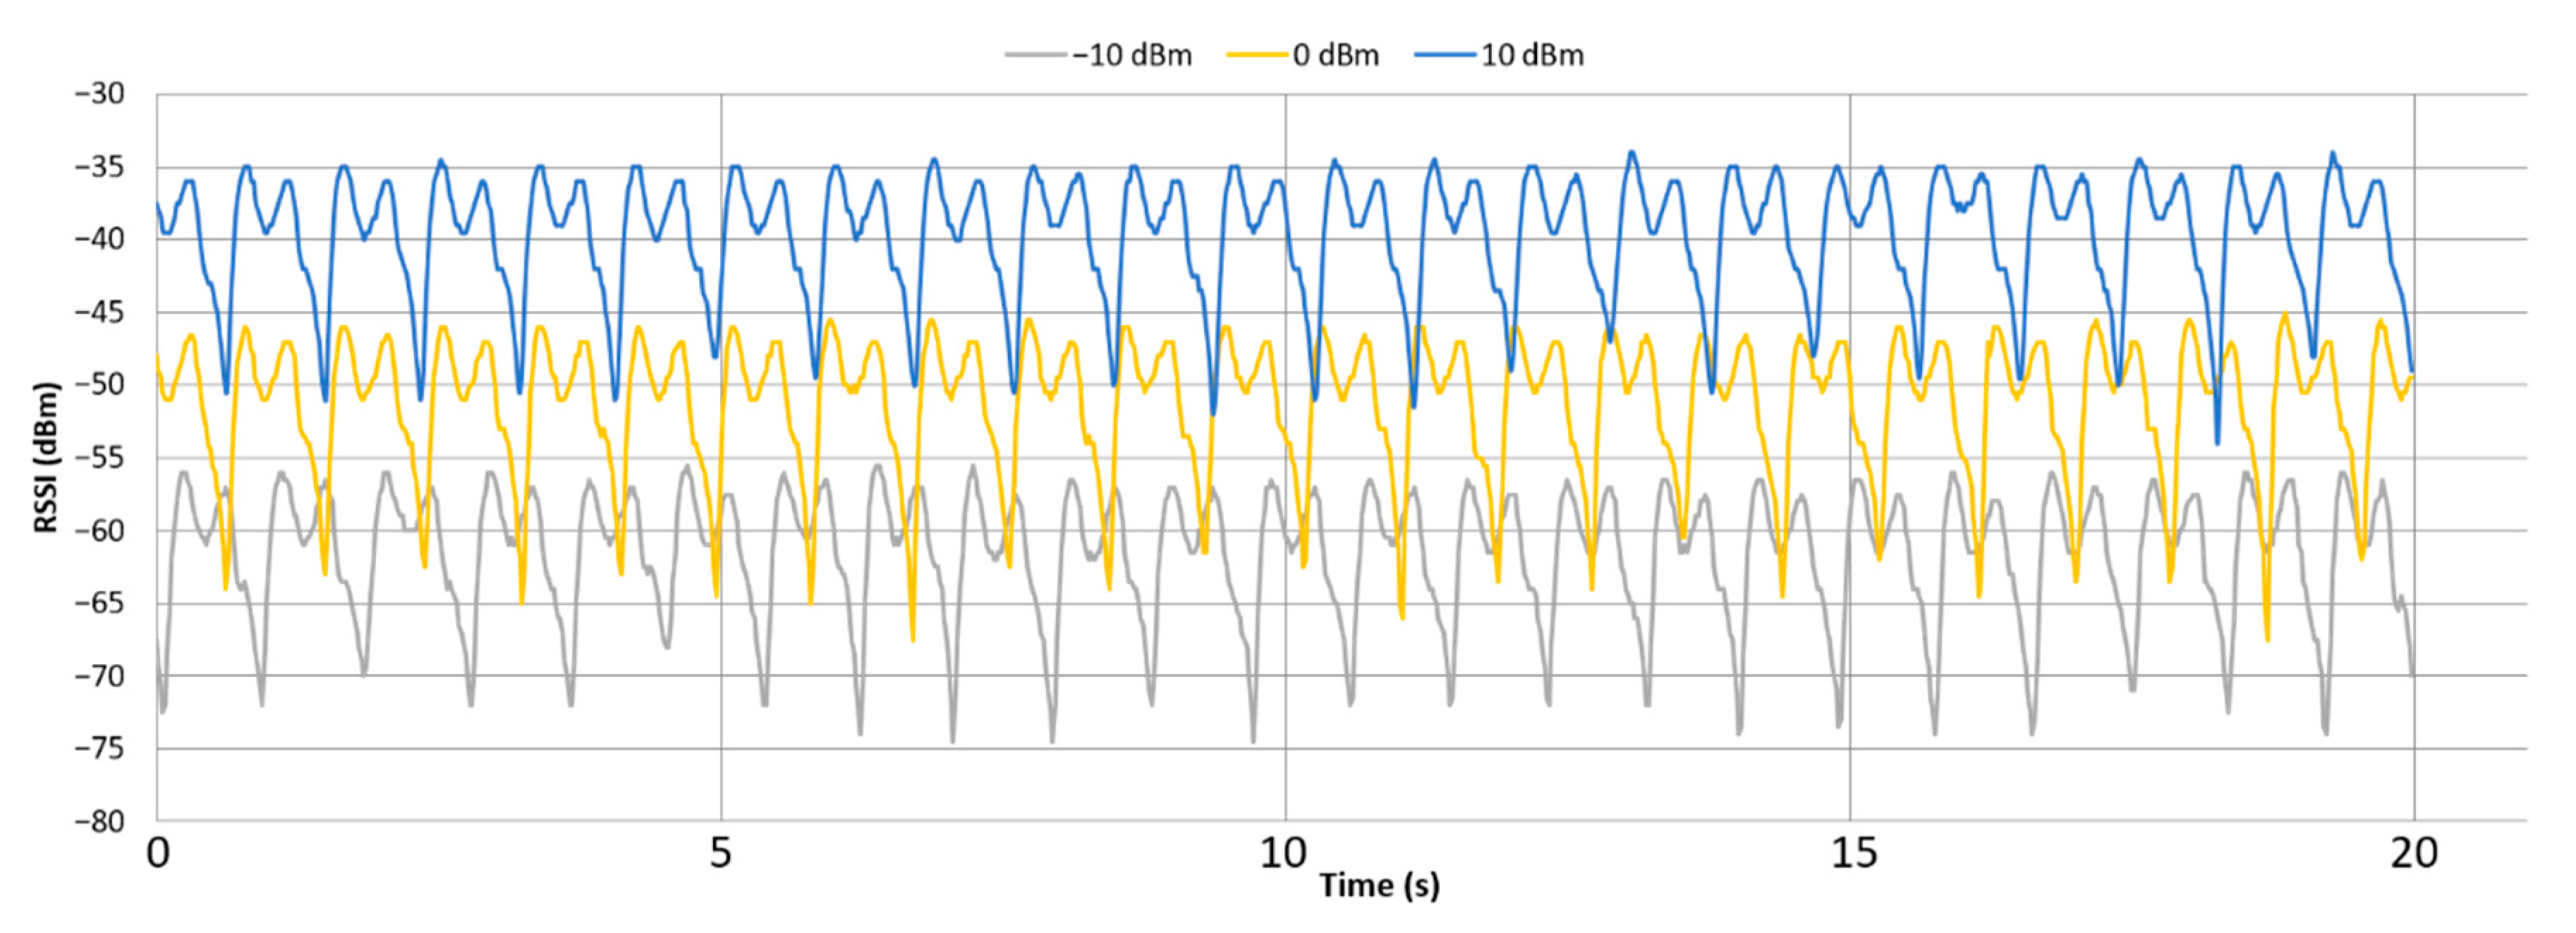
In dynamic scenarios, the most interesting result is the RSSI variation with time. Given that the sender node on the subject’s ankle moves in a quasi-uniform circular motion, it gets closer and farther from the receiver node in a periodic manner, which is reflected in the RSSI metric. The RSSI variation with time in the cycling scenario for several of the available transmit power levels of the 433 MHz band can be seen in Figure 10.
The periodicity is very clear in these graphs, where the shape of each complete pedal turn is very clearly depicted for all power levels. Not only could this periodicity be exploited for TPC or other energy efficient algorithms, but the very shape of the curves could be used by the WBAN to intelligently recognize the human activity taking place. The periodic peaks of the curve maintain their shape with every power level for the 433 MHz band, differing only in the RSSI values around which they are centered.
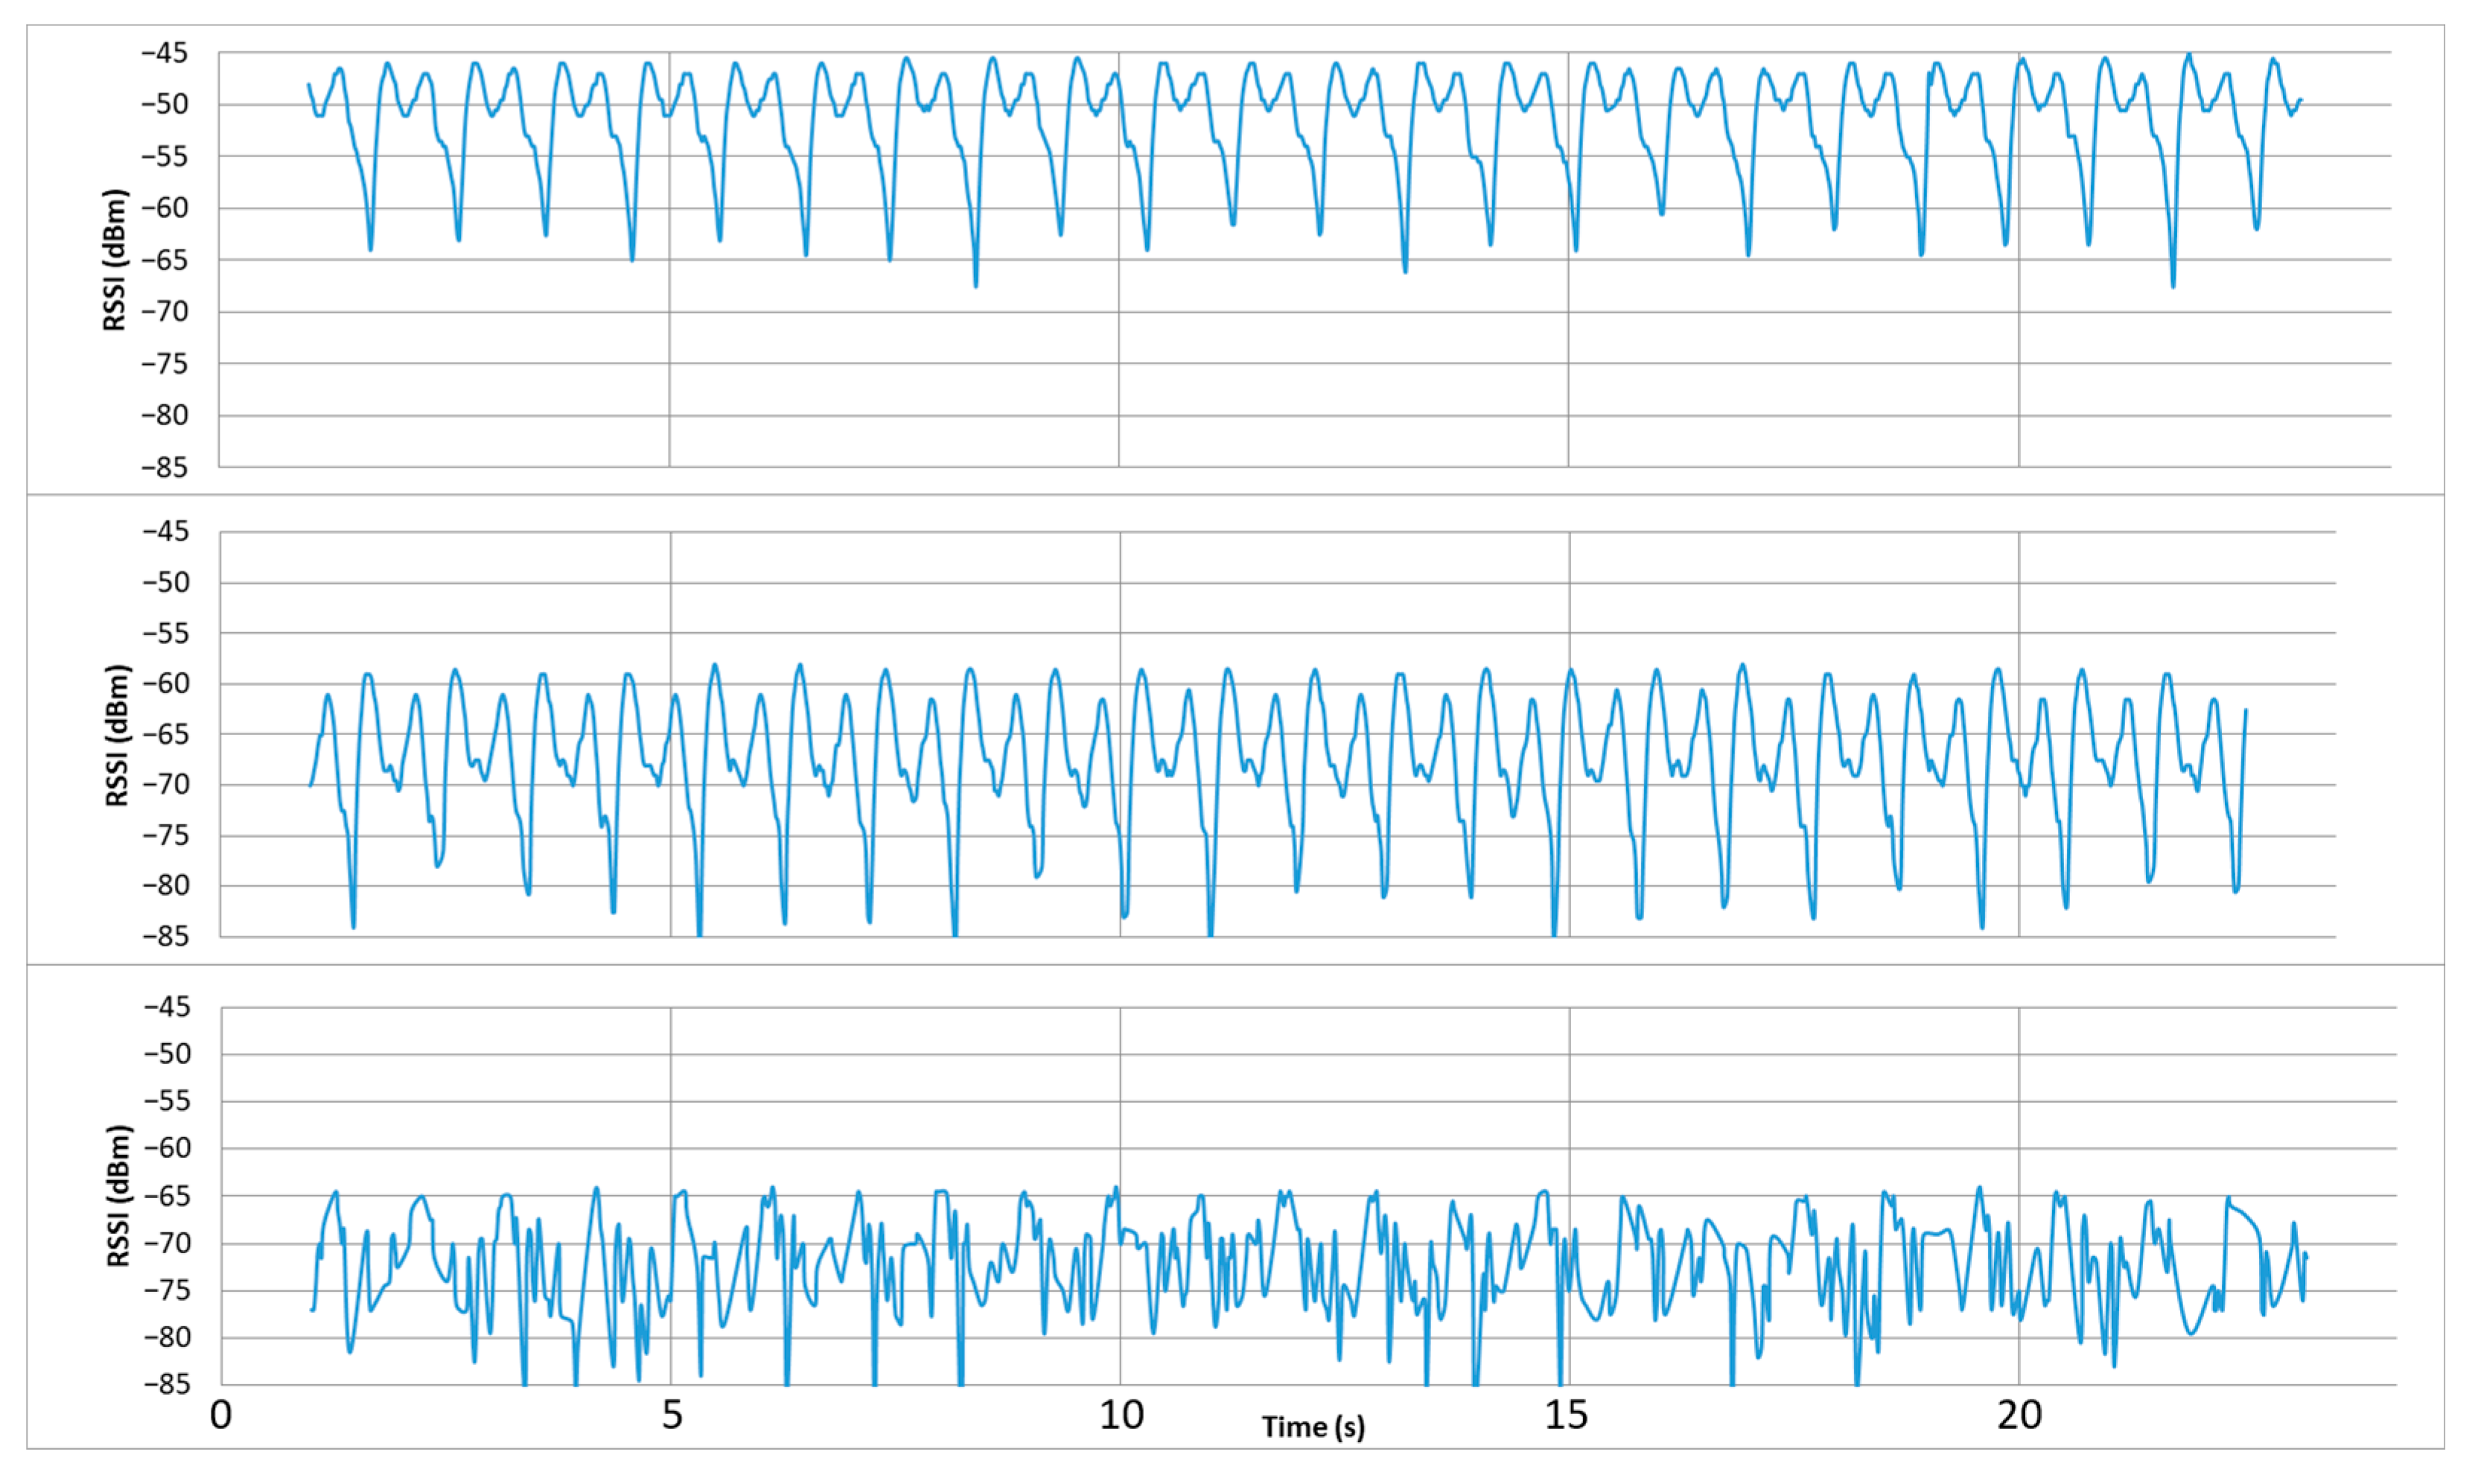
The RSSI variation with time for the 868 MHz and 2.4 GHz band and a transmit power level of 0 dBm is presented in Figure 11. Particularly for the 2.4 GHz band, its lower RSSI and PRR values are reflected on the periodic shape, where the pedaling motion is not as easily recognizable. The distinctive peak shape with two contiguous maxima that is present in both sub-1 GHz frequencies, is not visible for this band. However, the maxima and minima corresponding to each pedal turn are easily observable, and the periodicity of the curve is still clear and can be exploited.
3.4. Walking Scenario
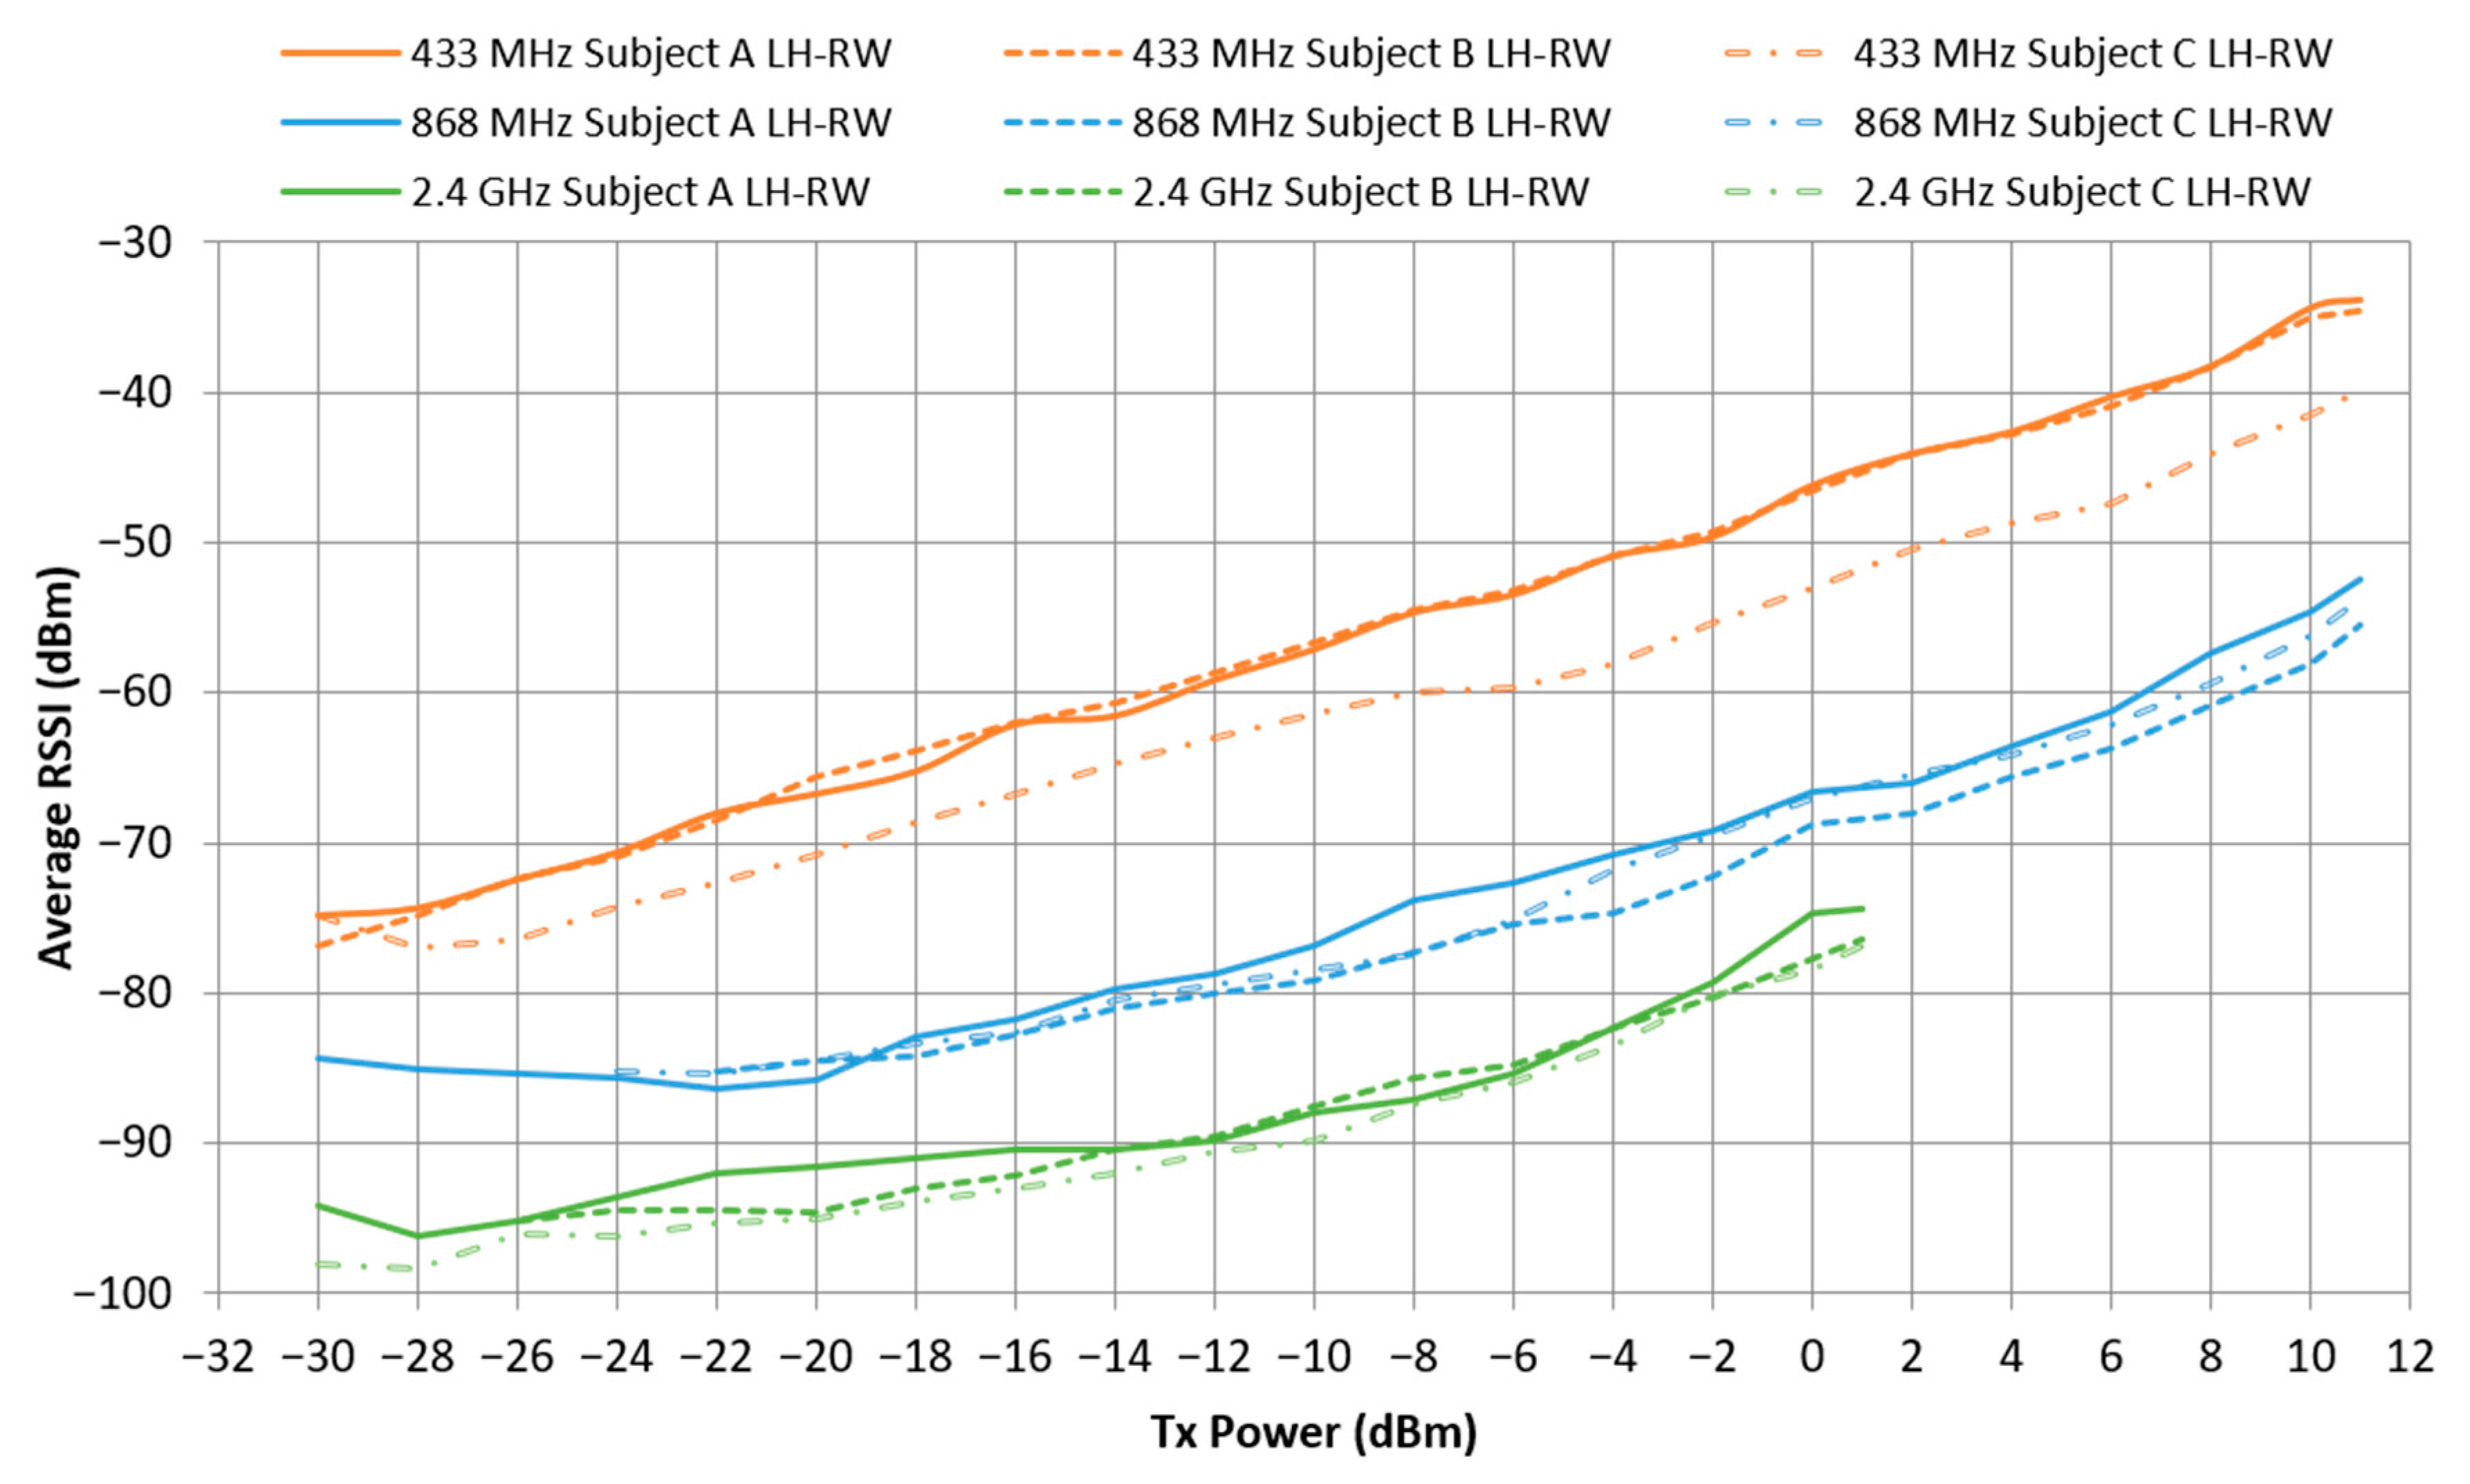
The average RSSI for each of the transmit power levels of each frequency band and subject are presented in Figure 12 and Figure 13 for the wrist and ankle location, respectively.
These curves show the expected increasing tendency for all subjects with respect to the transmit power level and the inversely proportional relation between the RSSI and frequency. There are significant differences in performance among the different subjects, although in no case do these variations surpass the effect of the frequency band; i.e., in all cases the three lines corresponding to each frequency for the three subjects are grouped together without crossing any of the other frequency curves.
Comparing the wrist and ankle location, a higher variation among the subjects is observed for the latter. This is probably due to the fact that the distance between the subjects’ ankle and hip is more dependent on the subjects’ height than in the case of the wrist. This is also supported by the fact that Subject C—the tallest of the three—generally obtains a worse RSSI performance than that of the other two subjects, due to a longer distance between his node locations.
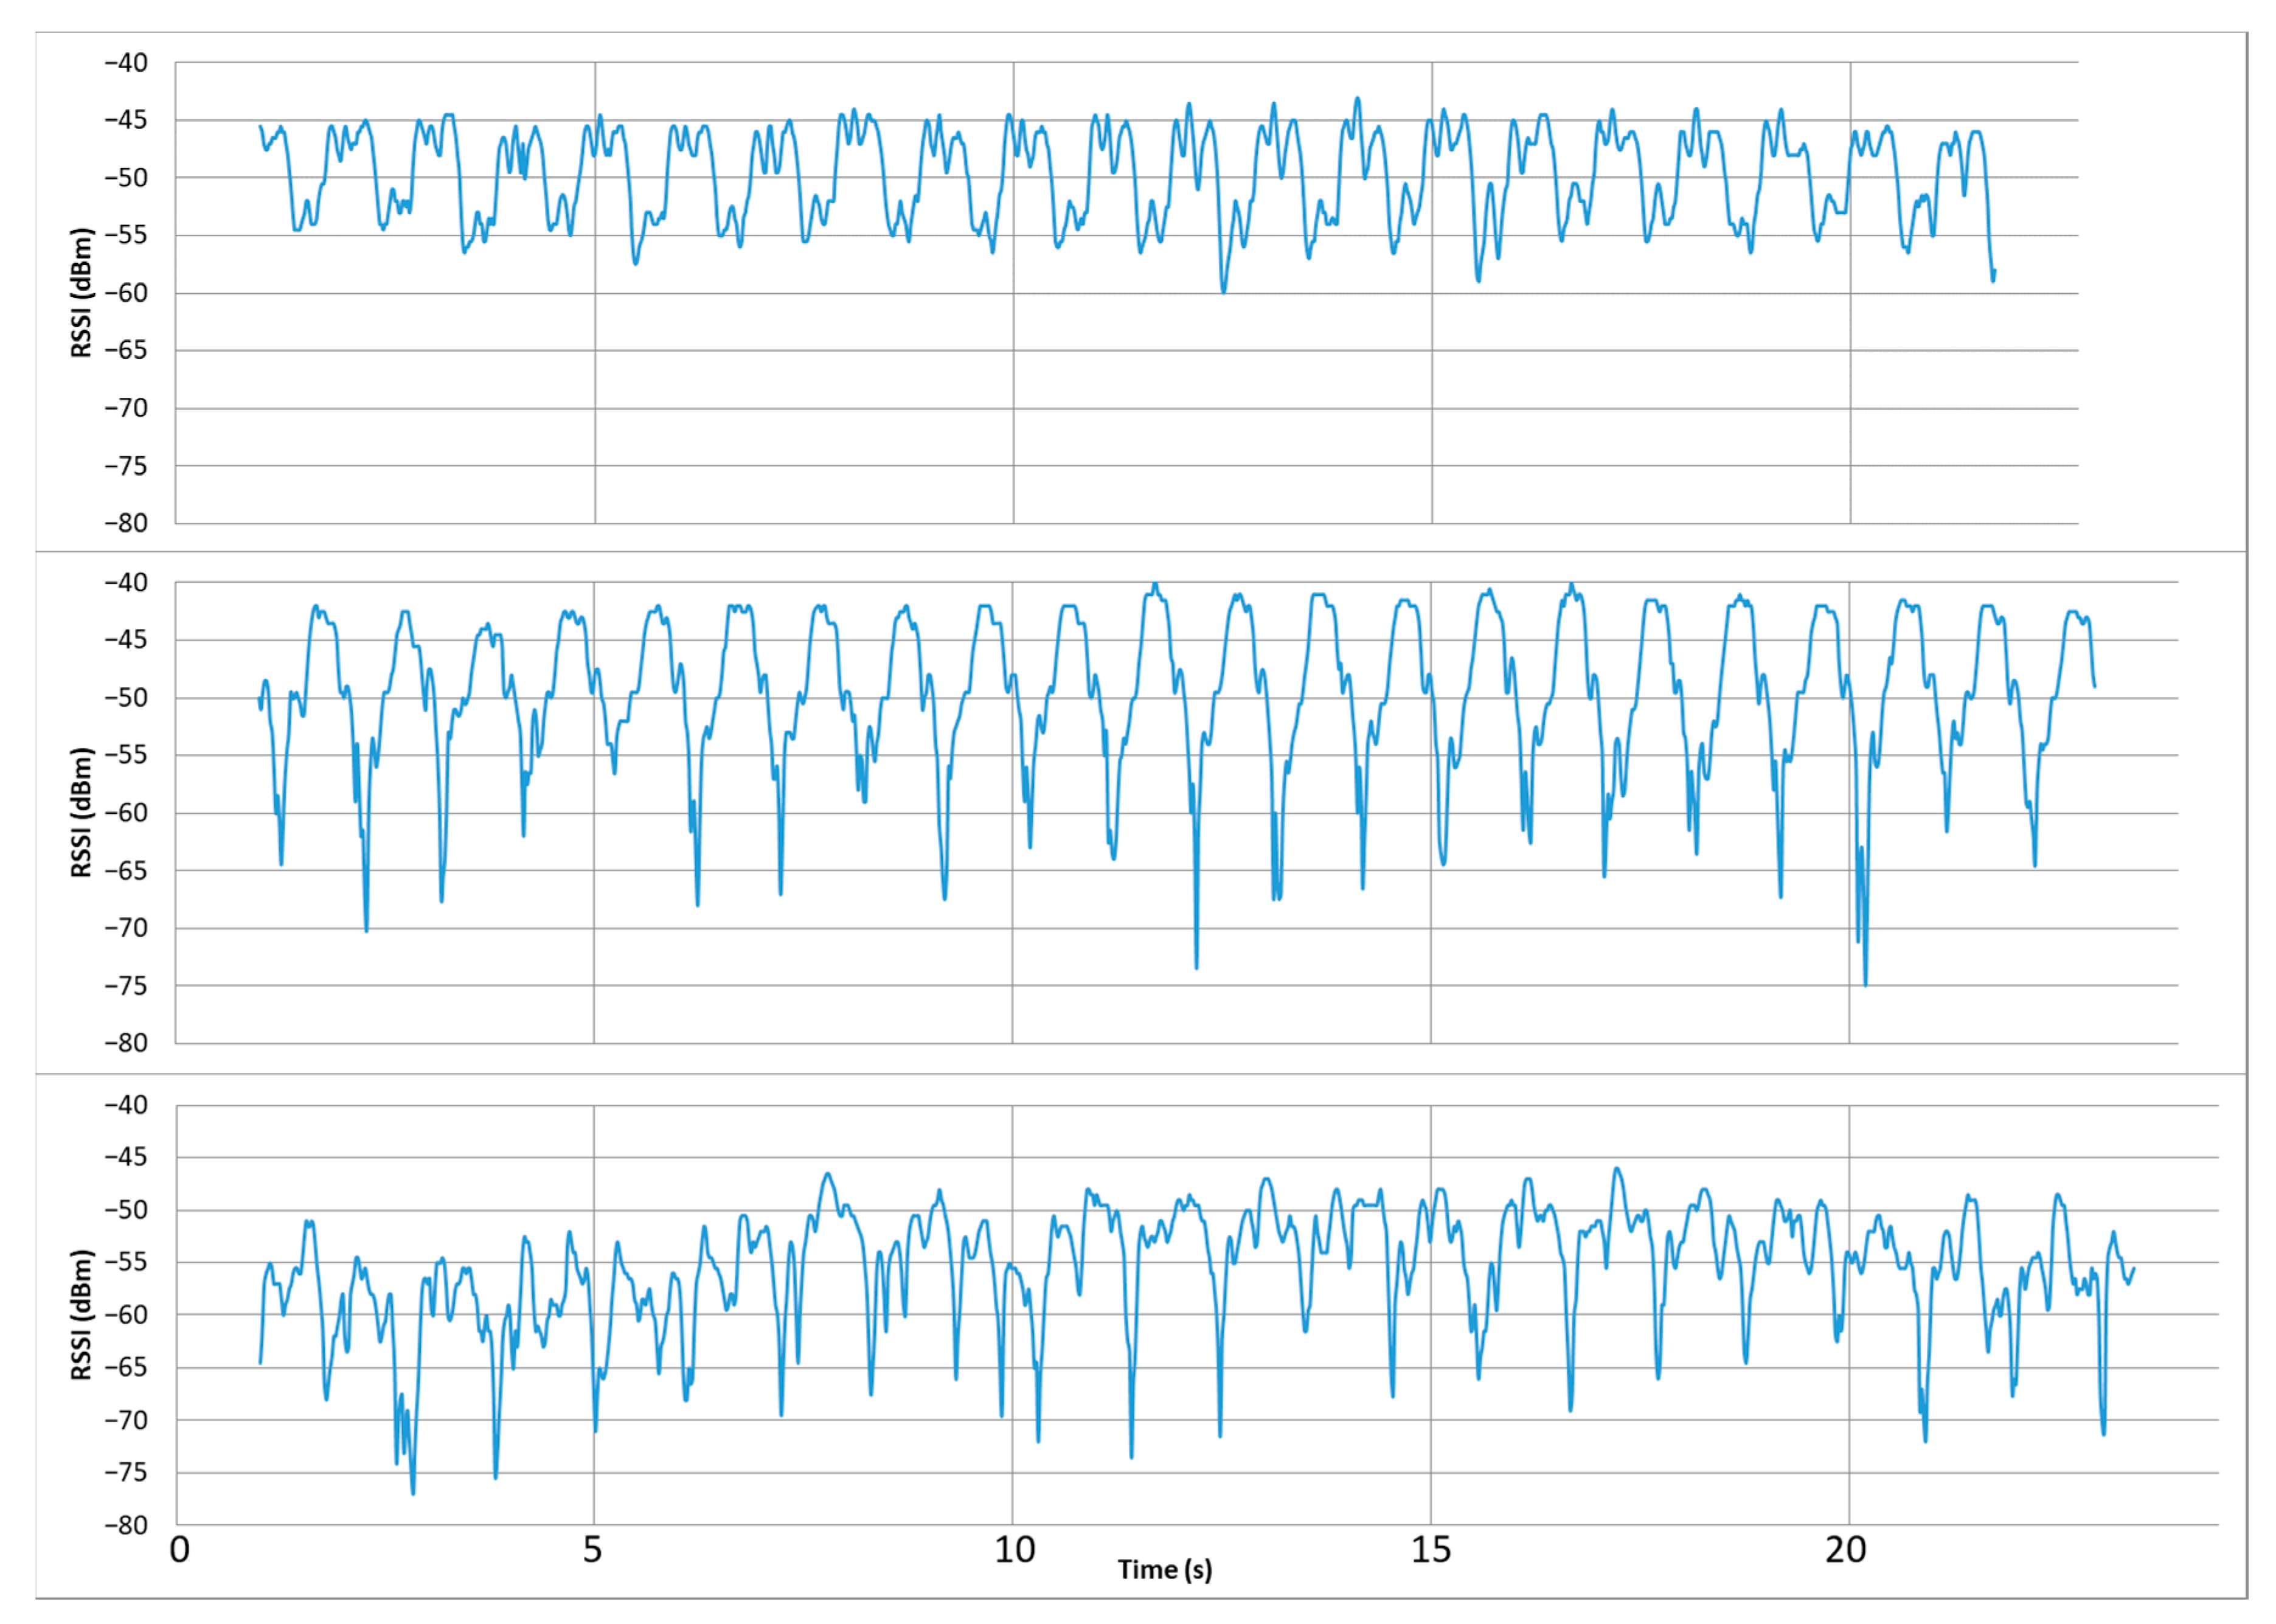
As in the cycling scenario, the RSSI variation with time clearly reflects the periodicity of the walking motion. Each iteration of the gait cycle, or stride, produces a distinctive peak shape with a maximum and minimum value that is periodically repeated at a rate equal to the subject’s walking cadence. Figure 14 shows the distinctive periodic shape of the RSSI metric for the three subjects on the 433 MHz band, with the sender node on the subjects’ wrist, and with a transmit power of −2 dBm. It is clear that the different walking patterns—especially the arm swing—of the three people produce a distinct periodic peak shape in the RSSI curve. For instance, it can be inferred that Subject A swings her arm farther back than the other two, given that the nodes spend more time in NLOS, as reflected in the wider portion of the bottom part of her periodic shape. Oppositely, subjects B and C present periodic shapes, the minima of which are quasi-instant in time.
The walking speed and cadence of the three subjects is also reflected in the graphs, with Subject B having the highest cadence in steps/min as noted in Table 2. The width of the periodic peak shapes also explains the relationship between the walking speed and cadence; e.g., Subject C walks faster with a lower cadence due to his longer stride, resulting in a wider shape.
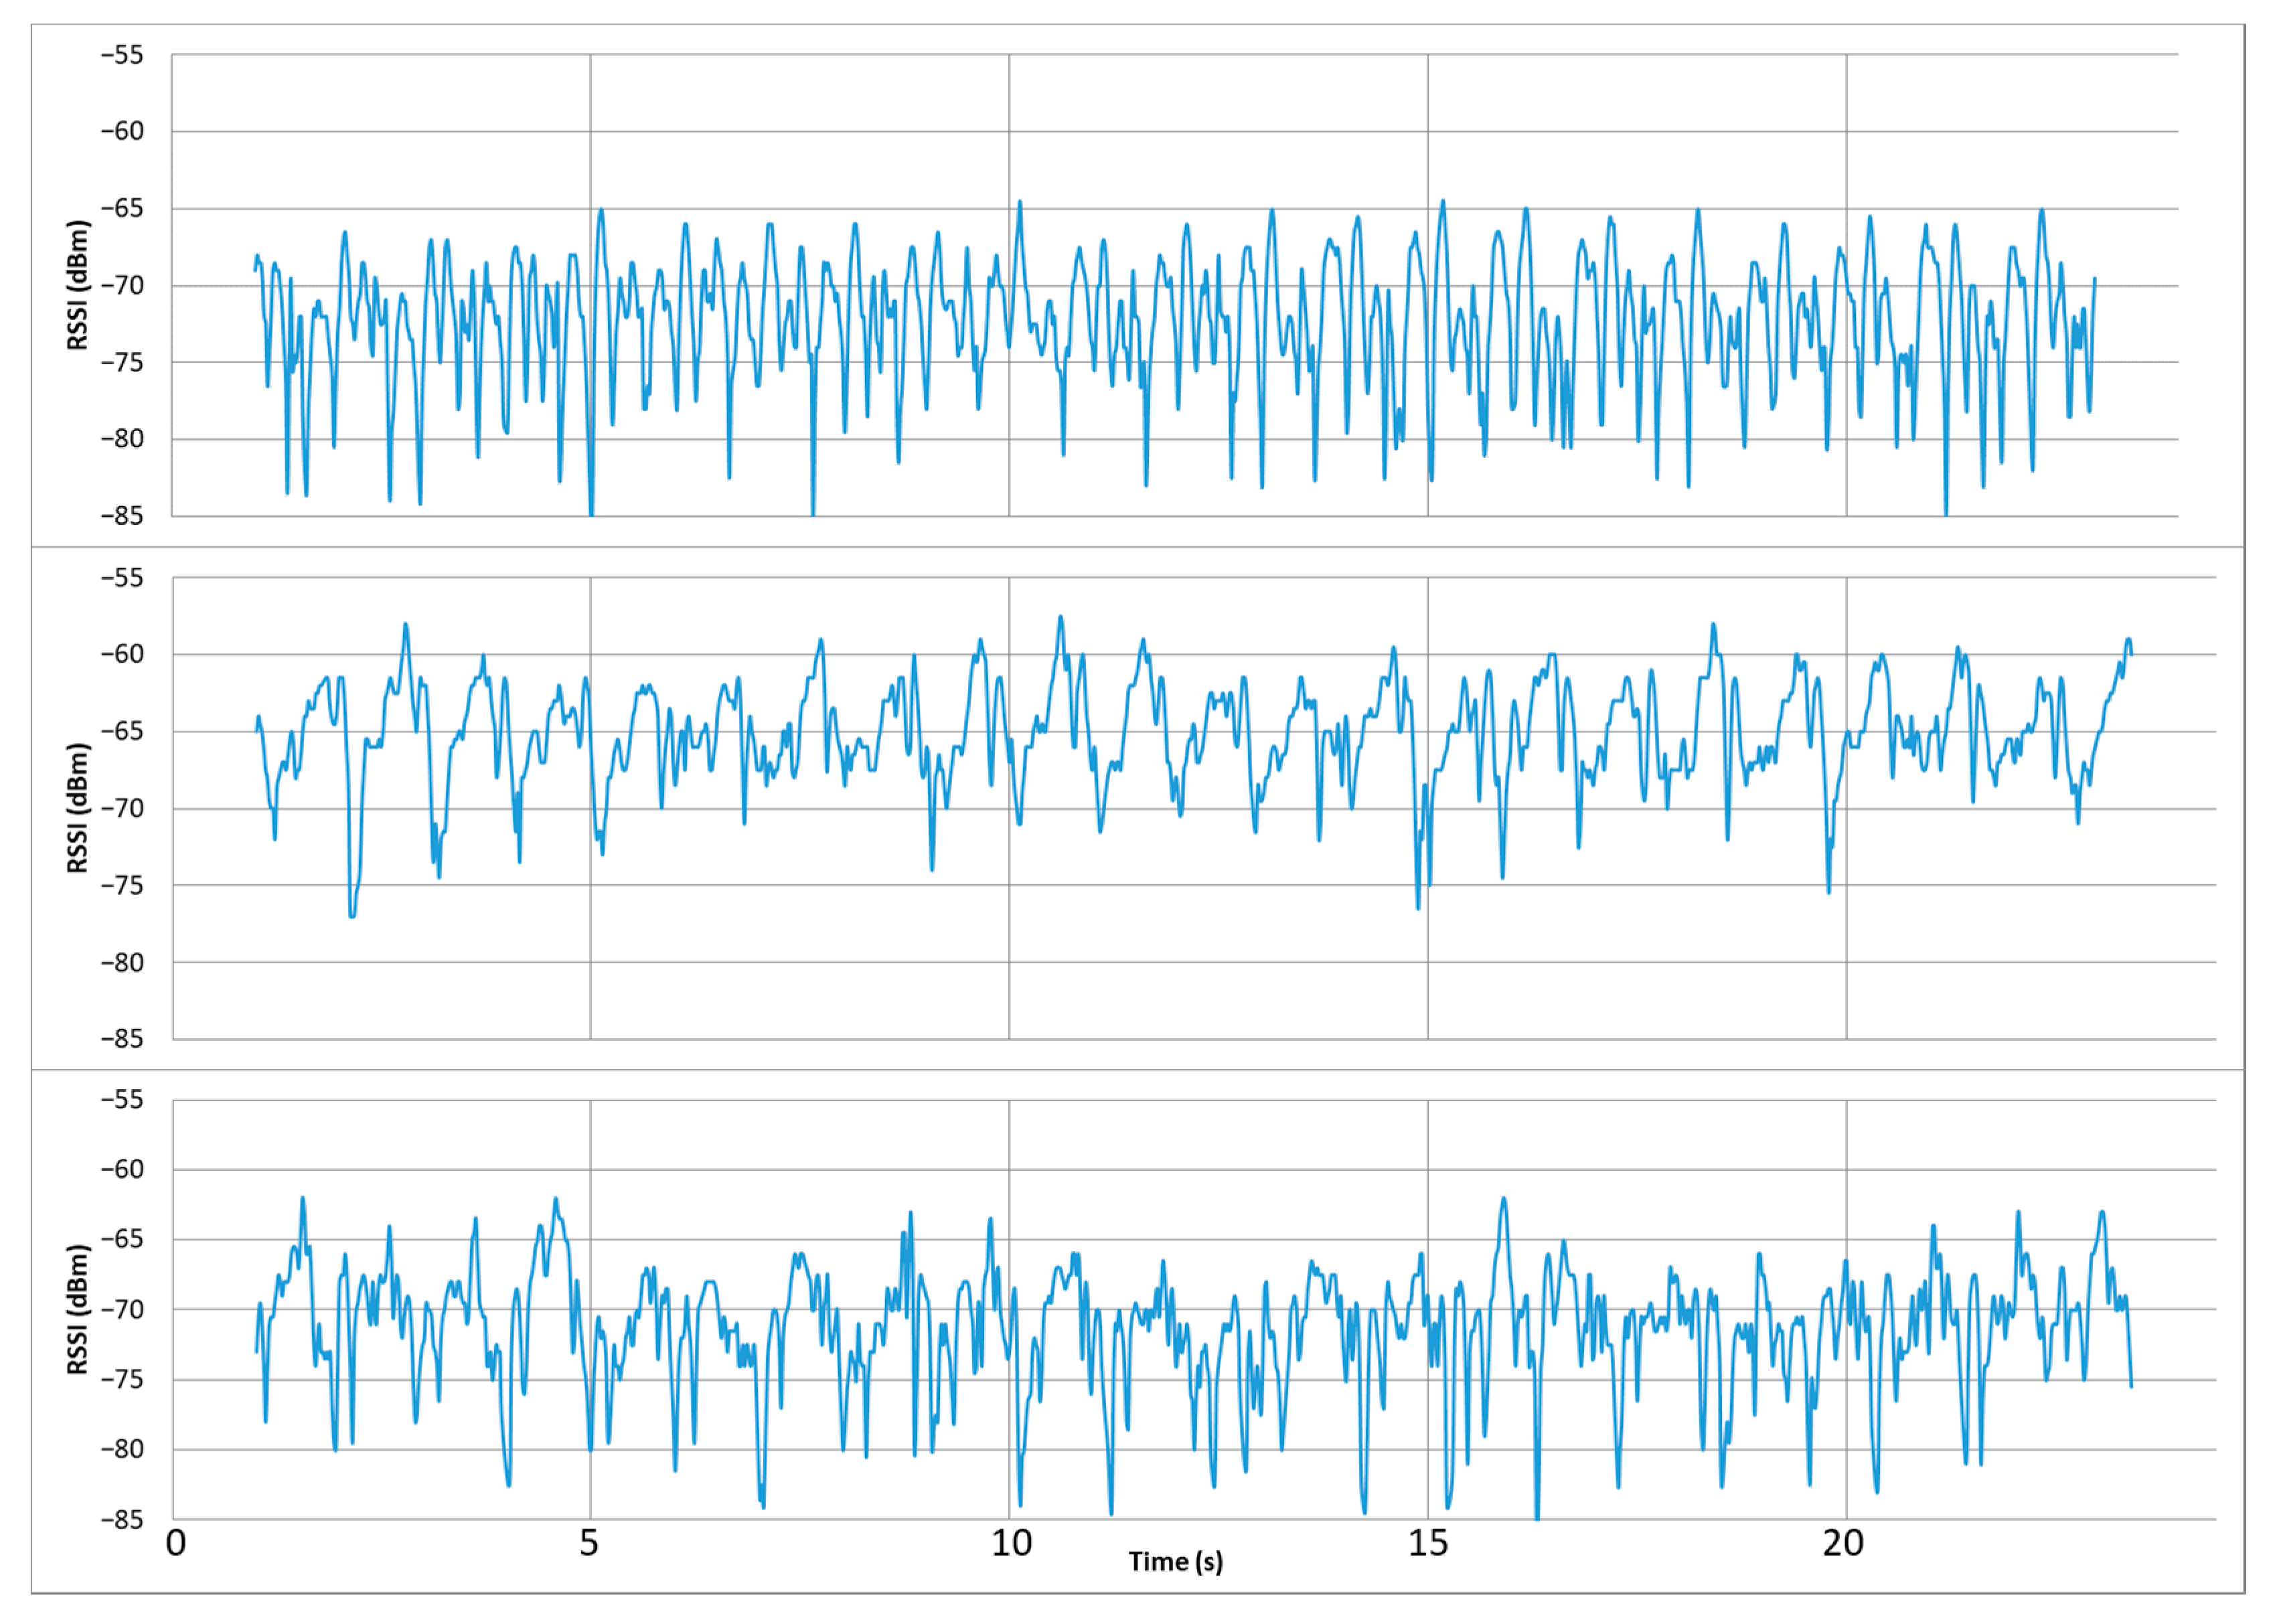
Figure 15 shows the RSSI variation with time for the three subjects on the 868 band, and with a transmit power level of −2 dBm, but with the sender node located on the right ankle. Comparing the RSSI periodic pattern for the wrist and ankle locations, the gait cycle can be better inferred from the former, which provides a clearer shape and an easier to extract periodicity. The same can be observed from other measurements in the dataset for other frequencies and transmit power values. Thus, strategies and algorithms that exploit the periodicity of the walking motion would benefit from being applied on wrist node positions, as has been suggested by other studies in the field [14].
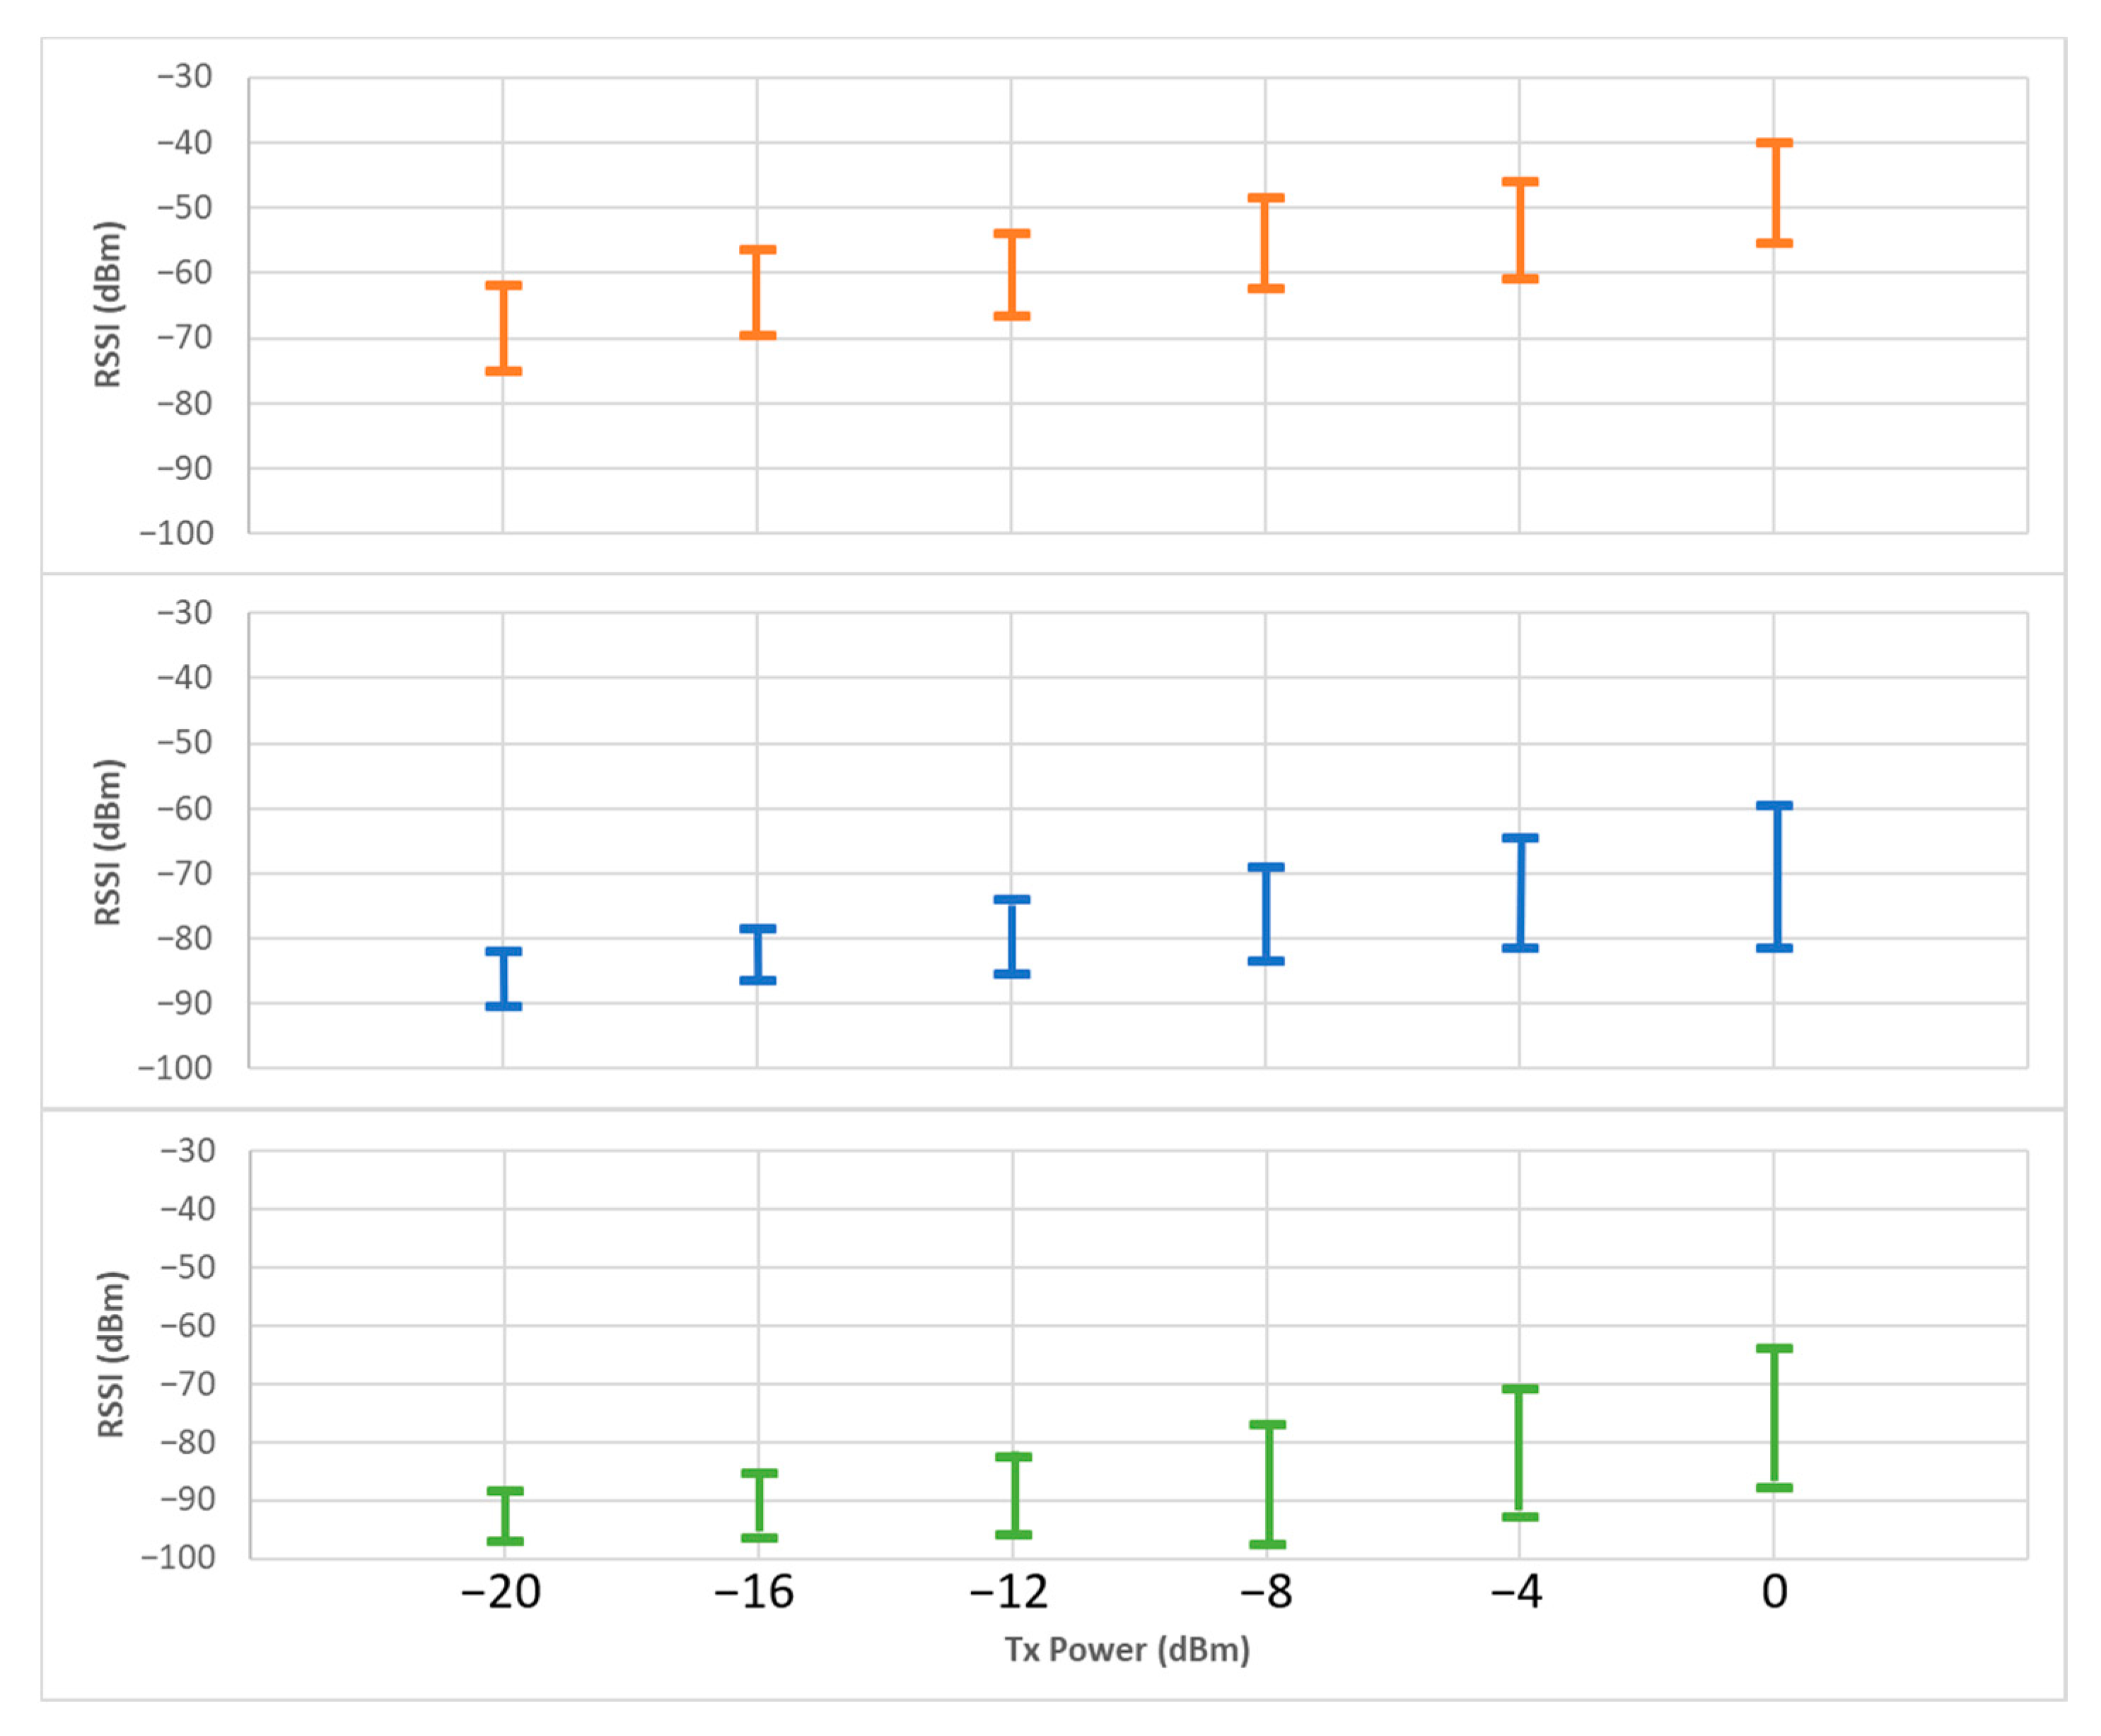
The transmit power level of the sender node has an effect on the shape of the RSSI periodic peaks. The higher the transmit power, the higher the RSSI, and the taller the periodic peak shape, with a greater range between its maximum and minimum values. Figure 16 shows this phenomenon for Subject A, for all the three frequency bands and with the sender node on the wrist location. As can be seen, this is more noticeable for the higher frequencies. Since the walking motion was maintained in a uniform manner for the duration of the experiment, the percentage of time in LOS and NLOS does not change with transmit power. Observing the charts, it can be seen that the average maximum value of the periodic shape increases more significantly with the increase in transmit power than the case of the average minimum. This suggests that an increase in transmit power has a higher impact on the LOS part of the gait cycle, affecting the NLOS transmission in a much weaker way, when body tissue obstructs the signal path.
4. Discussion
The performance of WBAN channels has been empirically characterized by means of two well-known metrics: RSSI and PRR. Three different bands—433 MHz, 868 MHz and 2.4 GHz—have been used to evaluate the effect of the frequency on the WBAN channel conditions. All experiments confirm the theoretical notions derived from path loss equations, with the lower frequencies performing better in terms of RSSI.
The tests presented in this work have also confirmed the correlation between the RSSI and PRR metrics for most scenarios and experimental conditions. A higher average RSSI results in a higher PRR for a given frequency and transmit power. However, as was mentioned in the introduction and stated in [7], this is not the case when the packet loss is caused by interference rather than attenuation. In our experiments, this happens on the 2.4 GHz band in several environments, e.g., the sitting scenario, where interference and multipath effects result in a decreased PRR metric even for RSSI values above the receiver sensitivity. The 2.4 GHz band also seems to be much more negatively impacted by the presence of body parts on the signal path than the other two frequencies, as seen for the two different node placements in the standing and sitting scenarios.
Two dynamic physical activities—cycling and walking—were evaluated in order to study the periodic time-variant characteristics of their WBAN channels. The walking motion has been the subject of several studies in the field [5,14,15]. However, to the best of our knowledge, this is the first time that cycling activity has been evaluated in the context of WBAN channel characterization. As predicted, the repetitive nature of these body motions is reflected on the RSSI variation with time of WBAN links. Our results have confirmed this, being able to extract periodic patterns for several test conditions and subjects. An important contribution of this work is introducing the frequency band and node placement as independent variables to test their impact on the RSSI periodicity patterns of the different activities. More importantly, the influence of the subject wearing the WBAN has been characterized. Our results show that the RSSI periodic pattern of the walking activity is extremely dependent on the particular subject. This should be taken into consideration by algorithms and strategies focused on exploiting these periodic patterns for energy efficiency and link reliability. It is mandatory that the particular periodic RSSI shape is extracted and characterized for each subject and activity, instead of assuming an a priori expected curve.
Our study of the cycling and walking activities also demonstrated that the periodicity of WBAN links can be obtained and characterized by simply extracting the RSSI metric, without any extra information. For instance, the walking cadence can be calculated just by averaging the distance between consecutive minima in the RSSI vs. time curve. This means that periodicity-exploiting algorithms or even activity-detection applications can be used without the need for extra hardware resources, such as accelerometers. Since the RSSI is already available in most commercial transceivers from the data packets already being sent, without any extra computing, this allows the development of low-resource algorithms and strategies for WBAN that require very few control packets and have almost no overhead.
All experiments have been performed with a custom hardware test platform with wireless commercial transceivers in three ISM bands. All the tests have also taken place in normal indoor and outdoor environments with regular conditions in terms of possible interfering equipment. This has been done in order to characterize the WBAN channels under their real use conditions, where potential algorithms and strategies are supposed to function. In the future, it would be interesting to characterize the performance of these same three bands but using different hardware or different antenna configurations, in order to further study and isolate the influence of the frequency.
5. Conclusions
An empirical evaluation of the performance of various WBAN links in several everyday scenarios and activities has been carried out in this work. Two static activities, standing and sitting, and two dynamic activities, cycling and walking, were characterized in terms of the RSSI and PRR metrics. During the experiments, the effects of several parameters and variables on these metrics were studied and characterized. In particular, we analyzed the impact of the frequency band, transmit power, node placement and, for the walking activity, the effect of the different cadence and gait cycle of three subjects.
The results of this work have empirically shown a correspondence—in terms of reliability—between wireless channel variations and particular motions and postures of different activities. Specifically, our experiments have characterized the negative effect of body tissue interrupting the signal path and increasing the NLOS part of wireless links, confirming the theoretical assumption derived from path loss equations.
A key contribution of this work is to provide researchers with an empirical performance benchmark of WBAN channels under different conditions, activities and scenarios. Future designers of WBANs can use this information to adapt their strategies and algorithms to these characteristics.
Supplementary Materials
The following are available online at https://www.mdpi.com/article/10.3390/app11072920/s1. The complete dataset of measurements for all scenarios is available online at http://elb105.com/wban-characterization/, accessed on 25 March 2021.
Author Contributions
Conceptualization, A.R., A.A. and J.M.R.; methodology, A.R., A.A. and J.M.R.; software, A.R.; validation, A.R., A.A. and J.M.R.; formal analysis, A.R.; investigation, A.R.; resources, A.R., A.A. and J.M.R.; data curation, A.R.; writing—original draft preparation, A.R.; writing—review and editing, A.R., A.A. and J.M.R.; visualization, A.R.; supervision, A.A. and J.M.R.; project administration, A.A.; funding acquisition, A.A. All authors have read and agreed to the published version of the manuscript.
Funding
This research was partially funded by the Spanish Ministry of Science and Innovation, under CDTI program (ROBIM and BLANCOK projects), and by a grant from Universidad Politécnica de Madrid to fund Alba Rozas’ five-month research stay at the University of California, Berkeley.
Institutional Review Board Statement
Not applicable.
Informed Consent Statement
Informed consent was obtained from all subjects involved in the study.
Data Availability Statement
The data presented in this study are available at the links provided in the Supplementary Material section above.
Acknowledgments
The authors want to thank the members of the Berkeley Wireless Research Center (BWRC) and B105 Electronic Systems Lab for their help and guidance, especially Ali Moin for his inspiring research in the field and Roberto Rodríguez-Zurrunero for developing the test platform. They also would like to thank friends and family members that helped with measurements during the COVID-19 lockdown periods, especially Lola Cid who served as a subject for some of the experiments.
Conflicts of Interest
The authors declare no conflict of interest. The funders had no role in the design of the study; in the collection, analyses, or interpretation of data; in the writing of the manuscript, or in the decision to publish the results.
References
- Cavallari, R.; Martelli, F.; Rosini, R.; Buratti, C.; Verdone, R. A survey on wireless body area networks: Technologies and design challenges. IEEE Commun. Surv. Tutor. 2014, 16, 1635–1657. [Google Scholar] [CrossRef]
- Rabaey, J.M. The Human Intranet—Where Swarms and Humans Meet. IEEE Pervasive Comput. 2015, 14, 78–83. [Google Scholar] [CrossRef]
- Ullah, S.; Shen, B.; Riazul Islam, S.M.; Khan, P.; Saleem, S.; Kwak, K.S. A study of MAC protocols for WBANs. Sensors 2010, 10, 128–145. [Google Scholar] [CrossRef] [PubMed]
- Xiao, S.; Dhamdhere, A.; Sivaraman, V.; Burdett, A. Transmission power control in body area sensor networks for healthcare monitoring. IEEE J. Sel. Areas Commun. 2009, 27, 37–48. [Google Scholar] [CrossRef]
- Huang, X.; Wu, Y.; Ke, F.; Liu, K.; Ding, Y. An Energy-Efficient and Reliable Scheduling Strategy for Dynamic WBANs with Channel Periodicity Exploitation. IEEE Sens. J. 2020, 20, 2812–2824. [Google Scholar] [CrossRef]
- Moin, A.; Thielens, A.; Araujo, A.; Sangiovanni-Vincentelli, A.; Rabaey, J.M. Adaptive Body Area Networks Using Kinematics and Biosignals. IEEE J. Biomed. Health Inform. 2020. [Google Scholar] [CrossRef] [PubMed]
- Kim, S.; Kim, S.; Eom, D.S. RSSI/LQI-based transmission power control for body area networks in healthcare environment. IEEE J. Biomed. Health Inform. 2013, 17, 561–571. [Google Scholar] [CrossRef] [PubMed]
- Takabayashi, K.; Tanaka, H.; Sugimoto, C.; Sakakibara, K.; Kohno, R. Performance evaluation of a quality of service control scheme in multi-hop WBAN based on IEEE 802.15.6. Sensors 2018, 18, 3969. [Google Scholar] [CrossRef] [PubMed]
- Patel, M.; Wang, J. Applications, challenges, and prospective in emerging body area networking technologies. IEEE Wirel. Commun. 2010, 17, 80–88. [Google Scholar] [CrossRef]
- Son, D.; Krishnamachari, B.; Heidemann, J. Experimental study of the effects of transmission power control and blacklisting in wireless sensor networks. In Proceedings of the 2004 First Annual IEEE Communications Society Conference on Sensor and Ad Hoc Communications and Networks, 2004. IEEE SECON 2004, Santa Clara, CA, USA, 4–7 October 2004; pp. 289–298. [Google Scholar] [CrossRef]
- Srinivasan, K.; Levis, P. RSSI is Under Appreciated. In Proceedings of the Third Workshop on Embedded Networked Sensors (EmNets), Cambridge, MA, USA, 30–31 May 2006; Volume 3031, p. 239242. [Google Scholar]
- Ryckaert, J.; De Doncker, P.; Meys, R.; de Le Hoye, A.; Donnay, S. Channel model for wireless communication around human body. Electron. Lett. 2004, 40, 543. [Google Scholar] [CrossRef]
- Quwaider, M.; Rao, J.; Biswas, S. Body-posture-based dynamic link power control in wearable sensor networks. IEEE Commun. Mag. 2010, 48, 134–142. [Google Scholar] [CrossRef]
- Roberts, N.E.; Oh, S.; Wentzloff, D.D. Exploiting Channel Periodicity in Body Sensor Networks. IEEE J. Emerg. Sel. Top. Circuits Syst. 2012, 2, 4–13. [Google Scholar] [CrossRef]
- Zang, W.; Li, Y. Gait-Cycle-Driven Transmission Power Control Scheme for a Wireless Body Area Network. IEEE J. Biomed. Health Inform. 2018, 22, 697–706. [Google Scholar] [CrossRef] [PubMed]
- Thielens, A.; Benarrouch, R.; Wielandt, S.; Anderson, M.; Moin, A.; Cathelin, A.; Rabaey, J. A Comparative Study of On-Body Radio-Frequency Links in the 420 MHz–2.4 GHz Range. Sensors 2018, 18, 4165. [Google Scholar] [CrossRef] [PubMed]
- Fort, A.; Desset, C.; Ryckaert, J.; De Doncker, P.; Van Biesen, L.; Wambacq, P. Characterization of the ultra wideband body area propagation channel. Int. J. Ultra Wideband Commun. Syst. 2005, 2005, 22–27. [Google Scholar] [CrossRef]
- Rodriguez-Zurrunero, R.; Utrilla, R.; Rozas, A.; Araujo, A. Process management in IoT operating systems: Cross-influence between processing and communication tasks in end-devices. Sensors 2019, 19, 805. [Google Scholar] [CrossRef] [PubMed]
- He, C.; Fan, X.; Li, Y. Toward ubiquitous healthcare services with a novel efficient cloud platform. IEEE Trans. Biomed. Eng. 2013, 60, 230–234. [Google Scholar] [CrossRef] [PubMed]
- Kirkup, J.A.; Rowlands, D.D.; Thiel, D.V. Indoor propagation investigation from a 2.4 GHz waist mounted beacon. Procedia Eng. 2013, 60, 188–194. [Google Scholar] [CrossRef]
Figure 1.
YetiMote node.

Figure 2.
Standing scenario, with the receiver node on the left hip and sender nodes on the right wrist (a) and right ankle (b). Sitting scenario, with the receiver node on the left hip and sender nodes on the right wrist (c) and right ankle (d).
Figure 2.
Standing scenario, with the receiver node on the left hip and sender nodes on the right wrist (a) and right ankle (b). Sitting scenario, with the receiver node on the left hip and sender nodes on the right wrist (c) and right ankle (d).

Figure 3.
Node positions in the cycling scenario: (a) point of minimum distance, (b) point of maximum distance.
Figure 3.
Node positions in the cycling scenario: (a) point of minimum distance, (b) point of maximum distance.

Figure 4.
Subjects of the walking scenario at various points in the experiment: (a) Subject A, (b) Subject B and (c) Subject C.
Figure 4.
Subjects of the walking scenario at various points in the experiment: (a) Subject A, (b) Subject B and (c) Subject C.

Figure 5.
Average receiver signal strength indicator (RSSI) in the standing scenario.

Figure 6.
Packet reception rate (PRR) in the standing scenario.

Figure 7.
Average RSSI in the sitting scenario.

Figure 8.
PRR in the sitting scenario.

Figure 9.
Performance metrics in the cycling scenario: (a) Average RSSI, (b) PRR.

Figure 10.
RSSI variation with time in the cycling scenario for the 433 MHz band for three different transmit power levels.
Figure 10.
RSSI variation with time in the cycling scenario for the 433 MHz band for three different transmit power levels.

Figure 11.
RSSI variation with time in the cycling scenario for 0 dBm of transmit power: (top) 433 MHz, (middle) 868 MHz, (bottom) 2.4 GHz.
Figure 11.
RSSI variation with time in the cycling scenario for 0 dBm of transmit power: (top) 433 MHz, (middle) 868 MHz, (bottom) 2.4 GHz.

Figure 12.
Average RSSI in the walking scenario for all subjects and frequencies: sender node located on the right wrist.
Figure 12.
Average RSSI in the walking scenario for all subjects and frequencies: sender node located on the right wrist.

Figure 13.
Average RSSI in the walking scenario for all subjects and frequencies: sender node located on the right ankle.
Figure 13.
Average RSSI in the walking scenario for all subjects and frequencies: sender node located on the right ankle.

Figure 14.
RSSI variation with time in the walking scenario for the three subjects on the 433 MHz band for −2 dBm of transmit power and with the sender node located on the right wrist: (top) Subject A, (middle) Subject B, (bottom) Subject C.
Figure 14.
RSSI variation with time in the walking scenario for the three subjects on the 433 MHz band for −2 dBm of transmit power and with the sender node located on the right wrist: (top) Subject A, (middle) Subject B, (bottom) Subject C.

Figure 15.
RSSI variation with time in the walking scenario for the three subjects on the 868 MHz band for −2 dBm of transmit power and with the sender node located on the right ankle: (top) Subject A, (middle) Subject B, (bottom) Subject C.
Figure 15.
RSSI variation with time in the walking scenario for the three subjects on the 868 MHz band for −2 dBm of transmit power and with the sender node located on the right ankle: (top) Subject A, (middle) Subject B, (bottom) Subject C.

Figure 16.
Effect of the transmit power on the height of the periodic RSSI peak shape for Subject A with the sender node on the wrist location. Average maximum and average minimum values for each power level: (top) 433 MHz, (middle) 868 MHz, (bottom) 2.4 GHz.
Figure 16.
Effect of the transmit power on the height of the periodic RSSI peak shape for Subject A with the sender node on the wrist location. Average maximum and average minimum values for each power level: (top) 433 MHz, (middle) 868 MHz, (bottom) 2.4 GHz.


Table 1.
Configuration of the wireless parameters of the test platform.
| Parameters | SPIRIT1 @ 433 MHz | SPIRIT1 @ 868 MHz | CC2500 @ 2.4 GHz |
|---|---|---|---|
| Center frequency | 433.05 MHz | 868.00 MHz | 2.41 GHz |
| Modulation scheme | GFSK 1 | GFSK | MSK 2 |
| Frequency deviation (GFSK) | 127 kHz | 127 kHz | - |
| Receiver bandwidth | 540 kHz | 540 kHz | 540 kHz |
| Bit rate | 250 kbps | 250 kbps | 250 kbps |
| Packet size | 64 bytes | 64 bytes | 64 bytes |
| Output power range | (−30 dBm, 11 dBm) | (−30 dBm, 11 dBm) | (−30 dBm, 1 dBm) |
| Receiver sensitivity 3 | −86 dBm | −92 dBm | −100 dBm |
| External antenna | ¼ wavelength whip | ¼ wavelength whip | - |
1 GFSK corresponds to Gaussian Frequency Shift Keying modulation. 2 MSK corresponds to Minimum Shift Keying modulation. 3 Data obtained empirically with external antennas mounted when applicable.
Table 2.
Characteristics and parameters of the three subjects in the walking experiment.
| Subject A | Subject B | Subject C | |
|---|---|---|---|
| Physical characteristics | Female, 33, 166 cm | Female, 56, 160 cm | Male, 42, 189 cm |
| Average speed | 5.9 km/h | 5.8 km/h | 6.5 km/h |
| Walking cadence 1 | 59 ± 2 steps/min | 61 ± 2 steps/min | 58 ± 2 steps/min |
| Distance LH-ground | 92 cm | 100 cm | 107 cm |
| Distance RW-ground | 83 cm | 87 cm | 97 cm |
| Distance RA-ground | 15 cm | 19 cm | 18 cm |
1 This parameter was calculated from the experiments, averaging all iterations for each subject. LH: left hip; RW: right wrist; RA: right ankle.
Publisher’s Note: MDPI stays neutral with regard to jurisdictional claims in published maps and institutional affiliations. |
© 2021 by the authors. Licensee MDPI, Basel, Switzerland. This article is an open access article distributed under the terms and conditions of the Creative Commons Attribution (CC BY) license (http://creativecommons.org/licenses/by/4.0/).
Share and Cite
MDPI and ACS Style
Rozas, A.; Araujo, A.; Rabaey, J.M. Analyzing the Performance of WBAN Links during Physical Activity Using Real Multi-Band Sensor Nodes. Appl. Sci. 2021, 11, 2920. https://doi.org/10.3390/app11072920
AMA Style
Rozas A, Araujo A, Rabaey JM. Analyzing the Performance of WBAN Links during Physical Activity Using Real Multi-Band Sensor Nodes. Applied Sciences. 2021; 11(7):2920. https://doi.org/10.3390/app11072920
Chicago/Turabian StyleRozas, Alba, Alvaro Araujo, and Jan M. Rabaey. 2021. "Analyzing the Performance of WBAN Links during Physical Activity Using Real Multi-Band Sensor Nodes" Applied Sciences 11, no. 7: 2920. https://doi.org/10.3390/app11072920
Note that from the first issue of 2016, this journal uses article numbers instead of page numbers. See further details here.