
Modeling of Railway Stations Based on Queuing Networks


Matrosov Institute for System Dynamics and Control Theory of Siberian Branch of Russian Academy of Sciences (IDSTU SB RAS), 664033 Irkutsk, Russia
*
Author to whom correspondence should be addressed.
Appl. Sci. 2021, 11(5), 2425; https://doi.org/10.3390/app11052425
Submission received: 12 February 2021
/
Revised: 2 March 2021
/
Accepted: 3 March 2021
/
Published: 9 March 2021
(This article belongs to the Special Issue Risk Assessment in Traffic and Transportation)
Abstract
:Among the micro-logistic transport systems, railway stations should be highlighted, such as one of the most important transport infrastructure elements. The efficiency of the transport industry as a whole depends on the quality of their operation. Such systems have a complex multi-level structure, and the incoming traffic flow often has a stochastic character. It is known that the most effective approach to study the operation of such systems is mathematical modeling. Earlier, we proposed an approach to transport hub modeling using multiphase queuing systems with a batch Markovian arrival process (BMAP) as an incoming flow. In this paper, we develop the method by applying more complex models based on queuing networks that allow us to describe in detail the route of requests within an object with a non-linear hierarchical structure. This allows us to increase the adequacy of modeling and explore a new class of objects—freight railway stations and marshalling yards. Here we present mathematical models of two railway stations, one of which is a freight railway station located in Russia, and the other is a marshalling yard in the USA. The models have the form of queuing networks with BMAP flow. They are implemented as simulation software, and a numerical experiment is carried out. Based on the numerical results, some “bottlenecks” in the structure of the studied stations are determined. Moreover, the risk of switching to an irregular mode of operation is assessed. The proposed method is suitable for describing a wide range of cargo and passenger transport systems, including river ports, seaports, airports, and multimodal transport hubs. It allows a primary analysis of the hub operation and does not need large statistical information for parametric identification.
1. Introduction
Railway stations (RS) provide the most critical operations for the organization of car flows: their processing and the formation of technical routes. The sustainability of the transport process and the capacity of the railway network as a whole directly depend on the successful operation of the railway stations [1,2]. Here, the reliability, safety, and efficiency of the stations are affected by both positive and negative factors. This fact becomes especially relevant at the design or modernization stage, when the real operational factors, in particular, the volume of incoming train flows, are unknown in advance. In this case, planning errors can seriously affect both traffic flows and the transport economy as a whole. Risk analysis here is an essential tool that can be used for evaluating the quality of service processes.
RS include many components, such as equipment, vehicles, structures, and various technical subsystems, as well as the interrelations between them. At the same time, they are affected by many random factors: weather conditions, equipment failure, human factors, etc. In other words, stations are complex systems, and the possibility to perform various full-scale experiments to study their operation (for obvious reasons) is minimal. In such conditions, the most effective way to analyze and assess the quality of station operations is mathematical modeling and computer simulation [3]. The use of such models both at the stage of project work and during dispatching control at stations allows one to make the correct management decisions. Moreover, we note that an adequate mathematical description of the subject domain is an important aspect for creating intelligent transport systems. Applying a suitable mathematical apparatus allows you to use computing resources more efficiently and improve the quality of decisions made.
Optimization models are the most popular in the transport industry. For example, book [4] provides an overview of rail freight transport planning models, including models for managing the flow of empty and loaded freight cars. Papers [5,6] concern models for optimizing train delivery time to the RS and the long-term plan of work at the RS. Articles [7,8] propose optimization models for the formation of multi-group trains and control of traffic flows. Article [9] describes a model for optimizing the size and structure of yards at the station to serve various cargo flows. Methods for optimizing the schedule and locating of urban transport stops, based on the multiobjective cellular genetic algorithm and the multiobjective evolutionary algorithm, respectively, are developed in [10,11]. The advantage of optimization models is that they allow you to show the movement of traffic flows within the considered system and find the best solution in the sense of the chosen criterion. However, if significant random factors affect the system, one has to deal with a problem of stochastic optimization. Such problems are too complex to be solved (both analytically and numerically) and do not always allow us to obtain meaningful results for applications.
In this situation, a more rational way is to consider queuing theory models [12,13], as well as reliability theory ones [14] that use similar mathematics. The probabilistic models used here are best suited both for assessing various risks, which are usually stochastic in nature and for identifying critical important elements in the design of a technical system, taking into account the required level of service [13,14,15]. Such models are not conventional in the transport domain; they often appear in the field of information [16] and telecommunication technologies [17,18,19]. However, in the field of transport logistics, such models are known. Thus, the German scientist G. Potthoff in the classical monograph [20] showed the suitability of using probability theory methods in operational work. Queuing theory plays here a special role [21,22]. It is known that queuing systems (QS) are well suited to the study of objects in which the same type of activity is regularly repeated [20,21]. Therefore, it can describe any micro logistic systems, which, firstly, are characterized by repeated execution of standard technological operations, and secondly, the incoming flow and its further processing have a stochastic character.
Such logistic systems include railway stations and networks. Therefore, researchers quite often use queuing theory apparatus to describe and analyze them [23,24]. In [25,26,27,28,29], this theory is used to model and study the railway network and its particular sections. In [25], an analytical model is proposed for estimating train delays on the Australian rail network. The authors compare the calculation results with the results of simulating. Model validation, which is carried out using a real-life suburban train network consisting of 157 trains, shows the model estimates to be on average within 8% of those obtained from a large-scale simulation. Articles [26,27] present models of three lines of the Dutch railway network: from Rotterdam to Utrecht, from The Hague to Utrecht, and from Amersfoort to Zwolle. The models are designed to determine train delays, the capacity of rail networks, and a long-term global assessment of their efficiency without regard to train schedules. In these works, the authors use queuing networks with an infinite queue at each node to model the railway network. In [28], a model based on a single-channel queuing system is discussed and used to analyze railway lines’ capacity. It is, according to the authors, widely applied in Germany. Mean knock-on delays are used as a quality-dependent indicator of capacity, allowing to determine the admissible number of trains for a level of service prescribed. In [29], the authors deal with a queuing network for modeling the movement of suburban trains, where the network nodes are technical stations. The nodes are arranged sequentially, have a single channel, and a queue of finite length. The effective capacity of the railway and the distribution of train travel time are calculated based on the proposed model.
Queuing theory is also used to mathematically describe the operation of railway stations and other elements of railway infrastructure [30,31]. Therefore, in [30], a railway station model was created, and all its components are written as separate queues. It is also assumed that the arrival time and service time obey an Erlang distribution, and the queues are infinite. Paper [31] presents a mathematical model of the train disbanding by the hump. It has the form of a queuing system with the presence of failures and a final queue.
Articles [32,33,34] deal with the simulation of the railway hubs operation. In [32], the author uses Markov chains of a special type and calculates the queue length on the tracks adjacent to the railway hubs. In [33], the authors apply a quasi-birth-and-death process approach for the integrated modeling of capacity and reliability. By allowing for phase-type distributed arrival, service, and repair processes, the model permits a wide range of schedule and operational characteristics to be described. At the same time, the solvability of Markovian processes and the information on the queue length distribution are preserved. In article [34], railway nodes are divided up into a set of station tracks and the switching zones constituting a station’s “throats” (route nodes). The nodes are described in the form of multi-resource queues, and a system of equations to determine exactly the loss probabilities for a route node is suggested.
Queuing theory is used in scheduling transportation on railway transport, in particular, to predict the time of clearing the track for the passage of an oncoming train [35]. The proposed approach is based on the use of semi-Markov queuing systems. Using probabilistic models, it is also possible to estimate the capacity, the probability of system overflow, and the loss probability (refuse to service an incoming request), i.e., the most significant system operation risks [15].
For completeness, it should be noted that QS are not the only models that can consider the influence of random factors on railway transport operation. Other types of probabilistic models can be found in the scientific literature [36,37], in particular, the job shop models and the delay propagation models [24,38,39].
Through this review, we want to emphasize that, firstly, at present, the apparatus of the queuing theory is often used in world practice to study railway transport. Secondly, our study presented below combines and develops ideas above as follows:
Based on the mathematical apparatus of queuing theory, we developed a method for modeling the operation of passenger transport systems [40,41]. In the proposed method, multiphase QS are applied to describe the system structure [12,13], and the BMAP model (Batch Markovian Arrival Process) to specify the incoming transport flow [42]. It is suitable for describing systems with a linear structure, i.e., in which service devices (subsystems) are arranged sequentially, and requests (passengers) are served once in each one. Unfortunately, as will be shown later, RS do not always have a similar (simple) structure.
This paper develops the method by applying more complex models based on queuing networks (QN) [12,13]. QN allow us to define in detail the route of requests within an object with a non-linear hierarchical structure [29,30], as well as to describe a new class of systems—freight railway stations and marshalling yards. Here the functioning process of RS of a general form is considered, and its generalized mathematical model, which has the form of a queuing network, is constructed. Mathematical models of two RS are presented. The first one is a freight railway station located in Russia. The second one is a marshalling yard located in Nebraska (USA). They are implemented as simulation software, and a numerical experiment is carried out. We determine the probability of failure of an incoming train and “bottlenecks” in the structure of the studied stations based on the numerical results and make recommendations for their elimination.
2. Subject Model
The organization of work at the railway station is determined by the technological process, which includes the following steps [1,2,22]:
- train acceptance at the receiving yard, where it is fastened and processed technically and commercially;
- train movement to the hump;
- accumulation of cars at the sorting bowl to train integrity and performing operations to finalize the train formation;
- supply of the cars to the cargo yard, where cargo operations such as reception, loading, unloading, delivery to recipients and storage are carried out;
- cars handling at the cargo yard and its transfer to departure yard or receiving yard;
- repeating steps 2–5 for the local car flow (if necessary) from the cargo yard;
- train movement to the departure yard and its cars handling, arrival and accession of the locomotive, and departure of the train.
The system parameters that are not explicitly taken into account in the model are as follows: train formation plan, railway tracks specialization, time for fastening the rolling stock. The first parameter governs the formation of all categories of car flows, including the order of their departures. The model considers only incoming car flow for even and odd directions. The second parameter is taken into account implicitly by the capacity of the yards. The third one is included in the train idle time at the receiving yard [2,22].
It is also typical for the railway system to have feedback loops; for example, the formed train remains in the sorting bowl until the track to the departure park is available.
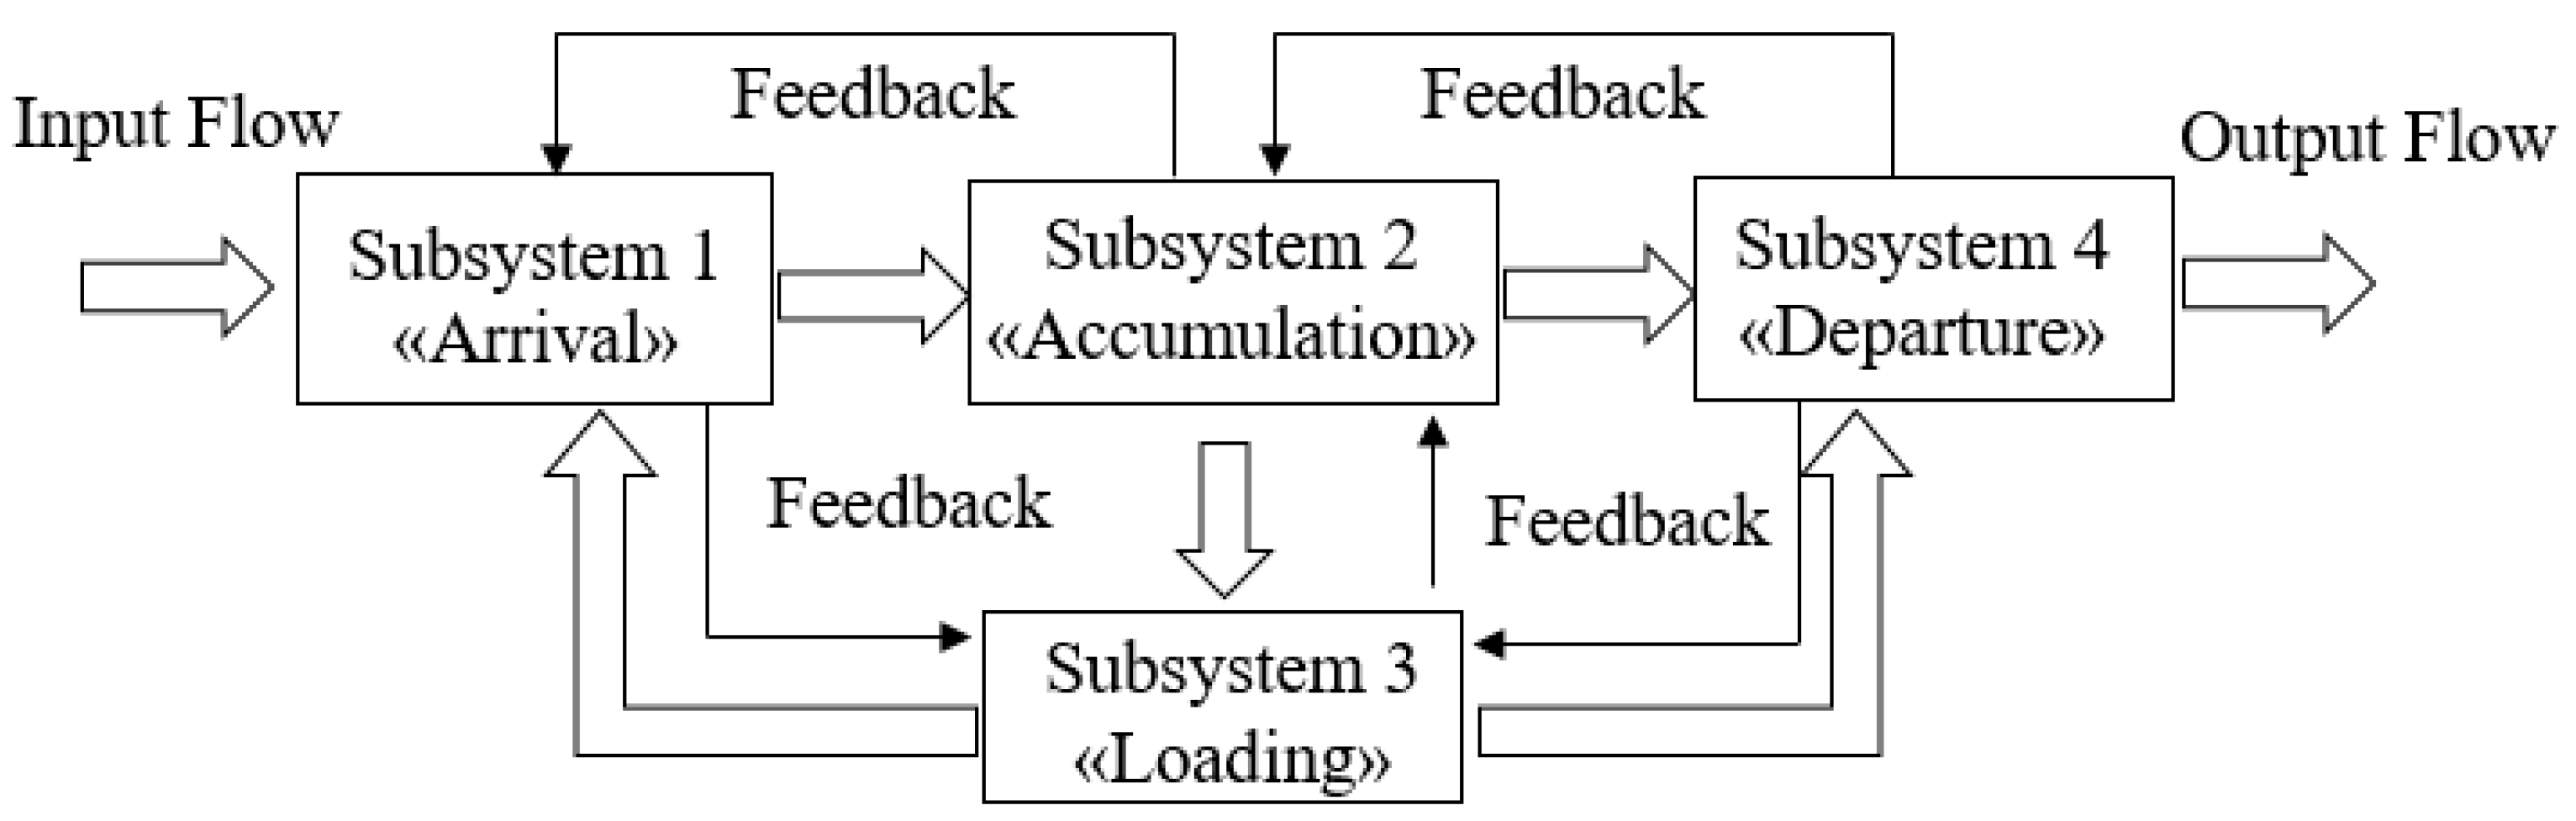
Based on the considered typical technological process of station operation, we separate the following functional subsystems (Figure 1):
- Subsystem 1 «Arrival» includes train acceptance, processing and breaking-up of a train at a hump (steps 1 and 2);
- Subsystem 2 «Accumulation» consists of an accumulation of cars to train integrity at the sorting bowl, their sorting and sending to the cargo yard (steps 3 and 4);
- Subsystem 3 «Loading» includes car processing at the cargo yard and transfer (if necessary) to the receiving yard for re-disbandment (steps 5 and 6);
- Subsystem 4 «Departure» is the final formation of the train and departure (step 7).
Note the feature of Subsystem 1. It contains a hump, which is the primary sorting device in the railway station, designed for the breaking-up of a train [1,2,22]. Therefore, this subsystem plays a crucial role in RS operations.
It can be argued that stations are complex objects that have a nonlinear hierarchical structure and a stochastic process of functioning. A suitable apparatus for describing such objects, as was noted in the introduction, is the queuing theory, in particular, queuing networks. Next, we present a mathematical description of a QN and design a general model of the RS operations.
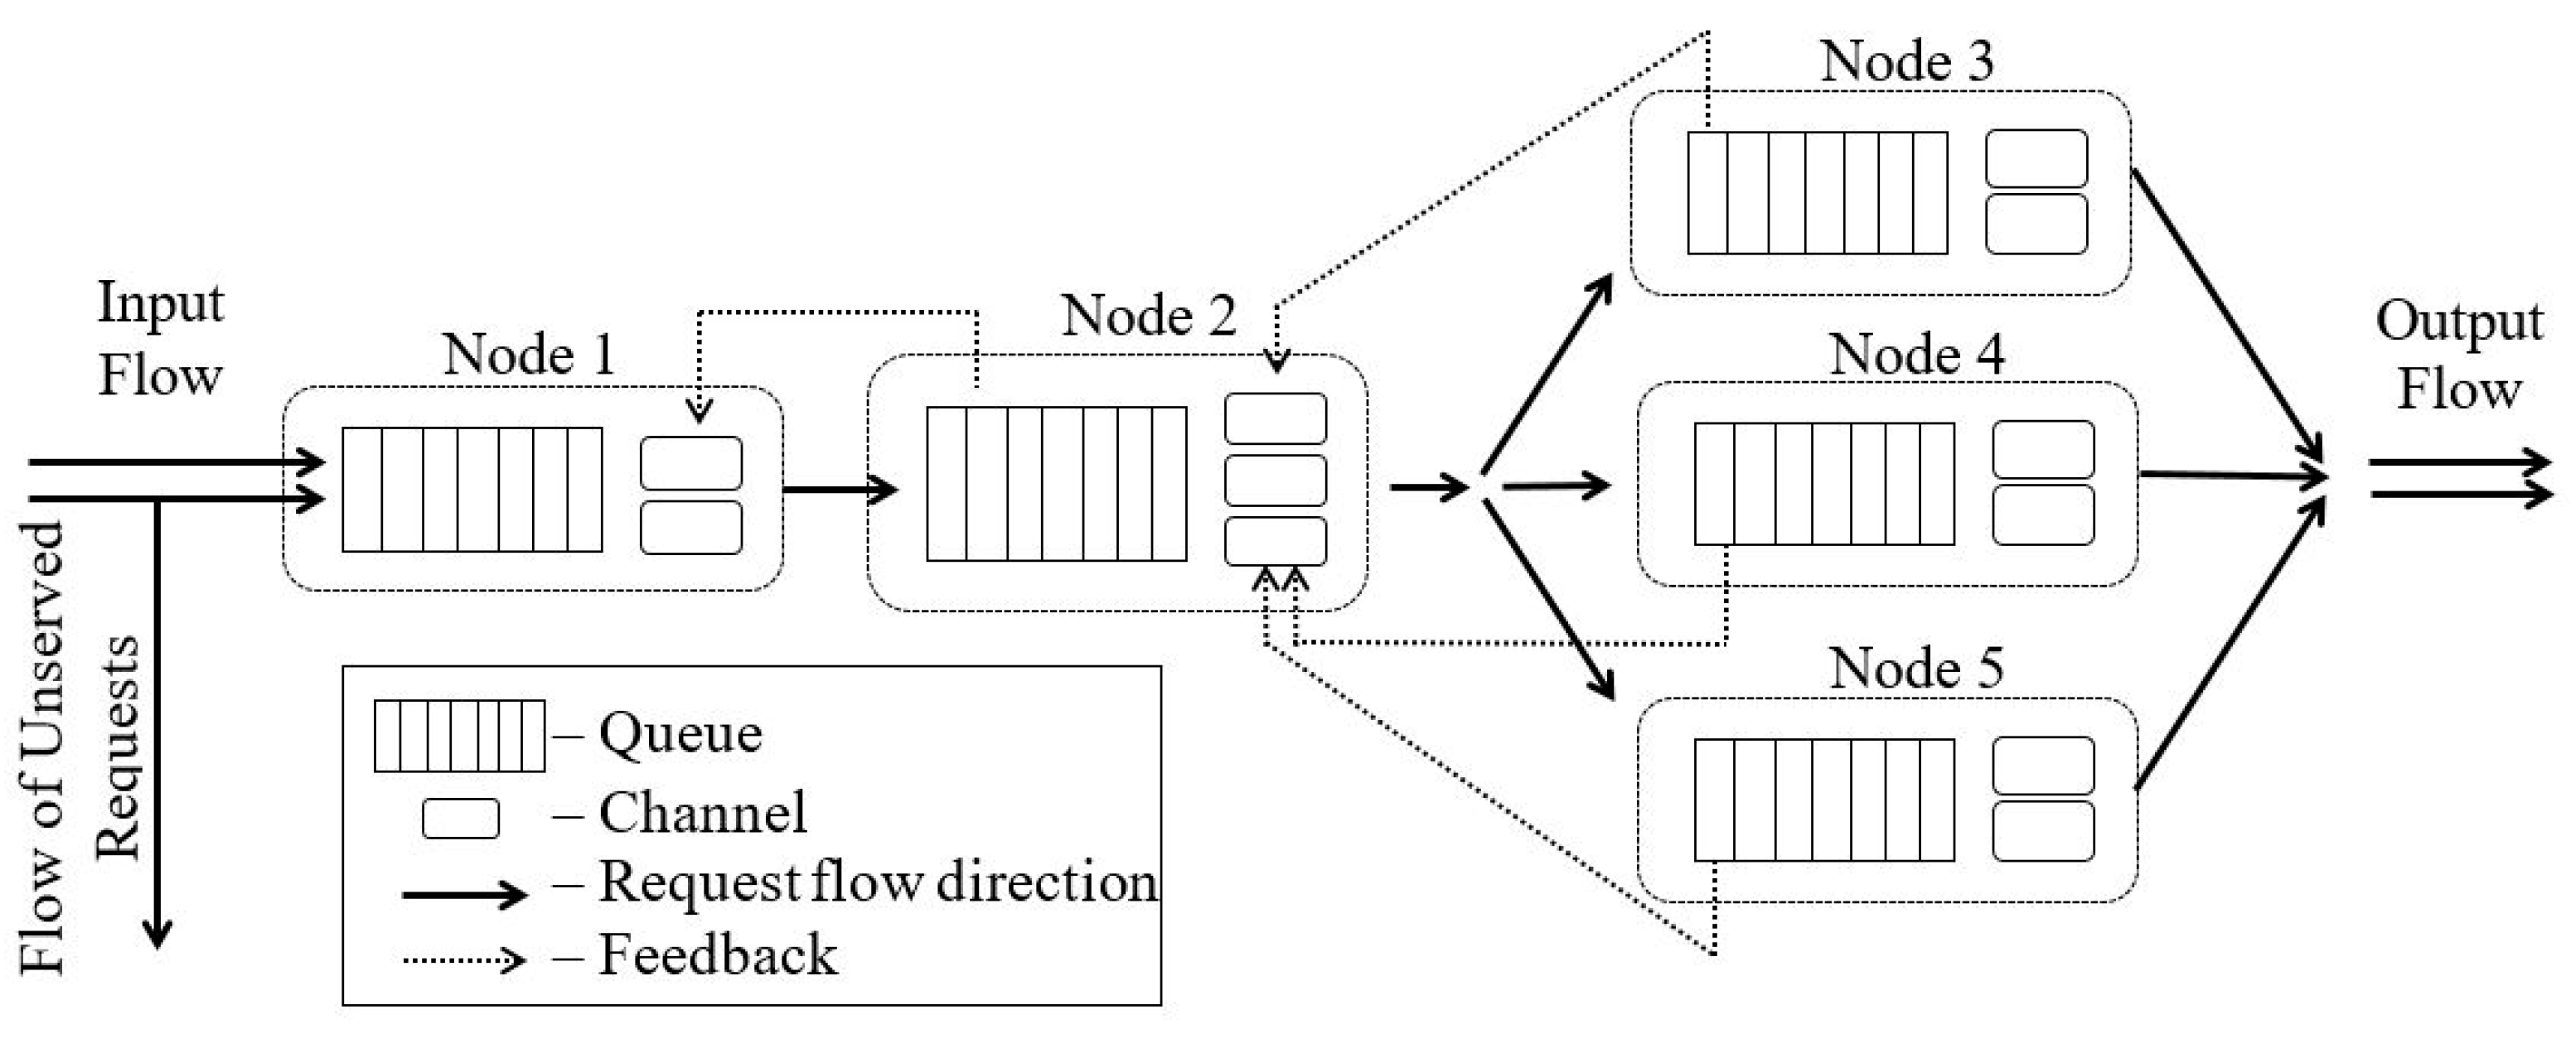
3. Mathematical Model
Queuing network is a generalization of a multiphase queuing system. It is the union of a finite number of QS (hereinafter referred to as nodes), in which requests move from one node to another in accordance with the routing matrix P [12,13]. We deal with open QN. It means that requests come from an external source. Then, if it is considered as an additional node with index 0, a route of a request is determined by a stochastic matrix . Here, P0j is the probability of an arriving request from the source to the j-th node; Pj0 is the probability of a request leaving from the QS after servicing at the j-th node; Pij is the probability of request transition from node i to node j (). It is obvious that .
Each node of QS is characterized by four parameters. In accordance with Kendall’s notation [12,13], they take the form A/B/m/n. Here, A describes the distribution of durations between each arrival to the queue, B is the distribution of service times for requests, m is the number of servers at the node and n is the buffer size. If the parameters of the arriving flow are unknown, then in the first position (symbol A) we put the symbol “*”. Next, it is assumed that at each node, requests are selected from the queue according to FIFO (First in, first out).
To design the mathematical model of the railway station, let us first describe the arriving flow and then consider the nodes of QN. The arriving train flow consists of flows of even and odd directions, the parameters of which may differ significantly. The train should be considered as a group of requests since the cars are serviced independently. To describe such a flow, we use BMAP [42], which allows us to combine several incoming flows with different characteristics into a single structure.
BMAP is a generalization of the group Poisson process, allowing the change in the intensity of the arrival of request groups, but keeping the basic Markov structure. We have a Markov chain with continuous time and state space {0,1,…,W}. The intensity of arrival request groups depends on the state number of the Markov chain . The residence time in each state is exponentially distributed with parameter . With probability the chain can go to state . This generates a group of random size k ≥ 0. The normalization condition is satisfied:
The transitions intensities are written in matrix form:
According to the subject model described in the previous section, the railway station includes four subsystems (S = 4). Each of them is represented in the form of QS, the numerical parameters of which are determined by the characteristics of a particular system in the next section. Node 1 is «Arrival», Node 2 is «Accumulation», Node 3 is «Loading», and Node 4 is «Departure». The requests arrive only to Node 1. The acceptance policy is complete rejection. It means that if there is not enough space for at least one request from the group, then the whole group is rejected. Then the requests transit through the system in accordance with the scheme shown in Figure 1. The routing matrix has the following form:
If there is no free place in the queue of Nodes 2–4 for accepting the request from the previous Node, then the previous Node is temporarily blocked.
The routing matrix P1 shows that the probabilities of transferring a request from Node 2 to Nodes 3 and 4 are the same and equal to 0.5, as well as from Node 3 to Nodes 1 and 4. It is assumed since, first, we do not know the probability of separate car moving between subsystems in advance if there are two or more possible routings, and, second, to simplify the model. Anyway, in the computational experiment, this value can be considered as an algorithmic parameter. Generally speaking, according to the technological process [2,22,43], after servicing in Node 2, requests can go to Node 3, then again go to Node 2, and only then to Node 4. Such a route can be included in the model, for example, by introducing request types. In this case, the requests change the type in Node 3 in order to exclude the repeated transfer from Node 2. However, this greatly complicates the model and has little effect on its accuracy. Therefore, simplification seems justified.
Thus, for structural identification of the model, it is necessary to determine the number of nodes and specify the routing matrix P1. Parametric identification of the model in the form of QN consists of two stages. Firstly, the parameters of arriving BMAP flow are determined. Secondly, for each node, the number of channels, the distribution of service time, the number of places in the queue (required), and the nature of the incoming flow of requests (if possible) are determined.
The required parameters (effectiveness indicators) are the probability of failure, absolute throughput, the average time of the request in each node and in the system, channel blocking time, and some others (this depends on the modeling purposes).
The resulting model is challenging to study, and it seems to be impossible to find effectiveness indicators analytically for it. To find them, we use simulation modeling [3].
4. Simulation Model
To implement the mathematical model, a simulation model of QN is proposed. It is based on the following principles:
- The arriving flow consists of sequentially incoming groups of requests. The size of the group and the duration between each arrival to the system are random variables whose distribution law is set by the user.
- The system consists of S nodes. The requests transit from one node to another in accordance with the routing matrix P.
- Each node is a queuing system, which has mi servicing channels and ni places in the queue (i = 1, 2,…, S).
- Channels of each node work independently, and each channel has its own distribution of service time and the size of the serviced group.
- As soon as the channel completed the service, it receives a request from the queue (if there is one). If the line is empty, the channel goes into idle mode.
- Channels can be blocked to prevent loss of requests between nodes in case of system overflow.
The simulation model is implemented as the authors’ software module using Object Pascal programming language [40,41]. The main functions of the software module are generating the number of requests in arriving groups and the durations between arrivals; generating the service time and the number of simultaneously served requests in the channel; checking the system status for overflow; displaying the service process in graphical and tabular forms; saving the simulation results in MS Excel format.
The accuracy of the simulation model is evaluated on a series of three types of problem with known characteristics. The first one is m-channel QS with losses (Erlang problem). The second and the third ones are two- and three-phase QS with blockings and BMAP, respectively [44]. The performance indicators of the QS obtained by the designed simulation model are compared with those found by analytical formulas for each task. Based on the results of the comparison, it was found that for all types of problem, the maximum relative error does not exceed 4%.
The following sections describe model experiments in which the operation of real railway stations is studied. Each experiment includes a description of the station, the construction of its mathematical model in the form of QS, and the numerical simulation of the QS. The quality of operating of the selected station is evaluated based on the simulation results.
5. Simulation
We have selected two railway stations for testing the developed approach and the simulation model. The first station is Sukhovskaya, a freight station located on East Siberian railway, Russia; the second is Bailey Yard, a marshalling yard located in North Platt, NE, USA. The systems have different purposes. Freight stations provide mass loading and unloading of cargo. As a rule, they have relatively small car traffic; five trains per day arrive on Sukhovskaya on average. Such stations may perform some of the functions of marshalling yards. Marshalling yards are intended for mass disbanding of trains into separate groups of cars, sorting these groups in accordance with the further direction of movement as well as forming and dispatching new trains.
Let us consider the freight RS Sukhovskaya, which was selected for the following reasons. First, it is a standard station on the East Siberian Railway. Second, its structure includes a round route for cars moving, which complicates the study. As for Bailey Yard, it is one of the largest marshalling yards in the world and meets one of the modern directions of development, which is to maximize the automation of technical processes [45,46]. Besides, for both stations, it managed to get statistics on arriving train traffic.
5.1. Sukhovskaya Station
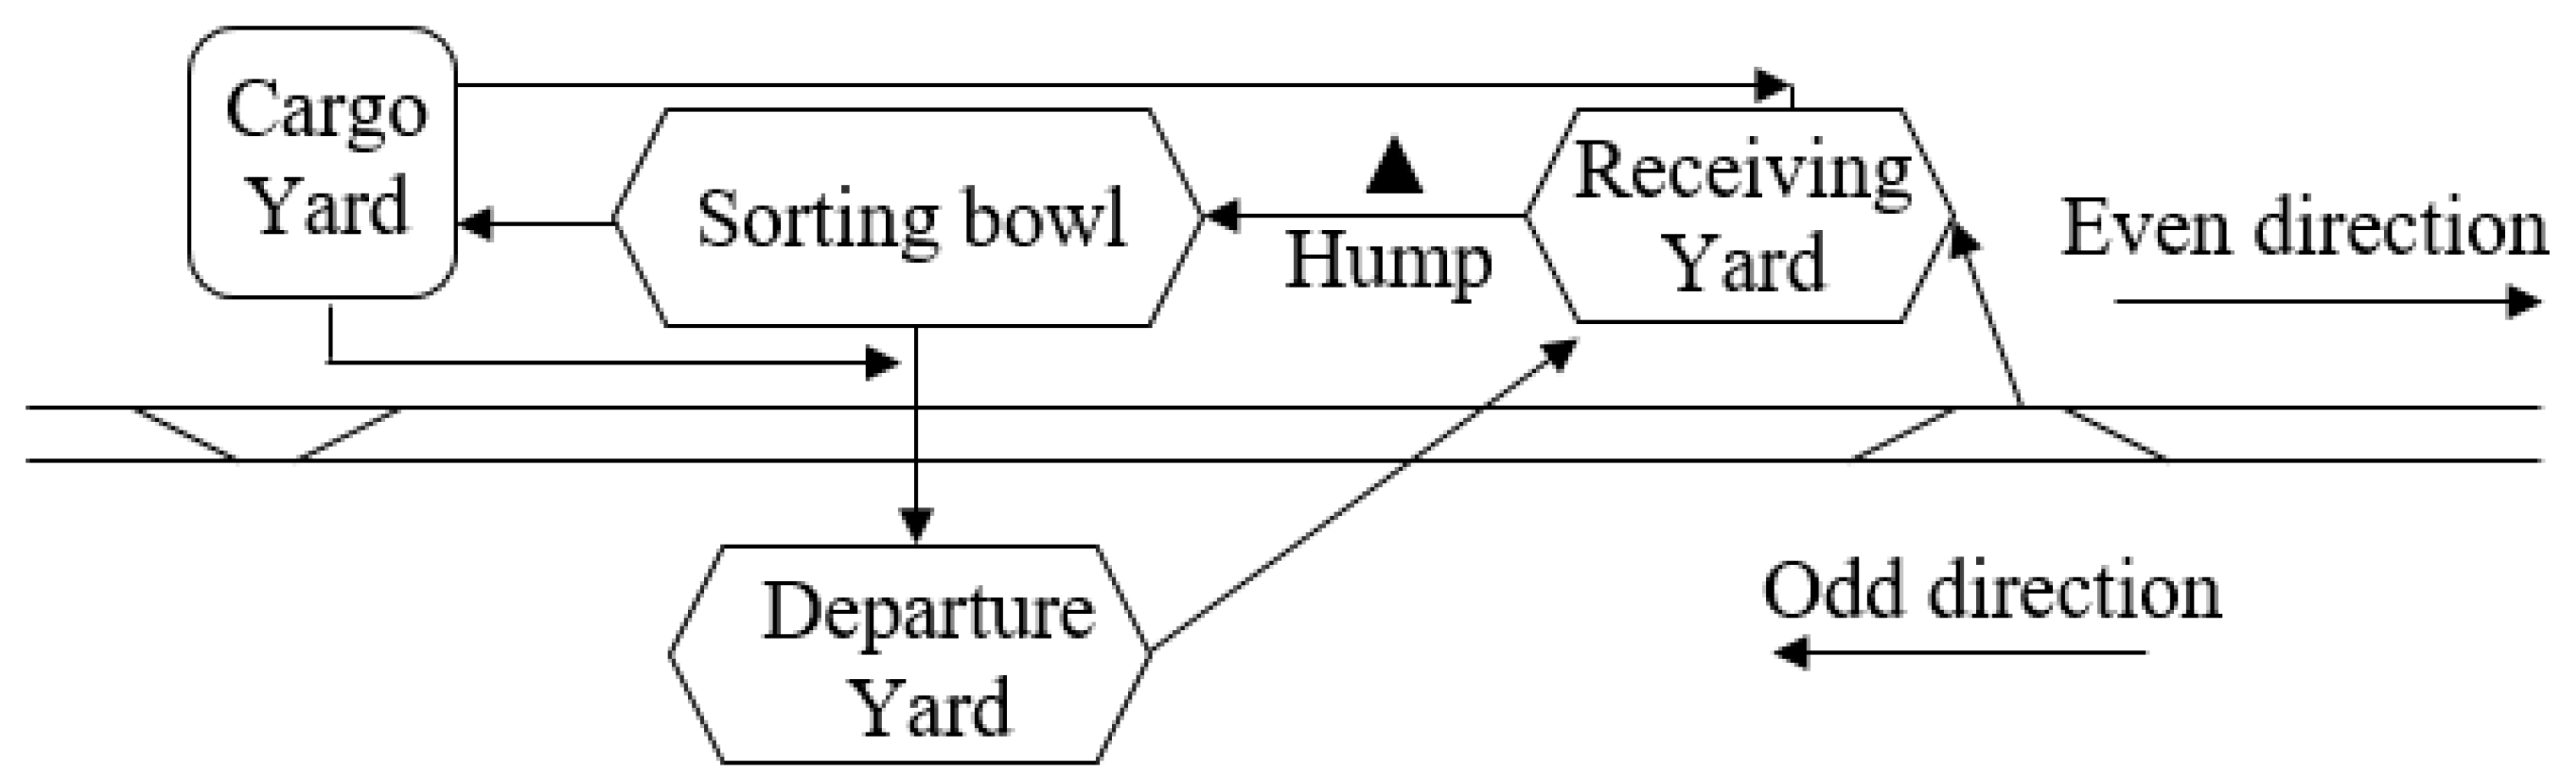
In this section, the freight RS Sukhovskaya is considered. It was selected for the following reasons. First, it is a standard station on the East Siberian Railway. Second, it managed to obtain statistics on arriving train traffic. Sukhovskaya station is designed for the mass loading and unloading of cargo. It includes sorting devices (the hump, humping tracks, draw-out tracks, etc.), the receiving yard, the sorting bowl, the cargo yard, and the departure yard (see Figure 2).
The technological process of the station is standard and shown in Figure 1. Now let us describe its characteristics. The receiving yard has 5 railway tracks with an average capacity of 87 conventional cars (conv. cars); the sorting bowl contains 16 tracks with an average capacity of 73 conv. cars; the departure yard includes 10 tracks with an average capacity of 67 conv. cars. From the receiving yard to the sorting bowl, a single diesel locomotive moves cars using one humping track. Train breaking-up is performed by a low-capacity hump with a processing capacity of up to 1500 cars per day. The processing capacity of the cargo yard is 150 conv. cars per day, at the loading and unloading front, there are 10 servicing devices that can accommodate no more than 30 conv. cars at a time. The total capacity of the front is 300 conv. cars. The supply and retraction of cars from the cargo yard, as well as the complete formation of trains, is carried out by one diesel locomotive in each of the shunting areas. Table 1 shows parameters of the distribution of random variables, which describe servicing time and car group size. Here and below, N(µ, σ) is the normal distribution, B(v, p) is the binomial distribution.
Service time distributions were obtained from regulatory documents [43] and field observations. These data include statistics on 91 trains that arrived at the station in the period from 10 February 2020 to 28 February 2020. Also, by analyzing statistical observations, it was found that the average number of trains arriving at the station during the day and night shifts is 3 and 2, respectively. The number of cars on the train is distributed as B(90, 0.92).
Trains arrive in the system in day and night shifts with different parameters. Hence, there are two sub-flows, and the control Markov chain has two states {0, 1}. Since the duration of the shifts is the same, the probabilities of the chain transition from one state to another are p0 = p1 = p = 0.5. The maximum number of cars in a train is 90, therefore the BMAP flow includes 91 matrices of size 2 × 2, Dk, . Their elements are calculated by formulas (1), where , and the transition probabilities , f(k) is an arrival probability of a group of k cars, the group size obeys binomial distribution B(90, 0.92).
Thus, in terms of the theory of queuing, the model of the Sukhovskaya station, constructed in accordance with the previously proposed approach, has the following form:
- Node 0—an external source
- Node 1 (Receiving Yard)—BMAP/GX/1/435
- Node 2 (Sorting bowl)—*/GX/2/730
- Node 3 (Cargo Yard)—*/GB/10/300
- Node 4 (Departure Yard)—*/GX/2/670
Here X = B(90, 0.92), B = 30 is maximum size of the served group. The movement of requests between nodes is carried out by the routing matrix P1.
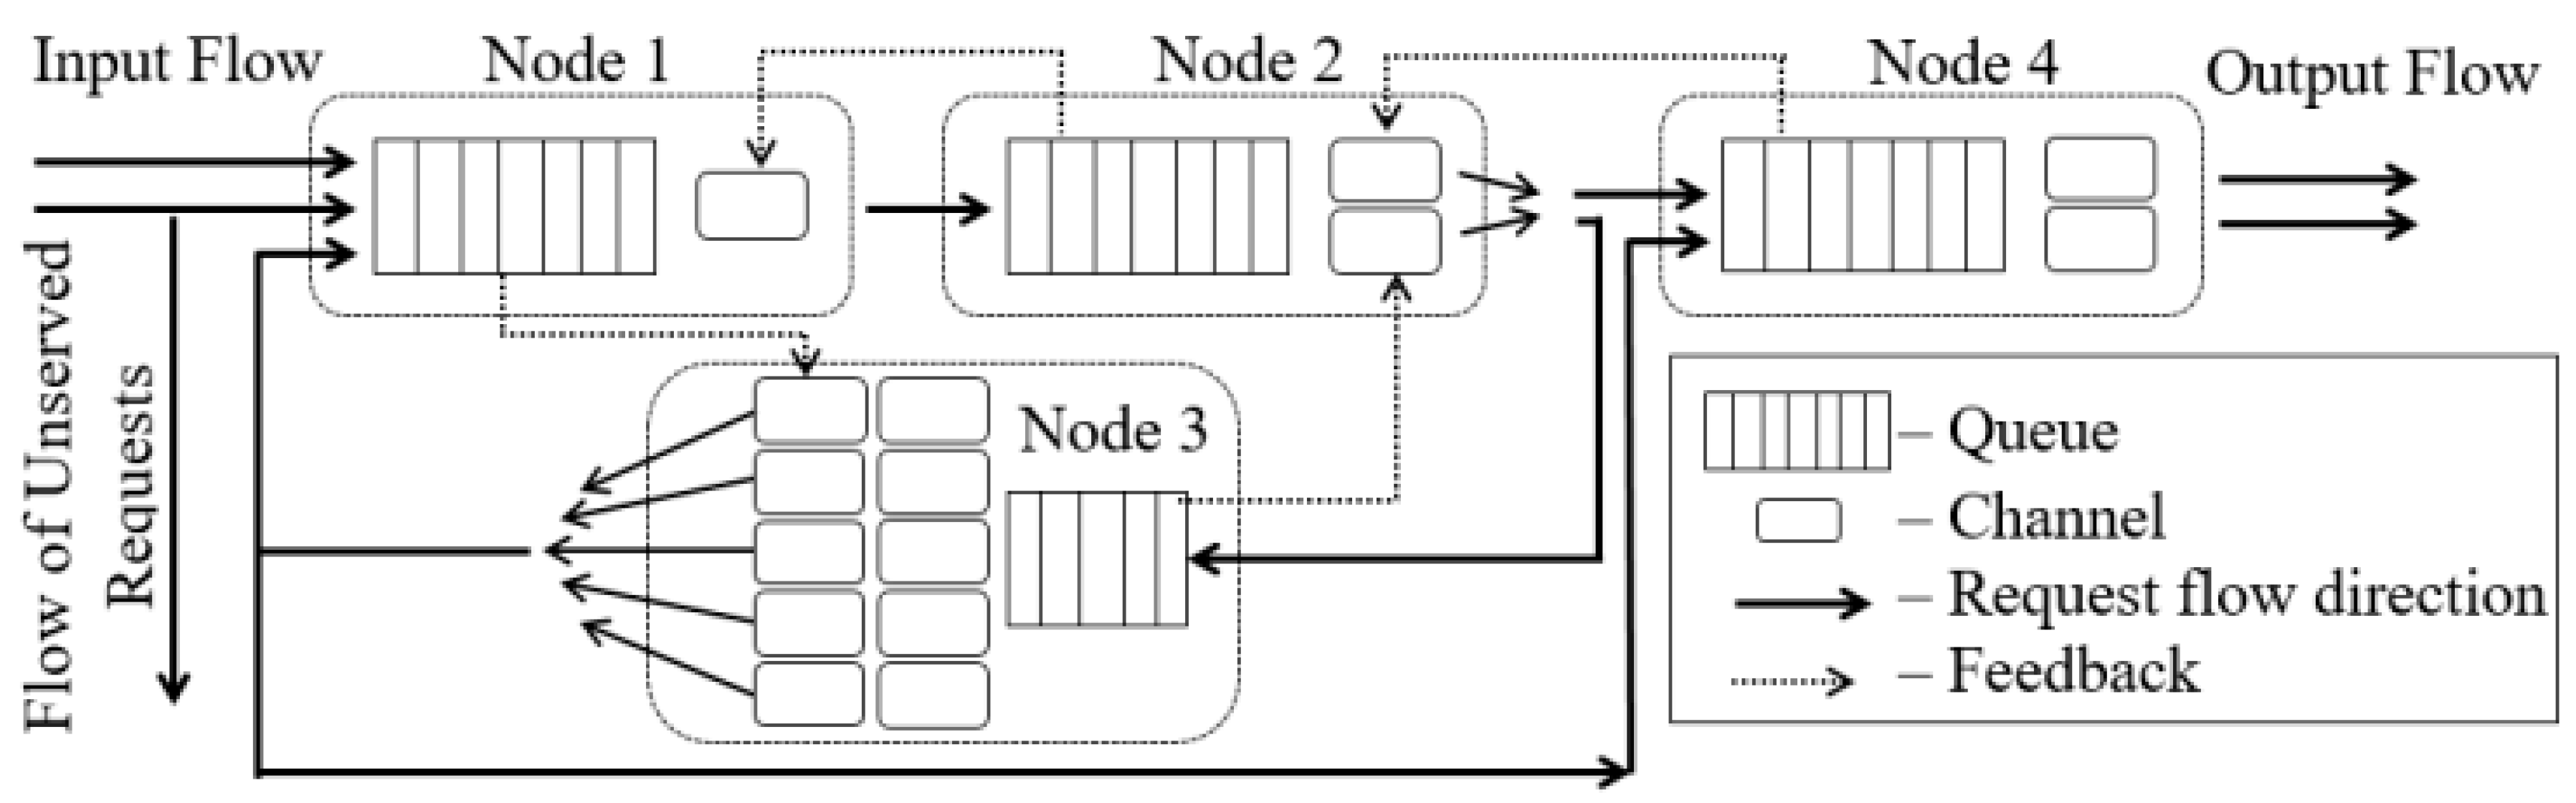
Figure 3 shows the general scheme of Sukhovskaya station model.
Table 2 presents the average results for 10 launches of the simulation model. The virtual simulation time for each start is 3 weeks. We have chosen this value because it is the minimum time for which the simulation model allows calculating the stationary characteristics of the studied QN.
Based on the results of the simulation, it can be seen that the average time spent by the request in the system is just over 46 h, which is due to the high load of the cargo yard (Node 3). Node 3 has the largest average sojourn time of the request (more than 29 h), which makes it a limiting element.
To increase the productivity of the station, it is recommended to reduce the time for servicing requests in Node 3. Measures to reorganize the work of the cargo yard may include reducing the time for servicing requests in channels or increasing their number. In particular, it is technologically possible to reduce the average loading/unloading time of trains by 16%, i.e., up to 20.16 h per train in the cargo yard. If you do not change the parameters of the other subsystems, the estimated capacity of the station will increase by 13.2%. In this case, the average time spent by a separate car at the Sukhovskaya station will be 40.45 h, and it will be possible to service 5.66 trains per day on average.
With a decrease in the average service time of trains in the cargo yard, the receiving yard (Node 1) becomes the limiting element, the capacity of which is insufficient to increase the intensity of train arrival further. The most obvious solution to reduce train service time in this yard is to increase locomotives. However, there is only one humping track in this subsystem. Therefore, this solution will be ineffective since one locomotive will occupy the only humping track, and the second one will stand idle. Then it is advisable to increase the number of service teams in the receiving yard, which will reduce the average service time by 22%. Taking these two recommendations into account, the station will be able to serve an average of 7.76 trains per day, i.e., 55.2% more than the current level.
5.2. Bailey Yard Station
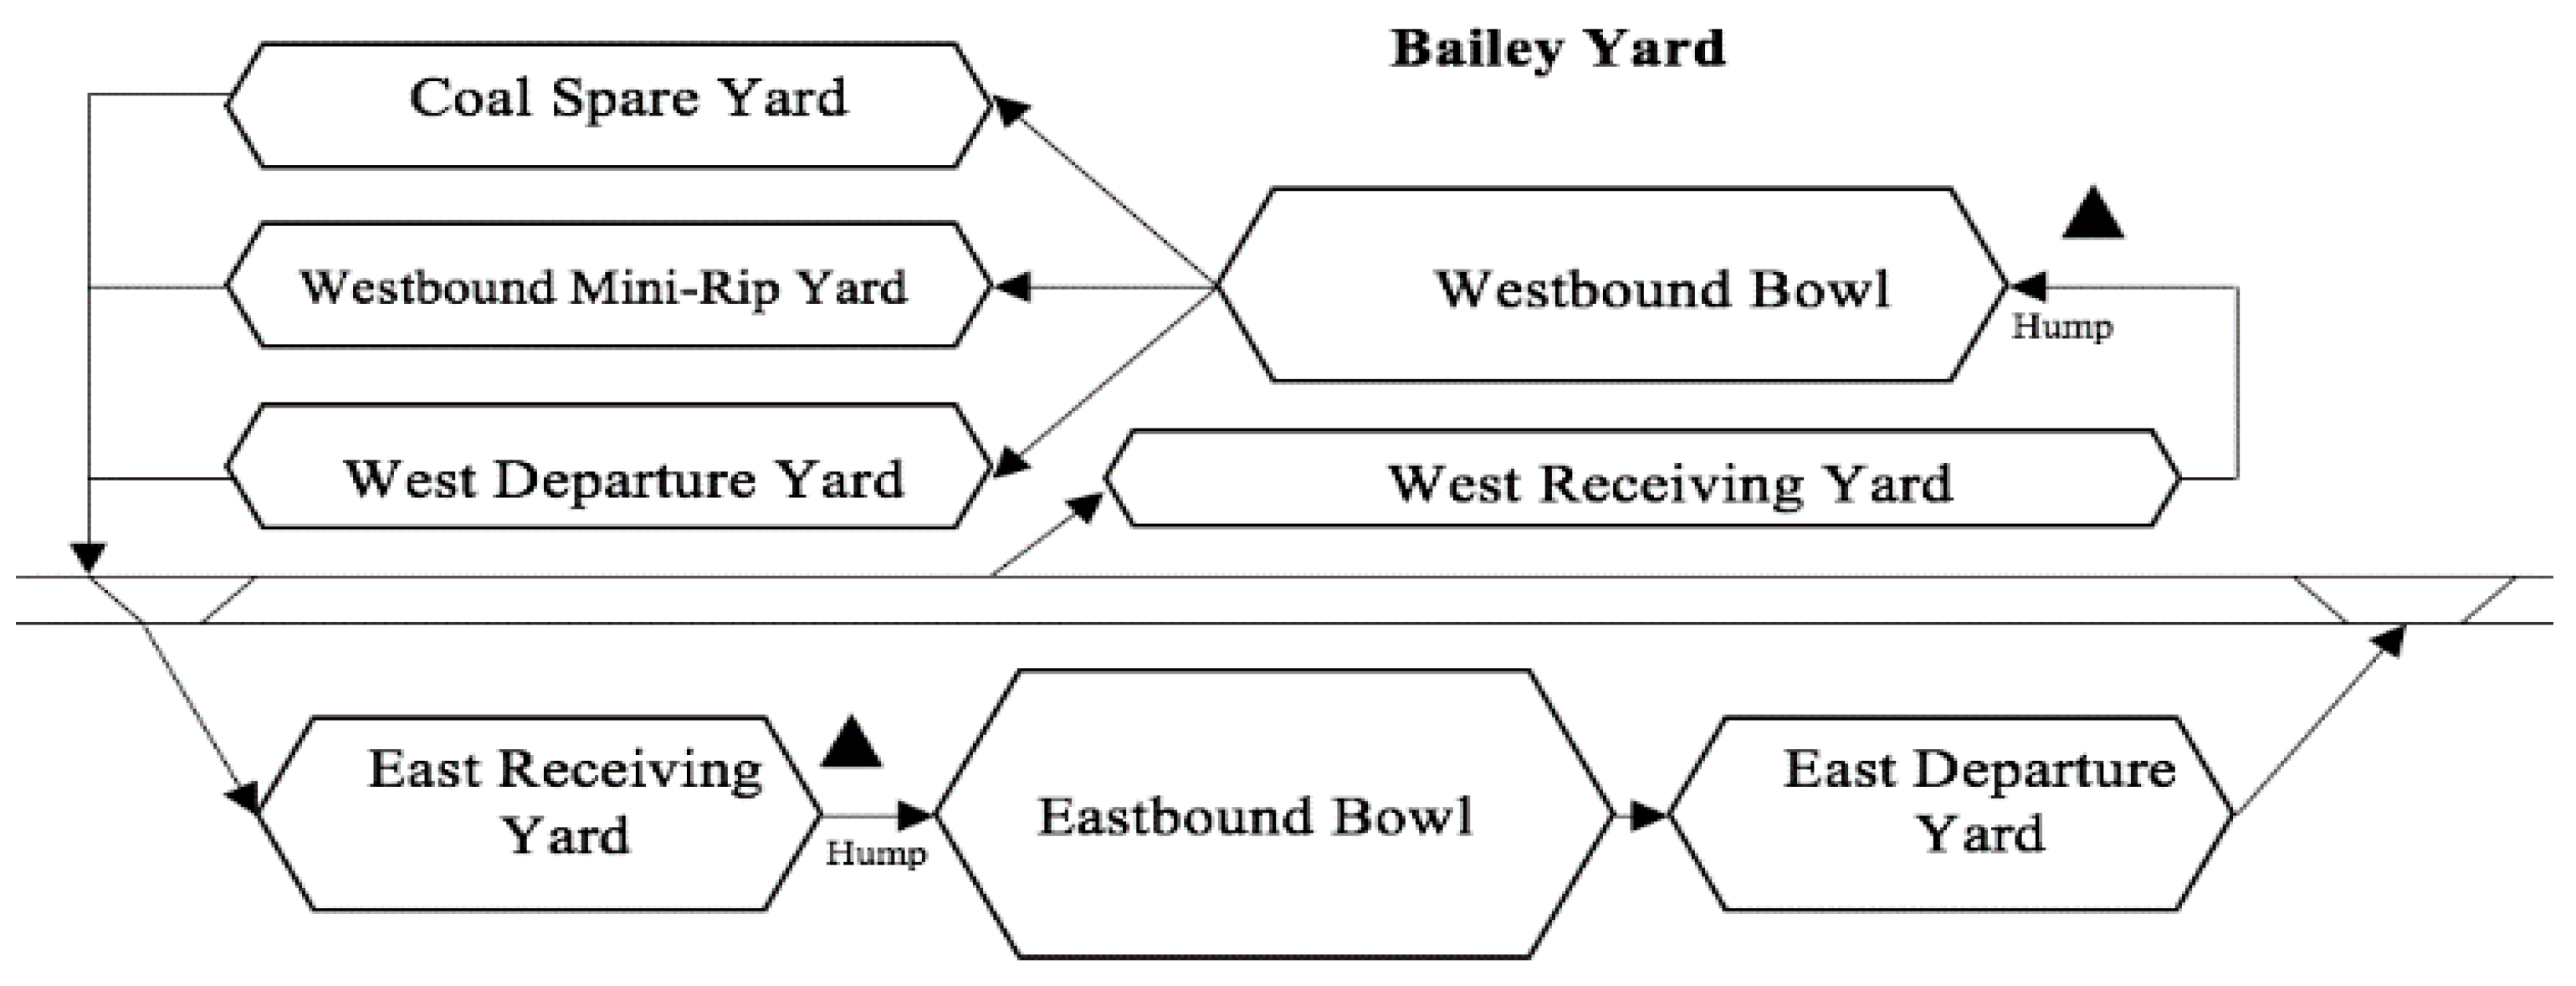
Consider the largest foreign two-way marshalling yard Bailey Yard, which is located in North Platt, NE, USA (Figure 4). The station has a developed track system (about 114 tracks) with reserves of up to 25%, which ensures high throughput and processing capacity, as well as unhindered receiving of trains even during peak loads. An average of more than 10,000 railroad cars pass through Bailey Yard every day, and the yard sorts approximately 4000 cars daily using the yard’s two humps. The eastbound hump is a 10 m tall mound, and the westbound hump is 6.1 m high. The receiving yards (East and West) and departure yards (East and West) have 9 and 10 tracks, respectively. Besides, a coal transit stream passes through the station [45] without processing (up to 32 trains per day). These trains are not re-formed at the station and arrive only for technical and commercial processing, as well as refueling the locomotive.
Due to the increase in transport work, Union Pacific has built special transit parks in the “Western” system: Coal Spare Yard is designed to form its own coal routes, and the Westbound Mini-Rip Yard is used to receive and send transit non-coal car traffic.
Now let us describe the characteristics of the West part of Bailey Yard station. The receiving yard has 9 railway tracks with an average capacity of 93 conv. cars; the sorting bowl contains 64 tracks with an average capacity of 87 conv. cars; each departure yard includes 8 tracks (for Westbound Mini-Rip Yard—10) with an average capacity of 97 conv. cars. From the receiving yard to the sorting bowl, two diesel locomotives move cars using two tracks. Train breaking-up is performed by the high-capacity hump with a processing capacity of up to 4000 cars per day, and two parallel humping tracks and two diesel locomotives are used. Three diesel locomotives perform the final train formation. This allows the formed trains to be moved to the departure yard reasonably quickly. There are also two transit yards located parallel to the departure park, which are intended for handling coal and non-coal routes.
Table 3 shows parameters of the distribution of random variables, which describe servicing time and car group size. This information was obtained from regulatory documents [43], statistical observations, and open data [46,47].
Arriving car traffic is regulated by the Harriman Dispatching Center (Omaha, Nebraska), the main dispatch center of the Union Pacific Railroad. By analyzing statistical observations and open data [46,47], it was found that the average sum number of trains arriving at the station for day and night shifts is 36; the average number of cars per train is 85. The number of cars on the train is distributed as B(90, 0.95). BMAP flow is constructed analogically.
The model of the West part of Bailey Yard station is as follows. The system has five servicing nodes. Node 1 corresponds to the West Receiving Yard. We assume that the two thrust locomotives and the hump are two channels; the tracks of the yard are the queue with a capacity of 837 cars. Node 2 simulates the operating of the Westbound Bowl. The channels are three thrust locomotives, the queue is the tracks of the park with 5568 places. Node 3–5 describes the operation of the West Departure Yard, Coal Spare Yard, and Westbound Mini-Rip Yard, where we consider two servicing teams as channels; the queue is also the tracks of these yards. Nodes 3 and 4 include the queue with 736 places. The queue of Node 5 has 920 places. Thus, in terms of the theory of queuing, the model of the west part of Bailey Yard station, constructed in accordance with the previously proposed approach, has the following form:
- Node 0—an external source
- Node 1 (West Receiving Yard)—BMAP/GX/2/837
- Node 2 (Westbound Bowl)—*/GX/3/5568
- Node 3 (West Departure Yard)—*/GX/2/736
- Node 4 (Coal Spare Yard)—*/GX/2/736
- Node 5 (Westbound Mini-Rip Yard)—*/GX/2/920
Note that the incoming car traffic model does not consider trains without processing. This category of trains passes through Nodes 1 and 2 and goes directly to Nodes 3 and 5. Their presence is taken into account implicitly by increasing the time of service requests in the channels of Nodes 3 and 5 concerning Node 4. The distributions of the service time and the sizes of the served groups of requests in the channels at each phase correspond to the characteristics of the service devices, which are presented in Table 3. The movement of requests between Nodes is carried out by the routing matrix:
Figure 5 shows the general scheme of the west part of Bailey Yard station model.
Table 4 presents the average results for 10 launches of the simulation model. The virtual simulation time for each start is 3 weeks.
Based on the results of the simulation, it can be seen that the average time spent by the request in the system is less than a day (20.88 h). Thus, the intensity of processing incoming trains and the formation of new ones from them is high. However, 77.55% of this time is spent at one of the three departure yards (nodes 3–5). At the same time, the West Receiving Yard and Westbound Bowl (Nodes 1 and 2) have a significant duration of channel blocking: 55.19 h for Node 1 and 115.88 h for Node 2. Consequently, all departure yards (Nodes 3–5) are limiting elements. Their load is close to the maximum possible value.
To solve this problem, it is advisable to increase the number of service teams and the reserves of locomotives (the number of channels) or to revise the technology of locomotive operating. These changes are aimed at reducing the average service time in departure yards. Therefore, if you reduce this parameter for West Departure Yard, Coal Space Yard, and Westbound Mini-Rip Yard by 20%, the estimated system capacity will increase by at least 12%.
It was not possible to assess the effectiveness of measures to reduce the service time in departure parks due to a lack of information on internal traffic flows of Bailey Yard. To obtain more accurate predictive estimates, the operational characteristics of the given station, such as information on internal traffic flows, are needed.
6. Discussion
According to the observed performance indicators, Sukhovskaya station and Bailey Yard station both cope with the current load. Nevertheless, their throughput is close to maximum. This means that in case of emergencies, they may not be able to cope with the load. Examples of such situations are the breakdown of a locomotive in the sorting bowl and/or repair work on the departure tracks. This is a topical problem for Bailey Yard station since the possibilities for redirecting traffic are limited due to the large distance between neighboring stations.
Note that in the presented simulation results (see Table 2 and Table 4), there is a non-zero fault probability for both stations, although it is insignificant (less than 0.03). It appears due to inaccuracy of the model because it is allowed to receive more trains per shift (12 h) than the receiving yard can accommodate. For example, Sukhovskaya station cannot accept six or more trains per shift. At a real transport facility, this situation is unlikely due to dispatch control, which contributes to a more uniform load distribution during the day, which is not taken into account in the model. Nevertheless, the presence of a non-zero loss probability once again confirms our assumption that the load of both stations is close to maximum and there is the risk of switching to an irregular mode of operation.
Based on the simulation results, the limiting elements for both stations are found. For the Sukhovskaya station, they are the cargo and receiving yards. To increase the capacity of this station, it is advisable to reduce the average service time in the cargo yard by 16%, in the receiving yard by 22%. Then the station will be able to serve an average of 7.76 trains per day, i.e., 55.2% more than the current level.
For the west part of Bailey Yard, the limiting elements are three departure yards with insufficient capacity. The estimated system capacity can be increased by at least 12% by reducing the average service time in departure yards by 20%. It is not possible to assess the effectiveness of measures to reduce the service time in departure parks due to a lack of information on internal traffic flows of Bailey Yard. For the same reason, we can design a model of only the West part of this station. Thus, the Bailey Yard station operation model needs to be refined and expanded, but the available data was sufficient to make some preliminary conclusions.
The results were discussed with the experts of the “Russian Railways” company and received prefatory approval.
7. Conclusions
Currently, we can see a growing interest in rail transportation, as railway transport is one of the most environmentally friendly ways of moving goods and passengers. In this regard, it is essential to create new model-algorithmic tools and develop existing ones that can be used for preliminary studies in the modernization of railway transport hubs. At the same time, it is necessary, on the one hand, to take into account the stochastic nature of the processes occurring, and on the other hand, to ensure the accuracy and adequacy of modeling, which will allow for more effective risk management and regulation of transport flows. Our research contributes to the solution of this problem, and we managed to apply and extend the approach that was previously mainly used in the field of information technology (IT).
In this article, the new method of modeling micro-logistic transport systems based on the queuing theory is proposed. The novelty lies in the use of queuing networks, instead of multiphase QS, which we applied earlier [40,41] for the mathematical description of passenger transport hubs. Queuing networks help us to describe in detail the route of requests within an object with a non-linear hierarchical structure. This allows us, firstly, to expand the capabilities of the model apparatus, and secondly, to explore a new class of transport objects—freight railway stations and marshalling yards.
The proposed method is versatile and highly adaptive (it has already been used to describe heterogeneous objects). Thus, it is suitable for describing a wide range of cargo transport systems, including river ports, seaports, and airports, as well as multimodal transport hubs.
At the same time, we should point out the limits of the model. It is not suitable for well-scheduled processes, such as unimodal public transportation or corporate cargo stations, where the influence of random factors needs to be minimized. Moreover, the models offered are quite simple and cannot replace detailed descriptions of transport hubs. In the models, elements such as train tracks and on-duty personnel are taken into account only generically through the capacity of the system and the number of service devices. Equipment failures, repairs, and other emergencies are not considered. Nevertheless, these models allow us to make a primary analysis of the hub operation and do not need large amounts of statistical information for parametric identification. Moreover, our models are undemanding to system resources for computational experiments. You can use ordinary personal computers and at the same time, obtain not only qualitative but also quantitative estimates of the parameters characterizing the efficiency of the transport systems operating and risk of switching to an irregular mode of operation.
Using this method, models of two operating stations are designed. The first station is Sukhovskaya, a freight station located in Russia; the second is Bailey Yard, a marshalling yard located in the USA. Thus, based on the numerical study of the constructed models, the following results are obtained:
- the load on both stations is close to the maximum allowable value;
- there are limiting elements in both stations, the capacity of which needs to be increased. For Sukhovskaya station, these are the cargo and receiving yards, and for the West part of Bailey Yard, these are three departure yards;
- reducing the average service time in the cargo yard by 16% and in the receiving yard by 22% will increase the capacity of Sukhovskaya station by 55.2%;
- reducing the service time at the three departure yards of the West part of Bailey Yard by 20% will increase the total system’s capacity by at least 12%;
- the Bailey Yard station operation model needs to be refined and expanded.
Further research can be carried out in the following directions. The first is the improvement of the proposed approach through the use of a semi-Markovian service process. This can help us address the possibility of changes in the operating characteristics of service devices associated with breakdowns, temporary inactivity, or the transition of the system from day to night shifts. Taking these features into account is essential for a more accurate determination of various risks for both transport and other complex systems, in particular, information [18,19]. The second direction concerns the expansion of the model approach to cross-border multimodal transport to study the conditions for the bullwhip effect and minimize its negative consequences. The third direction is related to applying the proposed approach to assessing the anthropogenic impact of transport on the environmental situation.
Moreover, one of the directions for further research is the creation of an intelligent system based on the developed model-algorithmic and software apparatus [48] for the automatic construction and study of models of micro logistics transport systems’ operation.
Author Contributions
Conceptualization, I.B. and A.K.; methodology, M.Z. and A.L.; software, M.Z. and A.K.; validation, I.B., A.K. and A.L.; formal analysis, M.Z.; investigation, A.K. and M.Z.; resources, I.B.; data curation, A.K. and M.Z.; writing—original draft preparation, A.K. and M.Z.; writing—review and editing, I.B. and A.L.; visualization, M.Z.; supervision, I.B.; funding, I.B. All authors have read and agreed to the published version of the manuscript.
Funding
The work was supported by the Ministry of Science and Higher Education of Russia, grant 075-15-2020-787 in the form of a subsidy for Major scientific projects on priority areas (the project “Fundamentals, methods and technologies for digital monitoring and forecasting of the environmental situation on the Baikal natural territory”).
Institutional Review Board Statement
Not applicable.
Informed Consent Statement
Informed consent was obtained from all subjects involved in the study.
Data Availability Statement
Data are not publicly available, although the data may be made available on request from the corresponding author.
Conflicts of Interest
The authors declare no conflict of interest.
References
- Kerner, B.S. Introduction to Modern Traffic Flow Theory and Control; Sprinter: New York, NY, USA, 2009. [Google Scholar] [CrossRef]
- Pyrgidis, C.N. Railway Transportation Systems. Design, Construction and Operation; CRC Press: Boca Raton, FL, USA, 2016. [Google Scholar]
- Law, A.M.; Kelton, W.D. Simulation Modelling and Analysis, 3rd ed.; McGraw-Hill: New York, NY, USA, 2000. [Google Scholar]
- Milenkovic, M.; Bojovic, N. Optimization Models for Rail Car Fleet Management, 1st ed.; Elsevier Inc.: Amsterdam, The Netherlands, 2019. [Google Scholar]
- Stefano, G.; Maue, J.; Modelski, M. Models for Rearranging Train Cars; Technical Report TR-0089; Arrival Project: L’Aquila, Italy, 2007. [Google Scholar]
- He, S.-W.; Li, H.-D.; Wang, B.-H.; Shen, Y.-S. Survey of Stage Plan for Railway Marshalling Station. J. China Railw. Soc. 2011, 33, 13–22. (In Chinese) [Google Scholar]
- Milos, I.; Markovic, M.; Markovic, A. Effects of the application of conventional methods in the process of forming the pick-up trains. Yugosl. J. Oper. Res. 2012, 2, 245–256. [Google Scholar] [CrossRef]
- Kozlov, P.A.; Misharin, A.S. A two-level model for the management of railroad goods transportation. J. Comput. Syst. Sci. Int. 2002, 41, 803–811. [Google Scholar]
- Kozlov, P.; Osokin, O.; Timukhina, E.; Tushin, N. Optimization of fleet size and structure while serving given freight flows. Adv. Intellegent Syst. Comput. 2020, 1116, 1064–1075. [Google Scholar] [CrossRef]
- Peña, D.; Tchernykh, A.; Nesmachnow, S.; Massobrio, R.; Feoktistov, A.; Bychkov, I.; Garichev, S.N. Operating Cost and Quality of Service Optimization for Multi-Vehicle-Type Timetabling for Urban Bus Systems. J. Parallel Distrib. Comput. 2019, 133, 272–285. [Google Scholar] [CrossRef]
- Fabbiani, E.; Nesmachnow, S.; Toutouh, J.; Tchernykh, A.; Avetisyan, A.; Radchenko, G. Analysis of mobility patterns for public transportation and bus stops relocation. Program. Comput. Softw. 2019, 44, 508–525. [Google Scholar] [CrossRef]
- Gross, D.; Shortle, J.F.; Thompson, J.M.; Harris, C.M. Fundamentals of Queueing Theory, 4th ed.; John Wiley & Sons Inc.: Hoboken, NJ, USA, 2008. [Google Scholar]
- Medhi, J. Stodhastic Models in Queuing Theory, 2nd ed.; Academic Press: San Diego, CA, USA, 2002. [Google Scholar]
- Todinov, M. Reliability and Risk Models: Setting Reliability Requirements; John Wiley & Sons Inc.: Hoboken, NJ, USA, 2005. [Google Scholar]
- Lebid, I.; Shevchenko, D.; Kravchenya, I.; Luzhanska, N.; Prokudin, G.; Oliskevych, M. Rationing of the number of signals and interlockings in the operational stock of railway stations. Matec Web Conf. 2019, 294, 05007. [Google Scholar] [CrossRef]
- Lisovskaya, E.; Moiseev, A.; Moiseeva, S.; Pagano, M. Modeling of Mathematical Processing of Physics Experimental Data in the Form of a Non-Markovian Multi-Resource Queuing System. Russ. Phys. J. 2019, 61, 2188–2196. [Google Scholar] [CrossRef]
- Mauro, M.; Liotta, A. Statistical Assessment of IP Multimedia Subsystem in a Softwarized Environment: A Queueing Networks Approach. IEEE Trans. Netw. Serv. Manag. 2019, 16, 1493–1506. [Google Scholar] [CrossRef]
- Dudin, A.; Klimenok, V.; Vishnevsky, V. The Theory of Queuing Systems with Correlated Flows; Springer Nature: Cham, Switzerland; AG: Cham, Switzerland, 2019. [Google Scholar]
- Klimenok, V.; Dudina, O.; Vishnevsky, V.; Samouylov, K. Retrial tandem queue with BMAP-input and semi-Markovian service process. In Distributed Computer and Communication Networks. DCCN 2017. Communications in Computer and Information Science; Vishnevskiy, V., Samouylov, K., Kozyrev, D., Eds.; Springer: Cham, Switzerland, 2017; Volume 700, pp. 159–173. [Google Scholar] [CrossRef]
- Potthoff, G. Verkehrs Stromungs Lehre; TRANSPRESS-VEB: Berlin, Germany, 1970. [Google Scholar]
- Landex, A. Station Capacity. In Proceedings of the 4th International Seminar on Railway Operations Modelling and Analysis, Rome, Italy, 16–18 February 2011. [Google Scholar]
- Daganzo, C.; Dowling, R.; Hall, R. Railroad classification yard throughput: The case of multistage triangular sorting. Transp. Res. 1983, 17, 95–106. [Google Scholar] [CrossRef]
- Galkin, A.; Sirina, N.; Zubkov, V. Elaboration of a Model of Integrated Transport Service in the Segment of Freight Transportation. Adv. Intell. Syst. Comput. 2020, 1116, 1076–1085. [Google Scholar] [CrossRef]
- Wilson, N.; Fourie, C.J.; Delmistro, R. Mathematical and simulation techniques for modelling urban train networks. S. Afr. J. Ind. Eng. 2016, 27, 109–119. [Google Scholar] [CrossRef]
- Kozan, E.; Higgens, A. Modeling train delays in urban networks. Transp. Sci. 1998, 32, 346–357. [Google Scholar] [CrossRef]
- Huisman, T.; Boucherie, R.J. Running times on railway sections with heterogeneous train traffic. Transp. Res. Part B Methodol. 2001, 35, 271–292. [Google Scholar] [CrossRef]
- Huisman, T.; Boucherie, R.J.; Van Dijk, N.M. A solvable queueing network model for railway networks and its validation and applications for the Netherlands. Eur. J. Oper. Res. 2002, 142, 30–51. [Google Scholar] [CrossRef] [Green Version]
- Weik, N.; Niebel, N.; Nießen, N. Capacity analysis of railway lines in Germany—A rigorous discussion of the queueing based approach. J. Rail Transp. Plan. Manag. 2016, 6, 99–115. [Google Scholar] [CrossRef]
- Weik, N.; Nießen, N. Quantifying the effects of running time variability on the capacity of rail corridors. J. Rail Transp. Plan. Manag. 2019, 15, 100203. [Google Scholar] [CrossRef]
- De Kort, A.F.; Heidergott, B.; Van Egmand, R.J.; Hoogheimstra, G. Train Movement Analysis at Railway Stations: Procedures & Evaluation of Wakob’s Approach, 1st ed.; Delft University Press: Delft, The Netherlands, 1999. [Google Scholar]
- Dorda, M.; Teichmann, D. Modelling of Freight Trains Classification Using Queueing System Subject to Breakdowns. Math. Probl. Eng. 2013, 2013, 307652. [Google Scholar] [CrossRef]
- Nießen, N. Waiting and loss probabilities for route nodes. In Proceedings of the 5th International Seminar on Railway Operations Modelling and Analysis, Kopenhagen, Denmark, 13–15 May 2013. [Google Scholar]
- Weik, N.; Nießen, N. A quasi-birth-and-death process approach for integrated capacity and reliability modeling of railway systems. J. Rail Transp. Plan. Manag. 2017, 7, 114–126. [Google Scholar] [CrossRef]
- Schmitz, C.; Weik, N.; Zieger, S.; Nießen, N.; Schmeink, A. Markov Models for the Performance Analysis of Railway Networks. In Proceedings of the 7th International Conference on Railway Operations Modelling and Analysis, Lille, France, 5–7 April 2017; p. 23. [Google Scholar]
- Wendler, E. The scheduled waiting time on railway lines. Transp. Res. Part B Methodol. 2007, 41, 148–158. [Google Scholar] [CrossRef]
- Kontrec, N.; Panic, S.; Petrovic, M.; Milosevic, H. A stochastic model for estimation of repair rate for system operating under performance based logistics. Eksploat. I Niezawodn. Maint. Reliab. 2018, 20, 68–72. [Google Scholar] [CrossRef]
- Kontrec, N.; Petrovic, M.; Panic, S.; Milosevic, H. A Stochastic Model for Achieving Required Level of Availability Based on the Repair Rate Analysis. Teh. Vjesn. Tech. Gaz. 2019, 26, 1171–1175. [Google Scholar] [CrossRef]
- Yuan, J.; Hansen, I.A. Optimizing capacity utilization of stations by estimating knock-on train delays. Transp. Res. Part B Methodol. 2007, 41, 202–217. [Google Scholar] [CrossRef]
- Meester, L.E.; Muns, S. Stochastic delay propagation in railway networks and phase-type distributions. Transp. Res. Part B Methodol. 2007, 41, 218–230. [Google Scholar] [CrossRef]
- Lempert, A.A.; Kazakov, A.L.; Zharkov, M.L. A Stochastic Model of a Transport Hub and Multi-phase Queueing System. Adv. Intell. Syst. Res. 2018, 158, 117–123. [Google Scholar] [CrossRef]
- Zhuravskaya, M.A.; Lempert, A.A.; Anashkina, N.Y.; Zharkov, M.L. Issues of sustainable urban mobility simulation. Business Logist. Mod. Manag. 2018, 18, 439–453. [Google Scholar]
- Lucantoni, D.M. New results on single server queue with a Batch Markovian Arrival Process. Commun. Stat. Stoch. Models 1991, 7, 1–46. [Google Scholar] [CrossRef]
- The Order of JSC “Russian Railways” Dated 11.12.2014 N2927p “On Approval of the Model for the Process of Sorting Station JSC “Russian Railways” (Along with the Typical Technological Process)”. Available online: https://cssrzd.ru/orders/2927.pdf (accessed on 25 February 2021). (In Russian).
- Zharkov, M.L.; Kazakov, A.L.; Lempert, A.A. Transient process modeling in micrologistic transport systems. Iop Conf. Ser. Earth Environ. Sci. 2021, 629, 012023. [Google Scholar] [CrossRef]
- Goossens, J.W.; Hoesel, S.P. On solving multi-type railway line planning problems of USA. Eur. J. Oper. Res. 2006, 168, 403–424. [Google Scholar] [CrossRef]
- Union Pacific in Nebraska. Available online: https://www.up.com/cs/groups/public/@uprr/@corprel/documents/up_pdf_nativedocs/pdf_nebraska_usguide.pdf (accessed on 22 January 2021).
- Golden Spike Tower. Live Feed from Bailey Yard Train Camera. Available online: https://goldenspiketower.com/bailey-yard/live-cam/ (accessed on 22 January 2021).
- Bychkov, I.V.; Kazakov, A.L.; Lempert, A.A.; Bukharov, D.S.; Stolbov, A.B. An intelligent management system for the development of a regional transport logistics infrastructure. Autom. Remote Control 2016, 77, 332–343. [Google Scholar] [CrossRef]
Figure 1.
Functional subsystems of the railway station.

Figure 2.
Scheme of Sukhovskaya station.

Figure 3.
Queuing network diagram of Sukhovskaya station.

Figure 4.
Scheme of Bailey Yard station.

Figure 5.
Queuing network diagram of Bailey Yard station.


Table 1.
Technical characteristics of Sukhovskaya station.
| Receiving Yard | Sorting Bowl | Cargo Yard | Departure Yard | |
|---|---|---|---|---|
| Service time distribution, h. | N(2.5, 0.30) | N(4.5, 0.50) | N(24.0, 0.50) | N(4.2, 0.50) |
| Group size distribution | B(90, 0.92) | B(90, 0.92) | Const = 30 | B(90, 0.92) |
Table 2.
Simulation results of the Bailey Yard station.
| Arrived groups of requests | 105.80 | Probability of failure of a requests group | 0.022 | |
| Arrived requests | 8756.80 | Probability of failure of requests | 0.022 | |
| Accepted groups of requests | 103.20 | Average sojourn time of a request at the system (h) | 46.13 | |
| Accepted requests | 8540.20 | Average sojourn time of a request at the system (m) | 2767.80 | |
| Node parameters | Node 1 | Node 2 | Node 3 | Node 4 |
| Average busy channels | 0.89 | 1.49 | 8.37 | 1.33 |
| Average queue length | 84.74 | 0.00 | 57.96 | 12.84 |
| Average sojourn time of a request at a Node (m) | 400.77 | 288.89 | 1757.86 | 320.28 |
| Total blocking time (m) | 0.00 | 7.40 | 1.60 | - |
Table 3.
Technical characteristics of the west system of Bailey Yard station.
| West Receiving Yard | Westbound Bowl | West Departure Yard | Coal Spare Yard | Westbound Mini-Rip Yard | |
|---|---|---|---|---|---|
| Service time distribution, h. | N(2.59, 0.10) | N(4.30, 0.50) | N(1.43, 0.20) | N(1.00, 0.20) | N(1.86, 0.20) |
| Group size distribution | B(90, 0.95) | B(90, 0.95) | B(90, 0.95) | B(90, 0.95) | B(90, 0.95) |
Table 4.
Simulation results of the Bailey Yard station.
| Arrived groups of requests | 763.00 | Probability of failure of a requests group | 0.014 | ||
| Arrived requests | 65,928.00 | Probability of failure of a requests | 0.014 | ||
| Accepted groups of requests | 751.80 | Average sojourn time of a request at the system (h) | 20.88 | ||
| Accepted requests | 64,957.40 | Average sojourn time of a request at the system (m) | 1252.65 | ||
| Node options | Node 1 | Node 2 | Node 3 | Node 4 | Node 5 |
| Average busy channels | 1.55 | 2.09 | 1.99 | 1.93 | 1.94 |
| Average queue length | 132.17 | 199.45 | 592.90 | 392.17 | 580.75 |
| Average sojourn time of a request at a Node (m) | 113.33 | 167.87 | 1052.07 | 806.86 | 1055.39 |
| Total blocking time (m) | 3311.50 | 6952.60 | 0.00 | 0.00 | 0.00 |
| Channel blocking probability | 0.11 | 0.23 | 0.00 | 0.00 | 0.00 |
Publisher’s Note: MDPI stays neutral with regard to jurisdictional claims in published maps and institutional affiliations. |
© 2021 by the authors. Licensee MDPI, Basel, Switzerland. This article is an open access article distributed under the terms and conditions of the Creative Commons Attribution (CC BY) license (http://creativecommons.org/licenses/by/4.0/).
Share and Cite
MDPI and ACS Style
Bychkov, I.; Kazakov, A.; Lempert, A.; Zharkov, M. Modeling of Railway Stations Based on Queuing Networks. Appl. Sci. 2021, 11, 2425. https://doi.org/10.3390/app11052425
AMA Style
Bychkov I, Kazakov A, Lempert A, Zharkov M. Modeling of Railway Stations Based on Queuing Networks. Applied Sciences. 2021; 11(5):2425. https://doi.org/10.3390/app11052425
Chicago/Turabian StyleBychkov, Igor, Alexander Kazakov, Anna Lempert, and Maxim Zharkov. 2021. "Modeling of Railway Stations Based on Queuing Networks" Applied Sciences 11, no. 5: 2425. https://doi.org/10.3390/app11052425
Note that from the first issue of 2016, this journal uses article numbers instead of page numbers. See further details here.