Article

Investigation of an Intense Dust Outbreak in the Mediterranean Using XMed-Dry Network, Multiplatform Observations, and Numerical Modeling

1
Institute of Atmospheric Sciences and Climate, National Research Council of Italy, CNR-ISAC, 73100 Lecce, Italy
2
Institute for Applied Geosciences, Technische Universität Darmstadt, 64287 Darmstadt, Germany
3
Department of Industrial Engineering and Mathematical Sciences, Università Politecnica delle Marche, 60131 Ancona, Italy
4
Ambient Quality & Waste Unit, Environment and Resources Authority, MRS 1441 Marsa, Malta
5
Institute of Nuclear and Radiological Sciences & Technology, Energy & Safety, N.C.S.R. Demokritos, 15341 Agia Paraskevi, Attiki, Greece
*
Author to whom correspondence should be addressed.
Appl. Sci. 2021, 11(4), 1566; https://doi.org/10.3390/app11041566
Submission received: 29 December 2020 / Revised: 1 February 2021 / Accepted: 5 February 2021 / Published: 9 February 2021
(This article belongs to the Special Issue New Insights into Atmospheric Chemistry and Climate)

Abstract

:
The Weather Research and Forecasting (WRF) model with online coupled chemistry (WRF-Chem) is applied to study an intense Saharan dust outbreak event affecting the Italian peninsula in 15 and 16 April 2018. According to the MODIS retrievals, this intrusion was characterized by an intense aerosol optical depth (AOD) peak value in the southern Mediterranean. Measurements within the Dry Deposition Network Across the Mediterranean (XMed-Dry) are compared with the output of the WRF-Chem model. XMed-Dry samples from Lecce (Italy), Athens (Greece) and San Lawrenz/Gozo (Malta) were analysed with respect to aerosol particle size distribution, relative dust contribution, and composition. The discrepancy between the model and measured deposition indicate the need to formulate in WRF-Chem more sophisticated deposition schemes, this will need to evaluate the sensitivity of the results to the precise particle size limits chosen for the aerosol model. Moreover, satellite retrievals from MODIS sensors elaborated with the MAIAC algorithm, Aeronet stations, and measurements of PM 10 at the selected sites were also considered. In a numerical domain that spans the Mediterranean and the northern Saharan desert, two different dust emission schemes, namely Gocart-AFWA and the Shao-2001, were tested and compared with multiplatform observations for simulation period covering the dust outbreak. Actual results indicate that both emission schemes would benefit from replacing the static erodibility map and soil particle distribution with remote sensed and in-situ observational data.

1. Introduction

The Intergovernmental Panel on Climate Change [1] has recognized mineral dust as the main component of atmospheric aerosols, and considered it as an ‘essential climate variable’. It may be defined as one of the largest natural aerosol sources and influencing significantly the weather and climate system [2]. Aerosol particles influence climate by modifying directly the global energy budget by scattering and absorbing long- and short-wave radiation [3] and interacting with clouds modifying the development and occurrence of precipitation (indirect effects).
The Sahara Desert contributes to the total emission of dust to more than half of the global [4]. Strong convective structures generated by the intense surface heating raise the dust particles for thousands of meters into the troposphere, where they are finally transported at the continental and intercontinental scales [5]. It has been estimated that 10% of the Saharan dust amount is transported across the Mediterranean Sea to Europe [6,7] in episodic storms or following periodic patterns [8,9]. In recent studies [10,11], it was reported an average contribution between 30% and 40% to the optical depth over different cities in southern Europe.
The most important parameter describing the level of columnar aerosols in the atmosphere is the Aerosol Optical Depth (AOD). AOD may be measured at ground level with a sun-photometer or from space by Spectroradiometer (e.g., Moderate Resolution Imaging Spectroradiometer, MODIS). At this purpose, a federation of ground-based sun-photometers has been established by NASA and the French CNRS. It includes nearly 1000 sun photometers distributed worldwide within the Aerosol Robotic Network (AERONET) [12] whose data are processed according to the same aerosol retrieval algorithms [13,14]. On the other side, AOD measurements from space started in 1999 by NASA with the launch of the Terra spacecraft that is carrying the MODIS sensor. The characterization of atmospheric aerosol is a core of the MODIS mission [15] and the AOD still represents the most robust aerosol physical parameter derived from space.
To complement measurements, numerical modeling may be considered a useful approach to study the dust transport from the Saharan arid and semi-arid regions toward the Mediterranean area, allowing a comprehensive understanding of the dust intrusions and their effects on air quality [16] and human health [17].
The Weather Research and Forecasting model coupled with chemistry (WRF-Chem; [18]) has been previously used by many research groups to study this argument, among the others we may cite Bossioli et al. [19] that studied the influence of biomass burning during summertime over the eastern Mediterranean, Georgiou et al. [20] who investigated an intense photochemical activity and their impact on air quality over the eastern Mediterranean, Chaibou et al. [21] who evaluated dust extinction and vertical profiles with different dust emission schemes into the WRF-Chem (v4.02) model over North Africa, and Su and Fung [22] and LeGrand et al. [23] that evaluated the model performance in the simulation of dust concentrations over an eastern Asia domain using different dust emission formulations. Previous studies of the WRF-Chem reproduction of the AOD over the Mediterranean area have been performed by Flaunas et al. [24] that made a sensitivity analysis over the broader Mediterranean regions of the WRF-Chem (V3.6.1) model to different dust emission parametrization, by Rizza et al. [9,25], that evaluated the different dust emission schemes in the same version of the WRF-Chem model and by Tsarpalis et al. [26] that implemented a dust wet deposition scheme in a dust module of WRF-Chem (V3.8).
Experimental data of mineral dust deposition are useful to improve the understanding of deposition processes itself but also to support the development and parameterizations of more sophisticated, size dependent deposition schemes in the WRF-Chem model. In this context, a dry deposition measurement network across the Mediterranean (XMed-Dry) has been recently established [27]. In this network, a set of seven newly developed dry deposition-only collectors has been installed at different locations across the Mediterranean (Huelva, Barcelona, Spain; IÎe-Rousse, France; Gozo Island, Malta; Lecce, Italy; Athens, Greece; Nicosia, Cyprus) to capture spatial and temporal variability of atmospheric aerosols including their size and composition [28]. In the context of this study, deposition data from three XMed-Dry stations—namely: Lecce, Athens, and Malta have been utilized to validate the WRF-Chem model. It is utilized to analyze an intense Saharan dust outbreak event affecting the Italian peninsula in 15 and 16 April 2018. This intrusion was characterized by an intense aerosol optical depth (AOD) peak value in the southern Mediterranean, according to the MODIS retrievals.
The WRF-Chem model, that actually implements two different dust emission schemes, namely the GOCART-Air Force Weather Agency (AFWA; [29]) and the University of Cologne (UoC; [30]), will be tested and compared with multiplatform observations, for a simulation period covering the dust outbreak in April, 2018. Generally, analysis shows that the AFWA emission scheme significantly over-predicts the emission of mineral dust, while the UoC parameterization gives overall better results in terms of optical properties and total mass. It is important to remark that rather than discovering new dust-emission parameterizations we are mainly interested in finding the optimal WRF-Chem configuration in term of physics and chemistry setup. We partially did this in a previous work [25] were we tested the UoC dust emission scheme using two different WRF land surface schemes and found very different results only by changing the surface land model.
The paper outline is the following: Section 2 describes materials and methods utilized for this study; Section 3 depicts results and the relative analysis; and finally, in Section 4, the conclusions of the study are drawn.

2. Materials and Methods

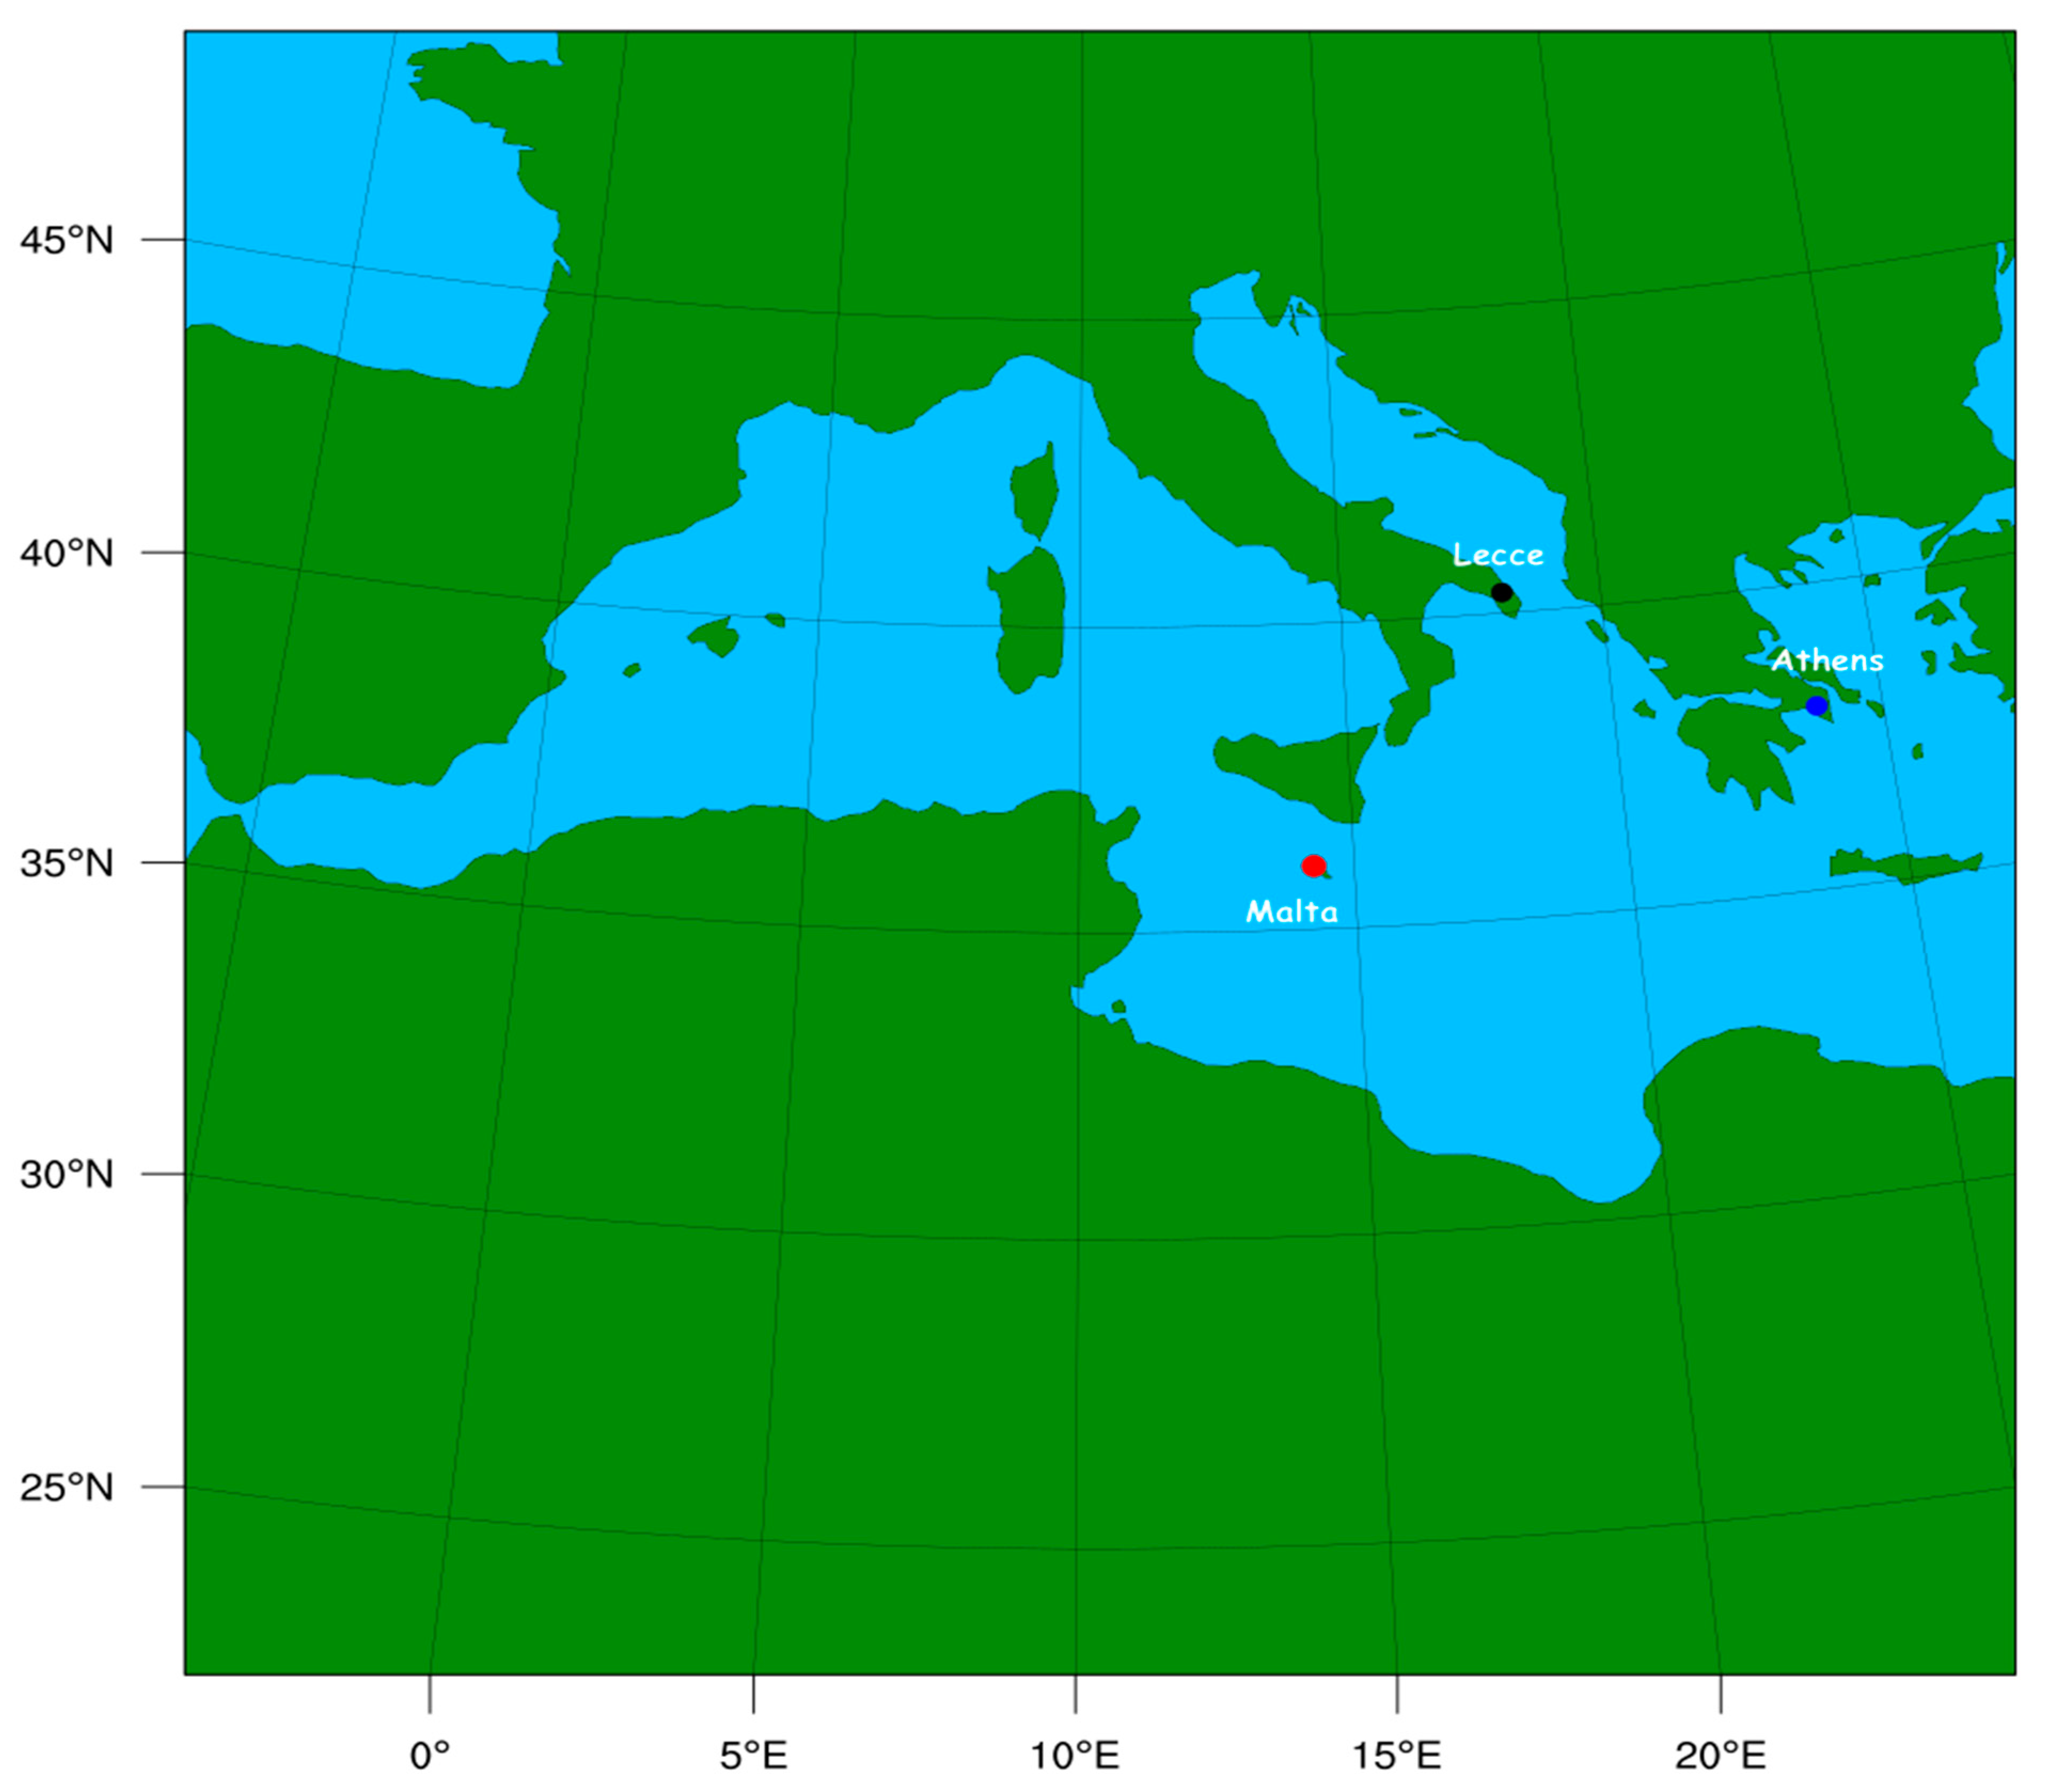
2.1. Description of the XMed-Dry Network and the Multiplatform Observations

2.1.1. Dry Deposition Measurements

Aerosol dry deposition was collected at three locations for this study: on the flat roof of the Engineering department building (Ecotekne campus) at Lecce (18.6° E, 40.2° N, 40 m above sea level/15 m above street level), on top of a measurement container in a pine forest at Athens (23.5° E, 37.6° N, 290 m above sea level/10 m above ground level), and on flat roof of a building at the edge of a housing area at San Lawrenz, Gozo (14.1° E, 36.0° N, 130 m above sea level/10 m above street level). A novel dry deposition collector with an active rain protection was used. The geometry of its sampling head follows the ‘flat-plate’ design as described by Waza et al. [31]. The function of the spacers in the given design was replaced by an external mounting frame, thus reducing the disturbance of the flow field between the plates. For additional rain protection, the outer part of the top plate is moved down around the lower plate in case of a positive signal from the rain detector sensor. The sampling substrate is positioned approximately 2 m above the roof. Samples were exposed to the atmosphere for 48 to 72 h, approximately. Particles were collected on a pure carbon adhesive (SpectroTabs, Plano GmbH, Wetzlar, Germany) mounted to a standard electron microscopy aluminum stub and stored in dry boxes at room temperature.
Particles were analyzed by automated scanning electron microscopy (FEI Quanta 400F ESEM, FEI, Eindhoven, The Netherlands) with attached X-ray fluorescence analysis (Oxford X-Max 120, Oxford Instruments, Abingdon, UK) under vacuum condition. Image acquisition was done at 100–150 nm/pixel resolution, and particle size was estimated from their projected cross-sectional area. Particle mass and aerodynamic diameter were estimated from their size assuming preferential flat orientation and a density based on the approximate composition from chemistry (for details refer to Waza et al. [31]). X-Ray fluorescence analysis time was chosen to allow for a minimum of 40,000 X-ray counts per particle. Quantification was carried out by the corresponding control software (Oxford Aztec 4.0). Prior to automated analysis, samples were visually inspected to avoid analysis of damaged samples surface areas. A total of 1500 to 5000 particles per sample were analyzed. More details of the data acquisition, quantification and processing have been previously reported [27].
Particles were classified according to their chemical composition [32]. This detailed classification was then summarized into dust, sea-salt and other particles groups. The dust particle group mainly consists of silicate and carbonate particles, but includes also iron and titanium oxides as well as other minerals, which only contribute negligibly to the total mass. The statistical uncertainty dominating the overall random error was estimated by a bootstrap approach and is reported in terms of the limits of the central 95% confidence interval.

2.1.2. PM10 Data

In this study daily mean PM 10 (particulate matter with aerodynamic diameter less than 10 µm) concentration values have been obtained by regional or municipal air quality monitoring networks in Lecce, Athens, and Malta by automatic devices. In particular, daily mean PM 10 values in Lecce have been obtained by the air quality monitoring network of the environmental protection regional agency (ARPA-Puglia) at the Lecce-Garigliano traffic urban monitoring station (18.1° E, 40.3° N). The second PM 10 measurement point was localized at a rural background site in Għarb, Gozo (14.2° E, 36.1° N). The third measurement point is located at the Demokritos suburban monitoring station in Agia Paraskevi, Attiki, Greece (23.8° E, 38.0° N).

2.1.3. AERONET AOD

AERONET [33] is a global network of nearly 1000 sun-photometers whose aerosol data are processed according to the same retrieval algorithm and made available online at the following web-portal [12]. For this study, we have utilized Version 3 AOD measurements at level-2 (cloud screened and quality checked) at the stations of Athens (Greece; 23.7° E, 38.0° N, 130 m elevation), Rome Tor Vergata (Italy; 12.6° E, 41.8° N; 130 m elevation) and Gozo (Malta; 14.3° E, 36.0° N, 111 m elevation). The station of Lecce (University) does not have valid level-2 data for the period considered and has been replaced by the above-mentioned Rome Tor Vergata site.

2.1.4. MODIS/MAIAC AOD

The MODIS Multi-Angle Implementation of Atmospheric Correction (MAIAC) is a recent advanced algorithm which uses time series analysis and a combination of pixel- and image-based processing to improve accuracy of cloud detection, aerosol retrievals and atmospheric correction [34]. MAIAC provides a suite of atmospheric and surface products in Hierarchical Data Format for the NASA Earth Observing System (HDF4_EOS), including daily atmospheric properties (MCD19A2). For each Terra/Aqua orbit, the MAIAC daily MCD19A2 file includes, among other things, the: (i) over land AOD and type; and (ii) the over water AOD outside of glint area and Fine Mode Fraction (FMF). Data access is granted through the NASA/USGS Earthdata search portal [35] from which AOD-HDF4 data may be downloaded for the selected domain and time interval of interest. The current MODIS Collection 6 MAIAC algorithm has changed considerably since its first release [36] to adapt to global processing and improve cloud/snow detection, aerosol retrievals and atmospheric correction of MODIS data [37].

2.2. Model Setup and Description

For this study, the WRF-Chem model version 3.6.1 has been utilized in the numerical domain depicted in Figure 1. It is important to remark that all the code alterations reported by Ukhov et al. [38] and LeGrand et al. [23], have been manually incorporated in this version. The numerical domain covers the northern regions of Sahara Desert and part of Europe, with 300 × 300 points with a horizontal grid spacing of 10 km. The simulation started on 10 April 2018 (0000 UTC) and ended on 17 April 2018 (0000 UTC). Boundary and initial conditions are at 1-degree resolution and provided from NCAR/NCEP Final Analysis from Global Forecast System (FNL from GFS).
Based on the WRF setup described in the work by Rizza et al. [39] for the Northern Sahara and the Mediterranean basin, the following physics parameterizations are utilized: the Mellor–Yamada–Nakanishi and Niino (MYNN) 2.5 level turbulent kinetic energy (TKE) parameterization is used to describe the planetary boundary layer and surface layer scheme [40]. The Rapid Update Cycle (RUC) Land Surface Model is chosen to represent the land surface processes [41]. The radiation physics is parameterized using the Rapid Radiative Transfer Model [42] for both short-wave (ra_sw_physics = 4) and long-wave (ra_lw_physics = 4). The Improved Bulk Microphysics Scheme of Thompson et al. [43] is used for the treatment of the microphysics processes (Table 1).
The WRF-Chem setting related to the aerosol model concerns the hybrid bulk/sectional Georgia Tech/Goddard Global Ozone Chemistry Aerosol Radiation and Transport (GOCART, [44]) model. This is implemented in WRF-Chem model selecting the namelist variable chem_opt = 300 (Table 2). As shown in Table 3 and Table 4 it considers five and four dust bins with diameters in the range (0–20) µm for the two dust emission schemes described below.
Table 3 and Table 4 show the effective diameter that is used in the specialized routine that calculates the gravitational settling deposition. In the WRF-Chem releases above 4.0 (June 2018) the number and diameter of dust bins are consistent between the two emission schemes.
The physics of the emission of dust is described with great details in a recent review by LeGrand et al. [23], in which the authors have analyzed the principal mechanisms responsible for the process of soil particles mobilization. In particular, three basic processes are responsible for the entrainment of dust particles in the atmospheric flows: (1) aerodynamic lift, (2) saltation bombardment, and (3) particle disaggregation. These three processes generate the lifting of a wide size spectrum of soil particles, from sand sized grains at around 70 µm by aerodynamic wind shear, down to smaller dust-sized particles at 0.1 µm (saltation bombardment and disaggregation).
There are actually three different dust emission schemes implemented into the WRF-Chem 3.6.1 model using the GOCART aerosol chemistry core (chem_opt = 300): the GOCART-WRF scheme (dust_opt = 1), the AFWA scheme (dust_opt = 3), and the University of Cologne (UoC-S01) scheme (dust_opt = 4).
Both AFWA and UoC-S01 emission schemes were introduced in WRF-Chem, because the GOCART-WRF original model revealed some issues with the dust emission scheme [23], making this parameterization [45] not appropriate under certain environmental conditions [23].
Specific details of the AFWA dust emission scheme, which may be considered a modification of the Marticorena and Bergametti [46] emission model, is already described in a work by LeGrand et al. [23] so it will not be replicated here. It is important to remark that in this scheme the dust emission is controlled by the saltation of larger particles that are triggered by wind shear at the surface leading to the emission of smaller particles by saltation bombardment. The vertical bulk dust flux is calculated as [23,47]
{ F b u l k = G × E R O D γ × β z 0 0.2   m F b u l k = 0   z 0 > 0.2   m
where G is the total streamwise horizontal saltation flux ([23], eq.13), β = 10 0.134 ( % c l a y 6 )   is the sandblasting mass efficiency calculated considering only the soil clay fraction; γ is the exponential tuning constant for erodibility. The fraction of erodible grid cell is represented by the EROD parameter which is provided by the WRF-Chem preprocessor (WRF Preprocessing System). Once the total bulk emission ( F b u l k ) is established, size-resolved dust emission fluxes (g cm−2 s−1) are obtained according to a size distribution that is hardcoded in the AFWA dust emission subroutine.
The University of Cologne (UoC-S01) scheme is activated in WRF-Chem by setting dust_opt = 4 and dust_schme = 1, in the chem-section of the WRF input namelist. It was firstly introduced by Shao [30] and further documented in Kang et al. [48], Su and Fung, [22], Rizza et al. [9,25], LeGrand et al. [23], and Zeng et al. [49].
The UoC-S01 scheme may be considered a spectral emission scheme because it is based on a size-resolved dust emission equation by supposing that particles are divided into a finite number of particle size intervals. Then the total dust flux (F) is expressed as an integral of the dust emission rate
F = d i d s 0 d i f ( d i , d s ) p ( d i ) p ( d s ) δ d i δ d s
where f ( d i , d s ) is the emission rate for particles of size d i generated by the saltation of particles of size d s [9,30]. Full details of the UoC-S01 formulation may be found in Shao [30], Kang et al., [48] and LeGrand et al. [23].
In this context, UoC-S01 and AFWA schemes in WRF-Chem follow the same general algorithm. The main difference between the two schemes is that the more elaborated UoC-S01 algorithm uses size-resolved saltation particle bins already at the level of the saltation process. Another difference concerns the calculation of the threshold friction velocity, the UoC-S01 scheme uses an additional correction factor caused by surface roughness elements, and commonly referred to as the drag partition correction [23]. Concerning the calculation of the threshold friction velocity, the differences between the two schemes is showed in Figure A1 of Appendix A. It is evident the largest positive difference of the quantity ( u u t ) for the AFWA scheme (panels b, d) compared to UoC (panels a, c). This quantity is of primarily importance because it defines the emission of dust at each appropriate grid point.
The removal processes consider both dry and wet deposition. A dry deposition scheme [50] accounting for gravitational settling and surface deposition is used to simulate the dry removal of mineral dust. A wet deposition scheme, which considers the total precipitation from both the microphysical and convective parameterizations, is used for natural (sea-spray and mineral dust) aerosols [22]. In particular, the gravitational settling routines actually implemented in WRF-Chem utilizes the Stokes law corrected by the Cunningham slip factor [51] for calculating the terminal fall velocity for each effective diameter (Table 3 and Table 4).

3. Results

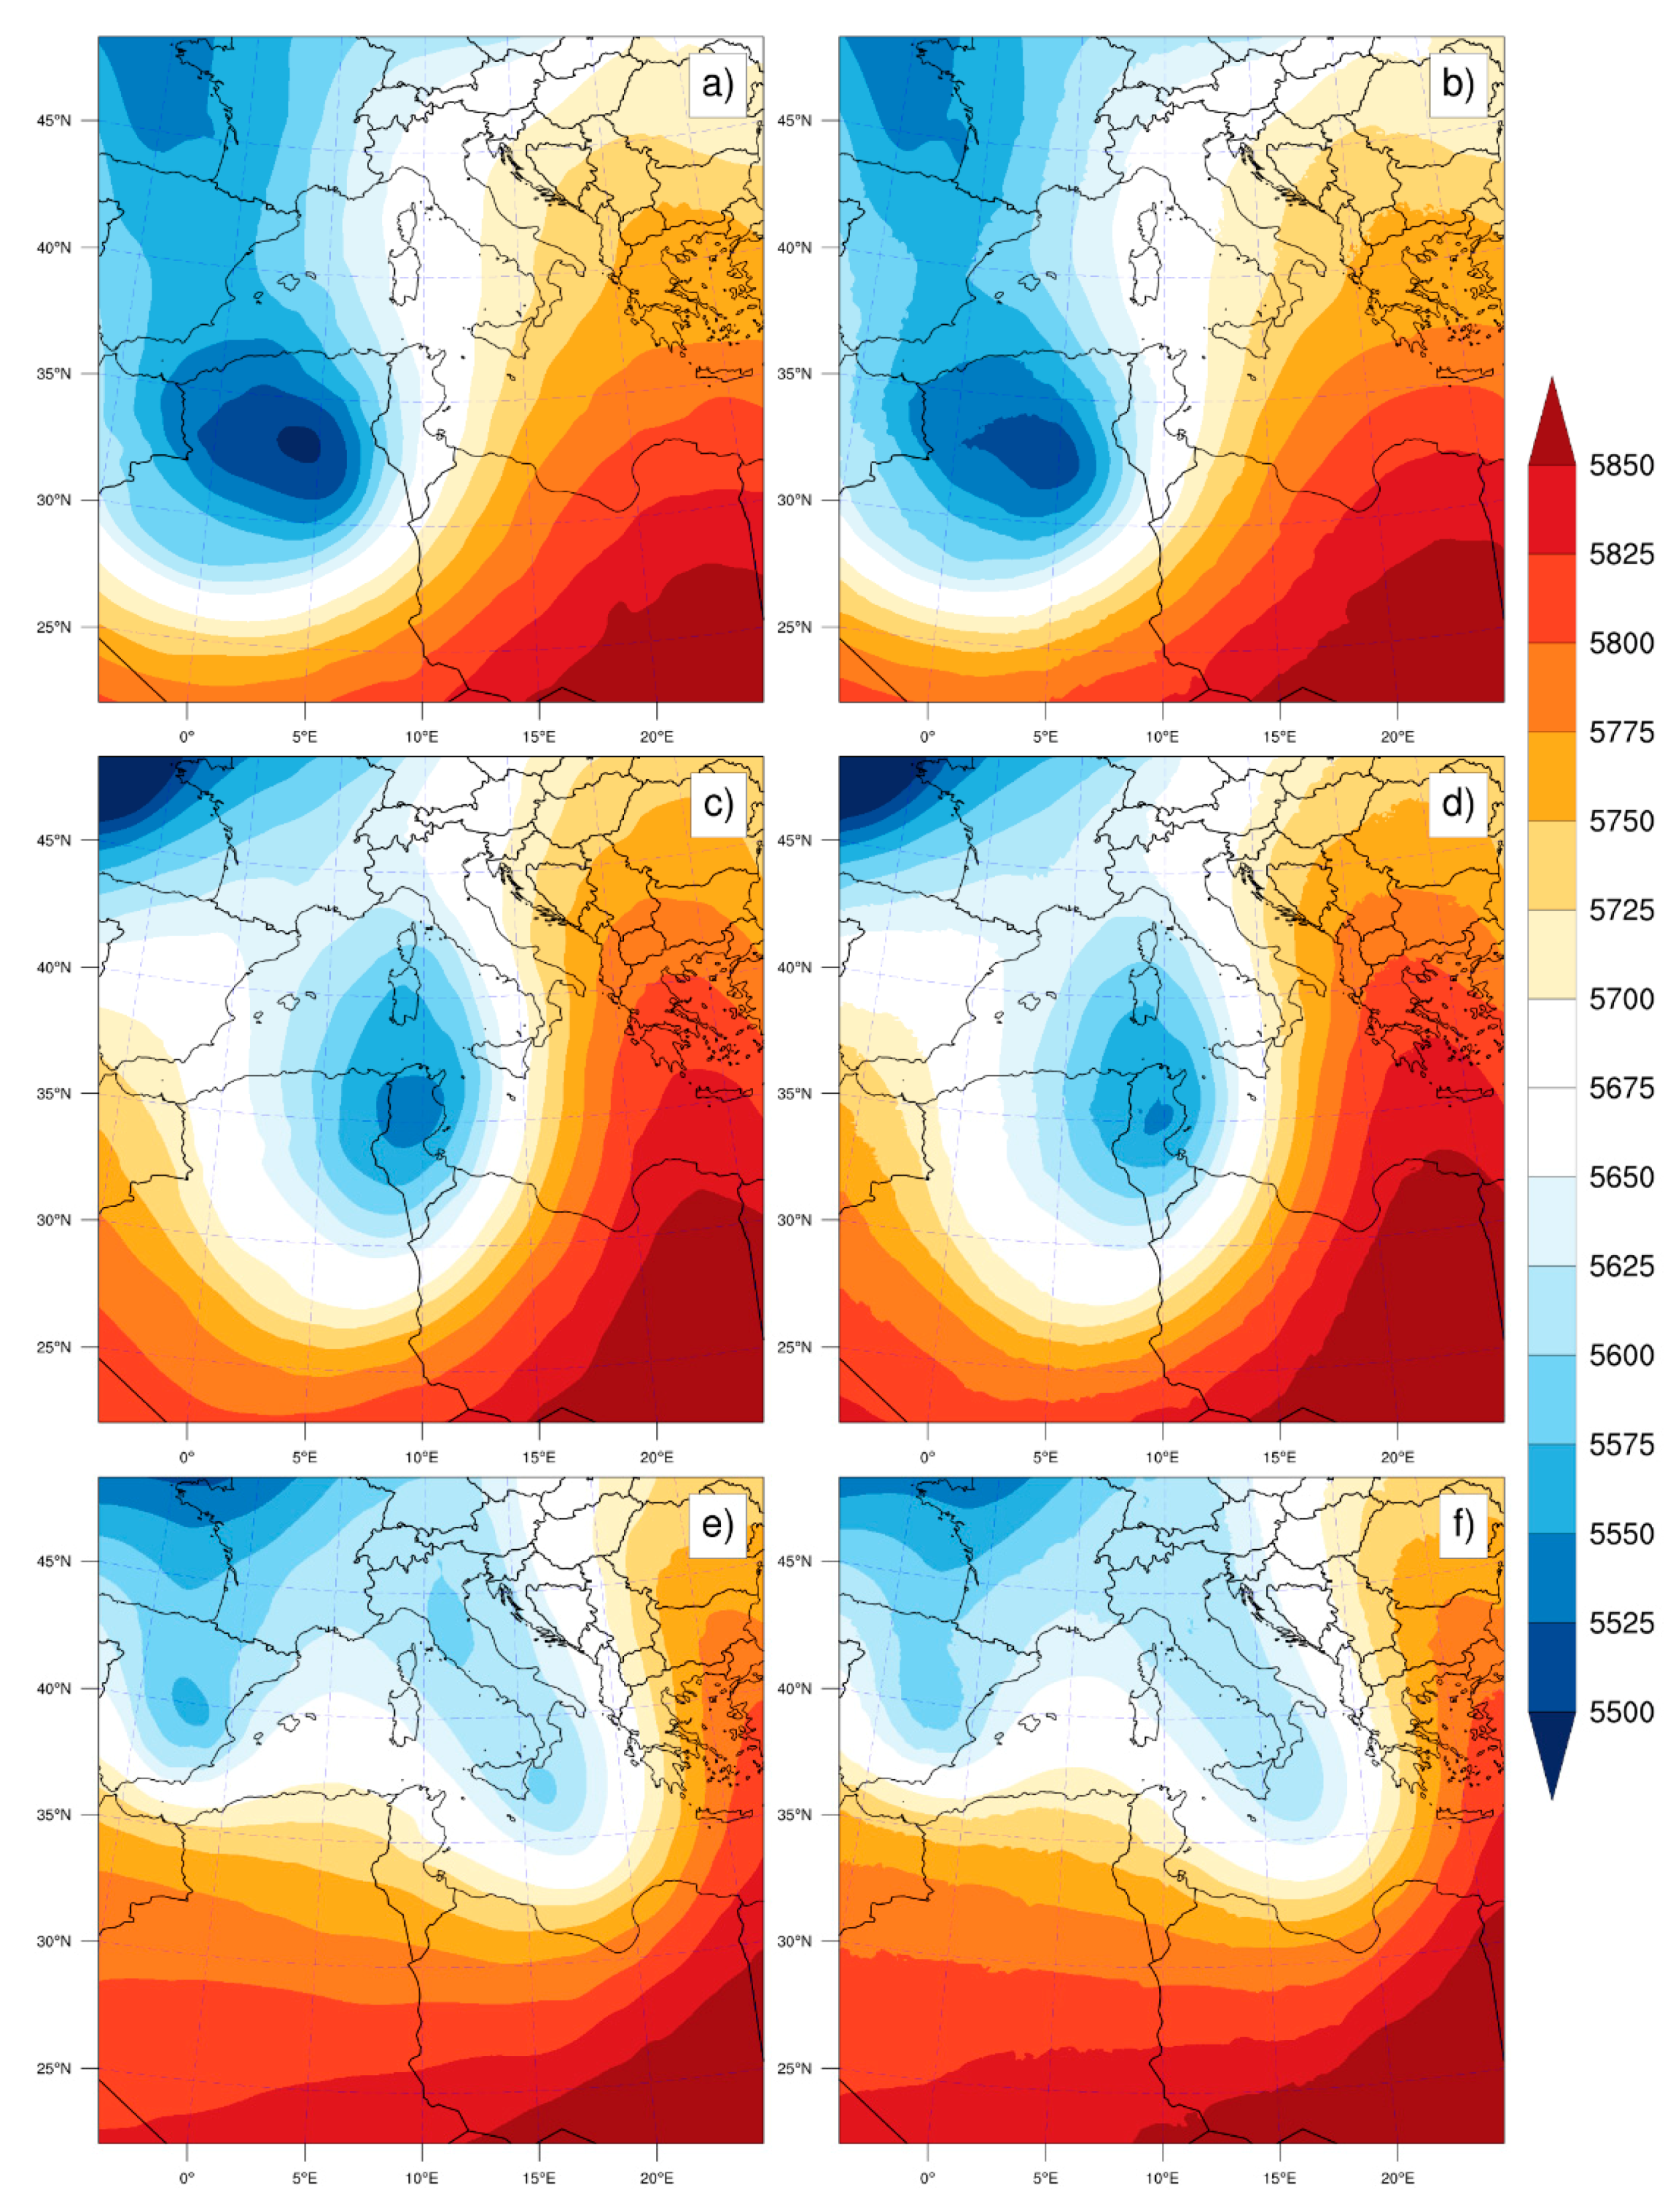
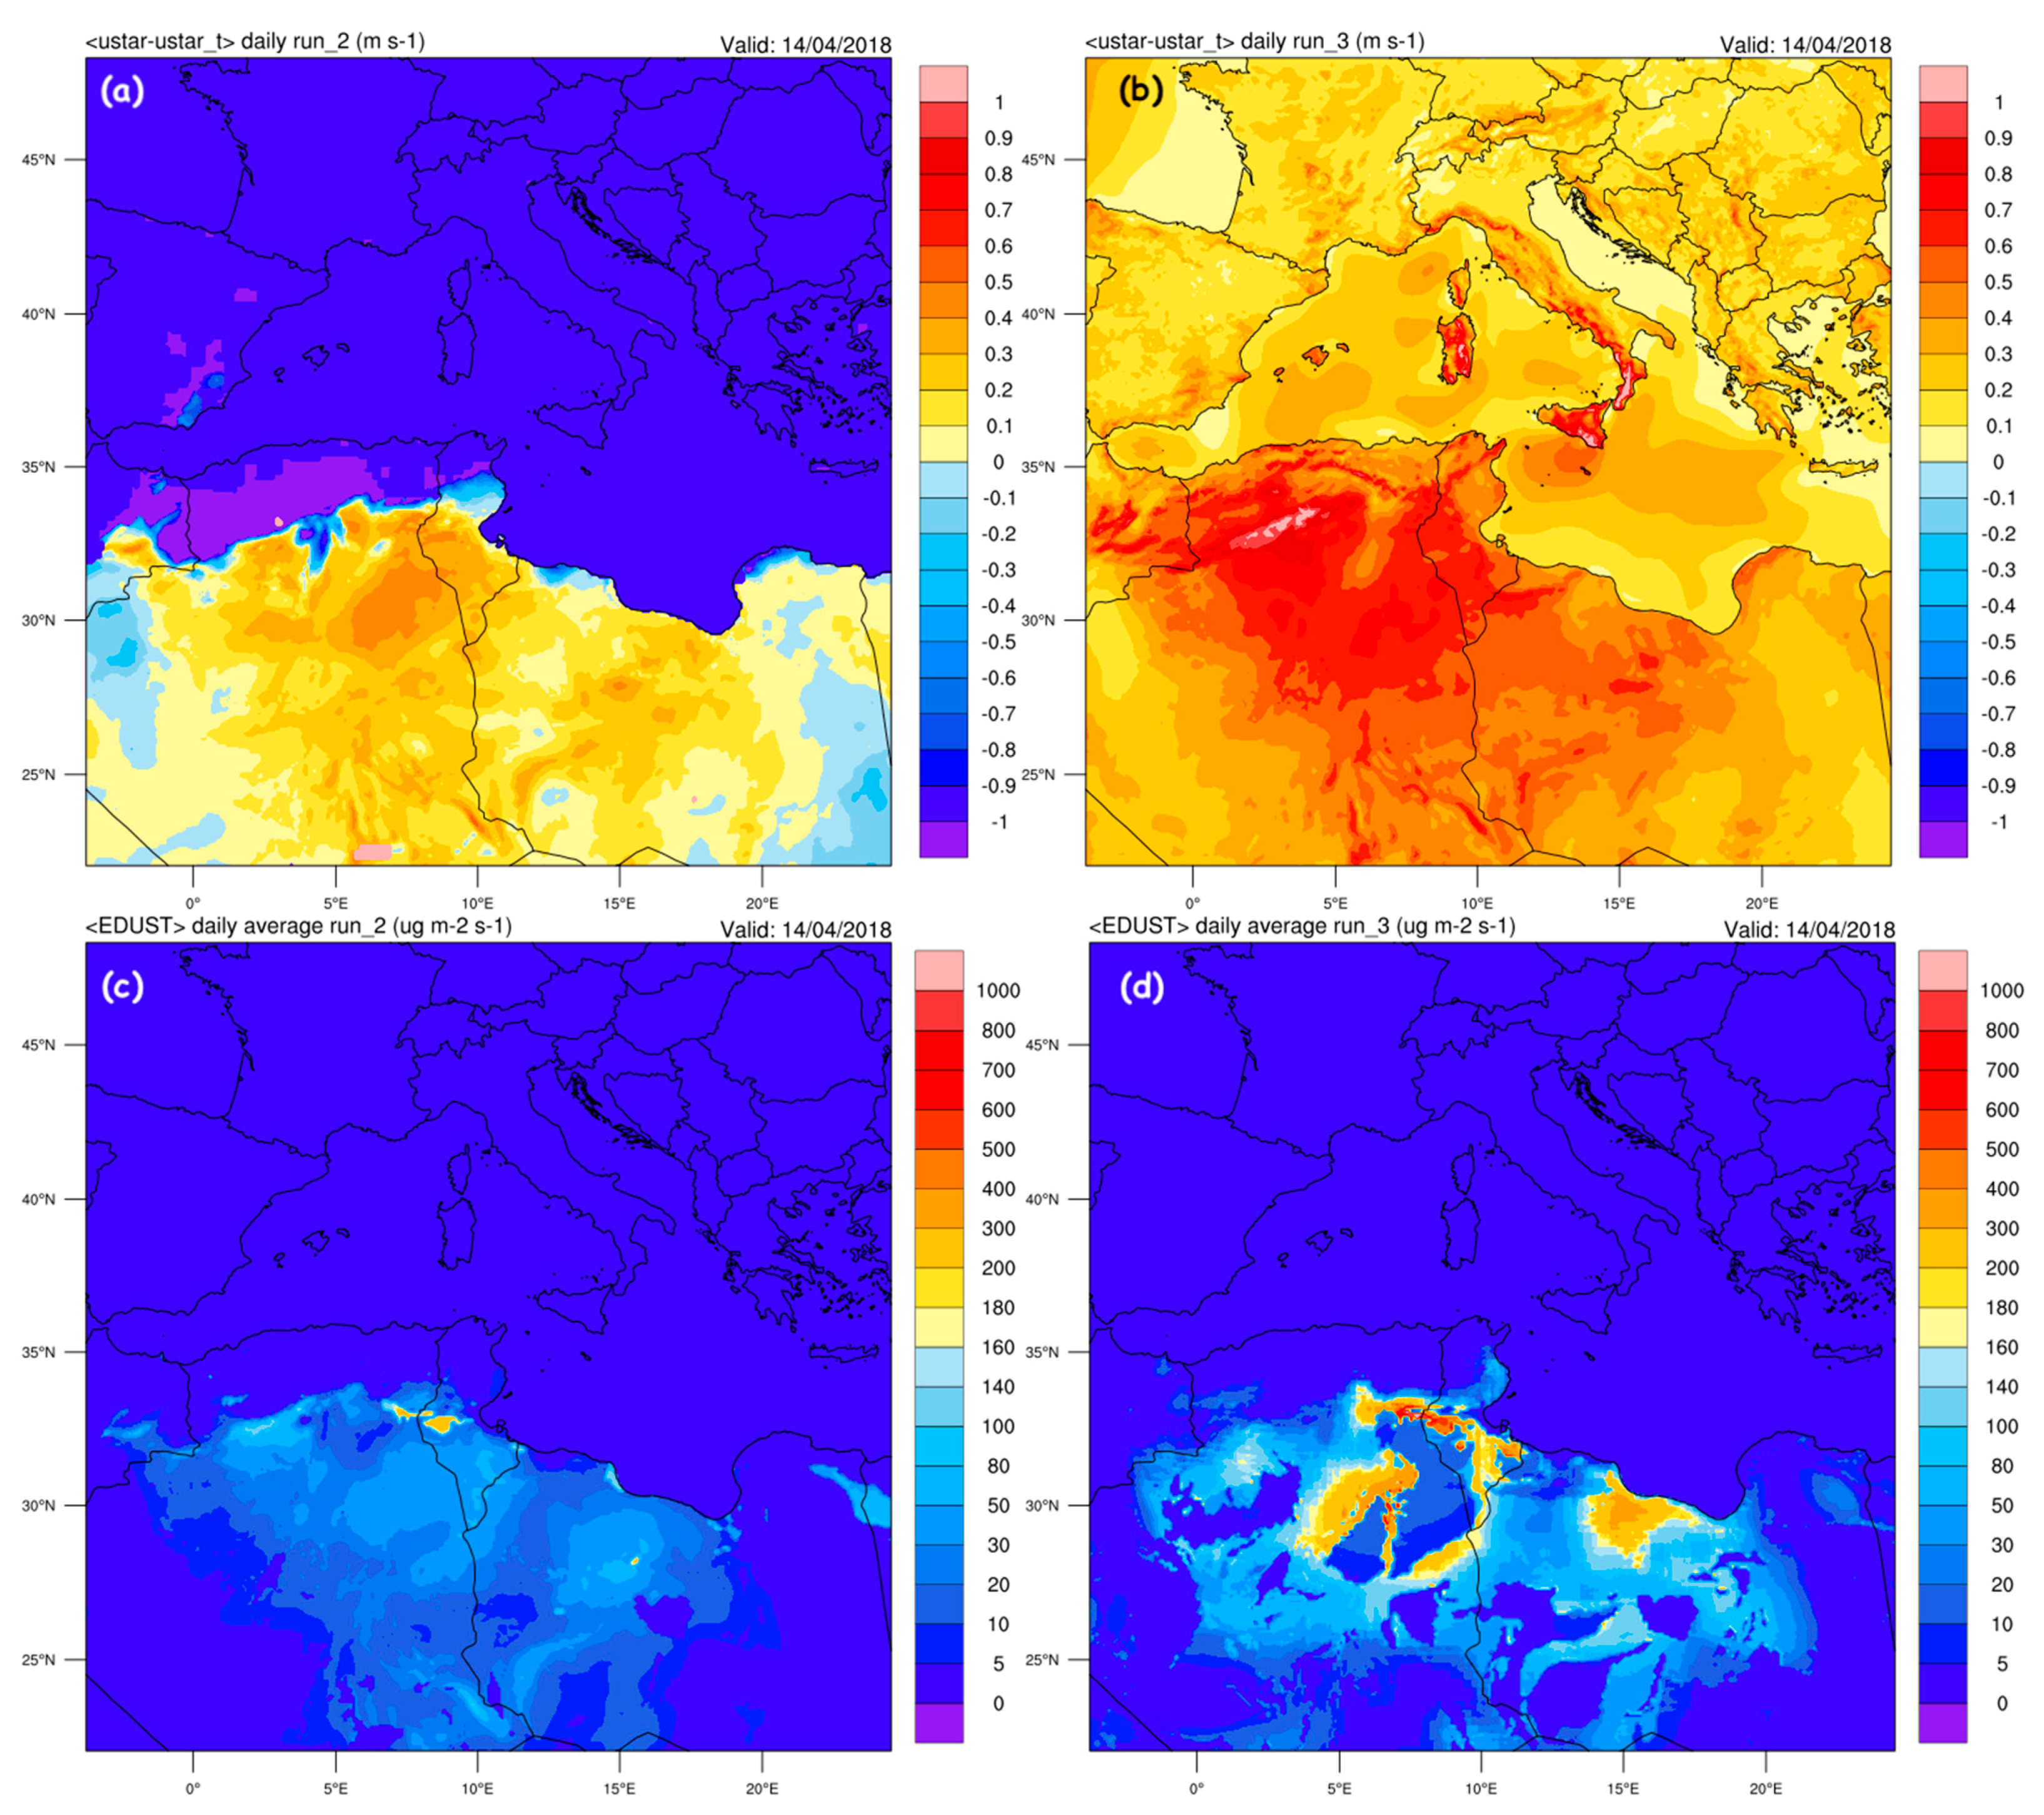
3.1. Events Description by ERA5 Reanalysis and MODIS Retrievals

This event was chosen by making a preliminary cross-checking in which we have considered the following criteria: (i) plume intrusion in Mediterranean basin with the highest AOD values; and, (ii) availability of Xmed-dry data. Considering that XMed-dry campaign started in 2017 with a series of Intensive Observation Periods, the period (14–16 April 2018) we have investigated was the only one satisfying the two criteria above.
The synoptic analysis of the dust event is described using the ERA5 reanalysis of the geopotential at 500 hPa. The geopotential is obtained downloading data from the Copernicus Climate data store [52]. In particular, the selected dataset concerns the ERA5 hourly data on pressure levels (1979 to present) from which the geopotential at 500 hPa may be downloaded in GRIdded Binary (GRIB) format. ERA5 represents the fifth generation of European Centre for Medium-Range Weather Forecasts (ECMWF) atmospheric reanalysis of the global climate. It combines model data with observations from across the world into a globally complete and consistent dataset [53]. ERA5 [54] is produced using 4D-Var data assimilation in the ECMWF’s Integrated Forecast System (IFS), with 137 sigma/pressure levels in the vertical and 31 km horizontal resolution.
Figure 2a–f shows the comparison between the geopotential height at an atmospheric pressure of 500 hPa predicted by the WRF-Chem (Figure 2b,d,f) and GRIB data downloaded from ECMWF/ERA5-reanalysis (Figure 2a,c,e). Data are displayed for 14 April at 06:00 UTC (upper panel), 15 April 1at 06:00 UTC (central panel) and 16 April at 18:00 UTC (bottom panel). On 14 April, ERA5-reanalysis (Figure 2a) shows a pressure minimum localized in the internal regions of Algeria fostering a southern circulation in the central Mediterranean basin. The following day (15 April), ERA5-reanalysis depicts that the pressure minimum is dislocated toward Tunisia reinforcing the circulation toward Italy. On 16 April at 18:00 UTC, the weakening of the pressure minimum is evident with the consequent zonal circulation (west–east) on the central and eastern Mediterranean basin.
It is evident the close reproduction of the ERA5 (Figure 2a,c,e) geopotential at 500 hPa by WRF-Chem model (Figure 2b,d,f). This is quite important as the long-range transport of dust plumes is governed by these high-tropospheric winds. These synoptic conditions are extremely favorable for the generation and transport of Saharan dust toward the Mediterranean basin for two reasons: (i) the presence of a low-pressure system and relative high winds speed on the Northern Sahara Desert; and the consequent (ii) southern wind circulation on the Mediterranean basin.
The transport of Saharan dust may be further verified by analyzing Figure 3 that represents the time averaged (14–16 April) map of MODIS/AOD at 550 nm. It is calculated combining the dark target (DT; [15]) and deep blue (DB; [55]) algorithms for land and ocean. The final product depicted at Figure 3 is obtained by merging MODIS-Terra (MOD08_D3 v6) and MODIS-Aqua (MYD08_D3 v6) intermediate maps. The extent of the dust plume represented by the time average map of Figure 3 reports the strong intrusion of Saharan dust (AOD peak ~2.0), from the emission regions encompassing the Sahara Desert portion of Algeria and Tunisia [4] toward southern Italy (15 April) and the eastern Mediterranean regions (16 April).

3.2. Comparison with XMed-Dry Measurements

In Table 5 the sampling periods are shown in the sampling site of Lecce (sample code: LES), San Lawrenz-Gozo (sample code: SLS) and Athens (sample code: ATS). The sampling periods, from 11 April to 16 April, covered the dust intrusion as can be verified by the presence of dust in the samples.
In Table 6, for each XMed-Dry investigated sample, it is reported the dust deposition rates by classification with the respective confidence intervals, total deposition rates and non-dust fraction. Dust and total deposition rates as well as the non-dust fraction have been obtained for particles which estimated volume-equivalent diameters range between 0.625 and 10 µm. In the last column of the Table 6 we have reported the average PM 10 concentration (obtained by daily values shown in Table 7, Table 8 and Table 9) for the investigated periods. Details of measurements are already described in paragraph 2.1.1. The deposition rate of the WRF-Chem model is calculated by considering the gravitational settling (GRASET_# variable) and the dust dry deposition for each size bins (DRYDEP_# variable) and summing all bins as depicted in the following Equation (3):
dep _ rate = i ( GRASET i + DRYDEP i )
This permits a comprehensive comparison between XMed-dry measurements and model outputs. The model results (dep_rate) for the run_2 and run_3 configurations are shown in the second and third columns of Table 6. For each XMed-dry sampling site, the variables of Equation (3) are extracted from the WRF-Chem netCDF output file in correspondence of the appropriate (lat, lon) coordinates of each station. To have a proper comparison between experimental data and model, dep_rate values are normalized using the same units (mg m−2 day−1).
If we consider the mean values that are calculated by averaging over all periods and stations and reported in the last row of Table 6, it results a positive bias (under-estimation) equal to 2.5 mg m−2 day−1 for run_2 and a negative bias of −4.6 mg m−2 day−1 corresponding to a considerable over-estimation for run_3.
The non-dust fraction (sixth column of Table 6) represents the abundance of particle mass not classified as dust. For the presented days, this non-dust fraction was mainly composed of sea-salt, but contained also sulfate particles (sodium/calcium/ammonium/potassium/magnesium sulfate and mixtures thereof) to a lesser extent. As can be seen, for all the samples the dust component is dominant except for the SLS_149 sample (Malta site). In fact, for all samples non-dust fraction ranges between 0.09 and 0.01, while for SLS_149 one non-dust fraction is 0.49, i.e., dust always dominates the total deposition.
Observing average PM 10 concentration values, obtained by daily values of air quality monitoring networks in Lecce, Athens, and Malta, good site-specific relative agreement with XMed-Dry total deposition rates is found. However, it appears that the same PM 10 concentration leads to different deposition rates at the different locations, which might indicate local conditions.

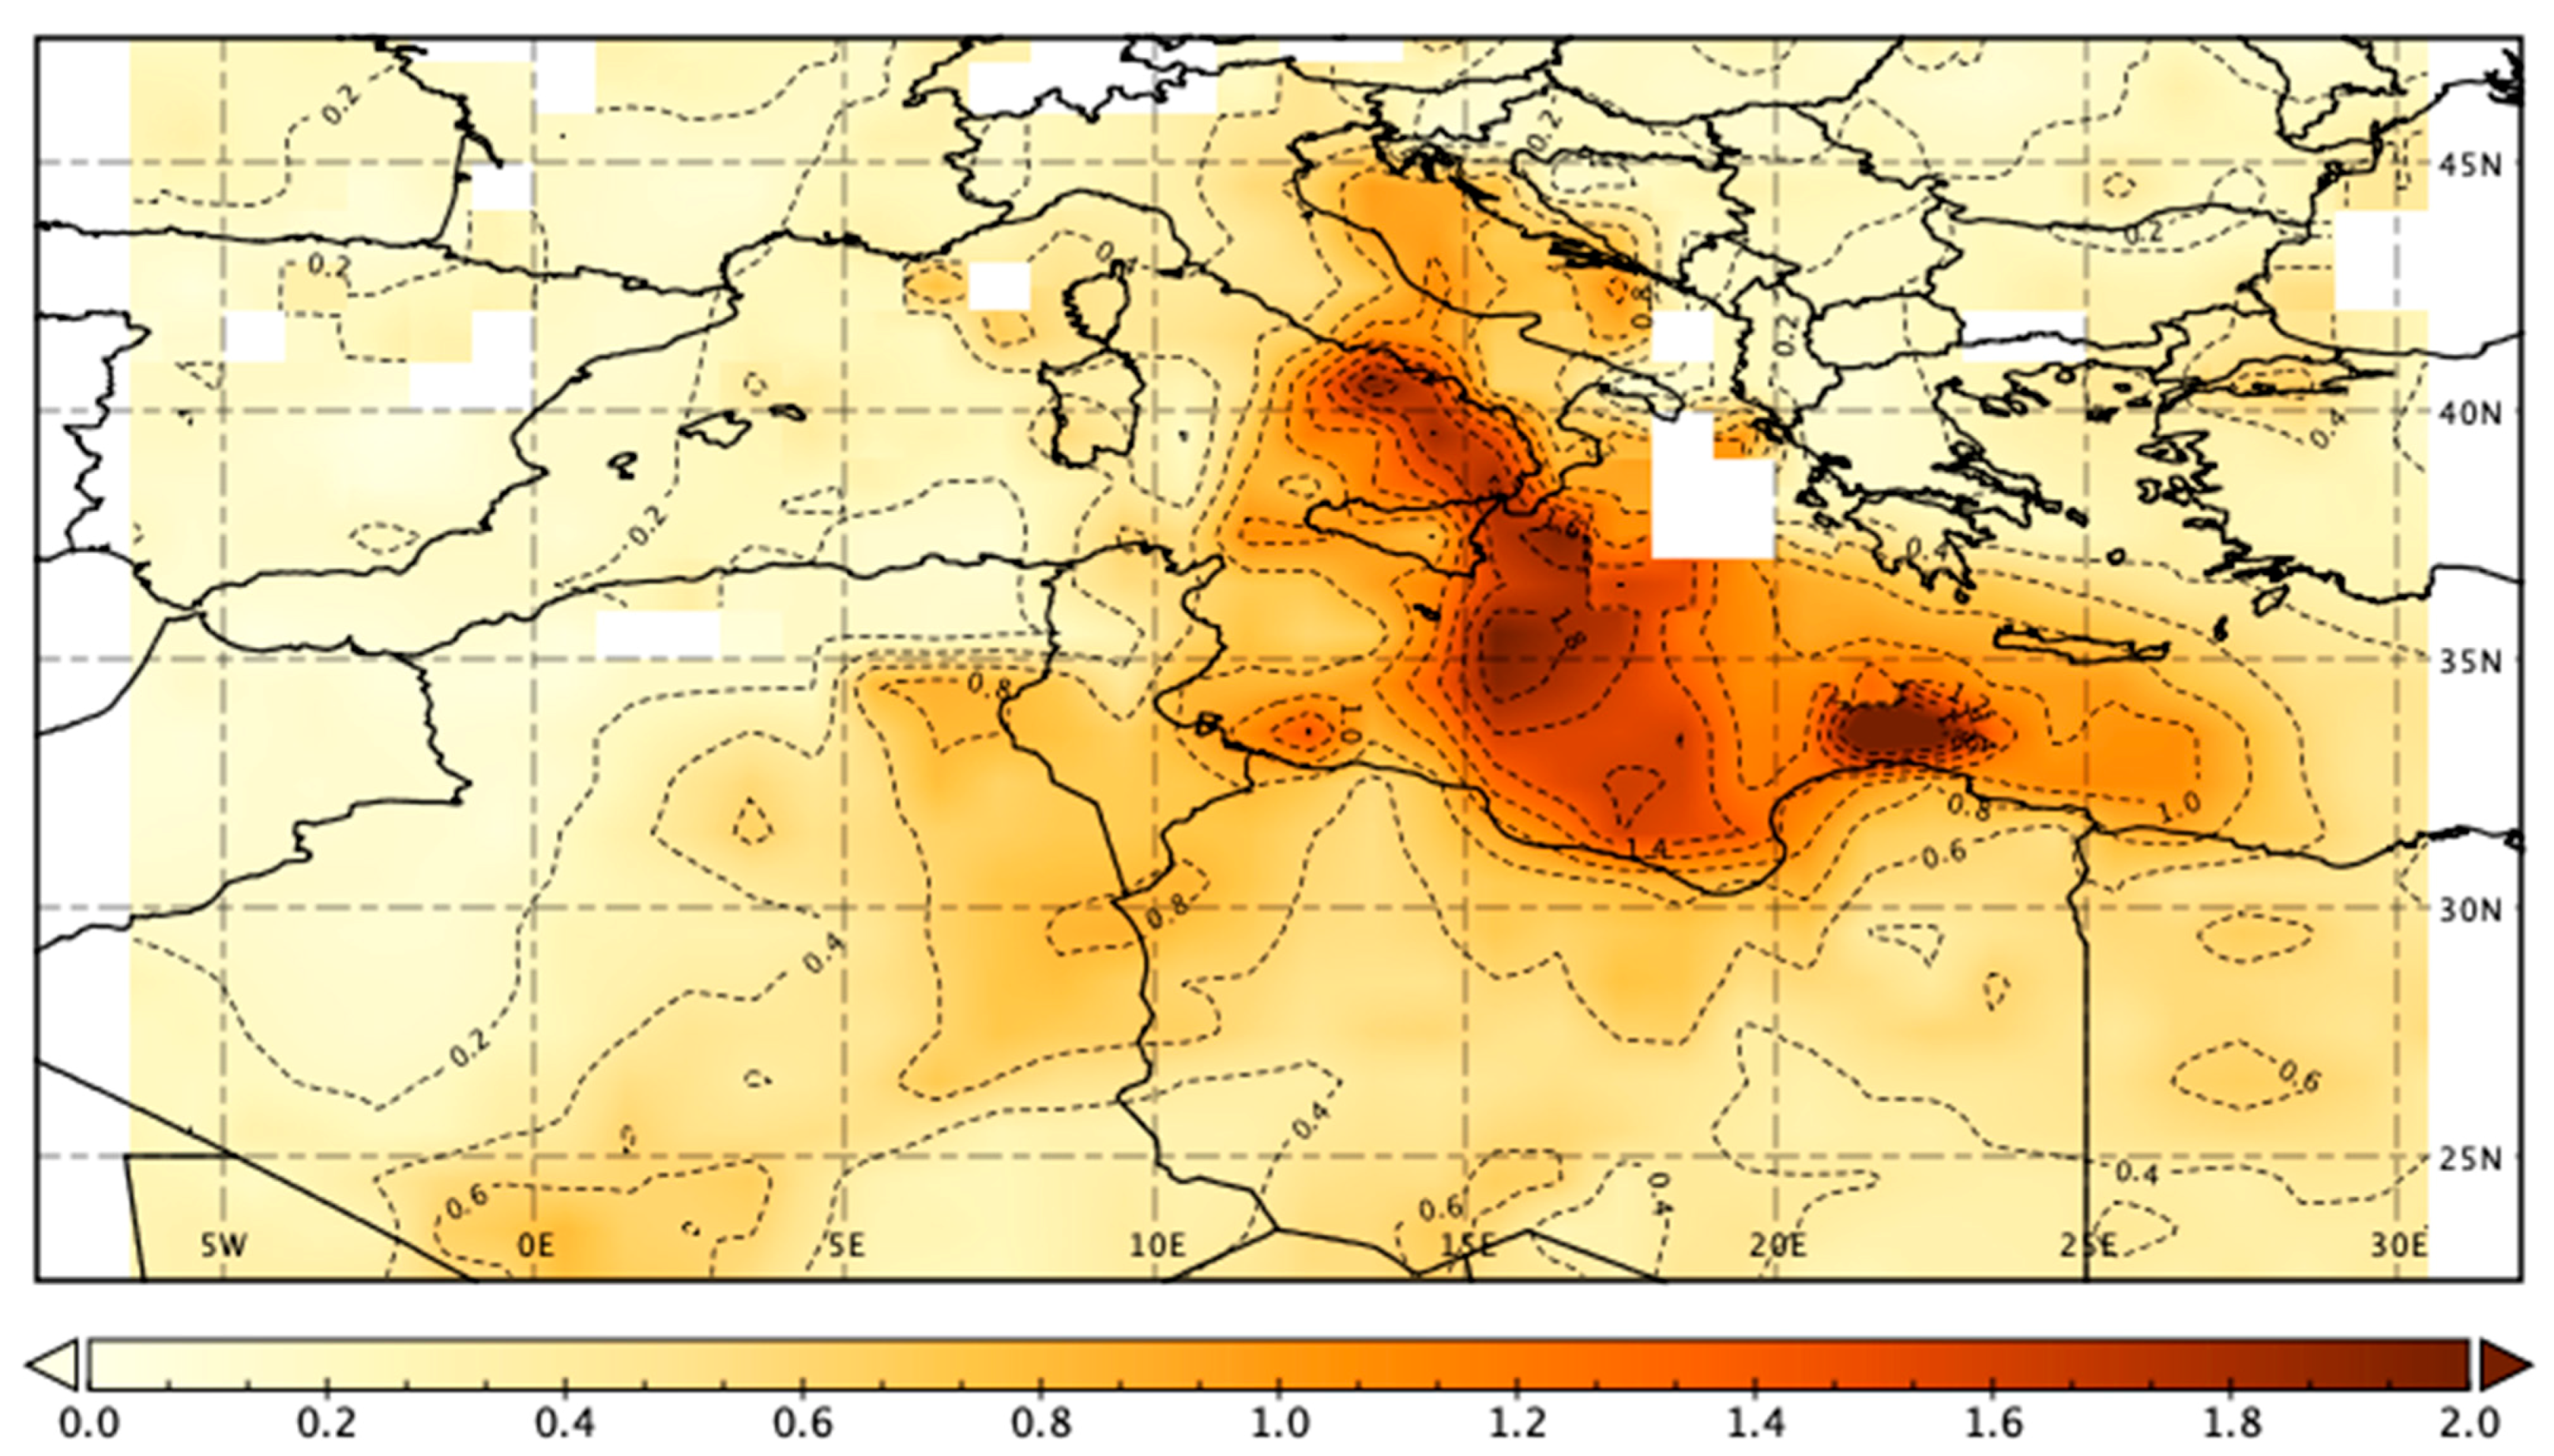
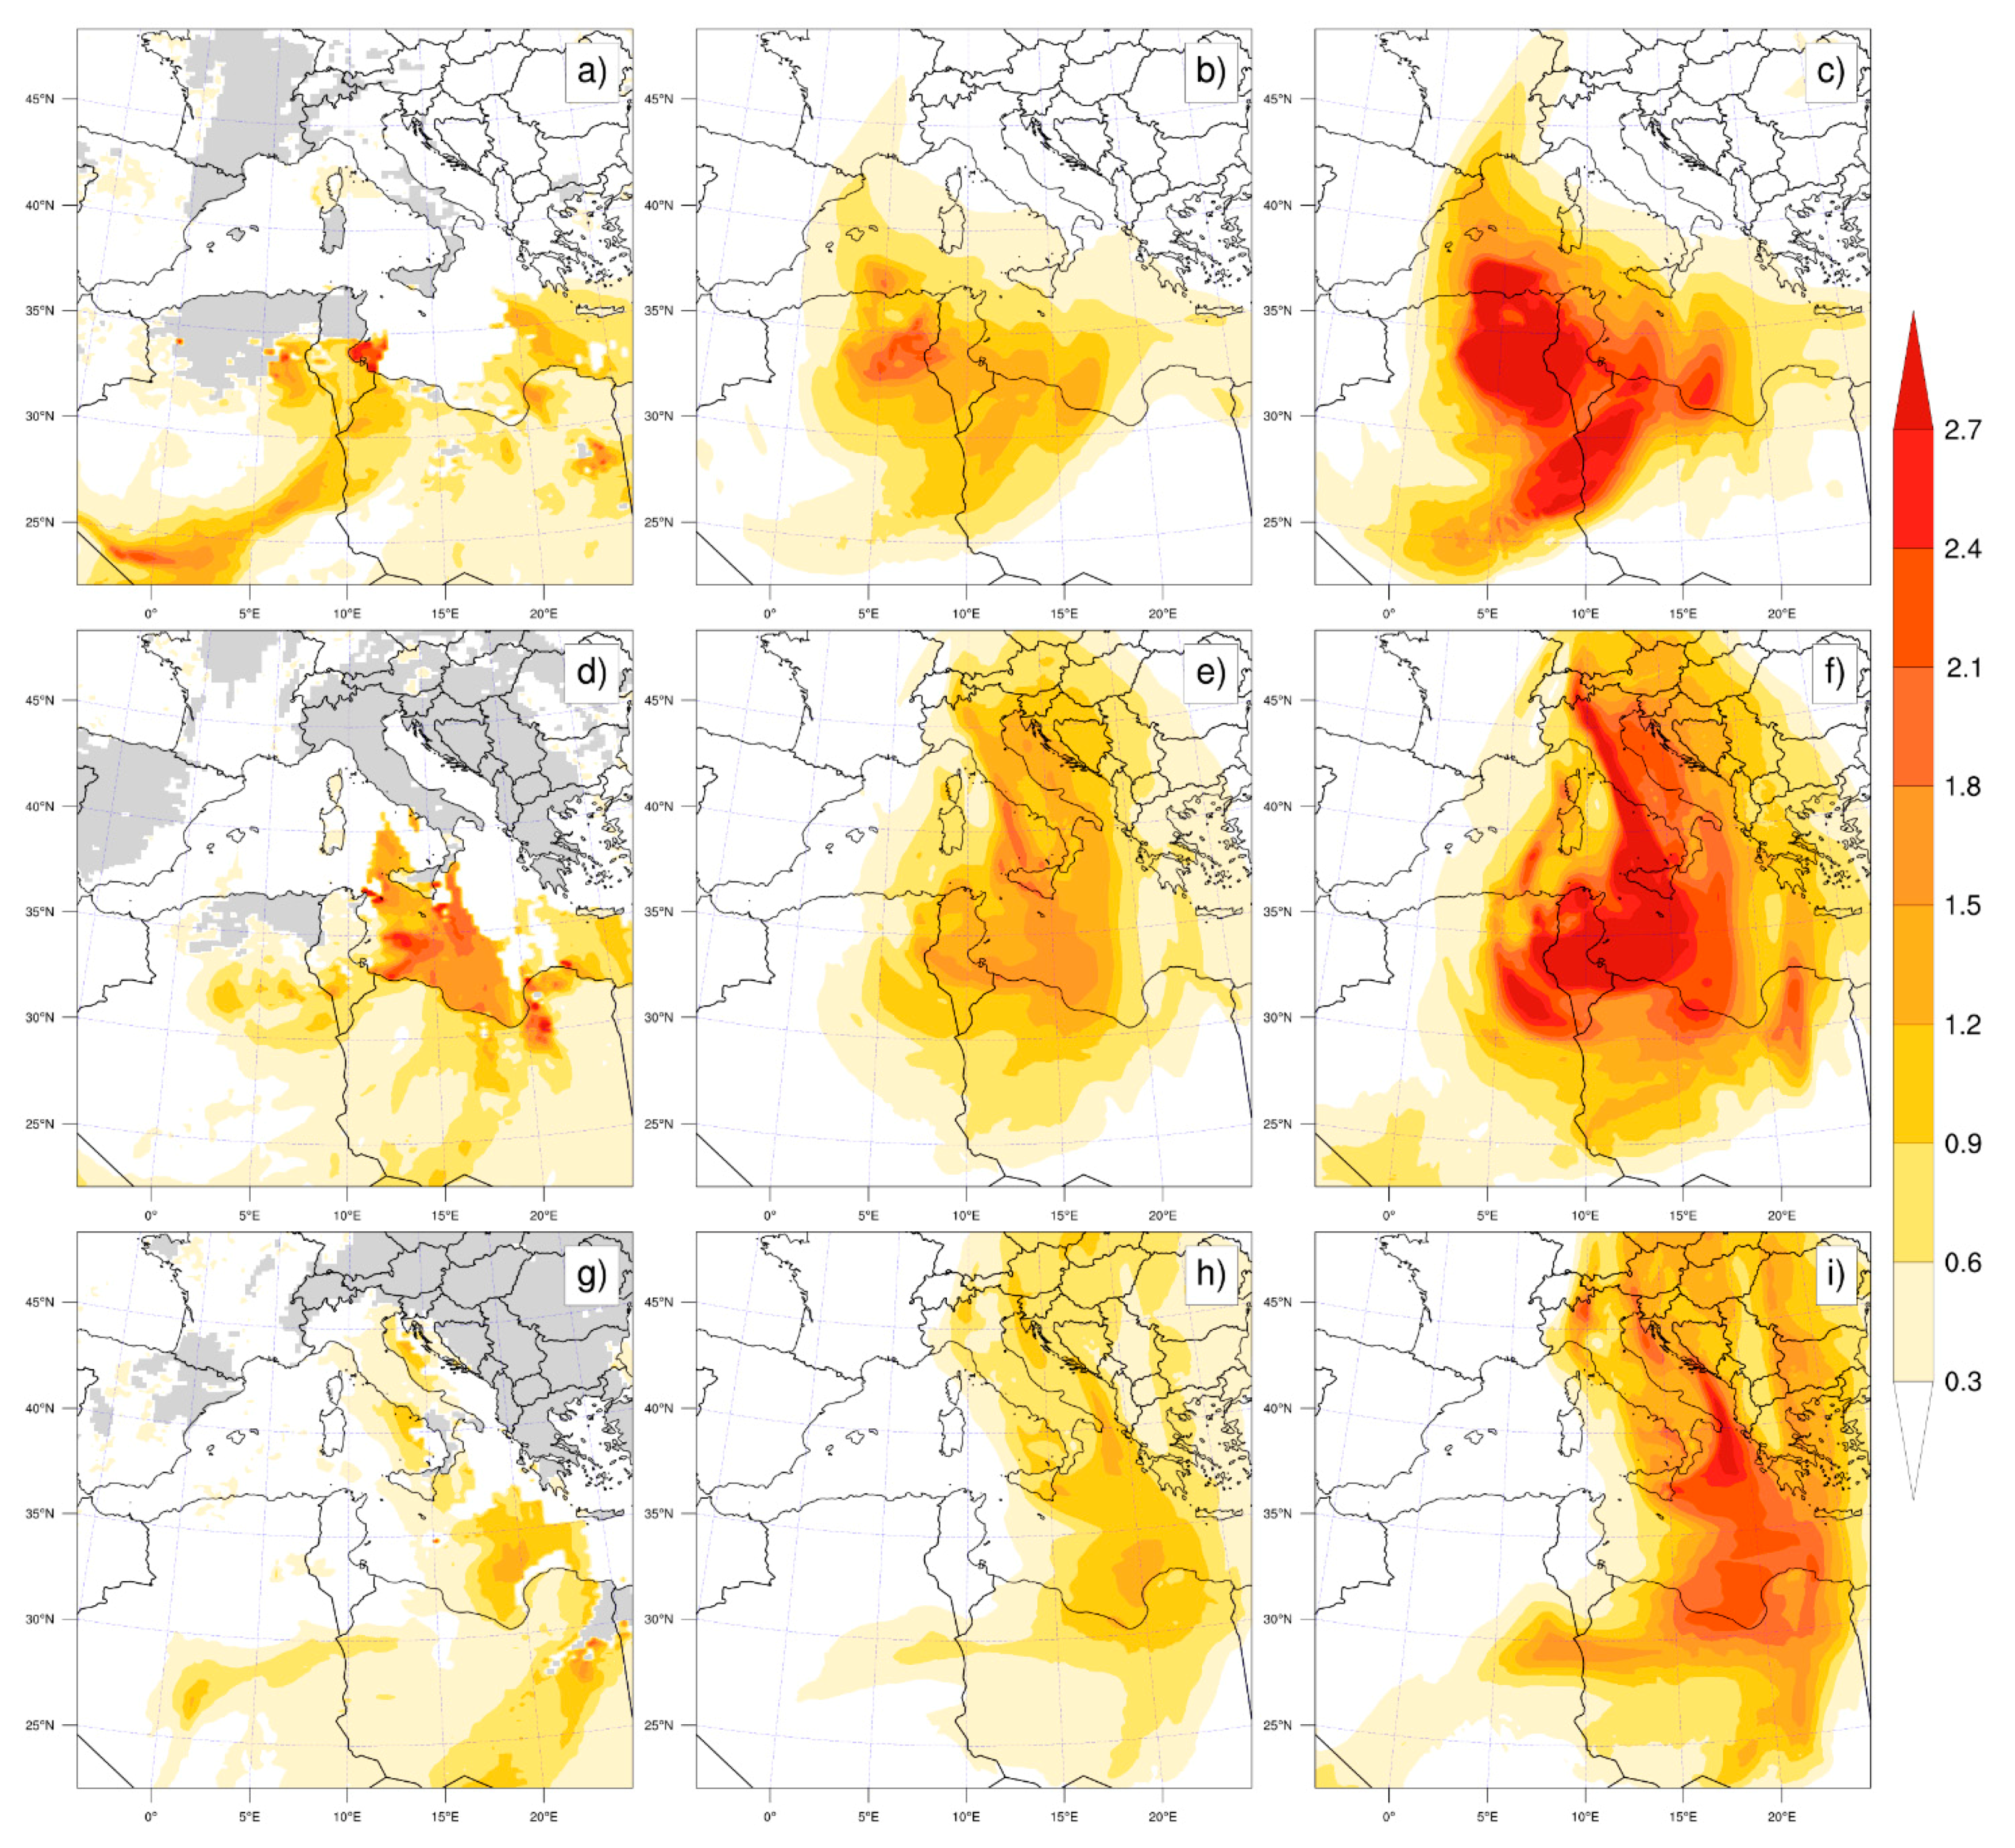
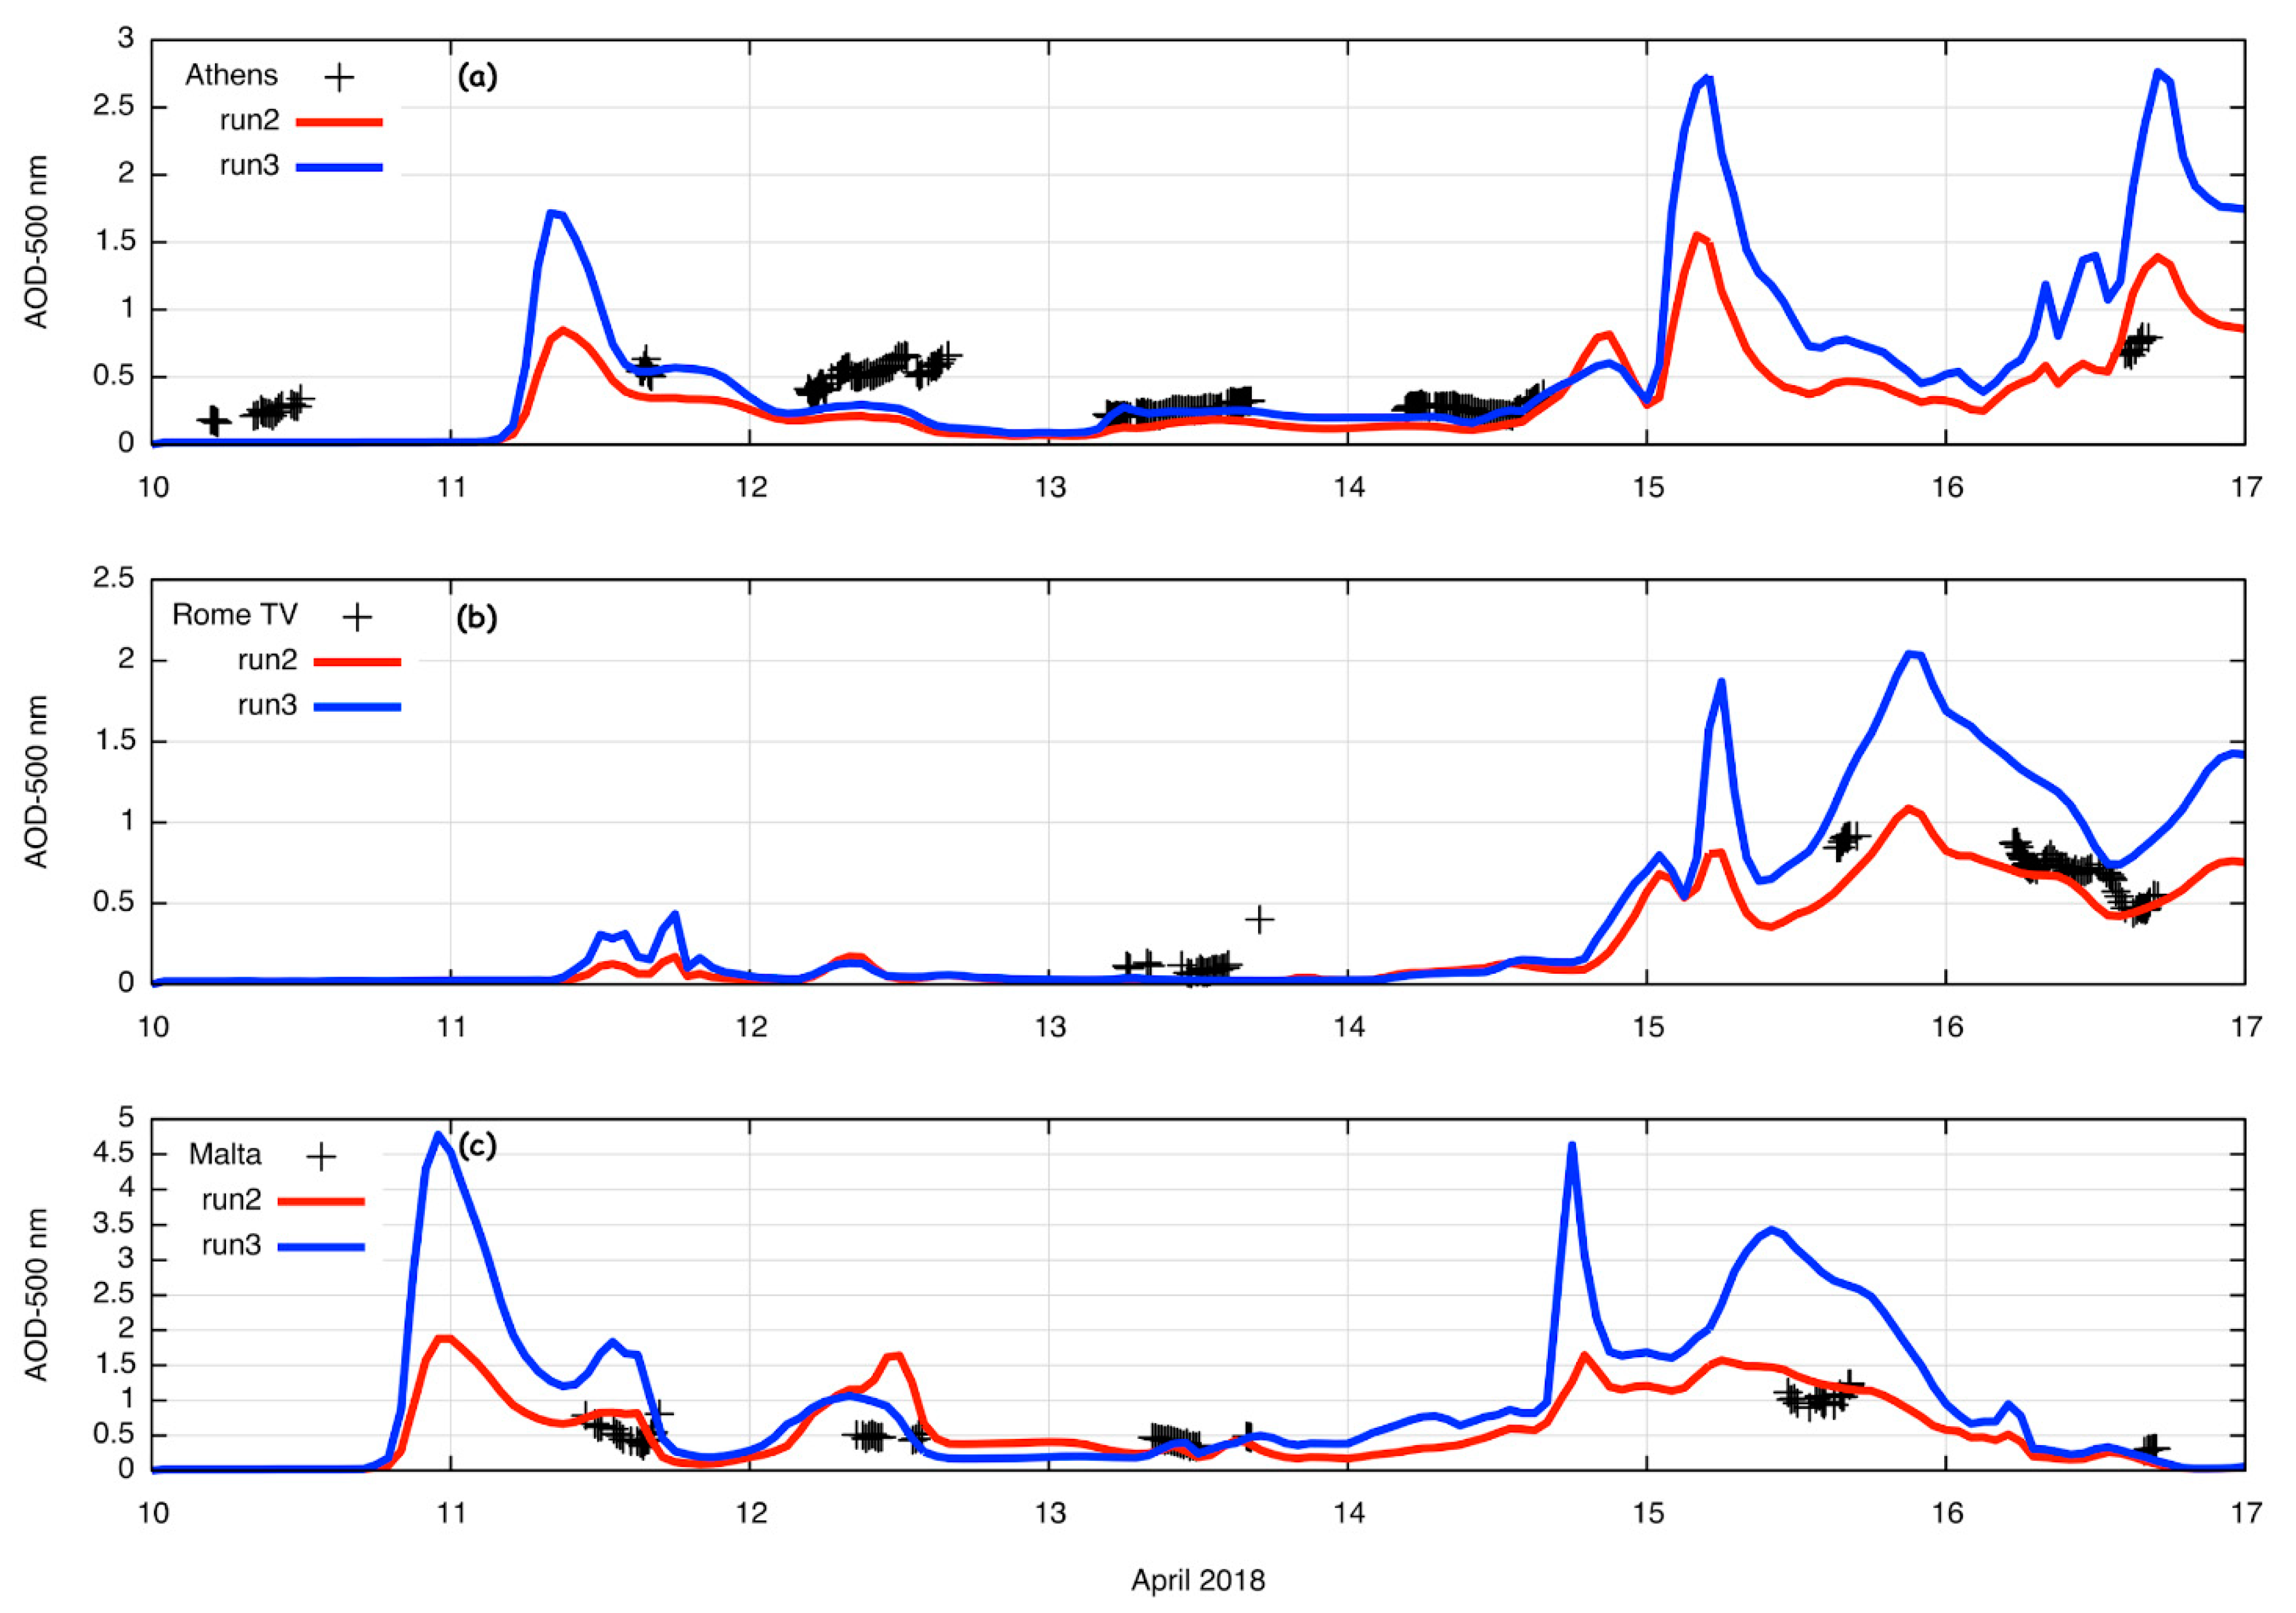
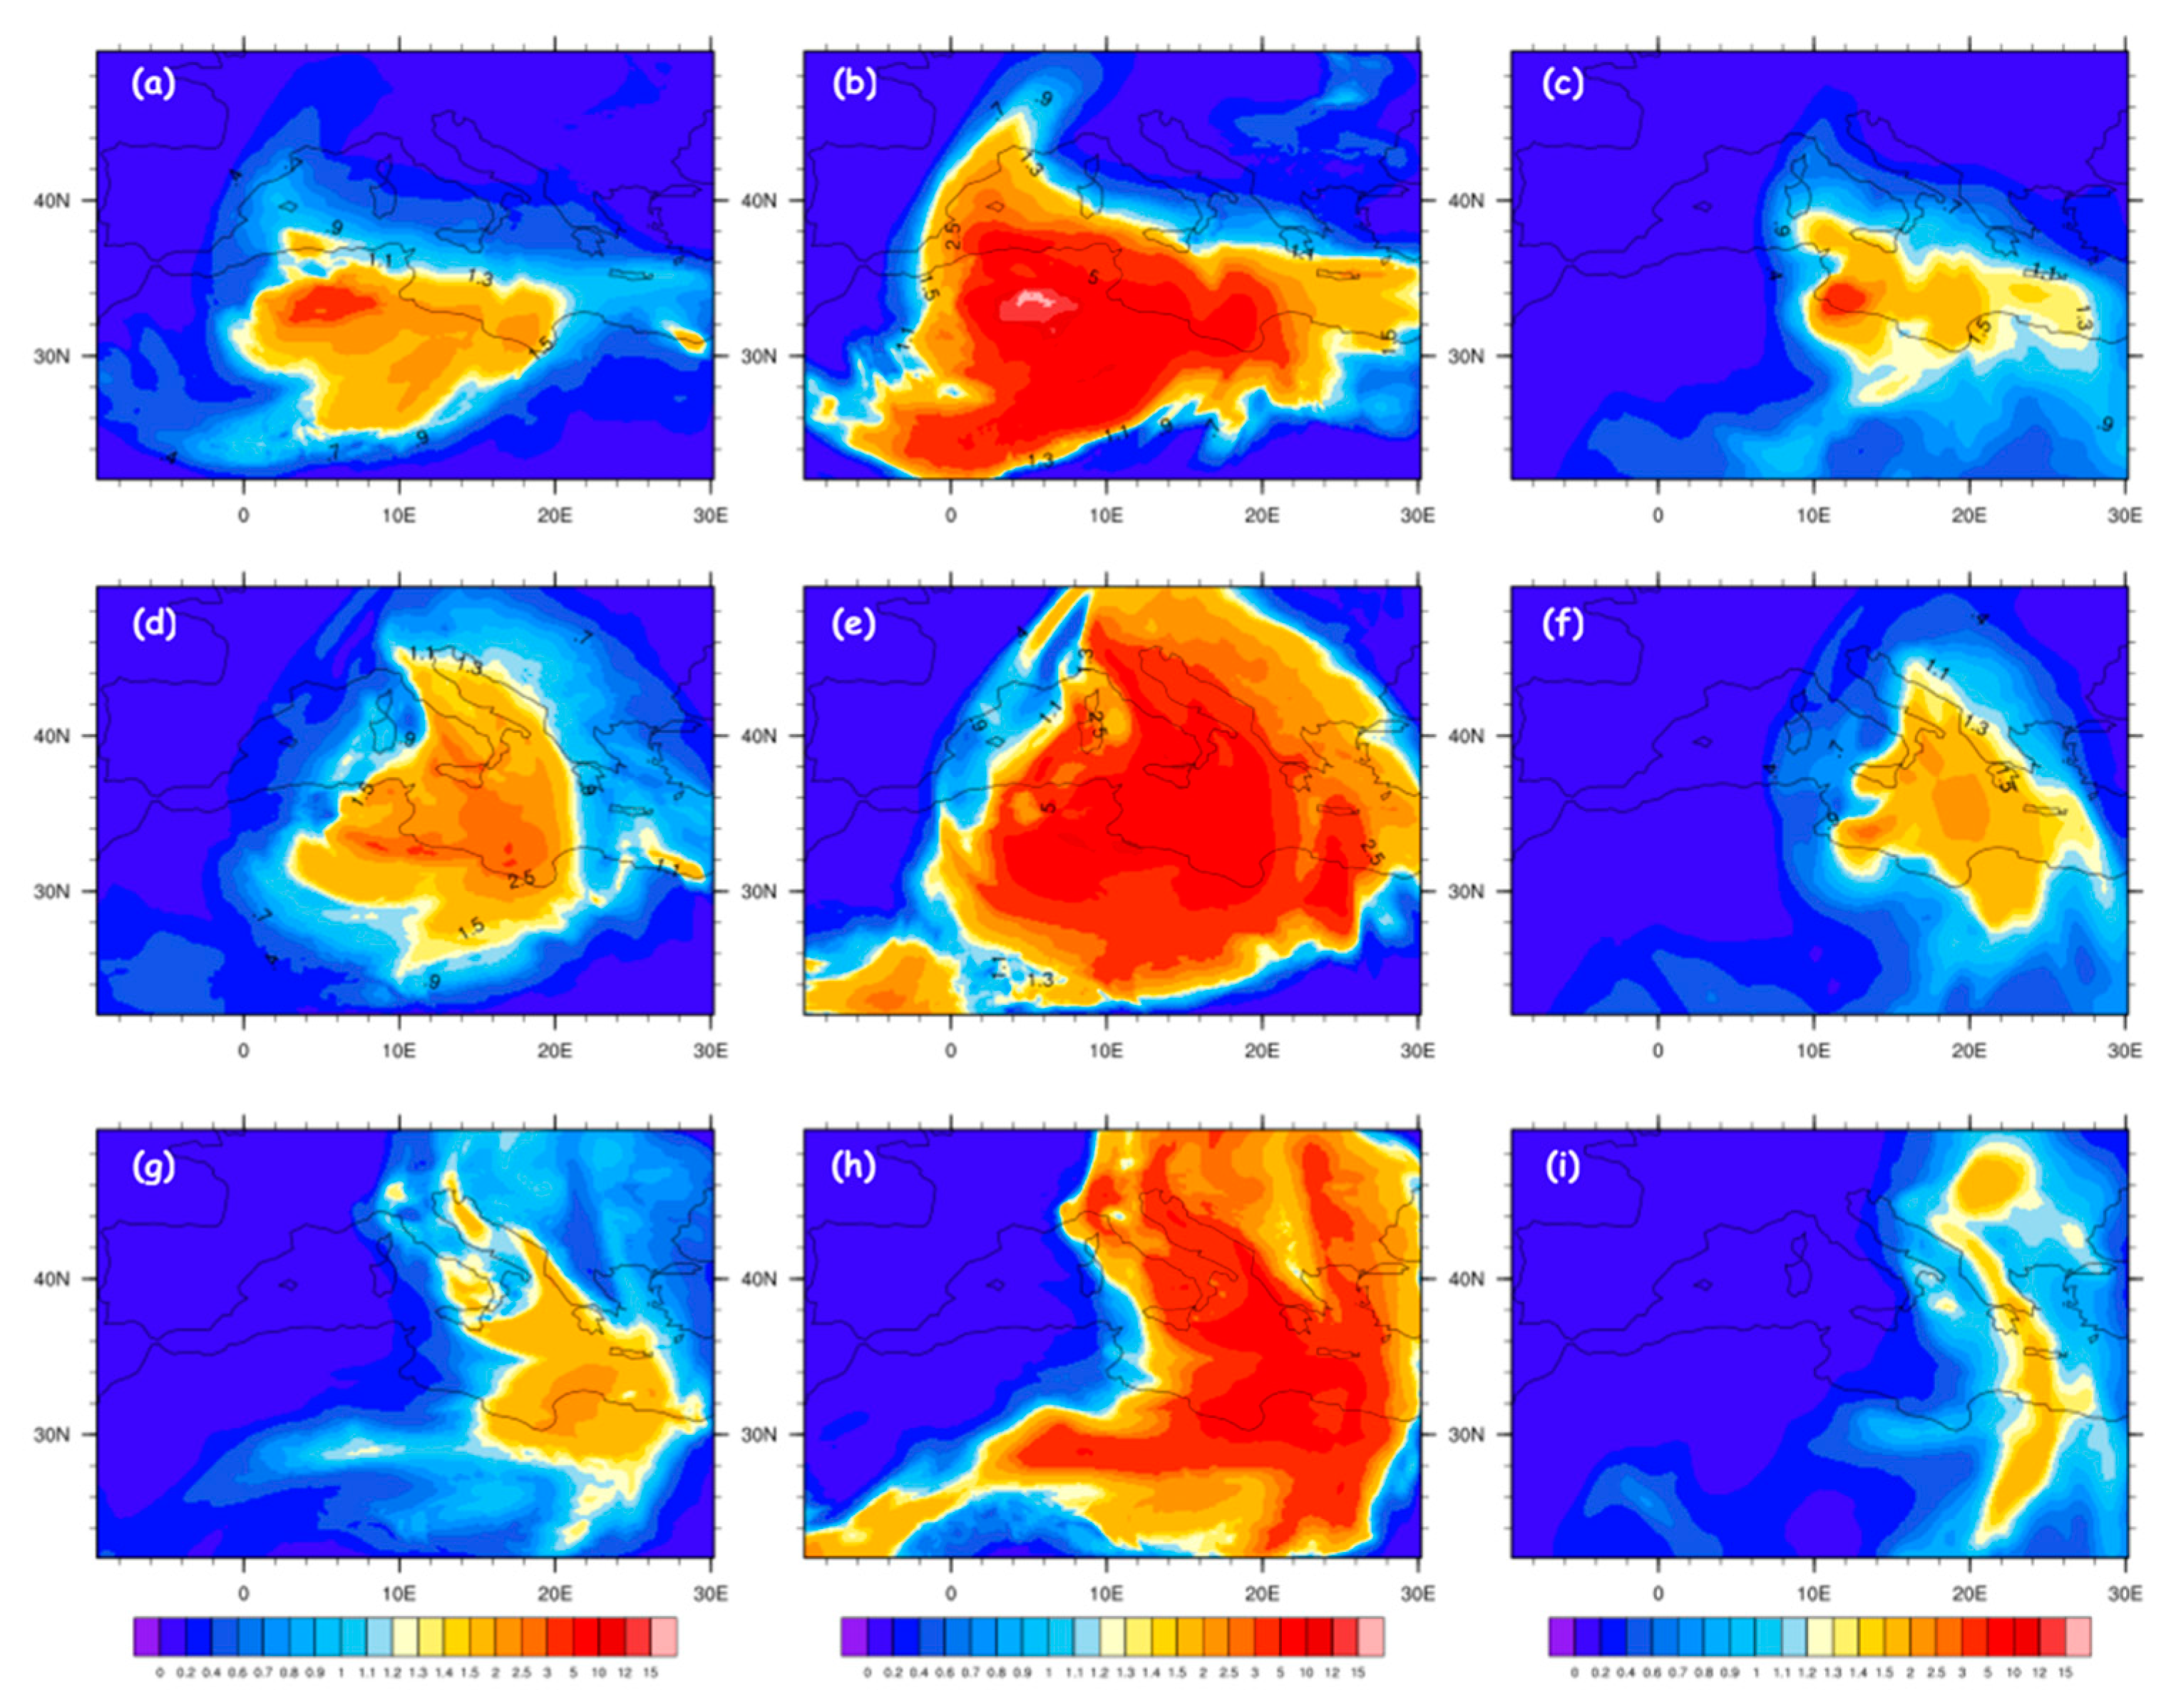
3.3. Comparison with AOD/MAIAC and AERONET

The comparison of satellite data with model results is performed by computing the columnar AOD from the extinction coefficient that is calculated by the model optical routines [56] at 0.55 μm ([23], eq.36). Figure 4 shows the binned average of the AOD at 0.55 μm elaborated for 14 April (a–c), 15 April (d–f) and 16 April (g–i). Left column (a,d,g) represents the Modis/MAIAC AOD, central column (b,e,h), the AOD from WRF-Chem/run_2 and finally the right column the AOD from WRF-Chem/run_3 configuration. Both Modis/MAIAC retrievals and model outputs show the generation/emission of mineral dust during 14 April (Figure 4a–c) to the dust source area corresponding to the Chott region in Northern Tunisia [4,9]. The spatial pattern is typical of a low-pressure system with the associated high wind speed at the surface (10 m) as described above. The following days (15 and 16 April) are characterized by the long-range transport toward Italy (Figure 4d–f) and toward Greece on 16 April (Figure 4g–i). More in detail, it may put in evidence: (i) the quite good spatial reproduction; and (ii) the overestimation of model AOD for both configurations, even if the run_2 produces a better comparison for all the investigated days. It should be also notified the consistent presence of clouds that prevented the aerosol retrievals from the MAIAC/AOD algorithm.
To complement the comparison with the satellite retrievals and to better follow the temporal evolution of the AOD field over the central Mediterranean, we used the AOD Level 2.0 (Version 3) AERONET measurements at Athens, Rome (Tor Vergata) and Malta. These data are automatically cloud cleared and quality assured with pre-field and post-field calibration applied.
Figure 5a–c depicts the hourly resolved AOD at 550 nm from the run_2 simulation (red line), run_3 (blue line) and the corresponding AERONET measurements (black crosses).
The measurements show AOD peaks (<1.0) on 16 April at Athens, on 15 and 16 April at Rome Tor Vergata (~1.0) and the highest peak (~1.5) on 15 April at Malta. These measurements agree with the synoptic transport of the dust plume that is described in Section 3.1. The comparison between AERONET measurements with the two WRF-Chem runs reveals clearly the optimal reproduction of this columnar optical property by the run_2 configuration, with a good performance in terms of peak value and timing. On the other side, the AFWA setup (run_3) produces a relevant overestimation of the AOD, with several unrealistic peak values registered during the simulation period.

3.4. Comparison with MERRA2 Reanalysis and Surface PM10

The final set of comparison is realized considering the dust column mass density (DUCM) and in situ particulate mass concentration ( PM 10 ) data. The variable DUCM represents the columnar content of dust aerosol particles in the atmosphere. This quantity is calculated in the WRF-Chem output system by multiplying for each grid point the dust mass mixing ratio ( μ g   kg 1 ) with the dry-air density ( kg   m 3 ) and summing over each vertical layer depth (m). The resulting quantity is expressed in μ g   m 2 and gives an indication of the amount of dust in the atmosphere.
In the panels of Figure 6 we have reported the comparison of the daily averaged DUCM from WRF-Chem run_2 and run_3 with the corresponding M2T1NXAER-DUCMASS variable of the MERRA2 Time-averaged, Single Level, Assimilation, Aerosol Diagnostics (V5.12.4) (GMAO, 2015). More in detail, in Figure 6 is reported the daily averaged maps for dust column mass density for 14 April (a–c), 15 April (d–f), and 16 April (g–i). Left column (a,d,g) represents run_2 outputs, central column (b,e,h) the run_3 outputs and right column (c,f,i) represents the MERRA2 reanalysis maps. There is in general an agreement for the spatial pattern of the daily averaged field between MERRA2 reanalysis and the WRF-Chem predictions. Model runs and reanalysis show that the dust plume emitted on 14 April is transported toward Southern/Central Italy on 15 April and then dislocated eastward in the following day. This spatial pattern is quite well reproduced by both schemes, we have to notify once more the considerable overprediction in term of intensity of the run_3 configuration and the good matching between run_2 and MERRA2, especially during 15 April.
If we consider particulate mass concentration ( PM 10 ) data, in the second column of Table 7, Table 8 and Table 9, we have reported the daily mean PM 10 concentrations measured at Gharb (Malta; Table 7), Lecce (Table 8), and Athens (Table 9) monitoring stations. In third and fourth columns are reported the corresponding PM 10 daily average from the WRF-Chem run_2 and run_3, respectively. Being surface values, all the quantities are expressed in μg m−3. If we consider the dust-grain distribution showed in Table 3 and Table 4, the dust contribution to PM 10 is calculated, in the WRF-Chem model, using the formulas [38]
PM 10   =   dust _ 1   +   dust _ 2   +   dust _ 3                                 run _ 2 - scheme
PM 10   =   dust _ 1   +   dust _ 2   +   dust _ 3   +   0.737   *   dust _ 4                                 run _ 3 - scheme
Due to the proximity to North African coasts (Figure 1), Malta is impacted by the dust plume on 15 April with a quite high daily mean value (158 μg m−3) reported by the authority’s measurement station in Gharb (Malta; Table 7). The XMed-Dry sample SLS_149 (Table 6) revealed that, during the sampling period from 13 (17:30 UTC) to 15 (10:15 UTC) April 2018, the sea salt deposition rate (not showed) is nearly as high as the dust rate for the same size range of 0.625–10 μm. On the other side, on 15 April the run_2 output underestimated the daily mean PM 10 concentration by about 40 μ g   m 3 . This bias was caused by neglecting the contribution of sea spray to PM 10 concentrations in the present study. In conformity with the above results, run_3 configuration provides a considerable over-prediction for this and the other PM 10 stations described below.
Considering the PM 10 concentration values of Lecce station (Table 8), it may be noted that the dust plume invested the city on 16 April, with a daily average value that is quite high (184 μ g   m 3 ) ; on the other side the XMed-Dry sample LES_126 revealed only 5% of non-dust composition, in the range of 0.625–10 μm. Model output from run_2 does not reproduce the intensity of the daily mean PM 10 value, even if the concentration for the day 16 (50.2 μ g   m 3 ) is doubled with respect to day 15 (23.3 μ g   m 3 ).
Finally, the Demokritos PM 10 station in Athens is analyzed and the relative measurements are reported in Table 9. The dust plume reached the capital of Greece on the afternoon of 17 April with a peak value of 175 μ g   m 3 (not showed) at 16:00 UTC. The model configuration run_2 anticipated the peak in the late afternoon of 16 April. The XMed-Dry sample ATS_138 reported a 1% of non-dust composition, in the range of 0.625–10 μm, indicating a ‘pure’ dust event.
This analysis makes clear the importance of XMed-Dry measurements as it reveals the composition and the size distribution of the collected aerosol samples, this is very important when comparing model output and in situ measurements of PM data.

4. Discussion and Conclusions

The ERA5-reanalysis and the Modis/AOD retrievals highlighted a plume intrusion of Saharan dust on 15 April in central/southern Italy. This plume was dislocated toward the Eastern Mediterranean regions on the following day (16 April).
To simulate this event, two different dust emission schemes that are actually implemented in WRF-Chem under the GOCART aerosol package, are tested and compared with experimental data. These include the dry-deposition XMed experimental data, satellite retrievals, reanalysis products, and in situ measurements. The comparison concerns both optical AOD and mass properties (deposition, DUCM, and PM 10 ).
The above analysis clearly demonstrates that the AFWA dust emission scheme (run_3) significantly over-predicts the amount of mineral dust in atmosphere, while the UoC-S01 parameterization (run_2) gives overall better results expressed in term of optical properties, dry deposition, total mass, and the surface PM 10 loading.
This may be explained by considering that the UoC-S01 scheme (run_2), compared to the AFWA scheme (run_3), produces a spatial distribution of emissions that are more localized and restricted to intense emission sites in the semi-arid region [4,25] of the Algerian desert. The modeled AOD for the UoC-S01 scheme corresponds to an intense pulse transported northward on 15 April and eastward the following day. In this context, the spatial extent of the dust plume and the modeled AOD intensity is considerably lower compared to the AFWA scheme. This outcome confirms a sensitivity study performed by Flaunas et al. [24] in the Sahara Desert showing that the AFWA scheme produced exceptionally high AOD values over North Africa compared to the UoC-S01 scheme. It may also be mentioned recent studies in southwest Asia by Khang et al. [48] and LeGrand et al. [23], with analogous results.
However, also on the deposition end of the dust cycle there are probably systematic differences. As it became visible from the comparison of measured PM 10 with deposition, varying effective deposition velocities exist at the different locations. This and the discrepancy between the model and measured deposition indicate the need to apply more sophisticated size depending deposition schemes. These could for example include ultra-Stokesian effects [57], which might affect deposition velocities by 10% for particles with d >10 µm, or could be non-Stokesian deposition models (a list is given e.g., by Waza et al. [31]), which might modify effective deposition velocities by more than an order of magnitude. While these models are available in principle, the choice and implementation might be difficult due to their diversity [31] and missing information on boundary conditions (e.g., relevant friction velocities). Future investigations need to yield a more robust statistical assessment here. This will need to assess then also the sensitivity of the results to the precise particle size limits chosen for the model comparison. Finally, it is important to remark that when comparing model output and in situ measurements of PM data, the combined analysis of the Xmed-dry samples may provide additional information in the size distribution and composition of aerosol particles.
It is important to point out that, in getting these results, we have performed all the code alterations as suggested by LeGrand et al. [23] and Ukhov et al. [38] that have been incorporated in WRF-Chem starting from version 4.0 (June 2018). However, both emission schemes would benefit from replacing the static erodibility map and soil particle distribution with remote sensed and in-situ observational data. Future works will go in this direction considering the WRF-Chem release above its version 4.0.

Author Contributions

Conceptualization, U.R., P.I., and K.K.; Methodology, U.R., P.I., and K.K.; Software, U.R. and M.M.; Validation, P.I., M.N., K.E., V.V., and M.E.; Formal analysis, K.K.; Writing—original draft preparation, U.R.; Writing—review and editing, E.M., S.V., and G.P.; Visualization, M.M.; Supervision, K.K.; Project administration, P.I. and K.K. All authors have read and agreed to the published version of the manuscript.

Funding

This research received no external funding.

Institutional Review Board Statement

Not applicable.

Informed Consent Statement

Not applicable.

Data Availability Statement

The data presented in this study are available on request from the corresponding author.

Acknowledgments

Analyses and visualizations used in this paper were produced with the Giovanni online data system, developed and maintained by the NASA GES DISC (http://giovanni.gsfc.nasa.gov/ (accessed date 29 Decmber 2020)). We also acknowledge the MODIS mission scientists and associated NASA personnel for the production of the data used in this research effort. NCEP Reanalysis data were provided by the NOAA/OAR/ESRL PSD, Boulder, CO, USA, from their Web site at http://www.esrl.noaa.gov/psd/ (accessed date 29 Decmber 2020). We thank the principal investigators and their staff for establishing and maintaining the AERONET sites, the data from which have been used in this study. ERA5 reanalysis are utilized according to the license to use Copernicus Products.

Conflicts of Interest

The authors declare no conflict of interest.

Appendix A

The differences between the two schemes in terms of daily average dust emission is outlined in Figure A1. For the calculation of the threshold friction velocity ( u t ), the UoC-S01 scheme uses two supplementary correction factors according to surface roughness elements and surface moisture. This is accurately reported by LeGrand et al. [23] in Equation 5 and Equation 17 for AFWA and UoC, respectively. Analyzing Figure A1, it is evident the correlation between the largest positive deviation from the threshold friction velocity (panel b) calculated by AFWA and the more intense emission of dust particles (panel d).
Figure A1. Mean daily values of (a) ( u u t ) for UoC scheme (run_2); (b) ( u u t ) for AFWA scheme (run_3), total dust emission from (c) UoC scheme (run_2), and (d) AFWA scheme (run_3) calculated for 14 April 2018.
Applsci 11 01566 g0a1

References

  1. Solomon, S.; Manning, M.; Marquis, M.; Qin, D. Climate Change 2007—The Physical Science Basis: Working Group I Contribution to the Fourth Assessment Report of the IPCC; Cambridge University Press: Cambridge, UK, 2007; Volume 4. [Google Scholar]
  2. Solomon, S. IPCC: Climate change the physical science basis. In Proceedings of the American Geophysical Union, Fall Meeting, San Francisco, CA, USA, 10–14 December 2007; p. U43D-01. [Google Scholar]
  3. Balkanski, Y.J.; Jacob, D.J.; Gardner, G.M.; Graustein, W.C.; Turekian, K.K. Transport and residence times of tropospheric aerosols inferred from a global three-dimensional simulation of 210Pb. J. Geophys. Res. Atmos. 2007, 98, 20573–20586. [Google Scholar] [CrossRef]
  4. Ginoux, P.; Prospero, J.M.; Gill, T.E.; Hsu, N.C.; Zhao, M. Global-scale attribution of anthropogenic and natural dust sources and their emission rates based on MODIS Deep Blue aerosol products. Rev. Geophys. 2012, 50. [Google Scholar] [CrossRef]
  5. Engelstaedter, S.; Tegen, I.; Washington, R. North African dust emissions and transport. Earth Sci. Rev. 2006, 79, 73–100. [Google Scholar] [CrossRef]
  6. Barnaba, F.; Gobbi, G.P. Aerosol seasonal variability over the Mediterranean region and relative impact of maritime, continental and Saharan dust particles over the basin from MODIS data in the year 2001. Atmos. Chem. Phys. 2004, 4, 2367–2391. [Google Scholar] [CrossRef] [Green Version]
  7. Israelevich, P.; Ganor, E.; Alpert, P.; Kishcha, P.; Stupp, A. Predominant transport paths of Saharan dust over the Mediterranean Sea to Europe. J. Geophys. Res. Atmos. 2012, 117. [Google Scholar] [CrossRef] [Green Version]
  8. Pey, J.; Querol, X.; Alastuey, A.; Forastiere, F.; Stafoggia, M. African dust outbreaks over the Mediterranean Basin during 2001-2011: PM10 concentrations, phenomenology and trends, and its relation with synoptic and mesoscale meteorology. Atmos. Chem. Phys. 2013, 13, 1395. [Google Scholar] [CrossRef] [Green Version]
  9. Rizza, U.; Barnaba, F.; Miglietta, M.M.; Mangia, C.; Di Liberto, L.; Dionisi, D.; Costabile, F.; Grasso, F.; Gobbi, G.P. WRF-Chem model simulations of a dust outbreak over the central Mediterranean and comparison with multi-sensor desert dust observations. Atmos. Chem. Phys. 2017, 17, 93. [Google Scholar] [CrossRef] [Green Version]
  10. Provençal, S.; Kishcha, P.; da Silva, A.M.; Elhacham, E.; Alpert, P. AOD distributions and trends of major aerosol species over a selection of the world’s most populated cities based on the 1st version of NASA’s MERRA Aerosol Reanalysis. Urban Clim. 2017, 20, 168–191. [Google Scholar] [CrossRef]
  11. Rizza, U.; Mancinelli, E.; Morichetti, M.; Passerini, G.; Virgili, S. Aerosol Optical Depth of the Main Aerosol Species over Italian Cities Based on the NASA/MERRA-2 Model Reanalysis. Atmosphere 2019, 10, 709. [Google Scholar] [CrossRef] [Green Version]
  12. Aerosol Robotic Network (AERONET). Available online: https://aeronet.gsfc.nasa.gov (accessed on 29 September 2020).
  13. Dubovik, O.; Smirnov, A.; Holben, B.N.; King, M.D.; Kaufman, Y.J.; Eck, T.F.; Slutsker, I. Accuracy assessments of aerosol optical properties retrieved from AERONET sun and sky- radiance measurements. J. Geophys. Res. Atmos. 2000, 105, 9791–9806. [Google Scholar] [CrossRef] [Green Version]
  14. Dubovik, O.; Sinyuk, A.; Lapyonok, T.; Holben, B.N.; Mishchenko, M.; Yang, P.; Eck, T.F.; Volten, H.; Munoz, O.; Veihelmann, B.; et al. Applicatn of spheroid models to account for aerosol particle non-sphericity in remonte sensing of desert dust. J. Geophys. Res. Atmos. 2006, 111, D11208. [Google Scholar] [CrossRef] [Green Version]
  15. Kaufman, Y.J.; Tanré, D.; Remer, L.; Vermote, E.; Chu, A.; Holben, B.N. Remote sensing of tropospheric aerosol from EOS-MODIS over the land using dark targets and dynamic aerosol models. J. Geophys. Res 1997, 102, 17051–17067. [Google Scholar] [CrossRef]
  16. Barnaba, F.; Bolignano, A.; Di Liberto, L.; Morelli, M.; Lucarelli, F.; Nava, S.; Perrino, C.; Canepari, S.; Basart, S.; Costabile, F.; et al. Desert dust contribution to PM10 loads in Italy: Methods and recommendations addressing the relevant European Commission Guidelines in support to the Air Quality Directive 2008/50. Atmos. Environ. 2017, 161, 288–305. [Google Scholar] [CrossRef]
  17. Stafoggia, M.; Zauli-Sajani, S.; Pey, J.; Samoli, E.; Alessandrini, E.; Basagaña, X.; Cernigliaro, A.; Chiusolo, M.; Demaria, M.; Díaz, J.; et al. Desert dust outbreaks in Southern Europe: Contribution to daily PM10 concentrations and short-term associations with mortality and hospital admissions. Environ. Health Perspect. 2016, 124, 413–419. [Google Scholar] [CrossRef] [PubMed] [Green Version]
  18. Grell, G.A.; Peckham, S.E.; Schmitz, R.; McKeen, S.A.; Frost, G.; Skamarock, W.C.; Eder, B. Fully coupled “online” chemistry within the WRF model. Atmos. Environ. 2005, 39, 6957–6976. [Google Scholar] [CrossRef]
  19. Bossioli, E.; Tombrou, M.; Kalogiros, J.; Allan, J.; Bacak, A.; Bezantakos, S.; Biskos, G.; Coe, H.; Jones, B.T.; Kouvarakis, G.; et al. Atmospheric composition in the Eastern Mediterranean: Influence of biomass burning during summertime using the WRF-Chem model. Atmos. Environ. 2016, 132, 317–331. [Google Scholar] [CrossRef]
  20. Georgiou, G.K.; Christoudias, T.; Proestos, Y.; Kushta, J.; Hadjinicolaou, P.; Lelieveld, J. Air quality modelling in the summer over the eastern Mediterranean using WRF-Chem: Chemistry and aerosol mechanism intercomparison. Atmos. Chem. Phys. 2018, 18, 1555–1571. [Google Scholar] [CrossRef] [Green Version]
  21. Chaibou, A.A.S.; Ma, X.; Kumar, K.R.; Jia, H.; Tang, Y.; Sha, T. Evaluation of dust extinction and vertical profiles simulated by WRF-Chem with CALIPSO and AERONET over North Africa. J. Atmos. Sol. Terr. Phys. 2020, 199, 105213. [Google Scholar] [CrossRef]
  22. Su, L.; Fung, J.C. Sensitivities of WRF-Chem to dust emission schemes and land surface properties in simulating dust cycles during springtime over East Asia. J. Geophys. Res. Atmos. 2015, 120, 11–215. [Google Scholar] [CrossRef] [Green Version]
  23. LeGrand, S.L.; Polashenski, C.; Letcher, T.W.; Creighton, G.A.; Peckham, S.E.; Cetola, J.D. The AFWA dust emission scheme for the GOCART aerosol model in WRF-Chem v3.8.1. Geosci. Model Dev. 2019, 12, 131. [Google Scholar] [CrossRef] [Green Version]
  24. Flaounas, E.; Kotroni, V.; Lagouvardos, K.; Klose, M.; Flamant, C.; Giannaros, T.M. Sensitivity of the WRF-Chem (V3. 6.1) model to different dust emission parametrization: Assessment in the broader Mediterranean region. Geosci. Model Dev. 2017, 10, 2925–2945. [Google Scholar] [CrossRef] [Green Version]
  25. Rizza, U.; Miglietta, M.M.; Mangia, C.; Ielpo, P.; Morichetti, M.; Iachini, C.; Virgili, S.; Passerini, G. Sensitivity of WRF-Chem model to land surface schemes: Assessment in a severe dust outbreak episode in the Central Mediterranean (Apulia Region). Atmos. Res. 2018, 201, 168–180. [Google Scholar] [CrossRef]
  26. Tsarpalis, K.; Papadopoulos, A.; Mihalopoulos, N.; Spyrou, C.; Michaelides, S.; Katsafados, P. The implementation of a mineral dust wet deposition scheme in the GOCART-AFWA module of the WRF model. Remote Sens. 2018, 10, 1595. [Google Scholar] [CrossRef] [Green Version]
  27. Kandler, K.; de la Rosa, J.; Torres-Sanchez, R.; Aviles, M.; Sanchez de la Campa, A.M.; Alastuey, A.; Perez, N.; Reche, C.; Querol, X.; Loye-Pilot, M.-D.; et al. XMed-DRY—A cross-Mediterranean dry deposition measurement network: First results. In Proceedings of the DUST2018—3rd International Conference on Atmospheric Dust, Bari, Italy, 29–31 May 2018. [Google Scholar]
  28. Kandler, K.; Schneiders, K.; Ebert, M.; Hartmann, M.; Weinbruch, S.; Prass, M.; Pöhlker, C. Composition and mixing state of atmospheric aerosols determined by electron microscopy: Method development and application to aged Saharan dust deposition in the Caribbean boundary layer. Atmos. Chem. Phys. 2018, 18, 13429–13455. [Google Scholar] [CrossRef] [Green Version]
  29. Jones, S.L.; Creighton, G.A.; Kuchera, E.L.; Rentschler, S.A. Adapting WRF-CHEM GOCART for fine-scale dust forecasting. In Proceedings of the American Geophysical Union, Fall Meeting 2011, San Francisco, CA, USA, 5–9 December 2011; p. U14A-06. [Google Scholar]
  30. Shao, Y. A model for mineral dust emission. J. Geophys. Res. Atmos. 2001, 106, 20239–20254. [Google Scholar] [CrossRef]
  31. Waza, A.; Schneiders, K.; May, J.; Rodríguez, S.; Epple, B.; Kandler, K. Field comparison of dry deposition samplers for collection of atmospheric mineral dust: Results from single-particle characterization. Atmos. Meas. Tech. 2019, 12, 6647–6665. [Google Scholar] [CrossRef] [Green Version]
  32. Kandler, K.; Lieke, K.; Benker, N.; Emmel, C.; Küpper, M.; Müller-Ebert, D.; Ebert, M.; Scheuvens, D.; Schladitz, A.; Schütz, L.; et al. Electron microscopy of particles collected at Praia, Cape Verde, during the Saharan Mineral Dust Experiment: Particle chemistry, shape, mixing state and complex refractive index. Tellus B Chem. Phys. Meteorol. 2011, 63, 475–496. [Google Scholar] [CrossRef]
  33. Holben, B.N.; Eck, T.F.; Slutsker, I.; Tanre, D.; Buis, J.P.; Setzer, A.; Vermote, E.; Reagan, J.A.; Kaufman, Y.J.; Nakajima, T.; et al. AERONET—A federated instrument network and data archive for aerosol characterization. Remote Sens. Environ. 1998, 66, 1–16. [Google Scholar] [CrossRef]
  34. Lyapustin, A.; Wang, Y. MCD19A2 MODIS/Terra+Aqua Land Aerosol Optical Depth Daily L2G Global 1km SIN Grid V006 [Data Set]. NASA EOSDIS Land Processes DAAC. Available online: https://doi.org/10.5067/MODIS/MCD19A2.006 (accessed on 13 May 2020).
  35. LP DAAC—NASA Earthdata Search. Available online: https://lpdaac.usgs.gov/tools/earthdata-search/ (accessed on 20 October 2020).
  36. Lyapustin, A.; Wang, Y.; Laszlo, I.; Kahn, R.; Korkin, S.; Remer, L.; Levy, R.; Reid, J.S. Multiangle implementation of atmospheric correction (MAIAC): 2. Aerosol algorithm. J. Geophys. Res. Atmos 2011, 116. [Google Scholar] [CrossRef]
  37. Lyapustin, A.; Wang, Y.; Korkin, S.; Huang, D. MODIS Collection 6 MAIAC algorithm. Atmos. Meas. Tech. 2018, 11, 5741–5765. [Google Scholar] [CrossRef] [Green Version]
  38. Ukhov, A.; Ahmadov, R.; Grell, G.; Stenchikov, G. Improving dust simulations in WRF-Chem model v4. 1.3 coupled with GOCART aerosol module. Geosci. Model Dev. Discuss. 2020, 14, 1–30. [Google Scholar]
  39. Rizza, U.; Mancinelli, E.; Canepa, E.; Piazzola, J.; Missamou, T.; Yohia, C.; Morichetti, M.; Virgili, S.; Passerini, G.; Miglietta, M.M. WRF Sensitivity Analysis in Wind and Temperature Fields Simulation for the Northern Sahara and the Mediterranean Basin. Atmosphere 2020, 11, 259. [Google Scholar] [CrossRef] [Green Version]
  40. Nakanishi, M.; Niino, H. Development of an improved turbulence closure model for the atmospheric boundary layer. J. Meteorol. Soc. Jpn. 2009, 87, 895–912. [Google Scholar] [CrossRef] [Green Version]
  41. Benjamin, S.G.; Grell, G.A.; Brown, J.M.; Smirnova, T.G.; Bleck, R. Mesoscale weather prediction with the RUC hybrid isentropic–terrain-following coordinate model. Mon. Weather Rev. 2004, 132, 473–494. [Google Scholar] [CrossRef]
  42. Iacono, M.J.; Delamere, J.S.; Mlawer, E.J.; Shephard, M.W.; Clough, S.A.; Collins, W.D. Radiative forcing by long-lived greenhouse gases: Calculations with the AER radiative transfer models. J. Geophys. Res. Atmos. 2008, 113. [Google Scholar] [CrossRef]
  43. Thompson, G.; Field, P.R.; Rasmussen, R.M.; Hall, W.D. Explicit forecasts of winter precipitation using an improved bulk microphysics scheme. Part II: Implementation of a new snow parameterization. Mon. Weather Rev. 2008, 136, 5095–5115. [Google Scholar] [CrossRef]
  44. Chin, M.; Rood, R.B.; Lin, S.-J.; Muller, J.F.; Thomspon, A.M. Atmospheric sulfur cycle in the global model GOCART: Model description and global properties. J. Geophys. Res. Atmos. 2000, 105, 24671–24687. [Google Scholar] [CrossRef]
  45. Ginoux, P.; Chin, M.; Tegen, I.; Prospero, J.M.; Holben, B.; Dubovik, O.; Lin, S.J. Sources and distributions of dust aerosols simulated with the GOCART model. J. Geophys. Res. Atmos. 2001, 106, 20255–20273. [Google Scholar] [CrossRef]
  46. Marticorena, B.; Bergametti, G. Modeling the atmospheric dust cycle: 1. Design of a soil-derived dust emission scheme. J. Geophys. Res. Atmos. 1995, 100, 16415–16430. [Google Scholar] [CrossRef] [Green Version]
  47. Rizza, U.; Anabor, V.; Mangia, C.; Miglietta, M.M.; Degrazia, G.A.; Passerini, G. WRF-Chem simulation of a saharan dust outbreak over the mediterranean regions. Ciênc. Nat. 2016, 38, 330–336. [Google Scholar] [CrossRef]
  48. Kang, J.-Y.; Yoon, S.-C.; Shao, Y.; Kim, S.-W. Comparison of vertical dust flux by implementing three dust emission schemes in WRF/Chem. J. Geophys. Res. 2011, 116, D09202. [Google Scholar] [CrossRef] [Green Version]
  49. Zeng, Y.; Wang, M.; Zhao, C.; Chen, S.; Liu, Z.; Huang, X.; Gao, Y. WRF-Chem v3. 9 simulations of the East Asian dust storm in May 2017: Modeling sensitivities to dust emission and dry deposition schemes. Geosci. Model Dev. 2020, 13, 2125. [Google Scholar] [CrossRef]
  50. Wesely, M.L. Parameterization of surface resistances to gaseous dry deposition in regional-scale numerical models. Atmos. Environ. 2007, 41, 52–63. [Google Scholar] [CrossRef]
  51. Stuefer, M.; Freitas, S.R.; Grell, G.; Webley, P.; Peckham, S.; McKeen, S.A.; Egan, S.D. Inclusion of ash and SO2 emissions from volcanic eruptions in WRF-Chem: Development and some applications. Geosci. Model Dev. 2013, 6, 457–468. [Google Scholar] [CrossRef] [Green Version]
  52. Climate Copernicus. Available online: https://cds.climate.copernicus.eu/#!/home (accessed on 20 October 2020).
  53. ERA5: Data documentation—Copernicus Knowledge Base—ECMWF Confluence Wiki. Available online: https://confluence.ecmwf.int/display/CKB/ERA5%3A+data+documentation (accessed on 20 October 2020).
  54. Hersbach, H.; Bell, B.; Berrisford, P.; Horányi, A.; Sabater, J.M.; Nicolas, J.; Radu, R.; Schepers, D.; Simmons, A.; Soci, C.; et al. Global reanalysis: Goodbye ERA-Interim, hello ERA5. ECMWF Newsl. 2019, 159, 17–24. [Google Scholar]
  55. Hsu, N.C.; Tsay, S.C.; King, M.D.; Herman, J.R. Aerosol properties over bright-reflecting source regions. IEEE Trans. Geosci. Remote Sens. 2004, 42, 557–569. [Google Scholar] [CrossRef]
  56. Barnard, J.C.; Fast, J.D.; Paredes-Miranda, G.; Arnott, W.P.; Laskin, A. Technical Note: Evaluation of the WRF-Chem “Aerosol Chemical to Aerosol Optical Properties” Module using data from the MILAGRO campaign. Atmos. Chem. Phys. 2010, 10, 7325–7340. [Google Scholar] [CrossRef] [Green Version]
  57. Rader, D.J.; Marple, V.A. Effect of Ultra-Stokesian Drag and Particle Interception on Impaction Characteristics. Aerosol Sci. Technol. 1985, 4, 141–156. [Google Scholar] [CrossRef] [Green Version]
Figure 1. Numerical domain and position of the XMed-Dry Stations.
Applsci 11 01566 g001
Figure 2. Geopotential height (meters) from ERA5 reanalysis (a,c,e) and WRF-Chem runs (b,d,f), for 14 April at 06:00 UTC (upper panel), 15 April at 06:00 UTC (central panel), and 16 April at 18:00 UTC (bottom panel).
Applsci 11 01566 g002
Figure 3. Time Averaged Map (14–16 April) of Combined Dark Target and Deep Blue AOD at 0.55 micron for land and ocean. MODIS-Terra MOD08_D3 v6.1 merged with MODIS-Aqua MYD08_D3 v6.1.
Applsci 11 01566 g003
Figure 4. Daily averaged maps for AOD at 0.55 μm for 14 April (ac), 15 April (df), and 16 April (gi). Left column (a,d,g) represents the Modis/MAIAC AOD, central column (b,e,h) the run_2 AOD and right column the run_3 AOD.
Applsci 11 01566 g004
Figure 5. Comparison between WRF-Chem run_2 (red line), run_3 (blue line) and AERONET level 2.0 data (black crosses) at Athens (a); Rome Tor Vergata (b); and Malta (c).
Applsci 11 01566 g005
Figure 6. Daily averaged maps for dust column mass density for 14 April (ac), 15 April (df) and 16 April (gi). Left column (a,d,g) represents run_2 outputs, central column (b,e,h) the run_3 outputs and right column (c,f,i) MERRA2 model reanalysis.
Applsci 11 01566 g006
Table 1. Physics options for the Weather Research and Forecasting model.
ParameterizationNamelist Variable(Option) Scheme
Surface layersf_sfclay_physics(5) MYNN
Surface modelsf_surface_physics(3) RUC Land Surface
Boundary layerbl_pbl_physics(5) MYNN Level 2.5
Microphysics mp_physics(8) Thompson
Longwave radiationra_lw_physics(4) RRTMG Longwave
Shortwave radiationra_sw_physics(4) RRTMG Shortwave
Surface Layersf_sfclay_physics(5) MYNN
Table 2. Weather Research and Forecasting model, coupled with chemistry (WRF-Chem) chemistry setup.
CaseChem_OptDUST_OptDust_SchmeScheme
run_230041UoC-S01
run_33003-AFWA
Table 3. Effective diameter and size bin range for the Air Force Weather Agency AFWA scheme.
Dust-Bin AFWALower-Upper Diameter (µm)Effective Diameter (µm)
10.2–21.1
22–3.62.8
33.6–64.8
46–129
512–2016
Table 4. Effective diameter and size bin range for the University of Cologne UoC-S01 scheme.
Dust-bin UoC-S01Lower-Upper Diameter (µm)Effective Diameter (µm)
10–2.51.25
22.5–53.75
35–107.5
410–2015
Table 5. Start/end of sampling period for each respective sampling site: namely Lecce (sample code: LES), San Lawrenz-Gozo (sample code: SLS), and Athens (sample code: ATS).
Sampling SiteStart Sampling
YYYY-MM-DD UTC
End Sampling
YYYY-MM-DD UTC
LES_1252018-04-11 10:102018-04-13 12:10
LES_1262018-04-13 12:252018-04-11 11:35
SLS_1482018-04-11 18:202018-04-13 17:20
SLS_1492018-04-13 17:302018-04-15 10:15
ATS_1372018-04-11 13:302018-04-13 12:20
ATS_1382018-04-13 12:252018-04-16 12:25
Table 6. Simulated (run_2, run_3) and measured dry deposition rates at the three sampling locations. For the measured dust deposition rates in parentheses the lower and upper limit of the central 95% confidence interval are shown. In the last three columns total deposition rate, non-dust fraction and the average PM10 concentration for the relative period are reported.
Sampling SiteRun_2
(mg m−2day−1)
Run_3
(mg m−2day−1)
Measured Dust Deposition
(0.625–10 µm)
(mg m−2day−1)
Measured Total Deposition
(0.625–10 µm)
(mg m−2day−1)
Non-Dust Fraction
(0.625–10 µm)
PM10 Average Concentration
(µg m−3)
LES_1253.210.83.32
(2.75–4.09)
3.50.0533.8
LES_1264.211.37.70
(6.82–8.73)
8.10.0574.2
SLS_1481.72.910.51
(9.05–12.23)
11.60.0950.5
SLS_1494.116.78.83
(7.67–10.23)
17.30.4983.4
ATS_1371.76.72.29
(1.83–2.89)
2.30.0131.75
ATS_1385.514.52.58
(2.19–3.06)
2.60.0137.95
Average2.510.55.9
Table 7. Daily mean PM10 at Authority’s station in Gharb (Malta) and predicted with the WRF-Chem configurations run_2 and run_3.
MaltaRun_2Run_3
April μ g   m 3 μ g   m 3 μ g   m 3
1256.773.557.5
1343.449.8161.9
1448.677.0221.8
15158.2115.8944.3
1640.414.329.7
Table 8. Daily mean PM10 at Lecce and predicted with the WRF-Chem configurations run_2 and run_3.
LecceRun_2Run_3
April μ g   m 3 μ g   m 3 μ g   m 3
1232.241.0124.8
1335.520.325.1
1435.017.236.3
1542.323.351.5
16184.050.2214.5
Table 9. Daily mean PM10 at Athens and predicted with the WRF-Chem configurations run_2 and run_3.
AthensRun_2Run_3
April μ g   m 3 μ g   m 3 μ g   m 3
1227.218.686.5
1336.229.486.2
1445.251.2129.0
1535.139.7106.3
1635.2181.0641.8
Publisher’s Note: MDPI stays neutral with regard to jurisdictional claims in published maps and institutional affiliations

