Article

Seismic Response of RC Frames with a Soft First Story Retrofitted with Hysteretic Dampers under Near-Fault Earthquakes

by
Santiago Mota-Páez
1,
David Escolano-Margarit
2 and
Amadeo Benavent-Climent
2,*
1
Department of Civil Engineering, Universidad Tecnológica del Cibao Oriental, Cotuí 43000, Dominican Republic
2
Department of Mechanical Engineering, Universidad Politécnica de Madrid, 28006 Madrid, Spain
*
Author to whom correspondence should be addressed.
Appl. Sci. 2021, 11(3), 1290; https://doi.org/10.3390/app11031290
Submission received: 26 December 2020 / Revised: 21 January 2021 / Accepted: 27 January 2021 / Published: 1 February 2021
(This article belongs to the Special Issue Passive Seismic Control of Structures with Energy Dissipation Systems)

Abstract

:

Featured Application

This work can be applied to the seismic upgrading of existing reinforced concrete structures with a soft story located near a fault by using metallic-type displacement-dependent dampers.

Abstract

Reinforced concrete (RC) frame structures with open first stories and masonry infill walls at the upper stories are very common in seismic areas. Under strong earthquakes, most of the energy dissipation demand imposed by the earthquake concentrates in the first story, and this eventually leads the building to collapse. A very efficient and cost-effective solution for the seismic upgrading of this type of structure consists of installing hysteretic dampers in the first story. This paper investigates the response of RC soft-story frames retrofitted with hysteretic dampers subjected to near-fault ground motions in terms of maximum displacements and lateral seismic forces and compares them with those obtained by far-field earthquakes. It is found that for similar levels of total seismic input energy, the maximum displacements in the first story caused by near-fault earthquakes are about 1.3 times larger than those under far-field earthquakes, while the maximum inter-story drift in the upper stories and the distribution and values of the lateral forces are scarcely affected. It is concluded that the maximum displacements can be easily predicted from the energy balance of the structure by using appropriate values for the parameter that reflects the influence of the impulsivity of the ground motion: the so-called equivalent number of cycles.

1. Introduction

Reinforced concrete framed structures with a soft first story and infill walls in top stories are very common, even in areas of substantial seismic hazard. Despite their merit from a functional and an architectural perspective, they constitute a poor solution from a mechanical point of view. When subjected to earthquake loads, the discontinuity in lateral strength and stiffness at the first (ground) story causes a concentration of the energy dissipation demand (i.e., damage) in this story. This amount of energy—very large in the case of a severe earthquake—must be dissipated by the columns of the first story in the form of cumulative plastic deformations. If the columns have an insufficient energy dissipation capacity (true of many existing reinforced concrete (RC) frames), the building eventually collapses. The plastic mechanism developed by the frame, called in the literature soft first story, is one of the most undesirable forms of collapse.
Observations after major earthquakes in the 1990s, such as Northridge (1994) in the U.S. [1] or Hyogoken–Nanbu (1995) in Japan [2], proved that catastrophic damage could be attributed to a soft first story. The performance of this structural typology has been investigated by many researchers in the past [3]. Several retrofitting techniques are available nowadays to mitigate this issue. The most common one is increasing the section area of the first-story columns with concrete jackets [4], which also allows for increasing the flexural and shear reinforcement. However, it implies an increase in the lateral stiffness of the structure as well, which in most cases means a greater seismic force demand upon the structure. On the other hand, increasing the strength and stiffness of the first-story columns does not change the failure mode and does not alleviate the problem of the high-energy dissipation demands on the columns of the first story—it just increases the base shear strength. Increasing the strength so that the retrofitted columns can absorb in elastic conditions (i.e., within the elastic range) the large amount of energy input by a severe earthquake can be impossible to achieve at a reasonable cost. Alternatively, using state-of-the-art solutions, e.g., confining with fibre-reinforced polymer (FRP) [5] textiles, would greatly increase the ultimate rotation of the columns, hence increasing the lateral deformation capacity at the first story, but again it will not avoid damage concentration in the first story and the collapse of the structure, as has been proven experimentally in full-scale tests [6]. Still, designers can positively exploit such damage concentration by using a retrofitting strategy similar to that used in base-isolated systems with energy dissipation devices. Under this approach, the existing columns (strengthened, if needed) could be considered as bearings that take in the gravity loads and second-order effects due to lateral deformation. In turn, the energy dissipation devices added in the first story concentrate most of the energy input by the earthquake. There are few references in the literature analysing this strategy. Parducci et al. and Mezzi and Parducci [7,8] compared different retrofitting strategies, concluding that the most economical solution was a combination of dampers and partial strengthening. Benavent-Climent and Mota-Páez [9] proposed an energy-based procedure for the seismic retrofitting of RC frames with a soft first story using hysteretic dampers. In this study, the authors designed dampers for a general seismic hazard scenario and evaluated it against far-field records. However, the severe demands imposed by near-field earthquakes were not considered [10,11,12,13]. Other authors have investigated the effect of near-fault earthquakes on framed structures equipped with friction and viscous dampers [14,15,16], concluding that the use of energy dissipation devices improved the behaviour of the structures studied. Even so, the literature about hysteretic dampers in near-fault scenarios is very limited [17] and, to the best of the authors’ knowledge, inexistent for the particular case of RC frames with hysteretic dampers only in the first story.
This paper investigates the seismic performance against near-fault earthquakes of non-ductile RC frames with a soft first story and masonry infill walls in the upper stories that were retrofitted with hysteretic dampers. Three prototypes representative of mid-rise buildings were retrofitted following an energy balance approach for a generic seismic hazard scenario. The seismic response under a set of 20 near-fault ground motions was obtained through nonlinear time history analyses. The maximum lateral displacements were within the limits allowed by well-known international standards but notably larger than those obtained for far-field ground motions. It is shown that the maximum response under near-fault earthquakes can be predicted from the energy balance of the structure by using an appropriate value for the so-called equivalent number of cycles.
Finally, it is worth emphasising that the behaviour of soft-first-story frames retrofitted with dampers has been widely investigated in the past under far-field ground motions but very scarcely under near-fault earthquakes; this constitutes one of the novelties and the main goal of this paper. The proposal of the new expression mentioned above for estimating the equivalent number of cycles for this type of structure under near-fault earthquakes constitutes a novel contribution of this study. It improves the expression proposed by Akiyama for a generic earthquake and provides a better prediction of the maximum displacement of soft-first-story frames retrofitted with dampers under near-fault earthquakes.

2. Predicting the Seismic Response by Applying the Energy Balance Concept

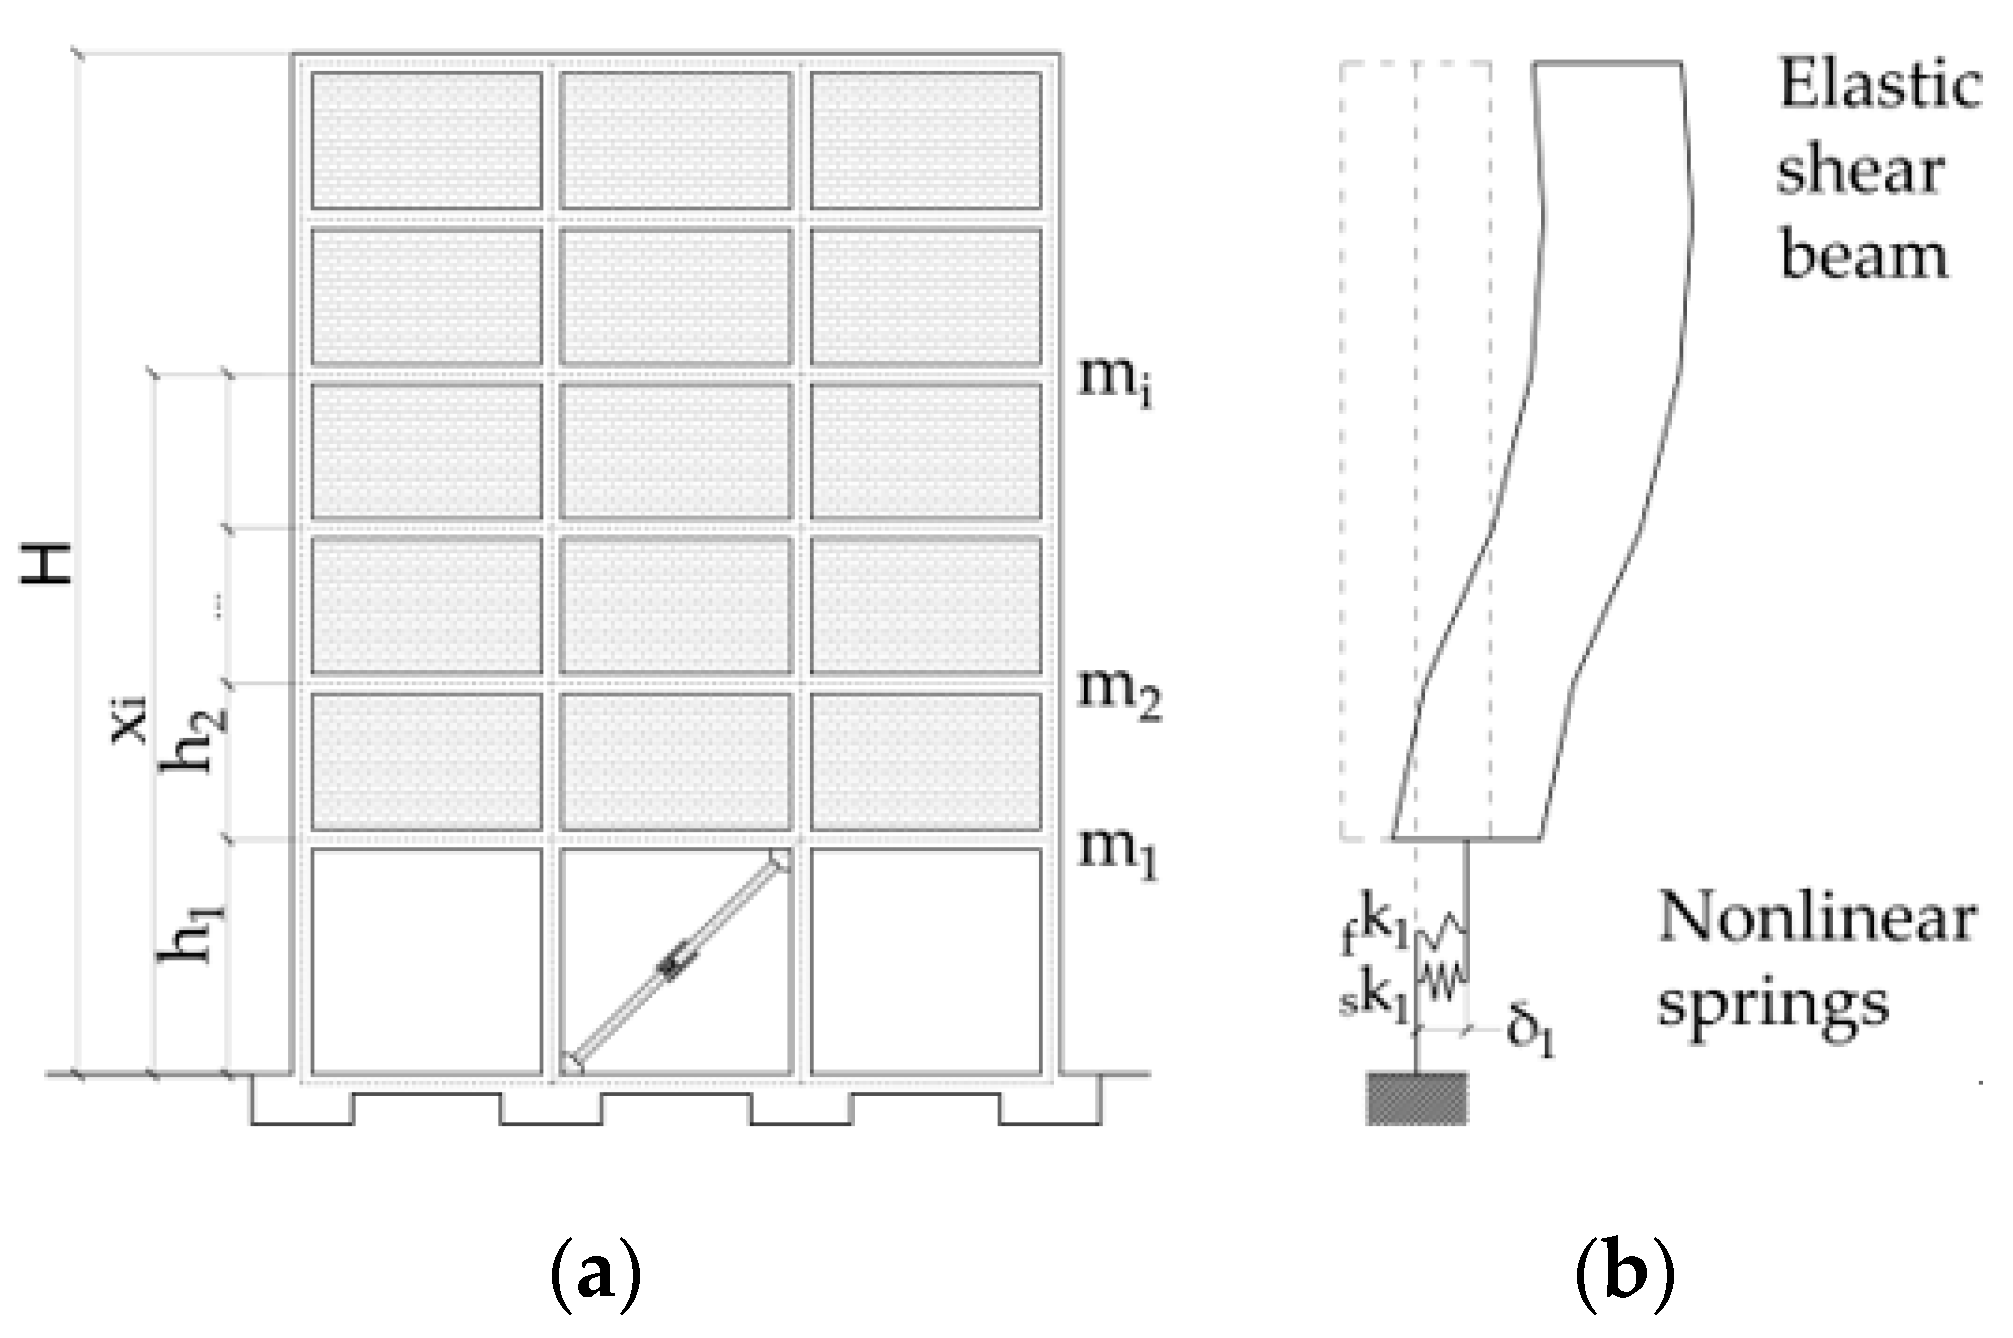
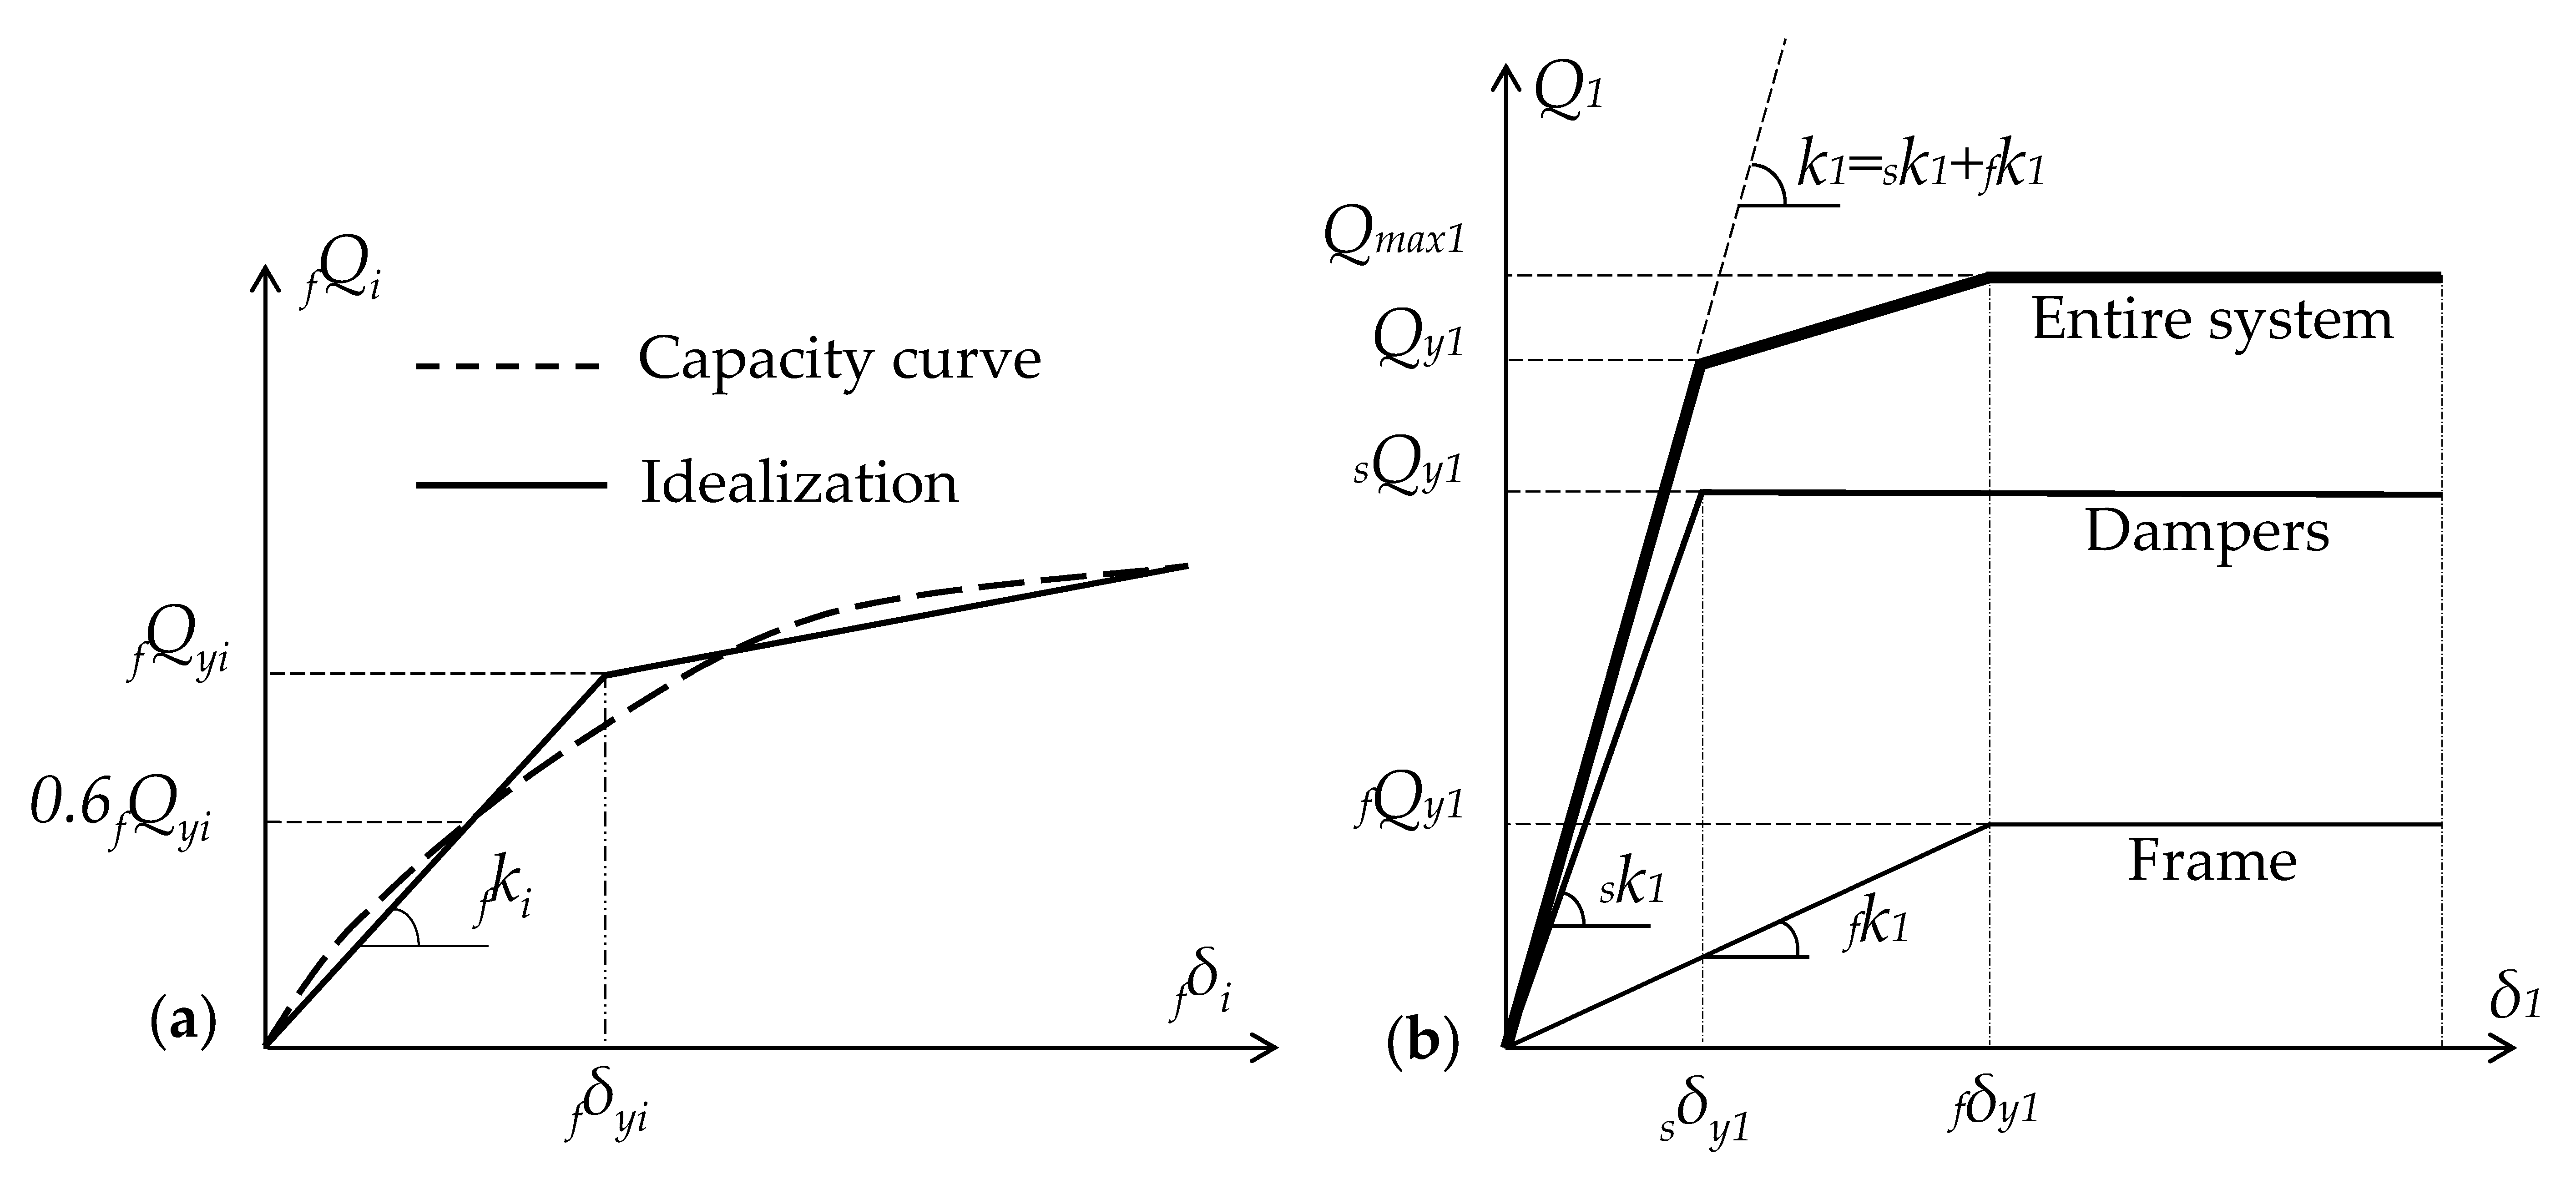
2.1. Analytical Modelling of the Structure

A frame with a soft first story and masonry infill walls in the upper stories that is retrofitted with hysteretic dampers can be idealised as a continuous elastic shear beam connected to the foundation through two parallel nonlinear shear springs (Figure 1). The springs represent the stiffness and strength discontinuity at the base. The first spring accounts for the contribution of the frame at the first (ground) story, defined by its elastic stiffness fk1, yielding force fQy1 and yielding inter-story displacement fδy1. The second spring represents the strength and stiffness added by the dampers, defined by their elastic stiffness sk1, yielding force sQy1 and yielding inter-story displacement sδy1 (=sQy1/sk1).
Figure 2a shows with a dashed line the typical relationship between shear force and inter-story drift, fQifδi, of the un-retrofitted frame at any story i. This curve is obtained by performing a nonlinear static (pushover) analysis using a representative nonlinear model of the RC frame that includes the masonry infill. In the upper stories (i.e., for i > 1), this curve is replaced by a bilinear idealisation that allows for determination of the initial elastic stiffness fki, the shear force fQyi and inter-story drift fδyi, as depicted in Federal Emergency Management Agency FEMA-356 [4]. In the first story (the only one that undergoes plastic deformations), the actual fQ1fδ1 curve is replaced by an elastic-perfectly-plastic (EPP) model (i.e., the slope of the second segment is made zero), that is depicted in Figure 2b as frame, and characterised by the initial elastic stiffness fk1, the shear force fQy1 and inter-story drift fδy1(=fQy1/fk1) at yielding. Figure 2b also shows the relationship between the shear force and the inter-story drift provided by the dampers of the first story, with an EPP model characterised by sk1, sQy1 and sδy1 (=sQy1/sk1). The total base shear force of the entire system at yielding is Qy1 = sQy1 + fk1·sδy1, and the maximum shear force is Qmax1 = sQy1 + fQy1.
In turn, the shear beam that represents the upper stories is assumed to remain elastic; it is defined by Gupper, assumed to be uniform from x = h1 to x = H, where x is a variable that measures the vertical distance from the foundation, h1 is the height of the first story and H is the total height of the building (see Figure 1a). Gupper can be derived from the story stiffness fki obtained by means of a linear static analysis as follows. First, at a given story i, Gi is defined as Gi = fQii, where γi = fδi/hi and hi is the height of the i-th story. Gi can be rewritten as Gi = fki hi. Next, Gupper is taken as the average of the Gi at each story weighted by hi to account for different story heights:
G u p p e r = i = 2 i = N k f i h i 2 i = 2   i = N h i
Alternatively, instead of weighting all Gi, Gupper can be also taken as the total lateral stiffness of the elastic superstructure and calculated just by adding a unitary force at the top of the building and calculating the global stiffness.

2.2. Energy Balance

In the mid-twentieth century, Housner [18] in the U.S. and Akiyama [19,20] in Japan settled the bases of the energy-based seismic design of structures. The fundamental energy balance equation of the structures can be simply obtained by integrating the work done by the dynamic forces along the total time duration of the earthquake, t0, as follows [20,21]:
M 0 t 0 u ¨ u ˙ d t + C 0 t 0 u ˙ 2 d t + 0 t 0 F ( u ) u ˙ d t = M 0 t 0 u ¨ g u ˙ d t
On the left side of Equation (2), the first term is the kinetic energy, Wk; the second term is the energy dissipated through the damping mechanism, Wξ; and the third term is the work done by the restoring force F(u), Ws, which comprises two parts: (i) the recoverable elastic strain energy Wse and (ii) the unrecoverable cumulative plastic strain energy Wp. The right side of Equation (2) is, by definition, the total energy input by the earthquake EI. Taking these into account, Equation (2) can be rewritten:
W k + W ξ + W s e + W p = E I
Akiyama [19,20] demonstrated that except for structures with very short periods, the value of EI in a multiple-degree-of-freedom (MDOF) system subjected to a given ground motion is approximately equal to the energy input by the ground motion in a single-degree-of-freedom (SDOF) system with period equal to the fundamental period T1 of the MDOF and mass equal to the total mass of the MDOF system. Wk and Wse balance each other during the whole vibration, summing up the so-called elastic vibrational energy (We = Wk + Wse). Housner defined the energy that contributes to damage, ED, by ED = EI − Wξ, leading Equation (3) to read:
E D = W e + W p = E I W ξ
For convenience, ED can be expressed as an equivalent velocity, VD, defined by:
V D = 2 E D M
Housner [18] proved that VD is close to the value of the spectral velocity SV for the fundamental period of the structure, T1, and for design purposes it can be assumed that VD = SV. In turn, SV can be readily obtained from an acceleration spectrum SA-T at the site, multiplying SA(T1) by T1/2π. Hence, Equation (4) can be rewritten as follows:
W e + W p = M S V 2 2  

2.3. Estimation of the Elastic Vibrational Energy We

To estimate the elastic vibrational energy We, the nonlinear spring of the first story that represents the frame is replaced by an undamped elastic continuous shear beam of length h1 and shear stiffness G1st (=sk1 h1). The contribution of the damper to G1st and therefore to We is disregarded. This is a conservative assumption since it implies underestimating the energy absorption capacity of the structure in terms of elastic strain energy, and it is justified because the damper yielding displacement sδy1 must be marginal when compared to fδy1 in order to effectively protect the frame against plastic deformations. Hence, the amount of elastic energy provided by the hysteretic dampers is negligible when compared to the rest of the system, and it is not considered. As a result, to estimate We the entire structure is represented by a cantilever elastic shear beam with two different shear stiffnesses: G1st from x = 0 to x = h1 and Gupper from x = h1 to x = H. The mass per unit length m is assumed constant and taken as m = m i / M   . Here xi is the distance from the ground to the i-th floor and mi is the mass at each level. The partial differential equation of this cantilever under a ground motion acceleration at the base z ¨ g ( t ) can be resolved by applying modal analysis, and the elastic vibrational energy is obtained from the following expression [9]:
W e = M g 2 T 1 2 4 π 2 ( e a 2 ) α f m a x , 1 2 2
where T1 is the fundamental period of the frame (without dampers), M is the total mass of the system, g is the gravity acceleration and α f max , 1 (=fQmax,1/Mg) is the base shear force coefficient of the frame, defined as the ratio between the maximum base shear sustained by the frame, fQmax,1, and the total weight of the building, Mg. In Equation (7), the ratio e/a2 is a constant that depends on the dynamic properties of the system and the V-T spectrum that characterises the ground motion. For structures with a soft first story, the following expression has been proposed [9] to estimate e/a2:
e a 2 = [ 0.35 0.33 ( h 1 H ) ] e ( G u p p e r G 1 s t ) 1.75 1.5 ( h 1 H ) + [ 1.04 + 0.25 ( h 1 H ) ]

2.4. Estimation of the Plastic Strain Energy Wp

In RC frames with a soft first story and infill walls in the upper stories, plastic deformations occur only at the first story. The inelastic demand in terms of curvature ductility occurs at the columns’ ends (critical regions), and it is very often, due to high axial load, much higher than the current ductility. Past studies [22,23] have shown that in critical regions of primary seismic columns, the minimum amounts of transverse reinforcement indicated by codes such as Eurocode 8 are not sufficient in many cases in satisfying the curvature ductility demand, even when the axial load is moderate. Further, most existing RC frames that need seismic retrofitting were designed according to old seismic codes (or designed without seismic provisions), and the plastic deformation capacity of the members is very limited. When establishing the energy balance of the structure, it is therefore reasonable not to rely on the plastic deformation capacity of the existing RC frame and neglect its contribution to the energy dissipation capacity of the structure in the nonlinear range. Considering that only the dampers of the first story dissipate energy through plastic deformations, Wp can be expressed as:
W p = η Q s y 1 δ s y 1 =   η Q s y 1 2 k s 1 = η α s 1 2 M 2 g 2 1 k s 1
where sa1 is the base shear force coefficient provided by the dampers and η is the cumulative plastic energy deformation ratio defined by:
α s 1 = Q s y 1 M g
η = W p Q s y 1 δ s y 1
The cumulative plastic energy dissipation ratio η is related to the normalised maximum plastic deformation μ = ( δ max 1 δ s y 1 ) / δ s y 1   through a parameter termed in the literature equivalent number of plastic cycles, neq, and defined by neq = η/μ. Here,   δ max 1 denotes the maximum deformation of the first story. For general structures, Akiyama [19,20] proposed the following expression to estimate neq:
n e q = { 4 + 4 r q 1     r q 1 < 1 8     r q 1 > 1
where rq1 (=fQmax,1/sQy1) is the ratio of the maximum shear force experienced by the frame, fQmax,1, to the yielding force of the dampers, sQy1. For convenience, the following new ratios are defined:
χ 1 = k f 1 k e q
K 1 = k s 1 k f 1
where keq is the stiffness of an equivalent SDOF with mass M and period T1, obtained by:
k e q = 4 π 2 M T 1 2
Using the above ratios, the plastic strain energy of Equation (9) can be rewritten as:
W p = M g 2 T 1 2 4 π 2 α s 1 2 η K 1 χ 1

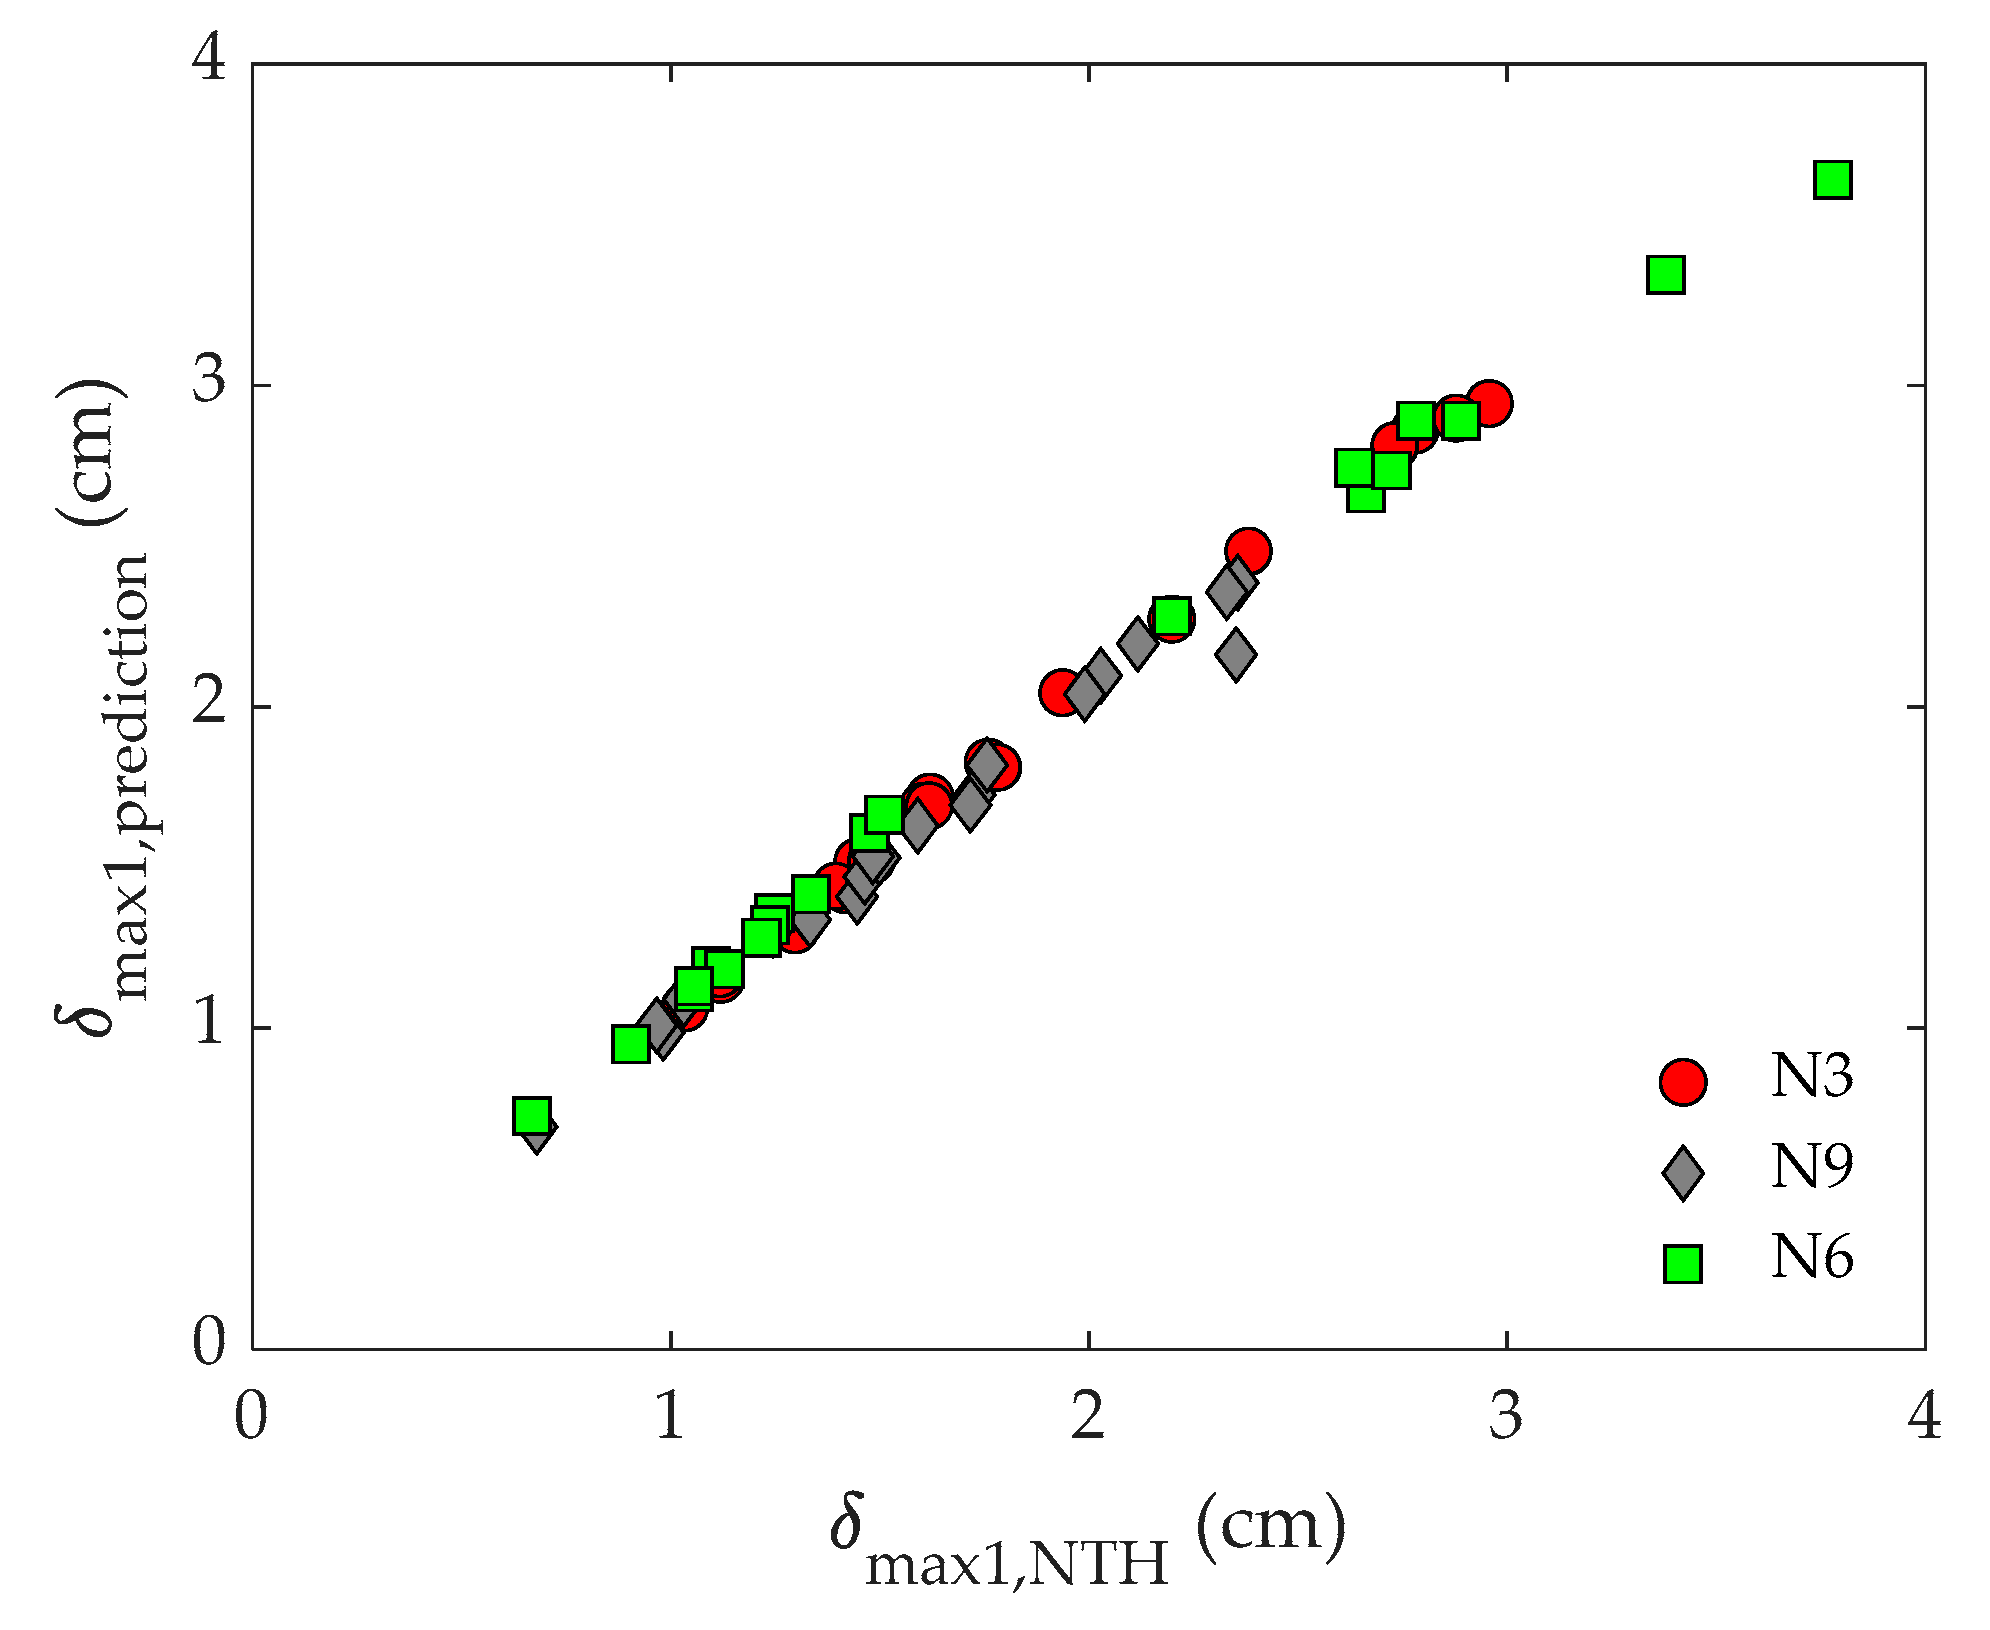
2.5. Maximum Inter-Story Drift at the First Story

Substituting Equations (7) and (16) in Equation (6), the energy balance equation is rewritten as follows:
( e a 2 ) α f max , 1 2 2 + α s 1 2 η K 1 χ 1 = 2 π 2 S V 2 T 1 2 g 2
Noting that fQmax1 = fQy1 (see Figure 2b), the maximum base shear force coefficient of the frame α f max , 1 (=fQmax,1/Mg) defined above can be replaced by the base shear force coefficient of the frame at yielding α f 1 defined by α f 1 (=fQy1/Mg), and solving for η in Equation (17) gives:
η = K 1 χ 1 α s 1 2 [ 2 π 2 S V 2 T 1 2 g 2 ( e a 2 ) α f 1 2 2 ]
Recalling that neq =   η / μ and μ = ( δ max 1 δ s y 1 ) / δ s y 1 , the maximum inter-story drift at the first story can be expressed by δ max 1 = δ s y 1 ( η n e q + 1 ) . Substituting here η given by Equation (18) gives:
δ max 1 = δ s y 1 { 1 + K 1 χ 1 n e q α s 1 2 [ 2 π 2 S V 2 T 1 2 g 2 ( e a 2 ) α f 1 2 2 ] }

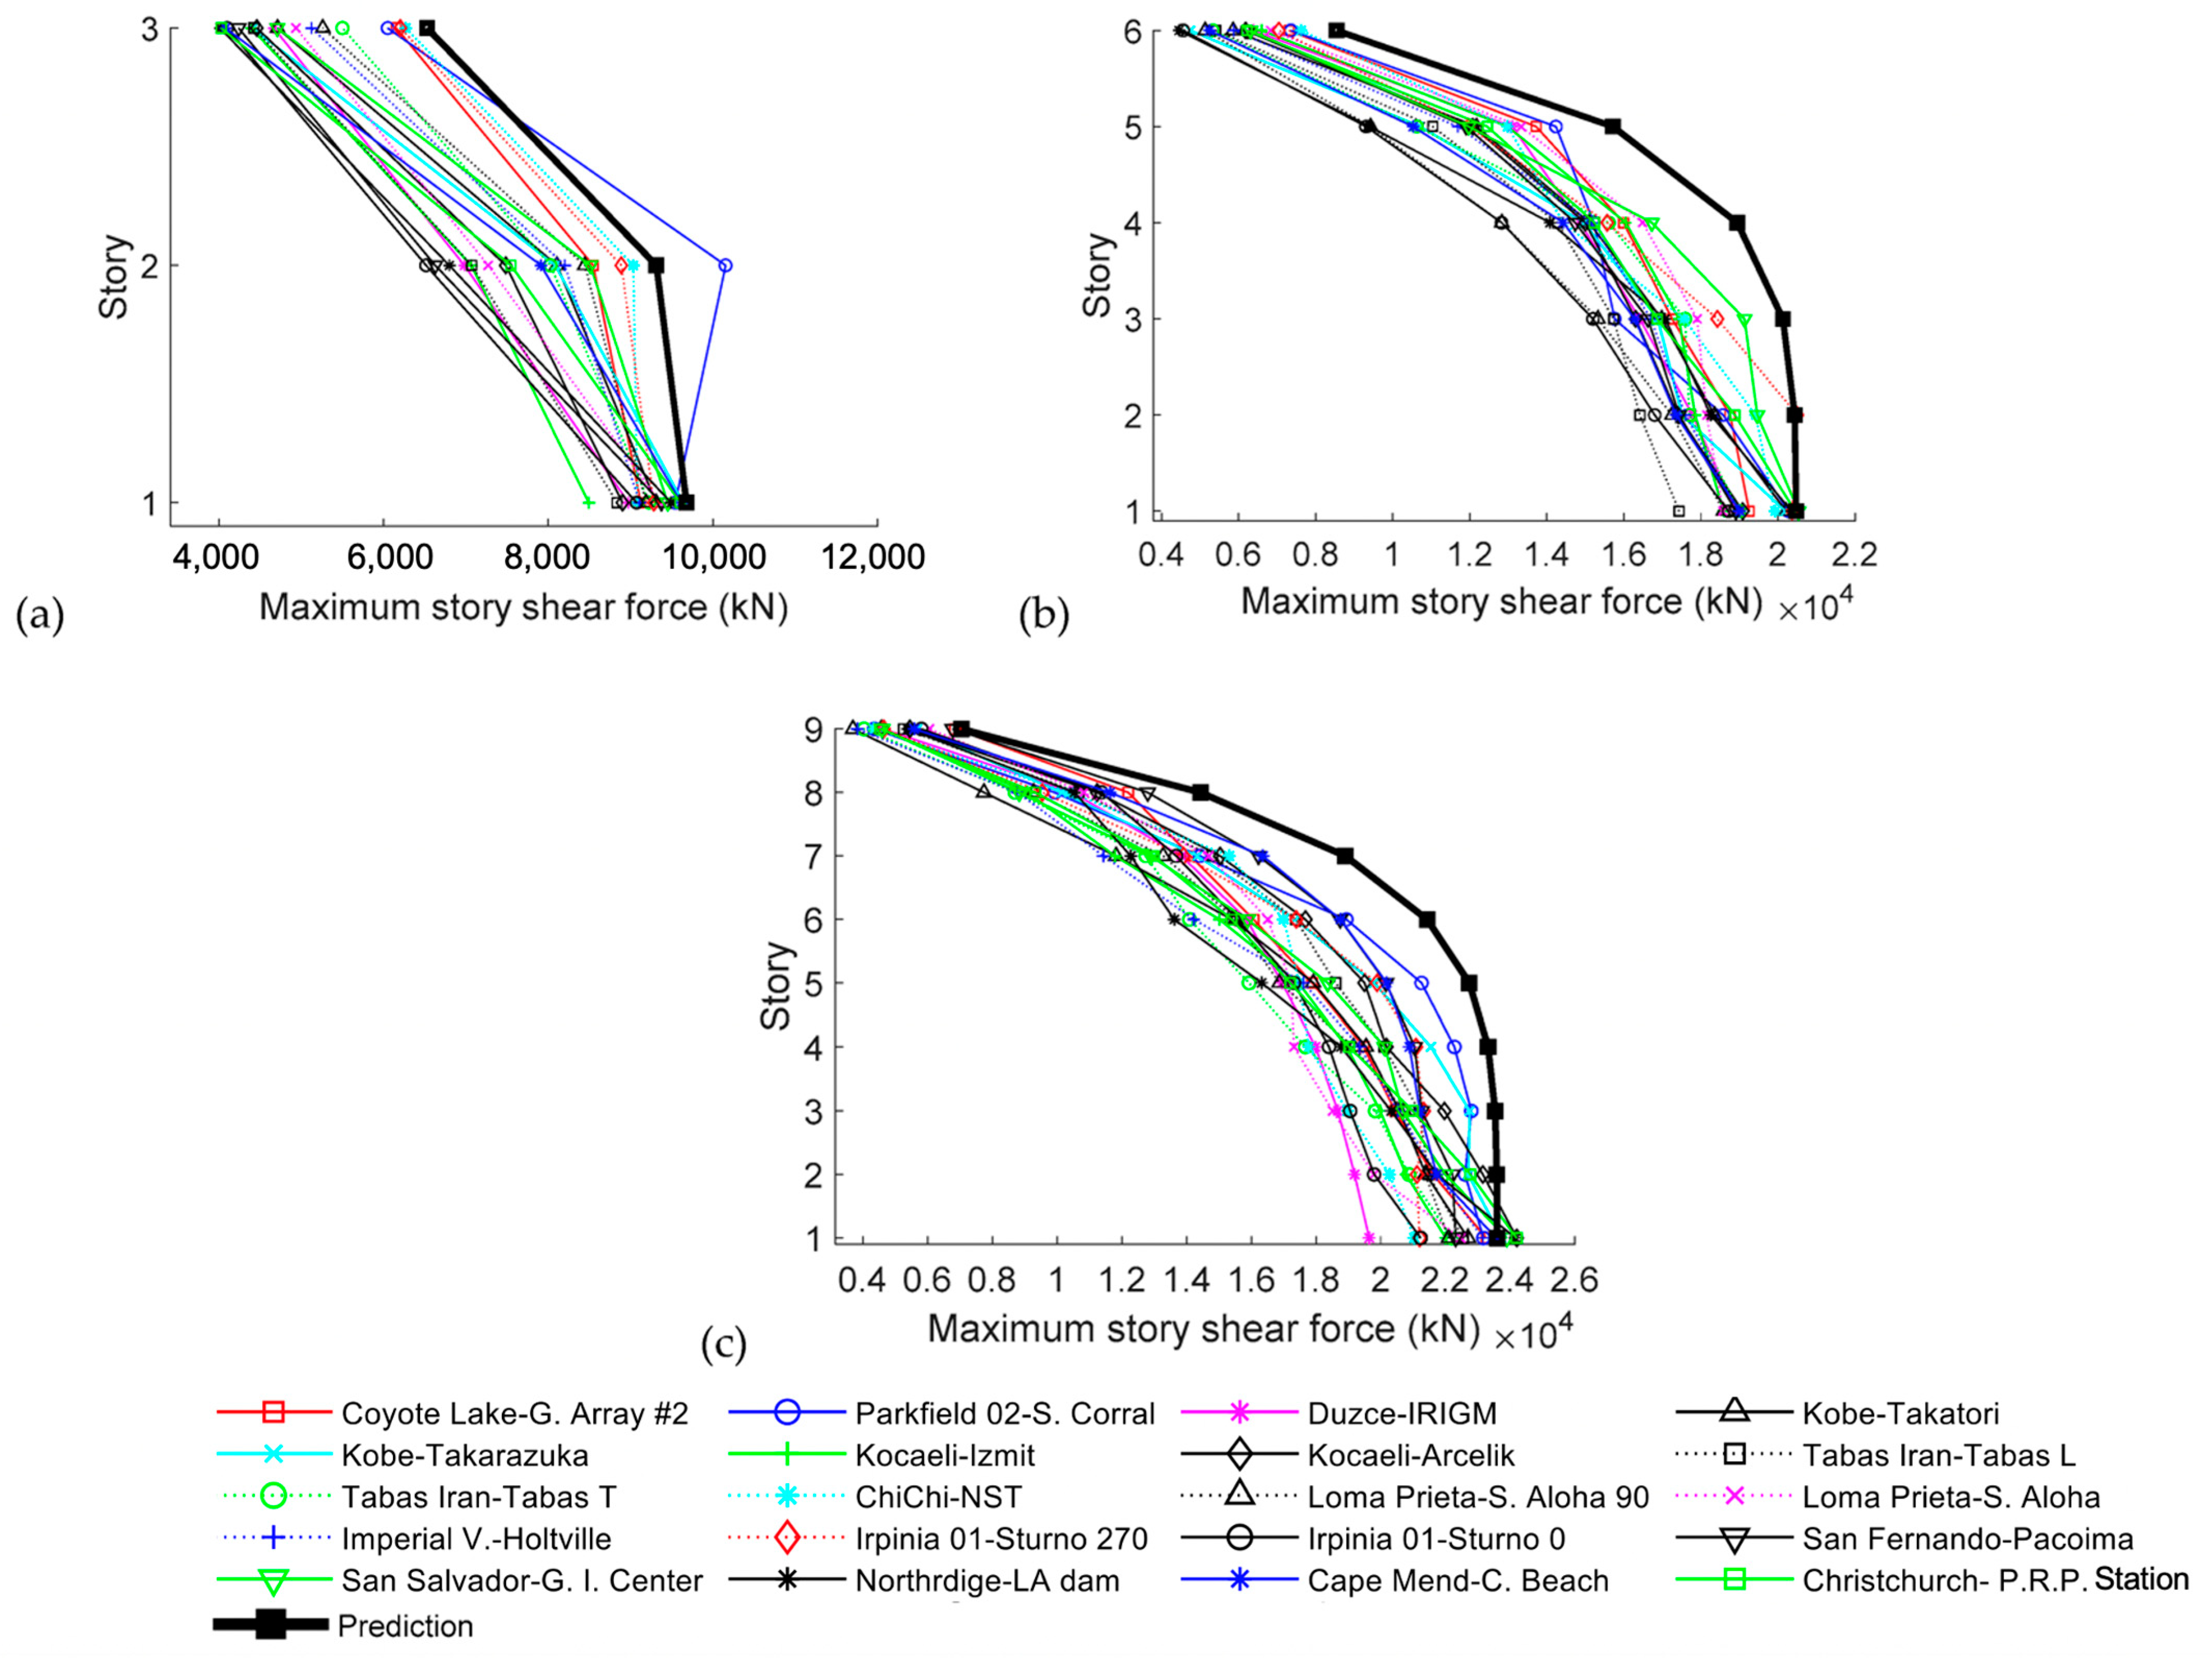
2.6. Maximum Shear Force at Each Story

The behaviour of an RC frame with a soft first story and infill walls in upper stories retrofitted with dampers is conceptually analogous to that of a base-isolated structure. In both cases plastic deformations are concentrated at the base, whereas the rest of the building (i.e., upper stories) remains elastic. To guarantee that the upper stories remain within the elastic range, it is critical to ensure that the maximum shear forces occurring at upper stories during the earthquake do not exceed their shear capacity. Following the analogy of a base-isolated structure, the procedure in American Society of Civil Engineers-Structural Engineering Institute ASCE-SEI-41-13 [24] was adopted to estimate the maximum shear forces in the upper part of the building. According to this formulation, the lateral forces acting at each level, Fxi, are computed by distributing the maximum base shear Qmax1 proportional to the mass and story elevation raised to a power. In this study, the value taken for the power is equal to four, which is the upper bound value established by ASCE-SEI-41-13 for base-isolated structures. Therefore, noting that Qmax1 = Q s y 1 + δ s y 1 k f 1 , the following equation is proposed to estimate Fxi:
F x i = Q m a x 1 m i x 4 k = 1 N m k x k 4
Once the forces Fxi are determined, the shear forces in a given story j, Qmax,j (for j > 1), are simply:
Q f max , j = i = j N F x i
It is worth noting that in the solution proposed in this paper, the dampers are installed only in the first story, where the axial forces in columns due to gravitational loads attain their maximum values. Nonetheless, the dampers impose additional axial forces in columns and in foundations that could not be considered as negligible in comparison with the axial forces due to gravity loads. One solution to alleviate these additional axial forces in columns and foundations is to divide up the required strength to be provided by the dampers, sQy1, among the maximum number of dampers (i.e., among the maximum number of spans). Despite this, it is often necessary to reinforce columns and foundations of the existing structure. One solution to reinforce the columns is to use fibre-reinforced polymers that can increase significantly the strength without impairing the stiffness.

3. Numerical Study

This section presents an extensive numerical study on RC frames with a soft first story and infill walls in upper stories retrofitted with hysteretic dampers and subjected to near-fault seismic hazard scenarios. Three prototypes having three, six and nine stories were designed for the highest seismic region of the Dominican Republic, where the peak ground acceleration (PGA) is 0.41 g, following the methodology described by the authors in previous studies [9]. The seismic hazard was characterised by an energy input spectrum expressed in terms of pseudo velocity VD-T. Recalling that VD can be taken equal to the spectral velocity SV, and given the well-known relationship between SV, the period T and the spectral response acceleration SA, i.e., SA = (2π/T)Sv, the VD-T design energy input spectrum was readily obtained from the acceleration response spectrum SA-T prescribed by the current seismic code of the Dominican Republic [25] for a 475-year return period (design earthquake) and for soft-soil conditions. The performance of two of these three prototype structures (i.e., the three- and six-story frames) under far-field ground motions was proved satisfactory in a previous study [9]. In this section, the performance of the same three- and six-story frames and of one additional frame having nine stories is investigated under 20 near-fault impulsive earthquakes.

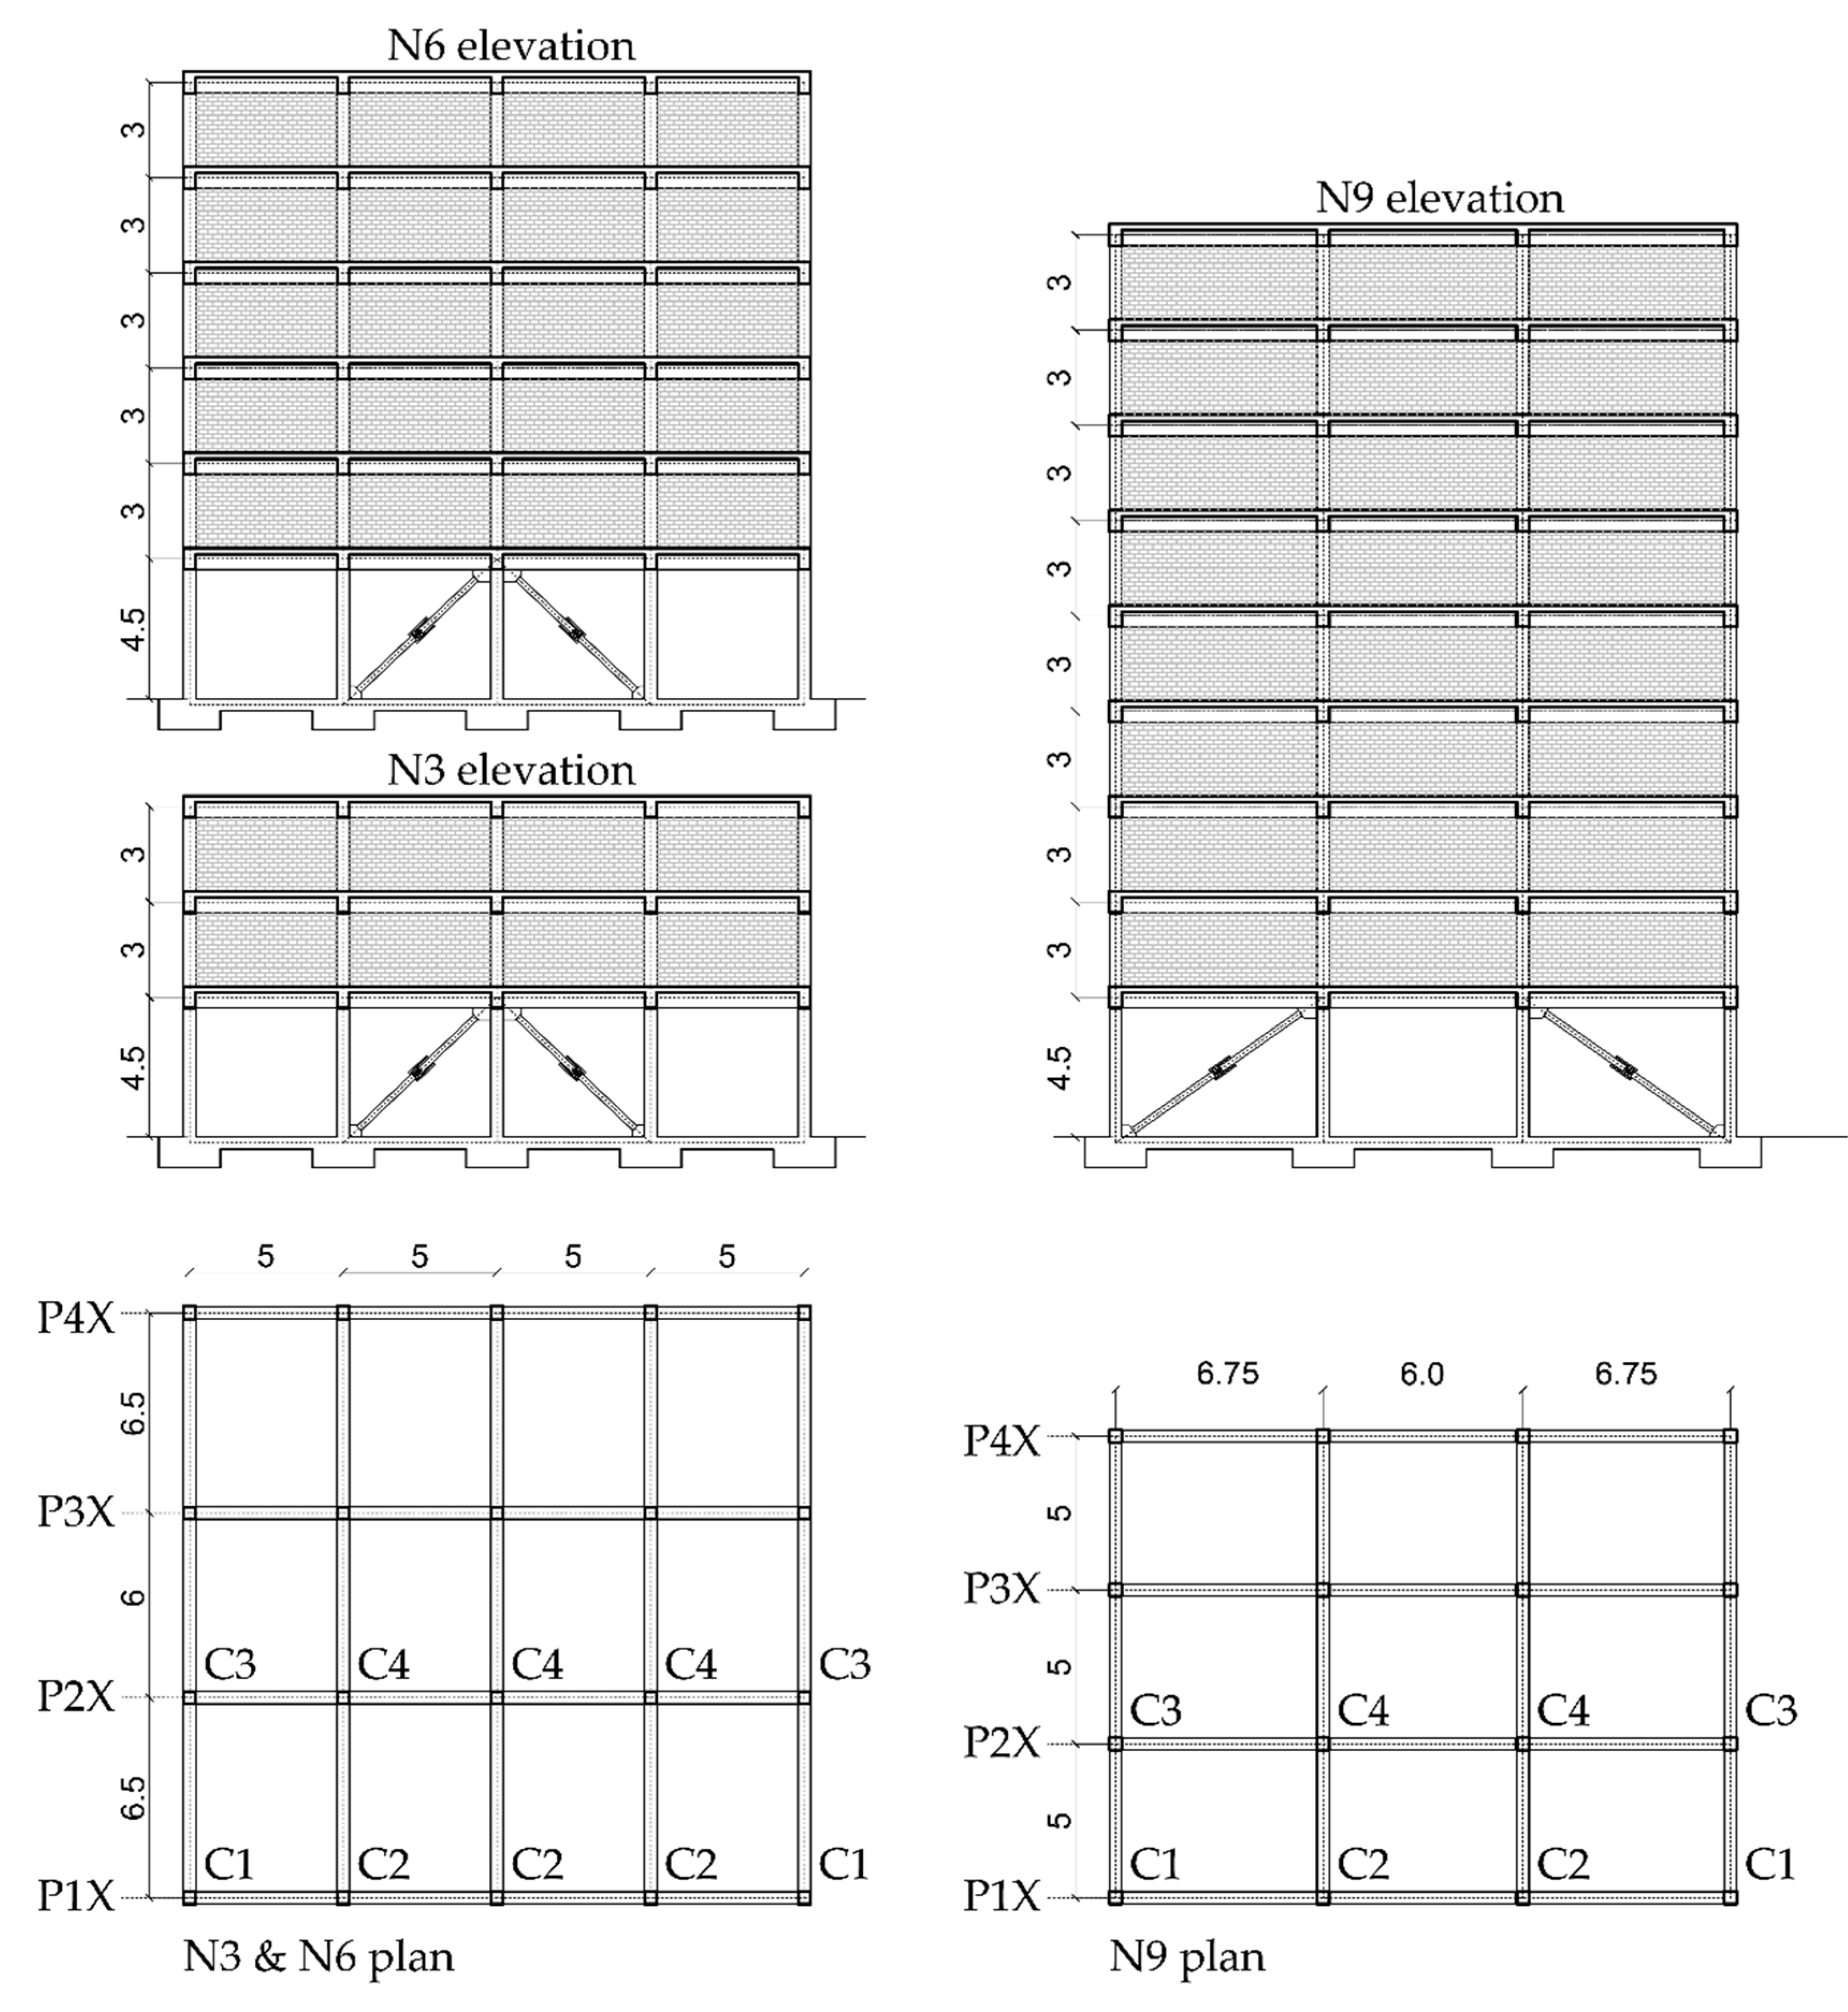
3.1. Description of the Prototype Buildings

Three RC-framed prototype structures were designed with three (N3), six (N6) and nine (N9) stories, having an open first story and upper stories infilled with masonry walls. The prototypes follow the construction practices of the Dominican Republic and were designed (without seismic provision) to sustain gravity loads only. Section dimensions and reinforcement were checked using American Concrete Institute ACI 318-99 [26]. N3 and N6 prototypes had four-by-three spans, whereas N9 had three-by-three spans, as seen in Figure 3. The flooring system entailed two-way slabs 0.16 m thick, supported by beams in both directions. The masonry infill walls were 0.15 m thick. The material mechanical properties typically used in the Dominican Republic are summarised in Table 1, while Table 2 shows the members´ dimensions linked to the notation in Figure 3. Table 2 also shows the inertial masses mi, corresponding to the self-weight and live loads, to be considered in the dynamic analysis. It is worth noting that the study focuses on the ground motions acting only in the X direction, so only the elements in this direction were defined herein.
These prototype structures were seismically upgraded with hysteretic dampers in the first story, as shown in Figure 3. The lateral strength sQy1 and stiffness sk1 provided by the dampers in the first story, and the corresponding inter-story drifts at yielding δ s y 1 , are given in Table 3.

3.2. Numerical Modelling

To carry out nonlinear time history (NTH) analyses, nonlinear numerical models of the prototypes were developed using Inelastic Dynamic Analysis of Reinforced Concrete IDARC-2D [27]. All frames in the X direction were considered for each model. The nonlinearities in the RC elements were concentrated on plastic hinges located at both ends of the beams and columns. To take into account the extension of the plastic hinge length as the level of plastic deformation increases, the spread of plasticity formulation implemented in IDARC-2D was adopted. The hysteretic moment rotation loops followed by the plastic hinges build on a non-symmetric moment curvature backbone of the cross section. This moment curvature backbone was determined with a fibre model analysis based on the nonlinear behaviour of the materials and the cross-sectional properties. The nonlinear properties of materials adopted for numerical modelling are as follows: concrete: compressive strength 20.6 MPa, initial Young’s modulus 21.5 GPa, strain at maximum strength 0.2%, stress at tension cracking 2.47 MPa, ultimate strain in compression 0.95% and slope of falling branch −2.2 GPa; steel: yield strength 274 MPa, ultimate strength 385 MPa, modulus of elasticity 206 GPa, modulus of strain hardening 3.33 GPa and strain at start of hardening 0.3%; and infill walls: prism strength of masonry 2.3 MPa, initial Young’s modulus 2.1 GPa, cracking stress of masonry 0.12 MPa, strain corresponding to prism strength 0.2%, shear strength of masonry bed joints 0.28 MPa and coefficient of friction of frame-infill interface 0.3. The response under cyclic loadings (i.e., the hysteretic rule) is governed by four parameters that account for the effects of stiffness degradation (HC), strength degradation (HBE, HBD) and pinching (HS). The values HC = 10, HBE = 0.01, HBD = 0.45 and HS = 0.25 were adopted for beams and HC = 10, HBE = 0.01, HBD = 0.45 and HS = 0.25 for columns. For the masonry infill walls, two compression struts linking correlative floors diagonally were defined using the lateral yield force and lateral stiffness determined in FEMA-356 [4]. Their nonlinear behaviour of the struts was modelled by the Bouc–Wen model [28] using the default values recommended by IDARC-2D. Finally, a tube-in-tube (TTD) metallic damper was considered in this study [29]. The TTD device exhibits stable quasi-rectangular loops under cyclic deformations. Its hysteretic behaviour was also represented with a Bouc–Wen model, whose parameters were calibrated against experimental results. The dampers were designed by applying the energy balance concept explained in Section 2.2, as follows. First, the values of fQyi, fδyi and fki = fQyi/fδyi were determined from a pushover analysis of the bare frame with infills; the fundamental period T1 was calculated with an eigenvalue analysis, and the ratio e/a2 was estimated using Equation (8). Second, the dampers were designed for the design earthquake associated with a return period of 475 years and soft-soil conditions prescribed by the current seismic code of the Dominican Republic [25]. The values of SV (=VD) obtained with this code are SV = 1.08 m/s for prototype N3, V SV = 0.97 m/s for prototype N6 and SV = 0.92 m/s for prototype N9. The yield horizontal displacement of the dampers was made equal to 0.15fδy1 so that the dampers start dissipating energy far before the onset of plastic deformations in the frame. The required horizontal strength of the dampers expressed in terms of sα1 was determined by solving sα1 in the energy balance equation of the structure, Equation (17), with fαmax1 = fQy1/Mg and η = 26. The value adopted for η corresponds to a low level of damage on the dampers, and it is far below the ultimate energy dissipation capacity of the type of damper (TTD damper) used in this study [27].

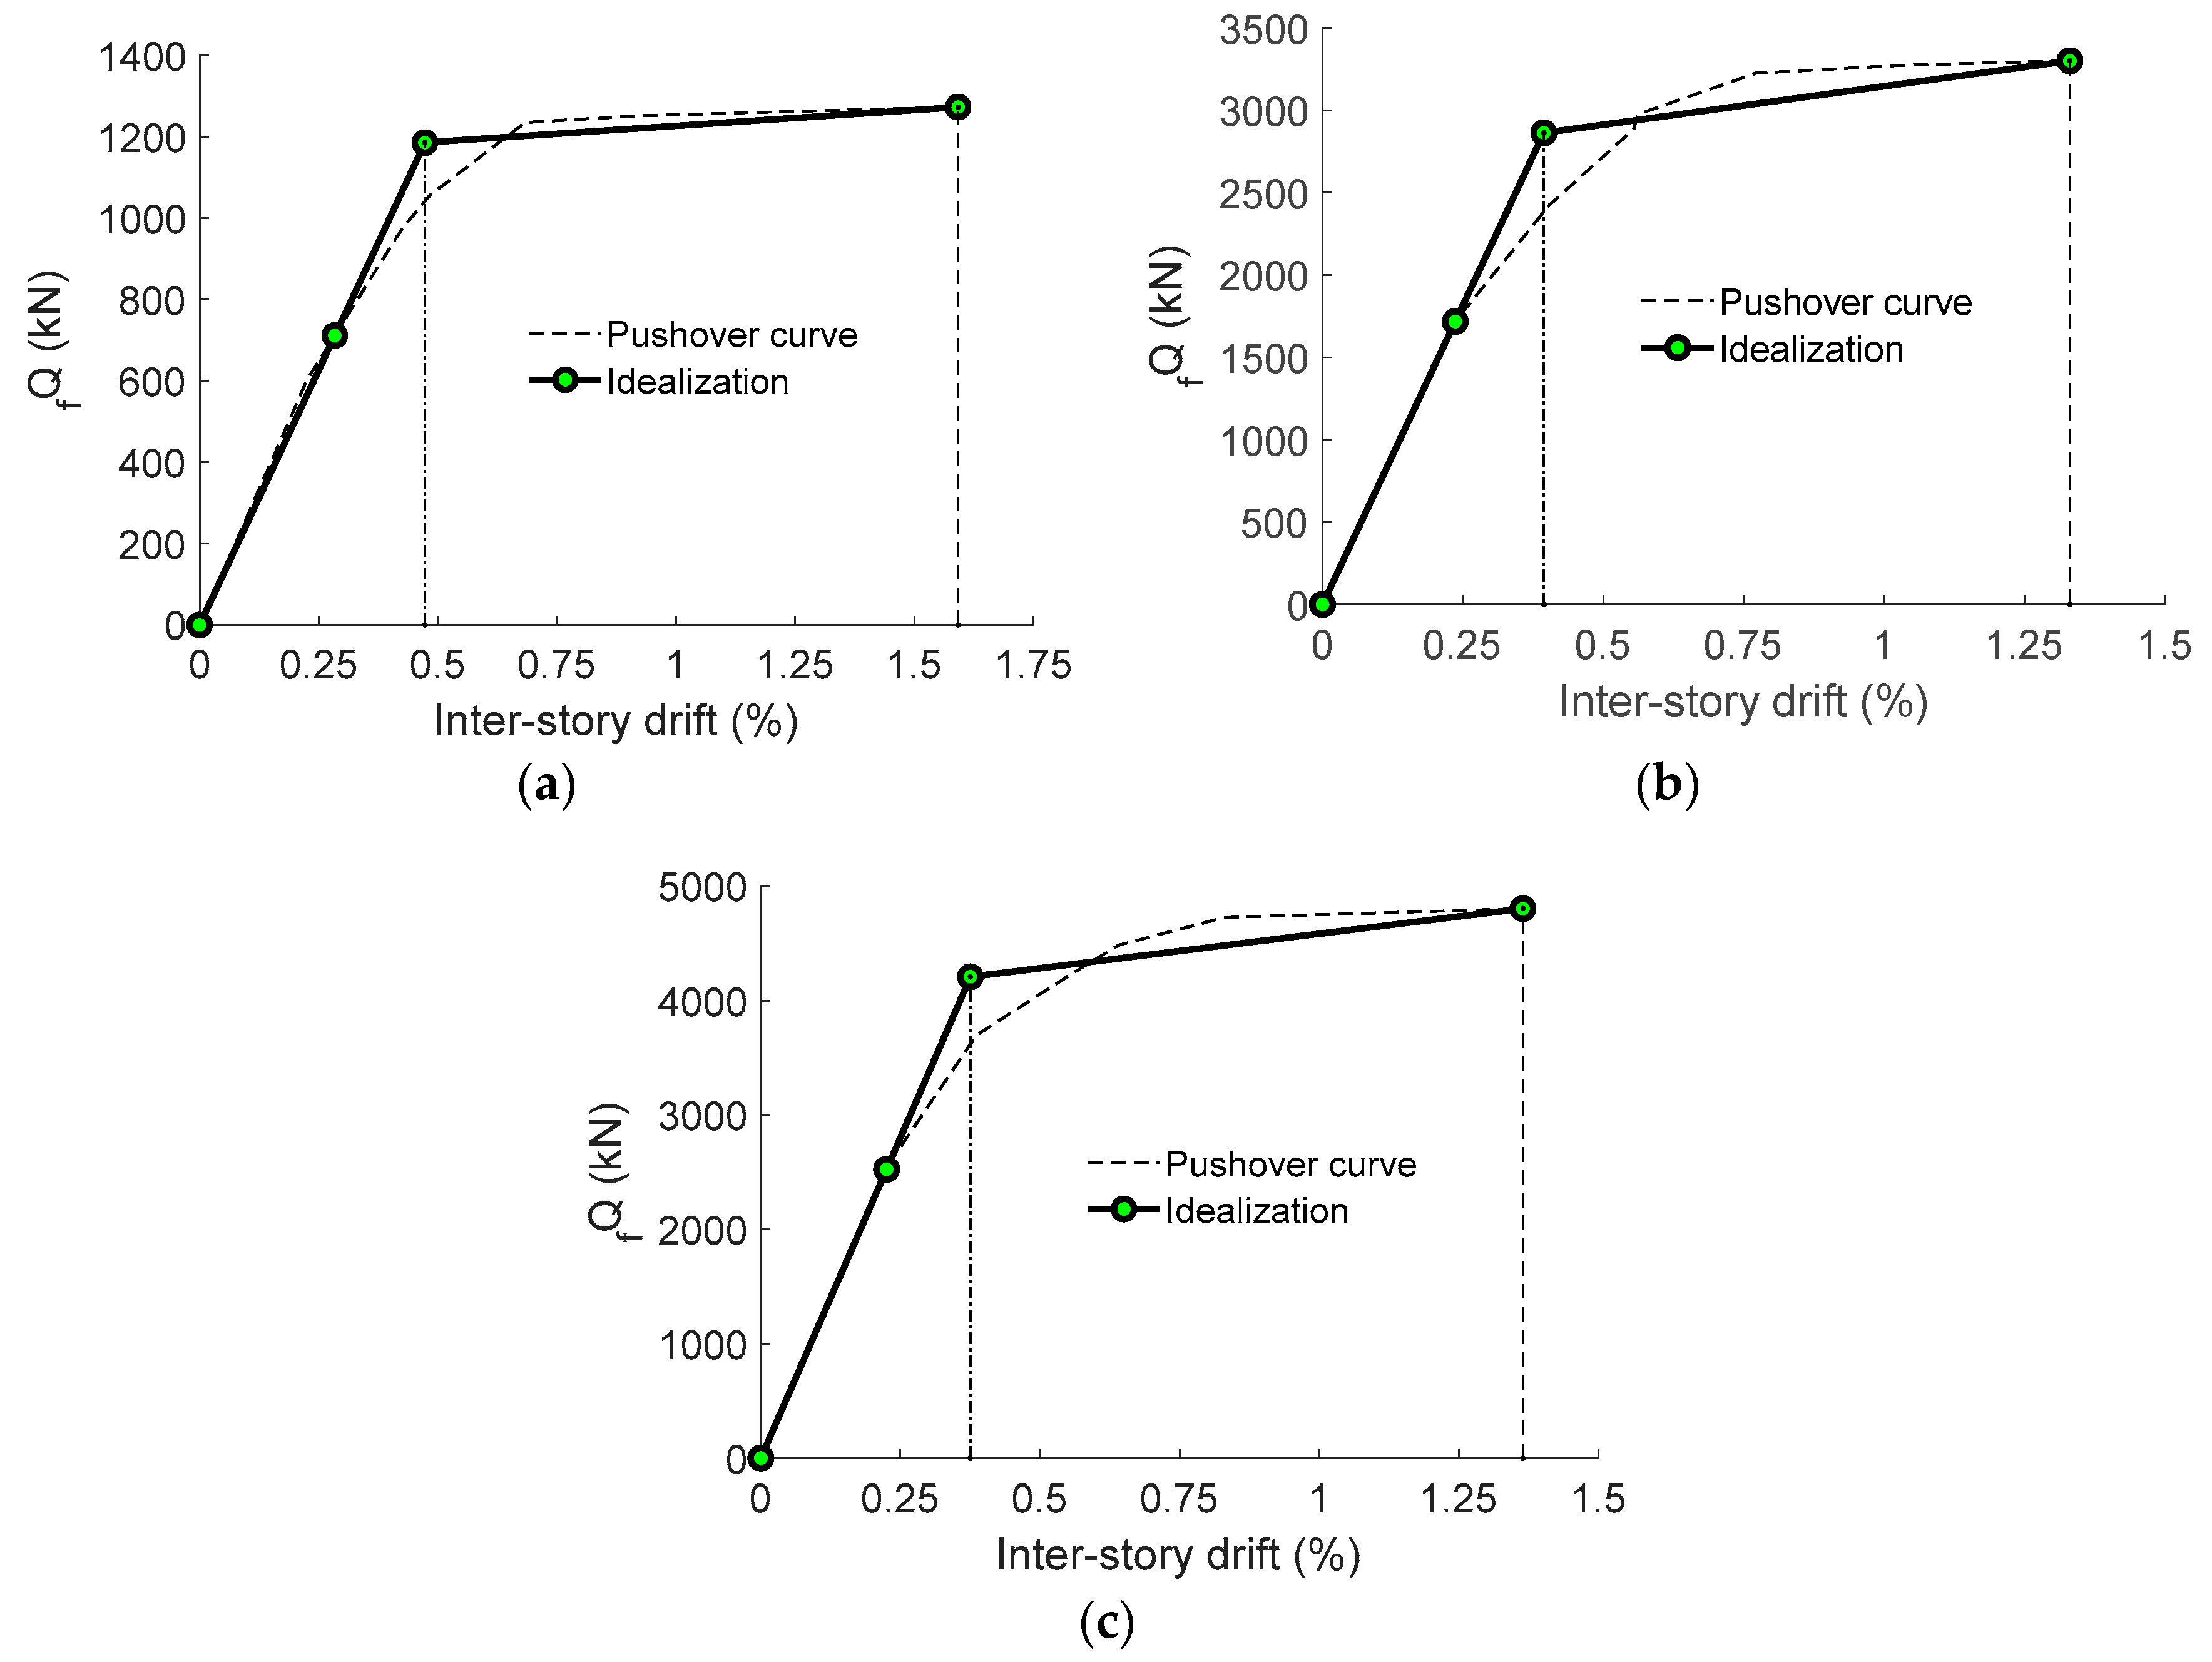
3.3. Pushover Analyses

Using the numerical models in Section 3.2, the capacity curves of each story (i.e., story drift vs. story shear force) of the bare frame with infill and of all prototypes were assessed from nonlinear pushover analyses. Figure 4 presents the characteristic curves obtained for the base story of prototypes N3, N6 and N9. Figure 4 also shows the bilinear idealisation employed for the characterisation of the main mechanical properties of each story, that is, fQyi, δ f y i and fki. The model criterion adopted for each story is based on FEMA-356 [4]. On the other hand, Table 3 summarises the values of the first story, together with the total mass of the buildings, M; the ultimate lateral displacement fδu,1; the fundamental period T1 obtained through eigenvalue analysis; and the ratio (e/a2) obtained using Equation (8).

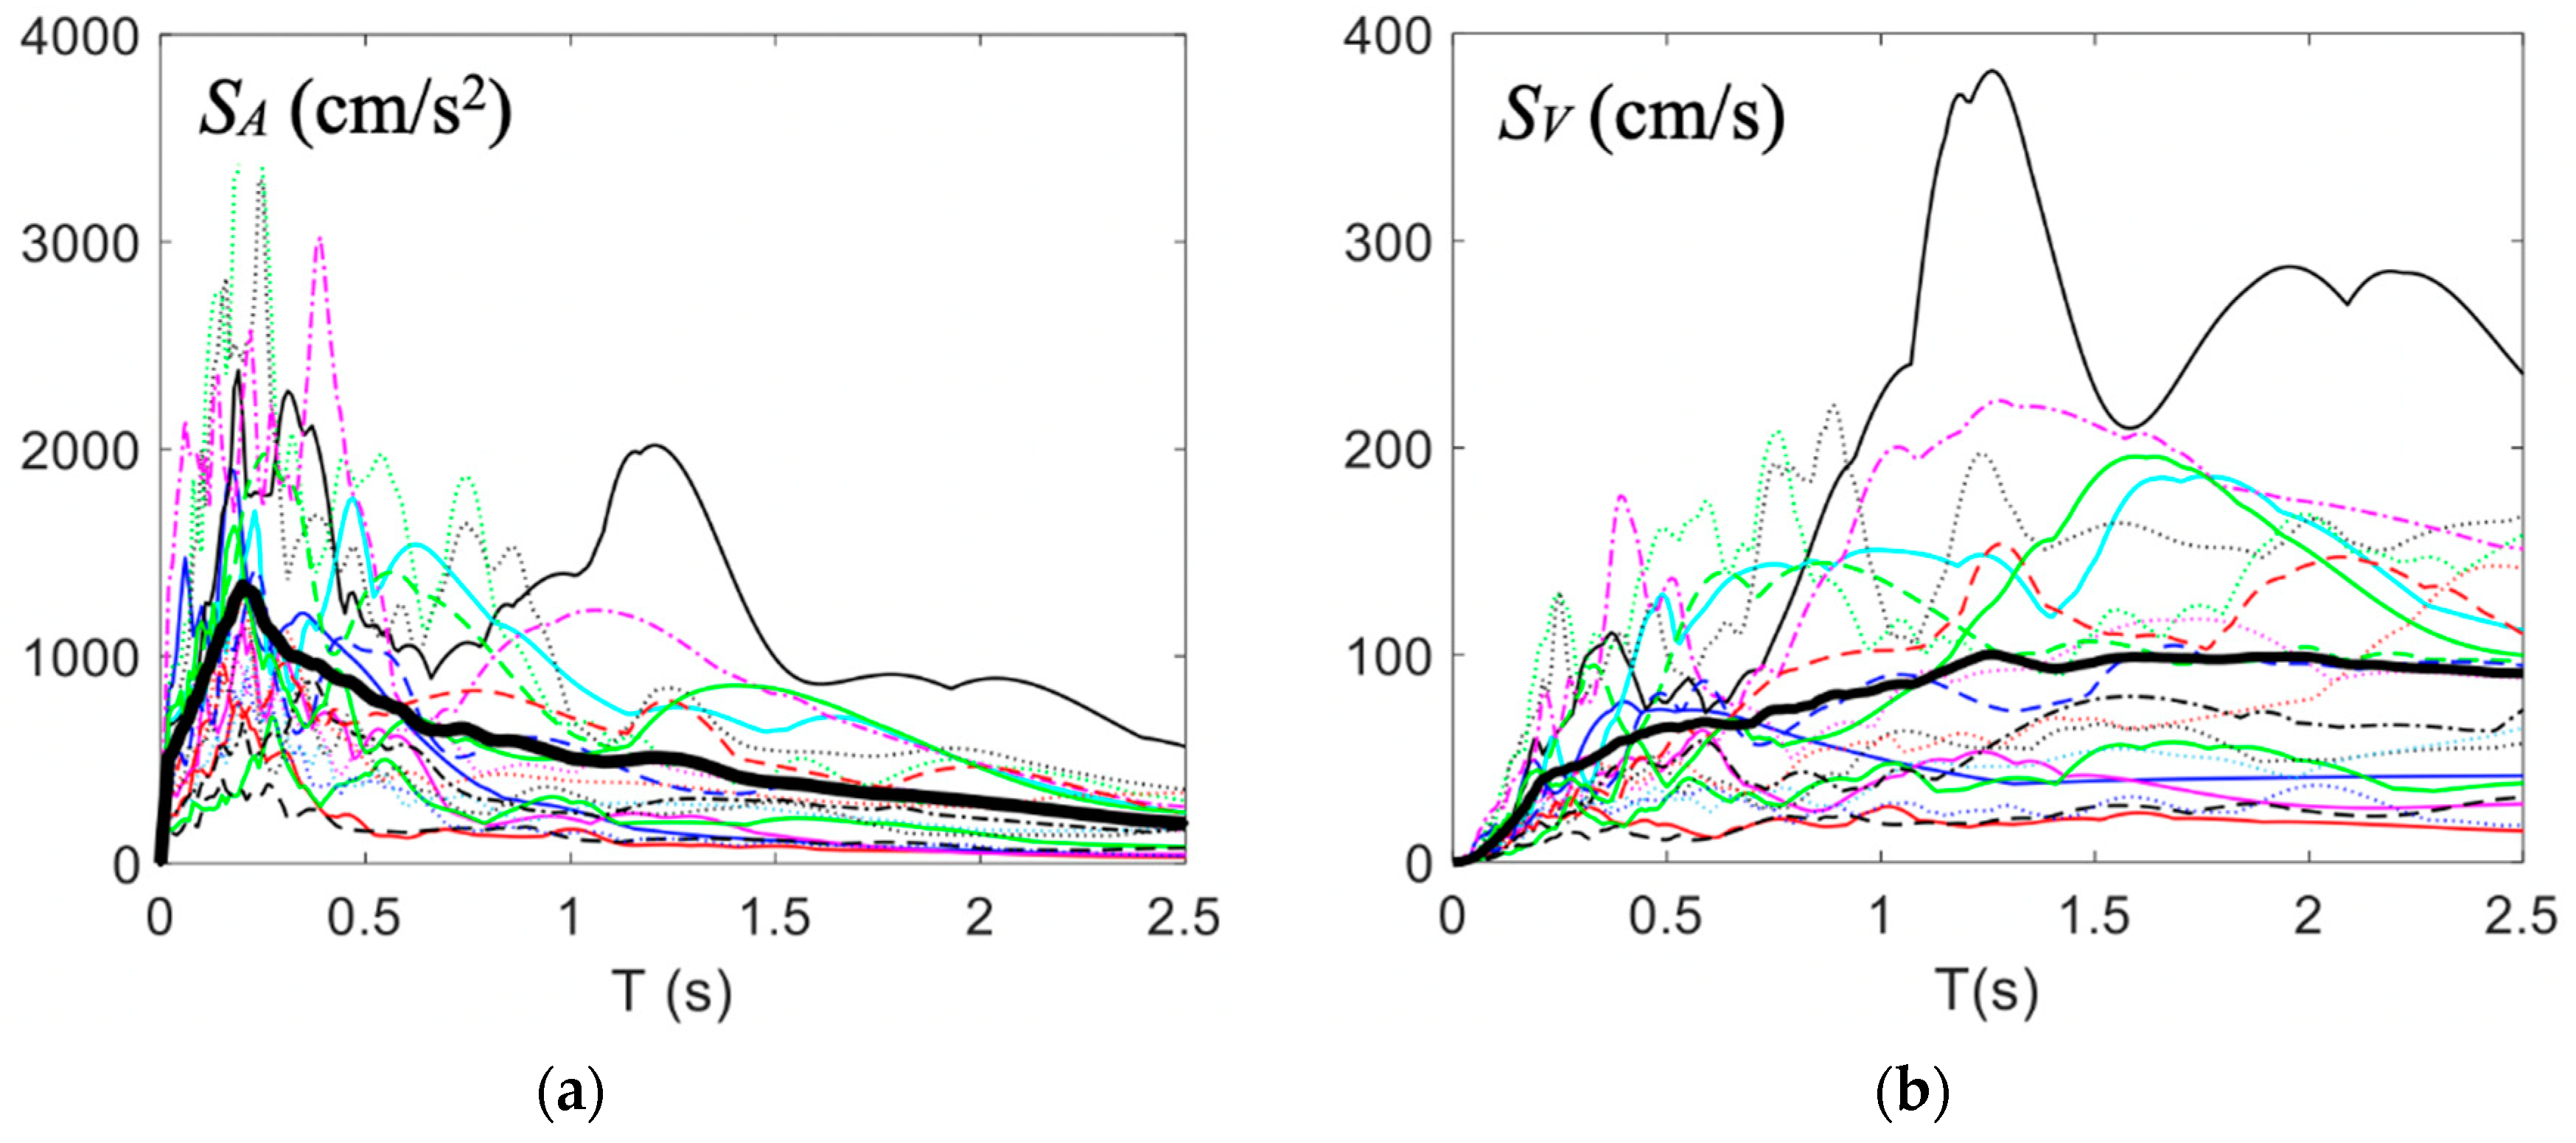
3.4. Time History Analyses: Ground Motions Considered

The numerical models representing the above prototypes were subjected to ground acceleration recorded during 20 near-field earthquakes, and the response was obtained through nonlinear time history analyses. The ground acceleration records were scaled to match (with a tolerance of ±2%) the VD considered for designing the dampers: VD = 1.08 m/s, VD = 0.97 m/s and VD = 0.927 m/s for prototypes N3, N6 and N9, respectively.
Table 4 shows the properties of the ground motion records used in the analysis, where Mw is the magnitude moment, Rjb is the closest horizontal distance to rupture plane and PGV is the peak ground velocity. The signals were selected from the Pacific Earthquake Engineering Research Center Ground motion database [30,31]. Table 4 also shows the scale factor employed for each record and prototype building, λN3, λN6 and λN9. Figure 5 shows the unscaled SA-T and SV-T spectra of the records used, together with the mean value (bold line).

4. Results and Discussion

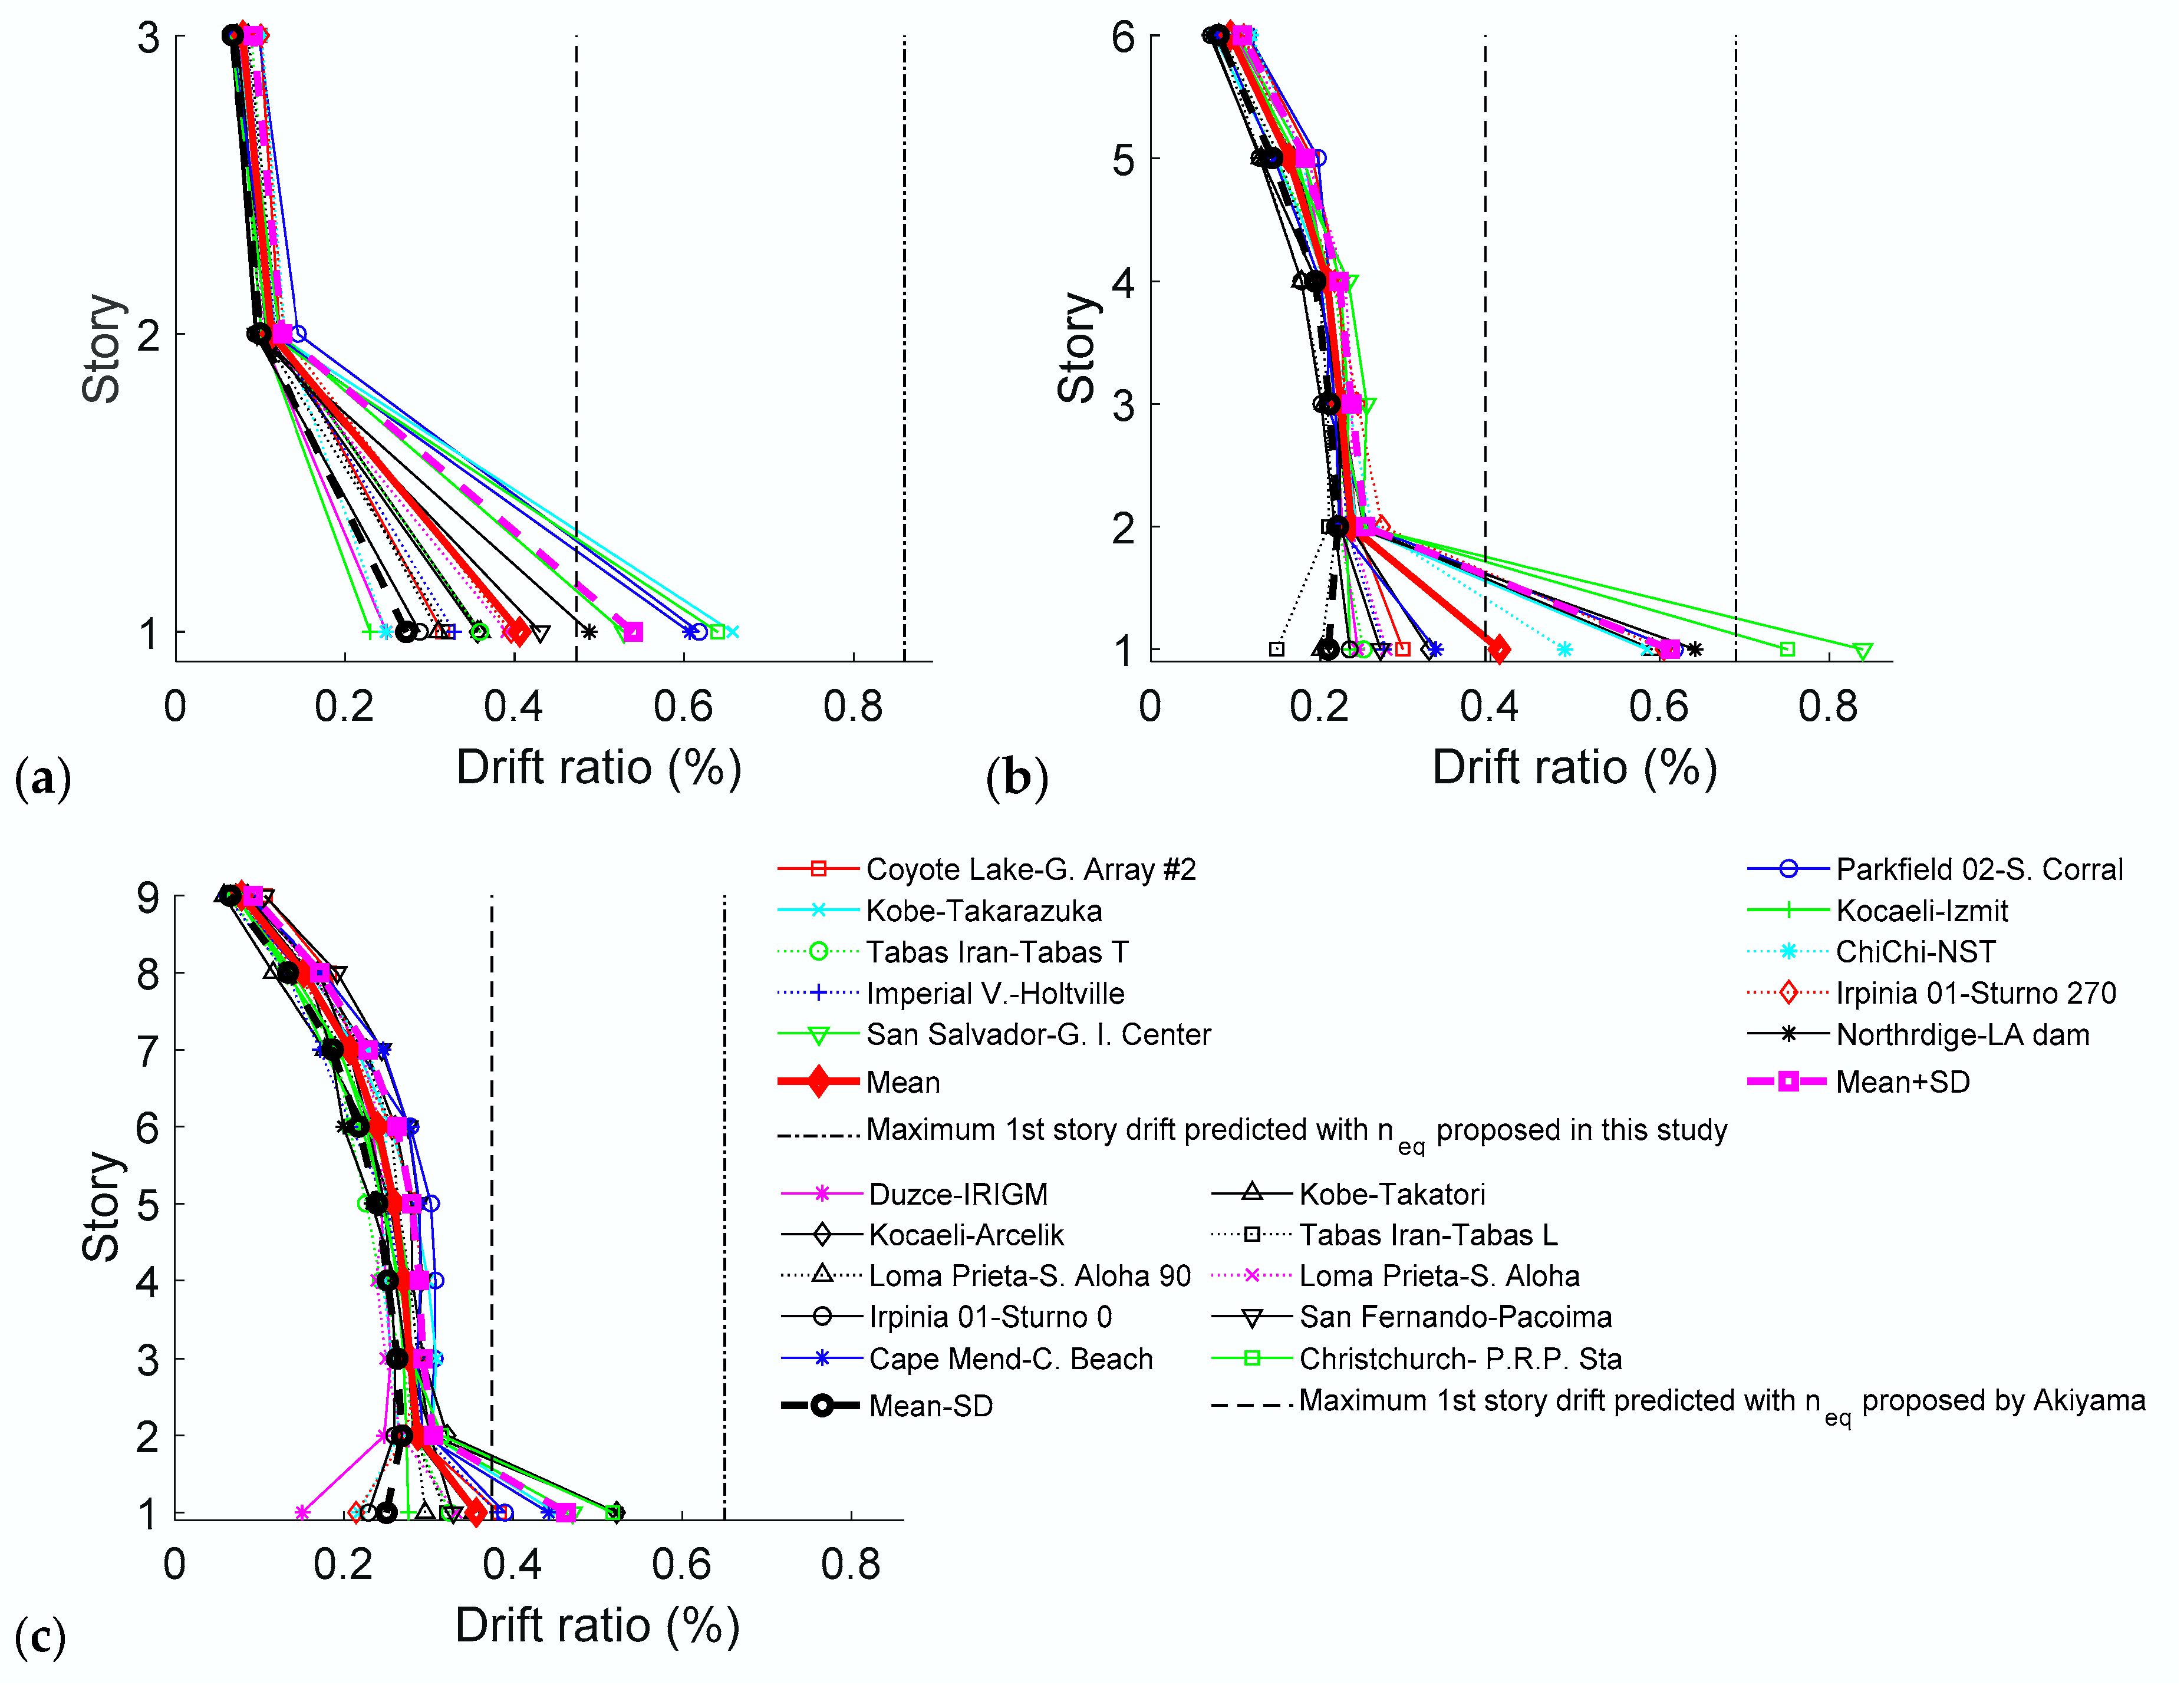
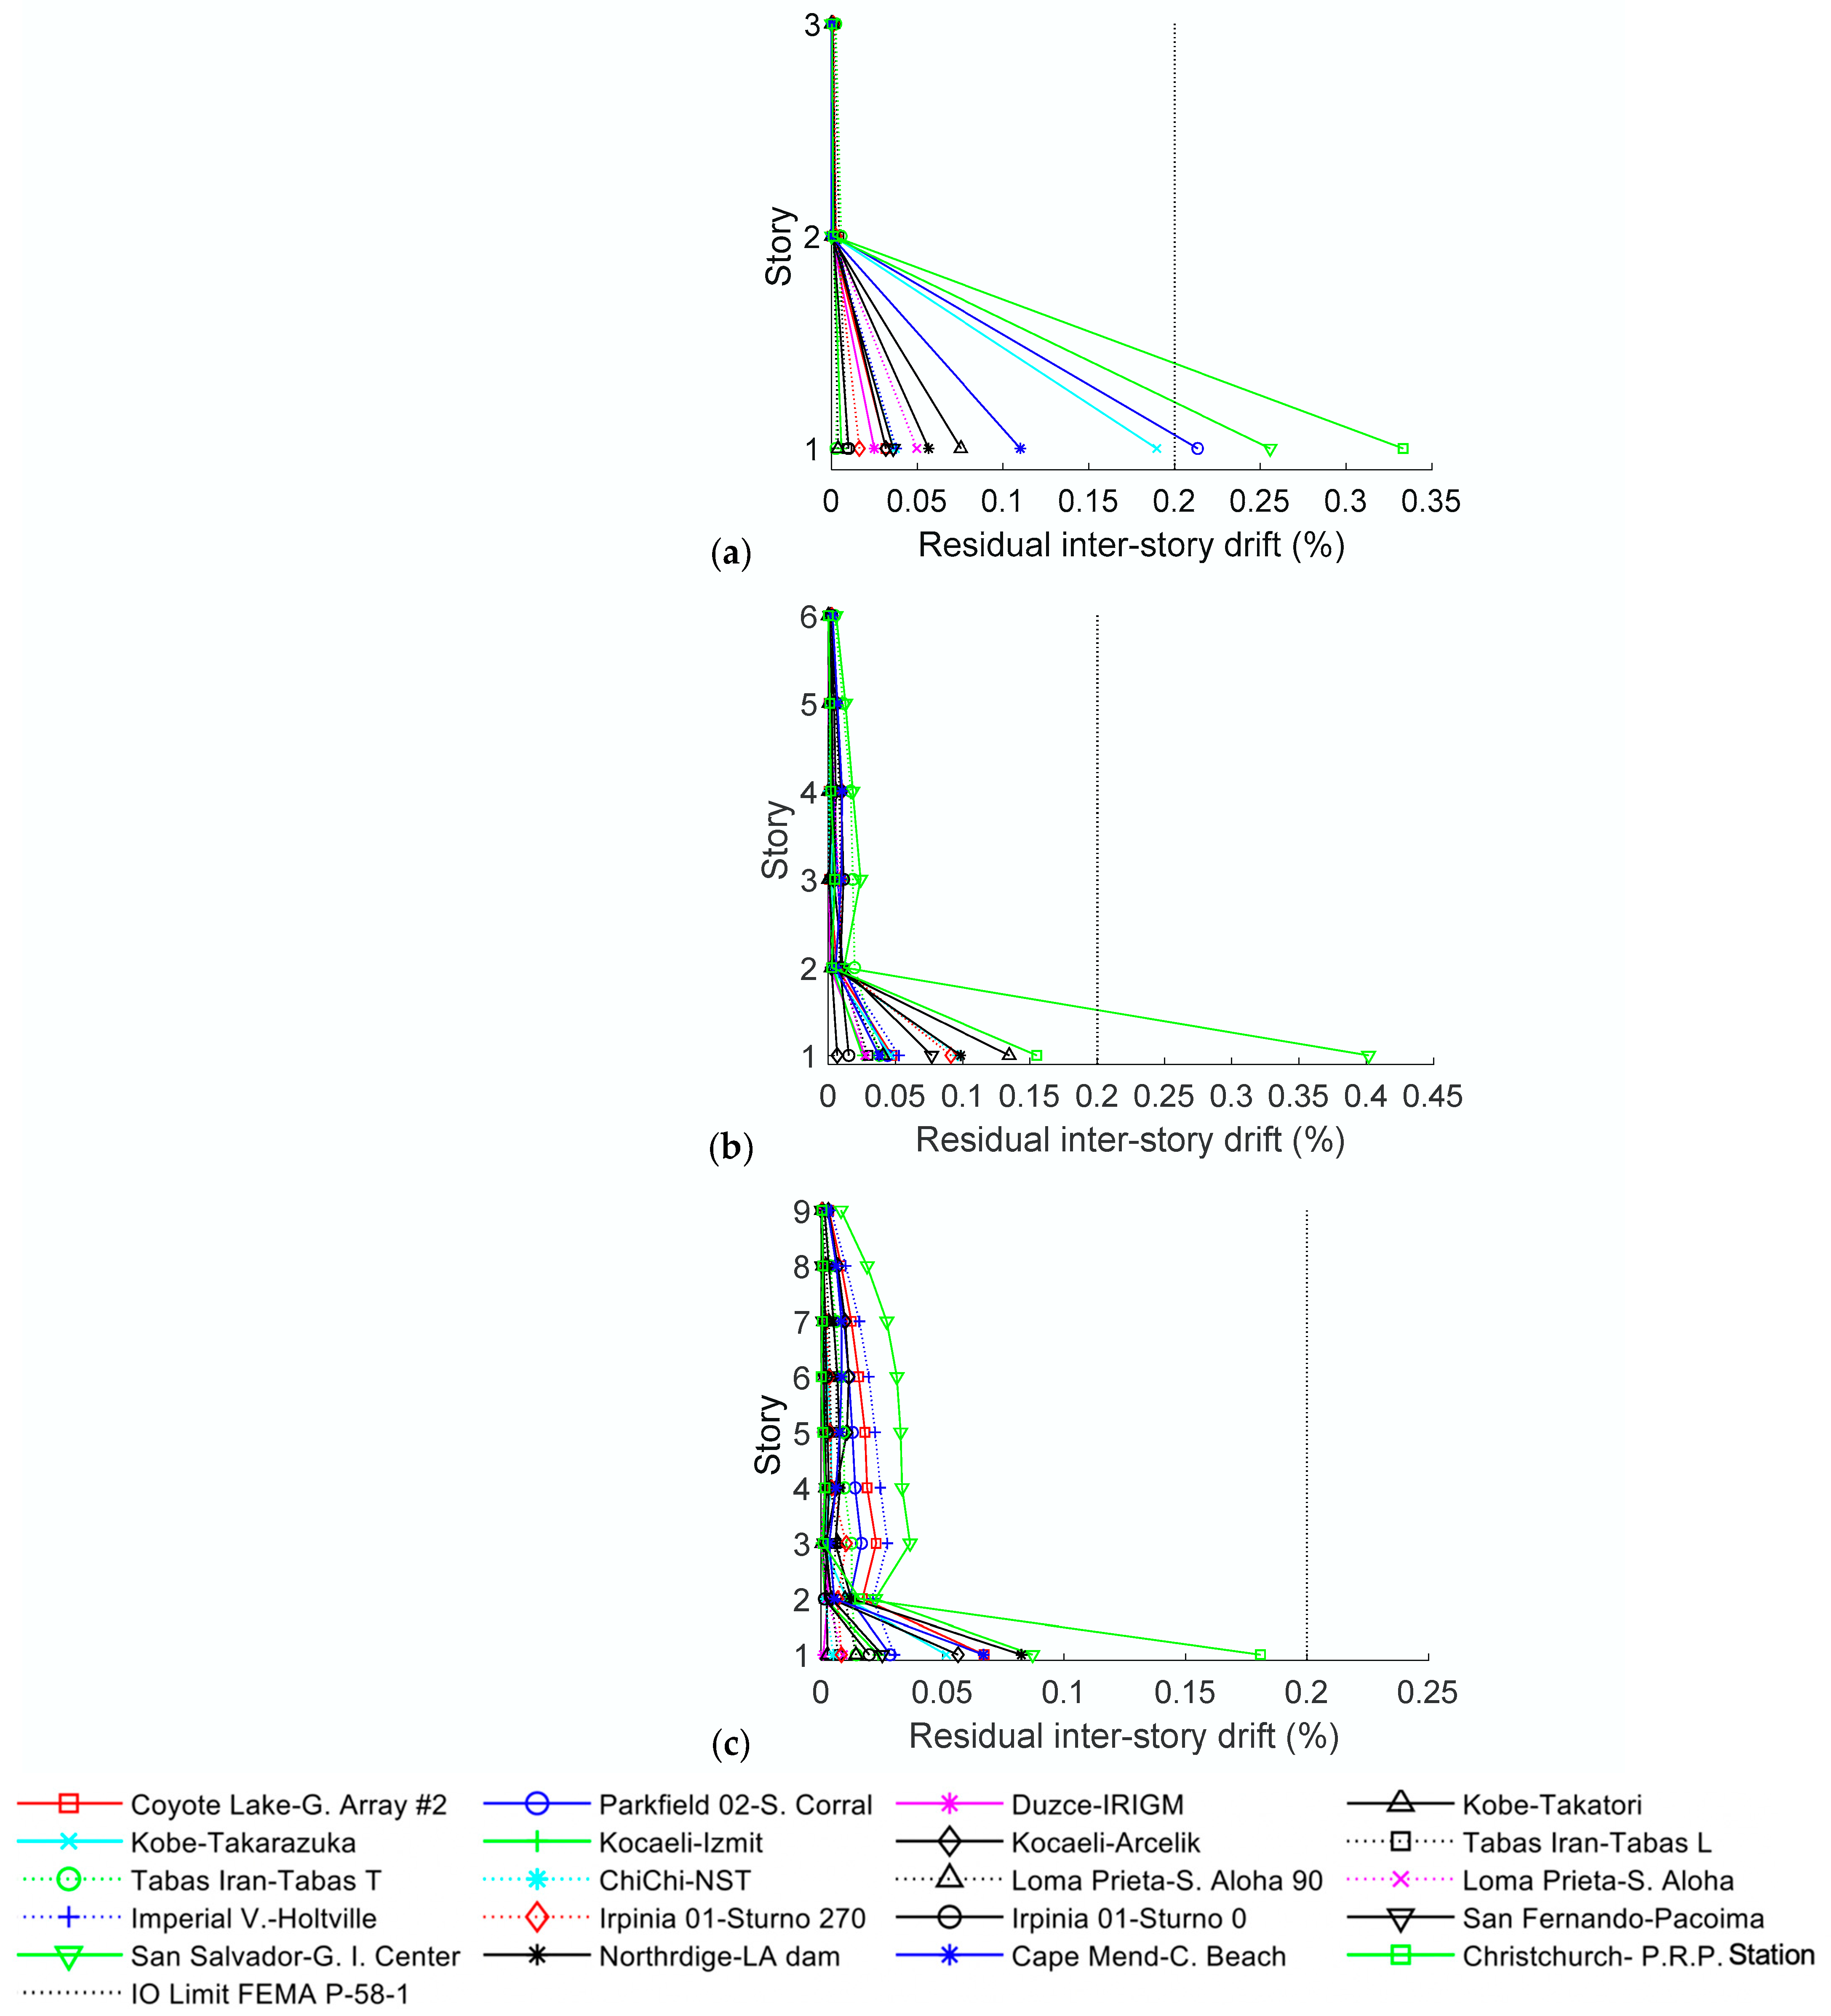
4.1. Story Drift Performance

Figure 6a–c shows with thin lines the maximum inter-story drifts normalised by the story height hi and expressed as a percentage (drift ratios) for each prototype under each near-fault ground motion. Also plotted in Figure 6 are the mean and mean plus/minus one standard deviation (SD). Comparing these maximum drifts with those obtained for prototypes N3 and N6 under far-field ground motions scaled for the same energy input (i.e., for the same values of VD) in previous studies [9], it is found that the maximum drift in the upper stories remains basically the same, whereas the maximum drift in the first story increases significantly. More precisely, the mean value increases by about 30% and the mean plus one SD up to 35%. In spite of this, the performance of the structure is satisfactory, as discussed next.
Figure 7 shows the cumulative distribution functions obtained by assuming a log-normal distribution of the maximum inter-story drift ratio. It can be seen that the probability of not exceeding the operational performance level (OPL) defined in Structural Engineers Association of California SEAOC [32] is 78%, 73% and 87%, respectively, for prototypes N3, N6 and N9. This means that the retrofitted frames performed well, i.e., within the expected limits of current standards. Figure 8 shows another important parameter to consider: the residual drift ratio after the earthquake. As can be seen, the residual drift in the first story falls in most cases below the limiting drift of 0.2% proposed in FEMA-P-58 [33], again meaning a satisfactory performance of the retrofitted frame.

4.2. Maximum Story Shear Forces

Figure 9a–c shows the maximum story shear forces endured by prototypes N3, N6 and N9, respectively, together with the prediction of shear forces calculated using Equations (20) and (21). The results indicate that Equation (21) provides satisfactory (upper bound) maximum shear forces in the upper stories.

5. Proposal of neq for RC Frames with a Soft First Story and Dampers under Near-Fault Earthquakes

The maximum drift of the first story predicted with Equation (19) using the values of neq proposed by Akiyama in Equation (12) are shown with vertical dashed lines in Figure 6. In general, they are seen to be underestimated. More precisely, the prediction approaches the mean value obtained with the time history analyses for near-fault earthquakes but substantially underestimates the mean plus one SD. The reason is that Equation (12) was proposed for conventional structures subjected to general ground motions, that is, not specifically near-fault earthquakes; therefore, it is not appropriate for impulsive earthquakes. Near-fault ground motions typically concentrate the energy demand in one or a few pulses [10]. In terms of the number of equivalent cycles, this means that the structure has to dissipate the same amount of energy input with a smaller number of cycles of greater amplitude when compared to far-field earthquakes.
It is worth emphasising that the reason behind the discrepancy between the maximum first-story drifts obtained with the time history analyses and the prediction given by Equation (19) with neq calculated using Equation (12) lies in Equation (12) itself, not the formulae given by Equation (19). To justify this assertion, first, the actual neq obtained for each prototype and for each ground motion was calculated, being referred to as neq,NTH. Next, the maximum first-story drift was recalculated using Equation (19) using this neq,NTH and is referred to as δmax1,prediction hereafter. In Figure 10, δmax1,prediction is plotted against the actual maximum first-story drift obtained for each ground motion with the NTH analyses, δmax1,NTH. As can be seen in Figure 10, all points lie very close to the 45° line that corresponds to δmax1,prediction = δmax1,NTH. In other words, Figure 10 shows that if the actual value of neq (=neq,NTH) corresponding to each prototype and to each ground motion is used in Equation (19), then the maximum displacement predicted with Equation (19) δmax1,prediction (vertical axis of Figure 10) is very close to the maximum displacement obtained from the time history analyss δmax1,NTH (horizontal axis of Figure 10). Here, the actual value of neq (=neq,NTH) means the ratio between the plastic strain energy dissipated by the damper Wp and sQy1sδy1, as defined in Section 2.4 by Equation (11).
Therefore, the maximum first-story drift in the event of near-fault ground motions can be well predicted with Equation (19) if an appropriate value is adopted for nEquation. For RC frames with a first soft story retrofitted with hysteretic dampers, and based on the results of this study, the following new expression is proposed for neq:
n e q = { 2 + 2 r q 1     r q 1 < 1 4     r q 1 > 1
The above expression was obtained by multiplying Equation (12) by a factor so that the maximum displacement δmax1 predicted with Equation (19) with the neq given by the new Equation (22) surpasses the 90th percentile of the responses obtained from the time history analyses. This percentile is above the 84th percentile that is commonly considered to provide the seismic design with an appropriate level of confidence [34]. The maximum first-story drifts predicted with Equation (19) and the new neq given by Equation (22) are plotted with vertical dashed-dotted lines in Figure 6, and they surpass the 90th percentile of δmax,1.

6. Conclusions

This study investigated the seismic performance of existing soft-first-story RC frames that were seismic-retrofitted with hysteretic dampers under near-fault ground motions. Three prototype frames designed for the generic seismic hazard conditions prescribed by the Dominican Republic code were subjected to 20 near-fault ground motions. The results of the analyses yielded the following conclusions:
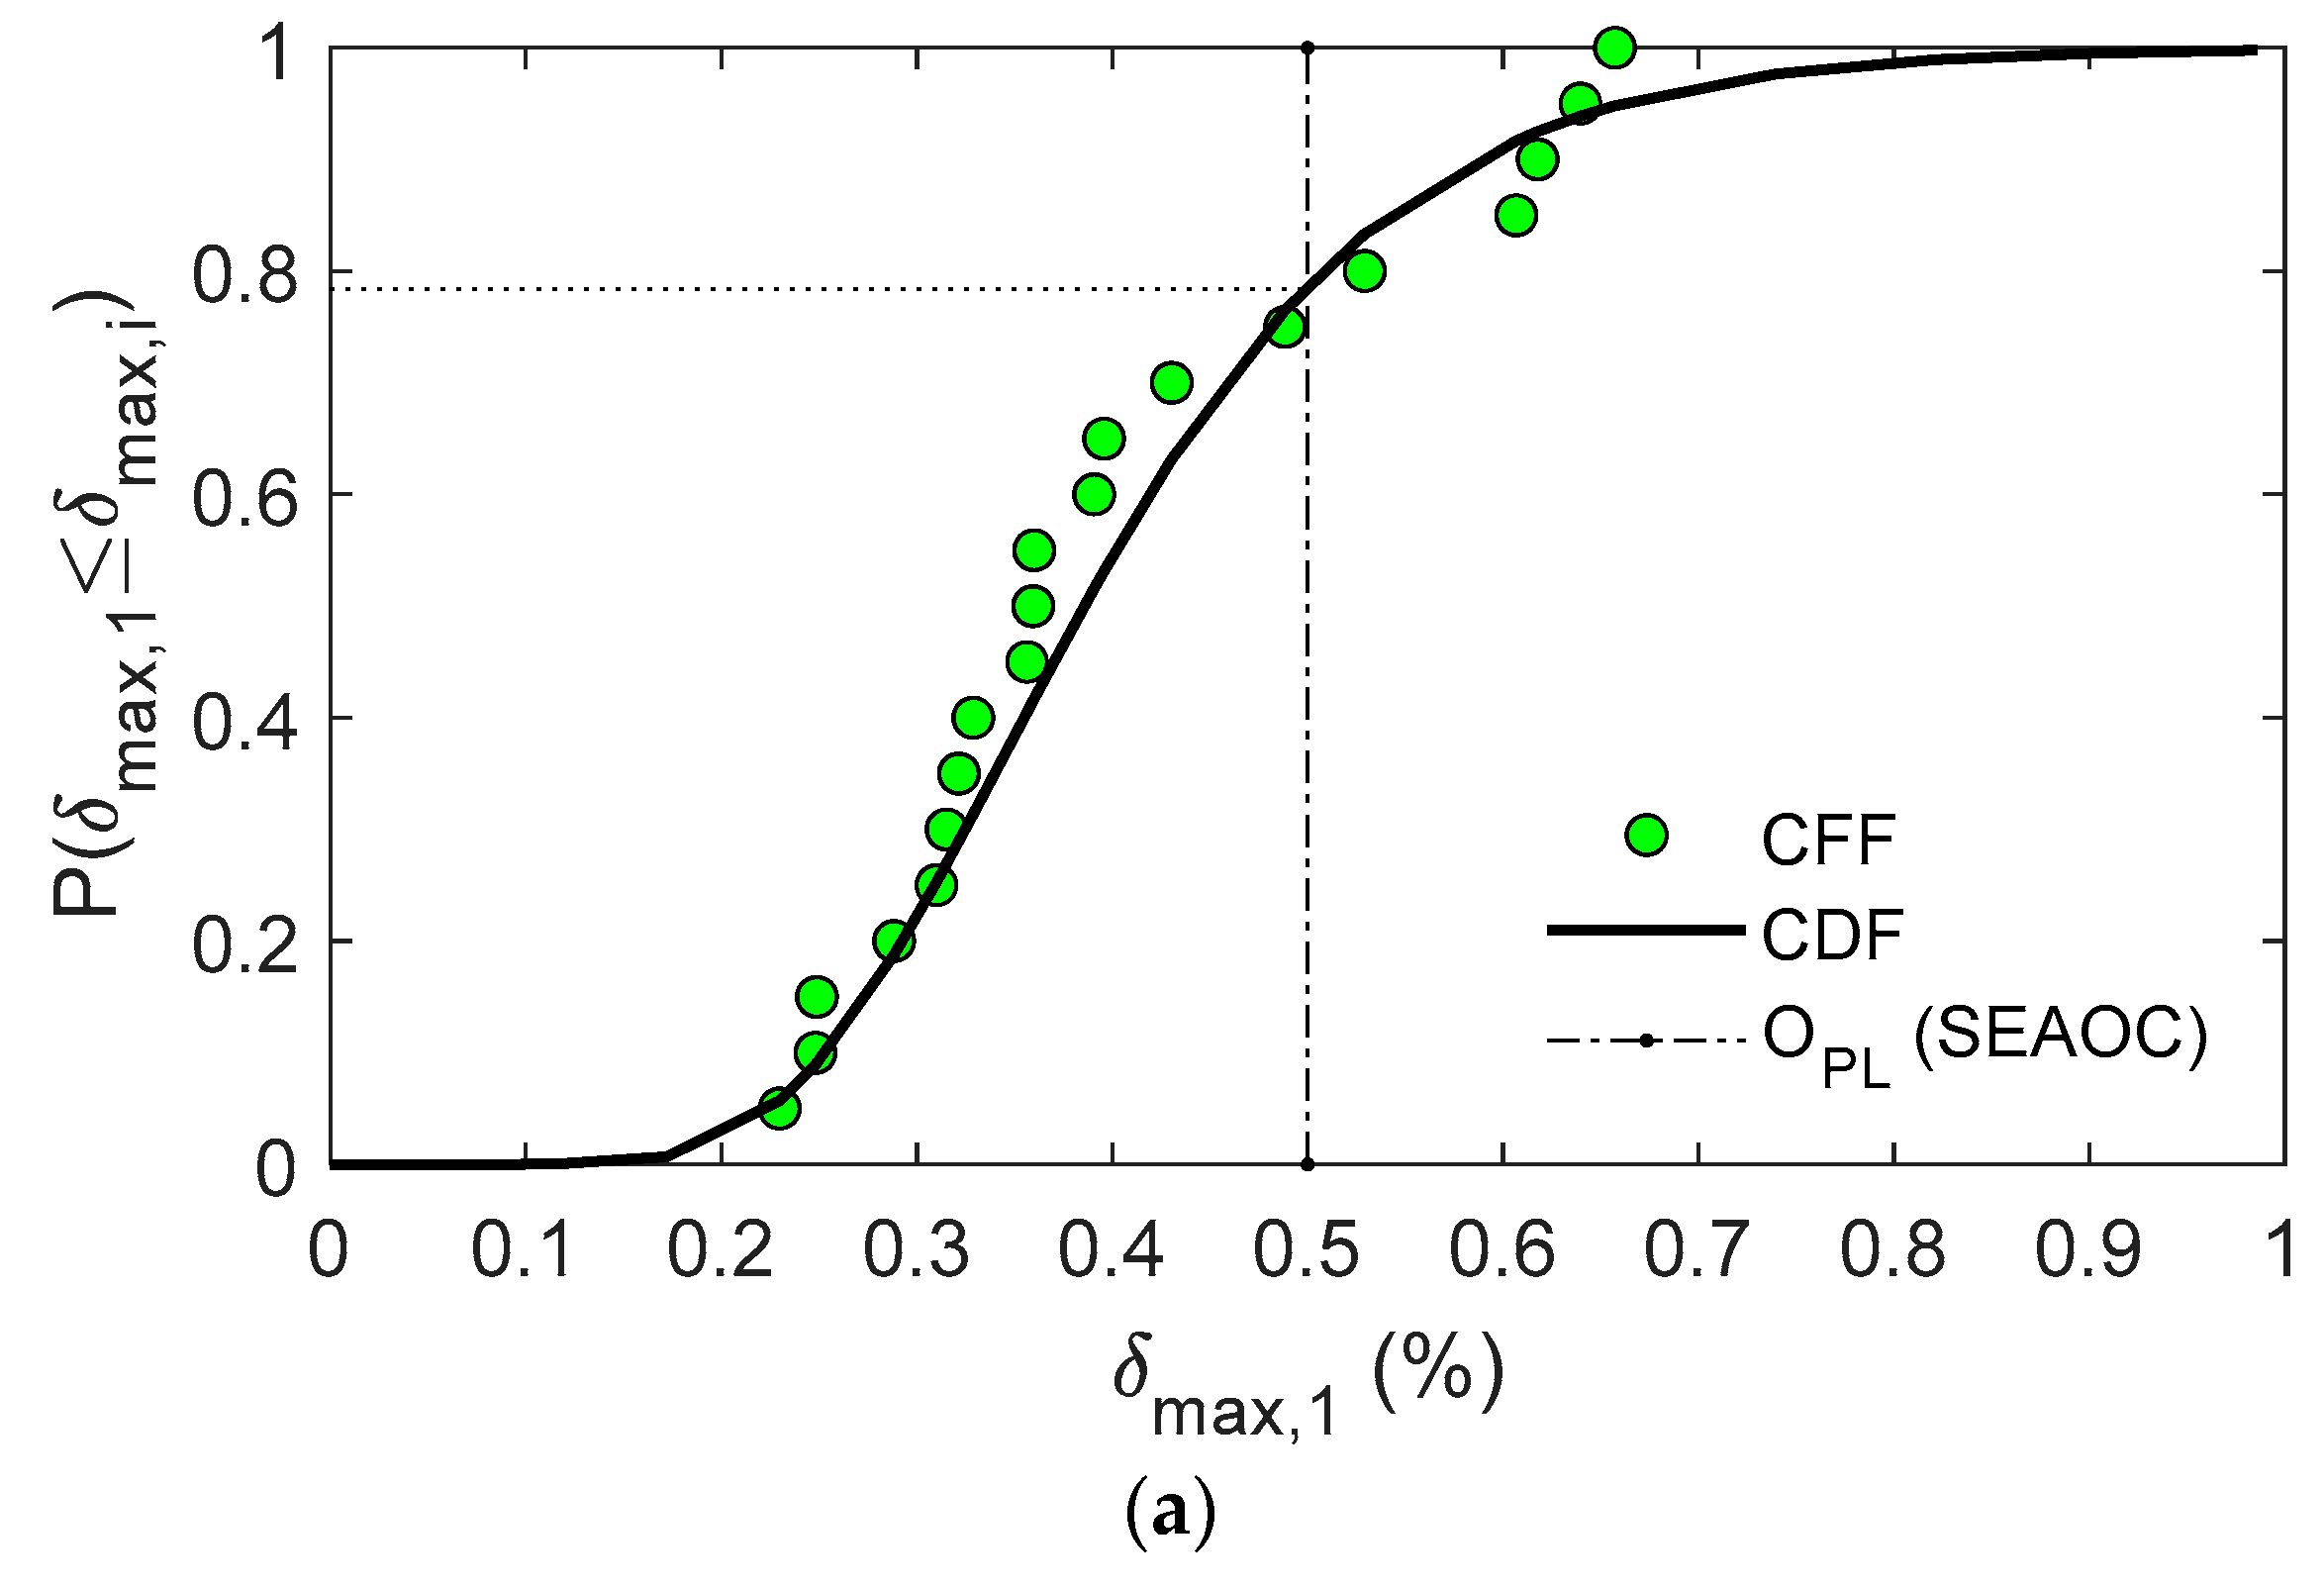
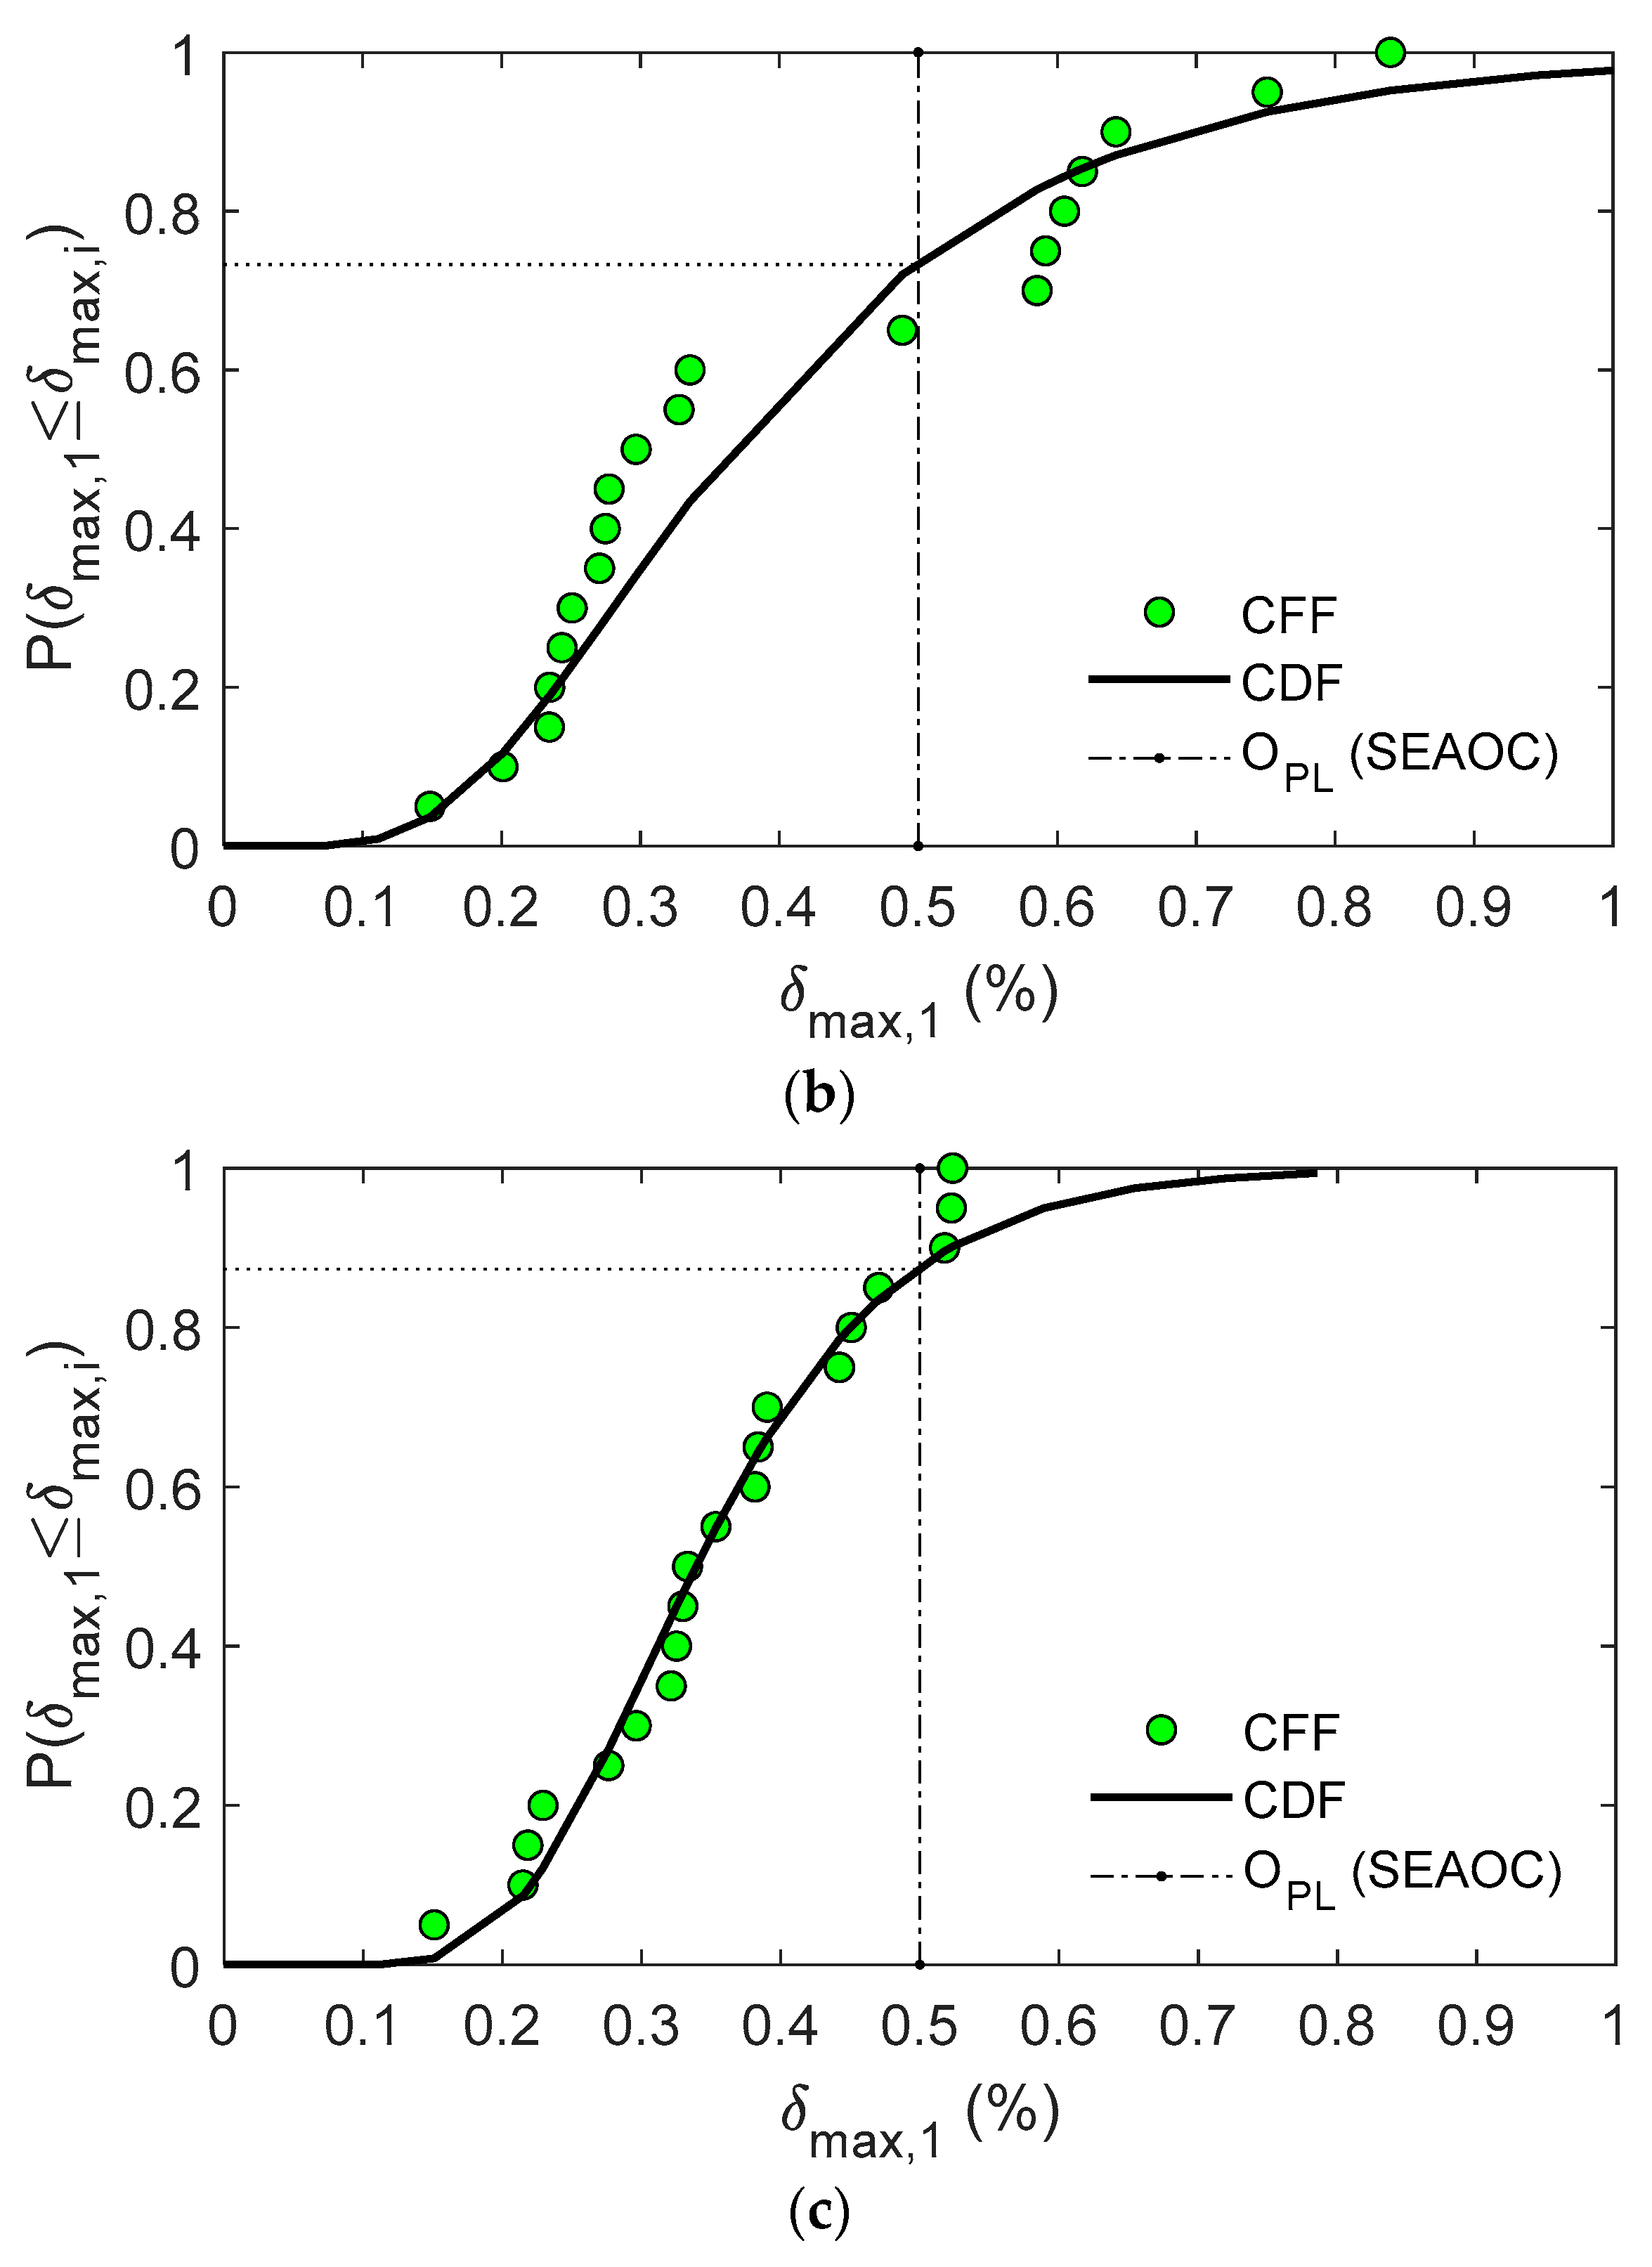
  • All prototype structures exhibit satisfactory performances from the viewpoint of (i) not exceeding the maximum story drifts prescribed by SEAOC for the operational seismic performance level and (ii) not exceeding in most cases the maximum residual drift of 0.2% recommended in FEMA-P-58. However, the maximum first-story drifts exhibited by the structures under the near-fault records exceeded by about 30% the counterpart drifts obtained in previous studies with far-field ground motions.
  • The maximum first-story drift obtained by establishing the energy balance of the structure and using the number of equivalent cycles proposed by Akiyama for generic earthquakes leads to an underestimation of the maximum first-story drifts.
Based on the results of the analyses conducted in this study, a new expression for the number of equivalent cycles is proposed for predicting the maximum first-story drift of RC frames with a soft first story that are seismically retrofitted with hysteretic dampers under near-fault ground motions. The prediction obtained by establishing the energy balance of the structure and employing the new number of equivalent cycles surpasses more than 90% of the results obtained from the nonlinear time history analyses. Two limitations of the present study are as follows. First, the frames investigated correspond to low- and mid-rise buildings; the behaviour of higher soft-first-story frames with hysteretic dampers under near-fault earthquakes is left to future studies. Second, the models investigated are 2D, and therefore the torsional effects have not been considered.

Author Contributions

Conceptualisation, A.B.-C.; methodology, S.M.-P.; software, S.M.-P.; validation, S.M.-P., D.E.-M. and A.B.-C.; investigation, S.M.-P., D.E.-M. and A.B.-C.; resources, S.M.-P., A.B.-C. and D.E.-M.; writing—original draft preparation, D.E.-M.; writing—review and editing, S.M.-P., D.E.-M. and A.B.-C.; visualisation, S.M.-P. and D.E.-M.; supervision, A.B.-C.; project administration, A.B.-C.; and funding acquisition, A.B.-C. All authors have read and agreed to the published version of the manuscript.

Funding

This research was funded by the Spanish Ministry of Economy and Competitivity (research project reference MEC BIA2017 88814 R) and received funds from the European Union (Fonds Européen de Dévelopment Régional).

Institutional Review Board Statement

Not applicable.

Informed Consent Statement

Not applicable.

Data Availability Statement

Data available on request due to restrictions e.g. privacy or ethical.

Conflicts of Interest

The authors declare no conflict of interest.

References

  1. Hall, J.F. Northridge Earthquake 17 January 1994 Preliminary Reconnaissance Report; Earthquake Engineering Research Institute: Oakland, CA, USA, 1994. [Google Scholar]
  2. Architectural Institute of Japan (AIJ). Preliminary Reconnaissance Report of the 1995 Hyogoken-Nanbu Earthquake; AIJ: Tokyo, Japan, 1995. [Google Scholar]
  3. Dohare, D.; Maru, S. Seismic behavior of soft storey buildings: A critical review. Int. J. Eng. Res. Gen. Sci. 2014, 2, 35–39. [Google Scholar]
  4. FEMA-356. Prestandard and Commentary for the Seismic Rehabilitation of Buildings; Federal Emergency Management Agency: Washington, DC, USA, 2000.
  5. Matthys, S. Fib Working Group. Externally Applied FRP Reinforcement for Concrete Structures (Vol. 90); International Federation for Structural Concrete: Lausanne, Switzerland, 2019. [Google Scholar]
  6. Ilki, A.; Tore, E.; Demir, C.; Comert, M. Seismic performance of a full-scale FRP retrofitted sub-standard RC building. In Proceedings of the European Conference on Earthquake Engineering, Thessaloniki, Greece, 18–21 June 2018. [Google Scholar]
  7. Parducci, A.; Comodini, F.; Lucarelli, M. A synergy dissipation approach to retrofit framed structures with a soft first storey. In Proceedings of the 9th World Seminar on Seismic Isolation, Energy Dissipation and Active Vibration Control of Structures, Kobe, Japan, 13–16 June 2005. [Google Scholar]
  8. Mezzi, M.; Parducci, A. Preservation of existing soft-first-story configurations by improving the seismic performance. In Proceedings of the 3rd International Specialty Conference on the Conceptual Approach to Structural Design, Singapore, 25–26 August 2005. [Google Scholar]
  9. Benavent-Climent, A.; Mota-Páez, S. Earthquake retrofitting of R/C frames with soft-first-story using hysteretic dampers: Energy-based design method and evaluation. Eng. Struct. 2017, 137, 19–32. [Google Scholar] [CrossRef]
  10. Yang, D.; Zhou, J. A stochastic model and synthesis for near-fault impulsive ground motions. Earthq. Eng. Struct. Dyn. 2015, 44, 243–264. [Google Scholar] [CrossRef]
  11. Bray, J.D.; Rodriguez-Marek, A. Characterization of forward-directivity ground motions in the near-fault region. Soil Dyn. Earthq Eng. 2004, 24, 815–828. [Google Scholar] [CrossRef]
  12. Yang, D.X.; Pan, J.W.; Li, G. Non-structure-specific intensity measure parameters and characteristic period of near-faultground motions. Earthq. Eng. Struct. Dyn. 2009, 38, 1257–1280. [Google Scholar] [CrossRef]
  13. Yang, D.X.; Wang, W. Nonlocal period parameters of frequency content characterization for near-fault ground motions. Earthq. Eng. Struct. Dyn. 2012, 41, 1793–1811. [Google Scholar] [CrossRef]
  14. Filiatrault, A.; Tremblay, R.; Wanitkorkul, A. Performance evaluation of passive damping systems for the seismic retrofit of steel moment-resisting frames subjected to near-field ground motions. Earthq. Spectra 2001, 17, 427–456. [Google Scholar] [CrossRef]
  15. Pavlou, E.A.; Constantinou, M.C. Response of elastic and inelastic structures with damping systems to near-field and soft-soil ground motions. Eng. Struct. 2004, 26, 1217–1230. [Google Scholar] [CrossRef]
  16. Miyamoto, H.K.; Singh, J.P. Performance of structures with passive energy dissipators. Earthq Spectra 2002, 18, 105–119. [Google Scholar] [CrossRef]
  17. Morillas, L.; Escolano-Margarit, D. Estimation of Cyclic Demand in Metallic Yielding Dampers Installed on Frame Structures. Appl. Sci. 2020, 10, 4364. [Google Scholar] [CrossRef]
  18. Housner, G.W. Limit design of structures to resist earthquakes. In Proceedings of the 1st World Conference on Earthquake Engineering, Berkeley, CA, USA, 1–5 June 1956; pp. 1–16. [Google Scholar]
  19. Akiyama, H. Earthquake resistant design based on the energy concept. In Proceedings of the 9th World Conference on Earthquake Engineering, Tokyo, Japan, 1–5 August 1988. [Google Scholar]
  20. Akiyama, H. Earthquake-Resistant Limit-State Design for Buildings; University of Tokyo Press: Tokyo, Japan, 1985. [Google Scholar]
  21. Uang, C.M.; Bertero, V.V. Evaluation of seismic energy in structures. Earthq. Eng. Struct. Dyn. 1990, 19, 77–90. [Google Scholar] [CrossRef]
  22. Laterza, M.; D’Amato, M.; Thanthirige, L.P.; Braga, F.; Gigliotti, R. Comparisons of codal detailing rules for curvature ductility and numerical investigations. Open Constr. Build. Technol. J. 2014, 8, 132–141. [Google Scholar] [CrossRef] [Green Version]
  23. Watson, S.; Zahn, F.A.; Park, R. Confining reinforcement for concrete columns. ASCE J. Struct. Eng. 1994, 120, 1798–1824. [Google Scholar] [CrossRef]
  24. ASCE-SEI-41-13. Seismic Evaluation and Retrofit of Existing Buildings; American Society of Civil Engineers: Reston, VA, USA, 2013. [Google Scholar]
  25. Ministerio de Obras Públicas y Comunicaciones (MOPC). Reglamento Para el Análisis y Diseño Sísmico de Estructuras; Dirección General de Reglamentos y Sistemas: Santo Domingo, República Dominicana, 2011.
  26. ACI 318-99. Building Code Requirements for Structural Concrete (ACI 318-99) and Commentary (ACI 318r-99); American Concrete Institute (ACI Committee 318): Farmington Hills, MI, USA, 1999. [Google Scholar]
  27. Reinhorn, A.M.; Roh, H.; Sivaselvan, M.; Kunnath, S.K.; Valles, R.E.; Madan, A.; Li, C.; Lobo, R.; Park, Y.J. IDARC2D Version 7.0: A Program for the Inelastic Damage Analysis of Structures; Report NCEER-96-0010; MCEER: New York, NY, USA, 2009. [Google Scholar]
  28. Wen, Y.K. Method for Random Vibration of Hysteretic Systems. J. Eng. Mech. Div. ASCE 1976, 102, 249–263. [Google Scholar]
  29. Benavent-Climent, A. A brace-type seismic damper based on yielding the walls of hollow structural sections. Eng. Struct. 2009, 32, 1113–1122. [Google Scholar] [CrossRef]
  30. PEER 2013/03-PEER Ground Motion Database. NGA-West2. Available online: https://ngawest2.berkeley.edu/ (accessed on 10 November 2020).
  31. PEER 2014/-PEER NGA-East Database. Available online: https://ngawest2.berkeley.edu/ (accessed on 10 November 2020).
  32. Vision 2000 Committee; California. Performance Based Seismic Engineering of Buildings; Structural Engineers Association of California, Office of Emergency Services: Sacramento, CA, USA, 1995. [Google Scholar]
  33. FEMA-P-58. Seismic Performance Assessment of Buildings Volume 1-Methodology; Rep. No. FEMA P-58-1; Federal Emergency Management Agency: Washington, DC, USA, 2012.
  34. Clough, R.W.; Penzien, J. Dynamics of Structures, 2nd ed.; McGraw Hill: New York, NY, USA, 1993. [Google Scholar]
Figure 1. Typical structure with dampers’ (a) elevation, and analytical model (b).
Applsci 11 01290 g001
Figure 2. Force–displacement relationships: (a) at the upper i-th story; (b) at the first story.
Applsci 11 01290 g002
Figure 3. Prototype building plans and elevations.
Applsci 11 01290 g003
Figure 4. Shear force versus inter-story drift curve for the first story: (a) N3, (b) N6 and (c) N9.
Applsci 11 01290 g004
Figure 5. SV-T: Unscaled response spectra in terms of SA (a) and SV (b).
Applsci 11 01290 g005
Figure 6. Maximum inter-story drift ratios of prototypes N3 (a), N6 (b) and N9 (c).
Applsci 11 01290 g006
Figure 7. Cumulative distributions for prototypes N3 (a), N6 (b) and N9 (c).
Applsci 11 01290 g007aApplsci 11 01290 g007b
Figure 8. Residual drift ratios for prototypes N3 (a), N6 (b) and N9 (c).
Applsci 11 01290 g008
Figure 9. Maximum shear forces for prototypes N3 (a), N6 (b) and N9 (c).
Applsci 11 01290 g009
Figure 10. First-story drift predicted with Equation (19) using neq,NTH (δmax1,prediction) and results from nonlinear time history analyses (δmax1,NTH).
Applsci 11 01290 g010
Table 1. Mechanical properties of the materials.
Concrete SteelMasonry
σc (MPa)Ec (GPa)σy (MPa)Es (GPa)σm (MPa)Em (GPa)
20.621.52742062.32.1
Table 2. Element sections of the prototypes (dimensions in centimetres).
Story/Floor: 1 2 3 4 5 6 7 8 9
Prototype Frame mi (kNs2/cm) 4.771 4.707 2.877 ------
N3 Exteriors: P1X, P4X Beams30 × 60 30 × 60 25 × 50 ------
ColumnsC1 30 × 30 30 × 30 25 × 25
C2 30 × 30 30 × 30 25 × 25
Interiors:P2X, P3X Beams30 × 60 30 × 60 25 × 50
ColumnsC3 30 × 30 30 × 30 25 × 25
C4 35 × 35 30 × 30 25 × 25
N6 mi (kNs2/cm) 4.862 4.775 4.749 4.739 4.718 2.881 ---
Exteriors: P1X, P4X Beams 30 × 60 30 × 60 30 × 60 30 × 60 30 × 60 25 × 50 ---
Columns C1 30 × 30 30 × 30 30 × 30 30 × 30 30 × 30 25 × 25
C2 35 × 35 35 × 35 35 × 35 30 × 30 30 × 30 25 × 25
Interiors: P2X, P3X Beams30 × 60 30 × 60 30 × 60 30 × 60 30 × 60 25 × 50
Columns C3 40 × 40 35 × 35 30 × 30 30 × 30 30 × 30 25 × 25
C4 50 × 50 45 × 45 40 × 40 35 × 35 35 × 35 30 × 30
N9 mi (kNs2/cm)3.93 3.84 3.81 3.78 3.76 3.75 3.74 3.742.29
Exteriors: P1X, P4X Beams 30 × 60 30 × 60 30 × 60 30 × 60 30 × 60 30 × 60 30 × 60 30 × 60 25 × 50
Columns C1 40 × 40 40 × 40 40 × 40 35 × 35 35 × 35 35 × 35 35 × 35 35 × 35 35 × 35
C2 45 × 45 45 × 45 40 × 40 40 × 40 35 × 35 35 × 35 35 × 35 35 × 35 35 × 35
Interiors: P2X, P3X Beams30 × 60 30 × 60 30 × 60 30 × 60 30 × 60 30 × 60 30 × 60 30 × 60 25 × 50
Columns C3 45 × 45 45 × 45 45 × 45 40 × 40 40 × 40 35 × 35 35 × 35 35 × 35 35 × 35
C4 60 × 60 60 × 60 55 × 55 50 × 50 45 × 45 40 × 40 35 × 35 35 × 35 35 × 35
Table 3. Properties of the existing structure and of the hysteretic dampers.
PrototypeExisting StructuresDampers
M
(kNs2/cm)
fk1
(kN/cm)
fQy,1
(kN)
fδy,1
(cm)
fδu,1
(cm)
T1
(s)
e/a2sα1rq1sδy,1
(cm)
sk1
(kN/cm)
sQy,1
(kN)
N312.3655711862.137.160.941.150.7010.140.32266148494
N626.72161528631.775.990.851.100.6720.160.2666,21517,611
N932.68249242081.696.140.811.080.6040.220.2576,56219,388
Table 4. Earthquake data of selected pulse-like ground motion records.
Name of the EarthquakeStationCompMwRjb
(km)
SoilPGA
(cm/s2)
PGV
(cm/s)
λN3λN6λN9
Coyote Lake, 1979Gilroy Array #2505.748.47Stiff187.1310.273.463.144.14
Parkfield 02, 2004Parkfield-Stone Corral 1E3606.002.85Stiff816.739.781.635.764.35
Duzce, Turquia, 1999IRIGM 487NS7.142.65Very dense297.538.931.421.991.62
Kobe, Japan, 1995Takatori906.901.46Stiff658.08122.920.962.312.44
Kobe, Japan, 1996Takarazuka06.900Stiff683.8668.381.294.823.04
Kocaeli, Turquia, 1999Izmit1807.513.62Rock161.9522.323.332.462.20
Kocaeli, Turquia, 2000Arcelik907.5110.56Very dense131.640.054.403.464.14
Tabas, Iran, 1978TabasL7.351.79Rock837.4798.810.592.932.93
Tabas, Iran, 1979TabasT7.351.79Rock845.1123.360.623.142.57
Chi-Chi, Taiwan, 1999NSTE7.6238.36Very dense306.120.882.344.403.67
Loma Prieta, 1989Saratoga-Aloha Avenue06.937.58Very dense504.5141.561.263.092.88
Loma Prieta, 1990Saratoga-Aloha Ave906.937.58Very dense319.9245.962.704.875.40
Imperial Valley 06, 1979Holtville Post Office3156.535.35Stiff217.1751.442.392.252.73
Irpinia, Italy 01, 1980Sturno (STN)2706.906.78Very dense314.3271.931.872.462.62
Irpinia, Italy 01, 1981Sturno (STN)06.906.78Very dense222.2836.972.251.781.41
San Fernando, 1971Pacoima Dam (upper left abut)1646.610Rock1195.47114.430.733.883.25
San Salvador, 1986Geotech Investig Center905.802.14Very dense690.6279.91.143.623.67
Northridge 01, 1994LA Dam646.690Very dense418.0674.821.853.202.73
Cape Mendocino, 1992Centerville Beach Naval Fac3607.0116.44Very dense468.4151.171.533.773.04
Christchurch, New Zealand, 2011Pages Road Pumping StationS6.201.92Stiff584.5481.251.584.874.24
Publisher’s Note: MDPI stays neutral with regard to jurisdictional claims in published maps and institutional affiliations.

