Laser Scanning versus Wide-Field—Choosing the Appropriate Microscope in Life Sciences


Institute of Applied Research, Aalen University, Beethovenstr. 1, 73430 Aalen, Germany
*
Author to whom correspondence should be addressed.
Appl. Sci. 2021, 11(2), 733; https://doi.org/10.3390/app11020733
Submission received: 4 December 2020
/
Revised: 7 January 2021
/
Accepted: 11 January 2021
/
Published: 13 January 2021
(This article belongs to the Special Issue Perspectives in Laser Scanning Microscopy)
Abstract
:Methods and applications of light microscopy in the life sciences are compared with respect to 3D imaging, resolution, light exposure, sensitivity, and recording time. While conventional wide-field or laser scanning microscopy appear appropriate for smaller samples of only a few micrometers in size with a limited number of light exposures, light sheet microscopy appears to be an optimal method for larger 3D cell cultures, biopsies, or small organisms if multiple exposures or long measuring periods are desired. Super-resolution techniques should be considered in the context of high light exposure possibly causing photobleaching and photo-toxicity to living specimens.
1. Introduction
Optical microscopy is a rapidly developing and widely used technique in life sciences such as biochemistry, biophysics, toxicology, genetics, and immunology. It is subdivided into two principal fields: Wide-field and laser scanning microscopy (LSM) [1,2]. While in the first case, whole images of a sample are recorded simultaneously, in the second case, the sample is scanned point by point with an image being composed of all the individual data points. Current techniques and applications are focused on 3D microscopy of the samples whose size exceeds the focal depth of a microscope objective lens, as well as on high resolution, contrast enhancement, and low light exposure, to avoid the photobleaching and photo-toxicity of living specimens. Label-free methods and methods that use markers or (genetically generated) fluorescent proteins are distinguished. However, most of the methods with fluorescent labelling are restricted to in vitro applications. Methods are subdivided into transmission, scattering, and fluorescence microscopy, with fluorescence microscopy playing a predominant role in the life sciences. Fluorescence microscopy is, therefore, the focus of this manuscript including Structured Illumination Microscopy (SIM), Light Sheet Fluorescence Microscopy (LSFM), Total Internal Reflection Fluorescence (TIRF) Microscopy, and single molecule-based techniques (all wide-field methods), as well as confocal (point-scan, Airy scan, spinning disk) or multiphoton laser scanning microscopy. In addition, Stimulated Emission Depletion (STED) or MINFLUX microscopy with a high super-resolution potential are emphasized. Further techniques increasing either resolution or specificity include axial tomography, spectral or fluorescence lifetime imaging, and Förster Resonance Energy Transfer (FRET). Clinical applications of an operation microscope, however, are not considered in this manuscript.
2. Wide-Field Microscopy
Samples in life sciences include two-dimensional and three-dimensional cell cultures, biopsies, and living organisms with (at least) a minimum of optical transparency. In conventional wide-field microscopy, an image is generated from the focal plane of a sample with superimposed out-of-focus information that severely diminishes spatial contrast. As this method does not provide any possibilities of sectioning per se, 3D microscopy needs some special equipment. One method is Optical Sectioning Structured Illumination Microscopy (OS-SIM), where an optical grid is imaged in the plane of the sample in three phase positions Φ1 = 0, Φ2 = 2π/3, and Φ3 = 4π/3, resulting in the intensities I1, I2, and I3. An algorithm I = [(I1 − I2)2 + (I1 − I3)2 + (I2 − I3)2]1/2 permits calculation of an image of the focal plane, while out-of-focus images add up to zero, as depicted in Figure 1. Upon variation of the sample’s vertical position, several focal planes can thus be detected, and a 3D image with high contrast may be calculated [3].
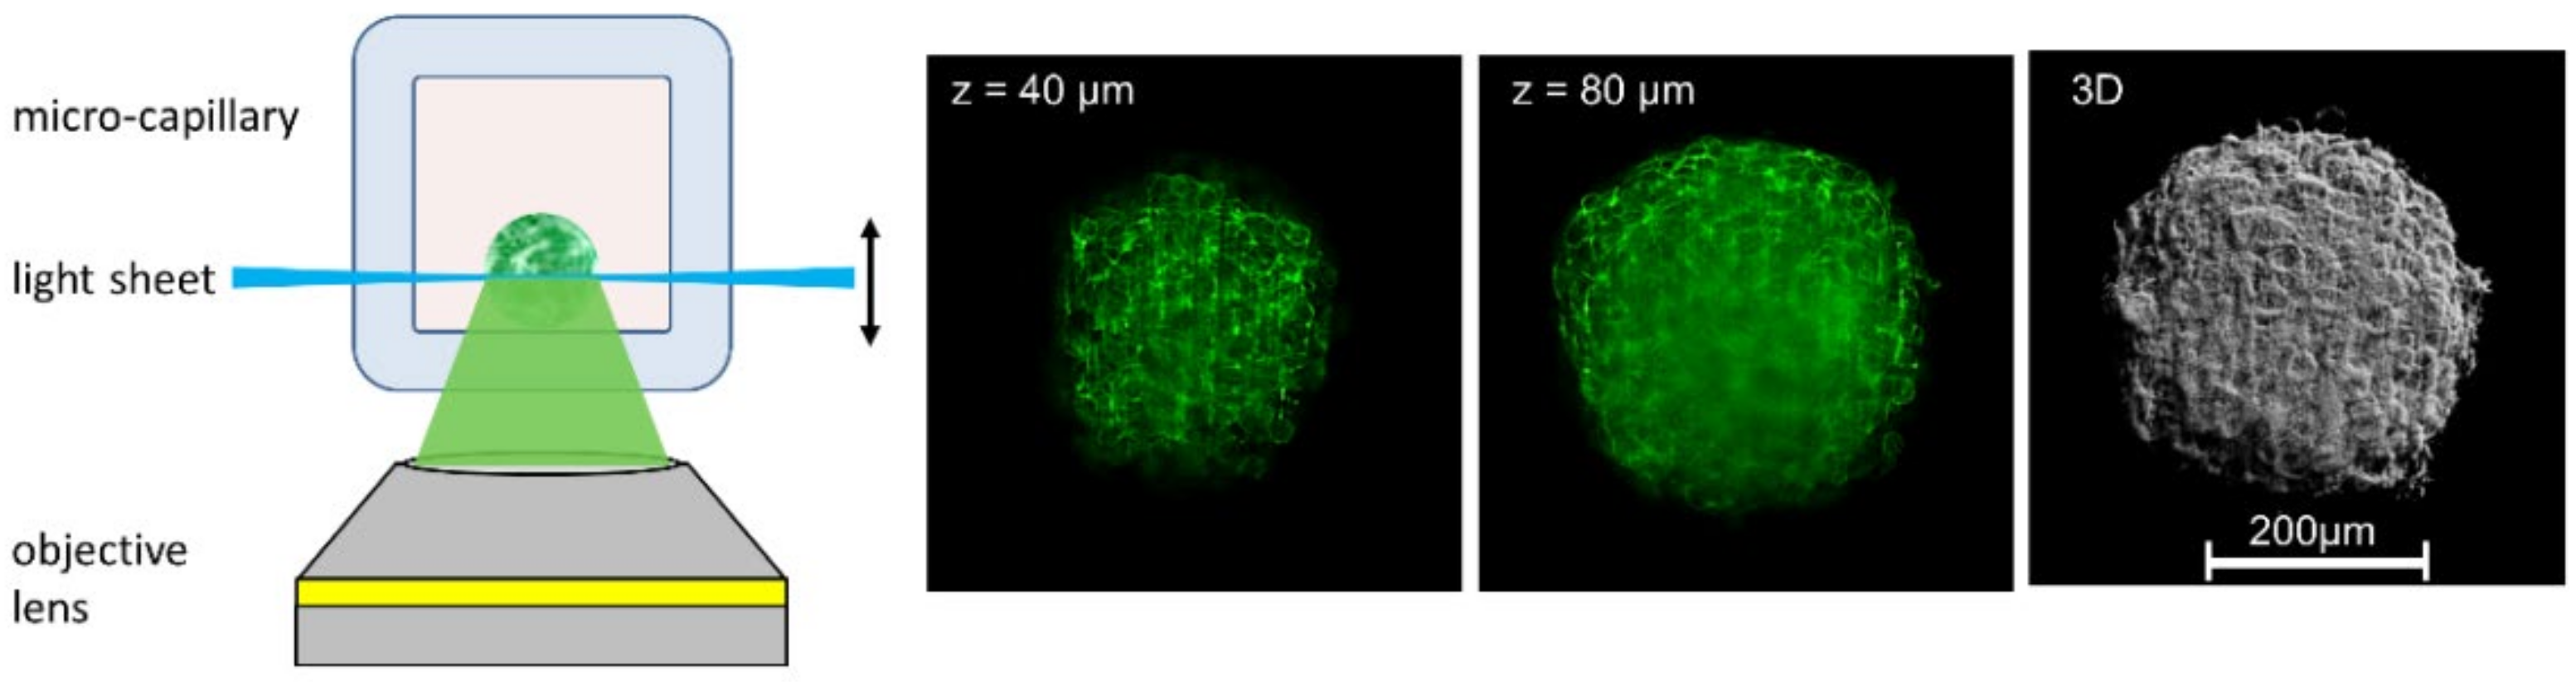
Another method is Light Sheet Microscopy, where a sample is illuminated from the side (at 90° with respect to the microscope axis). The light sheet and the microscope objective lens used for detection can be shifted simultaneously in the axial direction, so that the illuminated part of the sample is always at the focus of the objective lens (both shifts may be different due to the refractive index of the immersion fluid, but this can be corrected either mechanically [4] or by software). Thus, z-stacks can be recorded, and a 3D image may be calculated with low fluorescence background and high contrast, as depicted in Figure 2. For illumination, Gaussian-shaped laser beams may be either scanned or used in combination with a cylindrical lens. Alternatively, a lattice of so-called Bessel beams can be applied to generate an extremely thin light sheet, as further reported in Section 4. The main advantage of the Light Sheet over OS-SIM is that only those planes are illuminated, which are recorded simultaneously, so that light exposure is considerably lower than for those methods, where the recording of each image requires illumination of the whole specimen. Commercial light-sheet microscopes (e.g., Carl Zeiss, Olympus, Nikon), as well as open-source solutions or add-ons for existing microscopes, are presently available [5,6,7].
Resolution is commonly based on the Abbe criterion ymin ≥ λ/2AN (for coherent illumination with λ representing the wavelength of light and AN the numerical aperture of the microscope objective lens), or on the Rayleigh criterion ymin = 0.61 λ/AN representing the radius of the diffraction maximum of an incoherently luminescent spot (Airy disk). In both cases, values around 200 nm are attained for high numerical apertures (AN ≥ 1.30) and around 400–500 nm for moderate apertures (AN ≤ 0.60), e.g., when imaging larger objects with long-working-distance objective lenses. Only in the last 20 years could these values be reduced by super-resolution or super-localization methods. The latter are based on single-molecule detection within a thin illuminated layer of a sample. If a single molecule is detected n times, its localization can be determined with a precision Δx = Δx0/√n with Δx0 ≈ 200 nm resulting from the Rayleigh criterion. Therefore, localization occurs with a precision Δx = 20 nm for n = 100 and a precision Δx = 10 nm for n = 400. Methods based on super-localization microscopy include Stochastic Optical Reconstruction Microscopy (STORM), Photoactivation Localization Microscopy (PALM), and related techniques [9,10,11]. However, in comparison with conventional fluorescence microscopy, the irradiance in single-molecule experiments is typically 500 to 1000 times higher, which results in a high risk of phototoxic damage.
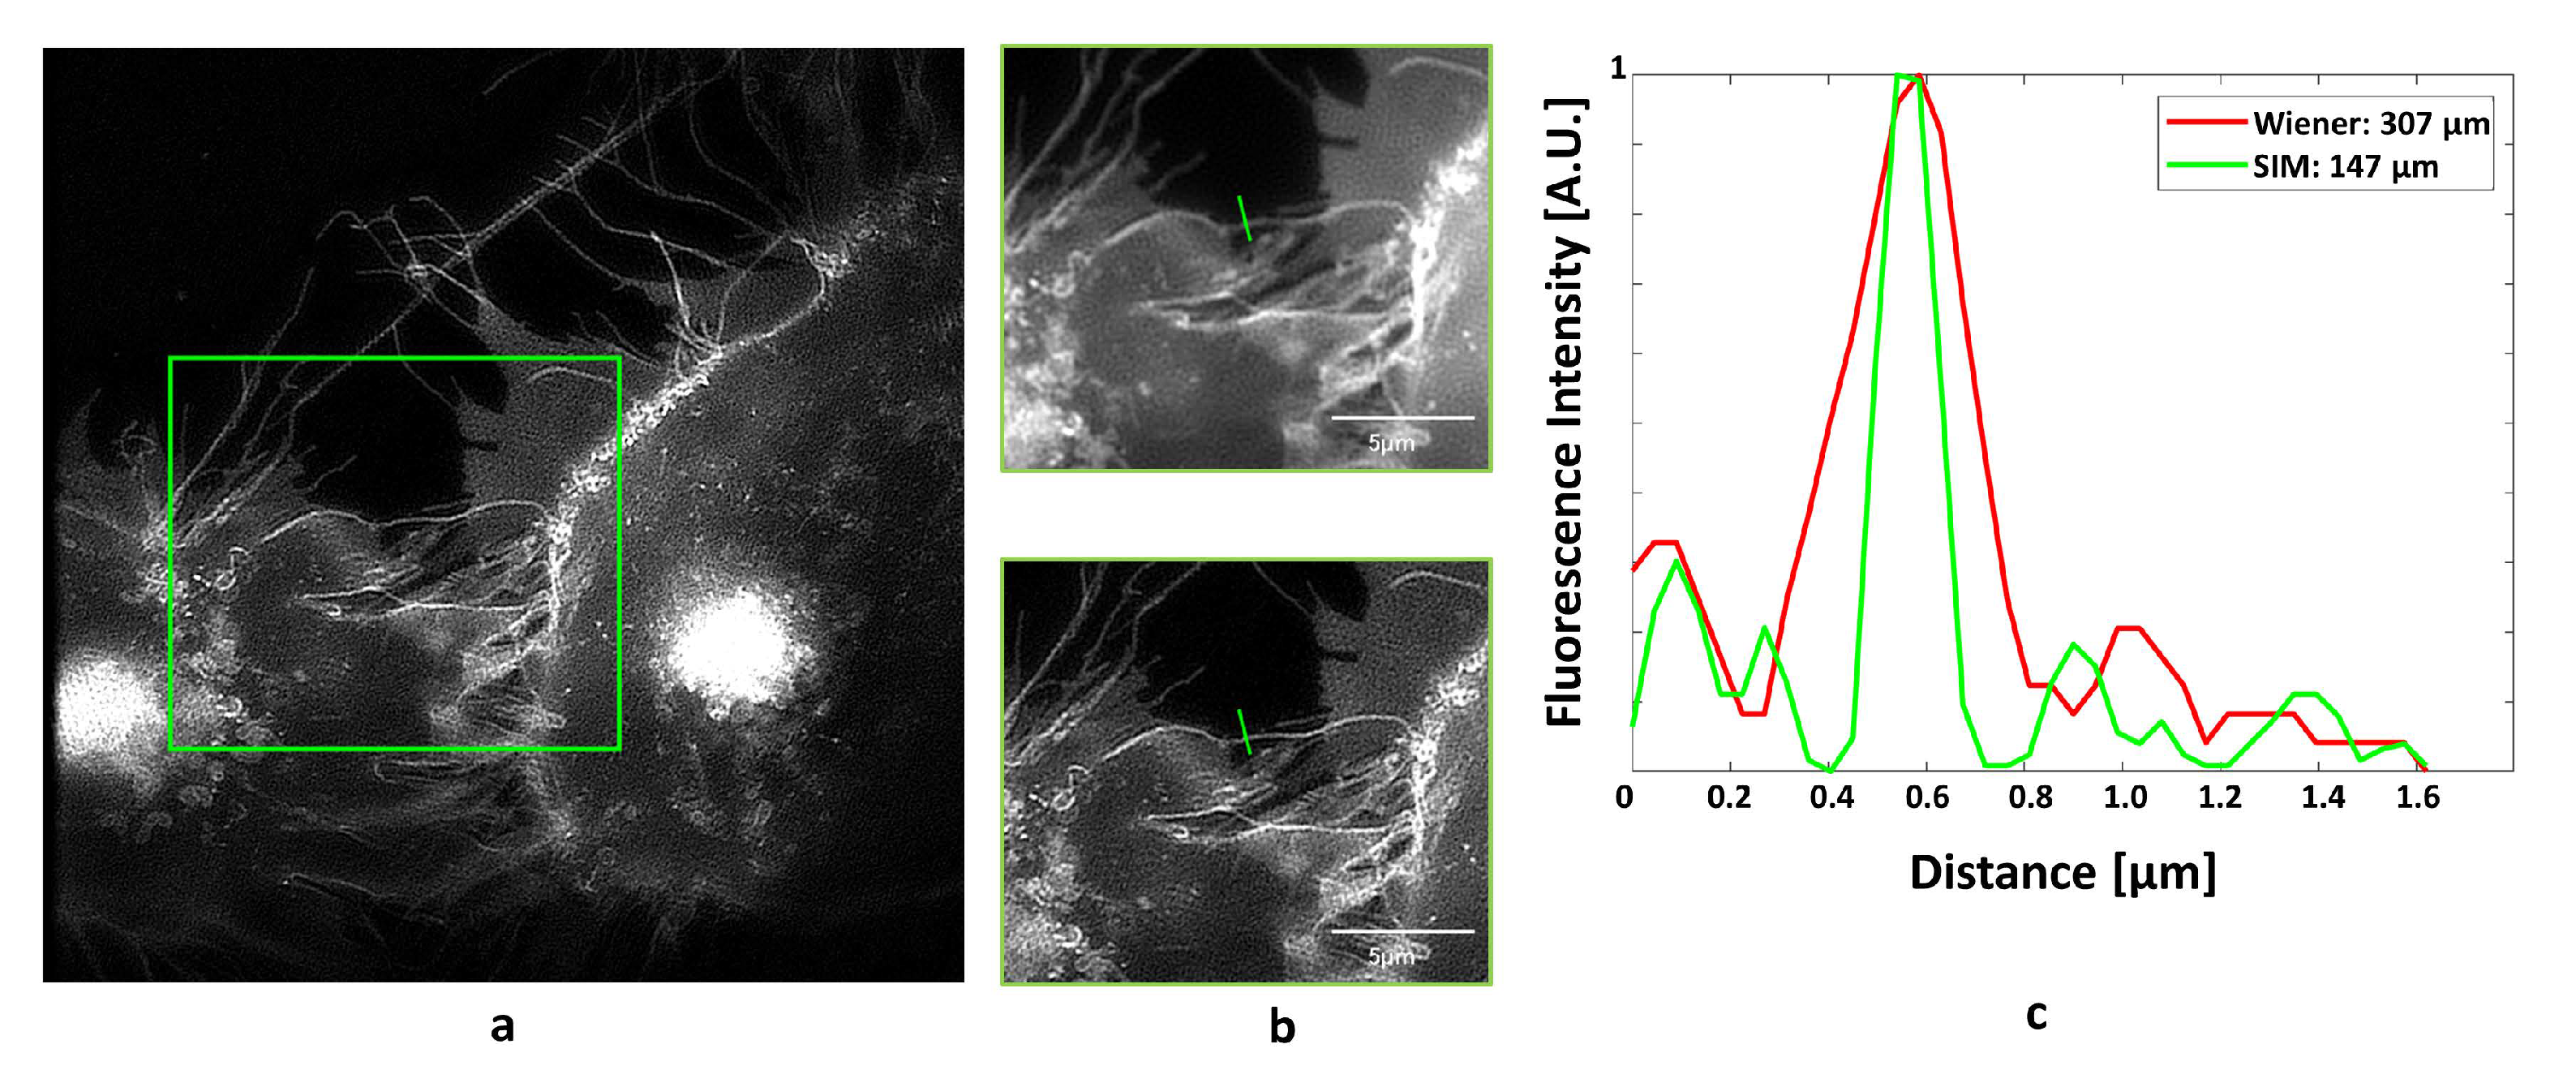
Super-resolution Microscopy by (coherent) Structured Illumination (SR-SIM) [12,13] avoids this high light exposure and appears to be a promising alternative for live cell microscopy, particularly in the cases of longer exposure times or repeated measurements. A periodical illumination pattern permits transmission of spatial frequencies, which are up to a factor of 2 higher than for conventional microscopy, resulting in a two-fold enhancement of resolution in comparison with the Abbe criterion. While illumination by three laser beams creates an interference pattern with high spatial resolution in all three dimensions [14], illumination by two laser beams, e.g., the first diffraction orders of an optical grating or a spatial light modulator (SLM) [15,16], creates an interference pattern in two dimensions, if these laser beams can be rotated to (at least) three different positions. Calculation of a super-resolved image commonly needs 9–15 single images with structured illumination of different phase and rotation angles [14,15,16]. This can be achieved by the fast scanning of a diffraction element with galvano mirrors, as described in [17] and further realized in a commercial system (Elyra 7, Carl Zeiss Microscopy Deutschland GmbH, Oberkochen, Germany). Use of a (switchable) SLM, however, obviates any movable component and seems to be a promising alternative. As an example of live cell microscopy, the intracellular distribution of the glucose transporter GLUT4 [18,19] transfected with green Fluorescent Protein (GFP) and stimulated by insulin is depicted in Figure 3, and a region of interest is compared for wide-field microscopy and SIM. While GLUT4 accumulates in intracellular vesicles, as well as in the plasma membrane, Figure 3 demonstrates an enhancement of resolution by a factor of 2 due to SIM in the plasma membrane. It should be emphasized that calculation of SIM images requires original images of sufficiently high contrast, using, e.g., fluorescent dyes or fluorescent proteins.
Total Internal Reflection Fluorescence Microscopy (TIRFM) permits the selective detection of surfaces, e.g., cell membranes, in the 100 nm range, and by variation of the angle of incidence, an axial resolution of only a few nanometers becomes possible. This permits the study of cell–substrate topology, e.g., upon application of cytotoxic or phototoxic agents or in the case of diseases. “Prism-type TIRF” with light incidence via a glass or quartz prism whose refractive index exceeds that of the specimen has been used for live cell measurements for almost 40 years [20,21], while “Objective-type TIRF” only became available 20 years later. Here, the illumination beam is focused close to the edge of the aperture of a microscope objective lens with very high numerical aperture, so that illumination occurs under total internal reflection [22]. This technique, which has been commercialized by several industrial companies, can also be combined with structured illumination microscopy using up to six interfering laser beams to achieve super-resolution in three dimensions [23,24,25].
3. Laser Scanning Microscopy
Laser scanning methods often use the principle of Confocal Laser Scanning Microscopy (CLSM) with apertures rejecting out-of-focus light. This results in an enhanced contrast, reduced noise, and high axial resolution (optical sectioning). The thickness of an optical section is commonly adapted to the depth of focus (wavelength of excitation light divided by the square of the numerical aperture of the objective lens). Information (e.g., fluorescence) from individual planes can be used for 3D image reconstruction.
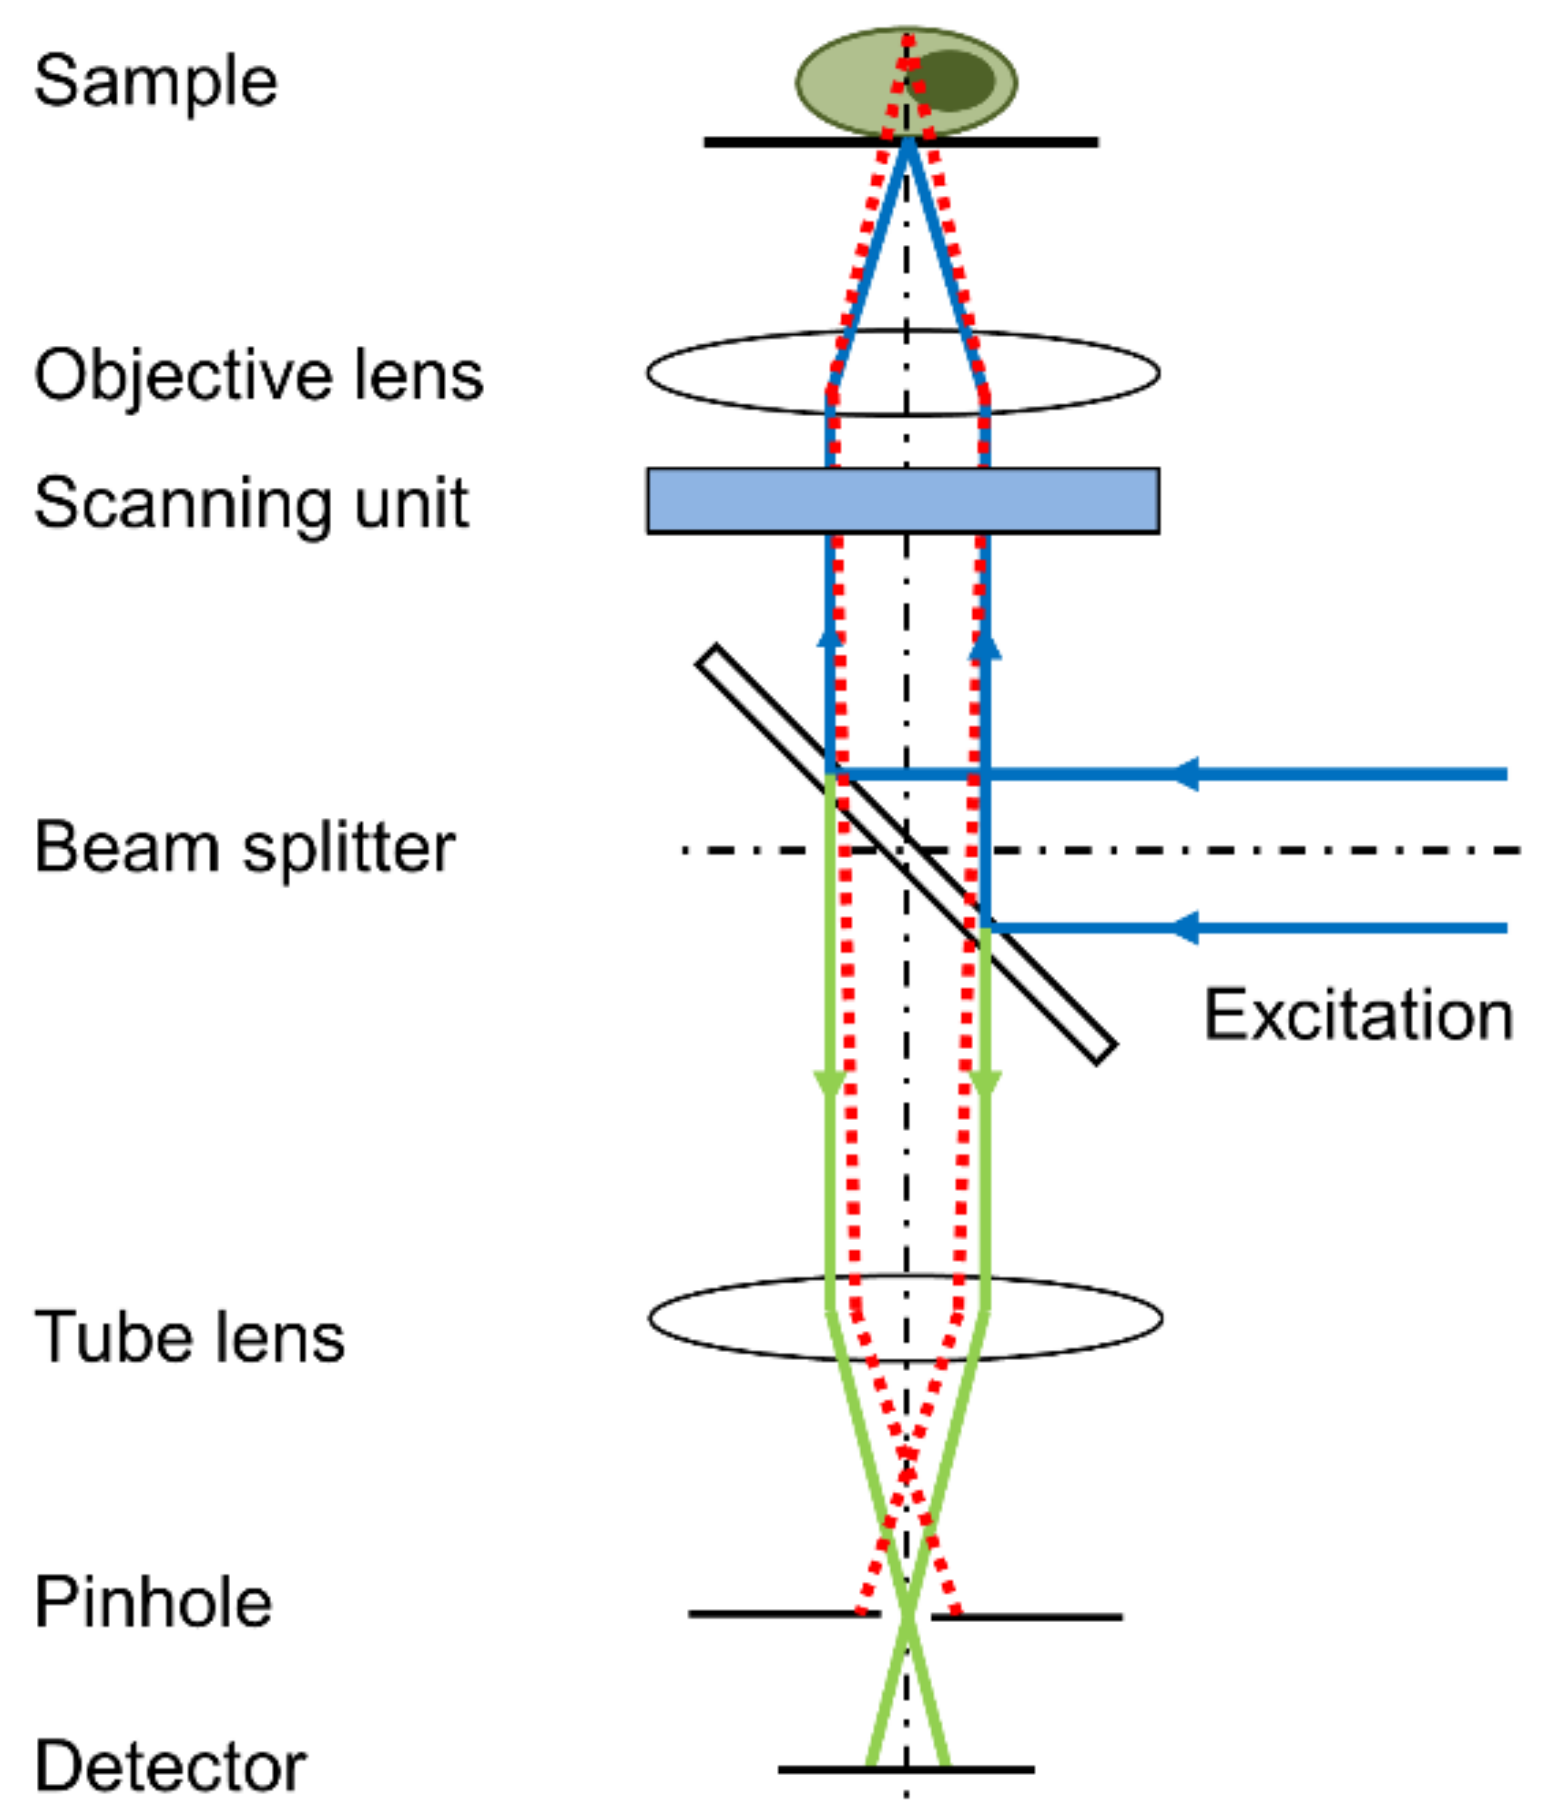
In a point-scanning confocal laser scanning microscope, a focused laser beam is scanned over the sample, and the emitted fluorescence light is imaged on a small pinhole in front of a light detector, e.g., photomultiplier, to eliminate out-of-focus light, as depicted in Figure 4. In this configuration, the confocal image of a specimen is reconstructed point by point, which considerably limits the acquisition speed. By exciting and collecting light from more points simultaneously, a higher acquisition speed is possible with similar optical sectioning and resolution, e.g., with a line-scanning configuration, where the excitation beam is focused to a line instead of a point. A considerably larger improvement was achieved with Spinning Disk Confocal Microscopy [26]. Here, a point-scanning configuration is used, with hundreds of micro-lenses arranged in spirals on a rotating disk, which focus the laser beam to pinholes on a second disk (Nipkow disk). By scanning the pinholes across the sample in rows, spinning disk microscopy vastly improves the speed of image acquisition (up to 1000 or 2000 frames per second) and, therefore, considerably reduces total light exposure and photo-damage.
Lateral resolution results from the diffraction-limited laser spot, as defined by the Rayleigh criterion. If the pinhole diameter is larger than the diameter of the so-called Airy disk, it differs only very little from wide-field microscopy (with the relevant wavelength being the excitation rather than the emission wavelength). If the pinhole is smaller, the resolution results from a convolution of the so-called point spread function in the plane of the sample and another point spread function defined by the pinhole. A smaller pinhole allows higher resolution but significantly lowers the collected emission intensity. Image Scanning Microscopy (ISM) overcomes this problem by replacing the pinhole by a fast EM-CCD camera chip to detect the Airy disk with a large number of “infinitely small pinholes,” thus increasing the resolution by up to a factor of 2 without losing intensity. ISM can be combined with spinning disk microscopy to reduce acquisition time [28] and may offer prospects for super-resolution imaging in deep tissue sections when combined with two-photon excitation [29]. The principle of using an array of very small pinholes has also been applied in Airy Scan Microscopy, where the Airy disc is detected by 32 single detector elements, thus providing improved resolution (typically by a factor 1.7) and increased sensitivity with reduced acquisition times compared to conventional CLSM. A further approach is Re-scan Confocal Microscopy (RCM) [30] with another laser scanning process over the pinhole. This technique maintains the high lateral and axial resolution of Image Scanning Microscopy, but is very sensitive, as it works with an open pinhole and uses highly sensitive and low-noise detectors.
In contrast to CLSM, multiphoton microscopy achieves optical sectioning without using a pinhole [31,32]. By focusing picosecond or femtosecond laser pulses onto a small spot in the sample, fluorescence is excited by two or more photons exclusively in the small focal volume. This permits scanning of different sample planes and restricts photo-damage to the focus of multiphoton excitation. A further advantage of multiphoton microscopy is the higher penetration depth of longer wavelengths. However, the longer wavelengths also cause larger diffraction-limited spots, and the technical equipment is more complex and needs more precise adjustment than conventional CLSM.
Stimulated Emission Depletion (STED) microscopy is a laser scanning technique that overcomes the diffraction-limited resolution of confocal and multiphoton microscopes. The enhancement of resolution is due to suppression of fluorescence of the dye molecules in the outer regions of a diffraction-limited illumination spot by stimulated emission using a (second) donut-shaped laser beam. While a resolution of 30–70 nm can thus be achieved [33], the irradiance, however, exceeds the irradiance in a conventional fluorescence microscope by a factor 104–105. This problem was minimized with the introduction of MINFLUX nanoscopy, a technique based on the localization and tracking of single molecules in the intensity minimum of a donut-shaped laser beam. MINFLUX achieves nanometer resolution (isotropic: ≥2 nm) with moderate light exposure, which is comparable to confocal laser scanning microscopy [34].
4. Comparison of Wide-Field and Laser Scanning Microscopy
As mentioned before, conventional wide-field microscopy has no inherent optical sectioning capability, but there are several techniques available to overcome this limitation. With OS-SIM, axial optical sections can be made as thin as 200 nanometers with a high-numerical-aperture objective lens and a fine grid spacing. While the two-beam configuration of SR-SIM provides super-resolution in the lateral direction, three-beam SR-SIM additionally doubles the resolution in the axial direction. Using a lattice pattern rather than grid lines gives higher contrast and a more robust image reconstruction, which allows deep tissue imaging up to 100 µm. Excessive illumination may cause light-induced damage that can alter cell physiology and, therefore, lead to incorrect results, especially in long-term experiments. To avoid photo-toxicity during and subsequent to experiments, light exposure should be kept as low as possible. Although structured illumination requires the acquisition of 9–15 individual images, photo-toxicity is still low in comparison with other super-resolution methods. While an irradiance of about 100 mW/cm2—corresponding to solar irradiance—is sufficient for SIM, a considerably higher irradiance is necessary for single-molecule methods (where each molecule is excited repeatedly), as well as for stimulated emission in STED microscopy (for an overview, see [27]).
Light Sheet Microscopy offers an optical section thickness ranging from about 1 µm (Lattice Light Sheet: dz = 280 nm [35]) up to about 15 µm, depending on the setup and the relevant application. With a comparably high penetration depth, most light-sheet systems are suitable for imaging applications over different scales: From single cells over cell assemblies (e.g., spheroids) up to small organisms. The main advantage of light sheet microscopy, in comparison with laser scanning techniques, is that light exposure is restricted to the examined planes of a specimen. Therefore, light sheet microscopy is ideal for low-light exposure, low photo-toxicity, and long-term observation of samples.
The primary advantage of laser scanning microscopy is the ability to produce serially thin optical sections of about 0.4 to 1.5 µm, depending on the numerical aperture, excitation wavelength, and pinhole size. Typical penetration depths for multiphoton LSM are 250–500 µm, although imaging as deep as 1 mm has been reported in the literature [36], compared to ~100 µm for CLSM. While the detection with CLSM is limited to the focal plane, a large sample volume is exposed to optical excitation, and significant photobleaching or photo-toxicity is likely to occur in living specimens. Simultaneous detection of multiple sample points and improved detection systems may reduce photo-toxicity by reducing the acquisition time and light exposure. With multiphoton excitation, phototoxic damage may be restricted to the laser focus, thus reducing the impact on other regions of the sample. For a comparison of wide-field and laser scanning techniques, see Table 1.
The acquisition of color images is an essential aspect of many biological applications. Wide-field methods offer a wide range of detection modes, including monochrome cameras for video-rate imaging with high sensitivity or color options for full RGB imaging. Laser scanning methods employ highly sensitive photomultipliers or cameras (spinning disk) to generate intensity-based images. For multicolor/pseudo-color imaging, multi-channel excitation and/or emission devices are available (for further information, see [37]).
In summary, conventional wide-field, OS-SIM, or CLSM, including Airy Scan, appear appropriate for 2D specimens or samples of low thickness, when the number of light exposures remains limited. For 3D specimens, particularly those that do not require very high resolution, light sheet microscopy appears to be an appropriate method, e.g., if multiple exposures or long measuring periods are desired. Conventional wide-field or spinning disk microscopy are preferential methods for high-speed experiments. If super-resolution is required, authors should consider the corresponding wide-field (SIM, single-molecule localization) or laser scanning (e.g., Airy scan or STED) methods, taking into consideration their relevant light exposures.
5. Further Techniques
Wide-field as well as laser scanning methods can be combined with further techniques, e.g., Spectral Imaging [38,39,40] or Fluorescence Lifetime Imaging Microscopy (FLIM) [41,42,43,44,45], in order to distinguish between various fluorophores, molecular conformations, or cellular binding sites on the basis of their different fluorescence spectra or lifetimes. In this context, Förster Resonance Energy Transfer (FRET) [46] has proven to be a valuable method for measuring intermolecular distances below 10 nm, e.g., in pharmaceutical test systems [47].
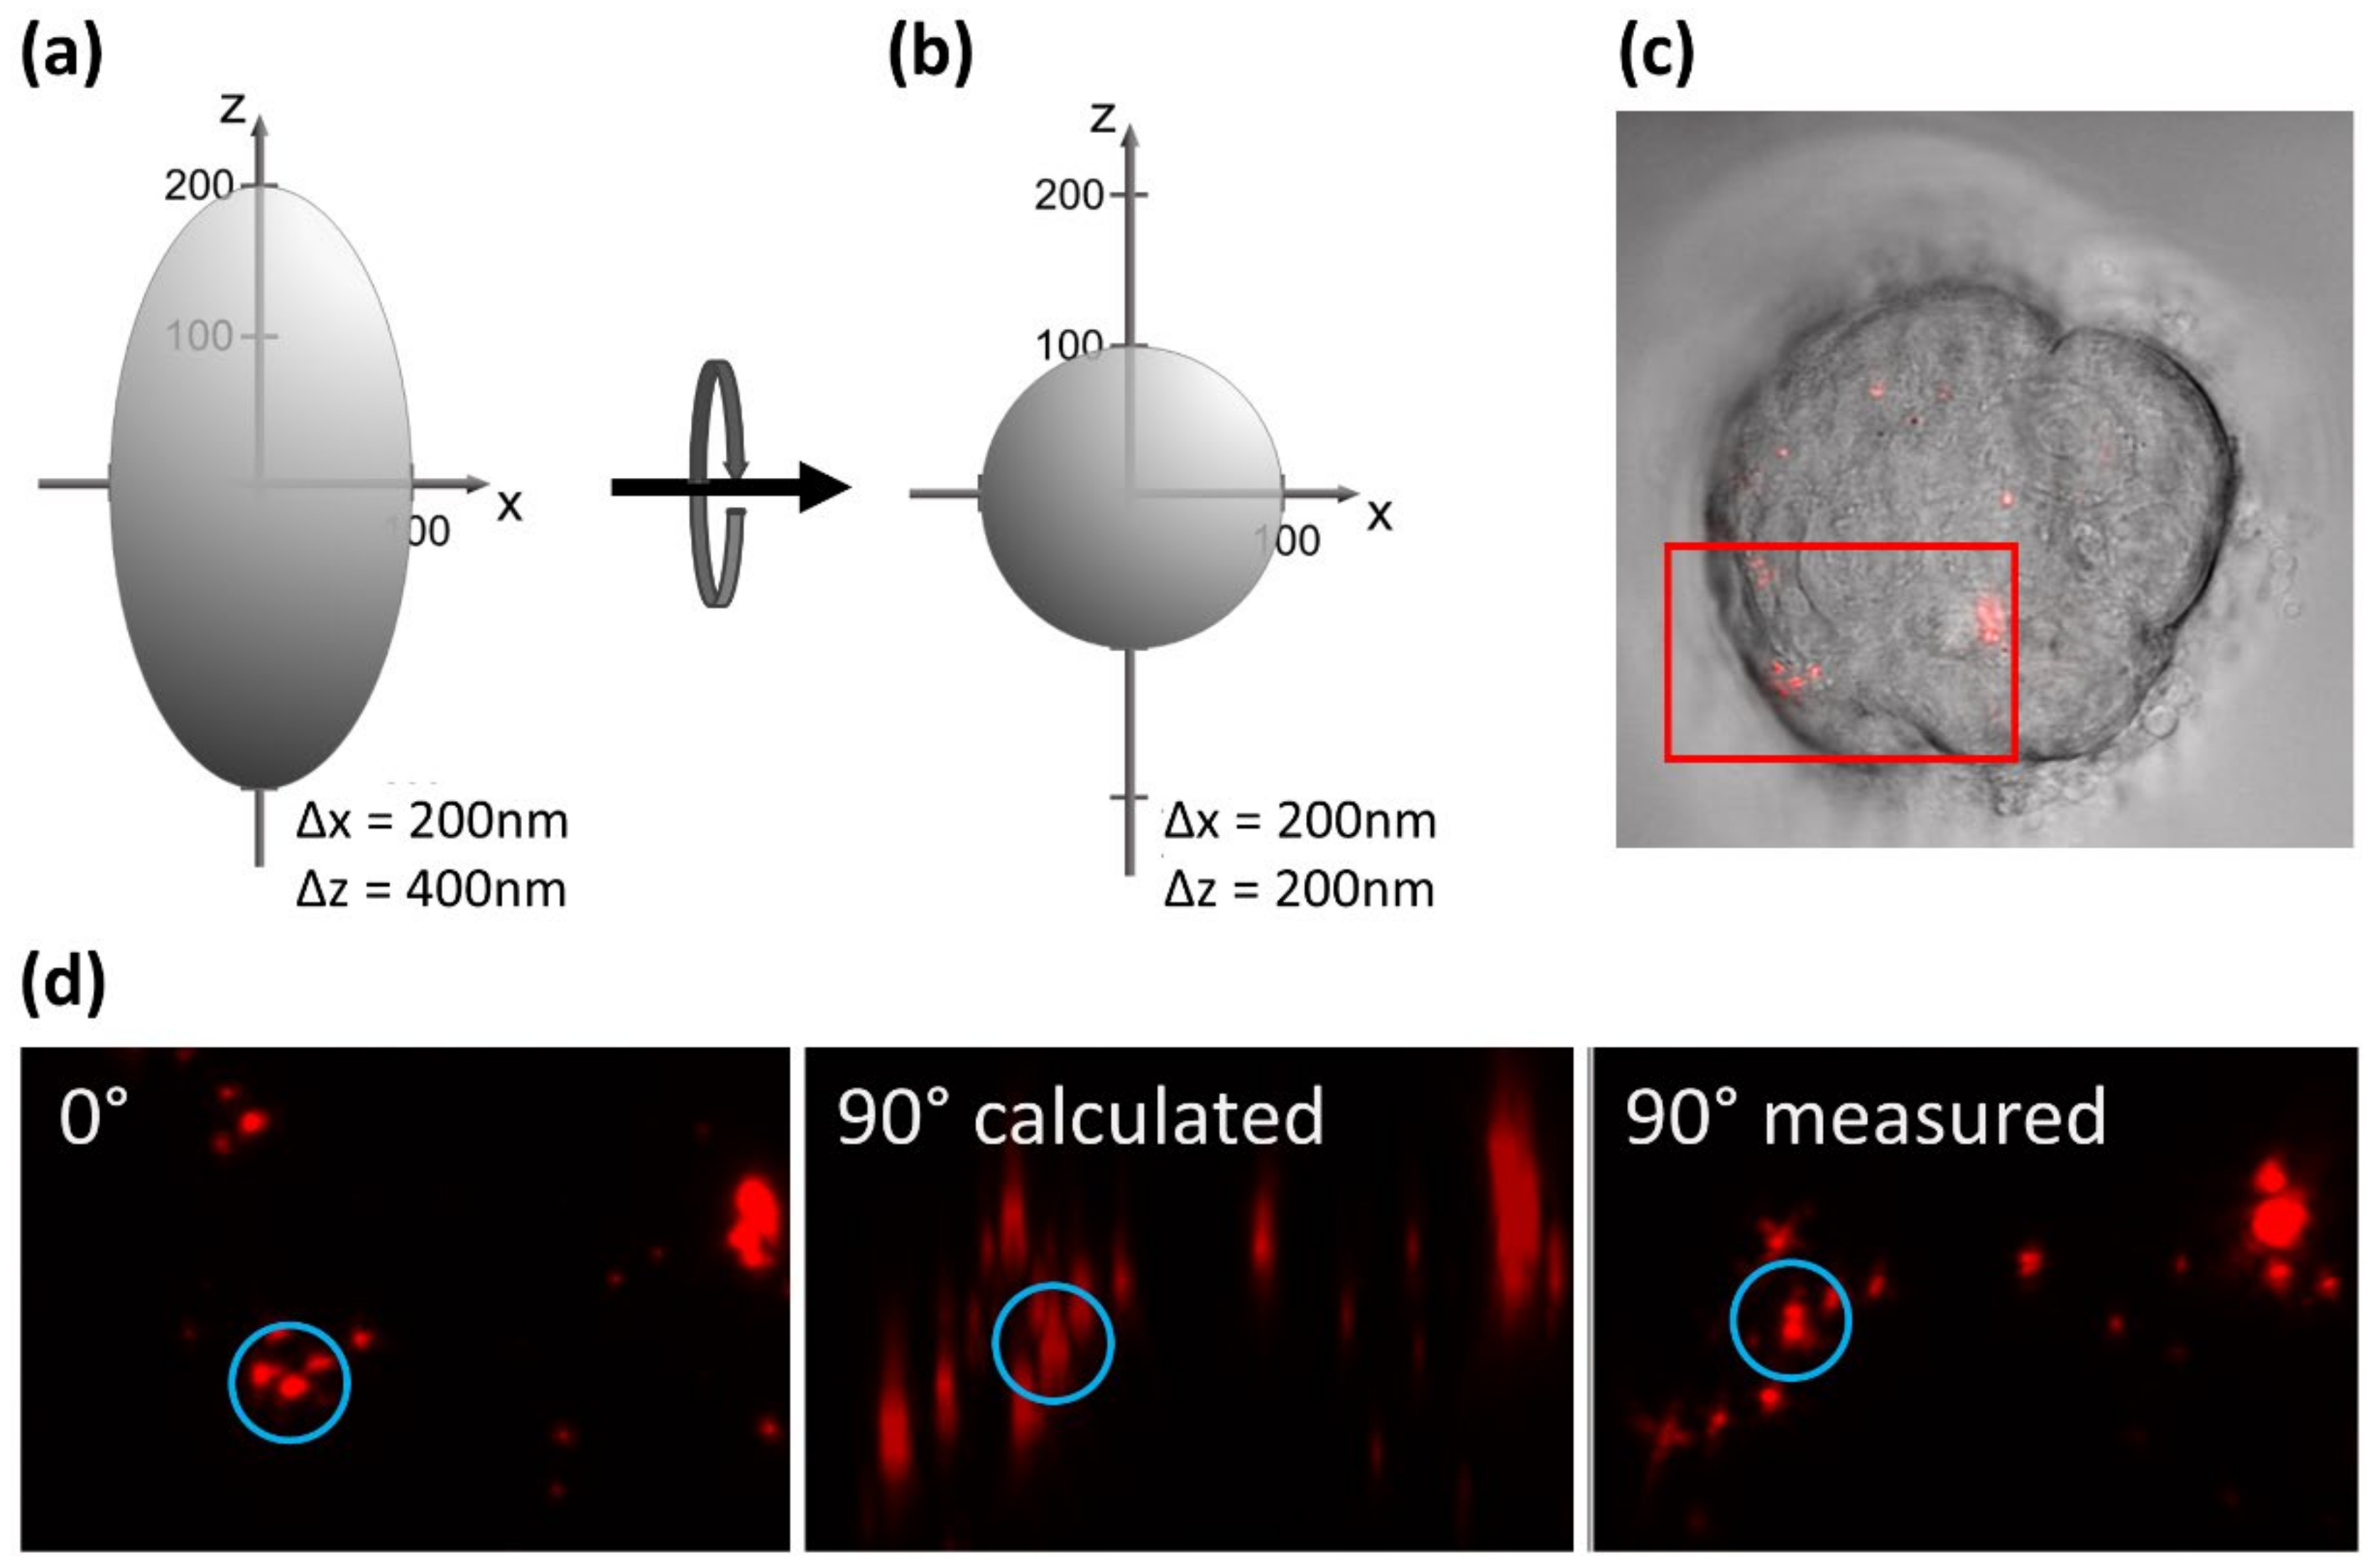
Most microscopy techniques can also be combined with axial tomography, where a sample embedded in a micro-tube or capillary is rotated and observed from various directions [48]. The advantage of this technique is demonstrated in Figure 5, showing an MCF-7 breast cancer cell incubated with quantum dots of about 20 nm in size (Figure 5c). Each dot is represented by a point spread function, as depicted in Figure 5a. In a side view at 90° (calculated from a z-stack recorded at 0°), the quantum dots appear blurred (reflecting the low axial resolution of the microscope), but after mechanical rotation through 90°, they appear clear and well resolved (Figure 5d). Thus, axial tomography provides an isotropic high resolution, as depicted in Figure 5b.
Most microscopy techniques can also be used in combination with microfluidics, e.g., using controlled addition of reagents, fluorescent dyes, or metabolites [8]. Furthermore, units for control of temperature, humidity, or CO2 content can be integrated into various kinds of microscopes.
6. Representative Applications
6.1. Live Cell Experiments (2D)
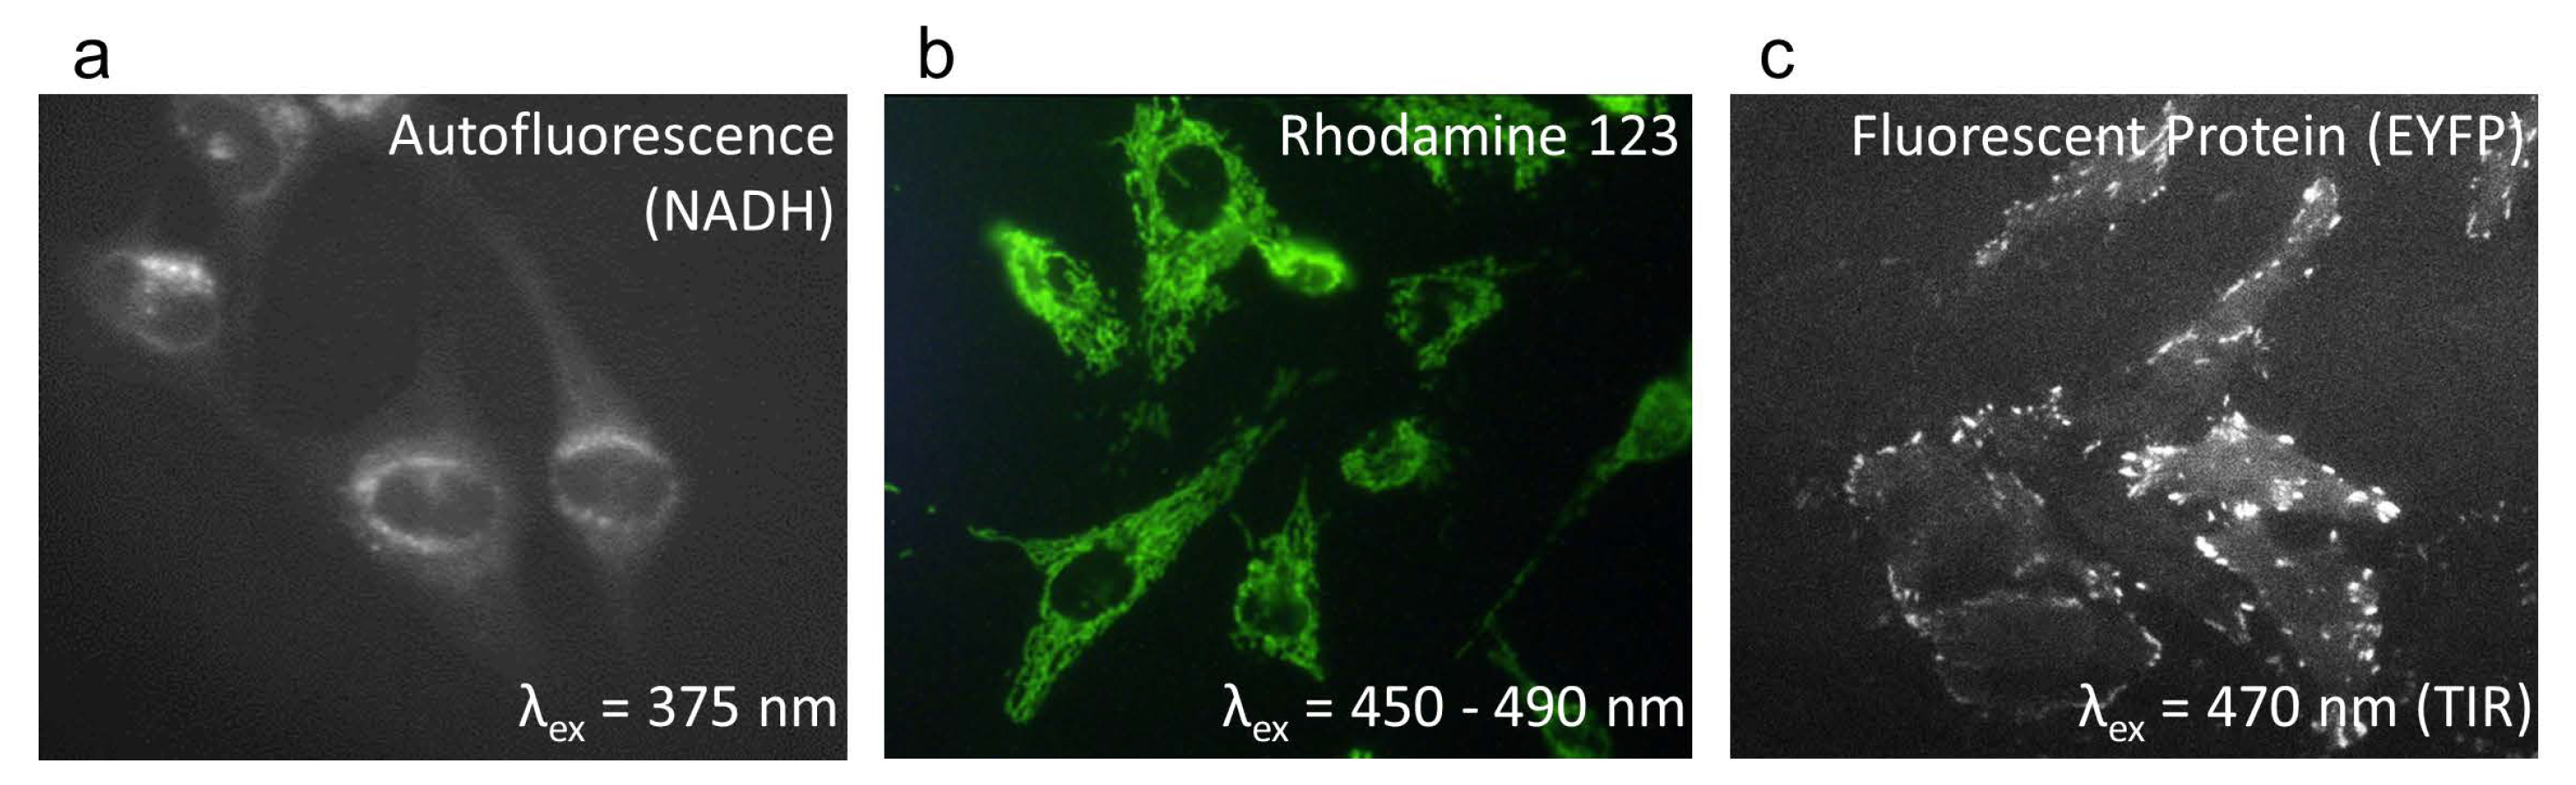
Cells are commonly cultivated as two-dimensional (2D) monolayers on glass or plastic slides and are readily assessed by wide-field as well as by laser scanning microscopy. In some cases, they may provide results of limited significance due to nonphysiological conditions that directly affect relevant parameters (e.g., resistance to drugs). Conventional wide-field microscopy can be used for fluorescence or light scattering experiments, if the information originates from thin cell layers of only a few micrometers, e.g., autofluorescence measurements (Figure 6a) or fluorescence measurements of dye-staining organelles, e.g., mitochondria (Figure 6b). However, for a numerical aperture AN = 0.75 (typical for a 40× magnifying objective lens), the depth of focus Δz = nλ/AN2 is less than 1 micrometer, so confocal laser scanning microscopy (CLSM) may be advantageous even for experiments concerning cell monolayers, when high axial resolution is required. Total-Internal-Reflection Microscopy (TIRFM), with an evanescent electromagnetic wave penetrating about 100 nm into a cell, is an appropriate wide-field method for measuring the surface of 2D cell cultures, e.g., for studies of their plasma membrane or membrane proximal sites. An example is given in Figure 6c for Enhanced Yellow Fluorescent Protein (EYFP) linked to Paxilline in focal adhesions, which are relevant for cell–substrate interactions.
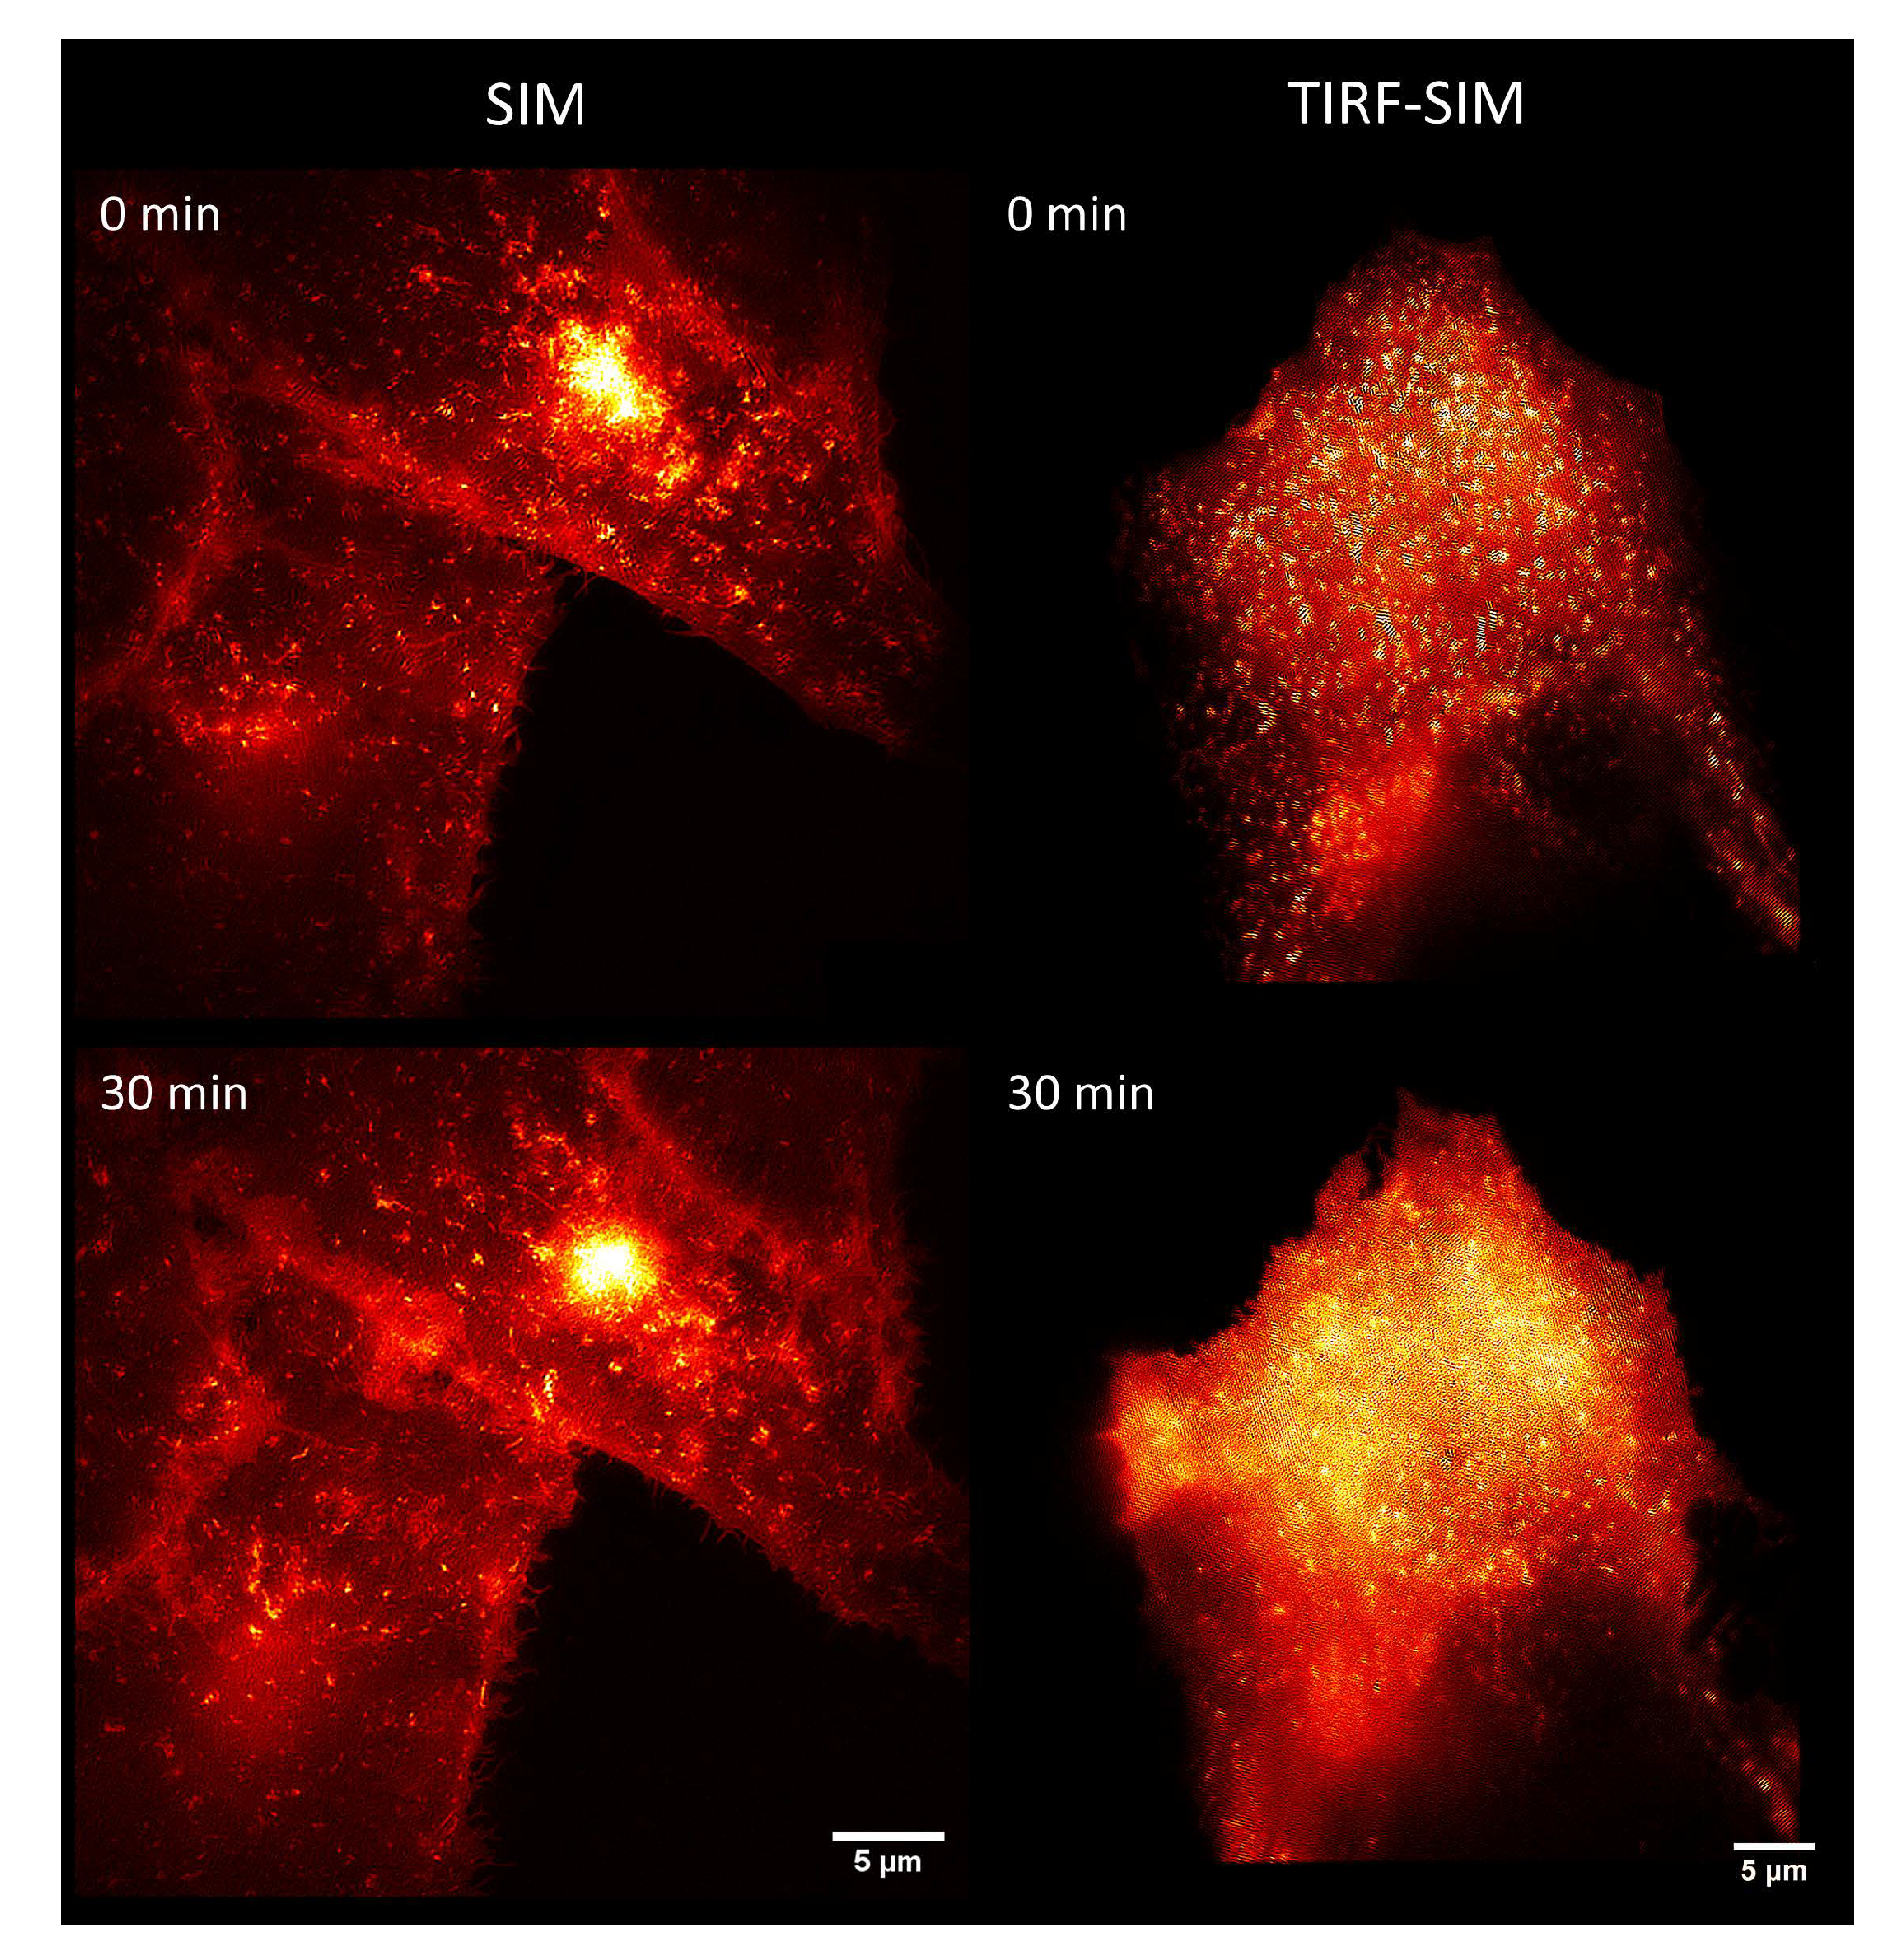
Previously, TIRFM has been combined with super-resolution or super-localization microscopy, e.g., for selection of thin layers for single-molecule detection. There are also reports in the literature on a combination of TIRFM with SIM, when two interfering laser beams are focused close to the edge of the aperture of high-AN objective lenses (AN ≥ 1.45), so that they are totally reflected on the sample [23,24,25]. In this case, high lateral and high axial resolution are combined on the surface of a specimen, resulting in an isotropic resolution of around 100 nm. An example is given in Figure 7 for the stimulus-dependent translocation of the glucose transporter GLUT4 (fused with green Fluorescent Protein, GFP) from intracellular storage compartments to the plasma membrane. Insulin or the insulin-mimetic phytochemical compounds tannic acid, as well as Bellis perennis extract, were used as stimulating agents [49]. As depicted in Figure 7 (left), we observed fluorescence arising from small vesicles and—in particular, after stimulation—from larger areas within the plasma membrane by SIM. When we measured the plasma membrane almost exclusively by SIM-TIRFM (Figure 7, right), we observed a pronounced increase in fluorescence over the whole cell surface after stimulation.
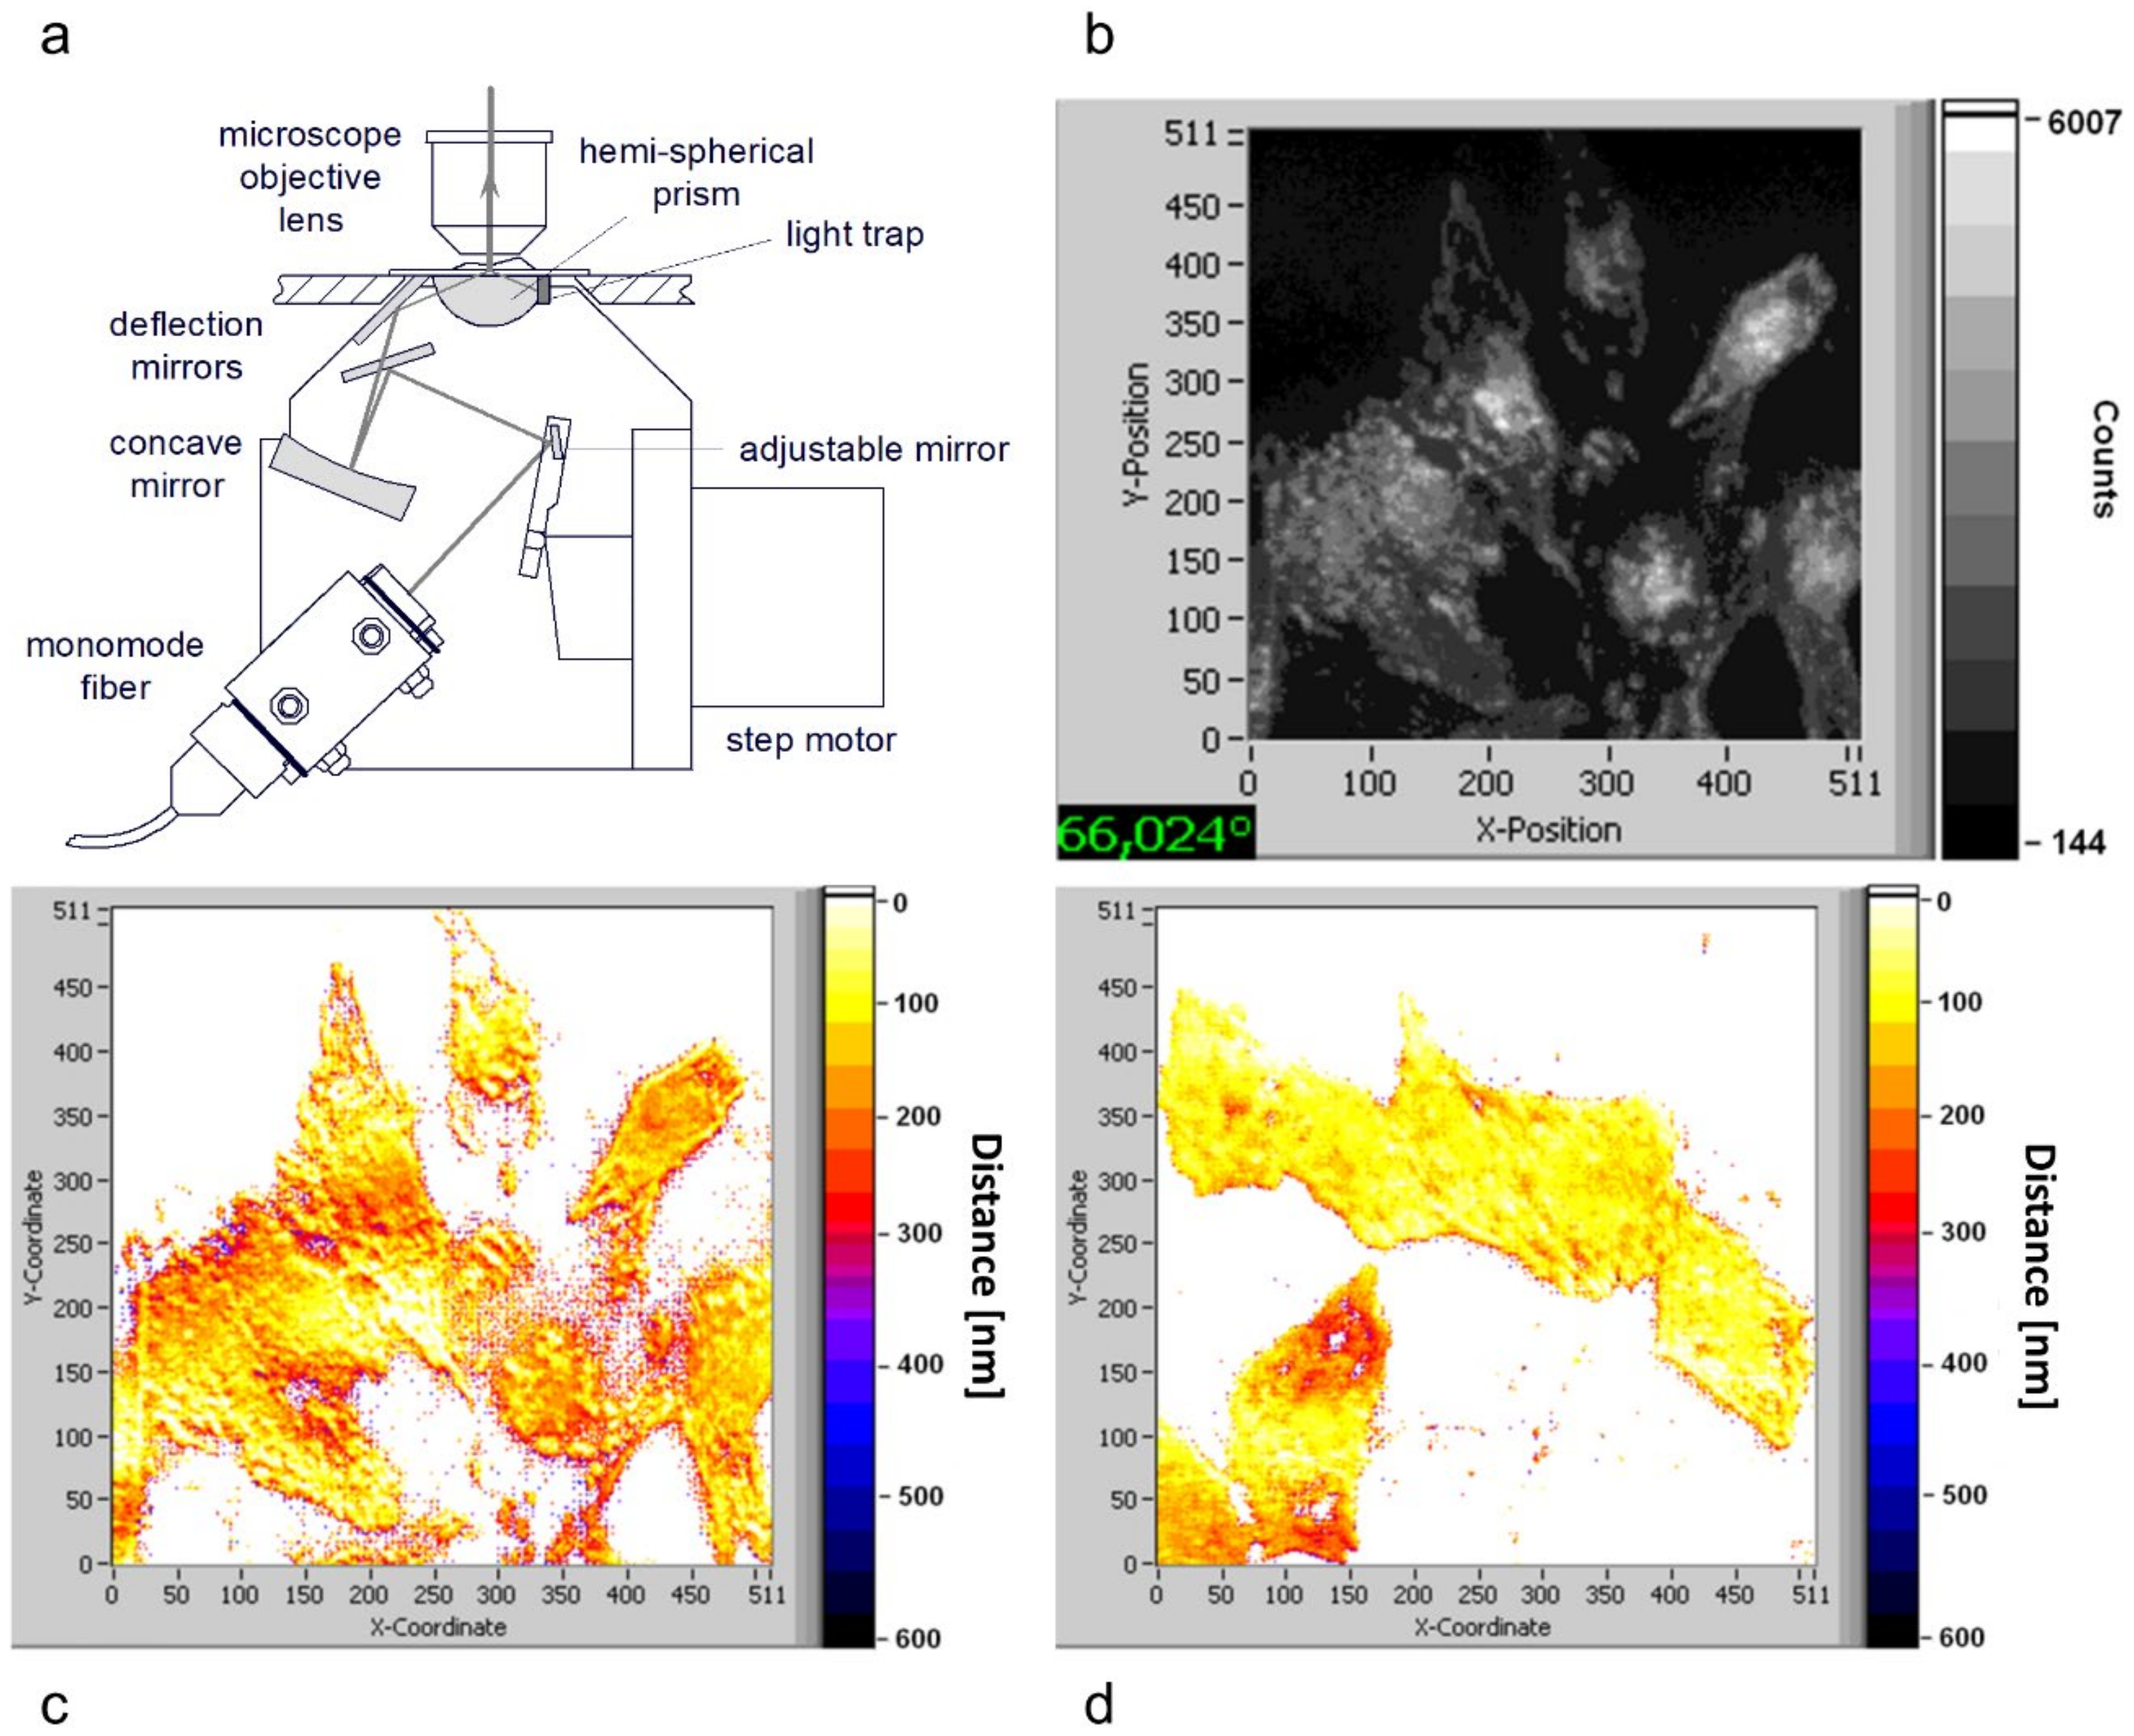
Based on the fact that the penetration depth d(Θ) of the evanescent electromagnetic wave depends on the angle of incidence Θ, we previously calculated the fluorescence intensity of the TIRFM signal for a homogenously fluorescent layer of thickness t as IF (Θ) = A T(Θ) t e-Δ/d(Θ) with a constant A, a transmission factor T(Θ) through the cell–substrate interface, and a distance Δ between a cell and its substrate [50]. Variation of the angle Θ (variable-angle TIRFM) permitted imaging of this distance Δ for the whole specimen (cell–substrate topology). An illumination device (microscope condenser) for variable-angle TIRFM is depicted in Figure 8a, and its applications in Figure 8b–d. Here, the fluorescence of the membrane marker laurdan in U251-MG glioblastoma cells is depicted upon excitation at Θ = 66° (Figure 8b), and the cell–substrate topology is calculated for cells with activated tumor suppressor gene TP53 (“less malignant cells,” Figure 8c), as well as for wild-type tumor cells (Figure 8d). Obviously, the less malignant cells showed variable distances Δ between about 100 and 300 nm (“folded surface”), whereas the tumor cells showed a homogeneous distance of Δ ≈ 100 nm (“unfolded surface”). Therefore, cell–substrate topology seems to be a criterion to distinguish between tumor cells and less malignant cells [51].
6.2. Live Cell Experiments (3D)
Single-cell experiments are not restricted to 2D specimens, i.e., cells growing on microscope slides or in Petri dishes. Cells can also be embedded in gels like agarose, e.g., in micro-capillaries, and possibly grow under more realistic conditions. In this case, Optical Sectioning Structured Illumination Microscopy (OS-SIM) or Confocal Laser Scanning Microscopy (CLSM) would be appropriate methods to detect them in the optimal vertical position. With rotatable capillaries, they can even be observed from various sides, and as the lateral resolution in microscopy is always better than the axial resolution, the vertical axis can be rotated into the horizontal position to profit from an enhanced resolution (axial tomography with isotropic resolution), as described above.
Three-dimensional (3D) cell assemblies, e.g., multicellular spheroids, closely resemble in vivo tissue in terms of cell physiology, cell metabolism, and development of extracellular matrices. Therefore, they offer more realistic conditions for studies of cell metabolism or tissue diagnostics. Cell spheroids are generally characterized by an external proliferating region and an internal quiescent zone (caused by the gradient of nutrient and oxygen diffusion), which may surround a necrotic core. Especially, multicellular (tumor) spheroids have gained significance in preclinical studies. Several techniques are available for the cultivation of multi-cellular specimens, mostly based on preventing cell attachment to surfaces, e.g., hanging drop methods, liquid overlay methods, or agitation-based approaches [52]. In addition, cell cultivation in a solid matrix, e.g., gel, as reported in the literature for about 30 years [53,54], may permit 3D cell growth under realistic conditions. For measurements of 3D cell cultures, a variety of specific sample holders, e.g., glass or plastic tubes or even micro-capillaries, is available for wide-field and laser scanning microscopy.
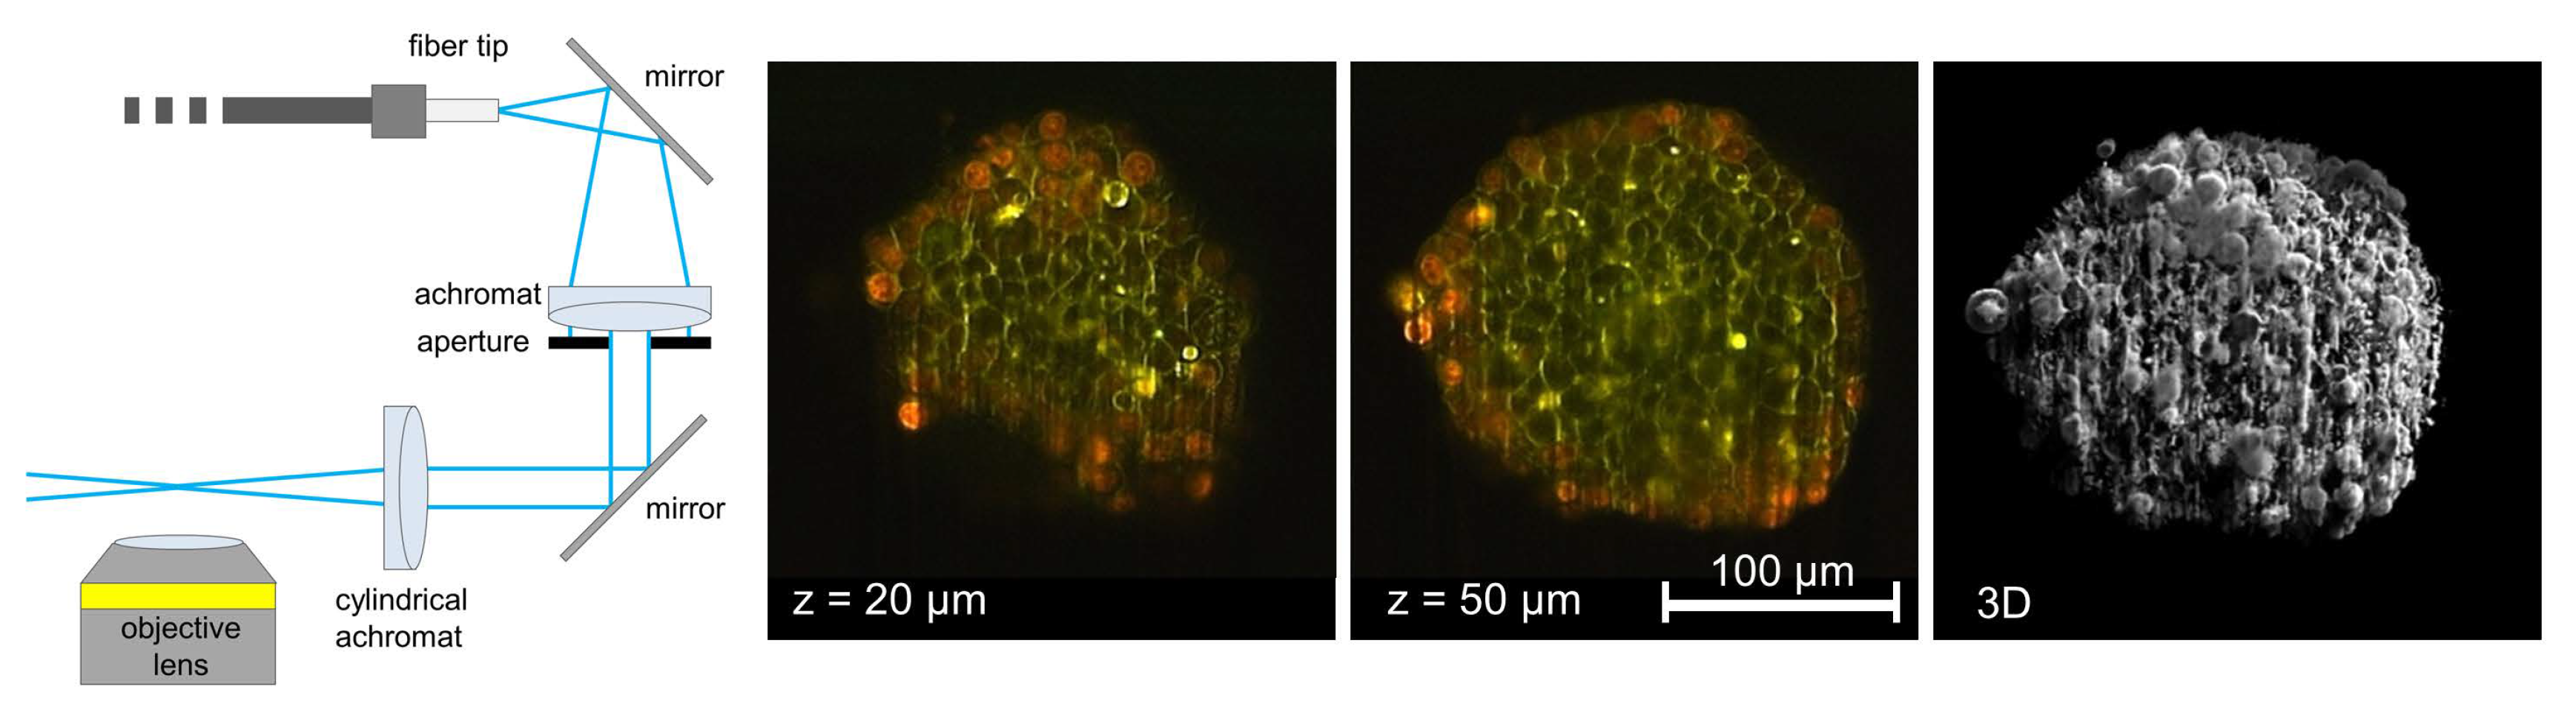
Light Sheet Fluorescence Microscopy (LSFM) is an appropriate tool for imaging (larger) cell assemblies, as it reduces light exposure of a single cell layer by illuminating only the plane of interest (focal plane). When using micro-capillaries as sample holders, the benefits of axial tomography (see above) can be applied to 3D cell cultures. LSFM can also be combined with microfluidics in order to apply nutrients, pharmaceutical agents, or fluorescent dyes prior to or during the measurement [4,8]. The distribution of the cytostatic agent doxorubicin in a cell spheroid 6 h after incubation is depicted in Figure 9 for two different layers, as well as in a 3D reconstruction. While doxorubicin (red fluorescence) accumulates preferentially in the peripheral regions of the spheroid, its degradation product (green-yellow color) is mainly located in its central part, e.g., within cell membranes.
A combination of 3D live cell microscopy with spectral imaging and fluorescence lifetime imaging has recently been presented [55]. In a sensor for apoptosis, nonradiative energy transfer (FRET) occurs from Enhanced Cyan Fluorescent Protein (ECFP) anchored in the plasma membrane to Enhanced Yellow Fluorescent Protein (EYFP) coupled to ECFP via a specific peptide linker. Upon apoptosis, this linker is cleaved by the enzyme caspase-3, and the energy transfer is disrupted. Upon optical excitation of ECFP, the spectral band of EYFP disappears, and the fluorescence lifetime of ECFP becomes longer, as nonradiative deactivation of its excited state via FRET is interrupted. This effect can be studied for all layers of a cell spheroid by Light Sheet Fluorescence Microscopy.
6.3. Biopsies
Biopsies from a histological laboratory are often stained with specific dyes for certain organelles to enhance contrast. Light scattering is a major problem for imaging deeper layers of cell assemblies or biopsies, limiting penetration depths typically to 100 µm or less. Optical clearing techniques matching the refractive indices of tissue and surrounding aqueous medium have gained considerable importance for deep view imaging of the skin, brain, and other organs [56,57,58]. Currently available optical clearing techniques are not compatible with live cell imaging; however, efforts are being made to find biocompatible solutions, especially for ex-vivo applications [59]. While penetration depths are limited to 100–200 µm in noncleared samples, they can be even larger than 0.5 mm in cleared samples. An example is given in Figure 10 for stained biopsies of the mouse brain. In an approach toward super-resolution microscopy, optical clearing is combined with Expansion Microscopy (ExM) (for a review, see [60]), where the sample is physically expanded using swellable charged polymers to gain nanoscale resolution. It has a wide range of applications in cell and developmental biology, but in most cases, is not compatible with life cell imaging.
6.4. Small Organisms
For imaging small organisms up to about 1 mm in size, Light Sheet Fluorescence Microscopy (LSFM), as well as Confocal Laser Scanning Microscopy (CLSM), have proved to be appropriate methods. As a further technique, Optical Projection Tomography (OPT) should be mentioned, where a sample is illuminated from various sides, and projections from individual planes are calculated. These projections are further combined in order to recover a high-quality 3D image (for a review, see [61]). However, in most cases, either high transparency or, again, the application of clearing techniques is required, if viability is not a main criterion.
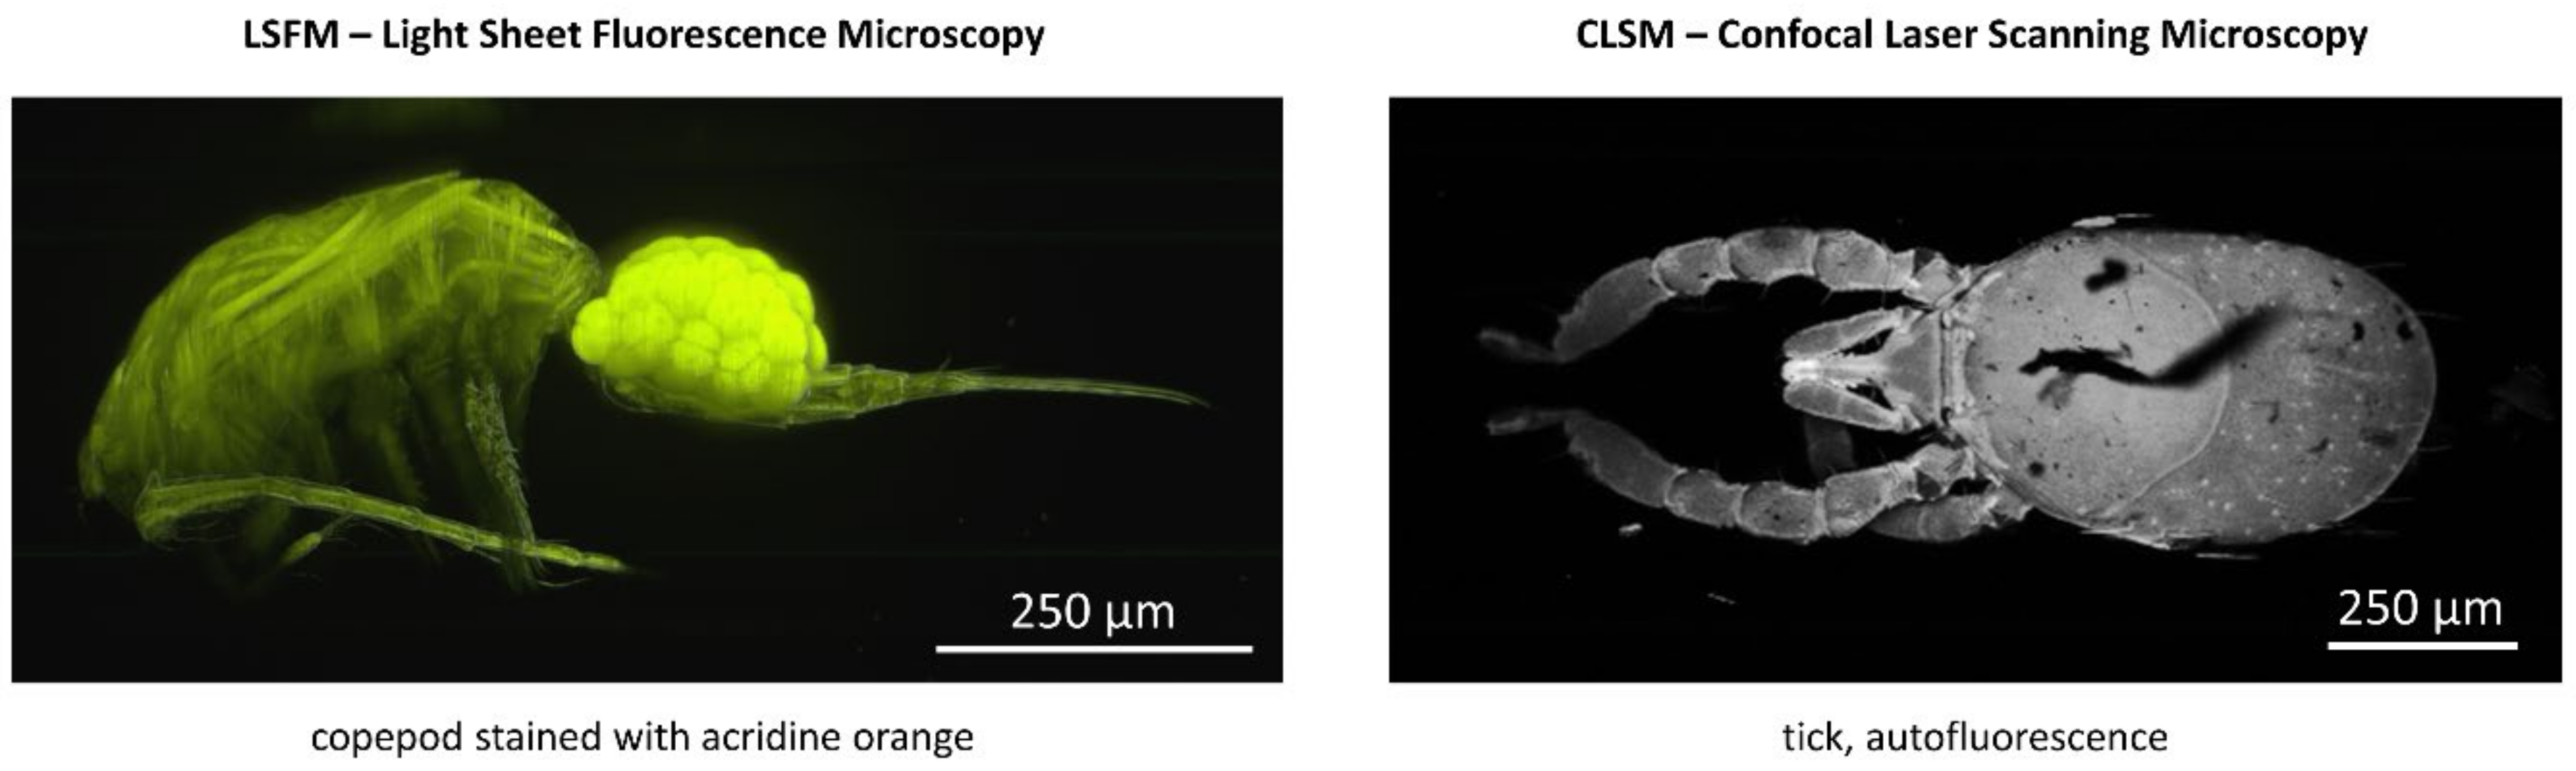
Examples are given in Figure 11 of a copepod stained with Acridine Orange (imaged by light sheet microscopy) and a tick (autofluorescence, imaged by confocal laser scanning microscopy). Specimens are kept in glycerol with a refractive index n = 1.473 well suited to the refractive indexes of the organisms, as well as the surrounding glass capillaries. For further details, the reader is referred to [62], also describing the rotation of the specimens within a set of two glass capillaries (a cylindrical rotatable capillary surrounded by a fixed rectangular capillary with a glycerol immersion).
Microscopy of small organisms includes the large field of developmental biology, wherein particular embryos of zebrafish, insects, and even mammalians (mice) are usually observed over a longer period. Due to its low light exposure, Light Sheet Microscopy (LSFM) is often the method of choice (for a review, see, e.g., [63,64,65,66]), but also Multiphoton Laser Scanning Microscopy (with its high penetration depth in tissue) is reported in the literature [67]. Recent developments include a combination with super-localization microscopy [68], real-time imaging [69], and multi-view light sheet microscopy [70]. A detailed description of all these methods and applications, however, would exceed the scope of this manuscript; therefore, the reader is referred to more specific literature.
7. Conclusions and Further Perspectives
This manuscript gives an overview of methods of optical microscopy and their potential applications in the life sciences. While an attempt has been made to cover many of the present technologies, applications are exemplary and often focused on the authors’ own work in order to limit the frame of this paper. The potential of 3D imaging, lateral and axial resolution, recording speed, as well as light exposure, to living cells or organisms are main criteria for selection of the most suitable method of microscopy. Generally, conventional wide-field microscopy (including TIRFM) or laser scanning microscopy appear appropriate for smaller samples (100 nm ≤ d ≤ 50 µm) with a limited number of light exposures, whereas light sheet microscopy appears to be an optimal method for larger 3D cell cultures, biopsies, or organisms (20 µm ≤ d ≤ 1 mm), if multiple exposures or long measuring periods are desired. Super-resolution techniques are commonly applied to small samples, e.g., single cells of a few micrometers in size, but there also exist some approaches to reach deeper into the tissue [71]. In addition, super-resolution techniques should be applied with care, as they often require high light exposure, possibly causing photobleaching and photo-toxicity to living specimens. Presently, Structured Illumination Microscopy (SR-SIM) seems to be the super-resolution method with the lowest light doses, and in the future, MINFLUX may have some potential to be applied to living specimens.
Methods reported in this manuscript have focused on hardware solutions together with supporting software for the calculation of images upon structured illumination, surface topologies for variable-angle TIRFM, or 3D images from measurements of individual planes. Future research directions may include innovative software applications for a more detailed cell analysis, e.g., deep learning algorithms for image segmentation, classification, and restoration. Furthermore, methods of fluorescence contrast enhancement should be considered, as endogenous fluorescence might provide low image contrast. Current research topics in this area include photo-switchable dyes that can be reversibly cycled between fluorescent and dark states, e.g., for light sheet microscopy [72], as well as nanostructured substrates for axial confinement, e.g., for TIRF [73].
Author Contributions
Conceptualization, H.S.; methodology, H.S. and V.R.; software, V.R.; validation, H.S. and V.R.; investigation, V.R.; resources, H.S.; data curation, V.R.; writing—original draft preparation, H.S. and V.R.; writing—review and editing, H.S.; visualization, V.R.; supervision, H.S.; funding acquisition, H.S. All authors have read and agreed to the published version of the manuscript.
Funding
Part of this research was financed by Baden-Württemberg Stiftung gGmbH.
Institutional Review Board Statement
Not applicable.
Informed Consent Statement
Not applicable.
Data Availability Statement
Data is contained within the article.
Acknowledgments
The authors thank Julian Weghuber and Peter Lanzerstorfer, University of Applied Sciences Upper Austria, Wels, Austria, as well as Sandra Ritz, Marton Gelleri and Christoph Cremer, IMB Mainz, Germany, and the former members of our group Thomas Bruns, Sarah Bruns, Petra Weber and Michael Wagner for their valuable contributions to the results presented in this manuscript.
Conflicts of Interest
The authors declare no conflict of interest.
References
- Pawley, J. Handbook of Biological Confocal Microscopy, 3rd ed.; Springer: Boston, MA, USA, 1990. [Google Scholar] [CrossRef]
- Webb, R.H. Confocal optical microscopy. Rep. Prog. Phys. 1996, 59, 427–471. [Google Scholar] [CrossRef]
- Neil, M.A.; Juskaitis, R.; Wilson, T. Method of obtaining optical sectioning by using structured light in a conventional microscope. Opt. Lett. 1997, 22, 1905–1907. [Google Scholar] [CrossRef] [PubMed]
- Bruns, T.; Schickinger, S.; Schneckenburger, H. Single plane illumination module and micro-capillary approach for a wide-field microscope. J. Vis. Exp. 2014, 90, e51993. [Google Scholar] [CrossRef] [PubMed] [Green Version]
- Greger, K.; Swoger, J.; Stelzer, E.H.K. Basic building units and properties of a fluorescence single plane illumination microscope. Rev. Sci. Instrum. 2007, 78, 023705. [Google Scholar] [CrossRef] [PubMed] [Green Version]
- Bruns, T.; Bauer, M.; Bruns, S.; Meyer, H.; Kubin, D.; Schneckenburger, H. Miniaturized modules for light sheet microscopy with low chromatic aberration. J. Microsc. 2016, 264, 261–267. [Google Scholar] [CrossRef]
- Voigt, F.F.; Kirschenbaum, D.; Platonova, E.; Pagès, S.; Campbell, R.A.A.; Kastli, R.; Schaettin, M.; Egolf, L.; van der Bourg, A.; Bethge, P.; et al. The mesoSPIM initiative: Open-source light-sheet microscopes for imaging cleared tissue. Nat. Methods 2019, 16, 1105–1108. [Google Scholar] [CrossRef] [PubMed]
- Bruns, T.; Schickinger, S.; Wittig, R.; Schneckenburger, H. Preparation strategy and illumination of 3D cell cultures in light–sheet based fluorescence microscopy. J. Biomed. Opt. 2012, 17, 101518. [Google Scholar] [CrossRef] [Green Version]
- Betzig, E.; Patterson, G.H.; Sougrat, R.; Lindwasser, O.W.; Olenych, S.; Bonifacino, J.S.; Davidson, M.W.; Lippincott-Schwartz, J.; Hess, H.F. Imaging intracellular fluorescent proteins at nanometer resolution. Science 2006, 313, 1642–1645. [Google Scholar] [CrossRef] [Green Version]
- Rust, M.J.; Bates, M.; Zhuang, X. Sub-diffraction-limit imaging by stochastic optical reconstruction microscopy (STORM). Nat. Methods 2006, 3, 793–796. [Google Scholar] [CrossRef] [Green Version]
- Cremer, C.; Masters, B.R. Resolution enhancement techniques in microscopy. Eur. Phys. J. H 2013, 38, 281–344. [Google Scholar] [CrossRef] [Green Version]
- Heintzmann, R.; Cremer, C. Laterally modulated excitation microscopy: Improvement of resolution by using a diffraction grating. In Optical Biopsies and Microscopic Techniques III; Proc. SPIE 3568; SPIE Press: Bellingham, WA, USA, 1999; pp. 185–196. [Google Scholar] [CrossRef]
- Gustafsson, M.G.L.; Shao, L.; Carlton, P.M.; Wang, C.J.R.; Golubovskaya, I.N.; Cande, W.Z.; Agard, D.A.; Sedat, J.W. Three-dimensional resolution doubling in wide-field fluorescence microscopy by structured illumination. Biophys. J. 2008, 94, 4957–4970. [Google Scholar] [CrossRef] [PubMed] [Green Version]
- Gustafsson, M.G.L. Surpassing the lateral resolution limit by a factor of two using structured illumination microscopy. J. Microsc. 2000, 198 Pt 2, 82–87. [Google Scholar] [CrossRef] [Green Version]
- Förster, R.; Lu-Walther, H.-W.; Jost, A.; Kielhorn, M.; Wicker, K.; Heintzmann, R. Simple structured illumination microscope setup with high acquisition speed by using a spatial light modulator. Opt. Express 2014, 22, 20663–20677. [Google Scholar] [CrossRef] [PubMed]
- Richter, V.; Piper, M.; Wagner, M.; Schneckenburger, H. Increasing Resolution in Live Cell Microscopy by Structured Illumination (SIM). Appl. Sci. 2019, 9, 1188. [Google Scholar] [CrossRef] [Green Version]
- Chen, Y.; Cao, R.; Liu, W.; Zhu, D.; Zhang, Z.; Kuang, C.; Liu, X. Widefield and total internal reflection fluorescent structured illumination microscopy with scanning galvo mirrors. J. Biomed. Opt. 2018, 23, 1–9. [Google Scholar] [CrossRef] [PubMed] [Green Version]
- Kahn, S.E.; Hull, R.L.; Utzschneider, K.M. Mechanisms linking obesity to insulin resistance and type 2 diabetes. Nature 2006, 444, 840–846. [Google Scholar] [CrossRef]
- Klip, A. The many ways to regulate glucose transporter 4. Appl. Physiol. Nutr. Metab. 2009, 34, 481–487. [Google Scholar] [CrossRef]
- Axelrod, D. Cell-substrate contacts illuminated by total internal reflection fluorescence. J. Cell Biol. 1981, 89, 141–145. [Google Scholar] [CrossRef] [Green Version]
- Schneckenburger, H. Total internal reflection fluorescence microscopy: Technical innovations and novel applications. Curr. Opin. Biotechnol. 2005, 16, 13–18. [Google Scholar] [CrossRef]
- Axelrod, D. Selective imaging of surface fluorescence with very high aperture microscope objectives. J. Biomed. Opt. 2001, 6, 6–13. [Google Scholar] [CrossRef]
- Brunstein, M.; Wicker, K.; Hérault, K.; Heintzmann, R.; Oheim, M. Full-field dual-color 100-nm super-resolution imaging reveals organization and dynamics of mitochondrial and ER networks. Opt. Express. 2013, 21, 26162–26173. [Google Scholar] [CrossRef] [PubMed]
- Young, L.J.; Ströhl, F.; Kaminski, C.F. A Guide to Structured Illumination TIRF Microscopy at high speed with multiple colors. J. Vis. Exp. 2016, 111, e53988. [Google Scholar] [CrossRef] [PubMed]
- Guo, M.; Chandris, P.; Giannini, J.P.; Trexler, A.J.; Fischer, R.; Chen, J.; Vishwasrao, H.D.; Rey-Suarez, I.; Wu, Y.; Wu, X.; et al. Single-shot super-resolution total internal reflection fluorescence microscopy. Nat. Methods 2018, 15, 425–428. [Google Scholar] [CrossRef] [PubMed]
- Nakano, A. Spinning-disk confocal microscopy—A cutting-edge tool for imaging of membrane traffic. Cell Struct. Funct. 2002, 27, 349–355. [Google Scholar] [CrossRef] [Green Version]
- Schneckenburger, H.; Richter, V.; Wagner, M. Live-Cell Optical Microscopy with Limited Light Doses; SPIE Spotlight Series; SPIE Press: Bellingham, WA, USA, 2018; Volume SL 42, ISBN 9781510622593. [Google Scholar] [CrossRef]
- Schulz, O.; Pieper, C.; Clever, M.; Pfaff, J.; Ruhlandt, A.; Kehlenbach, R.H.; Wouters, F.S.; Großhans, J.; Bunt, G.; Enderlein, J. Resolution doubling in fluorescence microscopy with confocal spinning-disk image scanning microscopy. Proc. Natl. Acad. Sci. USA 2013, 110, 21001. [Google Scholar] [CrossRef] [PubMed] [Green Version]
- Müller, C.B.; Enderlein, J. Image Scanning Microscopy. Phys. Rev. Lett. 2010, 104, 198101. [Google Scholar] [CrossRef] [PubMed]
- De Luca, G.M.R.; Breedijk, R.M.P.; Brandt, R.A.J.; Zeelenberg, C.H.C.; De Jong, B.E.; Timmermans, W.; Azar, L.N.; Hoebe, R.A.; Stallinga, S.; Manders, E.M.M. Re-scan confocal microscopy: Scanning twice for better resolution. Biomed. Opt. Express 2013, 4, 2644–2656. [Google Scholar] [CrossRef] [PubMed]
- Denk, W.; Strickler, J.H.; Webb, W.W. Two-photon laser scanning fluorescence microscopy. Science 1990, 248, 73–76. [Google Scholar] [CrossRef] [Green Version]
- König, K. Multiphoton microscopy in life sciences. J. Microsc. 2000, 200 Pt 2, 83–104. [Google Scholar] [CrossRef]
- Wildanger, D.; Medda, R.; Kastrup, L.; Hell, S.W. A compact STED microscope providing 3D nanoscale resolution. J. Microsc. 2009, 236, 35–43. [Google Scholar] [CrossRef]
- Balzarotti, F.; Eilers, Y.; Gwosch, K.C.; Gynnå, A.H.; Westphal, V.; Stefani, F.D.; Elf, J.; Hell, S.W. Nanometer resolution imaging and tracking of fluorescent molecules with minimal photon fluxes. Science 2017, 355, 606–612. [Google Scholar] [CrossRef] [PubMed] [Green Version]
- Chen, B.-C.; Legant, W.R.; Wang, K.; Shao, L.; Milkie, D.E.; Davidson, M.W.; Janetopoulos, C.; Wu, X.S.; Hammer, J.A.; Liu, Z.; et al. Lattice light-sheet microscopy: Imaging molecules to embryos at high spatiotemporal resolution. Science 2014, 346, 1257998. [Google Scholar] [CrossRef] [PubMed] [Green Version]
- Miller, D.R.; Jarrett, J.W.; Hassan, A.M.; Dunn, A.K. Deep Tissue Imaging with Multiphoton Fluorescence Microscopy. Curr. Opin. Biomed. Eng. 2017, 4, 32–39. [Google Scholar] [CrossRef] [PubMed]
- Markwirth, A.; Lachetta, M.; Mönkemöller, V.; Heintzmann, R.; Hübner, W.; Huser, T.; Müller, M. Video-rate multi-color structured illumination microscopy with simultaneous real-time reconstruction. Nat. Commun. 2019, 10, 4315. [Google Scholar] [CrossRef]
- Zimmermann, T. Spectral imaging and linear unmixing in light microscopy. Adv. Biochem. Eng. Biotechnol. 2005, 95, 245–265. [Google Scholar] [CrossRef]
- Hanley, Q.S.; Murray, P.I.; Forde, T.S. Microspectroscopic fluorescence analysis with prism-based imaging spectrometers: Review and current studies. Cytom. A 2006, 69, 759–766. [Google Scholar] [CrossRef]
- Weber, P.; Wagner, M.; Kioschis, P.; Kessler, W.; Schneckenburger, H. Tumor cell differentiation by label-free fluorescence microscopy. J. Biomed. Opt. 2012, 17, 101508. [Google Scholar] [CrossRef] [Green Version]
- Squire, A.; Verveer, P.J.; Bastiaens, P.I. Multiple frequency fluorescence lifetime imaging microscopy. J. Microsc. 2000, 197, 136–149. [Google Scholar] [CrossRef] [Green Version]
- Schneckenburger, H.; Wagner, M.; Kretzschmar, M.; Strauss, W.S.; Sailer, R. Laser-assisted fluorescence microscopy for measuring cell membrane dynamics. Photochem. Photobiol. Sci. 2004, 3, 817–822. [Google Scholar] [CrossRef]
- Suhling, K.; French, P.M.; Phillips, D. Time-resolved fluorescence microscopy. Photochem. Photobiol. Sci. 2005, 4, 13–22. [Google Scholar] [CrossRef]
- Chen, H.; Holst, G.; Gratton, E. Modulated CMOS camera for fluorescence lifetime microscopy. Microsc. Res. Tech. 2015, 78, 1075–1081. [Google Scholar] [CrossRef] [PubMed] [Green Version]
- Becker, W. Fluorescence lifetime imaging—Techniques and applications. J. Microsc. 2012, 247, 119–136. [Google Scholar] [CrossRef] [PubMed]
- Förster, T. Zwischenmolekulare Energiewanderung und Fluoreszenz. Ann. Phys. 1948, 437, 55–75. [Google Scholar] [CrossRef]
- Schneckenburger, H.; Weber, P.; Wagner, M.; Enderle, S.; Kalthof, B.; Schneider, L.; Herzog, C.; Weghuber, J.; Lanzerstorfer, P. Combining TIR and FRET in molecular test systems. Int. J. Mol. Sci. 2019, 20, 648. [Google Scholar] [CrossRef] [PubMed] [Green Version]
- Richter, V.; Bruns, S.; Bruns, T.; Weber, P.; Wagner, M.; Cremer, C.; Schneckenburger, H. Axial Tomography in Live Cell Laser Microscopy. J. Biomed. Opt. 2017, 22, 91505. [Google Scholar] [CrossRef] [PubMed] [Green Version]
- Richter, V.; Lanzerstorfer, P.; Weghuber, J.; Schneckenburger, H. Super-resolution live cell microscopy of membrane-proximal fluorophores. Int. J. Mol. Sci. 2020, 21, 7099. [Google Scholar] [CrossRef] [PubMed]
- Stock, K.; Sailer, R.; Strauss, W.S.L.; Lyttek, M.; Steiner, R.; Schneckenburger, H. Variable-angle total internal reflection fluorescence microscopy (VA-TIRFM): Realization and application of a compact illumination device. J. Microsc. 2003, 211, 19–29. [Google Scholar] [CrossRef]
- Wagner, M.; Weber, P.; Baumann, H.; Schneckenburger, H. Nanotopology of cell adhesion upon variable-angle total internal reflection fluorescence microscopy (VA-TIRFM). J. Vis. Exp. 2012, 68, e4133. [Google Scholar] [CrossRef] [Green Version]
- Lazzari, G.; Couvreur, P.; Mura, S. Multicellular tumor spheroids: A relevant 3D model for the in vitro preclinical investigation of polymer nanomedicines. Polym. Chem. 2017, 8, 4947–4969. [Google Scholar] [CrossRef] [Green Version]
- Johnson, M.D.; Bryan, G.T.; Reznikoff, C.A. Serial cultivation of normal rat bladder epithelial cells in vitro. J. Urol. 1985, 133, 1076–1081. [Google Scholar] [CrossRef]
- Dusny, C.; Grünberger, A.; Probst, C.; Wiechert, W.; Kohlheyer, D.; Schmid, A. Technical bias of microcultivation environments on single cell physiology. Lab. Chip 2015, 15, 1822–1834. [Google Scholar] [CrossRef] [PubMed] [Green Version]
- Weber, B.; Schickinger, S.; Wagner, M.; Angres, B.; Bruns, T.; Schneckenburger, H. Monitoring of apoptosis in 3D cell cultures by FRET and light sheet fluorescence microscopy. Int. J. Mol. Sci. 2015, 16, 5375–5385. [Google Scholar] [CrossRef] [PubMed] [Green Version]
- Costa, E.C.; Silva, D.N.; Moreira, A.F.; Correia, I.J. Optical clearing methods: An overview of the techniques used for the imaging of 3D spheroids. Biotechnol. Bioeng. 2019, 116, 2742–2763. [Google Scholar] [CrossRef] [PubMed]
- Sdobnov, A.Y.; Lademann, J.; Darvin, M.E.; Tuchin, V.V. Methods for Optical Skin Clearing in Molecular Optical Imaging in Dermatology. Biochemistry 2019, 84 (Suppl. S1), S144–S158. [Google Scholar] [CrossRef]
- Susaki, E.A.; Tainaka, K.; Perrin, D.; Yukinaga, H.; Kuno, A.; Ueda, H.R. Advanced CUBIC protocols for whole-brain and whole-body clearing and imaging. Nat. Protoc. 2015, 10, 1709–1727. [Google Scholar] [CrossRef] [Green Version]
- Costantini, I.; Cicchi, R.; Silvestri, L.; Vanzi, F.; Pavone, F.S. In-Vivo and ex-vivo optical clearing methods for biological tissues: Review. Biomed. Opt. Express. 2019, 10, 5251–5267. [Google Scholar] [CrossRef] [PubMed]
- Wassie, A.T.; Zhao, Y.; Boyden, E.S. Expansion Microscopy: Principles and Uses in Biological Research. Nat. Methods 2019, 16, 33–41. [Google Scholar] [CrossRef]
- Sharpe, J. Optical projection tomography. Annu. Rev. Biomed. Eng. 2004, 6, 209–228. [Google Scholar] [CrossRef]
- Bruns, T.; Schickinger, S.; Schneckenburger, H. Sample holder for axial rotation of specimens in 3D Microscopy. J. Microsc. 2015, 260, 30–36. [Google Scholar] [CrossRef]
- Huisken, J.; Stainier, D.Y.R. Selective plane illumination microscopy techniques in developmental biology. Development 2009, 136, 1963–1975. [Google Scholar] [CrossRef] [Green Version]
- de Medeiros, G.; Balázs, B.; Hufnagel, L. Light-sheet imaging of mammalian development. Semin. Cell Dev. Biol. 2016, 55, 148–155. [Google Scholar] [CrossRef] [PubMed]
- Strobl, F.; Stelzer, E.H.K. Long-term fluorescence live imaging of Tribolium castaneum embryos: Principles, resources, scientific challenges and the comparative approach. Curr. Opin. Insect Sci. 2016, 18, 17–26. [Google Scholar] [CrossRef] [PubMed]
- Power, R.M.; Huisken, J. A guide to light-sheet fluorescence microscopy for multiscale imaging. Nat. Methods 2017, 14, 360–373. [Google Scholar] [CrossRef] [PubMed]
- Veerapathiran, S.; Wohland, T. Fluorescence techniques in developmental biology. J. Biosci. 2018, 43, 541–553. [Google Scholar] [CrossRef] [PubMed]
- Hu, Y.S.; Zimmerley, M.; Li, Y.; Watters, R.; Cang, H. Single-molecule super-resolution light-sheet microscopy. Chem. Phys. Chem. 2014, 15, 577–586. [Google Scholar] [CrossRef] [PubMed]
- Weber, M.; Huisken, J. Light sheet microscopy for real-time developmental biology. Curr. Opin. Genet. Dev. 2011, 21, 566–572. [Google Scholar] [CrossRef]
- Schmied, C.; Tomancak, P. Sample Preparation and Mounting of Drosophila Embryos for Multiview Light Sheet Microscopy. Methods Mol. Biol. 2016, 1478, 189–202. [Google Scholar] [CrossRef]
- Schneckenburger, H.; Richter, V.; Gelleri, M.; Ritz, S.; Vaz Pandolfo, S.; Schock, F.; Hase, J.; Birk, U.; Cremer, C. High resolution deep view microscopy of cells and tissues. Quantum Electron. 2020, 50, 2–8. [Google Scholar] [CrossRef]
- Vettenburg, T.; Corral, A.; Rodríguez-Pulido, A.; Flors, C.; Ripoll, J. Photoswitching-Enabled Contrast Enhancement in Light Sheet Fluorescence Microscopy. ACS Photonics 2017, 4, 424–428. [Google Scholar] [CrossRef]
- Brunstein, M.; Cattoni, A.; Estrada, L.; Yacomotti, A.M. Improving image contrast in fluorescence microscopy with nanostructured substrates. Opt. Express 2015, 23, 29772–29778. [Google Scholar] [CrossRef] [Green Version]
Figure 1.
Principle of Optical-Sectioning Structured Illumination Microscopy (OS-SIM).

Figure 2.
3D imaging of CHO-pAcGFP1-Memcell spheroids with membrane-associated Green Fluorescent Protein (GFP). Light Sheet Fluorescence Microscopy (LSFM) using rectangular micro-capillaries (scheme, two single planes and 3D reconstruction); beam waist: Δz = 5–10 µm, focal depth: Δy = 100–200 µm (reproduced from Ref. [8] with modifications).

Figure 3.
Fluorescence image of CHO-K1-hIR-myc-GLUT4-GFP cells upon stimulation by insulin (1 µM; 60 min): (a) Wide-field microscopy with Wiener filter; (b) comparison of filtered wide-field (upper part) and super-resolution microscopy by (coherent) structured illumination (SR-SIM) (lower part) for a selected field; (c) line scan with Gaussian fit over a marked range of 0.8 µm across the plasma membrane for filtered wide-field and SIM; excitation wavelength: λ0 = 488 nm; detection range: λD ≥ 515 nm; Plan Neofluar 40×/1.30 oil immersion objective lens.

Figure 4.
Principle of a confocal laser scanning microscope (CLSM); only a confocal beam passes the pinhole, while non-confocal beams are blocked (reproduced from Ref. [27] with modifications).
Figure 4.
Principle of a confocal laser scanning microscope (CLSM); only a confocal beam passes the pinhole, while non-confocal beams are blocked (reproduced from Ref. [27] with modifications).

Figure 5.
Principle of axial tomography. Optimization of the point-spread function in view of an isotropic high resolution (a,b); MCF-7 breast carcinoma cell incubated with 20 nm quantum dots (c); fluorescence under 0° (top view) and 90° (side view calculated from a z-stack at 0° or measured after rotation, (d); laser scanning microscopy using a 63/0.9 water immersion objective lens; λex = 488 nm, λem ≥ 560 nm.

Figure 6.
Wide-field fluorescence microscopy of 2D cell cultures: (a) Autofluorescence of U251-MG glioblastoma cells (dominated by the coenzyme NADH); (b) BKEz-7 endothelial cells incubated with the fluorescent marker rhodamine 123 (5 µM, 45 min.); (c) HeLa cervical carcinoma cells transfected with enhanced yellow fluorescent protein (EYFP) linked to Paxilline upon Total-Internal-Reflection (TIR) excitation (wide-field microscopy with a 40×/0.75 microscope objective lens).

Figure 7.
Comparison of SIM (left) and SIM-Total Internal Reflection Fluorescence Microscopy (TIRFM) (right): CHO-K1-hIR-myc-GLUT4-GFP cells prior to (0 min, upper parts) and subsequent to stimulation (30 min, lower parts) with Bellis perennis extract (common daisy; 10 mg/L); excitation wavelength: λ0 = 488 nm; detection range: λD ≥ 515 nm; Plan Neofluar 40×/1.30 oil immersion (left) or Plan Apochromat 63×/1.46 oil immersion objective lens (right). Reproduced from Ref. [49] with modifications.

Figure 8.
(a) Illumination device for variable-angle TIRFM; (b) single TIRFM image of U251-MG glioblastoma cells incubated with the fluorescence marker laurdan (8 μm; 60 min) for θ = 66°; (c) cell–substrate distances in the range of 0–600 nm calculated from variable-angle TIRFM for the U251-MG wild type, and (d) the same for U251-MG with activated TP53 suppressor gene. Excitation wavelength: λ0 = 391 nm, detection range: λD ≥ 420 nm; image size: 210 μm × 210 μm. Reproduced from Ref. [51] with modifications.

Figure 9.
3D imaging of MCF-7 cell spheroids after incubation with doxorubicin (8 µM, 6 h). Light Sheet Fluorescence Microscopy (LSFM) using rectangular micro-capillaries (scheme, 2 single planes and 3D reconstruction); beam waist: Δz = 5–10 µm, focal depth: Δy = 100–200 µm.
Figure 9.
3D imaging of MCF-7 cell spheroids after incubation with doxorubicin (8 µM, 6 h). Light Sheet Fluorescence Microscopy (LSFM) using rectangular micro-capillaries (scheme, 2 single planes and 3D reconstruction); beam waist: Δz = 5–10 µm, focal depth: Δy = 100–200 µm.

Figure 10.
Light Sheet Fluorescence Microscopy of a 1 mm-thick mouse brain slice stained with Sytox Orange (DNA dye) and cleared with the Cubic clearing method [58]. A z-stack of 31 images with 50 µm spacing was recorded. Representative images from the stack are depicted at depths of 0, 250, 500, and 750 µm; scale bar: 500 µm. Images recorded in cooperation with Marton Gelleri and Sandra Ritz, IMB Mainz.

Figure 11.
Fluorescence microscopy of small organisms: Copepod incubated with Acridine Orange, imaged with Light Sheet Fluorescence Microscopy (left), and a tick, autofluorescence, imaged with Confocal Laser Scanning Microscopy (right). Reproduced from Ref. [62] with modifications.
Figure 11.
Fluorescence microscopy of small organisms: Copepod incubated with Acridine Orange, imaged with Light Sheet Fluorescence Microscopy (left), and a tick, autofluorescence, imaged with Confocal Laser Scanning Microscopy (right). Reproduced from Ref. [62] with modifications.


Table 1.
Summary on wide-field and laser scanning techniques, including lateral (Δx) and axial (Δz) resolution for high or moderate numerical aperture AN (used for single-cell monolayers or 3D Scheme 10. J/cm2) [27].
Table 1.
Summary on wide-field and laser scanning techniques, including lateral (Δx) and axial (Δz) resolution for high or moderate numerical aperture AN (used for single-cell monolayers or 3D Scheme 10. J/cm2) [27].
| Resolution Lateral/Axial (AN = 1.40) | Resolution Lateral/Axial (AN = 0.50) | Typ. Rec. Time, No. of Raw Images (Per Image) | No. of Images at W/A ≤ 10 J/cm2 [27] | |
|---|---|---|---|---|
| Wide-field | ||||
| Conventional | Δx ≤ 200 nm Δz not defined | Δx ≤ 500 nm Δz not defined | Δt = 0.01–1 s n = 1 | N ≥ 100 |
| OS-SIM | Δx ≤ 200 nm Δz ~ 300 nm | Δx ≤ 500 nm Δz ~ 2.4 µm | Δt = 0.1–5 s n ≥ 3 | N = 30–40 |
| SR-SIM | Δx ~ 100 nm Δz = 200 nm [13] | not suitable | Δt = 0.1–10 s n ≥ 9 | N = 10–15 |
| Light Sheet | Δx = 200 nm Δz ≥ 280 nm [35] | Δx = 200 nm Δz ~ 1 µm (**) | Δt = 0.1–1 s n = 1 | N ≥ 100 |
| TIRFM/TIRF-SIM (fixed angle) | Δx = 100–200 nm Δz = 100 nm [21] | Δx ≤ 500 nm Δz = 100 nm | Δt = 0.1–1 s n = 1 | N = 100–300 |
| Single-Molecule Localization | Δx ~ 10 nm Δz ~ 100 nm (TIRF) | not suitable | Δt ≥ 30 s n = 1 | N ≤ 1 |
| Laser scanning | ||||
| CLSM | Δx = 200 nm Δz = 400 nm | Δx = 500 nm Δz = 2 µm | Δt = 0.1–5 s n = 1 | N ~ 20 |
| Spinning disk | Δx = 200 nm Δz = 400 nm | Δx = 500 nm Δz = 2 µm | Δt = 10−3–10−1 s n = 1 | N ~ 200 (*) |
| Airy Scan, Image Scan, Re-Scan | Δx ~ 100 nm Δz ~ 200 nm (*) | not relevant | Δt = 0.1–5 s n = 1 | N ~ 20 (*) |
| Multiphoton (***) | Δx ≥ 200 nm Δz ≥ 400 nm | Δx ≥ 500 nm Δz ≥ 2 µm | Δt = 0.1–5 s n = 1 | N ≥ 100 (*) |
| STED | Δx = 30–70 nm Δz ≥ 100 nm (*) | not relevant | Δt = 0.1–5 s n = 1 | N ≤ 1 |
(*): Estimated values; (**): For reasons of a high depth of focus, numerical apertures AN ≤ 0.10 are often used, resulting in light sheets Δz ≥ 5 µm; (***): A superposition of two or more photons reduces the illuminated light spot, but this effect is compensated by the generally longer wavelength related to photons.
Publisher’s Note: MDPI stays neutral with regard to jurisdictional claims in published maps and institutional affiliations. |
© 2021 by the authors. Licensee MDPI, Basel, Switzerland. This article is an open access article distributed under the terms and conditions of the Creative Commons Attribution (CC BY) license (http://creativecommons.org/licenses/by/4.0/).
Share and Cite
MDPI and ACS Style
Schneckenburger, H.; Richter, V. Laser Scanning versus Wide-Field—Choosing the Appropriate Microscope in Life Sciences. Appl. Sci. 2021, 11, 733. https://doi.org/10.3390/app11020733
AMA Style
Schneckenburger H, Richter V. Laser Scanning versus Wide-Field—Choosing the Appropriate Microscope in Life Sciences. Applied Sciences. 2021; 11(2):733. https://doi.org/10.3390/app11020733
Chicago/Turabian StyleSchneckenburger, Herbert, and Verena Richter. 2021. "Laser Scanning versus Wide-Field—Choosing the Appropriate Microscope in Life Sciences" Applied Sciences 11, no. 2: 733. https://doi.org/10.3390/app11020733
Note that from the first issue of 2016, this journal uses article numbers instead of page numbers. See further details here.