Article

Authentication of Rice (Oryza sativa L.) Using Near Infrared Spectroscopy Combined with Different Chemometric Classification Strategies

by
Duy Le Nguyen Doan
1,2,
Quoc Cuong Nguyen
1,2,
Federico Marini
3 and
Alessandra Biancolillo
4,*
1
Department of Food Technology, Ho Chi Minh City University of Technology (HCMUT), Ho Chi Minh City 70000, Vietnam
2
Vietnam National University Ho Chi Minh City, Ho Chi Minh City 70000, Vietnam
3
Department of Chemistry, University of Rome “La Sapienza”, Piazzale Aldo Moro 5, 00185 Rome, Italy
4
Department of Physical and Chemical Sciences, University of L’Aquila, Via Vetoio, Coppito, 67100 L’Aquila, Italy
*
Author to whom correspondence should be addressed.
Appl. Sci. 2021, 11(1), 362; https://doi.org/10.3390/app11010362
Submission received: 7 December 2020 / Revised: 27 December 2020 / Accepted: 29 December 2020 / Published: 1 January 2021
(This article belongs to the Special Issue Application of Spectroscopy in Food Analysis: Volume II)

Abstract

:
Rice is a staple food in Vietnam, and the concern about rice is much greater than that for other foods. Preventing fraud against this product has become increasingly important in order to protect producers and consumers from possible economic losses. The possible adulteration of this product is done by mixing, or even replacing, high-quality rice with cheaper rice. This highlights the need for analytical methodologies suitable for its authentication. Given this scenario, the present work aims at testing a rapid and non-destructive approach to detect adulterated rice samples. To fulfill this purpose, 200 rice samples (72 authentic and 128 adulterated samples) were analyzed by near infrared (NIR) spectroscopy coupled, with partial least squares-discriminant analysis (PLS-DA) and soft independent modeling of class analogies (SIMCA). The two approaches provided different results; while PLS-DA analysis was a suitable approach for the purpose of the work, SIMCA was unable to solve the investigated problem. The PLS-DA approach provided satisfactory results in discriminating authentic and adulterated samples (both 5% and 10% counterfeits). Focusing on authentic and 10%-adulterated samples, the accuracy of the approach was even better (with a total classification rate of 82.6% and 82.4%, for authentic and adulterated samples, respectively).

1. Introduction

Rice (Oryza sativa L.) has increasingly become a hugely important staple food worldwide, and its consumption has surged as a result of population growth, changing food preferences, and urbanization [1]. Vietnam is among the top-five leading net exporters of rice and, while quantity is no longer the main problem, high quality is important to serve the high-end market segments. From 2015 to 2018, Vietnam’s rice price increased at a fast pace, from 334 to 391 USD/ton, but then suddenly dropped to only 323 USD/ton in 1 year [2]. Not only the export market, but also the domestic market is facing the same problem: high volume but low value. Currently, it is estimated that more than 130 different types of rice brand exist on the market, and no brand accounts for more than 3% of the market. This means that Vietnam’s rice market is considered as “fragmented”, and only a few businesses have a clear vision for branding.
The benefit race is more intense than ever, so fraud is one way that some producers choose to get an advantage in this game. This can be done easily when high-quality rice can be mixed with, or even replaced by, cheaper rice. Rice products are particularly vulnerable, and become a “prime target” of these frauds, as an additional processing step is included, and adulteration cannot easily be detected by visual examination alone. Moreover, with low awareness, limited knowledge about rice, and a loose tracing system, consumers and even some trading companies cannot distinguish or identify counterfeit products. Consequently, a reliable and highly reproducible technique that can effectively authenticate blended products with excellent sensitivity and accuracy is urgently needed.

Techniques Used in Rice Authentication

Given the importance rice has on a global level, in the literature it is possible to find several studies aimed at the analysis and characterization of this agro-food.
In this regard, several analytical approaches have been tested. For instance, inductively coupled plasma atomic emission spectroscopy and isotopic data coupled with chemometrics have been used to classify rice according to the variety or quality [3,4,5,6,7,8,9,10,11,12,13].
Nevertheless, due to the market value of this product, non-destructive approaches are generally preferred. Hence, imaging analysis has been proposed for the characterization and quality assessment of rice [3], as, for instance, has been done by Kuo et al. [14], where the images collected by a digital camera were elaborated and used to classify 30 different varieties of rice. In addition, spectroscopy represents a suitable non-destructive (or semi-destructive) solution. For instance, 1H-NMR has been used for discriminating rice according to its geographical origin [15], and lased-induced fluorescence to classify according to the variety [16], whereas terahertz spectroscopy imaging has been exploited to detect transgenic rice [17].
Despite the efficiency of traditional approaches, they present a common drawback: the preparation of samples can be time-consuming, as well as economically and environmentally disadvantageous. In this context, near infrared (NIR) spectroscopy has been widely used in the measurement of agricultural products due to its many advantages, such as being easy-to-use, non-destructive, fast and accurate, providing highly reproducible results, requiring minimum or, often, no sample preparation, and allowing the analysis of multiple constituents with a single measurement [18,19,20,21]. Direct spectroscopic measurements have been widely applied for several foods and commodities, especially in the grain, cereal products, and oilseed processing industries [22,23,24,25,26,27,28,29,30]; additionally, they have been successfully applied for the classification of rice [24,25,26,27,28]. Moreover, in the framework of the evaluation of rice quality, NIR spectroscopy has been used for the discrimination of rice [21,29]; the classification of varieties and detection of transgenic rice [31]; the quantification of various physico-chemical properties (such as moisture content, sound whole kernel, whiteness, translucency, color, and amylogram characteristics) [32]; classification of cultivars [33], prediction of protein and amylase content [34,35]; detection of wax rice [36]; and prediction of eating quality [37].
In this regard, the present paper aims at developing a non-destructive analytical methodology for detecting rice adulteration using a hand-held NIR spectrometer. Classification models were built using two different chemometric techniques, which often coupled with NIR spectroscopy, in particular for the analysis of plants and agro-food products [38,39]: partial least squares discriminant analysis (PLS-DA) and soft independent modelling of class analogy (SIMCA).

2. Materials and Methods

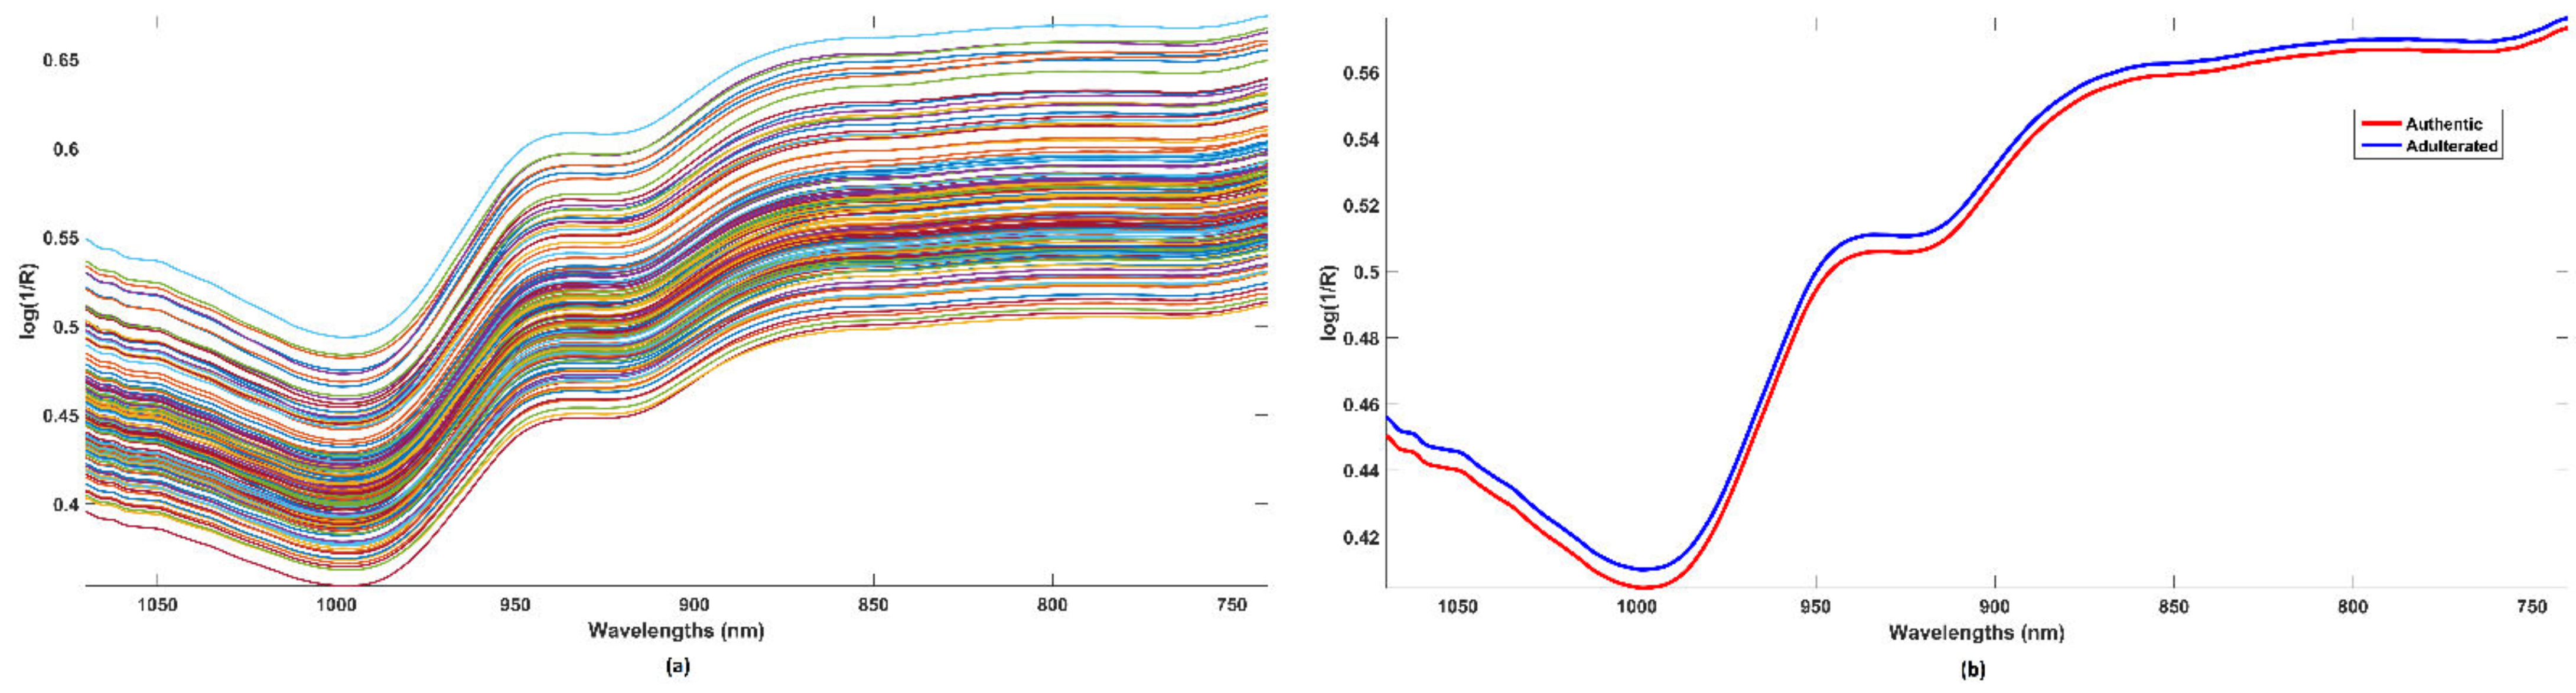
2.1. Spectral Acquisition

The spectrum of each rice sample was collected using a hand-held spectrometer SCIO™ (Consumer Physics, Inc., Saint Cloud, MN), with a spectral range between 740 nm and 1070 nm at a 1-nm resolution. Samples (50 g) were collected in glass containers, and scanned three times after rotating the cup. The whole process was carried out at ambient temperature.

2.2. Rice Data Set

Rice samples were collected across different seasons from local millers, and from four regions in Vietnam. Authentic samples were high-quality rice (namely J85), while adulterated samples were obtained by the addition of two different percentages (5% and 10%, given in w/w%) of lower quality rice (namely DT8).
Jasmine 85 (J85) is an aromatic rice variety developed in Thailand by the International Rice Research Institute from a cross between IR262-43-8-11 and KHAO DAWK MALI 4-2-105. J85 was imported to Vietnam in 1993 by the Cuu Long Delta Rice Research Institute, and mostly cultivated in 13 provinces in the Mekong Delta. This variety has many outstanding characteristics, such as a good-looking grain, and amylose content (around 18-20%). When cooked, the rice has a medium grain cooking quality, soft texture, and is cohesive.
Dai Thom 8 (DT8) is a rice variety cultivated in different places, from the Mekong Delta to the Central Highlands and Central Coast. This variety produces long, clear, silver-brown rice, with an incredibly low amylose content (around 16.29%). When cooked, the rice has a light, soft, fragrant aroma.
Authentic samples (J85) were collected from 4 provinces in the Mekong Delta: Can Tho, An Giang, Dong Thap, and Hau Giang from 2 factories during 3 seasons (Monsoon, Summer-Autumn, Winter-Spring), for a total of 24 lots. Each lot was further sampled three times; therefore, there were 72 high-quality rice samples (Authentic rice).
DT8 samples were obtained from the same provinces and factories as the authentic ones, and were collected across the same three seasons. For the preparation of the adulterated samples, each J85 rice resulting from the combination of a particular region and factory was cross-mixed with any of the region/factory combinations of DT8 rice at both 5% and 10% ratios. Despite the season not being explicitly considered as an additional combinatorial factor, care was taken that all the three seasons were fairly represented in the adulterated samples. Accordingly, 64 adulterated samples at 5% addition, and 64 adulterated samples at 10% addition, were available for the analysis.
As the main purpose was to discriminate high-quality rice from adulterated rice, the two groups with 5% and 10% addition were collected together into a single class of adulterated samples; consequently, 128 adulterated samples (Adulterated rice) were used for this study. Prior to the creation of the classification models, replicated measurements were averaged, obtaining a data matrix of dimensions 200 × 331.
The spectra were split by the Duplex algorithm [40] into a training set, used for the calibration of the models, and a test set, which was only used for their external validation. The most appropriate data-preprocessing approach, and the number of latent variables (LVs) to be extracted, were chosen in a 5-fold cross-validation procedure on the calibration samples only.

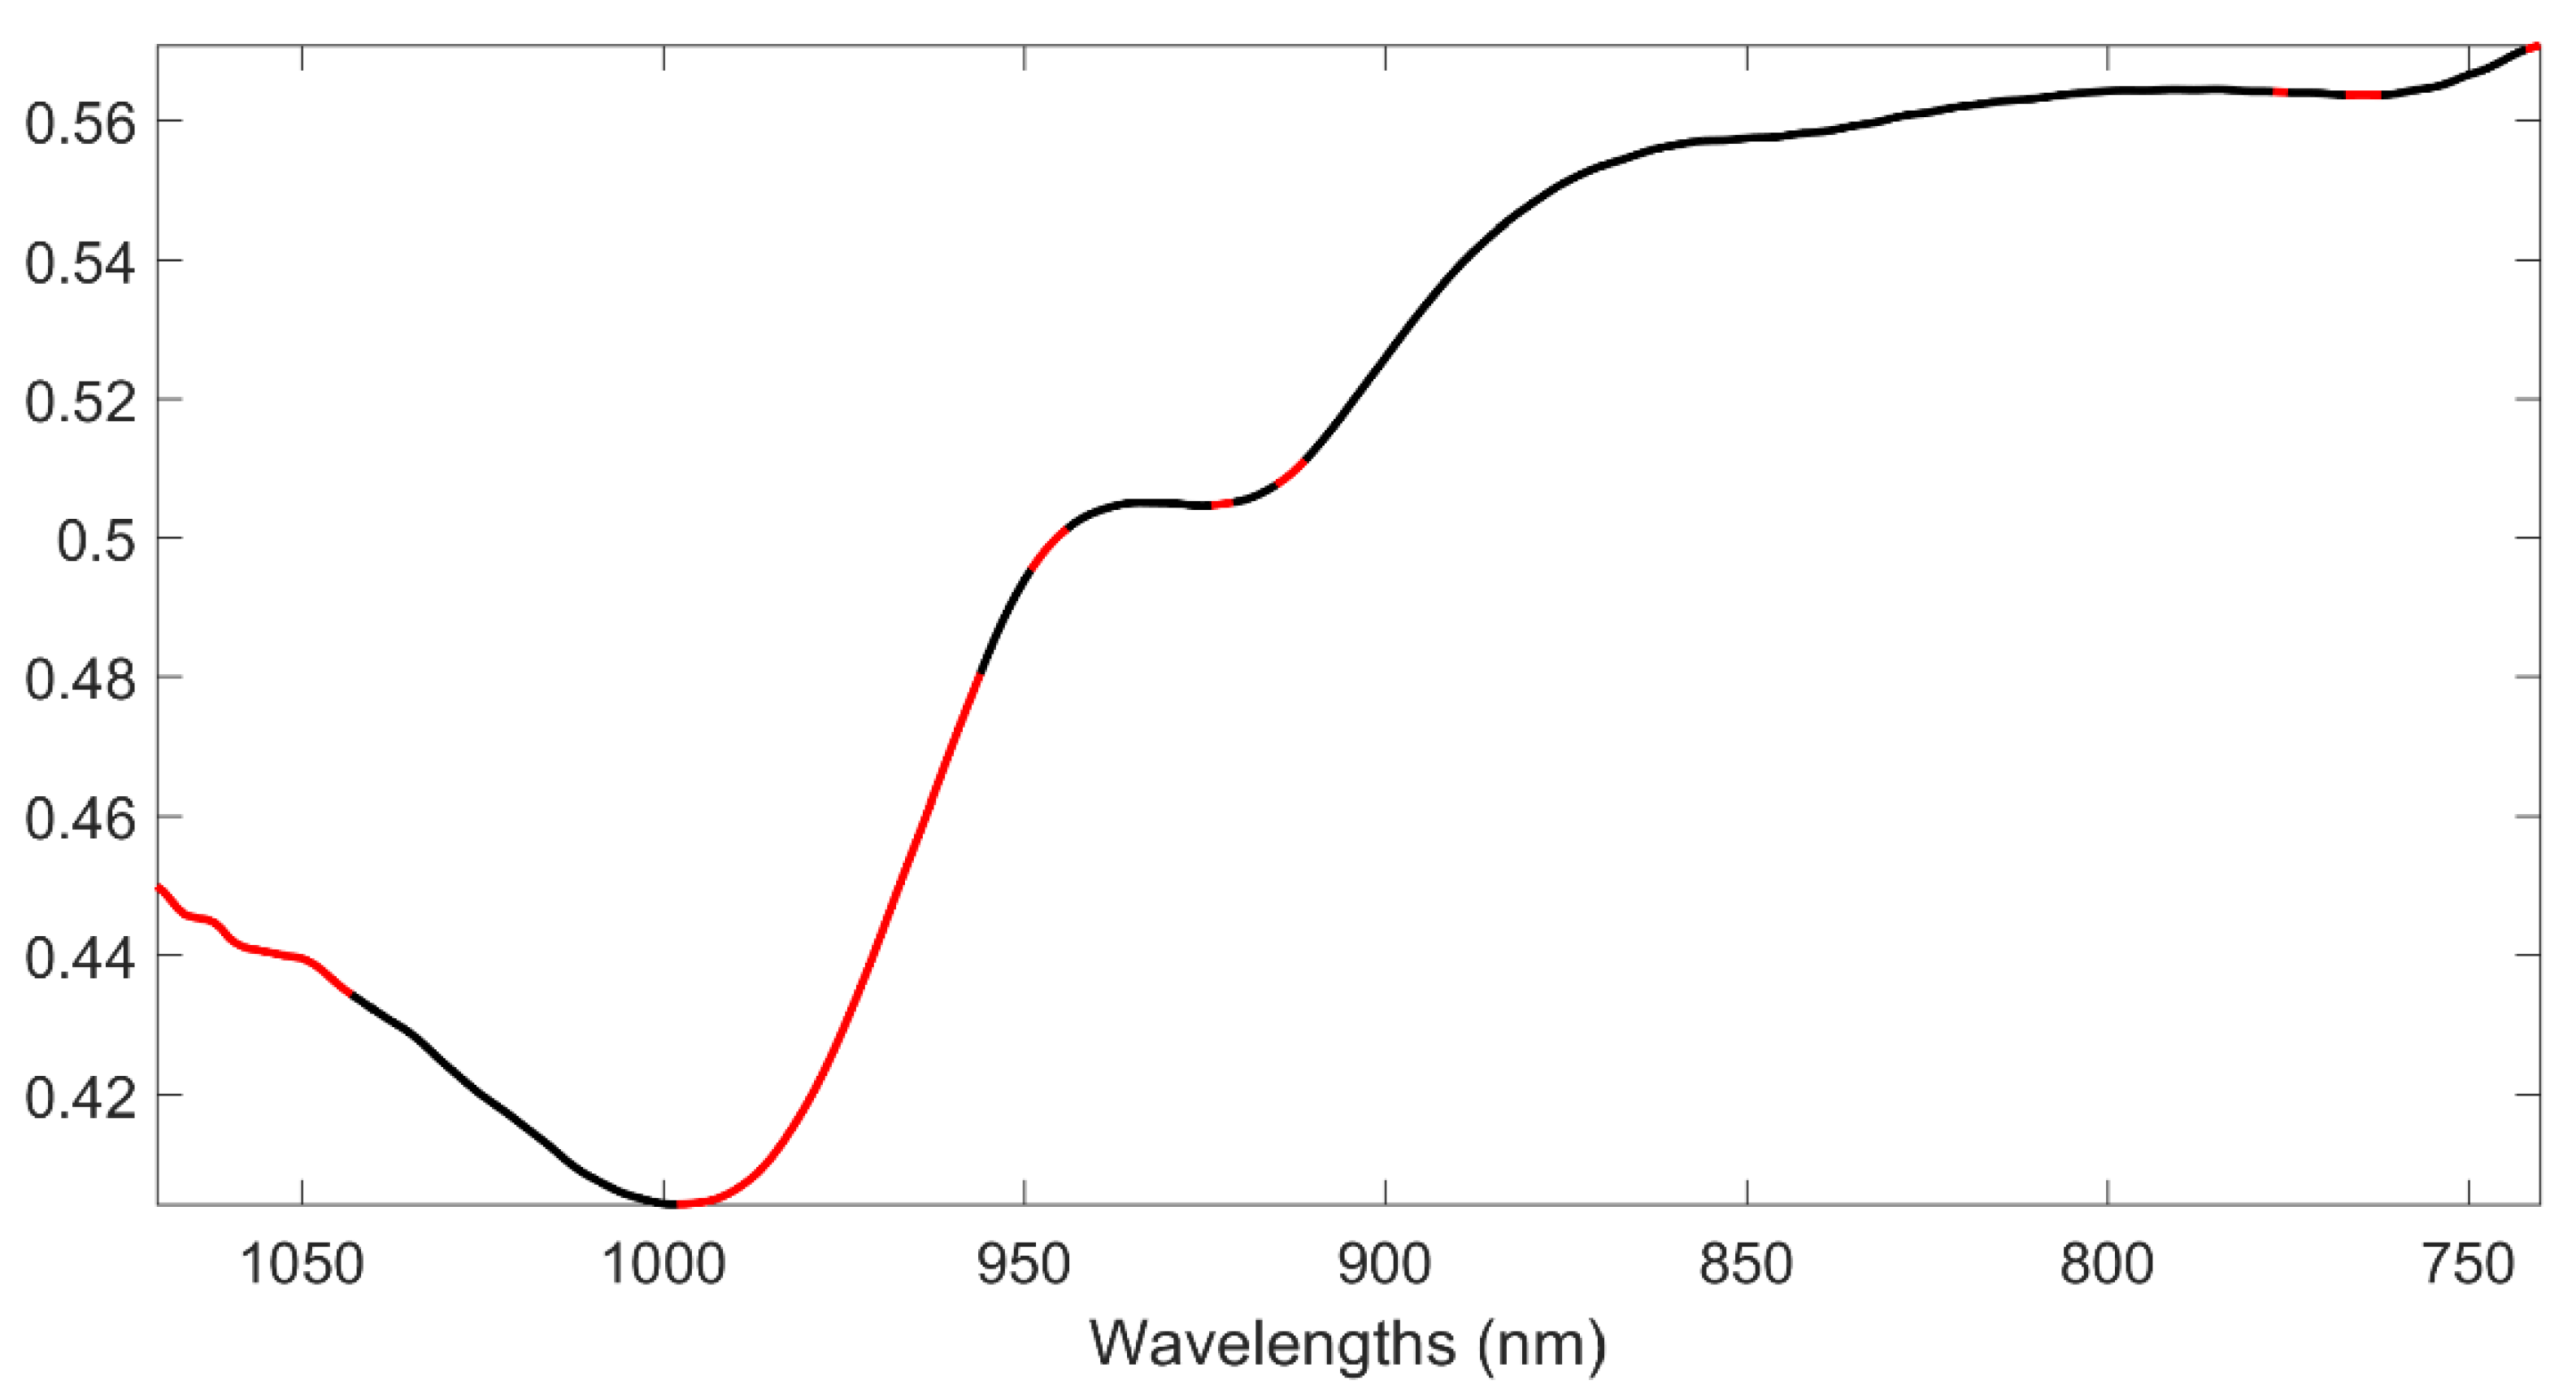
2.3. Spectral Preprocessing Techniques

Different signal preprocessing approaches were applied to the profiles [41]: the first and second derivative [42], and the standard normale variate (SNV) [43]. This step was necessary to remove the non-informative variability present in the spectra. First and the second derivatives were calculated according to the Savitzky–Golay (SG) approach [42] using a 19 points window and a 2nd or 3rd order polynomial. Each spectrum was mean centered (MC) prior to the creation of the models, to remove the variability due to the offsets differences identifiable with the average trend of the data, and this step was performed either as the only pretreatment step or, in all the other cases, after the application of other preprocessing methods.

2.4. Chemometric Methods

2.4.1. Partial Least Squares Discriminant Analysis (PLS-DA)

Partial least squares discriminant analysis (PLS-DA) [44,45,46,47,48] is a discriminant classifier, and is particularly appropriate for handling correlated features (e.g., spectroscopic variables). Briefly, PLS-DA is based on expressing the classification problem as a regression one, which can be solved by PLS [49,50,51]. More specifically, a predictor block is used to estimate (by PLS) a binary response called dummy Y (a binary response matrix encoding the class-belonging).
In a two-class problem, as in the present study, Y is a dummy vector ( y ) presenting either 1 or 0 in the rows corresponding to objects belonging to Class 1 (Authentic rice) and Class 2 (Adulterated rice), respectively. Mathematically, the regression relation between the data matrix X and the dummy vector y for a two-class case can be represented by the model in Equation (1)
y = y ^ + e = X b + e
where y ^ , b , and e are the vectors of predicted responses, regression coefficients, and residuals, respectively.
After solving the regression problem in Equation (1) by PLS, a further step is needed to achieve classification, since the predicted responses, y ^ , are not binary, but continuous values: accordingly, a suitable classification rule has to be built based on the values of y ^ . One possibility is to use the predicted responses, y ^ , (or the PLS scores) as input for classification methods such as linear discriminant analysis (LDA) or quadratic discriminant analysis (QDA) [52]. In the present study, the threshold was calculated based on the probabilistic approach proposed by Perez and colleagues [53].
When new samples (test set) need to be classified, their predicted responses, y ^ n e w , are calculated based on the measurements, X n e w , and the regression coefficients, b , estimated on the training set, and the classification rule described above is then applied to assign each individual to one of the categories under study.

2.4.2. Soft Independent Modelling of Class Analogies (SIMCA)

SIMCA [54] is a class-modeling approach, meaning that, in defining the class boundaries, the method focuses on the similarities among samples from the same category [55]. In SIMCA, unlike PLS-DA, since every class is individually modeled (i.e., region-boundaries are defined individually for each class and independently from the others), it can happen that an object can be assigned to more than one class (being “confused”) or excluded from every category. SIMCA results are presented in terms of “sensitivity” and “specificity”, where the former indicates the percentage of samples truly belonging to the category correctly accepted by the class model, while the latter expresses the percentage of the objects from other classes which have been correctly rejected.
SIMCA starts from a principal component analysis (PCA) of only the training objects belonging to the category to be modeled, in order to “capture” the systematic variability ascribable to the similarities among samples of the same class [56,57]. Once the PCA is calculated, objects are accepted or refused by the class-model according to their reduced distance from the class space, indicated as d .
For a generic i t h sample, the d value is calculated by Equation (2).
d i = ( T i 2 T 0.95 2 ) 2 + ( Q i Q 0.95 ) 2 = ( T i , r e d 2 ) 2 + Q i , r e d 2
where T 2 is the Mahalanobis distance of the sample from the center of the class space and Q is its orthogonal distance from the PC subspace. These values are divided by T 0.95 2 and Q 0.95 , which are the 95th percentiles of the T 2 and Q distributions, obtaining the reduced T 2 ( T r e d 2 ) and the reduced Q ( Q r e d ), respectively [56]. Due to the normalization, T 2 and Q limit values are equal to 1; a sample will then be accepted by the class model if d 2 , otherwise it is rejected.

2.4.3. Software Details

Calculations were run in MATLAB 2015b (The Mathworks Inc., Natick, MA, USA) using in-house functions. In particular, PLS-DA models were built using the routines freely available for download at: https://www.chem.uniroma1.it/romechemometrics/research/algorithms/plsda/.

3. Results

Prior to the creation of any classification models, the spectra of the analytical replicates were averaged, obtaining 200 NIR signals. Furthermore, in order to allow the external validation of the models, samples were divided into a training set of 140 objects (49 authentic and 91 adulterated), and a test set of 60 individuals (23 authentic and 37 adulterated) by the Duplex algorithm.
The NIR spectra of all the analyzed samples are displayed in Figure 1a, while, in Figure 1b, the average profile for the authentic and adulterated samples are plotted in red and blue, respectively.
Irrespective of the classifier used, NIR signals were pretreated by different preprocessing approaches: besides considering raw data, the first derivative (Savitzky–Golay approach, 15 points window, 2nd order polynomial), second derivative (Savitzky–Golay approach, 15 points window, 3rd order polynomial), and standard normal variate (SNV) were also tested. Prior to the creation of any calibration model, data were further mean-centered.
The most suitable preprocessing approach, together with the optimal complexity (number of LVs or PCs to be extracted) of any classification model, were defined based on a cross-validation procedure (5 cancellation groups). In particular, PLS-DA selection was based on the combination of pre-processing and model complexity leading to the lowest mean classification error, whereas for SIMCA the maximum efficiency (geometric mean of sensitivity and specificity) was sought.

3.1. PLS-DA Analysis

As mentioned above, four different PLS-DA models were calculated on the training samples, one per each tested pre-treatment. Cross-validated classification rates, together with the number of latent variables (LVs) used for the creation of the models, are reported in Table 1.
Inspecting the outcome of the PLS-DA analysis, the first derivative was considered the most suitable preprocessing approach for this data, because the model built on data pretreated by this preprocessing led to the most accurate predictions.
The application of this model to the test set led to a correct classification rate of 63.3%, corresponding to 10 authentic and 12 adulterated samples erroneously assigned. It has to be noted that, among the 12 misclassified adulterated samples, 10 are those with the lowest extent of adulteration (5%).
Consequently, the counterfeited samples with 5% adulteration were removed from the analysis and new PLS-DA models were calculated on the remaining samples. In this way, the training set consisted of 96 objects (49 authentic and 47 adulterated), and the test set of 40 individuals (23 authentic and 17 adulterated). Data were preprocessed as described before, and PLS-DA models were built and cross-validated; the corresponding results are reported in Table 2.
In this case the best calibration model was the one built on data preprocessed by SNV. Its application to the test set led to the correct classification of 82.6% of the authentic samples, and 82.4% of the adulterated objects, corresponding to four (over 23) and three (over 17) misclassified samples, respectively.
Eventually, in order to investigate which spectral variables most influenced the PLS-DA model, the values of the variable importance in projection (VIP) [53] for the individual predictors were inspected, and 82 NIR wavelengths were identified as significantly contributing (based on the greater than one criterion). A graphical representation of the selected bands is reported in Figure 2.
In the plot, variables with a VIP higher than one are highlighted in red, over the mean spectrum of the samples (in black). It can be seen that the spectral ranges contributing the most to the discrimination are those between 1040 and 1070 nm, corresponding to the second overtones of N–H stretching, and O–H stretching; those between 950 to 1000 nm, also corresponding to the second overtone of N–H stretching and of O–H stretching; and some variables between 900 and 950 nm, corresponding to the third overtone of C–H stretching [58,59].
Additionally, a further PLS-DA model was calculated on the data set reduced in agreement with the VIP analysis, but the feature selection did not lead to improvements from a prediction point of view.

3.2. SIMCA Analysis

The distinction of authentic and counterfeit products can be associated with the “asymmetric classification problems”, i.e., all those cases where the interest is on a specific category (authentic) rather than on the other class under examination. These kinds of problems are often solved by means of class-modeling approaches, which focus on identifying the (usually bound) portion of the multivariate space where it is more likely to find individuals from a specific category. For this reason, despite the relatively accurate results obtained by PLS-DA analysis, SIMCA was also used in order to model the authentic class of samples.
The same pre-treatments investigated in the case of PLS-DA analysis were tested as well in the SIMCA context; nevertheless, different figures of merit were used for assessing the optimal preprocessing approach and the number of principal components (PCs) to be extracted. In particular, the outcome of the SIMCA models was reported in terms of sensitivity (the percentage of the authentic samples correctly accepted by the model), specificity (the percentage of the adulterated samples correctly rejected by the model), and efficiency (the geometric average of sensitivity and specificity). The optimal model parameters (pre-treatments and number of PCs) were defined on the basis of the efficiency values resulting from a cross-validation procedure with seven cancelation groups. Similarly to above, four different models were created, one for each pre-treatment; the results are reported in Table 3.
Inspecting Table 3, it is straightforward to see that the models provide very high sensitivity, but, on the contrary, their specificity is definitely low, indicating that adulterated samples were accepted by the model of the authentic class. This leads to generally low efficiencies: the highest one was 32.8%, and it was provided by the model built on NIR signals preprocessed by the second derivative. As expected, the application of this model to the test set was not completely satisfactory; in fact, it led to a sensitivity of 98.0% and a specificity of 11.0%. A possible explanation for these results can be identified in the high heterogeneity of the modeled category (the authentic samples); in order to account for the wide range of variability spanned by the class (different factories, different regions, and different seasons) and to obtain a high sensitivity, the model space needs to be expanded to the point that a high amount of samples of the alternative class is accepted. Altogether, these results indicate that the tested strategy is not suitable for the investigated classification problem.

4. Conclusions

The present study represents a proof-of-concept study to investigate the possibility of coupling NIR spectroscopy and chemometric classifiers with the aim of detecting adulterated rice samples. In order to achieve this goal, two different strategies were exploited; one, based on a discriminant classifier (PLS-DA), and one employing a class-modelling technique (SIMCA). The two approaches provided different results; in particular, SIMCA appeared unable to solve the investigated problem. On the other hand, PLS-DA analysis is a suitable approach for the purpose of the work. In fact, while this approach provided not completely satisfactory results in discriminating authentic and adulterated samples, when considering both 5% and 10% counterfeits (with a total correct classification rate of 63.3%), on the other hand, when the analysis was restricted to the 10%-adulterated samples only, a very good accuracy was achieved. In fact, 82.6% of the authentic samples and 82.4% of the adulterated objects were correctly classified (corresponding to 4 authentic and 3 adulterated misclassified samples). These results indicate that the high within-class variability (due to the different origins of the samples in terms of factory, region, and season) can have an impact on the possibility of detecting low levels of adulteration; at the same time, they also suggest that the proposed approach could be useful for detecting samples adulterated at 10% or more.
In conclusion, we assert that the present preliminary study demonstrates that the combination of NIR spectroscopy and PLS-DA can represent an effective, rapid and non-destructive tool for the determination of adulteration in jasmine rice.

Author Contributions

Conceptualization, Q.C.N. and A.B.; methodology, Q.C.N. and A.B.; software, F.M. and A.B.; validation, D.L.N.D., Q.C.N., F.M. and A.B.; formal analysis, Q.C.N., F.M. and A.B.; investigation, D.L.N.D. and Q.C.N.; resources, D.L.N.D.; data curation, A.B.; writing—original draft preparation, Q.C.N. and A.B.; writing—review and editing, Q.C.N., F.M. and A.B.; visualization, A.B.; supervision, D.L.N.D. and Q.C.N.; project administration, D.L.N.D.; funding acquisition, D.L.N.D. All authors have read and agreed to the published version of the manuscript.

Funding

This research is funded by Vietnam National University Ho Chi Minh City under grant number C2019-20-23. We would like to thank Ho Chi Minh City University of Technology (HCMUT), VNU-HCM for the support of time and facilities for this study.

Institutional Review Board Statement

Not applicable.

Informed Consent Statement

Not applicable.

Data Availability Statement

The data presented in this study are available on request from the corresponding author. The data are not publicly available due to privacy restrictions.

Acknowledgments

We strongly appreciate the support of Agilent foundation and the Queen’s University of Belfast for this research.

Conflicts of Interest

The authors declare no conflict of interest.

References

  1. Fiamohe, R.; Demont, M.; Saito, K.; Roy-Macauley, H.; Tollens, E. How Can West African Rice Compete in Urban Markets? A Demand Perspective for Policymakers. EuroChoices 2018, 17, 51–57. [Google Scholar] [CrossRef]
  2. Statista. The Statistics Portal for Market Data, Marker Results and Market Studies. Available online: www.statista.com (accessed on 31 December 2020).
  3. Kambo, R.; Yerpude, A. Classification of Basmati Rice Grain Variety using Image Processing and Principal Component Analysis. Int. J. Comput. Trends Technol. 2014, 11. [Google Scholar] [CrossRef] [Green Version]
  4. Singh, K.R.; Chaudhury, S. Efficient technique for rice grain classification using back-propagation neural network and wavelet decomposition. IET Comput. Vis. 2016, 10, 780–787. [Google Scholar] [CrossRef]
  5. Zareiforoush, H.; Minaei, S.; Alizadeh, M.R.; Banakar, A. Qualitative classification of milled rice grains using computer vision and metaheuristic techniques. J. Food Sci. Technol. 2016, 53, 118–131. [Google Scholar] [CrossRef] [Green Version]
  6. Cheajesadagul, P.; Arnaudguilhem, C.; Shiowatana, J.; Siripinyanond, A.; Szpunar, J. Discrimination of geographical origin of rice based on multi-element fingerprinting by high resolution inductively coupled plasma mass spectrometry. Food Chem. 2013, 141, 3504–3509. [Google Scholar] [CrossRef]
  7. Promchan, J.; Günther, D.; Siripinyanond, A.; Shiowatana, J. Elemental imaging and classifying rice grains by using laser ablation inductively coupled plasma mass spectrometry and linear discriminant analysis. J. Cereal Sci. 2016, 71, 198–203. [Google Scholar] [CrossRef]
  8. Barbosa, R.M.; de Paula, E.S.; Paulelli, A.C.; Moore, A.F.; Souza, J.M.O.; Batista, B.L.; Campiglia, A.D.; Barbosa, F. Recognition of organic rice samples based on trace elements and support vector machines. J. Food Compos. Anal. 2016, 45, 95–100. [Google Scholar] [CrossRef]
  9. Borges, E.M.; Gelinski, J.M.L.N.; de Oliveira Souza, V.C.; Barbosa, F., Jr.; Batista, B.L. Monitoring the authenticity of organic rice via chemometric analysis of elemental data. Food Res. Int. 2015, 77, 299–309. [Google Scholar] [CrossRef]
  10. Gonzálvez, A.; Armenta, S.; de la Guardia, M. Geographical traceability of “Arròs de Valencia” rice grain based on mineral element composition. Food Chem. 2011, 126, 1254–1260. [Google Scholar] [CrossRef]
  11. Chung, I.-M.; Kim, J.-K.; Lee, J.-K.; Kim, S.-H. Discrimination of geographical origin of rice (Oryza sativa L.) by multielement analysis using inductively coupled plasma atomic emission spectroscopy and multivariate analysis. J. Cereal Sci. 2015, 65, 252–259. [Google Scholar] [CrossRef]
  12. Li, G.; Nunes, L.; Wang, Y.; Williams, P.N.; Zheng, M.; Zhang, Q.; Zhu, Y. Profiling the ionome of rice and its use in discriminating geographical origins at the regional scale, China. J. Environ. Sci. 2013, 25, 144–154. [Google Scholar] [CrossRef]
  13. Chung, I.-M.; Kim, J.-K.; Lee, K.-J.; Park, S.-K.; Lee, J.-H.; Son, N.-Y.; Jin, Y.-I.; Kim, S.-H. Geographic authentication of Asian rice (Oryza sativa L.) using multi-elemental and stable isotopic data combined with multivariate analysis. Food Chem. 2018, 240, 840–849. [Google Scholar] [CrossRef] [PubMed]
  14. Kuo, T.-Y.; Chung, C.-L.; Chen, S.-Y.; Lin, H.-A.; Kuo, Y.-F. Identifying rice grains using image analysis and sparse-representation-based classification. Comput. Electron. Agric. 2016, 127, 716–725. [Google Scholar] [CrossRef]
  15. Huo, Y.; Kamal, G.M.; Wang, J.; Liu, H.; Zhang, G.; Hu, Z.; Anwar, F.; Du, H. 1H NMR-based metabolomics for discrimination of rice from different geographical origins of China. J. Cereal Sci. 2017, 76, 243–252. [Google Scholar] [CrossRef]
  16. Yang, J.; Sun, J.; Du, L.; Chen, B.; Zhang, Z.; Shi, S.; Gong, W. Monitoring of Paddy Rice Varieties Based on the Combination of the Laser-Induced Fluorescence and Multivariate Analysis. Food Anal. Methods 2017, 10, 2398–2403. [Google Scholar] [CrossRef]
  17. Liu, W.; Liu, C.; Hu, X.; Yang, J.; Zheng, L. Application of terahertz spectroscopy imaging for discrimination of transgenic rice seeds with chemometrics. Food Chem. 2016, 210, 415–421. [Google Scholar] [CrossRef]
  18. Long, Z.; Shan-shan, W.; Yan-fei, D.; Jia-rong, P.A.N.; Cheng, Z.H.U. Discrimination of Transgenic Rice Based on Near Infrared Reflectance Spectroscopy and Partial Least Squares Regression Discriminant Analysis. Rice Sci. 2015, 22, 245–249. [Google Scholar] [CrossRef] [Green Version]
  19. Rodriguez-Saona, L.; Ayvaz, H.; Wehling, R.L. Infrared and Raman Spectroscopy. In Food Analysis; Nielsen, S.S., Ed.; Springer International Publishing: Cham, Germany, 2017; pp. 107–127. [Google Scholar] [CrossRef]
  20. Lin, L.; He, Y.; Xiao, Z.; Zhao, K.; Dong, T.; Nie, P. Rapid-Detection Sensor for Rice Grain Moisture Based on NIR Spectroscopy. Appl. Sci. 2019, 9, 1654. [Google Scholar] [CrossRef] [Green Version]
  21. Biancolillo, A.; Firmani, P.; Bucci, R.; Magrì, A.; Marini, F. Determination of insect infestation on stored rice by near infrared (NIR) spectroscopy. Microchem. J. 2019, 145, 252–258. [Google Scholar] [CrossRef]
  22. Sampaio, P.S.; Castanho, A.; Almeida, A.S.; Oliveira, J.; Brites, C. Identification of rice flour types with near-infrared spectroscopy associated with PLS-DA and SVM methods. Eur. Food Res. Technol. 2020, 246, 527–537. [Google Scholar] [CrossRef]
  23. Firmani, P.; Bucci, R.; Marini, F.; Biancolillo, A. Authentication of “Avola almonds” by near infrared (NIR) spectroscopy and chemometrics. J. Food Compos. Anal. 2019, 82, 103235. [Google Scholar] [CrossRef]
  24. Teye, E.; Amuah, C.L.Y.; McGrath, T.; Elliott, C. Innovative and rapid analysis for rice authenticity using hand-held NIR spectrometry and chemometrics. Spectrochim. Acta Part A Mol. Biomol. Spectrosc. 2019, 217, 147–154. [Google Scholar] [CrossRef] [PubMed]
  25. Firmani, P.; Nardecchia, A.; Nocente, F.; Gazza, L.; Marini, F.; Biancolillo, A. Multi-block classification of Italian semolina based on Near Infrared Spectroscopy (NIR) analysis and alveographic indices. Food Chem. 2020, 309, 125677. [Google Scholar] [CrossRef] [PubMed]
  26. Maione, C.; Barbosa, R.M. Recent applications of multivariate data analysis methods in the authentication of rice and the most analyzed parameters: A review. Crit. Rev. Food Sci. Nutr. 2019, 59, 1868–1879. [Google Scholar] [CrossRef] [PubMed]
  27. Chen, J.; Li, M.; Pan, T.; Pang, L.; Yao, L.; Zhang, J. Rapid and non-destructive analysis for the identification of multi-grain rice seeds with near-infrared spectroscopy. Spectrochim. Acta Part A Mol. Biomol. Spectrosc. 2019, 219, 179–185. [Google Scholar] [CrossRef] [PubMed]
  28. Chen, H.; Tan, C.; Lin, Z. Authenticity Detection of Black Rice by Near-Infrared Spectroscopy and Support Vector Data Description. Int. J. Anal. Chem. 2018, 2018, 8032831. [Google Scholar] [CrossRef] [PubMed]
  29. Chen, K.J.; Huang, M. Prediction of milled rice grades using Fourier transform near-infrared spectroscopy and artificial neural networks. J. Cereal Sci. 2010, 52, 221–226. [Google Scholar] [CrossRef]
  30. Firmani, P.; La Piscopia, G.; Bucci, R.; Marini, F.; Biancolillo, A. Authentication of P.G.I. Gragnano pasta by near infrared (NIR) spectroscopy and chemometrics. Microchem. J. 2020, 152, 104339. [Google Scholar] [CrossRef]
  31. Hao, Y.; Geng, P.; Wu, W.; Wen, Q.; Rao, M. Identification of Rice Varieties and Transgenic Characteristics Based on Near-Infrared Diffuse Reflectance Spectroscopy and Chemometrics. Molecules 2019, 24, 4568. [Google Scholar] [CrossRef] [Green Version]
  32. Natsuga, M.; Kawamura, S. Visible and Near-Infrared reflectance spectroscopy for determining physicochemical properties of rice. Trans. ASABE 2006, 49, 1069–1076. [Google Scholar] [CrossRef] [Green Version]
  33. Kong, W.; Zhang, C.; Liu, F.; Nie, P.; He, Y. Rice seed cultivar identification using near-infrared hyperspectral imaging and multivariate data analysis. Sensors 2013, 13, 8916–8927. [Google Scholar] [CrossRef] [PubMed] [Green Version]
  34. Zhang, B.; Rong, Z.Q.; Shi, Y.; Wu, J.G.; Shi, C.H. Prediction of the amino acid composition in brown rice using different sample status by near-infrared reflectance spectroscopy. Food Chem. 2011, 127, 275–281. [Google Scholar] [CrossRef]
  35. Xie, L.H.; Tang, S.Q.; Chen, N.; Luo, J.; Jiao, G.A.; Shao, G.N.; Wei, X.J.; Hu, P.S. Optimisation of near-infrared reflectance model in measuring protein and amylose content of rice flour. Food Chem. 2014, 142, 92–100. [Google Scholar] [CrossRef] [PubMed]
  36. Li, B.; Zhao, M.; Zhou, Y.; Hou, B.; Zhang, D. Detection of Waxed Rice Using Visible-near Infrared Hyperspectral Imaging. J. Food Nutr. Res. 2016, 4, 267–275. [Google Scholar] [CrossRef]
  37. Siriphollakul, P.; Nakano, K.; Kanlayanarat, S.; Ohashi, S.; Sakai, R.; Rittiron, R.; Maniwara, P. Eating quality evaluation of Khao Dawk Mali 105 rice using near-infrared spectroscopy. LWT-Food Sci. Technol. 2017, 79, 70–77. [Google Scholar] [CrossRef]
  38. Biancolillo, A.; Marini, F. Chapter Four-Chemometrics Applied to Plant Spectral Analysis. In Vibrational Spectroscopy for Plant Varieties and Cultivars Characterization; Lopes, J., Sousa, C., Eds.; Comprehensive Analytical Chemistry, 80; Elsevier: Amsterdam, The Netherlands, 2018; pp. 69–104. [Google Scholar]
  39. Biancolillo, A.; Marini, F.; Ruckebusch, C.; Vitale, R. Chemometric Strategies for Spectroscopy-Based Food Authentication. Appl. Sci. 2020, 10, 6544. [Google Scholar] [CrossRef]
  40. Snee, R.D. Validation of Regression Models: Methods and Examples. Technometrics 1977, 19, 415–428. [Google Scholar] [CrossRef]
  41. Rinnan, Å.; Berg, F.v.d.; Engelsen, S.B. Review of the most common pre-processing techniques for near-infrared spectra. TrAC Trends Anal. Chem. 2009, 28, 1201–1222. [Google Scholar] [CrossRef]
  42. Savitzky, A.; Golay, M.J.E. Smoothing and Differentiation of Data by Simplified Least Squares Procedures. Anal. Chem. 1964, 36, 1627–1639. [Google Scholar] [CrossRef]
  43. Barnes, R.J.; Dhanoa, M.S.; Lister, S.J. Standard Normal Variate Transformation and De-trending of Near-Infrared Diffuse Reflectance Spectra. Appl. Spectrosc. 1989, 43, 772–777. [Google Scholar] [CrossRef]
  44. Barker, M.; Rayens, W. Partial least squares for discrimination. J. Chemom. 2003, 17, 166–173. [Google Scholar] [CrossRef]
  45. Nocairi, H.; Mostafa Qannari, E.; Vigneau, E.; Bertrand, D. Discrimination on latent components with respect to patterns. Application to multicollinear data. Comput. Stat. Data Anal. 2005, 48, 139–147. [Google Scholar] [CrossRef]
  46. Indahl, U.G.; Martens, H.; Næs, T. From dummy regression to prior probabilities in PLS-DA. J. Chemom. 2007, 21, 529–536. [Google Scholar] [CrossRef]
  47. Sjöström, M.; Wold, S.; Söderström, B. PLS discriminant plots. In Pattern Recognition in Practice; Gelsema, E.S., Kanal, L.N., Eds.; Elsevier: Amsterdam, The Netherlands, 1986; pp. 461–470. [Google Scholar] [CrossRef]
  48. Ståhle, L.; Wold, S. Partial least squares analysis with cross-validation for the two-class problem: A Monte Carlo study. J. Chemom. 1987, 1, 185–196. [Google Scholar] [CrossRef]
  49. Wold, S.; Martens, H.; Wold, H. The multivariate calibration problem in chemistry solved by the PLS method. In Matrix Pencils; Springer: Berlin/Heidelberg, Germany, 1983; pp. 286–293. [Google Scholar]
  50. Geladi, P.; Kowalski, B.R. Partial least-squares regression: A tutorial. Anal. Chim. Acta 1986, 185, 1–17. [Google Scholar] [CrossRef]
  51. Martens, H.; Næs, T. Multivariate Calibration; John Wiley & Sons: New York, NY, USA, 1989. [Google Scholar]
  52. Tharwat, A. Linear vs. quadratic discriminant analysis classifier: A tutorial. Int. J. Appl. Pattern Recognit. 2016, 3, 145–180. [Google Scholar] [CrossRef]
  53. Pérez, N.F.; Ferré, J.; Boqué, R. Calculation of the reliability of classification in discriminant partial least-squares binary classification. Chemom. Intell. Lab. Syst. 2009, 95, 122–128. [Google Scholar] [CrossRef]
  54. Wold, S. Pattern recognition by means of disjoint principal components models. Pattern Recognit. 1976, 8, 127–139. [Google Scholar] [CrossRef]
  55. Wold, S.; Sjöström, M. SIMCA: A Method for Analyzing Chemical Data in Terms of Similarity and Analogy. In Chemometrics: Theory and Application; American Chemical Society: Washington, DC, USA, 1977; Volume 52, pp. 243–282. [Google Scholar]
  56. Yue, H.H.; Qin, S.J. Reconstruction-Based Fault Identification Using a Combined Index. Ind. Eng. Chem. Res. 2001, 40, 4403–4414. [Google Scholar] [CrossRef]
  57. Cocchi, M.; Biancolillo, A.; Marini, F. Chapter Ten-Chemometric Methods for Classification and Feature Selection. In Comprehensive Analytical Chemistry; Jaumot, J., Bedia, C., Tauler, R., Eds.; Elsevier: Amsterdam, The Netherlands, 2018; Volume 82, pp. 265–299. [Google Scholar]
  58. Stuart, B.H. Infrared Spectroscopy: Fundamentals and Applications; Wiley: New York, NY, USA, 2004. [Google Scholar]
  59. Franca, A.S.; Nollet, L.M.L. Spectroscopic Methods in Food Analysis; CRC Press: Boca Raton, FL, USA, 2017. [Google Scholar]
Figure 1. NIR spectra (a) raw spectra of all the investigated samples, (b) mean spectra of authentic (red line) and adulterated samples (blue line).
Applsci 11 00362 g001
Figure 2. Variable importance in projection (VIP) analysis. Average spectrum of training samples (black line). Spectral variables presenting VIP index >1 are highlighted in red.
Applsci 11 00362 g002
Table 1. Partial least squares discriminant analysis (PLS-DA) classification of authentic vs. 5% + 10% adulterated samples: results of cross-validation for model selection.
PreprocessingLVs% Correct Classification Rate in Cross-Validation
Authentic
(49 Samples)
Adulterated 5% + 10%
(91 Samples)
Overall
(140 Samples)
MC567.373.670.4
SNV (+MC)465.375.870.5
1st derivative (+MC)673.491.582.4
2nd derivative (+MC)471.476.674.1
Table 2. PLS-DA classification of authentic vs. 10% adulterated samples: results of cross-validation for model selection.
PreprocessingLVs% Correct Classification Rate in Cross-Validation
Authentic
(49 Samples)
Adulterated 10%
(47 Samples)
Overall
(96 Samples)
MC767.383.075.1
SNV (+MC)883.791.587.6
1st derivative (+MC)673.591.582.5
2nd derivative (+MC)573.578.779.3
Table 3. Soft independent modeling of class analogies (SIMCA) modeling of the authentic class (49 training samples): results of cross-validation for model selection.
PreprocessingPCsSensitivity (%)Specificity (%) vs. 5% + 10% AdulteratedEfficiency (%)
MC498.04.420.7
SNV (+MC)695.95.523.0
1st derivative (+MC)593.96.624.9
2nd derivative (+MC)898.011.032.8
Publisher’s Note: MDPI stays neutral with regard to jurisdictional claims in published maps and institutional affiliations.

