The Power of HPTLC-ATR-FTIR Hyphenation in Bioactivity Analysis of Plant Extracts


1
Department of Pharmaceutical and Toxicological Chemistry Named after Arzamastsev of the Institute of Pharmacy, I.M. Sechenov First Moscow State Medical University (Sechenov University), 119991 Moscow, Russia
2
School of Pharmacy and Biomedical Sciences, La Trobe Institute for Molecular Sciences, La Trobe University, Edwards Rd, Bendigo 3550, Australia
*
Author to whom correspondence should be addressed.
Appl. Sci. 2020, 10(22), 8232; https://doi.org/10.3390/app10228232
Submission received: 13 November 2020
/
Accepted: 18 November 2020
/
Published: 20 November 2020
(This article belongs to the Special Issue Recent Trends in FTIR Spectroscopy)
Given the simplicity in sample preparation and application, thin-layer chromatography (TLC) and high-performance thin-layer chromatography (HPTLC) as its most enhanced form are commonly used to separate and identify complex mixtures in solution. (HP)TLC has a long tradition of use in quality control of medicinal plants, complex plant extracts and natural products. HPTLC is based on the use of special layers of fine particles of stationary phase (~5 μm, narrow particle size range) applied to a plate. The use of automated computer controlled HPTLC instrumentation has improved method sensitivity, reproducibility, separation efficiency and enabled quantitative determination of separated components.
Through coupling with direct enzyme and enzyme inhibition bioassays whose response can be visualized on the chromatographic plate, (HP)TLC has been established as a targeted bioactivity screening method. These bioautographic assays provide not only phytochemical results by chromatographic separation, but also additional information about the activity of constituents in complex mixtures and extracts. However, one of the problems in (HP)TLC is the identification of separated compounds on the plate. In recent years, considerable effort has been devoted to the coupling of (HP)TLC with spectrometric methods due to the robustness and simplicity of (HP)TLC and the need for effective identification and determination of sample constituents. In instrumental analysis, compounds are usually been identified based on chromatographic-spectroscopic hyphenated techniques. The goal of hyphenation of two analytical techniques in (HP)TLC is to enable rapid and efficient chromatographic separation with subsequent identification of the separated fractions. Mass spectrometry (MS) is one of the most powerful identification techniques used in analytical chemistry and biochemistry. It has been successfully hyphenated with (HP)TLC as thin layer chromatography/mass spectrometry (TLC/MS) and thin layer chromatography/tandem mass spectrometry (TLC/MS/MS) [1,2,3,4,5,6]. Although TLC/MS/MS offers additional benefits, it requires more expensive instrumentation and more challenging operational requirements. Also, HPTLC–MS and HPTLC/MS/MS systems are available to only a small number of research groups. The introduction of an elution-based TLC–MS interface has also allowed the possibility of expanding the connection with other detectors. The chromatogram bands can be eluted from the HPTLC plate with a suitable solvent and either transferred online to the mass spectrometer or collected in a sample vial for further offline analysis.
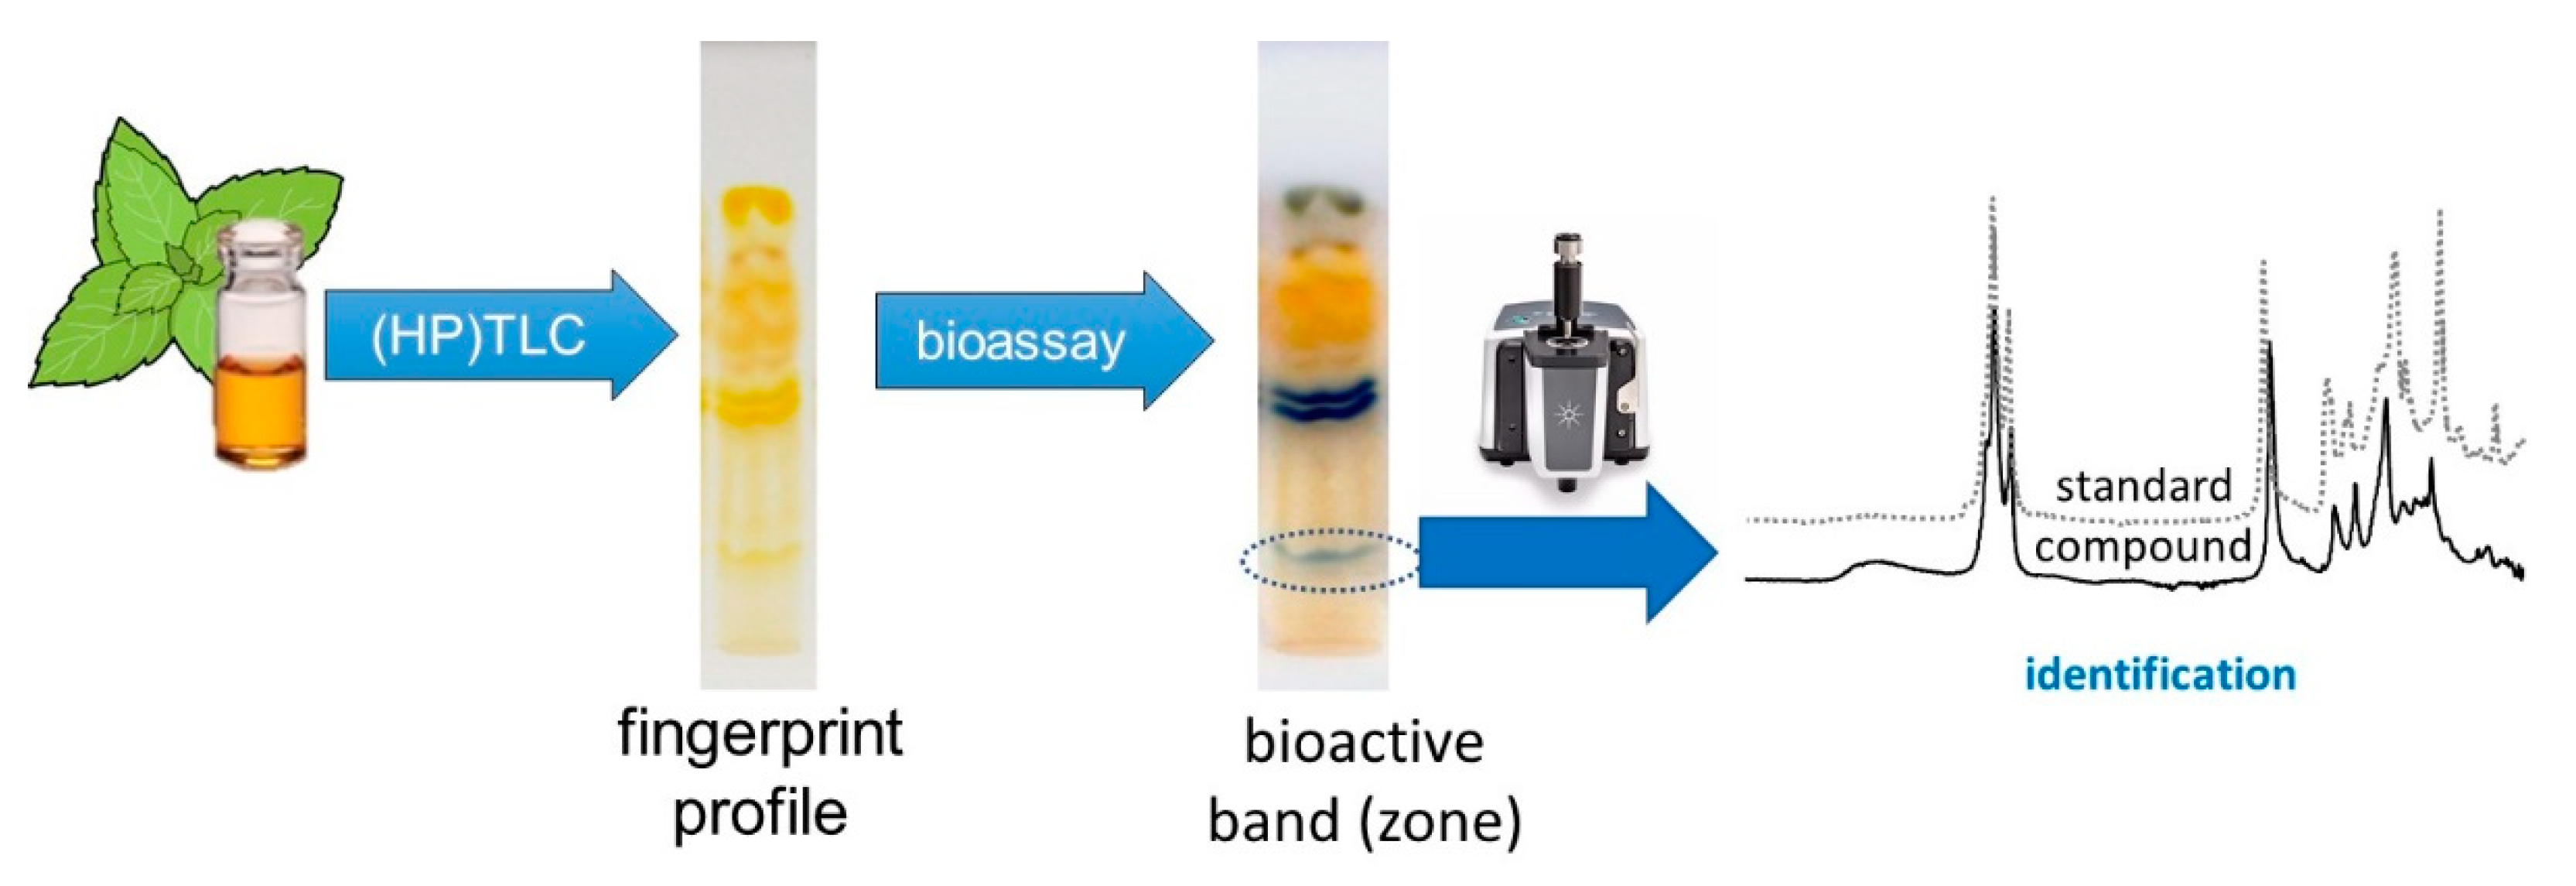
Infrared (IR) spectroscopy is another useful spectroscopic method that can be coupled with (HP)TLC. The major advantages of IR spectroscopy is no (or minimal) sample preparation is required, and it is an environmentally friendly and reagent-free green tool, that provides results within minutes [7]. Most IR spectrometers are easy to use, portable, and relatively inexpensive. After separation and bioassay detection, eluted bioactive bands can be easily chemically characterized using attenuated total reflection Fourier transform infrared (ATR-FTIR) spectral analysis (Figure 1).
FTIR spectra are typically measured in the mid-IR region (4000 to 400 cm−1) of the electromagnetic spectrum. When organic molecules absorb IR radiation, the radiation is converted into molecular vibrations. Although the IR spectrum is not characteristic of the entire molecule, the energy required to vibrate a functional group such as a carbonyl (–C=O) is very similar in different compounds so the peaks occur at or near the same frequency regardless of the structure of the rest of the molecule. Thus, IR spectroscopy can be used to elucidate organic structure by providing structural/chemical characterization based on functional group vibrations. Characteristic absorption bands can be used for compound-specific detection or to verify quality markers in plant extracts or distillates while a fingerprint IR spectrum can be used to identify unknown compounds.
Attenuated total reflection (ATR) is a sampling technique which is considered a universal sampling accessory. Spectra are recorded directly in either the solid or liquid state, without sample preparation. The only sample preparation required is to apply pressure with the pressure applicator, if solid samples are analyzed. There is no need to apply pressure when liquid samples are analyzed. The quality of ATR-FTIR spectra is sufficient to allow identification when examined and compared to the reference spectra of pure compounds, on different portions of the spectrum. Despite a small interference from solubilized silica to sample identification, compounds isolated from certain chromatographic bioactive bands can be identified. The search–match results can be used to compare the ATR-FTIR spectrum of the compound from certain chromatographic bands with the ATR-FTIR spectrum of a standard compound. The open access SpectraBaseTM (John Wiley & Sons, Inc., Hoboken, NJ, USA) [8] is a free database of IR, NMR, Raman, UV, and mass spectra, containing hundreds of thousands of spectra provided by Wiley. Spectra can be searched by name, International Chemical Identifier (InChI) key, and Chemical Abstracts Service (CAS) number. Spectra of unknown compounds isolated from chromatograms can be superimposed with the spectrum from the database for comparison. Combined with effect-directed assays and ATR-FTIR spectroscopy, hyphenated HPTLC allows an effect-directed high-throughput screening and fast characterization of the active compound. HPTLC combined with effect directed analysis has been previously used to detect biological active compounds on chromatograms [9]. Combined with effect-directed assays and attenuated total reflectance-Fourier transform infrared (ATR-FTIR) spectroscopy, hyphenated HPTLC has allowed a fast characterization of the compound responsible for α-amylase inhibition in Mediterranean culinary herbs [10]. Compounds with biological activities from five native Australian plants were identified via ATR-FTR spectroscopy [11]. ATR spectral analysis of this bioactive band on chromatograms has tentatively identified an oleanolic acid derivative to be responsible for α-amylase inhibition.
References
- Krüger, S.; Bergin, A.; Morlock, G.E. Effect-directed analysis of ginger (Zingiber officinale) and its food products, and quantification of bioactive compounds via high-performance thin-layer chromatography and mass spectrometry. Food Chem. 2018, 243, 258–268. [Google Scholar] [CrossRef] [PubMed]
- Morlock, G.E.; Ristivojevic, P.; Chernetsova, E. Combined multivariate data analysis of high-performance thin-layer chromatography fingerprints and direct analysis in real time mass spectra for profiling of natural products like propolis. J. Chromatogr. A 2014, 1328, 104–112. [Google Scholar] [CrossRef] [PubMed] [Green Version]
- Henion, J.; Maylin, G.A.; Thomson, B.A. Determination of drugs in biological samples by thin-layer chromatography tandem mass spectrometry. J. Chromatogr. A 1983, 271, 107–124. [Google Scholar] [CrossRef]
- Ovchinnikova, O.S.; Van Berkel, G.J. Thin-layer chromatography and mass spectrometry coupled using proximal probe thermal desorption with electrospray or atmospheric pressure chemical ionization. Rapid Commun. Mass Spectrom. 2010, 24, 1721–1729. [Google Scholar] [CrossRef] [PubMed]
- Van Berkel, G.J.; Ford, M.J.; Deibel, M.A. Thin-layer chromatography and mass spectrometry coupled using desorption electrospray ionization. Anal. Chem. 2005, 77, 1207–1215. [Google Scholar] [CrossRef] [PubMed]
- Paglia, G.; Ifa, D.R.; Wu, C.; Corso, G.; Cooks, R.G. Desorption electrospray ionization mass spectrometry analysis of lipids after two-dimensional high-performance thin-layer chromatography partial separation. Anal. Chem. 2010, 82, 1744–1750. [Google Scholar] [CrossRef] [PubMed] [Green Version]
- Dytkiewitz, E.; Morlock, G.E. Analytical strategy for rapid identification and quantification of lubricant additives in mineral oil by high-performance thin-layer chromatography with uv absorption and fluorescence detection combined with mass spectrometry and infrared spectroscopy. J. AOAC Int. 2008, 91, 1237–1243. [Google Scholar] [PubMed]
- Wiley SpectraBase. Available online: http://spectrabase.com/about (accessed on 10 November 2020).
- Móricz, Á.M.; Lapat, V.; Morlock, G.E.; Ott, P.G. High-performance thin-layer chromatography hyphenated to high-performance liquid chromatography-diode array detection-mass spectrometry for characterization of coeluting isomers. Talanta 2020, 219, 121306. [Google Scholar] [CrossRef] [PubMed]
- Agatonovic-Kustrin, S.; Kustrin, E.; Gegechkori, V.; Morton, D.W. Bioassay-guided identification of α-amylase inhibitors in herbal extracts. J. Chromatogr. A 2020, 1620, 460970. [Google Scholar] [CrossRef] [PubMed]
- Agatonovic-Kustrin, S.; Doyle, E.; Gegechkori, V.; Morton, D.W. High-performance thin-layer chromatography linked with (bio)assays and FTIR-ATR spectroscopy as a method for discovery and quantification of bioactive components in native Australian plants. J. Pharm. Biomed. Anal. 2020, 184, 113208. [Google Scholar] [CrossRef] [PubMed]
Figure 1.
Overview of hyphenated (HP)TLC with ATR-FTIR identification as a tool in the Effect-Directed Discovery of bioactive compounds in plant extracts.
Figure 1.
Overview of hyphenated (HP)TLC with ATR-FTIR identification as a tool in the Effect-Directed Discovery of bioactive compounds in plant extracts.

Publisher’s Note: MDPI stays neutral with regard to jurisdictional claims in published maps and institutional affiliations. |
© 2020 by the authors. Licensee MDPI, Basel, Switzerland. This article is an open access article distributed under the terms and conditions of the Creative Commons Attribution (CC BY) license (http://creativecommons.org/licenses/by/4.0/).
Share and Cite
MDPI and ACS Style
Agatonovic-Kustrin, S.; Morton, D.W. The Power of HPTLC-ATR-FTIR Hyphenation in Bioactivity Analysis of Plant Extracts. Appl. Sci. 2020, 10, 8232. https://doi.org/10.3390/app10228232
AMA Style
Agatonovic-Kustrin S, Morton DW. The Power of HPTLC-ATR-FTIR Hyphenation in Bioactivity Analysis of Plant Extracts. Applied Sciences. 2020; 10(22):8232. https://doi.org/10.3390/app10228232
Chicago/Turabian StyleAgatonovic-Kustrin, Snezana, and David W. Morton. 2020. "The Power of HPTLC-ATR-FTIR Hyphenation in Bioactivity Analysis of Plant Extracts" Applied Sciences 10, no. 22: 8232. https://doi.org/10.3390/app10228232
Note that from the first issue of 2016, this journal uses article numbers instead of page numbers. See further details here.