Article

Determination of the Most Effective Wavelengths for Prediction of Fuji Apple Starch and Total Soluble Solids Properties

1
Department of Biosystems Engineering, College of Agriculture, University of Mohaghegh Ardabili, Ardabil 56199-11367, Iran
2
Sanaz Jarolmasjed, Agnetix biological and machine vision systems, 7965 Dunbrook Rd, San Diago, CA 92126, USA
3
Faculty of Science and Technology, University of Algarve, Campus de Gambelas, 8005 Faro, Portugal
*
Author to whom correspondence should be addressed.
Appl. Sci. 2020, 10(22), 8145; https://doi.org/10.3390/app10228145
Submission received: 17 October 2020 / Revised: 14 November 2020 / Accepted: 16 November 2020 / Published: 17 November 2020
(This article belongs to the Special Issue Applications of Optical Spectroscopy in Plant Sciences)

Abstract

:
Proper physical properties and standard chemical properties are among the criteria that consumers use to select fruits. Recently, researchers attempted to develop non-destructive methods for measuring properties, among which the near-infrared (NIR) spectroscopy is of great use. Fuji apples were collected in three different growth stages, and then starch and soluble solids were extracted. Spectral data in the range of 800 to 900 nm were used to predict the amount of starch content and 920 to 980 nm to estimate total soluble solids (TSS). Reflectance spectra were pre-processed and the most effective wavelengths of each property were selected using hybrid artificial neural network-simulated annealing (ANN-SA). Non-destructive estimation of physicochemical properties was conducted using spectral data of the most effective wavelengths using a hybrid artificial neural network-biogeography-based optimization algorithm (ANN-BBO). The results indicated that the regression coefficient of the best state of training for predicting starch was 0.97 and of TSS was 0.96, while R2 was 0.92 for both. The most effective wavelengths were 852.58, 855.54, 849.03, 855.83, 853.47, 844.90 nm for starch and 967.86, 966.67, 964.90, 958.40, 957.22, 963.97 nm for TSS.

1. Introduction

Apples are among the most popular and nutritious fruits. Depending on the climate and soil of each region of the globe, different fruit varieties grow. Standards must be considered to distribute these fruits domestically or for export to other countries; otherwise, they will be damaged in the postharvest stages which causes loss of quality. Generally, the quality of fruits should be considered from the perspectives of external and internal quality. Much research has been conducted to measure the external quality of fruits, such as size, weight, and no fruit skin damage [1,2,3]. Internal quality includes soluble solids content (SSC), titration acidity (TA), and starch [4]. Unlike external quality, internal quality measurement methods are destructive, time-consuming, and costly [5].
Several studies have been conducted to predict fruits’ properties that determine their internal quality [6,7,8]. Various methods have been proposed for non-destructive quality investigations [9,10,11,12]. Visible/near-infrared reflectance (Vis-NIR) spectroscopy has also been used by various, measuring chemical components and quality properties of fruits and vegetables [13,14,15].
Vis-NIR spectroscopy has been used for different purposes on different fruits such as orange [16], kiwi [17], apricot [18], pear [19], and apple [20]. Vis-NIR spectroscopy was used by Uwadaira et al. [21] for non-destructive evaluation of peach fruit. In another study conducted by Oliveira-Folador et al. [22], a fast method for quality evaluation was proposed for passion fruit using NIR and mid-infrared spectroscopy methods.
Color is one of the most critical factors in the quality of fruits [23,24,25]. Schouten et al. [26] demonstrated that Vis-NIR could be used to detect chlorophyll and lycopene levels in tomato accurately. In another study conducted by Tilahun et al. [27], lycopene and beta-carotene were estimated by chromatography and Vis-NIR spectra on tomatoes. Hernández-Hernández et al. [28] described a portable application that uses color segmentation and a probabilistic approach based on histograms in the optimum color space to optimize the water needs calculation.
As observed, researchers have focused on the non-destructive estimation of the physicochemical properties of different fruits due to the high speed of monitoring operation during growth to consumption. Previous research uses statistical methods to estimate properties, which are linear methods and often mistaken for complex data or use a simple artificial neural network (ANN) without optimal adjustment. In addition, in most research, the prediction of properties is performed only once, making it impossible to check the methods’ reliability.
This paper aims to determine the most effective wavelengths for non-destructive prediction of total soluble solids and starch of Fuji apples at different stages of their growth using a hybrid artificial neural network-biogeography-based optimization algorithm (ANN-BBO). This may help create portable tools that can be used in the field to optimize orchard management during harvest time and postharvest operations. Optimal adjustment of the parameters of the artificial neural network (including the number of layers, number of neurons, transfer function, backpropagation network training function, and backpropagation weight/bias learning function using an algorithm based on biogeography) ensures the method’s maximum performance for predicting starch properties and soluble solid content. The selection of the most effective wavelengths among whole wavelengths using a simulated annealing algorithm selects the effective spectra based on the thinking behind the metal annealing operation. Repeating the non-destructive estimation operation 100 times measures the reliability of the proposed algorithm.

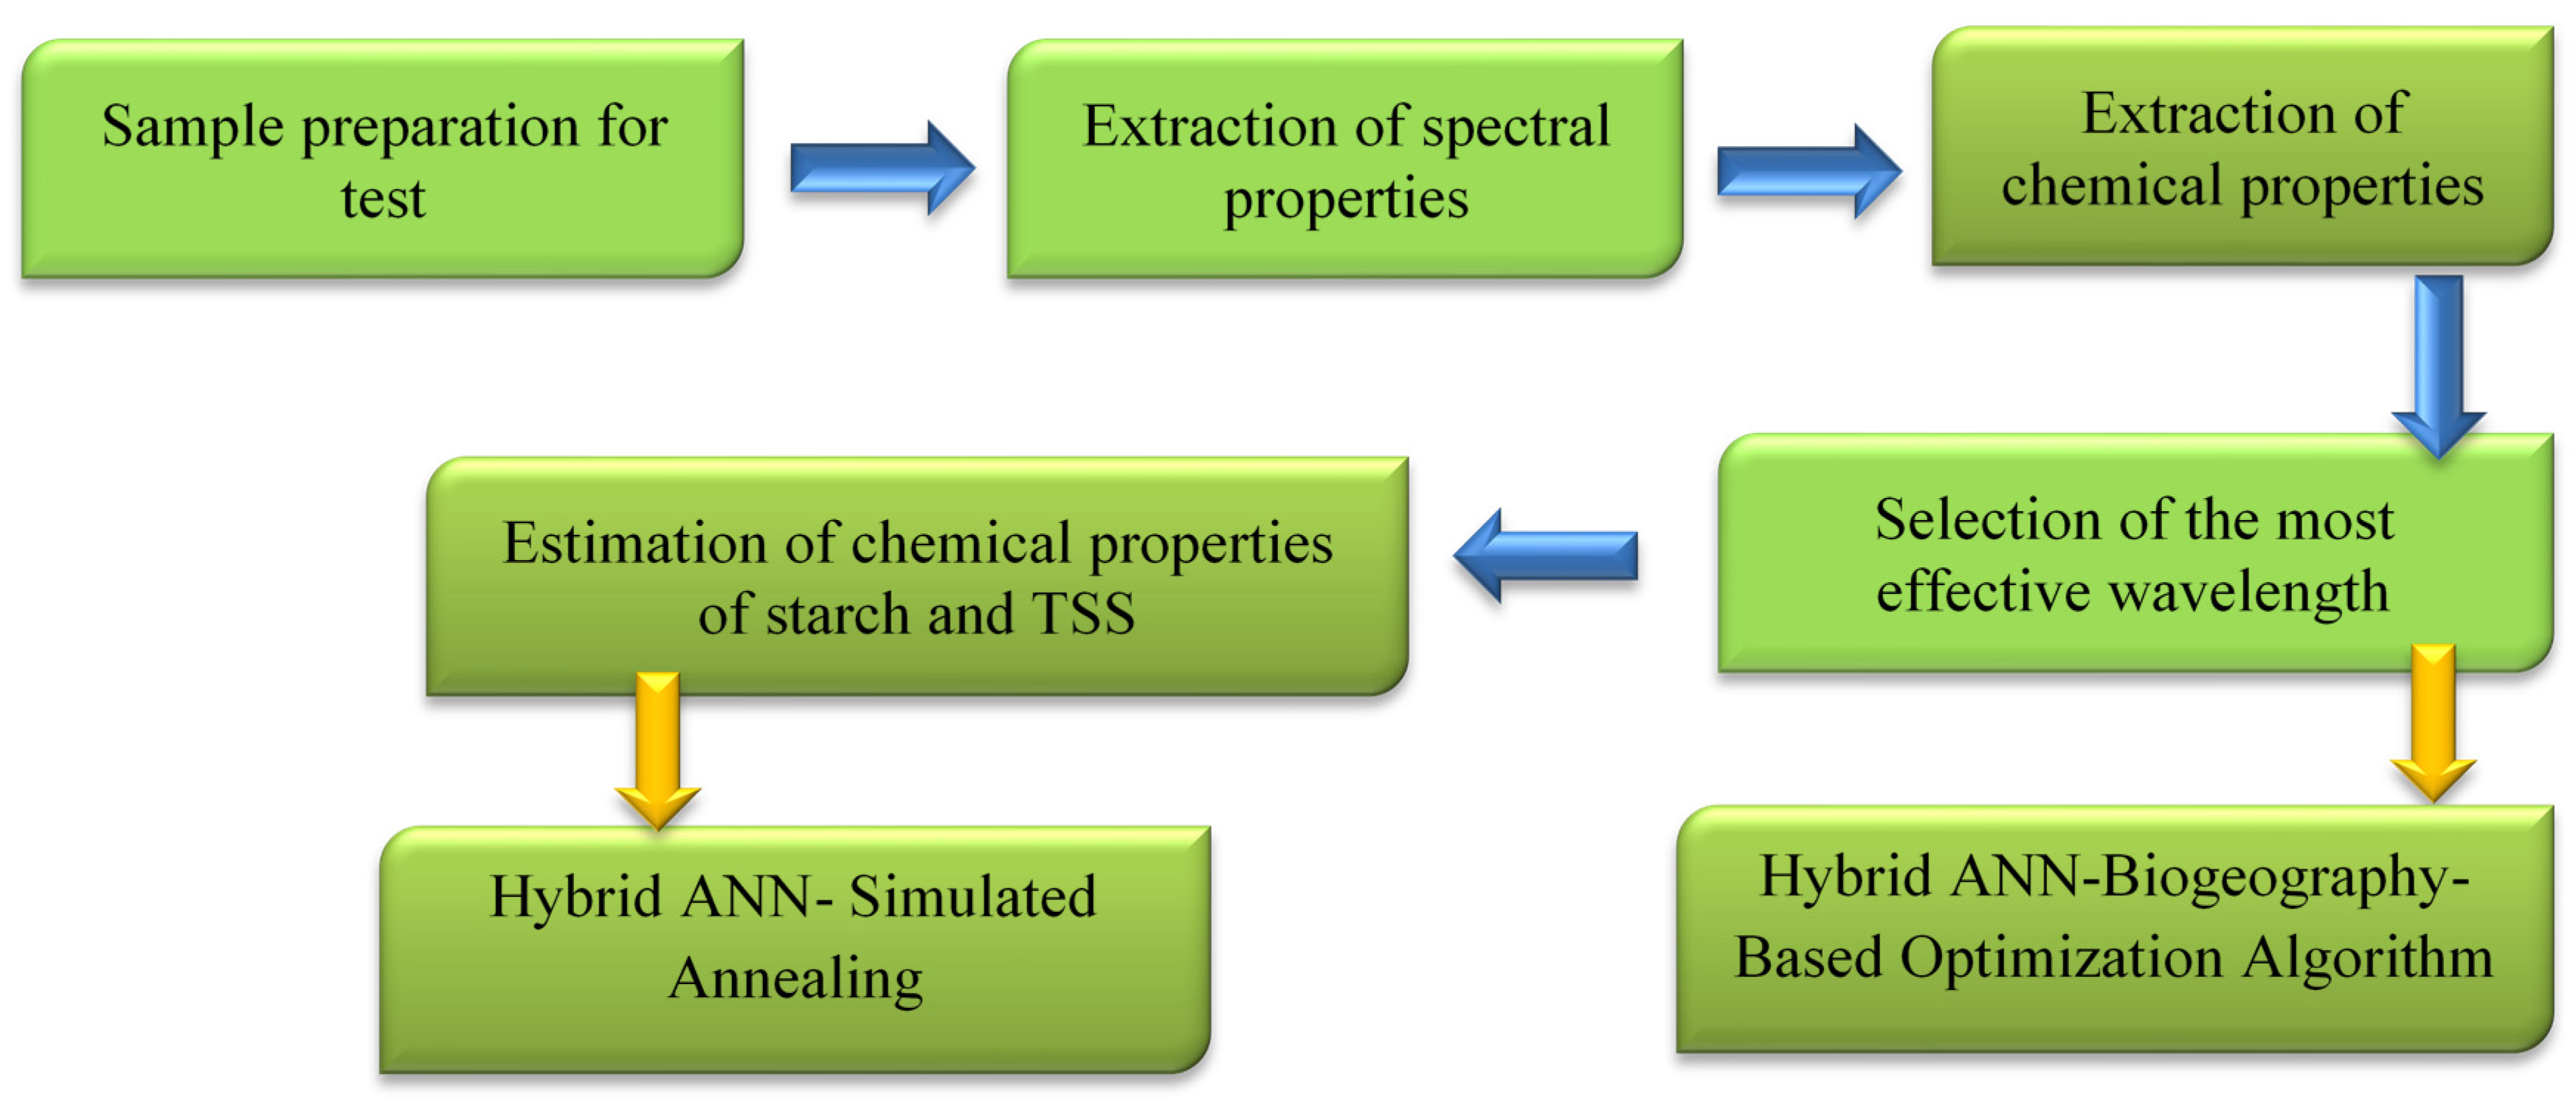
2. Materials and Methods

For non-destructive detection of starch and total soluble solids (TSS) in Fuji apple, an estimation algorithm needs to be trained. Figure 1 illustrates the flowcharts of the different training steps of this algorithm. As can be observed, five necessary steps are needed to train. Each step is described below.

2.1. Data Collection

The first step was to train a non-destructive prediction algorithm for the fruit properties of starch and TSS. For this purpose, 140 samples of Fuji apple were collected at three different stages of maturity from different trees of different gardens in Kermanshah, Iran (34°18′ N 47°4′ E). Initially, Fuji apple ripening time was determined based on 45 samples collected 14 and 7 days before maturity and 50 samples at maturity time. At each stage, samples were transferred to the laboratory to measure TSS and starch properties.

2.2. Extraction of Spectral Properties of Samples

After harvesting the samples at each stage of maturity, the spectral properties of each were extracted. The hardware used includes the spectrophotometer EPP200NIR (StellarNet, Tampa, FL, USA) which was equipped with an indium-gallium-arsenide detector with a range of 400 to 1000 nm, light source SLI-CAL (StellarNet, Tampa, FL, USA) 20 W tungsten halogen light, and laptop Intel Corei3CFI with 330 M at 2.13 GHz, 4 GB of RAM. Spectra Wiz software used for saving the spectral data. Two optic fibers were used for transmitting light to the samples and then from there to the spectrometer.
It should be noted that the spectral data measured of each apple was a reflection spectrum. Spectral charts contain several peaks, showing that spectral ranges around these peaks contain essential information on the fruit properties [29]. After receiving reflectance spectra from each sample, these spectra were converted to absorption spectra using Equation (1). The purpose of this pre-processing of the extracted spectral data was to establish a linear relationship with the molecular concentration of the samples [30]:
Absorption spectra = log(1/Reflectance spectra).

2.3. Extraction of Fruit Properties

2.3.1. Destructive Measurement of the Starch Property

Starch is a homopolymeric carbohydrate of the sugar glucose. During the ripening process, starch turns into sugar, so it is possible to estimate the fruit’s ripening stage. The method described by Hedge and Hofreiter [31] was used in this paper. The various steps that were taken to measure the amount of starch in apples are as below:
(1)
Peeling a part of the apple and cutting a piece of 0.5 g from it.
(2)
Crushing the piece with a mortar and extracting apple juice.
(3)
Preparing a buffer using the phosphate buffer solution.
(4)
Mixing the sediment from step (2) with 1.5 mL of buffer solution.
(5)
Performing centrifugation at 12,000 rpm for 20 min to completely separate the sediment from the mixture.
(6)
After complete separation of the precipitate from the solution, the resulting precipitate was mixed with a mixture of dimethyl sulfoxide/hydrochloric acid 4:1 and centrifuged at a speed of 12,000 rpm for 20 min.
(7)
Mixing the solution obtained from step (6) with iodine-hydrochloric acid reagent in a ratio of 1 to 5 and recording the number of absorption using a spectrophotometer (Optizen 2120 UV plus, Company: Mecasys Co., Ltd., Yuseong-gu, Daejeon, Korea) at 600 nm and the results were presented in terms of mg/g.

2.3.2. Destructive Measurement of TSS Property

A refractometer was used to measure total soluble solids. The amount of sugar obtained by different refractometers is expressed in different units, but in most cases, it is °Brix. Degrees Brix consists of sugars, organic acids, soluble amino acids (except proteins as they are not soluble), alcohol, minerals, fat, and flavonoids (Vitamin C and Vitamin A). Brix is considered a measure of sweetness of fruits /fruit juices because the portion of sugar content is nearly 80%, while the portion of other solids is little. However, if the proportion of other components increases, they can influence Brix. Brix cannot discriminate different sugars but indicates the total content of all sugars. The °Brix, measured at 200 C, represents the total sugar content of fruit. Therefore, °Brix 50 indicates that the fruit has 50% of TSS (https://felixinstruments.com/blog/brix-as-a-metric-of-fruit-maturity/). Brix is equal to the amount of sugar (gr) contained in 100 g of fruit. Aqueous refractometers are commonly used to obtain TSS. The basis of refractometers is light refraction. Light is refracted by passing through two heterogeneous environments. As the concentration of the solution increases, the refractive index of light increases linearly [32].

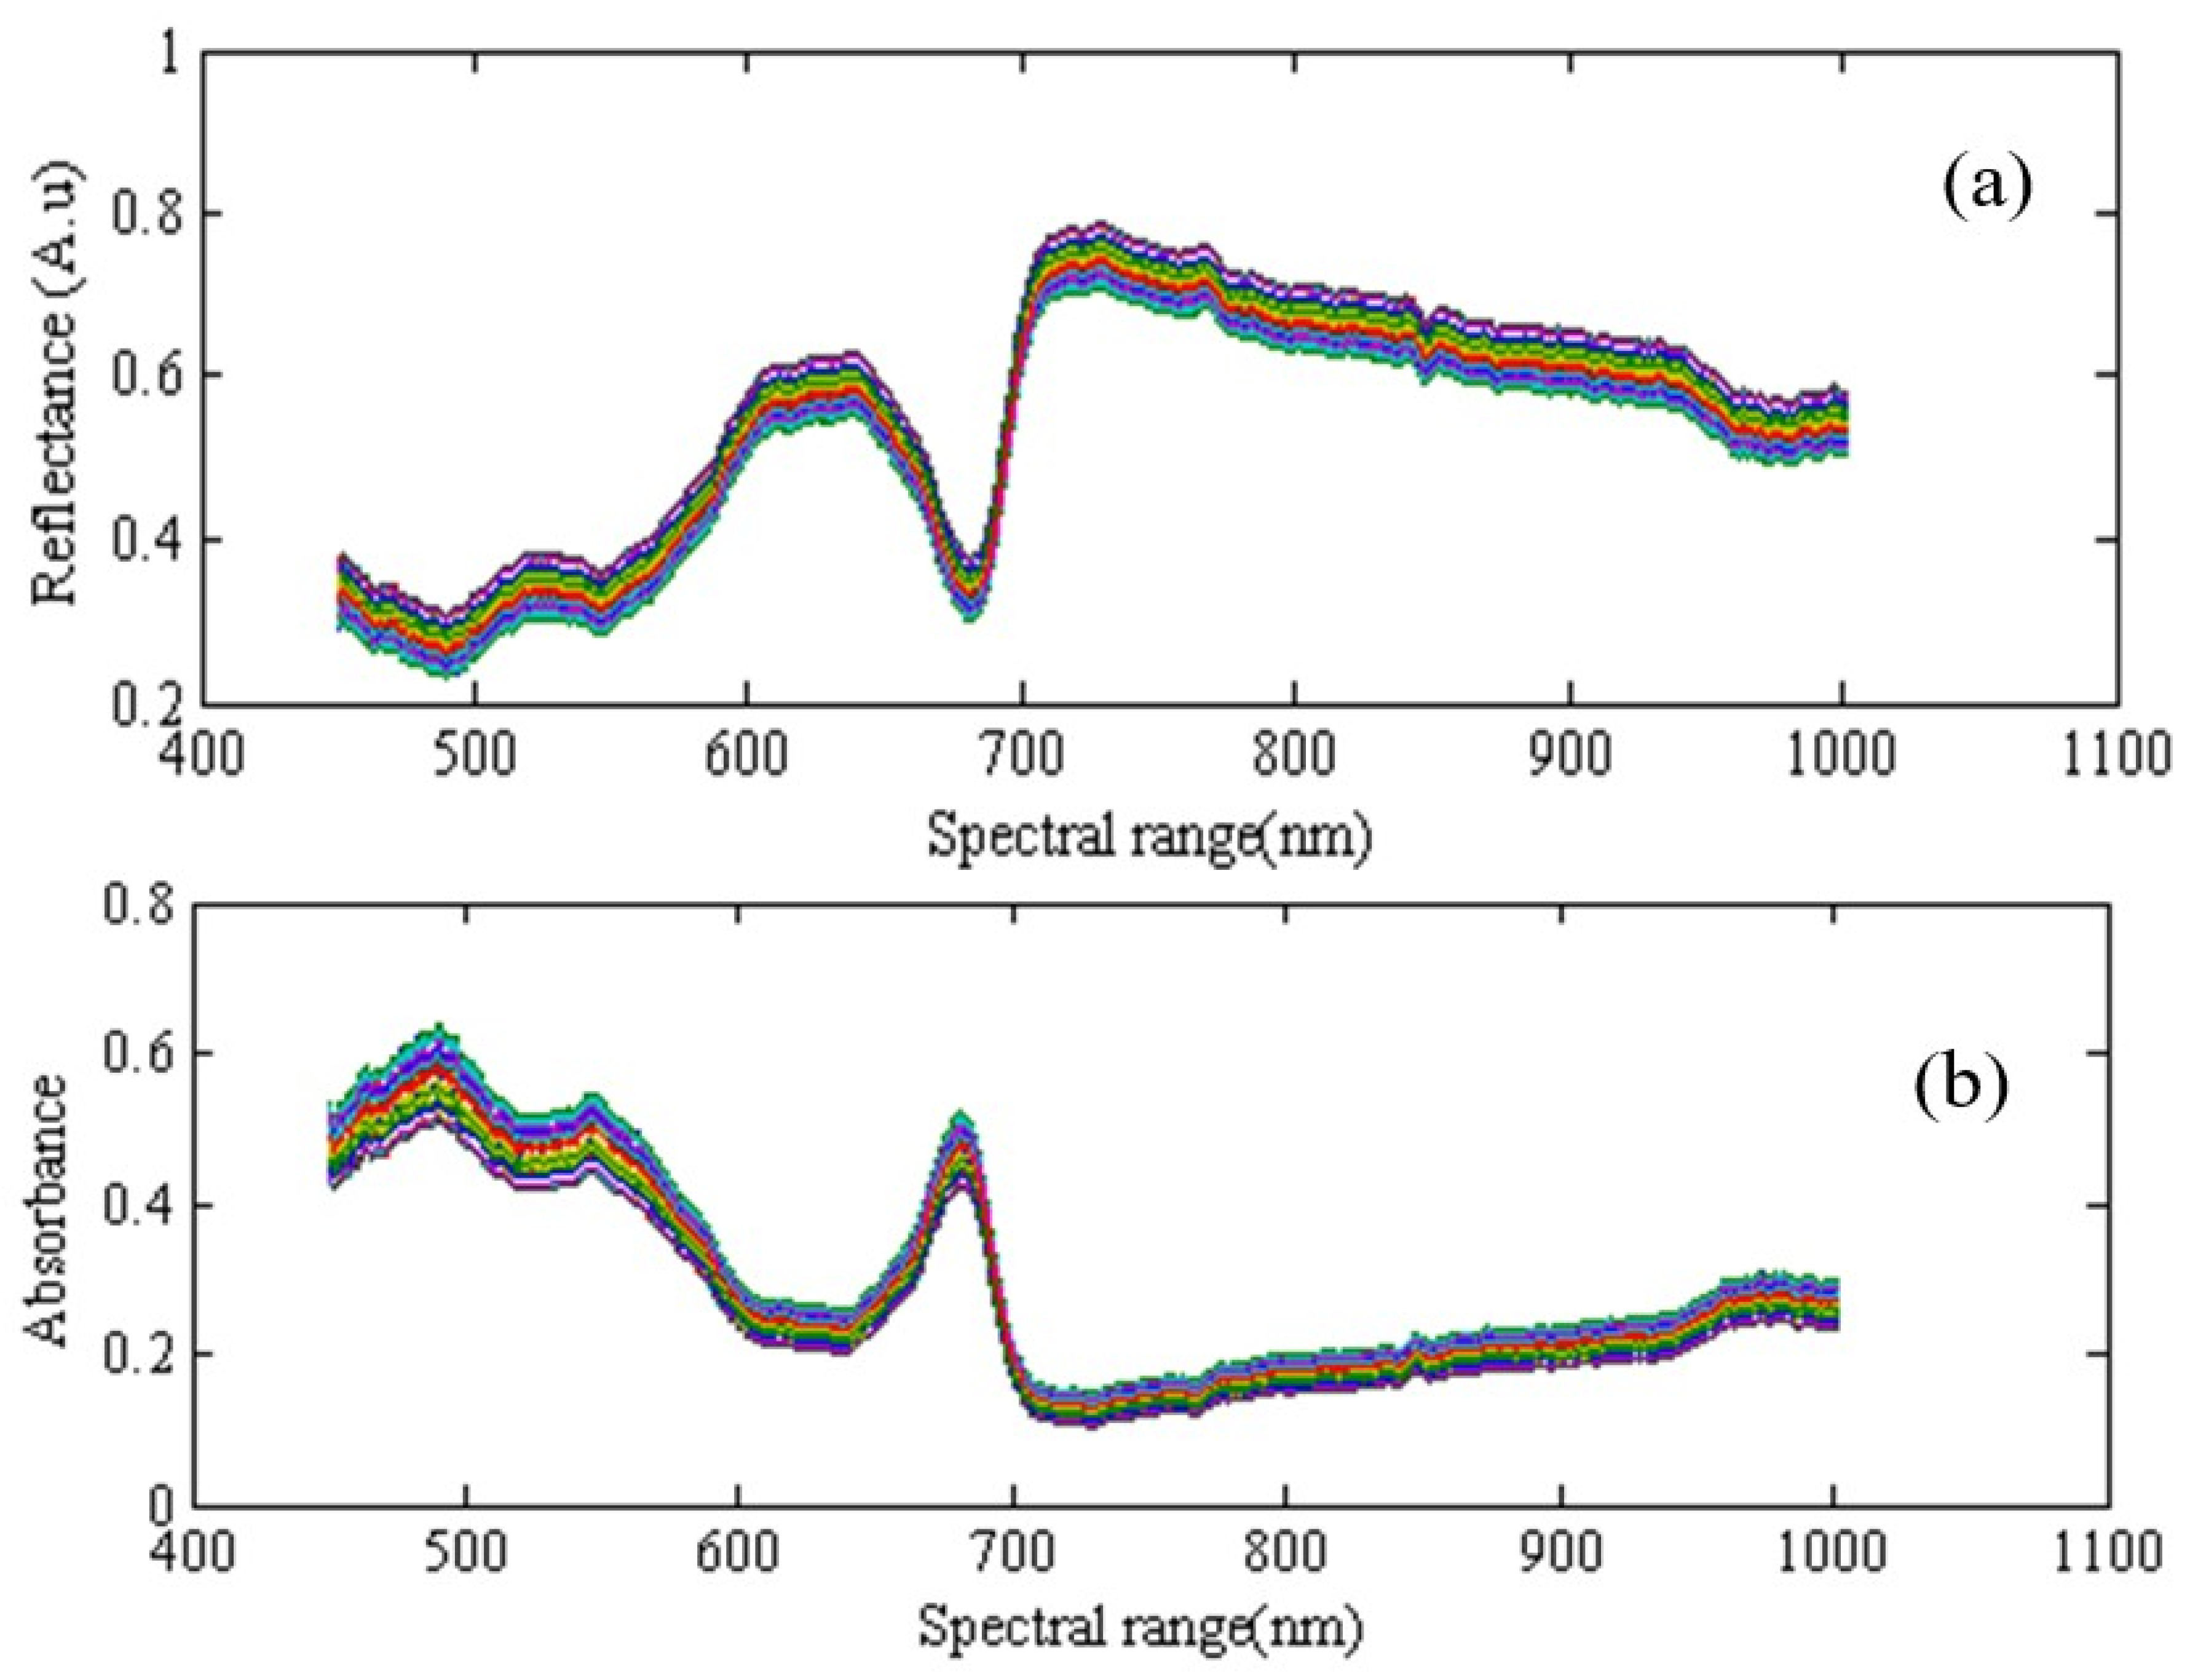
2.4. Spectrum Used for Non-Destructive Estimation of Starch and TSS Properties

Spectral graphs of the Fuji apple samples have several peaks, including peaks at wavelengths of 496, 549, 683, 849, 875, and 962 nm. In this study, spectral data around these peaks were analyzed, and starch and TSS properties were estimated. For non-destructively estimation of starch content and TSS, the spectral peaks with the best results were thoroughly analyzed. Therefore, spectral data of 800 to 900 nm could predict the amount of starch content, and spectral data of 920 to 980 nm to estimate TSS.
Predicting starch and TSS requires 3 to 9 wavelengths. Limiting factors to develop a portable device are cost and size. Therefore, the number of wavelengths used for prediction should be as low as possible. Thus, it is crucial to select the most effective wavelengths. In this study, a hybrid ANN-simulated annealing algorithm was used to select the most effective wavelengths. This algorithm is like the metal annealing operation process performed repetitively to achieve a stable material state with lowest energy use [33].
Table 1 gives the hidden layer structure of the neural network used to select the most effective wavelengths. Each neural network has an input and an output vector. The output vector contains data on fruit properties and the input vector contains spectral data. The simulated annealing algorithm has the task of selecting adequate inputs to the ANN. Following this procedure, the simulated annealing algorithm introduces vectors of different sizes as inputs to the ANN and records the optimal vector. Different wavelengths within the vector are chosen as the most effective wavelengths.

2.5. Non-Destructive Estimation of Starch and TSS Properties

Non-destructive estimation of starch and TSS was performed using a hybrid ANN-biogeography-based optimization (BBO). The hybrid ANN-BBO algorithm is inspired by how different animal and plant species are distributed in different parts of the universe [34]. The different steps of the bio-based algorithm are as follows.
  • Generating the initial population or so-called initial random habitat and sorting them;
  • Determining migration and immigration rates;
  • Repeating step 4–8 for each habitat such as j;
  • Steps 5 to 8 are repeated for each variable such as k at location j;
  • Changes are made according to steps 6 to 8 with the probability of migrating to a habitation;
  • Determine the origin of the migration using random values;
  • Migrating from one habitation to another;
  • Random changes (mutations) are applied to the variable;
  • The set of new responses is evaluated;
  • Combining the original population with the migration-related population and creating a new stage population;
  • Return to step 3 if the termination is not fulfilled.
The purpose of this algorithm is to adjust the parameters of the multilayer perceptron (MLP). MLP has five adjustable parameters: the number of neurons, the number of layers, transfer function, the back-propagation network training function, and the back-propagation weight/bias learning function [35]. The number of neurons selectable for the first layer was between 1 and 25, and between 0 and 25 for the other layers. The number of layers was at least one and a maximum of 3. The transfer function for each layer was selected from 13 different functions, such as tansig. The back-propagation network training function was selected from 19 different functions, such as traincgb. Finally, the back-propagation weight/bias learning function was selected from 15 different functions, such as learnwh. These are the functions available in the toolbox of the artificial neural network of MATLAB.
ANN’s input is the spectral data, and its output is the starch content and TSS. The BBO algorithm adjusts the vector’s network structure in each step of the training ANN, and the result is recorded as the mean squared error (MSE). Finally, any vector of adjustable parameters with the least MSE is considered as the optimal vector. After selecting the optimal structure of ANN, 100 replications were performed to evaluate the reliability of ANN. It should be noted that among 140 samples, after extracting spectral properties, 60% were randomly used as training data, 10% as validation data, and 30% as test data.

2.6. Performance Evaluation Criteria for Starch and TSS

Coefficient of determination (R2), sum squared error (SSE), mean absolute error (MAE), mean square error (MSE), root mean square error (RMSE) were used to evaluate the performance of starch and soluble solids [36].

3. Result and Discussion

3.1. Reflectance Spectra

Figure 2 represents the diagrams of the reflectance spectra, and the spectra converted to absorption of Fuji apples. As can be seen, there are different peaks in the absorption spectral graphs, each containing useful information to predict different physicochemical properties.

3.2. Wavelengths Selection by the Hybrid ANN-SA

Diagrams of the reflectance spectra and the spectra converted to absorption of Fuji apples were created from samples at different maturity times. Different peaks in the absorption spectral graphs represented useful information to predict Fuji apples’ starch and TSS properties. Estimating the starch content for non-destructive Fuji apple, the most effective wavelengths selected by hybrid ANN-SA algorithm were 852.58, 855.54, 849.03, 855.83, 853.47, 844.90 nm, while estimating TSS, the most effective wavelengths selected by hybrid ANN-SA algorithm were 967.86, 966.67, 964.90, 958.40, 957.22, 963.97 nm. Table 2 gives the optimal structure of the ANN hidden layers adjusted by the bio-based optimization algorithm to predict starch and TSS. As can be seen, the best ANN structure for predicting starch content and TSS is three layers and two layers, respectively.

3.3. Performance of the Hybrid ANN-BBO in Estimating Fruit Properties Based on Spectral Data

Figure 3 represents the regression plot between the mean estimated and actual amount of starch of Fuji apples based on spectral data of 800 to 900 nm. As mentioned, 100 iterations were executed to evaluate the hybrid ANN-BBO method’s reliability in predicting starch. The regression coefficient was 0.97 for predicting starch, indicating the algorithm’s high accuracy in predicting starch at the given spectral range. Figure 4 represents the criteria evaluating the performance of the ANN-BBO for predicting the starch content of Fuji apple at 100 iterations. These graphs indicate that in all iterations, the regression coefficient value for starch was higher than 0.87, and in the best state of training, it was close to 0.97.
According to Figure 5, the regression coefficient of 0.94 for predicting TSS implies that TSS estimation at the range of 920–980 is highly accurate. Figure 6 illustrates that in all iterations, the prediction algorithm’s regression coefficient was higher than 0.83. In the best state of training, it was close to 0.96. The performance of hybrid ANN-BBO was evaluated using boxed diagrams of mean estimated and actual starch and actual TSS of apple at the range of 800 to 900 nm. Most samples’ box diagrams were almost overlapped, indicating close results between estimated and actual starch values and TSS values.

3.4. Performance of the Method in Estimating Fruit Properties Based on the Most Effective Wavelengths

Figure 7 shows the regression plot between the mean estimated and actual starch of Fuji apple (test set) based on the most effective wavelengths. Each iteration included 140 test samples, so there will be 14,000 samples in 100 iterations. The regression coefficient of the ANN-BBO method was above 0.96. Figure 8 illustrates the hybrid ANN-BBO method’s performance in estimating the starch content using data of the most effective wavelength. Results of different iterations had close results in the estimation of starch.
Figure 9 represents the regression plot between the mean estimated and the actual (measured) TSS using data of effective wavelengths. The regression coefficient of the ANN-BBO method was above 0.94. Figure 10 indicates that hybrid ANN-BBO has close estimations for TSS in different iterations. Box diagrams representing the difference between actual and mean estimated starch content and TSS of Fuji apples using the proposed ANN-BBO method showed a close relationship.

3.5. Comparison of the Performance of Hybrid ANN-BBO in Predicting Fruit Properties Using Spectral Data and Data Related to the Most Effective Wavelengths

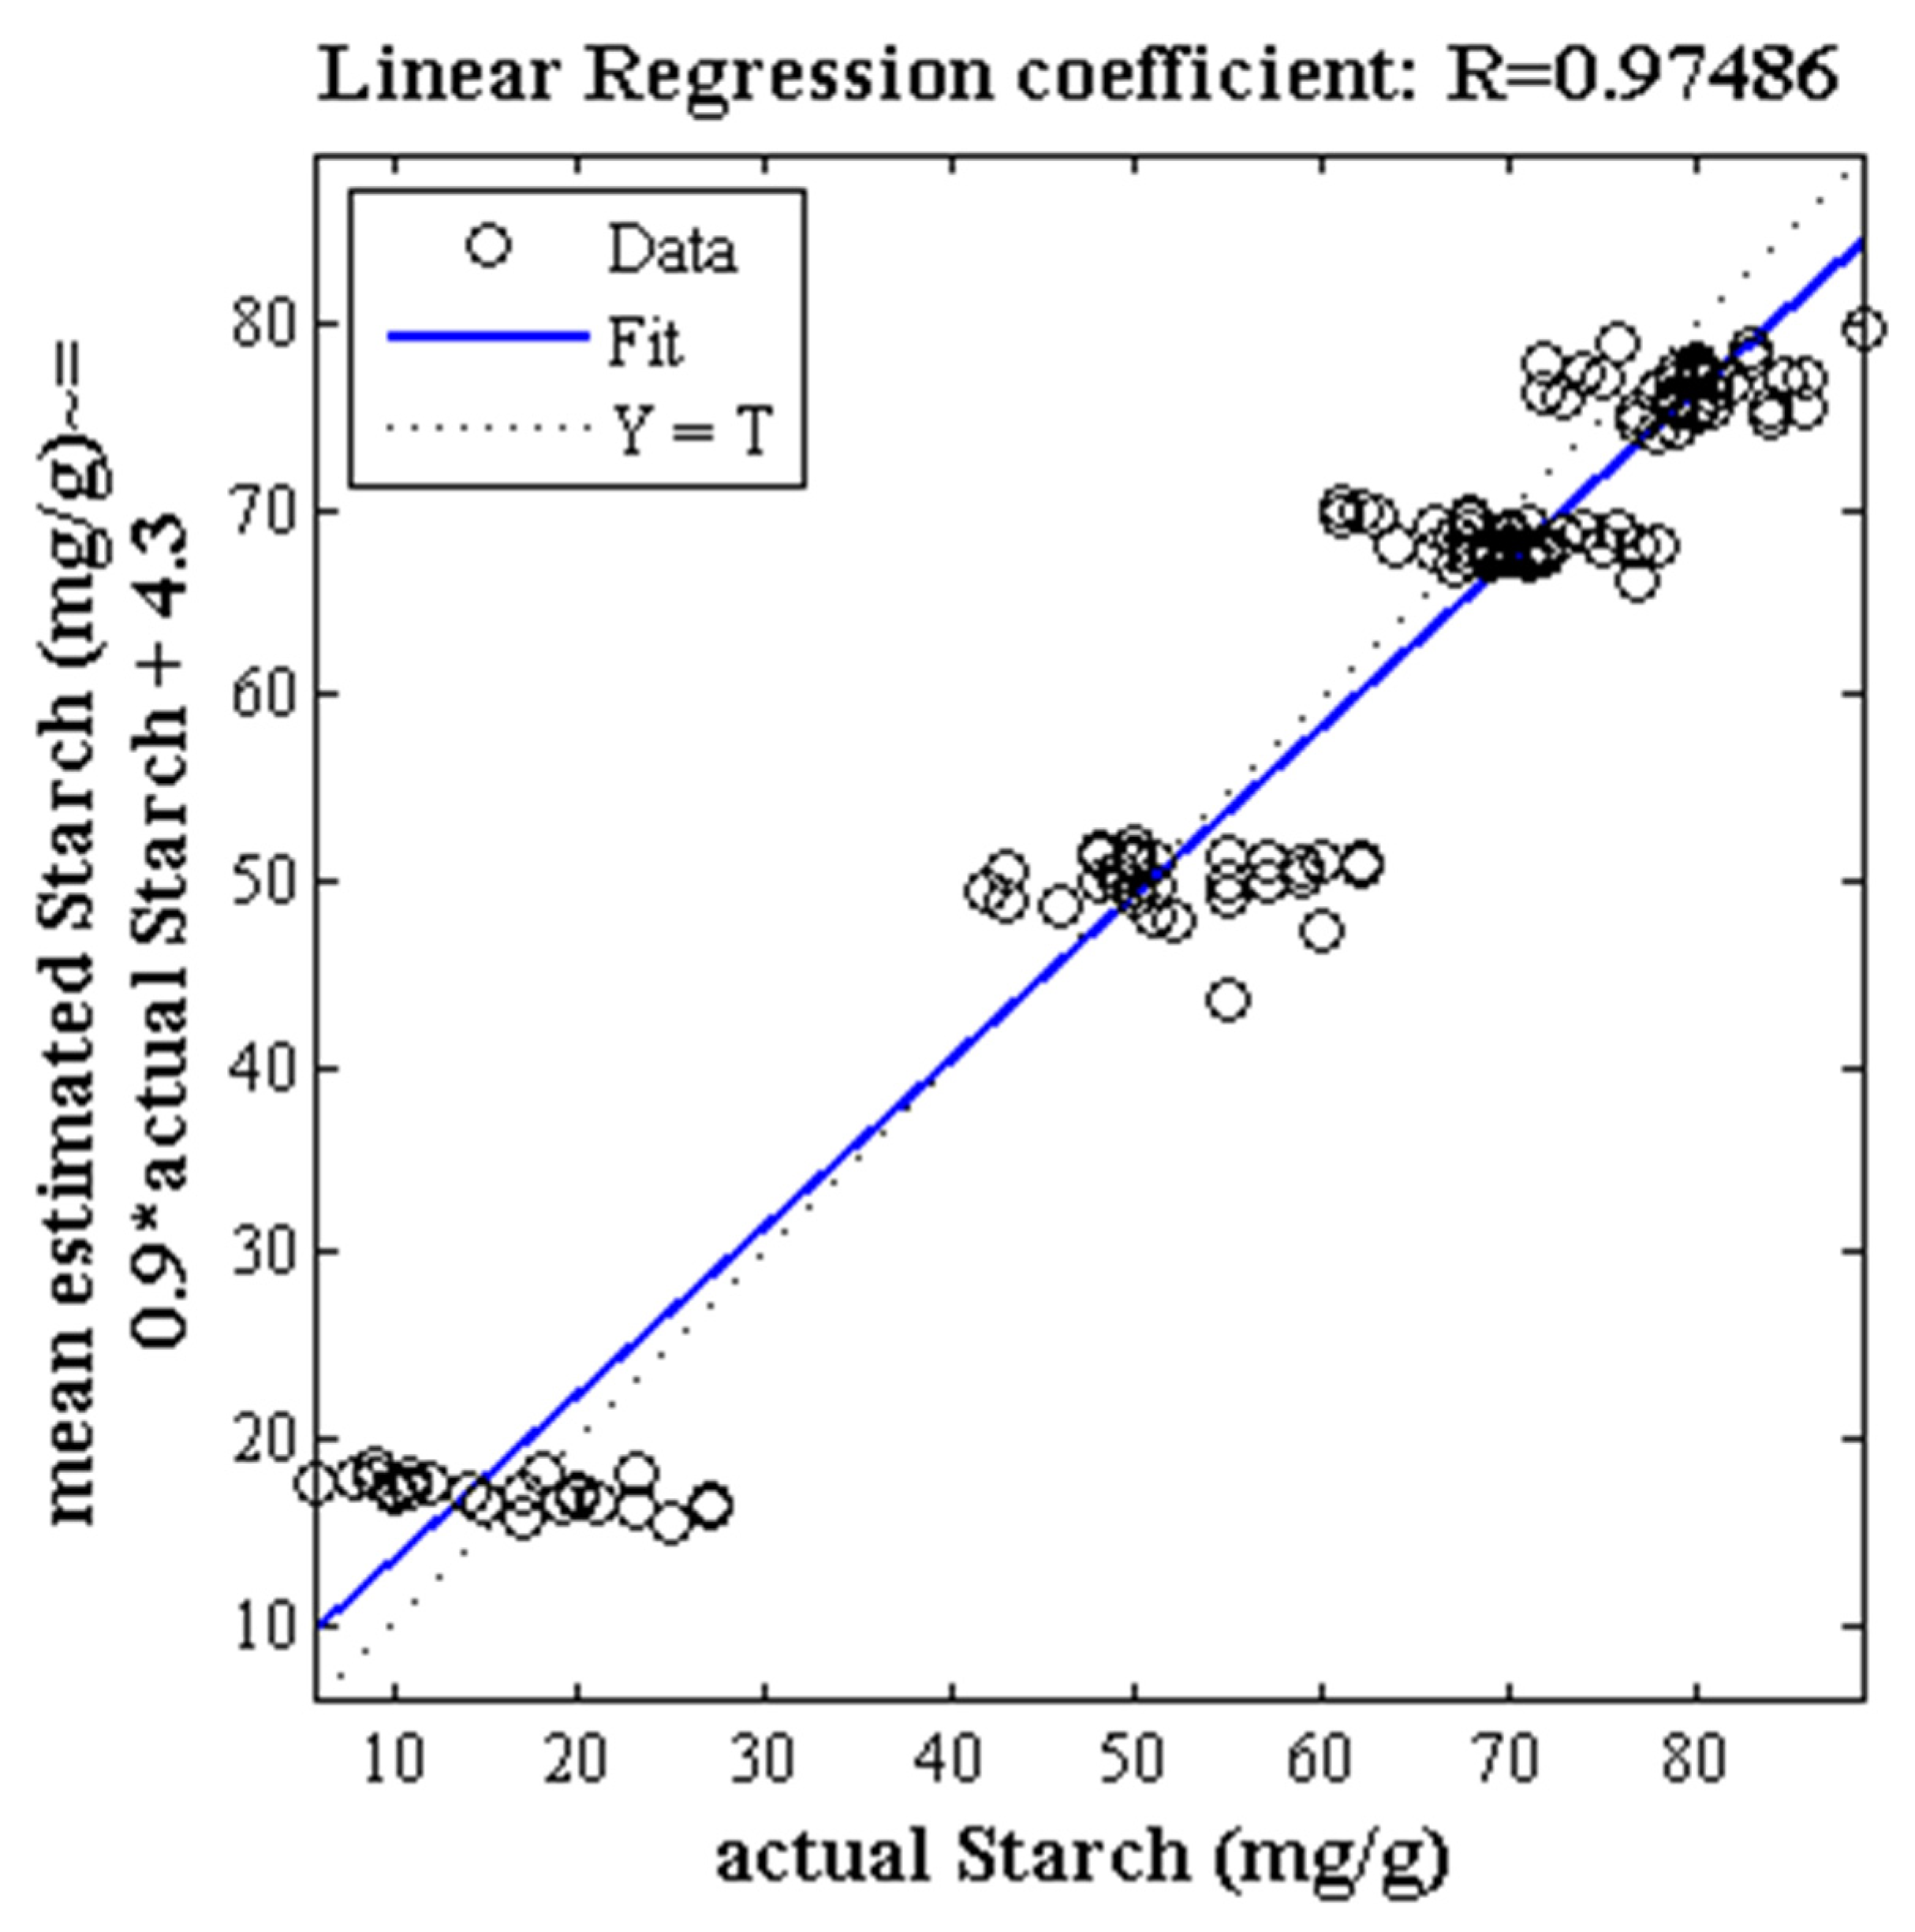
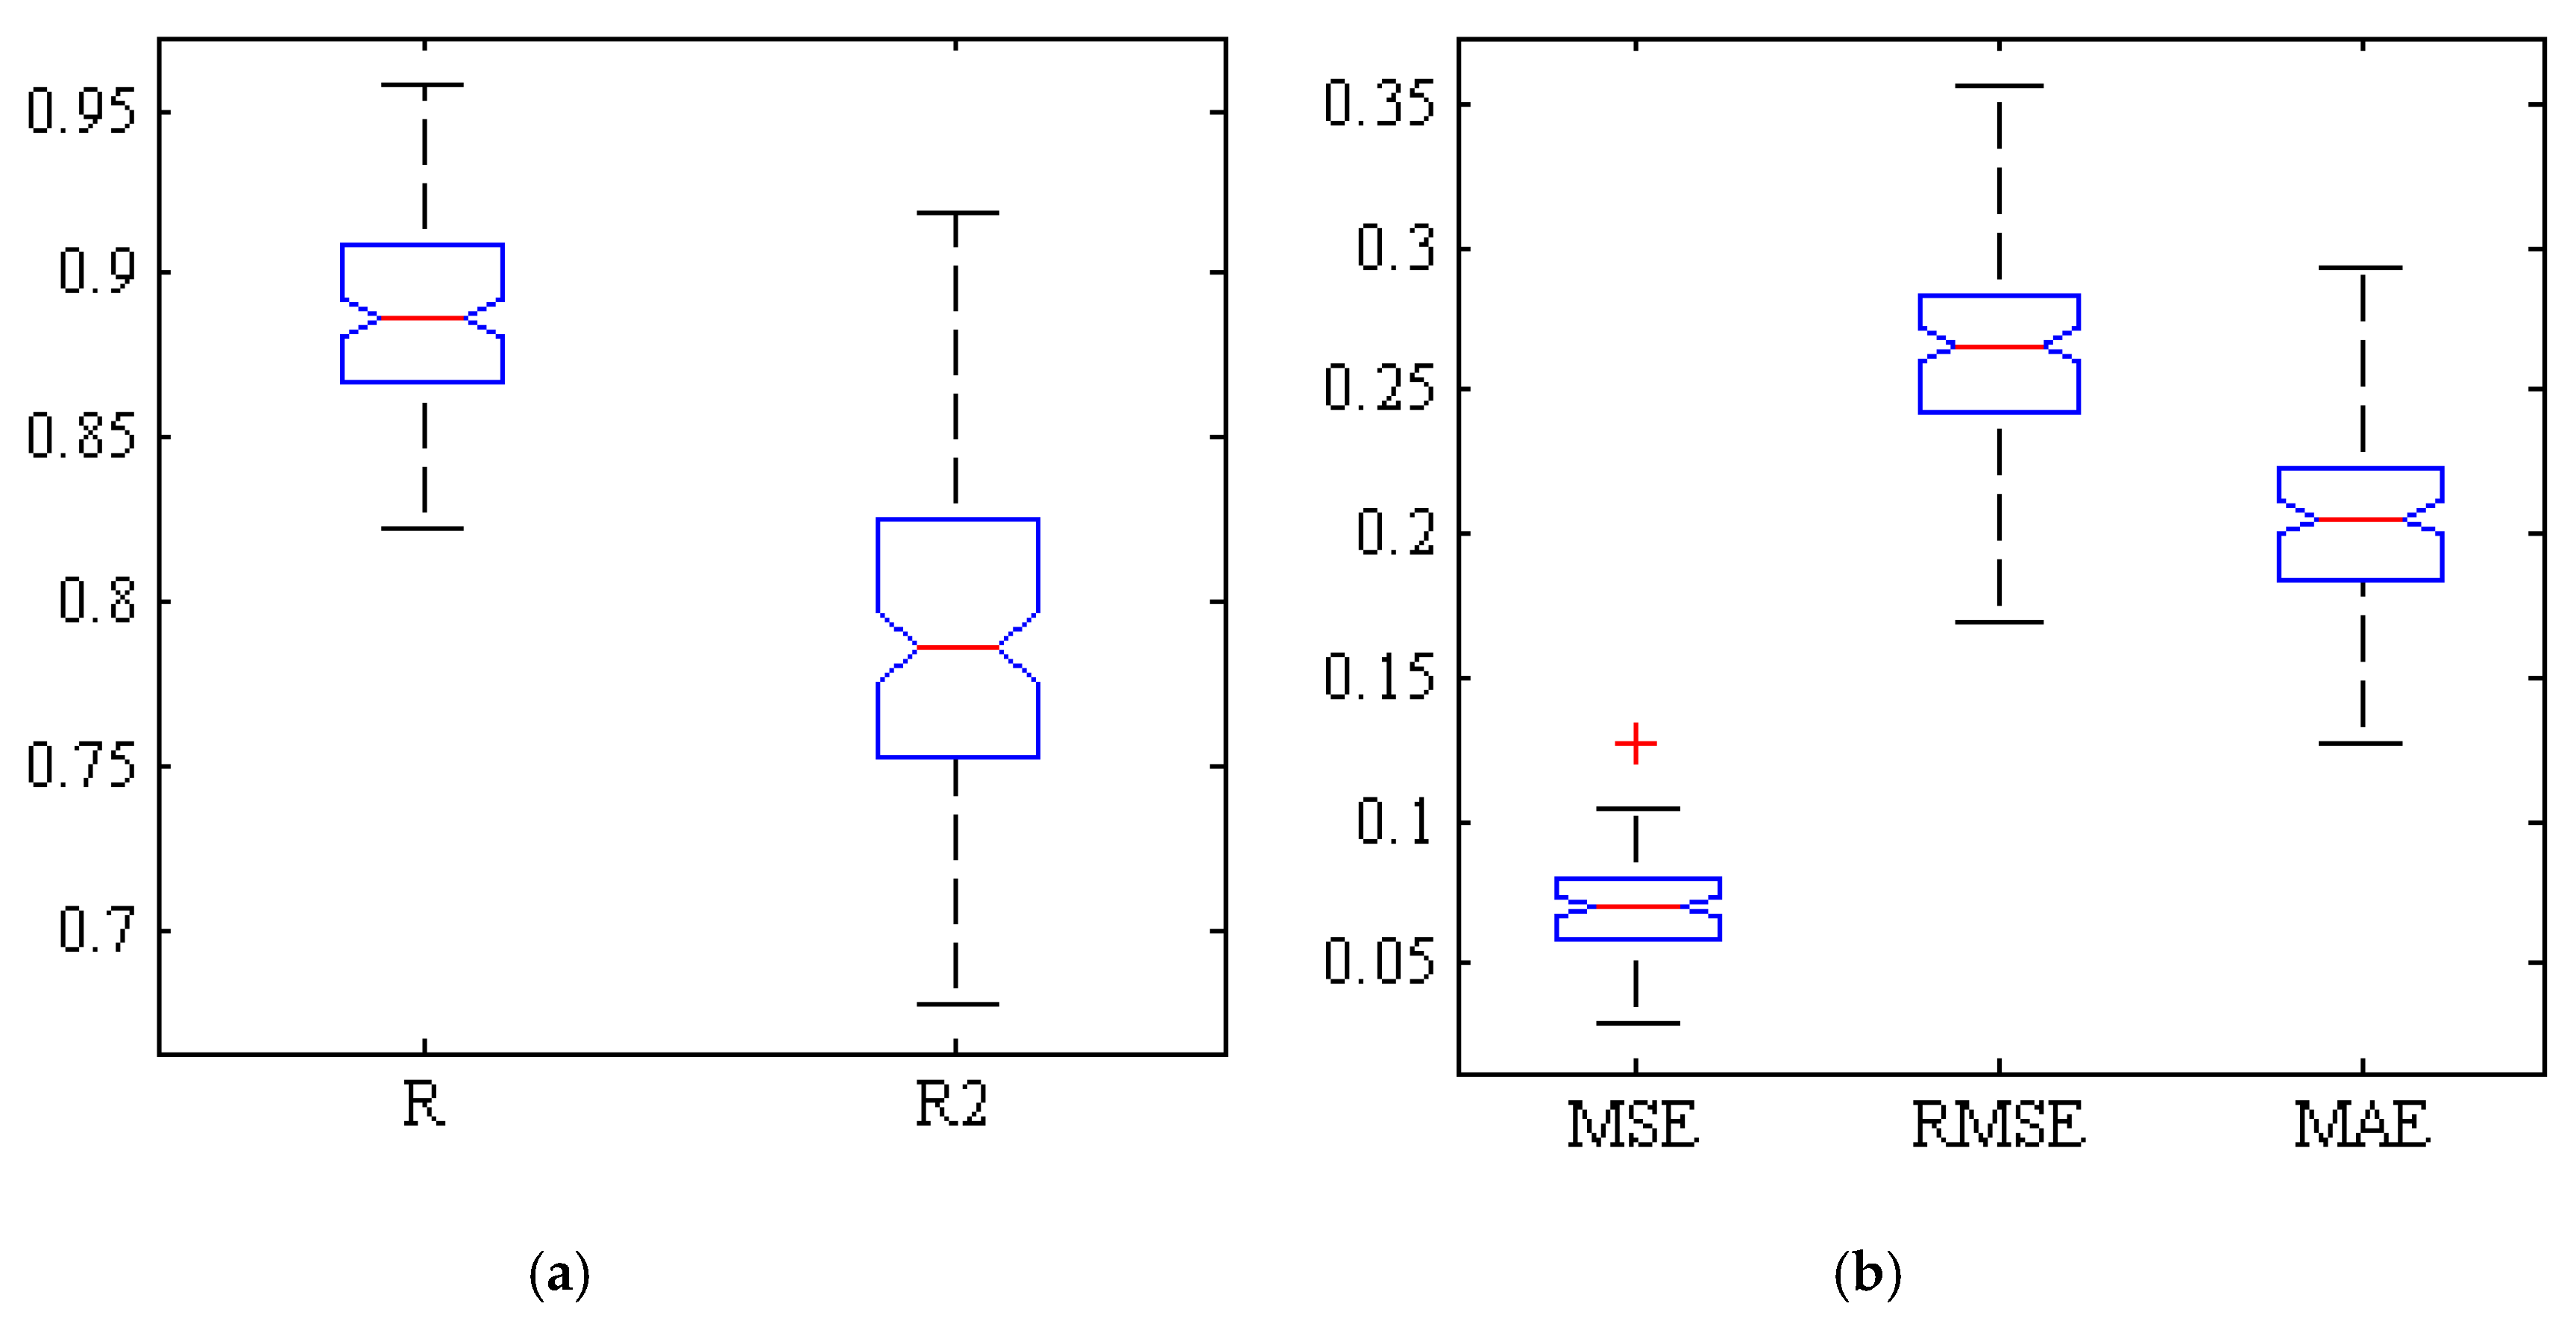
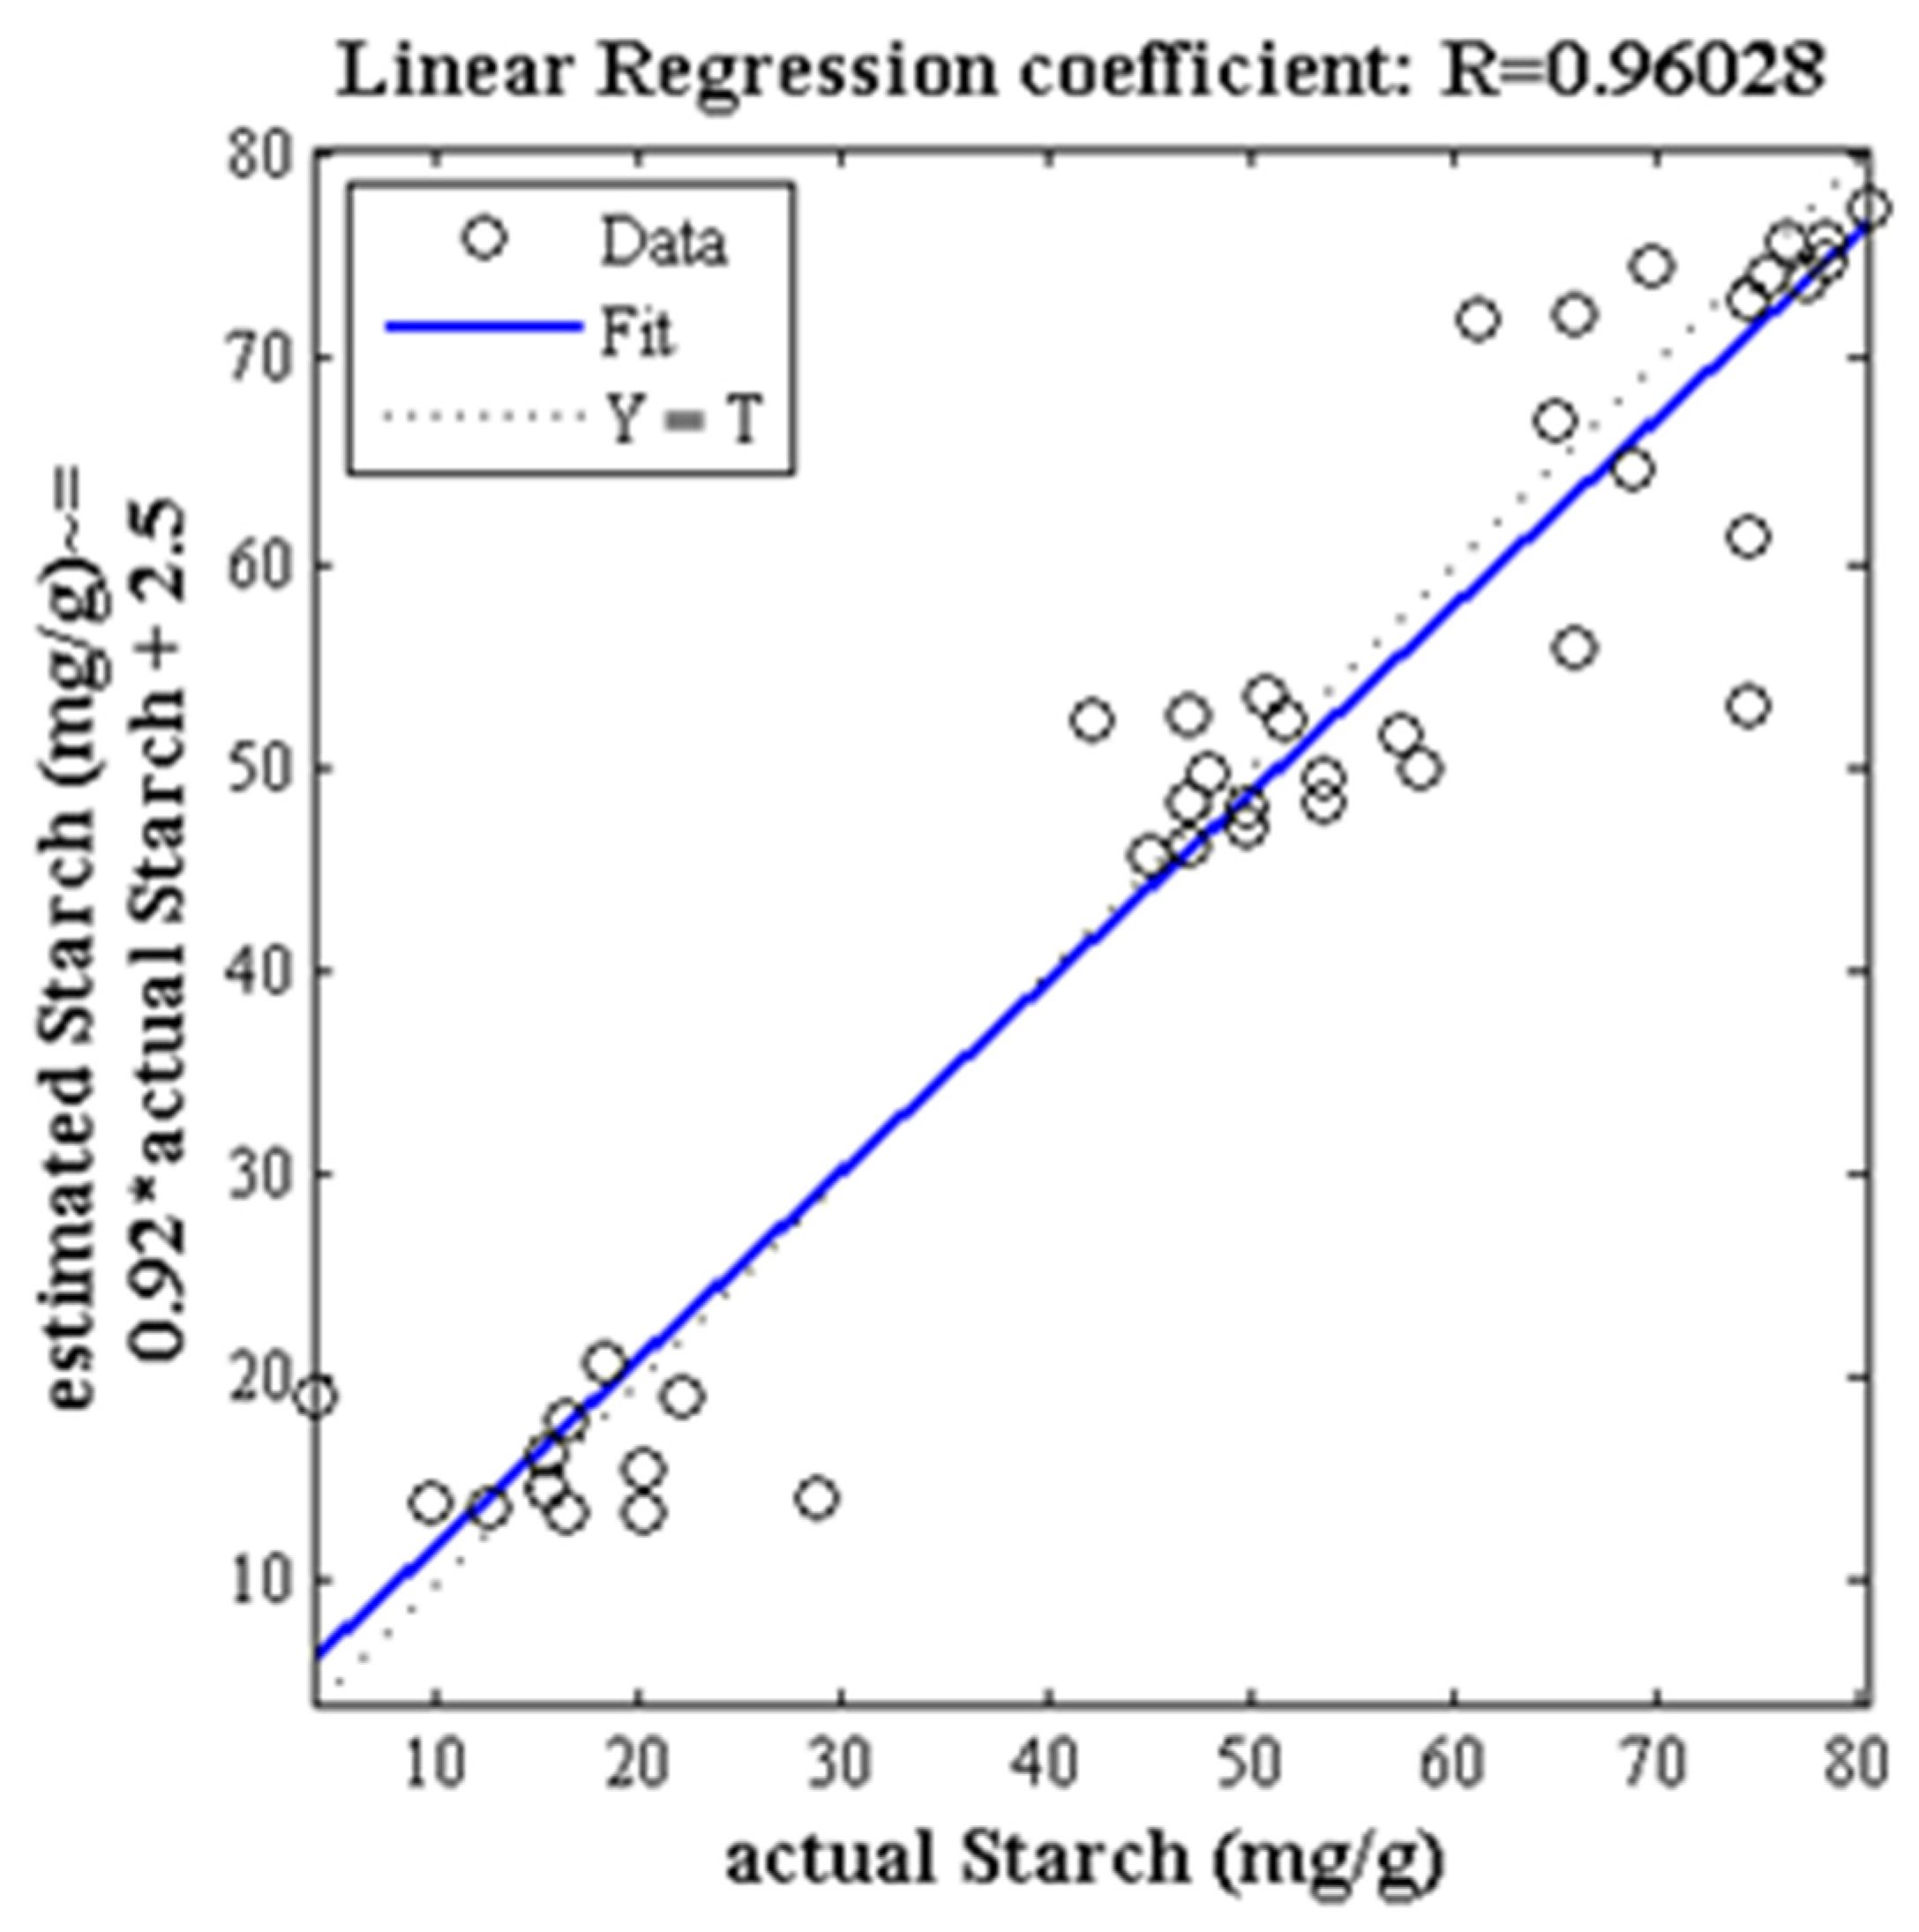
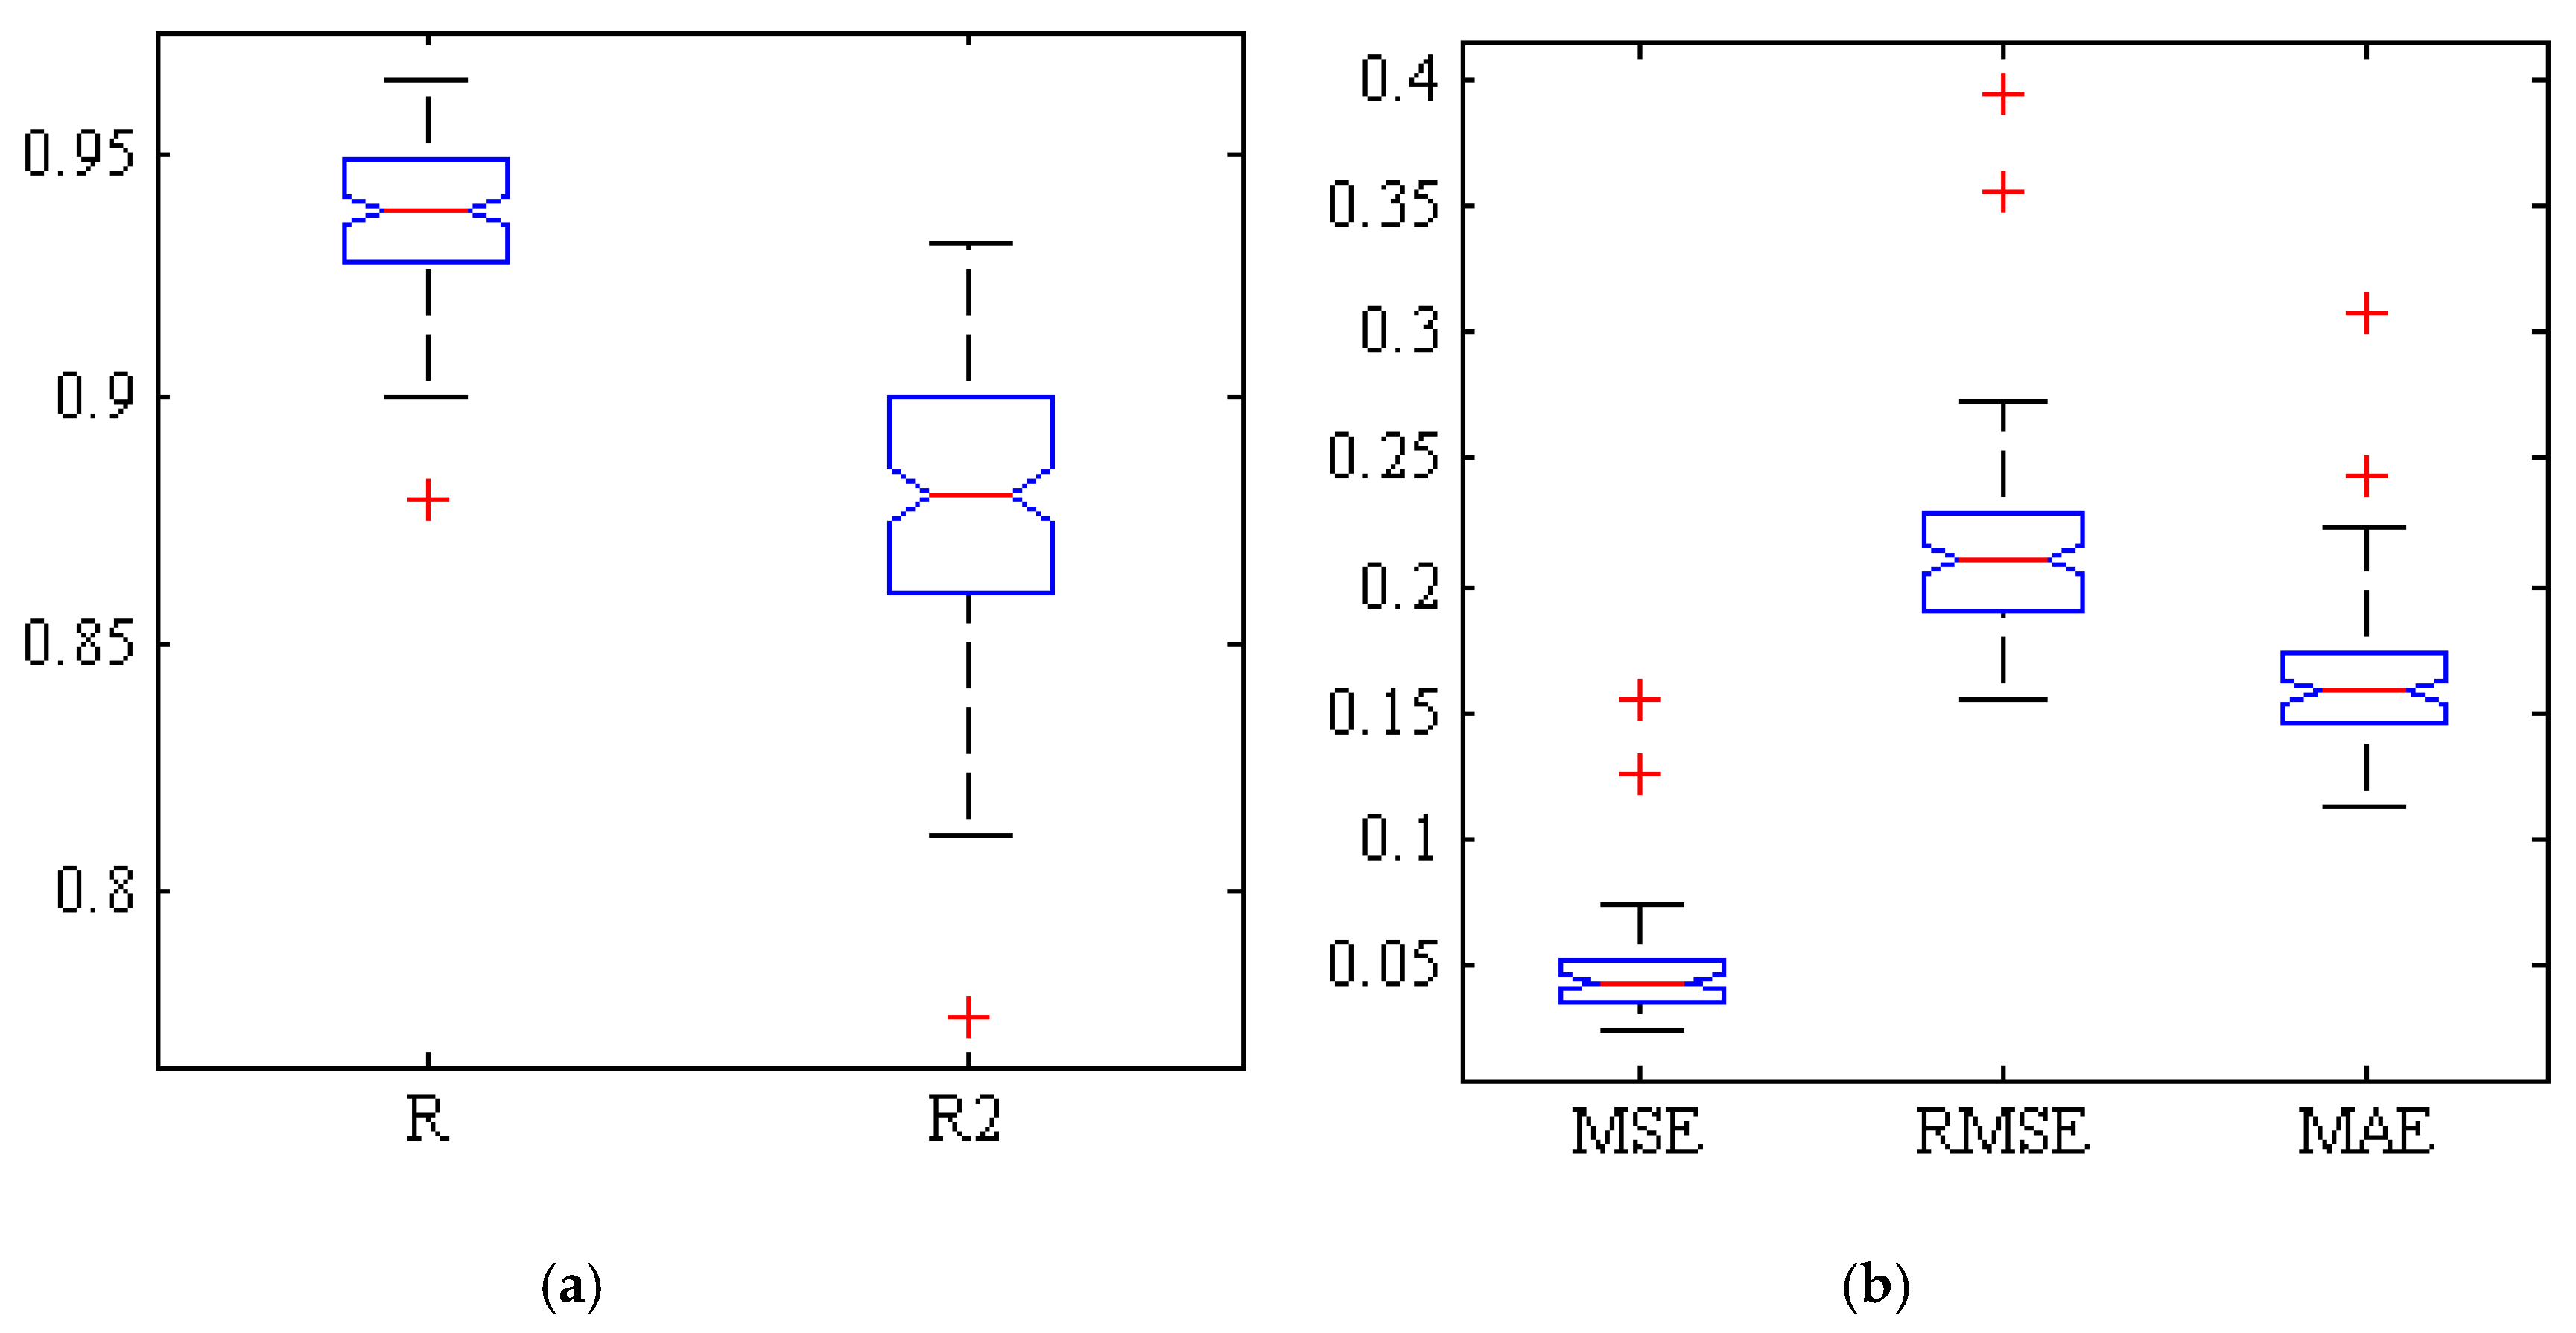
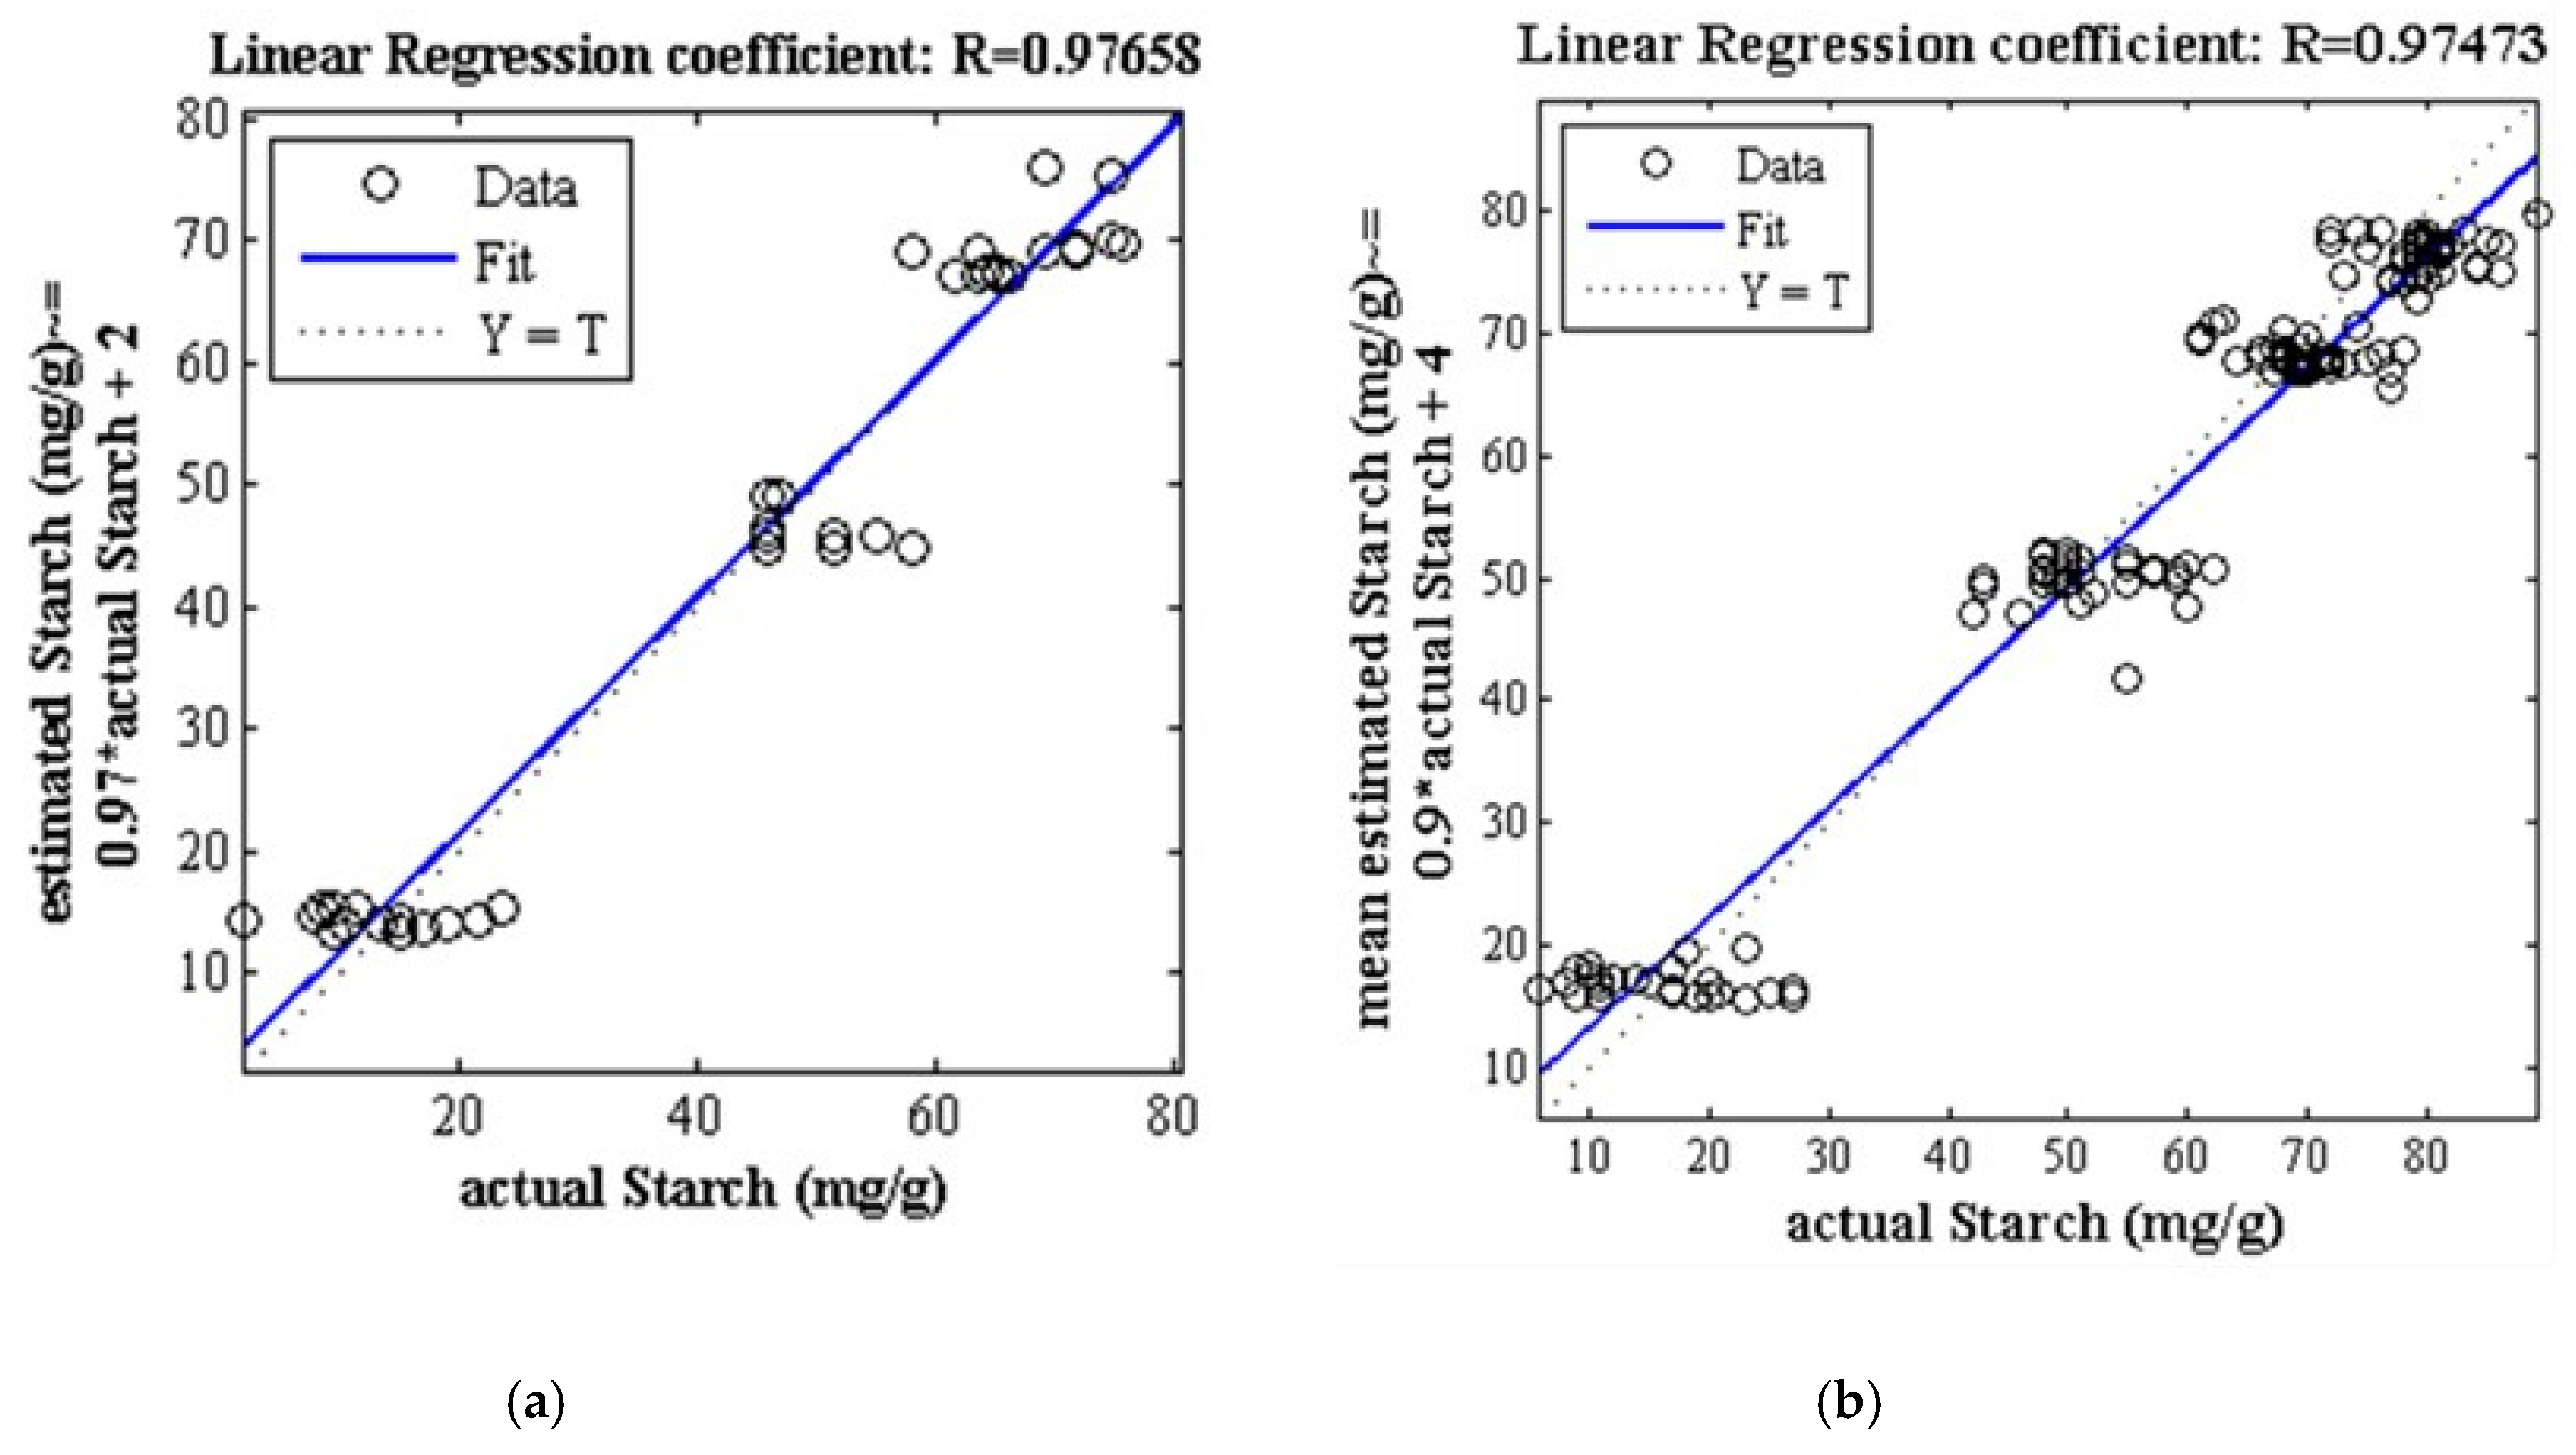
3.5.1. Properties of Starch

As seen in Figure 11, the regression coefficients obtained using spectral data of 800 to 900 and effective spectral data are above 0.97, which means the starch content is predictable. Table 3 gives the mean and standard deviation of the ANN-BBO algorithm predicting the starch of apples in 100 iterations and the values of the various criteria in the best state of training using spectral data of 800 to 900 nm and the data of the most effective wavelength. Given the nearly identical performance in different iterations, it can be said that the proposed method has high reliability.

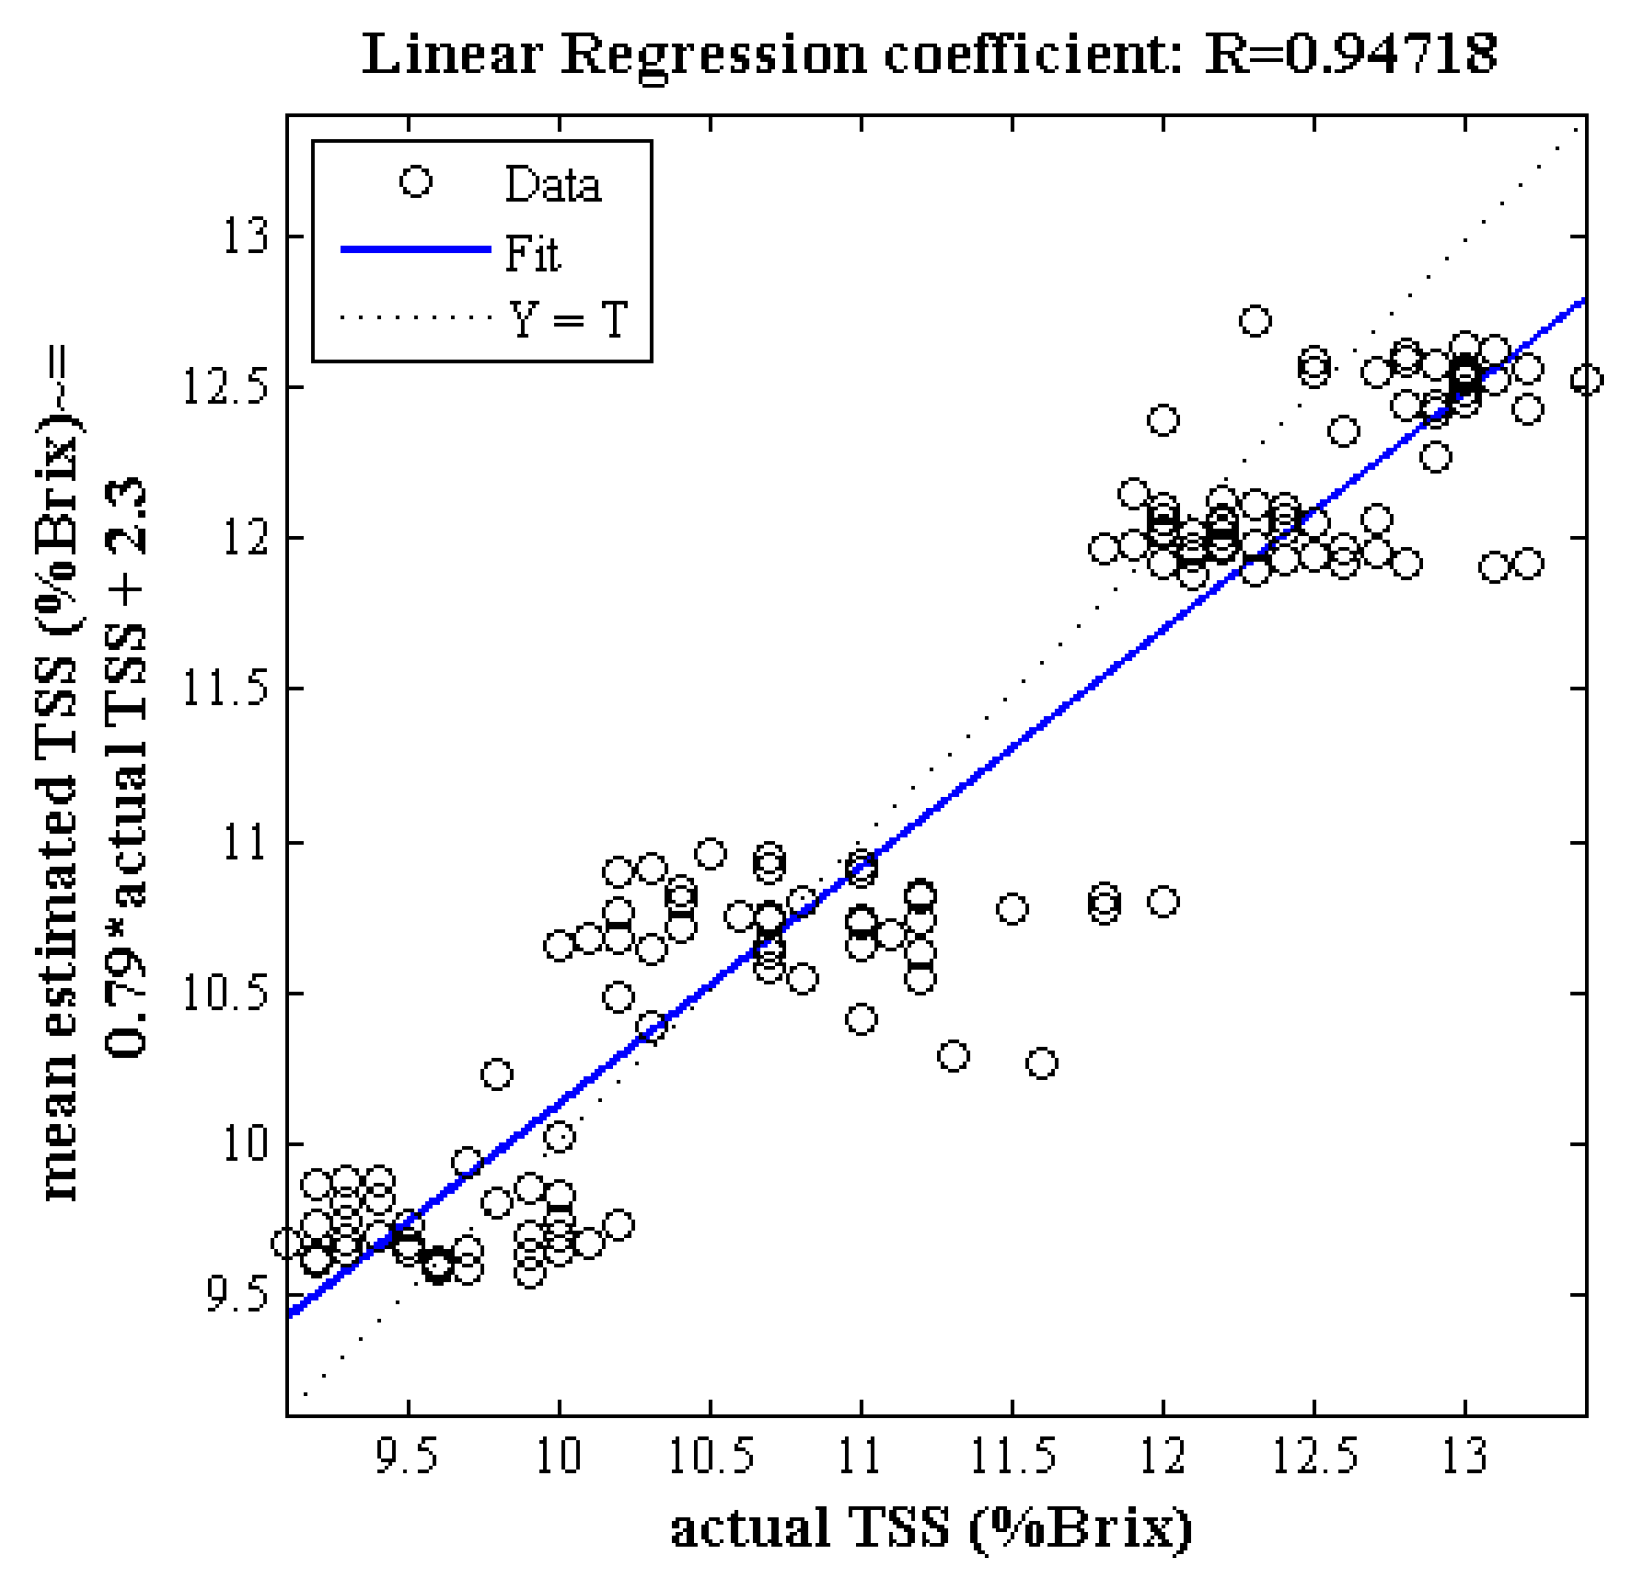
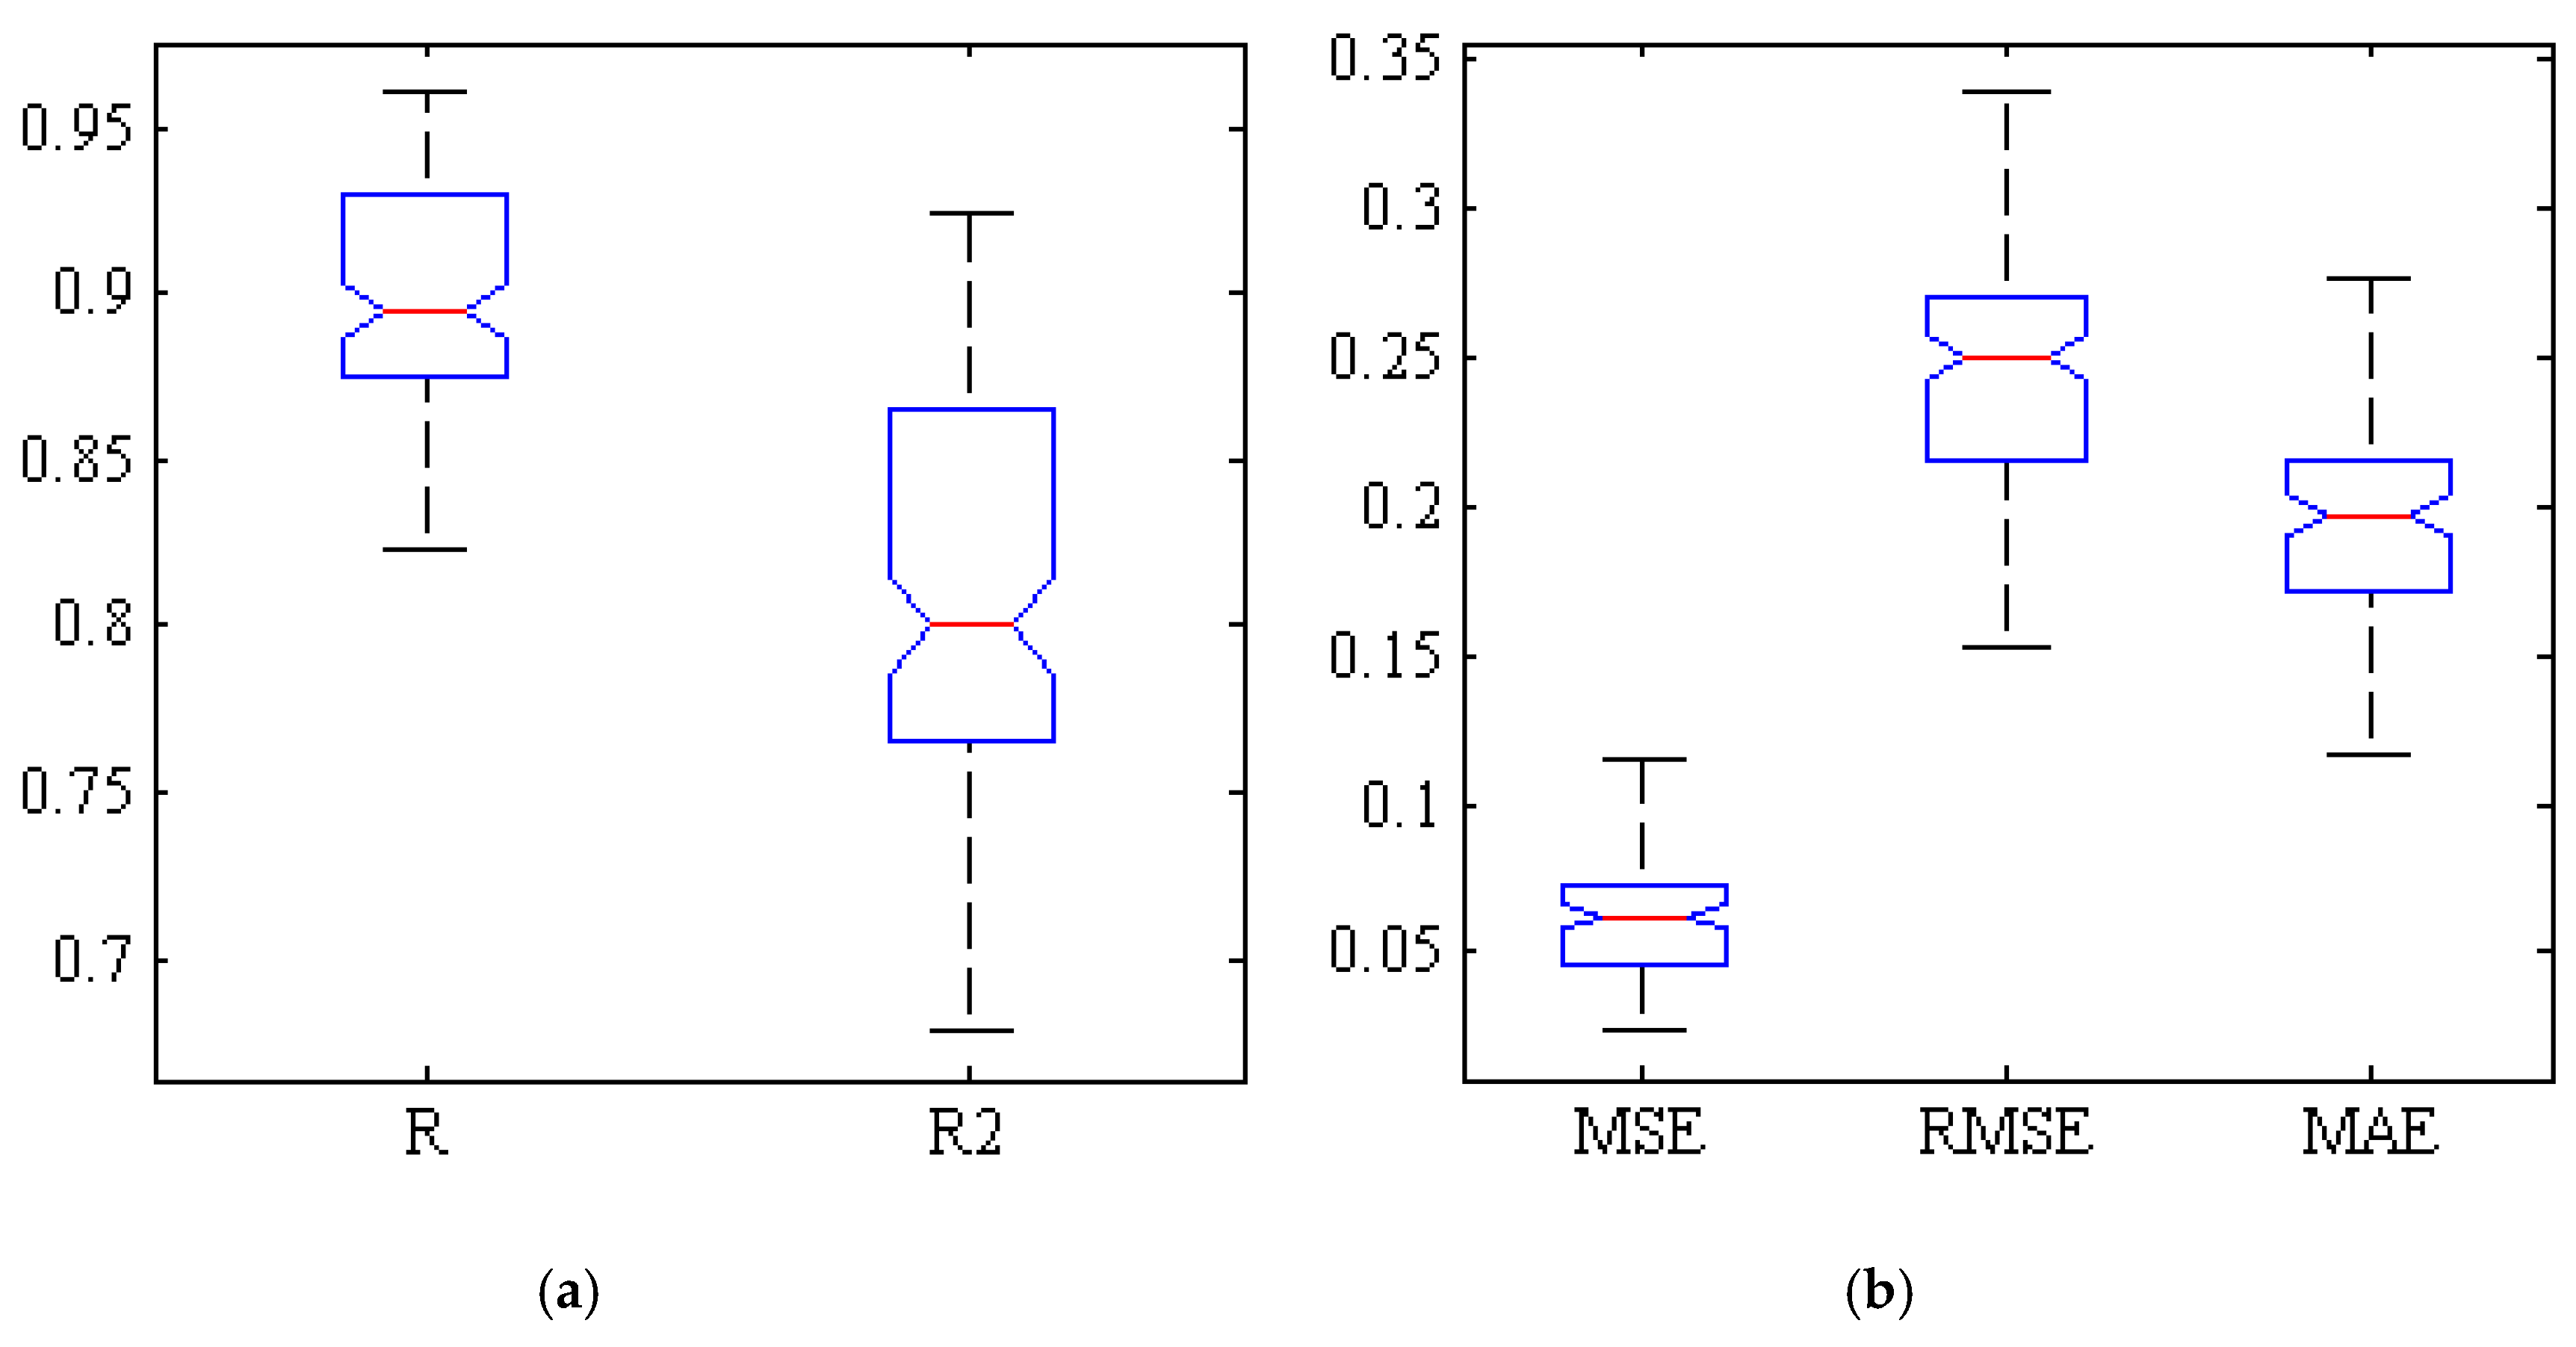
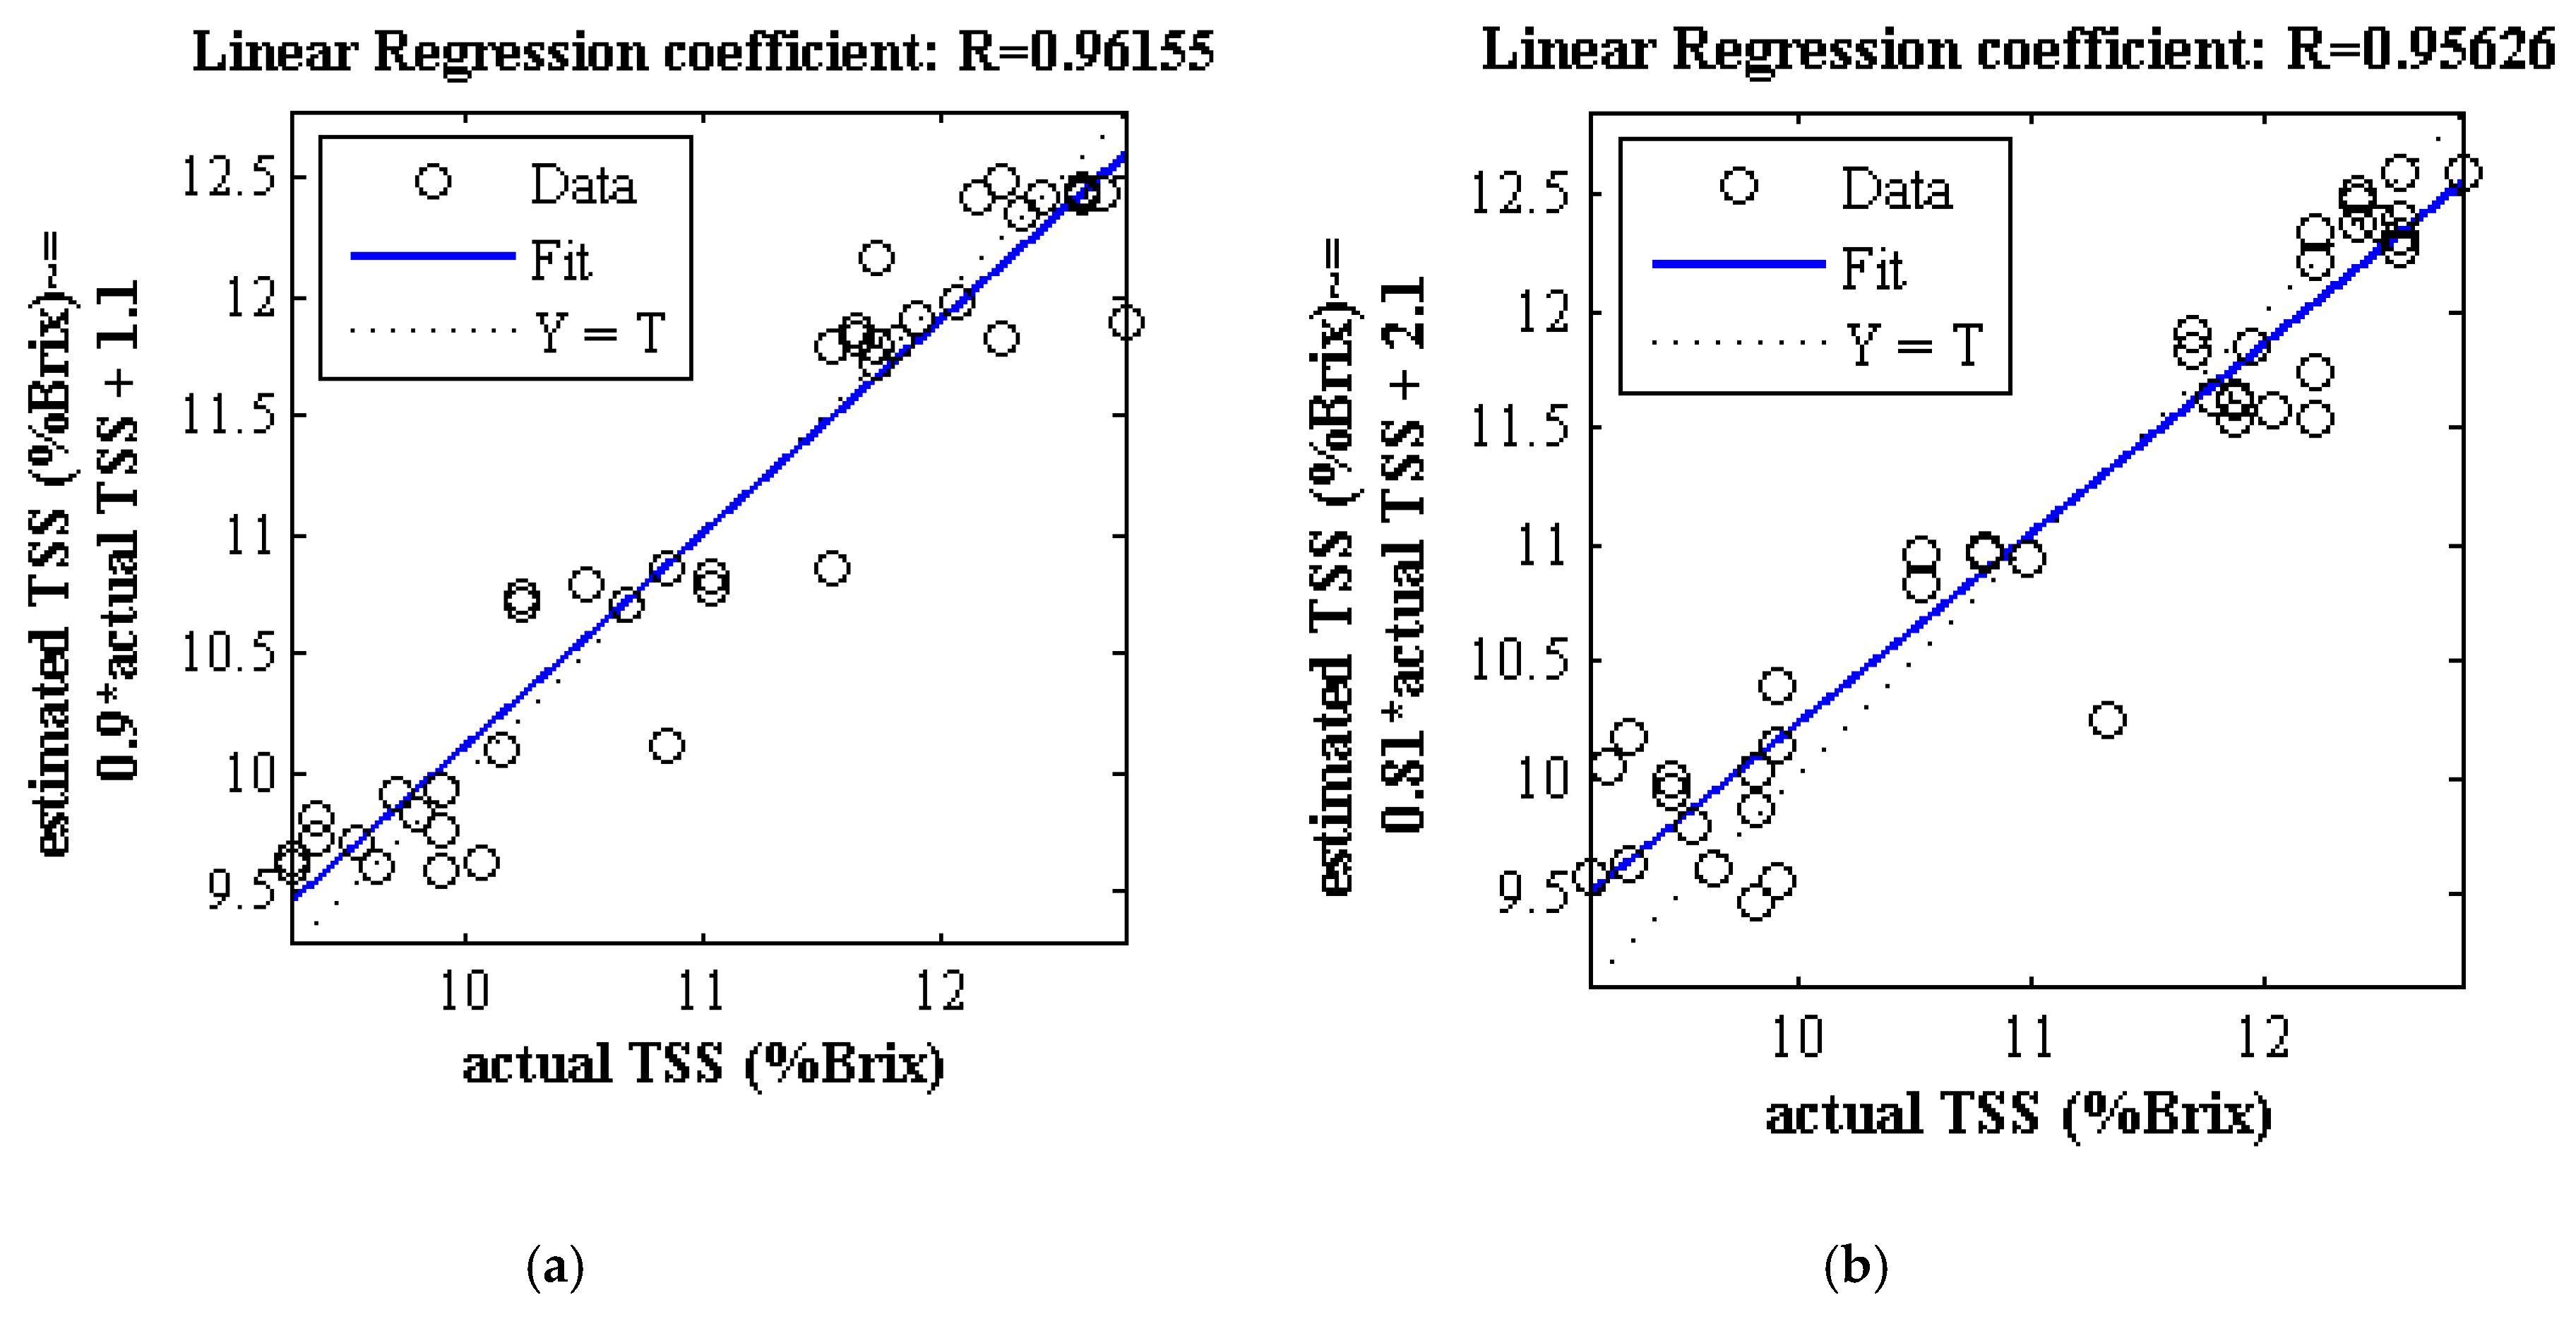
3.5.2. Properties of Total Soluble Solids (TSS)

As seen in Figure 12, the regression coefficients obtained by data based on 920 to 980 nm and the most effective wavelengths are above 0.95, and thus TSS of Fuji apples can be predicted with both data types. According to Table 4, the mean and standard deviation of the hybrid ANN-BBO at 100 iterations using spectral data of 920 to 980 nm and the effective wavelength is near similar; therefore, the proposed method is highly reliable.

3.6. Comparison of the Proposed Method with Other Researchers

After investigating the proposed algorithm’s performance using different criteria, the results were compared with other researchers’ results. Table 5 gives a comparison of the different studies. As can be seen, the proposed method based on spectral data has a high regression coefficient at the best state of training and using the most effective wavelengths, indicating the high performance of the proposed method.
Most methods published on a non-destructive estimation of fruit properties are based on samples collected and assessed under controlled laboratory conditions after fruit temperature equilibration [37]. Predictions of non-destructive methods based only on internal validations tend to be overestimated in the literature. A comparison between internal and external validations is needed to demonstrate NIR’s real potentialities in field conditions [38].
Previous research from Pourdarbani et al. [39] using linear (partial least squares regression, PSLR) and nonlinear (artificial neural network, ANN) regression estimation of firmness, acidity (pH), and starch content of 160 Fuji apple fruit showed less robust estimation of starch content with R2 0.865 for ANN and 0.91 for PLSR.

4. Conclusions

This study proposed a hybrid ANN-BBO algorithm based on spectral data of 800 to 900 nm and 920 to 980 for non-destructive estimation of two properties, namely starch and TSS. The most important results are:
  • The most effective wavelengths selected by hybrid artificial neural network-simulated annealing algorithm to estimate TSS correspond to the wavelengths around the peak of 950 nm. In addition, the most effective wavelengths estimate starch corresponds to the wavelengths around the peak of 850 nm.
  • Due to the small amount of standard deviation of the results obtained by hybrid ANN-BBO in 100 iterations, it can be said that the proposed method has high reliability because of close results in different iterations.
  • The TSS were predicted with a regression coefficient above 0.8 in all iterations. Since this feature is related to the ripening stage of fruits, a high-performance portable device can estimate Fuji apple’s ripening stage using the most effective wavelengths to manage post-harvest operations better.
Precision agriculture requires the availability of portable tools that can be used in the field. The results help optimize Fuji apples’ harvest time and apply precision agriculture at the orchard, supporting the postharvest operations. One of the requirements of portable devices that can be used in orchards is their portable size and low price. Since effective wavelengths are selected from different ranges, the amount of extracted data from each apple sample was reduced. Thus, a portable device predicting starch and TSS values can be developed. Another advantage of the proposed method was using the biogeography-based optimization evolutionary algorithm, which optimally adjusts the artificial neural network’s main parameters and, in practice, ensures its high efficiency in estimating starch and TSS values. External validation is needed in order to demonstrate the real potentialities of NIR in field conditions.

Author Contributions

Conceptualization, R.P. and S.S.; methodology, S.S.; validation, T.P., S.S. and S.J.; formal analysis, S.S. and T.P.; investigation, R.P.; writing—original draft preparation, R.P., S.S. and T.P.; writing—review and editing, T.P.; visualization, T.P.; supervision, T.P, S.S. and S.J. All authors have read and agreed to the published version of the manuscript.

Funding

AGNETICS funded the APC.

Acknowledgments

This research was supported by the project NIBAP—Núcleo de Investigação em Biotecnologia e Agricultura de Precisão FEDER ALG-01-0247-FEDER-037303.

Conflicts of Interest

The authors declare no conflict of interest.

References

  1. Blasco, J.; Aleixos, N.; Cubero, S.; Gomez-Sanchis, J.; Molto, E. Automatic sorting of Satsuma (Citrus unshiu) segments using computer vision and morphological features. Comput. Electron. Agric. 2009, 66, 1–8. [Google Scholar] [CrossRef]
  2. Leemans, V.; Destain, M. A real-time grading method of apples based on features extracted from defects. J. Food Eng. 2004, 61, 83–89. [Google Scholar] [CrossRef] [Green Version]
  3. Kondo, S.; Uthaibutra, J.; Gemma, H. Comparison of 1-aminocyclopropane-1-carboxylic acid, abscisic acid and anthocyanin content of some apple cultivars during fruit growth and maturation. J. Jpn. Soc. Hort. Sci 1991, 60, 505–511. [Google Scholar] [CrossRef]
  4. Ncama, K.; Opara, U.L.; Tesfay, S.Z.; Fawole, O.A.; Magwaza, L.S. Application of Vis/NIR spectroscopy for predicting sweetness and flavour parameters of ‘Valencia’ orange (Citrus sinensis) and ‘Star Ruby’ grapefruit (Citrus x paradisi Macfad). J. Food Eng. 2017, 193, 86–94. [Google Scholar] [CrossRef]
  5. Liu, Y.; Sun, X.; Zhang, H.; Aiguo, O. Non-destructive measurement of internal quality of Nanfeng mandarin fruit by charge coupled device near infrared spectroscopy. Comput. Electron. Agric. 2010, 71, 10–14. [Google Scholar] [CrossRef]
  6. Arendse, E.; Fawole, O.A.; Opara, U.L. Influence of storage temperature and duration on postharvest physico-chemical and mechanical properties of pomegranate fruit and arils. Cyta J. Food 2014, 12, 389–398. [Google Scholar] [CrossRef] [Green Version]
  7. Pourdarbani, R.; Sabzi, S.; Kalantari, D.; Hernández-Hernández, J.L.; Arribas, J. A computer vision system based on majority-voting ensemble neural network for the automatic classification of three chickpea varieties. Foods 2020, 9, 113. [Google Scholar] [CrossRef] [Green Version]
  8. Eisenstecken, D.; Stürz, B.; Robatscher, P.; Lozano, L.; Zanella, A.; Oberhuber, M. The potential of near infrared spectroscopy (NIRS) to trace apple origin: Study on different cultivars and orchard elevations. Postharvest Biol. Technol. 2019, 147, 123–131. [Google Scholar] [CrossRef]
  9. Gowen, A.A.; ODonnell, C.P.; Cullen, P.J.; Downey, G.; Frias, J.M. Hyperspectral imaging e an emerging process analytical tool for food quality and safety control. Trends Food Sci. Technol. 2007, 18, 590–598. [Google Scholar] [CrossRef]
  10. Zhang, L.; McCarthy, M.J. Black heart characterization and detection in pomegranate using NMR relaxometry and MR imaging. Postharvest Biol. Technol. 2012, 67, 96–101. [Google Scholar] [CrossRef]
  11. Donis-González, I.R.; Guyer, D.E.; Fulbright, D.W.; Pease, A. Postharvest noninvasive assessment of fresh chestnut (Castanea spp.) internal decay using computer tomography images. Postharvest Biol. Technol. 2014, 94, 14–25. [Google Scholar] [CrossRef]
  12. Magwaza, L.S.; Opara, U.L. Analytical methods for determination of sugars and sweetness of horticultural products—A review. Sci. Hort. 2015, 184, 179–192. [Google Scholar] [CrossRef]
  13. Clement, A.; Dorais, M.; Vernon, N. Non-destructive measurement of fresh tomato lycopene content and other physicochemical characteristics using visible-NIR spectroscopy. J. Agric. Food 2008, 56, 9813–9818. [Google Scholar] [CrossRef] [PubMed]
  14. Baranska, M.; Schutze, W.; Schulz, H. Determination of lycopene and B-carotene content in tomato fruits and related products: Comparison of FT-Raman, ATR-IR, and NIR spectroscopy. Anal. Chem. 2006, 78, 8456–8461. [Google Scholar] [CrossRef] [PubMed]
  15. Pan, J.; Wang, G.; Li, X.; He, H.; Wu, A.; Cai, R. Construction of a genetic map with SRAP markers and localization of the gene responsible for the first-flowernode trait in cucumber (Cucumis sativus L.). Prog. Nat. Sci. 2005, 15, 407–413. [Google Scholar]
  16. Cavaco, A.M.; Antunes, M.D.; Panagopoulos, T.; Rosendo, M.; Pires, R.; Brázio, A.; Silva, L.; Afonso, A.M.; Guerra, R. Upgrading current practices in Vis/NIR spectroscopy for insitu orchard monitoring. Acta Hortic. 2018, 1194, 745–752. [Google Scholar] [CrossRef]
  17. Guerreiro, A.; Vieira, A.I.; Brázio, A.; Gago, C.; Cavaco, A.; Panagopoulos, T.; Veloso, F.; Antunes, M.D.; Guerra, R. Quality characterization of kiwifruit (Actinidia deliciosa) cv. Hayward using destructive and optical non-invasive methods. Acta Hortic. 2018, 1218, 497–502. [Google Scholar] [CrossRef]
  18. Amoriello, T.; Ciccoritti, R.; Paliotta, M.; Carbone, K. Classification and prediction of early-to-late ripening apricot quality using spectroscopic techniques combined with chemometric tools. Sci. Hortic. 2018, 240, 310–317. [Google Scholar] [CrossRef]
  19. Bexiga, F.; Rodrigues, D.; Guerra, R.; Brázio, A.; Balegas, T.; Cavaco, A.M.; Antunes, M.D.; Oliveira, J.V. A TSS classification study of ‘Rocha’ pear (Pyrus communis L.) based on noninvasive visible/near infra-red reflectance spectra. Postharvest Biol. Technol. 2017, 132, 23–30. [Google Scholar] [CrossRef]
  20. Pourdarbani, R.; Sabzi, S.; Kalantari, D.; Karimzadeh, R.; Ilbeygi, E.; Arribas, J.I. Automatic non-destructive video estimation of maturation levels in Fuji apple (Malus Malus pumila) fruit in orchard based on colour (Vis) and spectral (NIR) data. Biosyst. Eng. 2020, 195, 136–151. [Google Scholar] [CrossRef]
  21. Uwadaira, Y.; Sekiyama, Y.; Ikehata, A. An examination of the principle of non-destructive flesh firmness measurement of peach fruit by using VIS-NIR spectroscopy. Heliyon 2018, 4, e00531. [Google Scholar] [CrossRef] [PubMed] [Green Version]
  22. Oliveira-Folador, G.; Bicudo, M.O.; Andrade, E.F.; Renard, C.M.G.C.; Bureau, S.; Castilhos, F. Quality traits prediction of the passion fruit pulp using NIR and MIR spectroscopy. LWT 2018, 95, 172–178. [Google Scholar] [CrossRef]
  23. Crisosto, C.H.; Crisosto, G.M.; Metheney, P. Consumer acceptance of ‘Brooks’ and ‘Bing’ cherries is mainly dependent on fruit SSC and visual skin color. Postharvest Biol. Technol. 2003, 28, 159–167. [Google Scholar] [CrossRef]
  24. Sabzi, S.; Abbaspour-Gilandeh, Y.; García-Mateos, G.; Ruiz-Canales, A.; Molina-Martínez, J.M.; Arribas, J.I. An automatic non-destructive method for the classification of the ripeness stage of red delicious apples in orchards using aerial video. Agronomy 2019, 9, 84. [Google Scholar] [CrossRef] [Green Version]
  25. Pourdarbani, R.; Sabzi, S.; García-Amicis, V.M.; García-Mateos, G.; Molina-Martínez, J.M.; Ruiz-Canales, A. Automatic Classification of Chickpea Varieties Using Computer Vision Techniques. Agronomy 2019, 9, 672. [Google Scholar] [CrossRef] [Green Version]
  26. Schouten, R.E.; Huijben, T.P.M.; Tijskens, L.M.M.; Kooten, O. Modelling quality attributes of truss tomatoes: Linking colour and firmness maturity. Postharvest Biol. Technol. 2007, 45, 298–306. [Google Scholar] [CrossRef]
  27. Tilahun, S.; Park, D.S.; Solomon, T.; Choi, H.R.; Jeong, C.S. Maturity stages affect nutritional quality and storability of tomato cultivars. J. CyTA J. Food 2018, 17, 87–95. [Google Scholar] [CrossRef]
  28. Hernández-Hernández, J.L.; Ruiz-Hernández, J.; García-Mateos, G.; González-Esquiva, J.M.; Ruiz-Canales, A.; Molina-Martínez, J.M. A new portable application for automatic segmentation of plants in agriculture. Agric. Water Manag. 2017, 183, 146–157. [Google Scholar] [CrossRef]
  29. Nicolaï, B.M.; Beullens, K.; Bobelyn, E.; Peirs, A.; Saeys, W.; Theron, K.I.; Lammertyn, J. Non-destructive measurement of fruit and vegetable quality by means of NIR spectroscopy: A review. Postharvest Biol. Technol. 2007, 46, 99–118. [Google Scholar] [CrossRef]
  30. Rossel, R.A.V. ParLeS: Software for chemometric analysis of spectroscopic data. Chemom. Intell. Lab. Syst. 2008, 90, 72–83. [Google Scholar] [CrossRef]
  31. Hodge, J.E.; Hofreiter, B.T. Determination of Reducing Sugars and Carbohydrates. In Methods in Carbohydrate Chemistry; Whistler, R.L., Wolfrom, M.L., Eds.; Academic Press: New York, NY, USA, 1962; pp. 380–394. [Google Scholar]
  32. Ignat, T.; Lurie, S.; Nyasordzi, J.; Ostrovsky, V.; Egozi, H.; Hoffman, A.; Schmilovitch, Z. Forecast of apple internal quality indices at harvest and during storage by VIS-NIR spectroscopy. Food Bioprocess Technol. 2014, 7, 2951–2961. [Google Scholar] [CrossRef]
  33. Kirkpatrick, S.; Gelatt, C.D., Jr.; Vecchi, M.P. Optimization by simulated annealing. Science 1983, 220, 671–680. [Google Scholar] [CrossRef] [PubMed]
  34. Simon, D. Biogeography-based optimization. IEEE Trans. Evol. Comput. 2008, 12, 702–713. [Google Scholar] [CrossRef] [Green Version]
  35. Simon, D. Evolutionary Optimization Algorithms; John Wiley & Sons: New York, NY, USA, 2013. [Google Scholar]
  36. Sabzi, S.; Arribas, J.I. A visible-range computer-vision system for automated, non-intrusive assessment of the pH value in Thomson oranges. Comput. Ind. 2018, 99, 69–82. [Google Scholar] [CrossRef]
  37. Sabzi, S.; Pourdarbani, R.; Kalantari, D.; Panagopoulos, T. Designing a fruit identification algorithm in orchard conditions to develop robots using video processing and majority voting based on hybrid artificial neural network. Appl. Sci. 2020, 10, 383. [Google Scholar] [CrossRef] [Green Version]
  38. Cavaco, A.M.; Pires, R.; Antunes, M.D.; Panagopoulos, T.; Brázio, A.; Afonso, A.M.; Silva, L.; Lucas, R.M.; Cadeiras, B.; Cruz, S.P.; et al. Validation of short wave near infrared calibration models for the quality and ripening of ‘Newhall’ orange on tree across years and orchards. Postharvest Biol. Technol. 2018, 141, 86–97. [Google Scholar] [CrossRef]
  39. Pourdarbani, R.; Sabzi, S.; Kalantari, D.; Arribas, J. Non-destructive visible and short-wave near-infrared spectroscopic data estimation of various physicochemical properties of Fuji apple (Malus pumila) fruits at different maturation stages. Chemom. Intell. Lab. Syst. 2020, 206, 104147. [Google Scholar] [CrossRef]
Figure 1. Flowcharts of different training steps of the proposed method for non-destructive estimation of starch and total soluble solids (TSS) properties of Fuji apple
Applsci 10 08145 g001
Figure 2. Spectral diagrams of several samples tested. (a): Reflectance spectrum of different samples. (b): Spectral graphs transferred from the reflectance spectrum to the absorption spectrum.
Applsci 10 08145 g002
Figure 3. Regression analysis of the scatter plot between the mean estimated and the measured starch content in Fuji apple based on spectral data of 800 to 900 nm.
Applsci 10 08145 g003
Figure 4. Box diagram of five criteria for evaluating ANN-BBO performance in estimating the starch content of Fuji apple on spectral data of 800 to 900 nm in 100 iterations. (a) coefficients of regression and determination, (b) error criteria.
Applsci 10 08145 g004
Figure 5. Regression analysis of the scatter plot between the mean estimated and the measured content of TSS in Fuji apple based on spectral data of 920 to 980 nm.
Applsci 10 08145 g005
Figure 6. Box diagram of five criteria for evaluation of ANN-BBO performance in estimating TSS of Fuji apple on spectral data of 920 to 980 nm in 100 replicates, (a) coefficients of regression and determination, (b) error criteria.
Applsci 10 08145 g006
Figure 7. Regression analysis of the scatter plot between the mean estimated and the measured starch content in Fuji apple based on the most effective wavelength’s spectral data.
Applsci 10 08145 g007
Figure 8. Box diagram of five criteria for evaluation of ANN-BBO performance in estimating starch content of Fuji apple on spectral data of the most effective wavelength, (a) coefficients of regression and determination, (b) error criteria.
Applsci 10 08145 g008
Figure 9. Regression analysis of the scatter plot between the estimated mean and the measured TSS content in Fuji apple based on the most effective wavelength’s spectral data.
Applsci 10 08145 g009
Figure 10. Box diagram of five criteria for evaluation of ANN-BBO performance in estimating TSS of Fuji apple on spectral data of the most effective wavelength, (a) coefficients of regression and determination, (b) error criteria.
Applsci 10 08145 g010
Figure 11. Regression analysis of scatter plot at the best state of training of ANN-BBO to predict starch content of Fuji apple, (a) based on spectral data in the range of 800 to 900 nm, (b) based on spectral data of the most effective wavelengths.
Applsci 10 08145 g011
Figure 12. Regression analysis of scatter plot at the best state of training of ANN-BBO to predict starch content of Fuji apple. (a) Based on spectral data in the range of 920–980 nm, (b) of the most effective wavelengths.
Applsci 10 08145 g012
Table 1. The hidden layer structure of artificial neural network (ANN) used to select the most effective wavelengths (tansig is transfer function; traincgb is training function; learnwh is learning function).
Number of LayersFirst Layer: 19
Number of Neurons1
Transfer Functiontansig
Backpropagation Network Training Functiontraincgb
Back-propagation Weight/Bias Learning Functionlearnwh
Table 2. Optimal structure of ANN hidden layers adjusted by the biogeography-based optimization algorithm (BBO) algorithm to predict the Fuji apple properties.
PropertiesNumber of LayerNumber of NeuronsTransfer FunctionBackpropagation Network Training FunctionBackpropagation Weight/Bias Learning Function
1st Layer: 21poslin
Starch32nd Layer: 18logsigtrainlmlearnk
3rd Layer: 6radbas
TSS21st Layer: 16tribas trainclearngd
2nd Layer: 8poslin
Table 3. Comparison of the mean and standard deviation of criteria of ANN-BBO for estimating starch content of Fuji apple in 100 replicates using spectral data of 800 to 900 nm and data on effective wavelengths.
PropertiesCriterionMSERMSEMAERR2
Spectral data in the range 800–900 nmMean0.0430.2030.1560.9750.950
SD±0.014±0.035±0.027±0.020±0.038
At best state of training0.0150.120.0930.9670.953
Spectral data of the most effective wavelengthsMean0.0460.2130.1630.9410.885
SD±0.016±0.033±0.025±0.016±0.028
At best state of training0.0250.160.1190.9610.923
Table 4. Comparison of the mean and standard deviation of criteria of ANN-BBO for estimating TSS of Fuji apple in 100 replicates using spectral data of 920–980 nm and data on effective wavelengths.
PropertiesCriterionMSERMSEMAERR2
Spectral data in the range 920–980 nmMean0.0690.2610.2030.9470.897
SD±0.016±0.032±0.028±0.029±0.052
At best state of training0.0340.1860.1450.9560.914
Spectral data of the most effective wavelengthsMean0.0610.2430.1910.9460.895
SD±0.019±0.04±0.034±0.034±0.061
At best state of training0.0230.1530.1190.9620.925
Table 5. Comparing the performance of the proposed methods on non-destructive estimation of starch content and TSS with other methods.
ResearcherFruitNo. of SamplesR2
The proposed method (Starch)Apple1400.923
The proposed method (TSS)Apple1400.925
Oliveira-Folador et al. [22]Passion fruit1300.95
Uwadaira et al. [21]Peach400.80
Cavaco et al. [38] (in situ)Orange5300.49
Pourdarbani et al. [39]Apple1600.865
Publisher’s Note: MDPI stays neutral with regard to jurisdictional claims in published maps and institutional affiliations.

