Hyperspectral Imaging for Minced Meat Classification Using Nonlinear Deep Features


1
Department of Computer Engineering, Khwaja Freed University of Engineering and Technology (KFUEIT), Rahim Yar Khan 64200, Pakistan
2
Department of Computer Sciences, National University of Computer and Emerging Sciences, Islamabad, Chiniot-Faisalabad Campus, Chiniot 35400, Pakistan
3
Institute of Software Development and Engineering, Innopolis University, 420500 Innopolis, Russia
*
Author to whom correspondence should be addressed.
Appl. Sci. 2020, 10(21), 7783; https://doi.org/10.3390/app10217783
Submission received: 6 October 2020
/
Revised: 27 October 2020
/
Accepted: 30 October 2020
/
Published: 3 November 2020
Abstract
:Minced meat substitution is one of the most common forms of food fraud in the meat industry. Recently, Hyperspectral Imaging (HSI) has been used for the classification and identification of minced meat types. However, conventional methods are based only on spectral information and ignore the spatial variability of the data. Moreover, these methods first tend to reduce the size of the data, which to some extent ignores the abstract level information and does not preserve the spatial information. Therefore, this work proposes a novel Isos-bestic wavelength reduction method for the different minced meat types, by retaining only Myoglobin pigments (Mb) in the meat spectra. A total of 60 HSI cubes are acquired using Fx 10 Hyperspectral sensor. For each HSI cube, a set of preprocessing schemes is applied to extract the Region of Interest (ROI) and spectral preprocessing, i.e., Golay filtering. Later, these preprocessed HSI cubes are fed into a 3D-Convolutional Neural Network (3D-CNN) model for nonlinear feature extraction and classification. The proposed pipeline outperformed several state-of-the-art methods, with an overall accuracy of .
1. Introduction
Hyperspectral Imaging (HSI) systems are an advanced form of imaging system, which have been used in a plethora of research areas such as remote sensing [1,2], food science, chemistry [3], medical imaging [4] and other raw materials [5]. HSI systems eliminate the use of traditional imaging systems such as monochromic images, 3-channel images (RGB), and Multi-spectral imaging techniques in terms of accuracy, processing, and spatial information [6]. Thus, the combination of spatial and spectral information across the electromagnetic spectrum provides a unique signature for its material, which helps in inspection, authentication, classification, and identification of different materials.
The HSI system also provides the visualization of its material, utilizing an image alongside the distribution of its chemical components. By definition, HSI provides information in the form of cubical structure, i.e., 3-dimensional cube (called Spectral cube); , where represents spatial coordinates, explains the fundamental wavelength of an image and R represents the reflectance of minced meat. This entire electromagnetic spectrum (wavelength ()) generates a chemical composition (nature) of the material via the intensity of the reflected light. Moreover, the HSI system forms a stack of images throughout its entire wavelength, where each image is a gray-scale (monochromic) and commonly represented as a band at each point of wavelength () and defined as [7].
As earlier explained, HSI has been used for many real-world applications, and one of them is minced meat identification and classification. Minced meat is enriched with nutritional values such as iron and protein, which contains all the essential vitamins required for human growth. Minced meat is widely used in a variety of food products such as meatballs, burgers, and sausages, etc. Therefore, minced meat identification to prevent substitution is getting more attention from the research community [8,9]. Accurate identification of minced meat not only minimizes the issues (risk) of human health (gastric cancer, allergies, blood pressure, and type-2 diabetes) [10], but it also helps in investigating substitution fraud [11,12]. Substitution is the most common form of fraud due to its incredible impact on economic gain, i.e., inexpensive meat will give more revenue than expensive meat, which ultimately affects consumer religion, wealth, and lifestyle [13,14].
HSI processing used traditional Artificial Intelligence (AI) and Machine Learning (ML) methods to prevent minced meat frauds [15]. These methods are faster and efficient [16,17] than laboratory-based control measures such as pH meter, Drip-loss, and water holding capacity (WHC) [18]. For instance, Sanz et al. [16] introduced a study to differentiate and classify between four types of lamb muscles. The principal component analysis (PCA) was applied to reduce the dimensions of the HSI system. For the selected wavelengths, linear discrimination analysis outperformed the linear least mean squares classifier, multilayer perceptron with scaled conjugate gradient, variant of the Support Vector Machine (v-SVM), K-Nearest Neighbor (KNN), and Logistic Regression (LR). Velas et al. [19] proposed a method to classify the marbling of 35 beef samples. The sample types include longissimus dorsi and are examined through the HSI sensor. For better classification, each muscle was examined through the Decision Tree (DT). Similarly, Barbon et al. [20] used the DT approach to identify and classify chicken meat based on the REP Tree method and achieved an overall precision of .
Minced meat identification process usually include color, pH and texture parameters [17,21,22,23] analysis. For example, Liu et. al. [21] used quality parameters such as; Moisture Content (MC), and the color of beef meat was examined for (0–75 s) through microwave heating treatment. Color parameters (L*, a*), and their related Maygpbin (Mb) percentage were investigated for the mean spectrum of beef samples. The prediction model—Partial Least Square Regression Model (PLSR) coefficient of determination for prediction data = 0.890, Root Mean Square Error (RMSEP) = 0.735, and Residual Predictive Deviation (RPD) = 2.733 were established for a* values. In another work, Liu et al. [22] investigated the quality of pork meat for predicting the color and pH of salted meat. To reduce the dimensions of the HSI cube, PCA was used and the results show L* = , a* = , and pH = for the coefficients of determination (, cv = cross-validation) and of , , and respectively. Similarly, in 2020, Xu et al. [23] experimented on an entire HSI cube of real salmon fillets through several feature descriptors such as Gray-level Co-occurrence Matrix (GLCM), variogram, Histograms of Oriented Gradients (HOG), and Local Binary Pattern (LBP). The obtained results showed HOG features outperformed with accuracy for the red meat. In addition, Ayaz et al. [24] performed the classification of multiple minced meat types (beef, mutton, and chicken). To perform better classification, myoglobin spectral features were used with the SVM algorithm which outperformed the mostly used method by achieving an overall accuracy of 88.8%.
However, in most cases, traditional approaches applied to complex 3D HSI cube require several feature extraction steps [23], which reduces the effectiveness of the classification model [25]. Besides, they are also limited to the use of spectral information [26]. Irrespective of these methods, Convolutional Neural Network (CNN) allows both spatial and spectral information of HSI-system [15,27]. For instance, Al-Sarayreh et al. [6] proposed an in-depth model for beef, lamb, pork, and fat adulteration based on SVM, 1D and 3D CNN [28] for identification and classification of different meat types. The result indicates the 3D CNN model outperforms with , as compared to the traditional techniques. Similarly, in another work, Al-Sarayerh et al. [29] used 3D CNN to classify red-meat using snapshot HSI.
Chunk meat classification and identification have been explored through CNN models and showed remarkable results as compared to the traditional methods. However, CNN has not yet been used for minced meat identification and classification. Therefore, this work proposes the identification of minced meat through classification using Deep Learning (DL) techniques, which follow the process of pixel-based classification of minced meat. This work also proposes the novel isos-bestic point band reduction approach using myoglobin (Mb) pigments irrespective of traditional wavelength reduction techniques. In our previous work [24], we have utilized the absorption feature spectrum of minced meat to perform spectral classification and used the entire spectrum rather than reduced spectra. In a nutshell, the following steps are followed.
- (1)
- Collection and mincing of meat types using two cross blades.
- (2)
- HSI system is used for image acquisition and image correction.
- (3)
- Reduction of dimensionality using Isos-bestic point in Mb pigments to retain maximum color information.
- (4)
- Classification of minced meat types using KNN, SVM, and 3D-CNN.
The rest of the paper is structured as; Section 2, sampling process, and HSI-sensor data acquisition is explained with image correction and pre-processing. This section also explains the Isos-bestic point wavelength reduction along with the classification techniques. Section 3, discuss the information found in the minced meat spectrum, alongside achieved classification results for both traditional and state-of-the-art DL methods. Finally, Section 4 concludes the work with future directions.
2. Material and Methods
2.1. Preparation of Samples
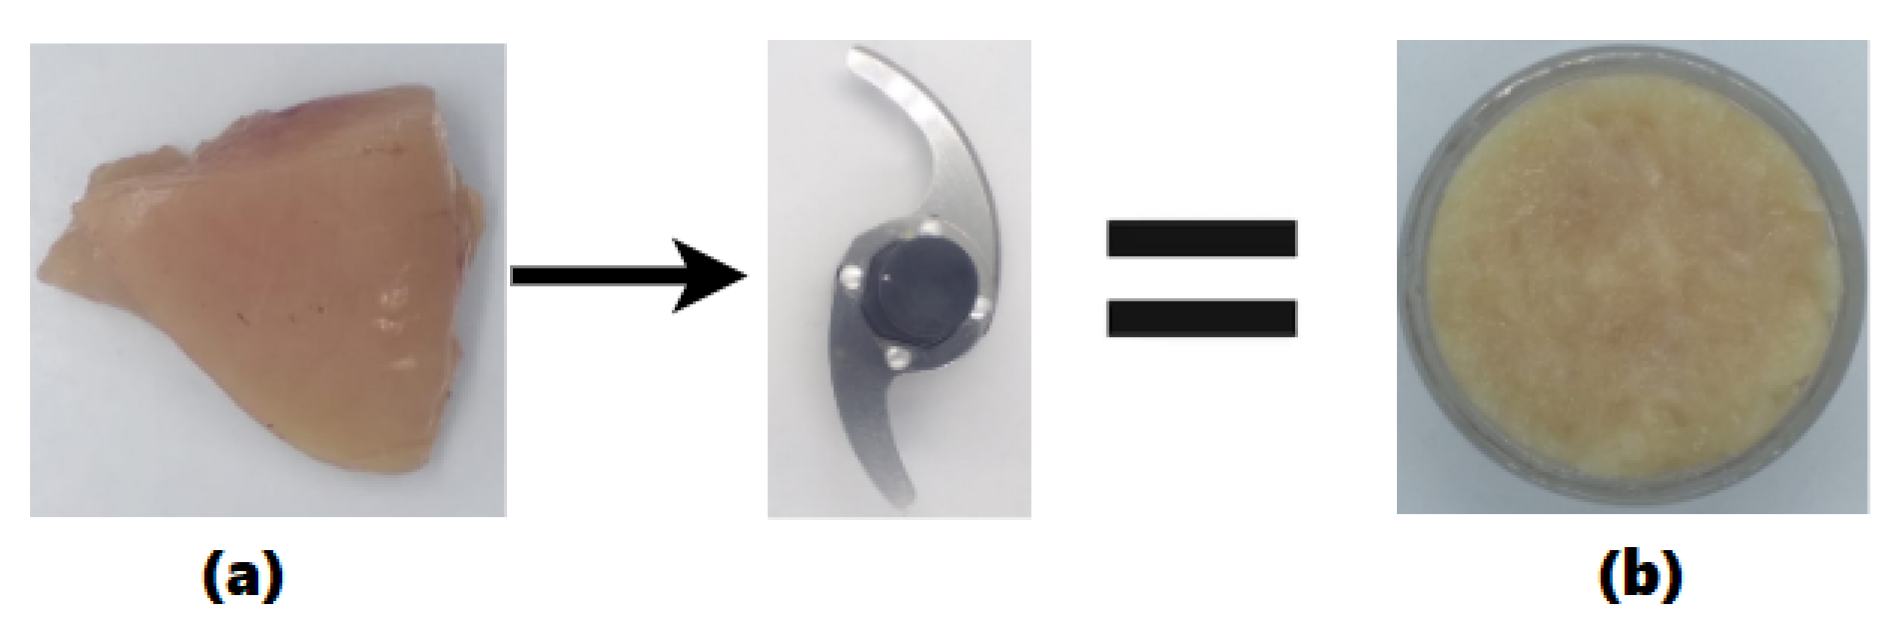
The minced meat used in this study consists of 20 beef and 20 chicken and 19 mutton samples to make a total of 59 meat samples. Meat samples were brought from the local butcher market within 1 hour of slaughter. To preserve the freshness of the meat, each meat was stored in an ice cooler with two ice-cubes to maintain moderate temperature. These were then minced over an interval of approx. 5 to 7 s by using a minced meat maker with two cross blades, as shown in Figure 1. The entire mincing process was performed under the room temperature of our laboratory in Rahim Yar Khan, Pakistan. The mincer was cleaned correctly before the sampling process to avoid any contamination. The mincing of meat removes the issue of weight and size for each sample, using a standard size of 65 kg for each meat type. The processed samples are then passed to the HSI conveyor belt through a cylindrical container.
2.2. Hyperspectral Imaging System (HSI)
The hyperspectral camera used in this study is Specim FX-10. A push-broom (line scanning) system, which is considered as a standard way of collecting lab-oriented spatial-spectral information. HSI camera is equipped to capture an electromagnetic spectrum of visible and near-infrared range (400 nm × 1000 nm). The system includes a conveyor belt with a translational try of 21 × 40 cm, which moves with the speed of 25 mm/s at an exposure time of 16 ms and frame rate of 60 Hz. The sensor is also coupled with a lens of 1.4/8 mm and three halogen lamps of 75 Watts for each light. The system was also connected to a laptop via serial port to generate three raw extension files containing information of minced meat, (ceramic) white reference tile, and a dark reference cube.
2.2.1. Image Correction
The HSI system used in this study formulates 224 spectral bands () with the spatial size of 1024 × 512 []. The raw information of minced meat contains spectral radiance, which further needs correction to generate accurate reflectance. The whole process is performed due to the involvement of light effect, pixel size, atmospheric changes. Therefore, an imperial line method [30] is used to calculate accurate reflectance by using the following Equation (1):
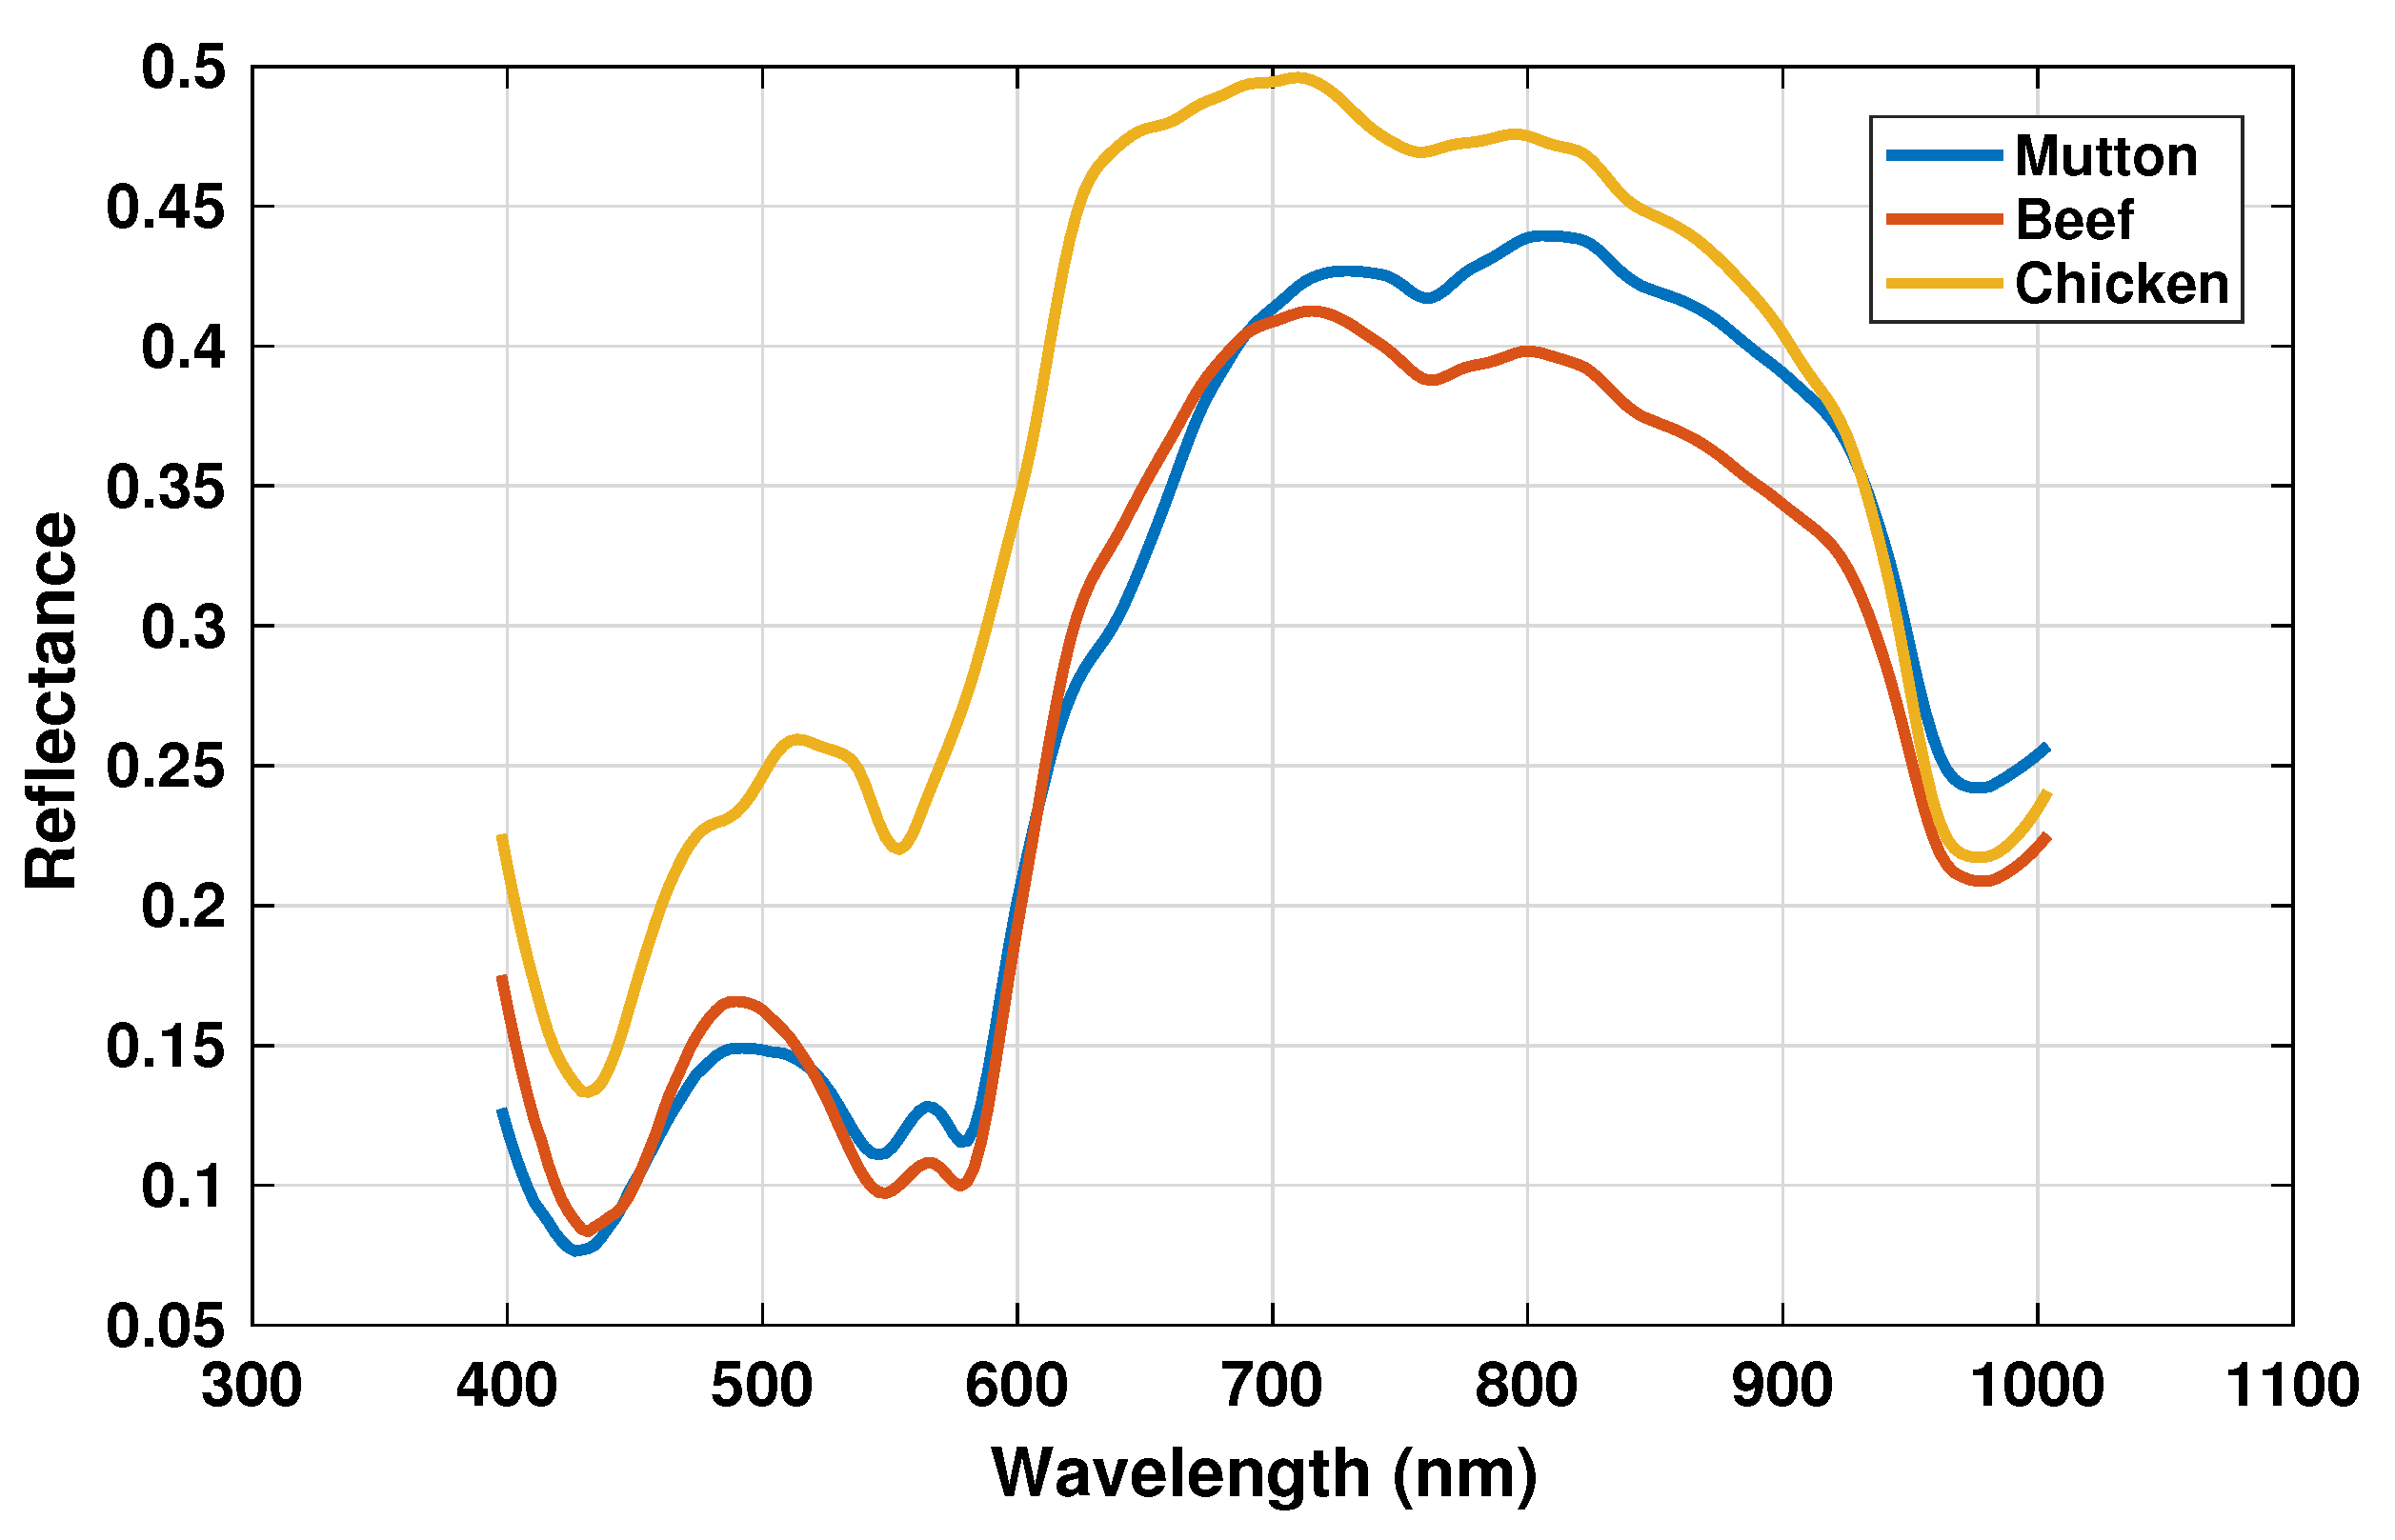
where is the accurate reflectance of minced meat as shown in Figure 2 and represents the values of chicken, beef, and mutton over the entire wavelength range of the HSI sensor. is radiance spectral information, and is a dark current cube (generally, 0% reflectance), and represents white reference (generally, 99% reflectance). The acquired sample of HSI sensor formulates a total size of , which further needs spatial-spectral pre-processing.
2.2.2. Spatial Pre-Processing
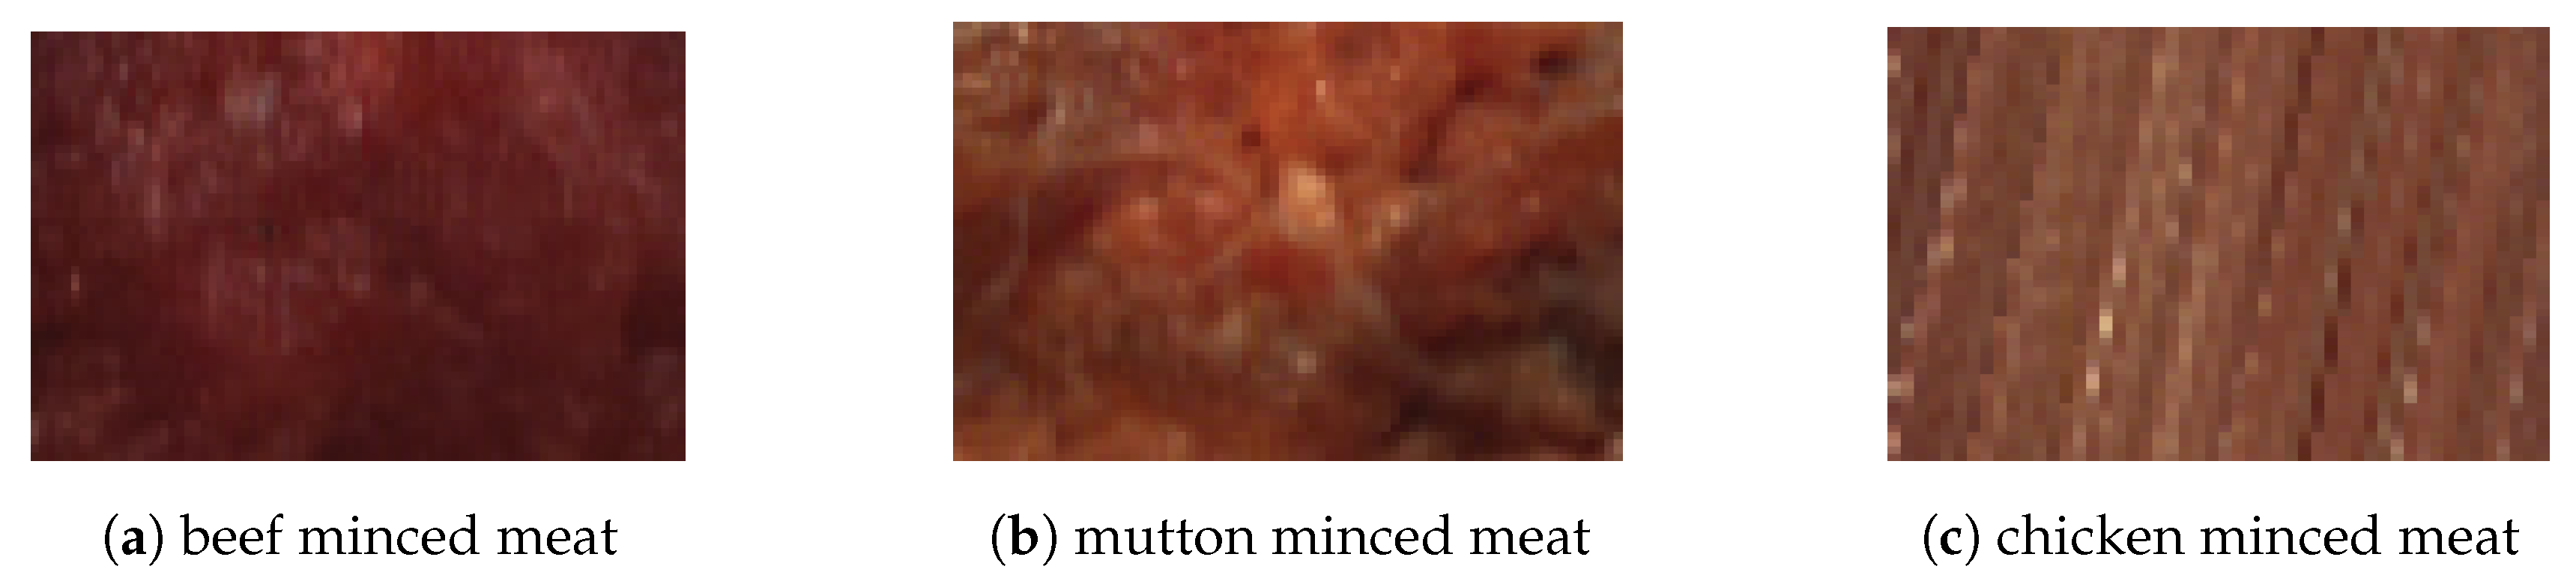
The HSI system formulates high spatial information throughout the entire visible to near-infrared (VNIR) region. Each image in the captured spectrum contains information about the minced meat with the background of the translational tray. Therefore, to limit the computational complexity, the region of interest (ROI) needs to be extracted by computing a true-color image by mean of the correlation coefficient method [31]. The extracted ROI goes to the process of the blob analysis technique to formulate a static size of [24], which are represented in Figure 3. Each image in its true color form represents its texture, such as Figure 3a represents beef minced meat texture and Figure 3c represents chicken minced meat texture.
2.2.3. Spectral Pre-Processing
The formulated reflectance cube contains random noises due to the scattering of light falling on the minced meat. These effects of light can cause undesired spectral variations in the spectrum, which may not be equivalent to the studies and cause unreliable effects in the classification process. Therefore, to normalize the irregularities in the spectra Savitzky Golay Filtering method is applied by using two-degree polynomial and eleven point filters respectively [32]. Thus, a smooth spectrum is formulated that contains the maximum information regarding the chemical composition of each minced meat type.
2.3. Isos-Bestic Point Reduction
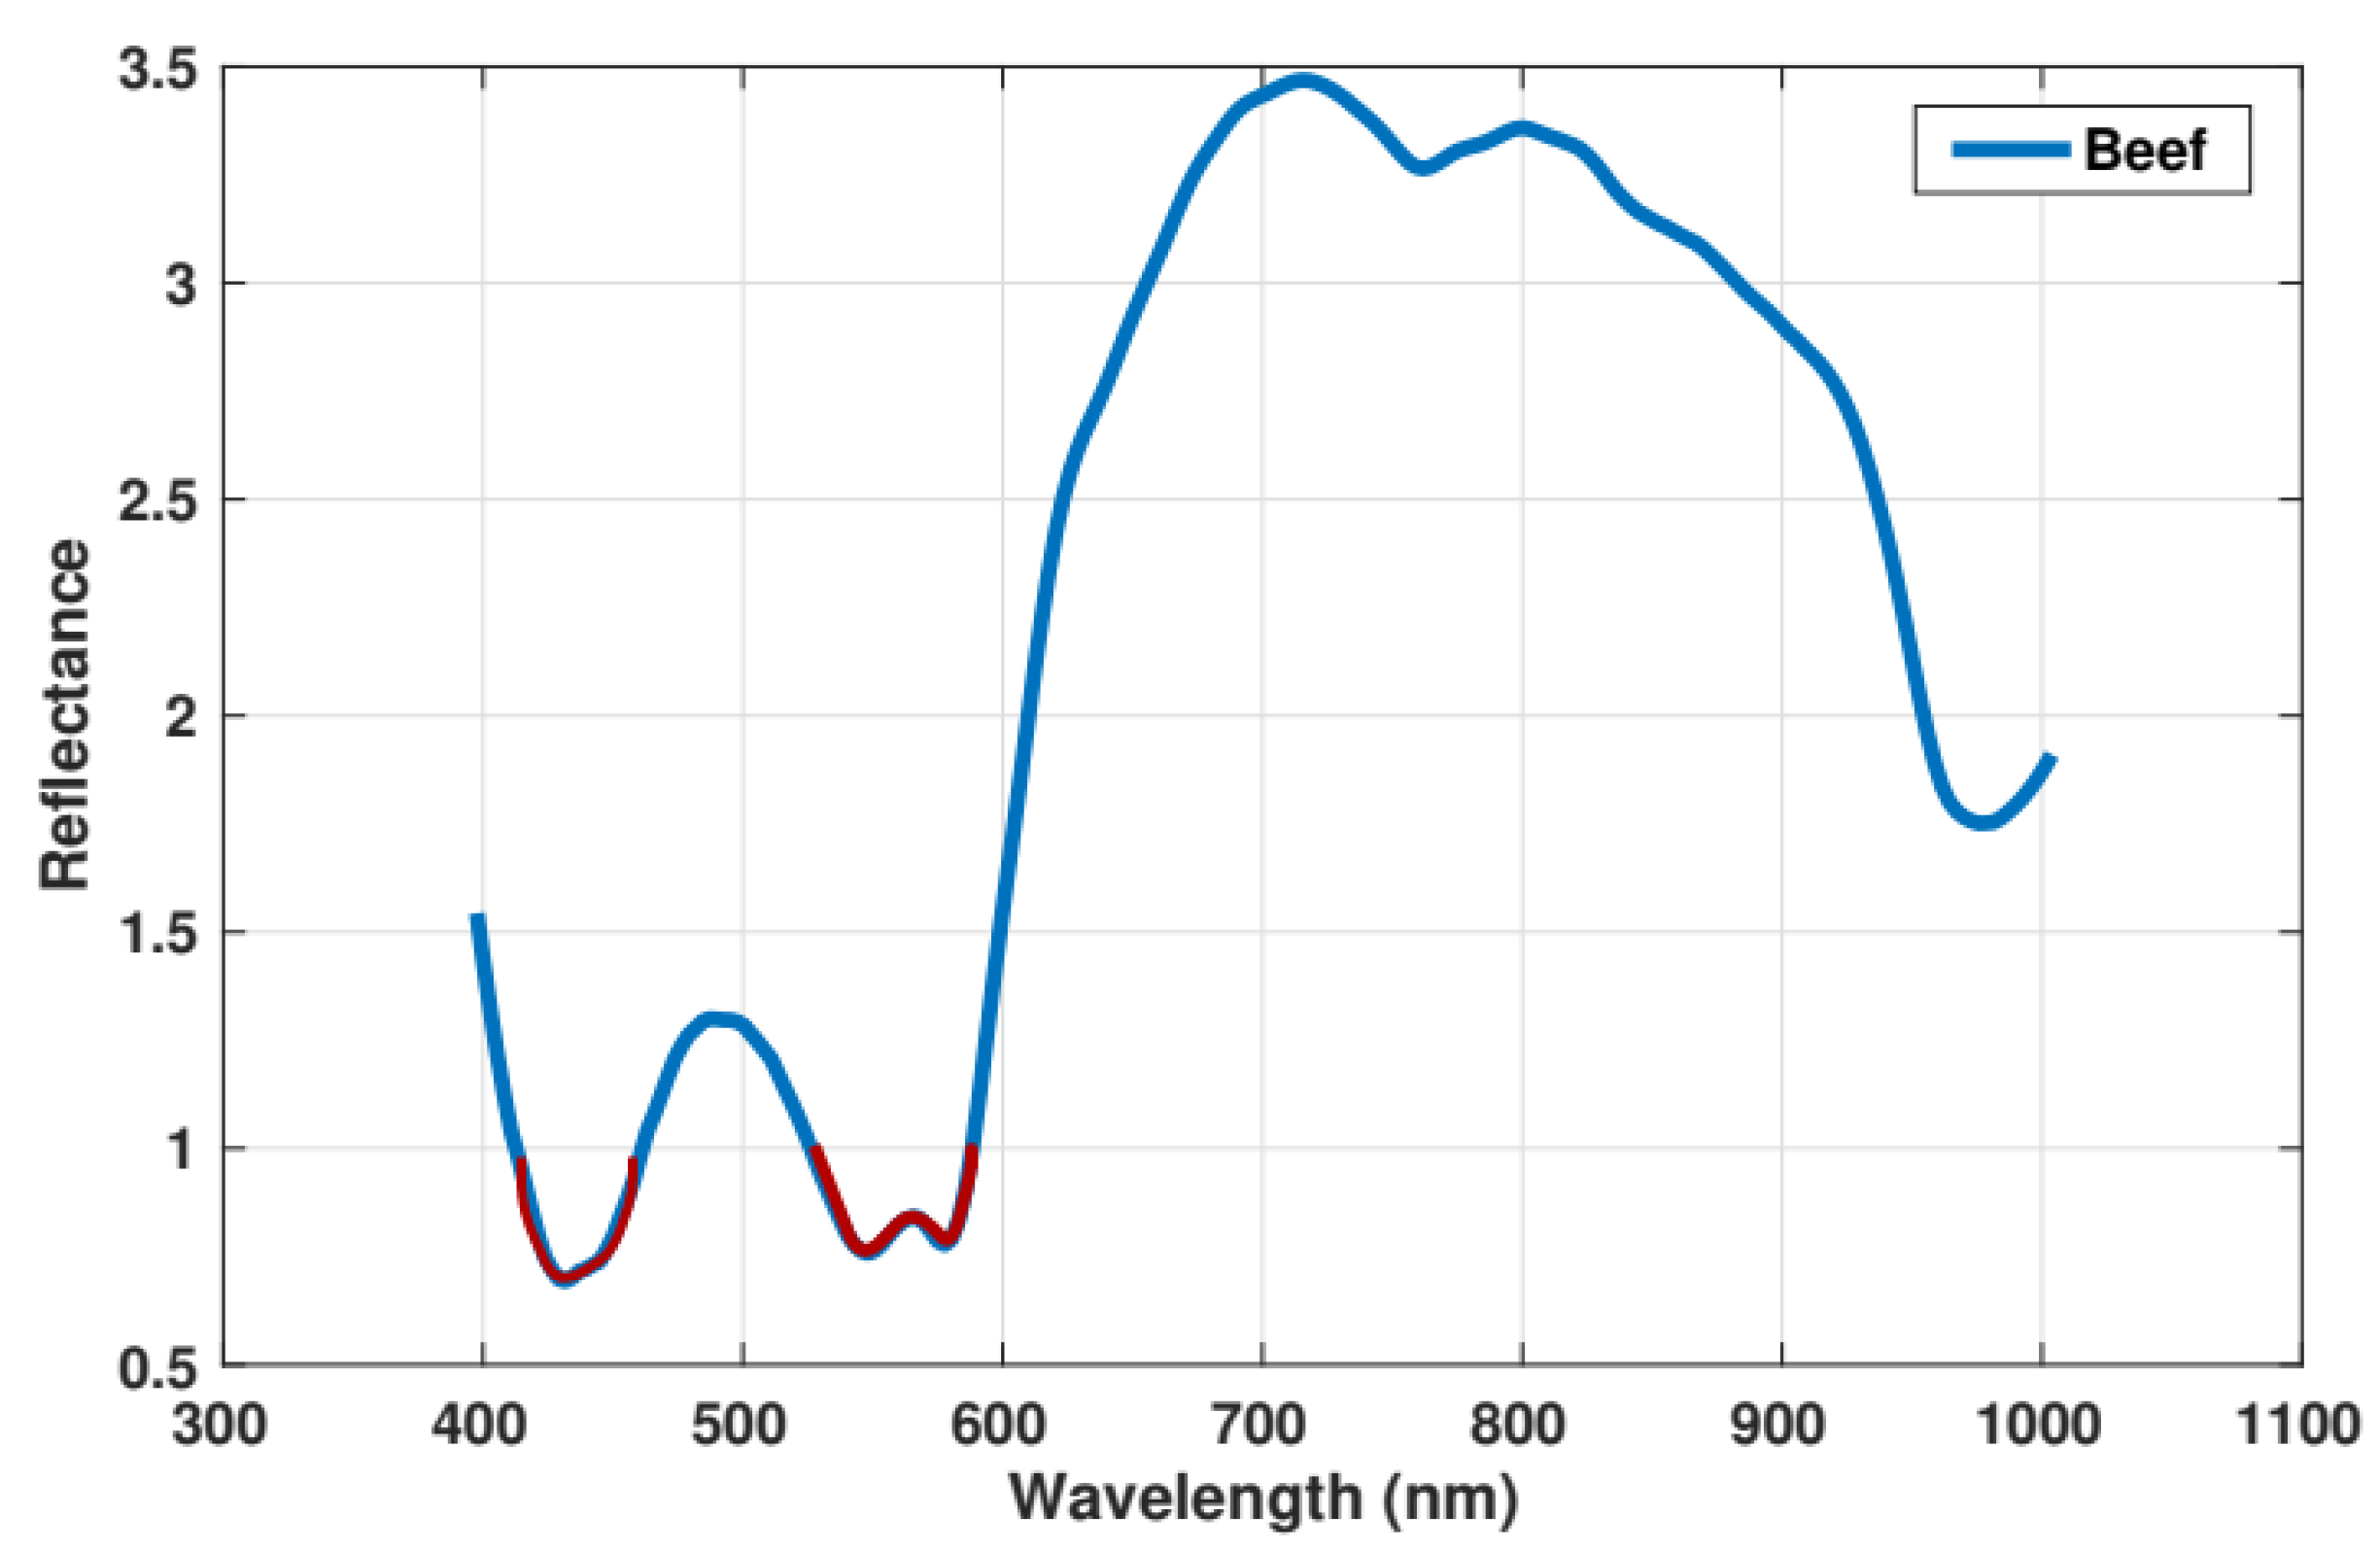
The spectrum of minced meat in 1000 nm represents several characteristics, such as the scort absorption band [33], at nm Mb pigments and 780 and 980 O-H bond information [16]. In meat chemistry, the formation of muscle color is due to the Mb pigments, which are further divided into three stages: DEXA-Mb, OXA-Mb, and meta-Mb. According to the studies, the Iso-bestic band in the minced meat spectrum is at the fixpoint of 525 nm, which contains equal concentration for each stage of Mb pigments [34]. This point in the minced meat spectrum is utilized to select the informative color bands by using the following Equation (2).
where is the pre-processed spectrum, represents the accurate reflectance with as entire wavelength range and represents the wavelength of 525 nm [24]. Since Mb pigment (color) is the primary source for the identification and classification of each minced meat type, and to reduce the spectral dimension, the pre-processed spectrum under the interval of 0 to 1 is considered as most useful as shown in Equation (3).
where is the reduced spectrum consisting of 44 spectral bands under the range of 0 to 1 reflectance level. The reduced spectrum contains only the Mb pigment information found in minced meat spectra as shown in Figure 4.
2.4. Classification
2.4.1. Multivariate Data Analysis
To perform supervised classification of the minced meat types, statistical classifiers such as support vector machine (SVM) and k nearest neighbor (KNN) have been applied to validate the classification results.
SVM
Support Vector Machine (SVM) is the supervised model that analyzes the data to perform classification. SVM is one of the most used prediction methods based on the statistical learning framework. The main aim of SVM is to find the optimal maximum marginal (hyperplanes) distance between the support vectors (linear or non-linear). Thus, SVM acts as a binary classifier (one vs. Rest), by separating one class to one side of the hyperplane and making rest to the other side of the hyperplane [16].
KNN
K nearest neighbors (KNN), is the pattern recognition algorithm used for classification problems. It is a non-parametric method, which inputs K closest training samples and outputs the class based on membership function. The algorithm works on a distance function based on the voting of its nearest neighbors by using the Euclidean distance-based measuring [35].
2.4.2. Deep Convolution Neural Network
Deep Convolutional Neural Network (DCNN) is referred to as a fully connected network that uses numerous layers to extract nonlinear features. The principled estimation is to extract the features by directly applying several convolutions and kernel parameters on raw image [36]. However, the HSI system belongs to an advanced spectroscopy technique and constructs more than hundred of images. These images processed through 2D-CNN can be prone to over-fitting due to a large number of kernels parameters and computational cost [26].
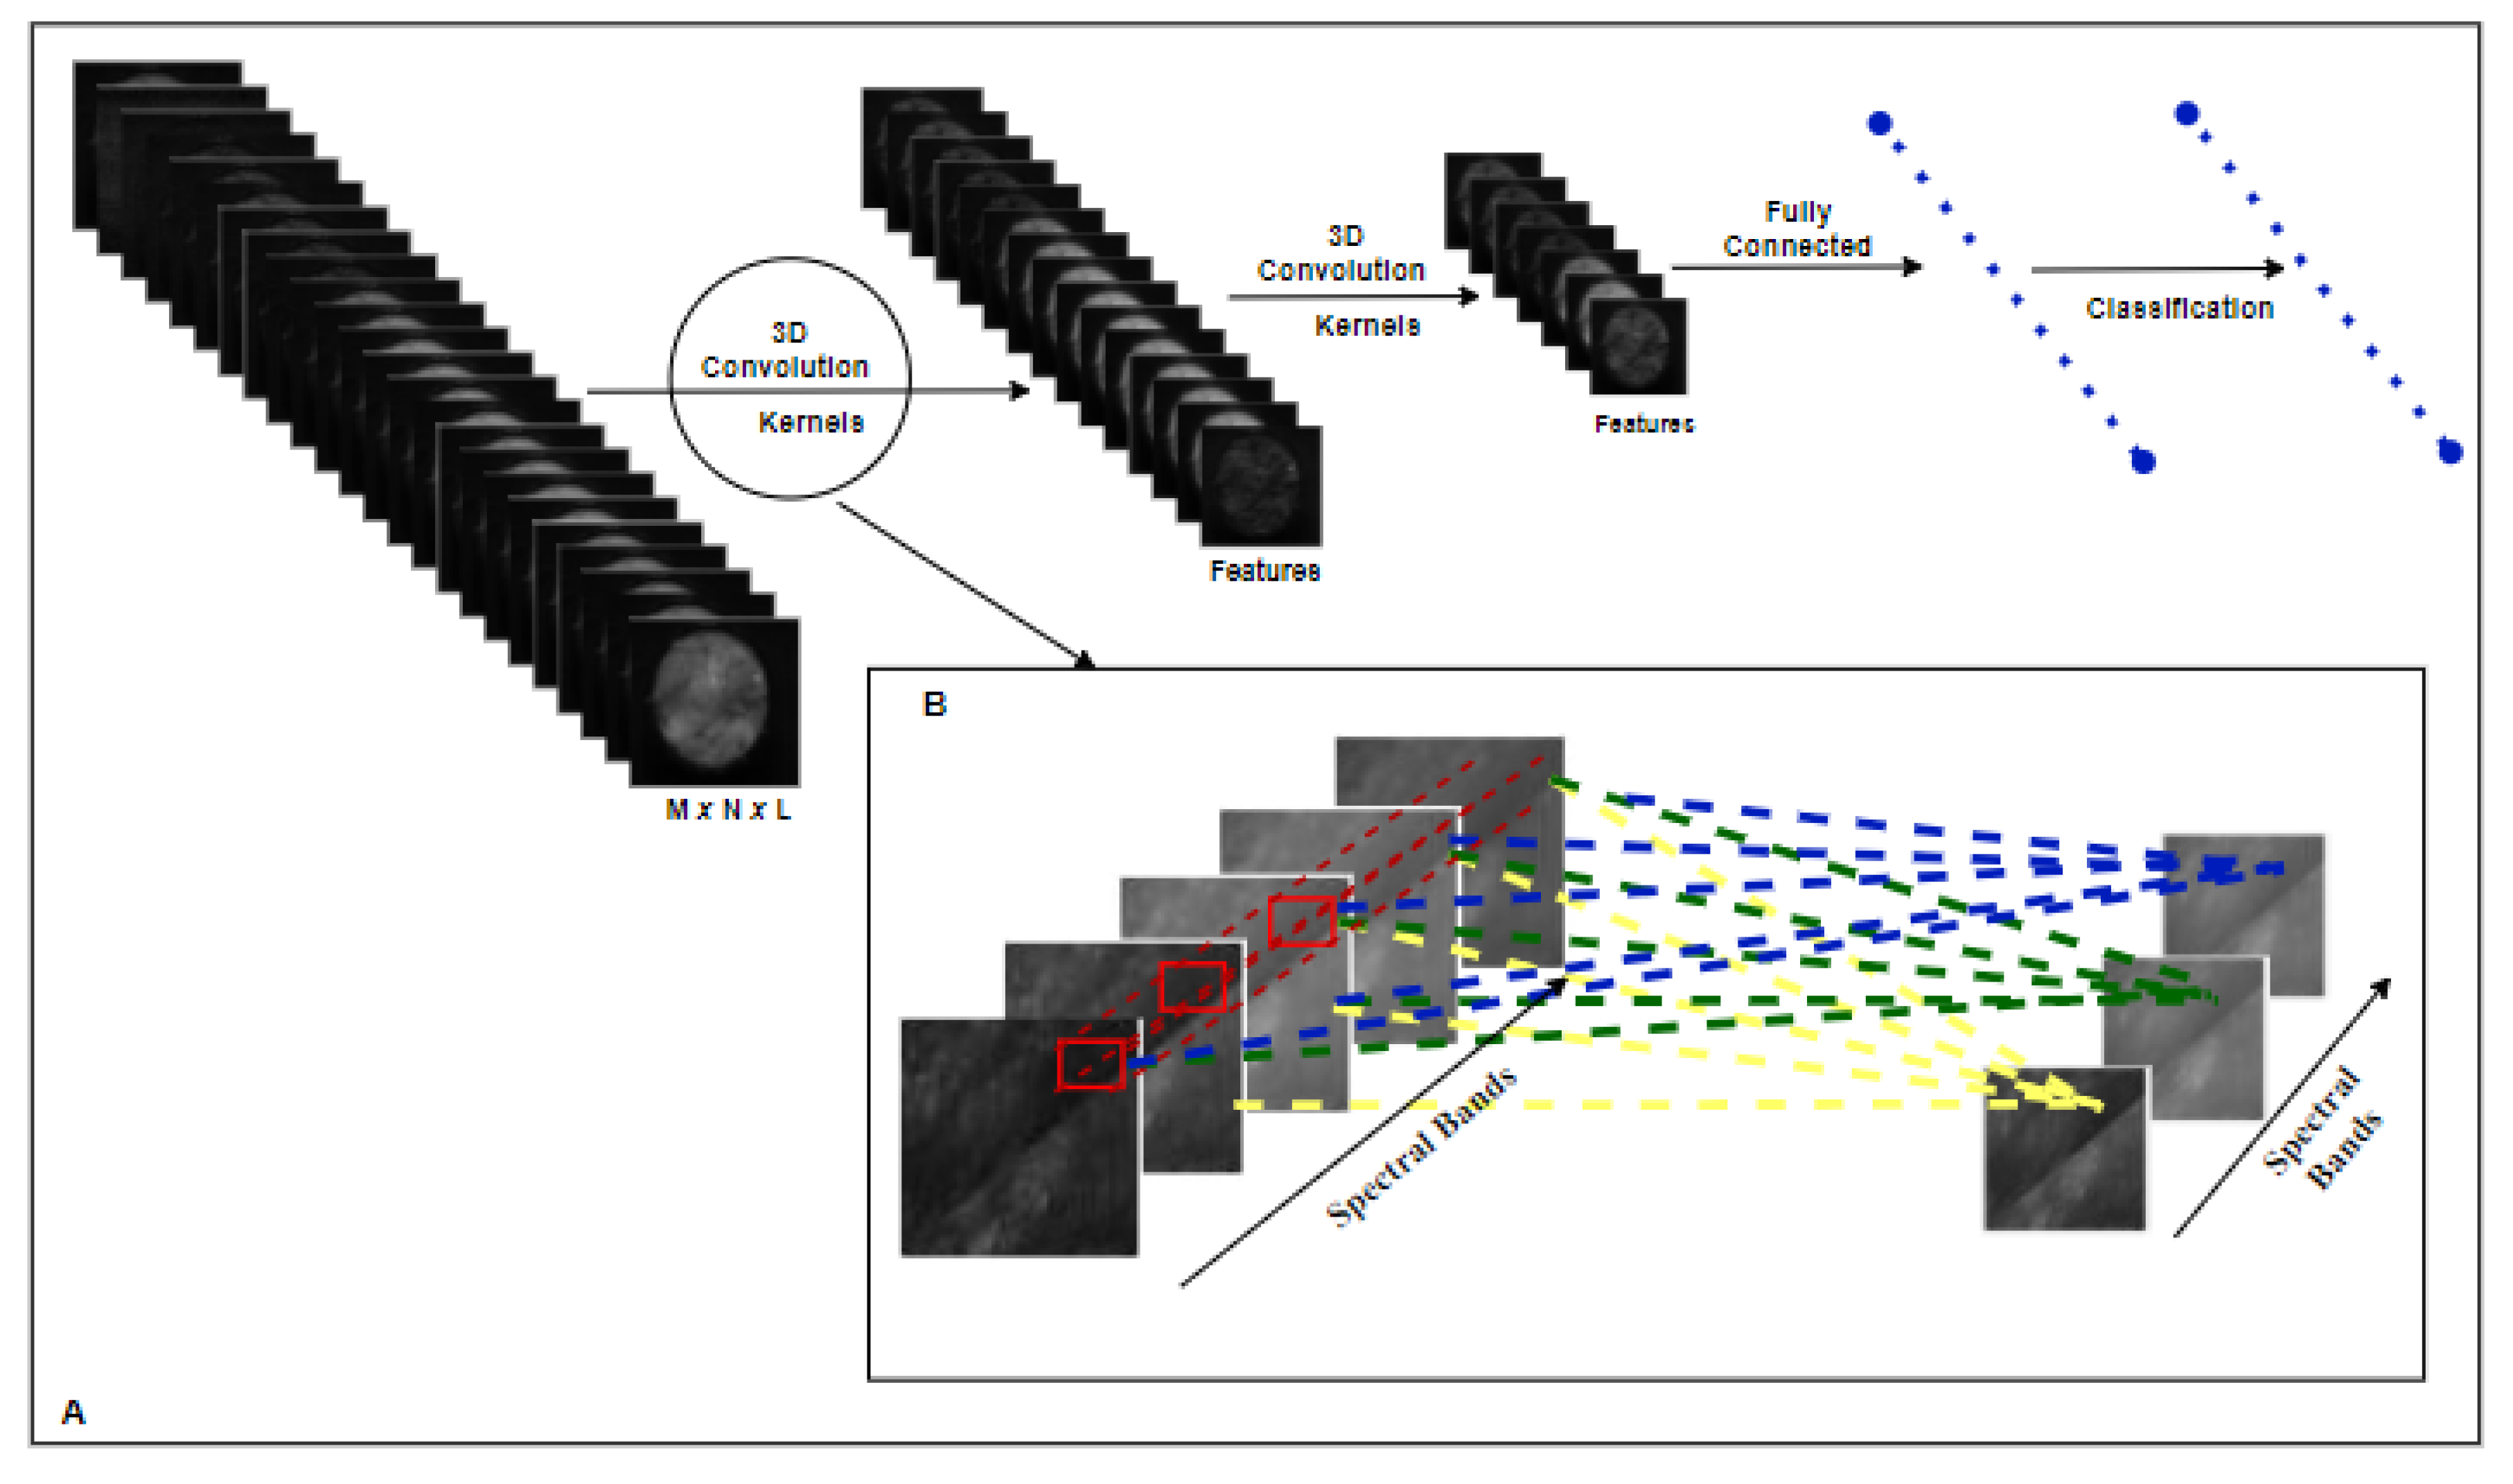
To counter these issues [37], a deeper complex convolutional model of deep learning is required (3D-CNN) [28]. The 3D-CNN comprehends the HSI cube by using 3D kernels and 3D convolutional operations to extract the significant spatial-spectral information automatically as shown in Figure 5, which is further illustrated by the following equation;
where P indicates the convolution layer, i indicates the features learned from the previous layer, j represents the number of kernels, represents the height, represents the width, represents the depth of spectral cube, represents the bias, gives the output of the feature learned on the cube of through convolution and kernel implementation and represents kernel by values to the feature cube. Further, f represents the activation function rectified linear units (ReLUs) and optimizer ’Adam’ is used to optimize the loss function (categorically cross entropy); where p represents number of samples and m represents number of classes. Conversely, Z, g represent the model vectors and represents the model biases and weights.
3. Results and Discussion
This section explains the experiment held for the classification of meat types through the traditional ML technique (SVM, KNN) and state-of-the-art 3D-DL model. Furthermore, to validate the blind test, accuracy matrices such as precision, recall, and F1-score are also evaluated. Initially, the experiments are performed on an online platform called Google Colab [38] with the features of Graphical Processing Unit (GPU), 25 GB of Random Access Memory (RAM), and 358:27 GB of storage capacity. Since the HSI system acquires 100s of images for a single sample, in this work a total of images are used, which gives validation of a reasonable dataset to construct a non-linear model. To perform the supervised learning, experimental data is divided into a ratio for the test and train set, on which Training samples are further divided into for the Training and Validation. In a nutshell, 42 samples are considered for training, and 17 samples are used as a blind test set.
3.1. Minced Meat Spectral Analysis
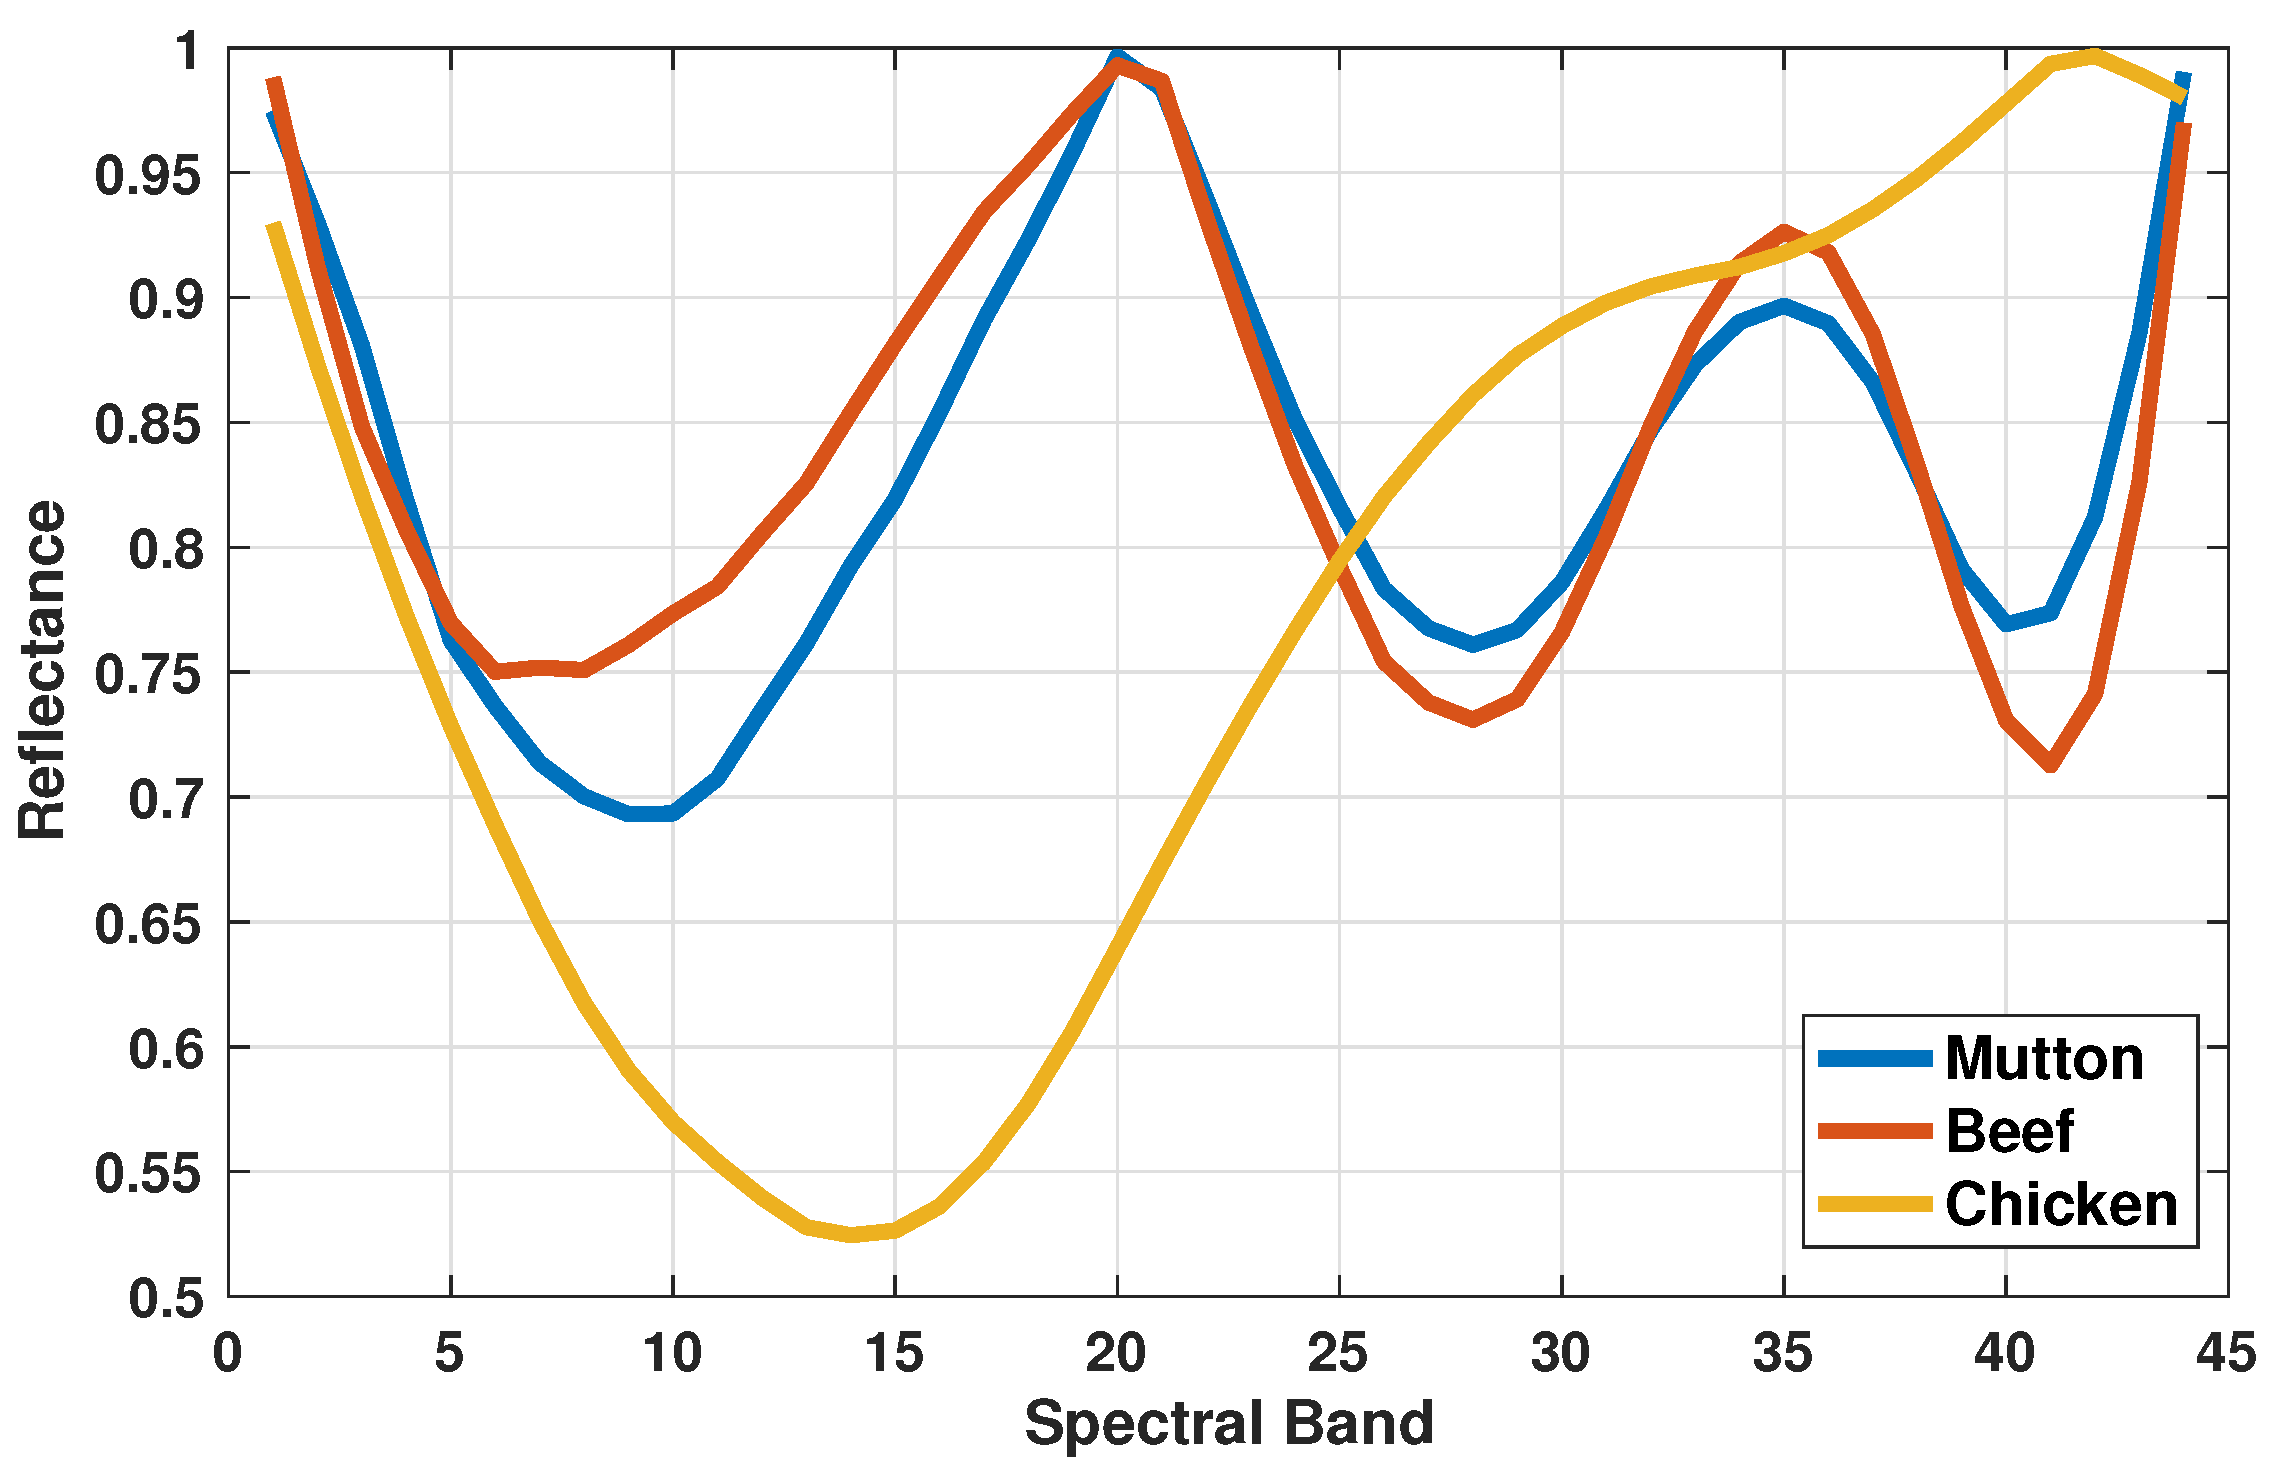
Spectral cubes of minced meat samples were obtained by the HSI system, distributed along the VNIR region. The selected region of interest (ROI) of 3000 pixels was extracted from the entire spectral images. Finally, the average reflectance spectrum was calculated as the original smooth spectra. The average spectrum can be seen in Figure 2.
The extracted spectra of the HSI system in the VNIR region contain several pieces of information about the overtones and other molecular bonds of C-H, O-H, and N-H. Specifically, the wavelength of 970 nm, which is the second overtone of absorption in minced meat. Besides, the information of color (Mb pigments) in the visible region of the electromagnetic spectrum vary from species to species and within the animals of one species as well. This color information presents the most important variations in the minced meat spectrum, as color is the primary indicator for the consumer to buy their desired meat. Therefore, Figure 6 represents the important wavelength extracted from the Isos-bestic point division.
3.2. Classification of Minced Meat
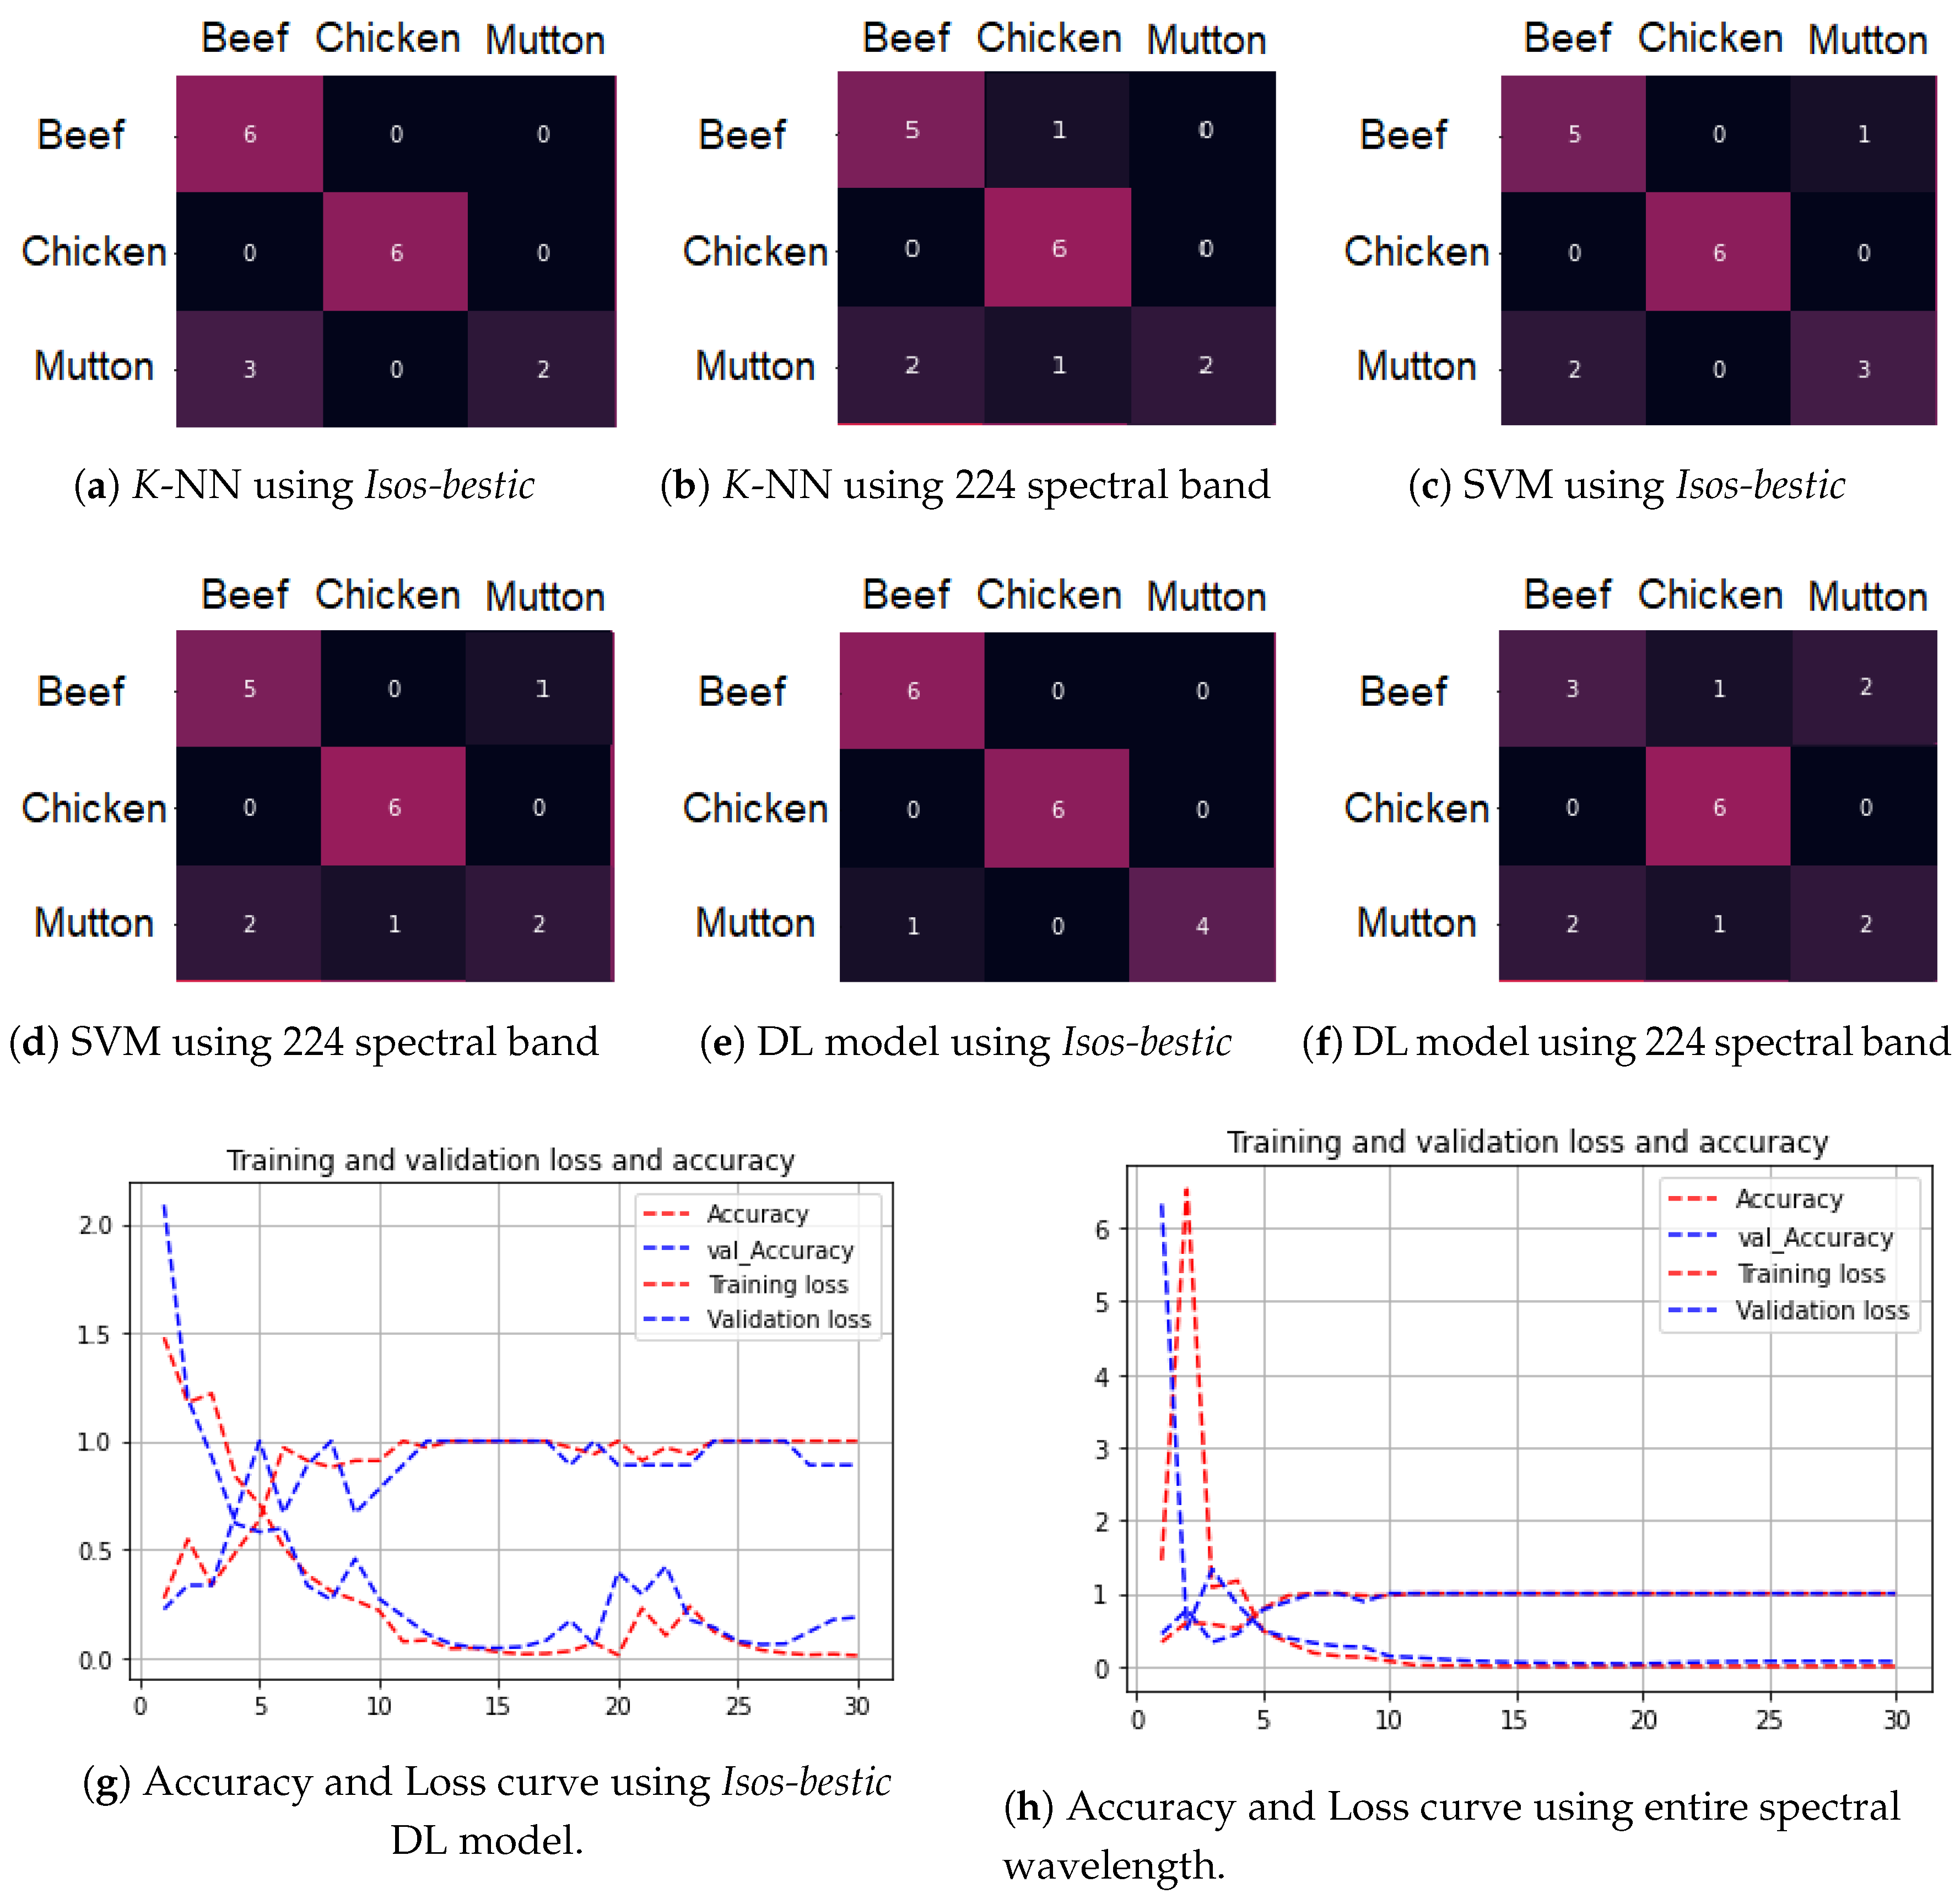
To compare with deep models, two traditional classifier SVM and KNN were used one after the other. A train set of 42 samples cube’s (training set) containing 1848 images was passed to the classifiers with 132,000 features in each cube. For SVM, the kernel function (RBF) was used, with a classification type of one vs. all approaches. However, for KNN, a total number of 8 neighbors with a leaf size of 30 were used respectively. The confusion matrix for SVM and KNN classifier can be seen in Figure 7a,b, which represents the number of samples successfully classified on blind test set ( 132,000) for both traditional classifiers and achieved the classification accuracy of respectively. In addition to that, the entire reflectance is also analyzed and compared with the proposed band reduction method, as shown in Figure 7b for K-NN and Figure 7d for SVM classifier. The proposed method outperformed the entire spectral classification method by achieving the overall accuracy of .
3D-DL and Architecture
In a generalization of the previous studies, deep models outperform conventional methods due to the non-linear information it preserves such as edge, shape, intensity points, and color. Therefore, in the proposed 3D-convolutional model, numerous empirics were conducted to construct effective, optimal architecture. During construction of the 3D-DL model over-fitting may occur, therefore to avoid the process of over-fitting the dropout technique [39] was implemented by using dropout layers. The details of the proposed structure are given in Table 1, in which conv3D represents the convolutional layer and max3D represents the pooling layer for downsampling. The proposed convolutional structure follows the hierarchy of 6 layers in total: A layer of 3-Dimenstional input with the size of (). A total of two 3D convolutions are used to extract the feature maps, which is followed by a 3D max-pooling layer. A kernel size of 8 and 4 is used for each convolution layer with filters for each layer. The activation function at each layer is ’relu’.
Furthermore, the features maps are fully connected (dense layer) with a 256-layer feature extractor through the activation function “relu”. The output layer is then fully connected with a 3 softmax layer to predict the valuable outcome of minced meat. Moreover, in a deep model learning, rate is also a sensitive issue; therefore, in this work, an Adam [40] optimizer is implemented with a step size of 0.001. In general, the model required 30 epochs to train until its convergence and the converge model performed adequately and showed a stable convergence in both validation and training, as presented in Figure 7d.
3.3. Comparison with SVM and KNN
3.3.1. Principle Component Analysis-Based Comparison
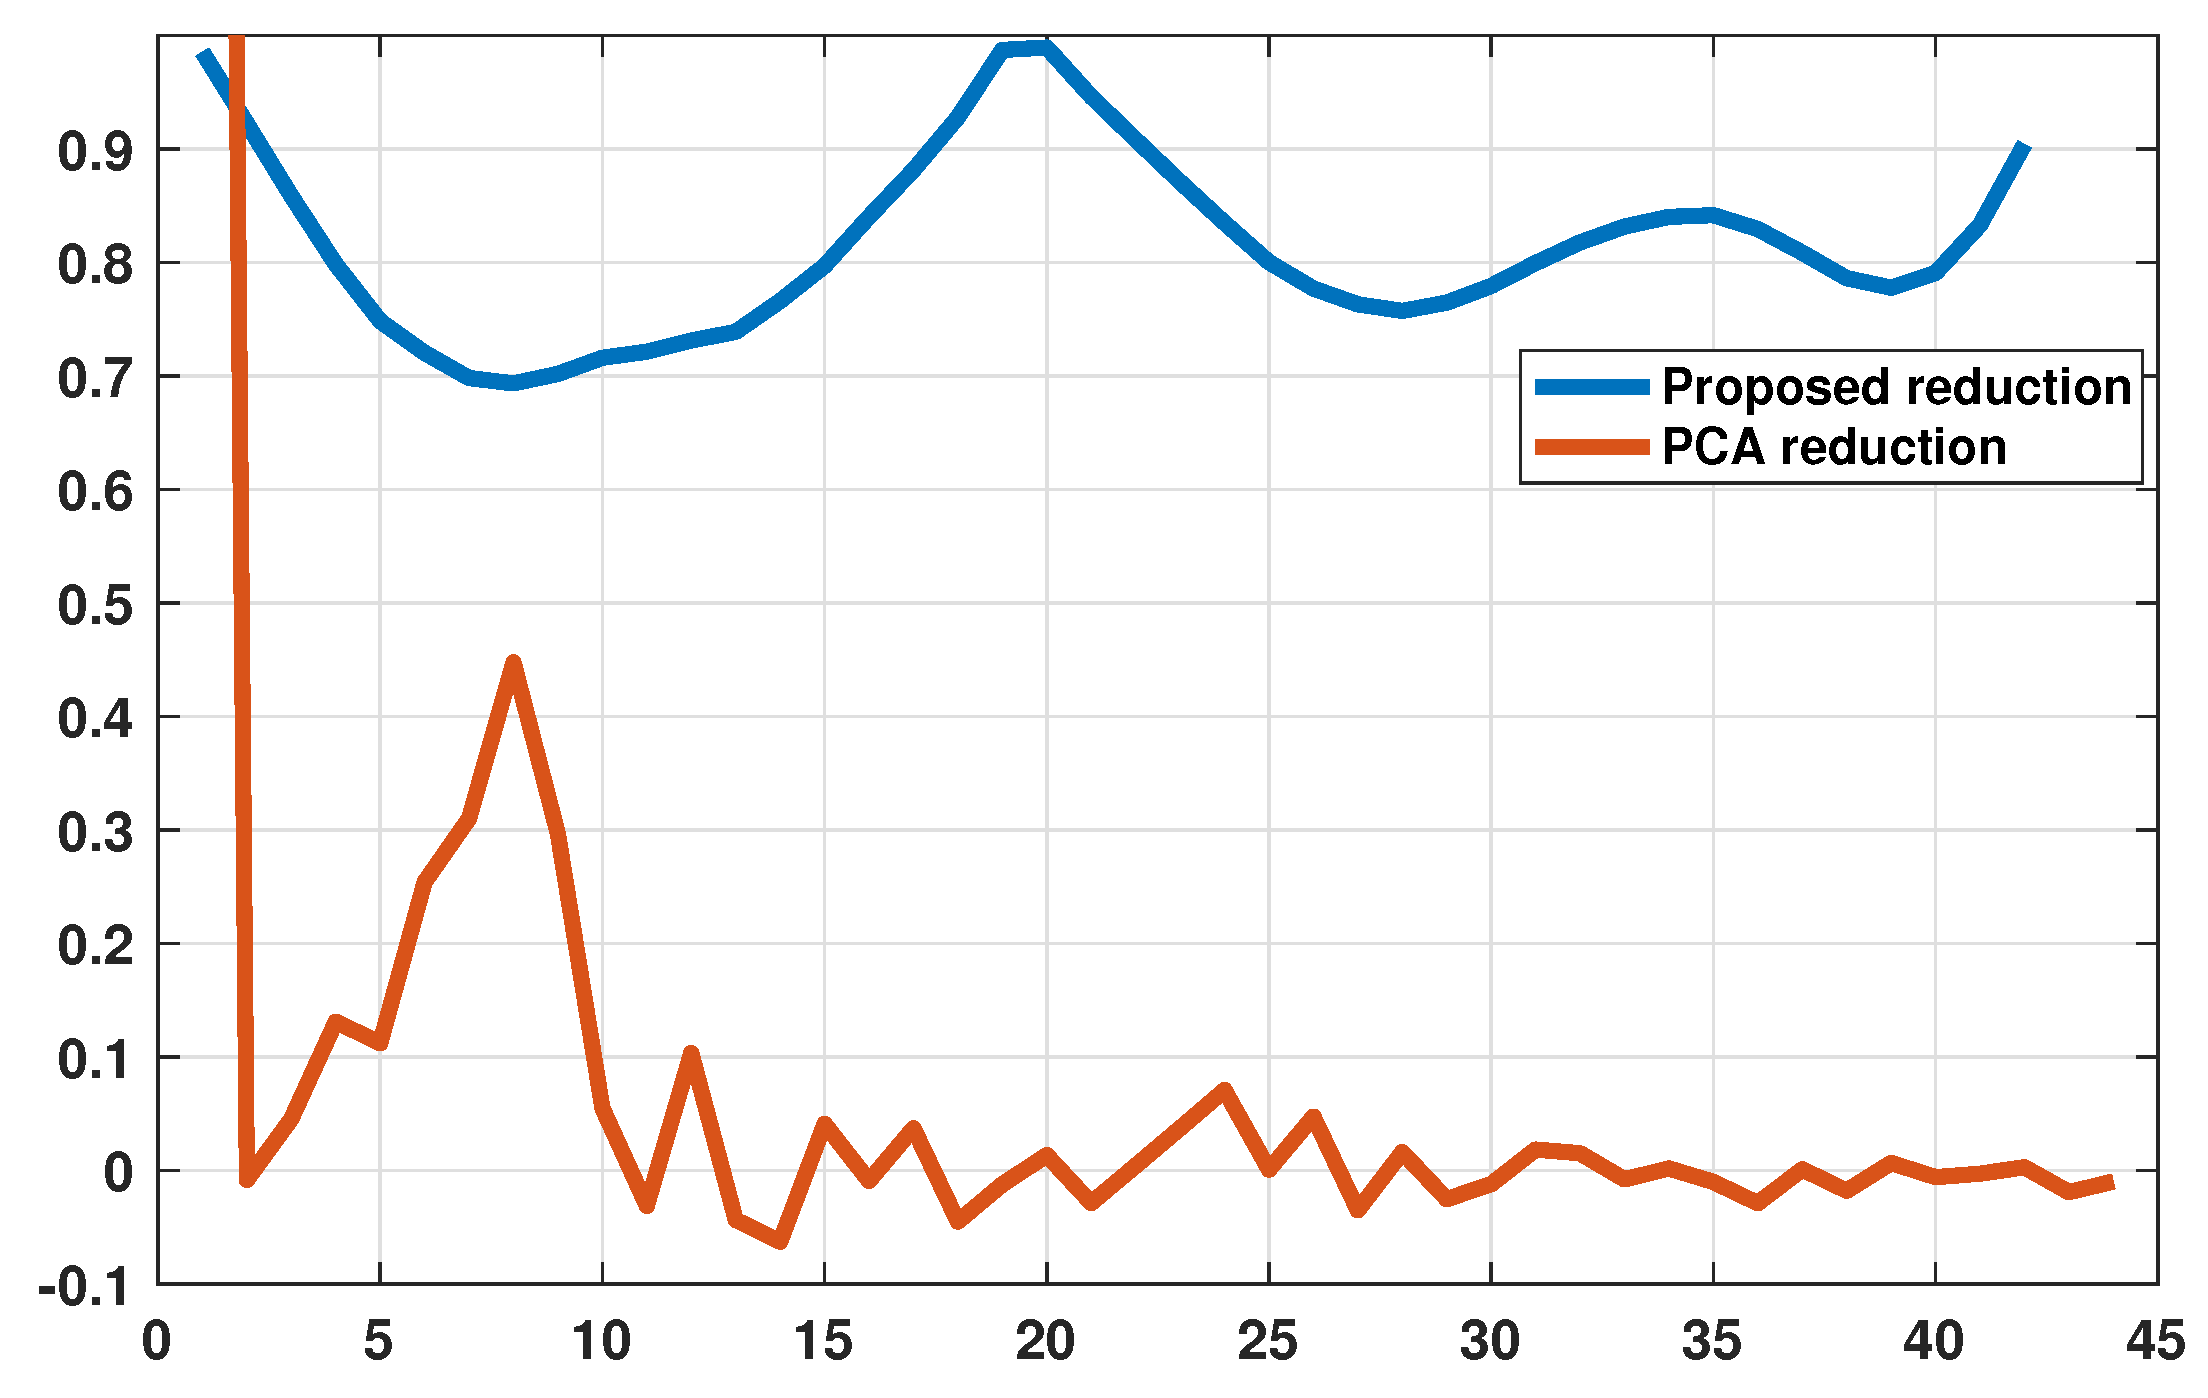
In comparison with a widely used method such as , the overall accuracy of the deep model is 81%, whereas the accuracy achieved by Isos-bestic point base reduction is 94%. The increase in performance is due to the spectral behavior in conventional machine learning and deep learning algorithm as preserves the most information in the first image, which gets lower in the next and one after the other, subjugating the actual spectral response. However, the Isos-bestic band reduction preserves the spectral information for the myoglobin pigments and reduce the HSI-cube by retaining the spectral response and subcategories of Mb pigments. The detailed information of the spectral behavior can be seen in Figure 8.
3.3.2. Model Evaluation
To evaluate the performance of the proposed 3D-DL model, several statistical tests have been analyzed, including overall accuracy, F1-score, precision, and Recall through the following equations;
The values used in the above equations are computed through the confusion matrix. Where and represents the true and false positive, represents the false-negative and M represents the number of samples. The statistical tests are presented in Table 2, where one can easily observe the statistical significance of our proposed model than the traditional classifier. In addition to that, Table 3 represents the overall accuracy (OA) of the traditional and state-of-the-art DL models and showed the DL model outperformed statistical classifier by computing the overall accuracy of 94% respectively. Where DL-PCA represents the accuracy achieved by based reduction of minced meat and DL-Isos represents the band reduction using Isos-bestic point wavelength-division. However, after the deep spatial-spectral analysis of minced meat spectra, some misclassification always remains due to intense similarities in the spectral information of mutton and beef spectra.
4. Conclusions
Meat classification is the most valuable task in the meat industry, and it has been investigated for multiple food frauds. The proposed study investigates the correctness and potential of HSI systems, through conventional classification methods and state-of-the-art deep models respectively. The non-linear features extracted by the DL model provide a robust classification for a different type of meat using only the Mb pigment region in comparison with the traditional machine learning algorithm. The proposed structure outperforms traditional spectral methods by achieving an accuracy of % rather than correlation methods. Also, the DL architecture provides fast and reliable classification to remove the limitation of manual tools used in the meat industry. Furthermore, the future direction of our study is to analyze the classification of adulteration fraud in the food industry using myoglobin spectral response and deep learning models.
Author Contributions
Conceptualization, H.A., M.A., M.M. and A.S.; Data creation, H.A. and M.A.; Formal analysis, H.A. and M.A.; Funding acquisition, M.A. and M.M.; Investigation, H.A. and M.A.; Methodology, H.A. and M.A.; Supervision, M.A. and M.M.; Validation, H.A., M.A. and A.S.; Visualization, H.A., M.A. and A.S.; Writing—original draft, H.A., M.A., M.M. and A.S.; Writing—review & editing, H.A., M.A., M.M. and A.S. All authors have read and agreed to the published version of the manuscript.
Funding
This research received no external funding.
Conflicts of Interest
The authors declare no conflict of interest.
Dataset and Code Availability:
The experimental dataset and running demo will be provided upon reasonable request.
References
- Ahmad, M.; Mazzara, M.; Raza, R.A.; Distefano, S.; Asif, M.; Sarfraz, M.S.; Khan, A.M.; Sohaib, A. Multiclass Non-Randomized Spectral–Spatial Active Learning for Hyperspectral Image Classification. Appl. Sci. 2020, 10, 4739. [Google Scholar] [CrossRef]
- Ahmad, M.; Khan, A.M.; Mazzara, M.; Distefano, S. Multi-layer Extreme Learning Machine-based Autoencoder for Hyperspectral Image Classification. In Proceedings of the VISIGRAPP (4: VISAPP), Prague, Czech Republic, 25–27 February 2019; pp. 75–82. [Google Scholar]
- Dixit, Y.; Casado-Gavalda, M.P.; Cama-Moncunill, R.; Cullen, P.; Sullivan, C. Challenges in model development for meat composition using multipoint NIR spectroscopy from at-line to in-line monitoring. J. Food Sci. 2017, 82, 1557–1562. [Google Scholar] [CrossRef] [PubMed] [Green Version]
- Lu, G.; Fei, B. Medical hyperspectral imaging: A review. J. Biomed. Opt. 2014, 19, 010901. [Google Scholar] [CrossRef] [PubMed]
- Zhang, X.; Qiu, G.; Wang, J.; Zhou, X.; Shen, L.; Aleksic, M.; Vaddadi, S.; Zhuo, S. Multispectral Imaging System. U.S. Patent 9,692,991, 27 June 2017. [Google Scholar]
- Al-Sarayreh, M.; Reis, M.M.; Yan, W.Q.; Klette, R. Deep spectral-spatial features of snapshot hyperspectral images for red-meat classification. In Proceedings of the 2018 International Conference on Image and Vision Computing New Zealand (IVCNZ), Auckland, New Zealand, 19–21 November 2018; pp. 1–6. [Google Scholar]
- Ahmad, M.; Shabbir, S.; Oliva, D.; Mazzara, M.; Distefano, S. Spatial-prior generalized fuzziness extreme learning machine autoencoder-based active learning for hyperspectral image classification. Optik 2020, 206, 163712. [Google Scholar] [CrossRef]
- Geronimo, B.C.; Mastelini, S.M.; Carvalho, R.H.; Júnior, S.B.; Barbin, D.F.; Shimokomaki, M.; Ida, E.I. Computer vision system and near-infrared spectroscopy for identification and classification of chicken with wooden breast, and physicochemical and technological characterization. Infrared Phys. Technol. 2019, 96, 303–310. [Google Scholar] [CrossRef]
- Taheri-Garavand, A.; Fatahi, S.; Omid, M.; Makino, Y. Meat quality evaluation based on computer vision technique: A review. Meat Sci. 2019, 156, 183–195. [Google Scholar] [CrossRef]
- Zheng, Y.; Li, Y.; Satija, A.; Pan, A.; Sotos-Prieto, M.; Rimm, E.; Willett, W.C.; Hu, F.B. Association of changes in red meat consumption with total and cause specific mortality among US women and men: Two prospective cohort studies. BMJ 2019, 365. [Google Scholar] [CrossRef] [Green Version]
- Fuseini, A.; Wotton, S.B.; Knowles, T.G.; Hadley, P.J. Halal meat fraud and safety issues in the UK: A review in the context of the European Union. Food Ethics 2017, 1, 127–142. [Google Scholar] [CrossRef] [Green Version]
- López-Maestresalas, A.; Insausti, K.; Jarén, C.; Pérez-Roncal, C.; Urrutia, O.; Beriain, M.J.; Arazuri, S. Detection of minced lamb and beef fraud using NIR spectroscopy. Food Control 2019, 98, 465–473. [Google Scholar] [CrossRef]
- Ballin, N.Z. Authentication of meat and meat products. Meat Sci. 2010, 86, 577–587. [Google Scholar] [CrossRef]
- Ruslan, A.; Kamarulzaman, N.; Sanny, M. Muslim consumers’ awareness and perception of Halal food fraud. Int. Food Res. J. 2018, 25, S87–S96. [Google Scholar]
- Cheng, J.H.; Nicolai, B.; Sun, D.W. Hyperspectral imaging with multivariate analysis for technological parameters prediction and classification of muscle foods: A review. Meat Sci. 2017, 123, 182–191. [Google Scholar] [CrossRef] [PubMed]
- Sanz, J.A.; Fernandes, A.M.; Barrenechea, E.; Silva, S.; Santos, V.; Gonçalves, N.; Paternain, D.; Jurio, A.; Melo-Pinto, P. Lamb muscle discrimination using hyperspectral imaging: Comparison of various machine learning algorithms. J. Food Eng. 2016, 174, 92–100. [Google Scholar] [CrossRef]
- Xiong, Z.; Sun, D.W.; Zeng, X.A.; Xie, A. Recent developments of hyperspectral imaging systems and their applications in detecting quality attributes of red meats: A review. J. Food Eng. 2014, 132, 1–13. [Google Scholar] [CrossRef]
- ElMasry, G.; Barbin, D.F.; Sun, D.W.; Allen, P. Meat quality evaluation by hyperspectral imaging technique: An overview. Crit. Rev. Food Sci. Nutr. 2012, 52, 689–711. [Google Scholar] [CrossRef]
- Velásquez, L.; Cruz-Tirado, J.; Siche, R.; Quevedo, R. An application based on the decision tree to classify the marbling of beef by hyperspectral imaging. Meat Sci. 2017, 133, 43–50. [Google Scholar] [CrossRef]
- Barbon, S.; Costa Barbon, A.P.A.d.; Mantovani, R.G.; Barbin, D.F. Machine Learning Applied to Near-Infrared Spectra for Chicken Meat Classification. J. Spectrosc. 2018, 2018, 8949741. [Google Scholar] [CrossRef]
- Liu, Y.; Sun, D.W.; Cheng, J.H.; Han, Z. Hyperspectral imaging sensing of changes in moisture content and color of beef during microwave heating process. Food Anal. Methods 2018, 11, 2472–2484. [Google Scholar] [CrossRef]
- Liu, D.; Ma, J.; Sun, D.W.; Pu, H.; Gao, W.; Qu, J.; Zeng, X.A. Prediction of color and pH of salted porcine meats using visible and near-infrared hyperspectral imaging. Food Bioprocess Technol. 2014, 7, 3100–3108. [Google Scholar] [CrossRef]
- Xu, J.L.; Gowen, A.A. Spatial-spectral analysis method using texture features combined with PCA for information extraction in hyperspectral images. J. Chemom. 2020, 34, e3132. [Google Scholar] [CrossRef]
- Ayaz, H.; Ahmad, M.; Sohaib, A.; Yasir, M.N.; Zaidan, M.A.; Ali, M.; Khan, M.H.; Saleem, Z. Myoglobin-Based Classification of Minced Meat Using Hyperspectral Imaging. Appl. Sci. 2020, 10, 6862. [Google Scholar] [CrossRef]
- Xiong, Z.; Sun, D.W.; Pu, H.; Zhu, Z.; Luo, M. Combination of spectra and texture data of hyperspectral imaging for differentiating between free-range and broiler chicken meats. LWT-Food Sci. Technol. 2015, 60, 649–655. [Google Scholar] [CrossRef]
- Li, Y.; Zhang, H.; Shen, Q. Spectral–spatial classification of hyperspectral imagery with 3D convolutional neural network. Remote Sens. 2017, 9, 67. [Google Scholar] [CrossRef] [Green Version]
- Weng, S.; Guo, B.; Tang, P.; Yin, X.; Pan, F.; Zhao, J.; Huang, L.; Zhang, D. Rapid detection of adulteration of minced beef using Vis/NIR reflectance spectroscopy with multivariate methods. Spectrochim. Acta Part A Mol. Biomol. Spectrosc. 2020, 230, 118005. [Google Scholar] [CrossRef] [PubMed]
- Ahmad, M. A Fast 3D CNN for Hyperspectral Image Classification. arXiv 2020, arXiv:2004.14152. [Google Scholar]
- Al-Sarayreh, M.; M Reis, M.; Qi Yan, W.; Klette, R. Detection of red-meat adulteration by deep spectral–spatial features in hyperspectral images. J. Imaging 2018, 4, 63. [Google Scholar] [CrossRef] [Green Version]
- Farrand, W.H.; Singer, R.B.; Merényi, E. Retrieval of apparent surface reflectance from AVIRIS data: A comparison of empirical line, radiative transfer, and spectral mixture methods. Remote Sens. Environ. 1994, 47, 311–321. [Google Scholar] [CrossRef]
- Su, H.; Du, Q.; Du, P. Hyperspectral image visualization using band selection. IEEE J. Sel. Top. Appl. Earth Obs. Remote Sens. 2013, 7, 2647–2658. [Google Scholar] [CrossRef]
- Schafer, R.W. What is a Savitzky-Golay filter. IEEE Signal Process. Mag. 2011, 28, 111–117. [Google Scholar] [CrossRef]
- Cozzolino, D.; Murray, I. Identification of animal meat muscles by visible and near infrared reflectance spectroscopy. LWT-Food Sci. Technol. 2004, 37, 447–452. [Google Scholar] [CrossRef]
- American Meat Science Association. AMSA Meat Color Measurement Guidelines: AMSA; American Meat Science Association: Savoy, IL, USA, 2012. [Google Scholar]
- Huang, H.; Liu, L.; Ngadi, M.O. Recent developments in hyperspectral imaging for assessment of food quality and safety. Sensors 2014, 14, 7248–7276. [Google Scholar] [CrossRef] [Green Version]
- Akilan, T.; Wu, Q.J.; Zhang, H. Effect of fusing features from multiple DCNN architectures in image classification. IET Image Process. 2018, 12, 1102–1110. [Google Scholar] [CrossRef]
- Liang, H.; Li, Q. Hyperspectral imagery classification using sparse representations of convolutional neural network features. Remote Sens. 2016, 8, 99. [Google Scholar] [CrossRef] [Green Version]
- Carneiro, T.; Da Nóbrega, R.V.M.; Nepomuceno, T.; Bian, G.B.; De Albuquerque, V.H.C.; Reboucas Filho, P.P. Performance analysis of google colaboratory as a tool for accelerating deep learning applications. IEEE Access 2018, 6, 61677–61685. [Google Scholar] [CrossRef]
- Srivastava, N.; Hinton, G.; Krizhevsky, A.; Sutskever, I.; Salakhutdinov, R. Dropout: A simple way to prevent neural networks from overfitting. J. Mach. Learn. Res. 2014, 15, 1929–1958. [Google Scholar]
- Kingma, D.P.; Ba, J. Adam: A method for stochastic optimization. arXiv 2014, arXiv:1412.6980. [Google Scholar]
Figure 1.
The entire process of sample preparation; (a) represents chuck meat; and (b) represents the minced meat.
Figure 1.
The entire process of sample preparation; (a) represents chuck meat; and (b) represents the minced meat.

Figure 2.
Mean reflectance spectrum for beef, mutton and chicken minced meat.

Figure 3.
Generated Regions of Interest (ROIs) for primary minced meat types. (a) Beef minced meat; (b) mutton minced meat; (c) chicken minced meat.
Figure 3.
Generated Regions of Interest (ROIs) for primary minced meat types. (a) Beef minced meat; (b) mutton minced meat; (c) chicken minced meat.

Figure 4.
Spectral band reduction of minced meat spectrum; the red line represents the selected bands and blue line represents the Isos-bestic point scaling of the reflectance spectra.
Figure 4.
Spectral band reduction of minced meat spectrum; the red line represents the selected bands and blue line represents the Isos-bestic point scaling of the reflectance spectra.

Figure 5.
Proposed 3D-Convolutional model for minced meat classification. (A) represents the 3D-Convolutional Neural Network (3D-CNN) framework and (B) represents the Convolution and Kernel Operation for 3D Spectral Cube.
Figure 5.
Proposed 3D-Convolutional model for minced meat classification. (A) represents the 3D-Convolutional Neural Network (3D-CNN) framework and (B) represents the Convolution and Kernel Operation for 3D Spectral Cube.

Figure 6.
Reduced spectrum of minced meat, representing Myoglobin pigments (Mb) pigments information for each minced meat types.
Figure 6.
Reduced spectrum of minced meat, representing Myoglobin pigments (Mb) pigments information for each minced meat types.

Figure 7.
Confusion matrix for 17 blind spatial-spectral cubes, where (a,c,e) represent the confusion matrix of Support Vector Machine (SVM), K-Nearest Neighbor (KNN) and Deep Learning (DL) model using proposed band reduction method; and (b,d,f) represents the confusion metrics for entire spectral bands; (g,h) represent the training and validation loss/accuracy curves for the proposed architecture.

Figure 8.
The spectral behaviour of principal component analysis (PCA) based band reduction and proposed (Isos-bestic) band reduction method.
Figure 8.
The spectral behaviour of principal component analysis (PCA) based band reduction and proposed (Isos-bestic) band reduction method.


Table 1.
Structure for 3D-DL Architecture.
| Layers | Kernels | Filters | Activation | Output Size | Params |
|---|---|---|---|---|---|
| Input layer | — | — | — | (None, 60, 50, 44) | 0 |
| conv3d (Conv3D) | 8 | relu | (None, 58, 48, 42) | 224 | |
| conv3d (Conv3D) | 8 | relu | (None, 56, 46, 40) | 1736 | |
| max pooling | — | — | — | (None, 28, 23, 20) | 0 |
| flatten (Flatten) | — | — | — | (None, 51520) | 0 |
| dense (Dense) | — | — | relu | (None, 256) | 13,189,376 |
| dropout (0.4) | — | — | — | (None, 256) | 0 |
| dense (Dense) | — | — | — | (None, 3) | 771 |
| Total Trainable Parameters = | |||||
Table 2.
Statistical evaluation of SVM, KNN and DL model of Isos-bestic reduction.
| Classifier | Beef | Chicken | Mutton |
|---|---|---|---|
| Precision | |||
| KNN | 0.67 | 0.99 | 0.99 |
| SVM | 0.71 | 0.99 | 0.75 |
| DL | 0.86 | 0.99 | 0.99 |
| Recall | |||
| KNN | 0.99 | 0.99 | 0.40 |
| SVM | 0.83 | 0.99 | 0.60 |
| DL | 0.99 | 0.99 | 0.80 |
| score | |||
| KNN | 0.80 | 0.99 | 0.57 |
| SVM | 0.77 | 0.99 | 0.67 |
| DL | 0.92 | 0.99 | 0.89 |
Table 3.
The overall accuracy (OA) achieved by each classifer.
| Classifier | Beef | Chicken | Mutton | OA |
|---|---|---|---|---|
| KNN-Isos | 0.99 | 0.99 | 0.40 | 0.82 |
| KNN-PCA | 0.80 | 0.99 | 0.40 | 0.75 |
| KNN-224 | 0.83 | 0.99 | 0.40 | 0.75 |
| SVM-Isos | 0.83 | 0.99 | 0.60 | 0.82 |
| SVM-PCA | 0.40 | 0.99 | 0.40 | 0.62 |
| SVM-224 | 0.83 | 0.99 | 0.40 | 0.75 |
| DL-Isos | 0.99 | 0.99 | 0.80 | 0.94 |
| DL-PCA | 0.99 | 0.99 | 0.40 | 0.81 |
| DL-224 | 0.50 | 0.99 | 0.40 | 0.64 |
Publisher’s Note: MDPI stays neutral with regard to jurisdictional claims in published maps and institutional affiliations. |
© 2020 by the authors. Licensee MDPI, Basel, Switzerland. This article is an open access article distributed under the terms and conditions of the Creative Commons Attribution (CC BY) license (http://creativecommons.org/licenses/by/4.0/).
Share and Cite
MDPI and ACS Style
Ayaz, H.; Ahmad, M.; Mazzara, M.; Sohaib, A. Hyperspectral Imaging for Minced Meat Classification Using Nonlinear Deep Features. Appl. Sci. 2020, 10, 7783. https://doi.org/10.3390/app10217783
AMA Style
Ayaz H, Ahmad M, Mazzara M, Sohaib A. Hyperspectral Imaging for Minced Meat Classification Using Nonlinear Deep Features. Applied Sciences. 2020; 10(21):7783. https://doi.org/10.3390/app10217783
Chicago/Turabian StyleAyaz, Hamail, Muhammad Ahmad, Manuel Mazzara, and Ahmed Sohaib. 2020. "Hyperspectral Imaging for Minced Meat Classification Using Nonlinear Deep Features" Applied Sciences 10, no. 21: 7783. https://doi.org/10.3390/app10217783
Note that from the first issue of 2016, this journal uses article numbers instead of page numbers. See further details here.