Assessing Stiffness, Joint Torque and ROM for Paretic and Non-Paretic Lower Limbs during the Subacute Phase of Stroke Using Lokomat Tools


Abstract
:1. Introduction
2. Materials and Methods
2.1. Design of the Study
2.2. Participants
2.3. Rehabilitative Program
2.4. Measurement Protocol
2.5. Statistical Analysis
3. Results
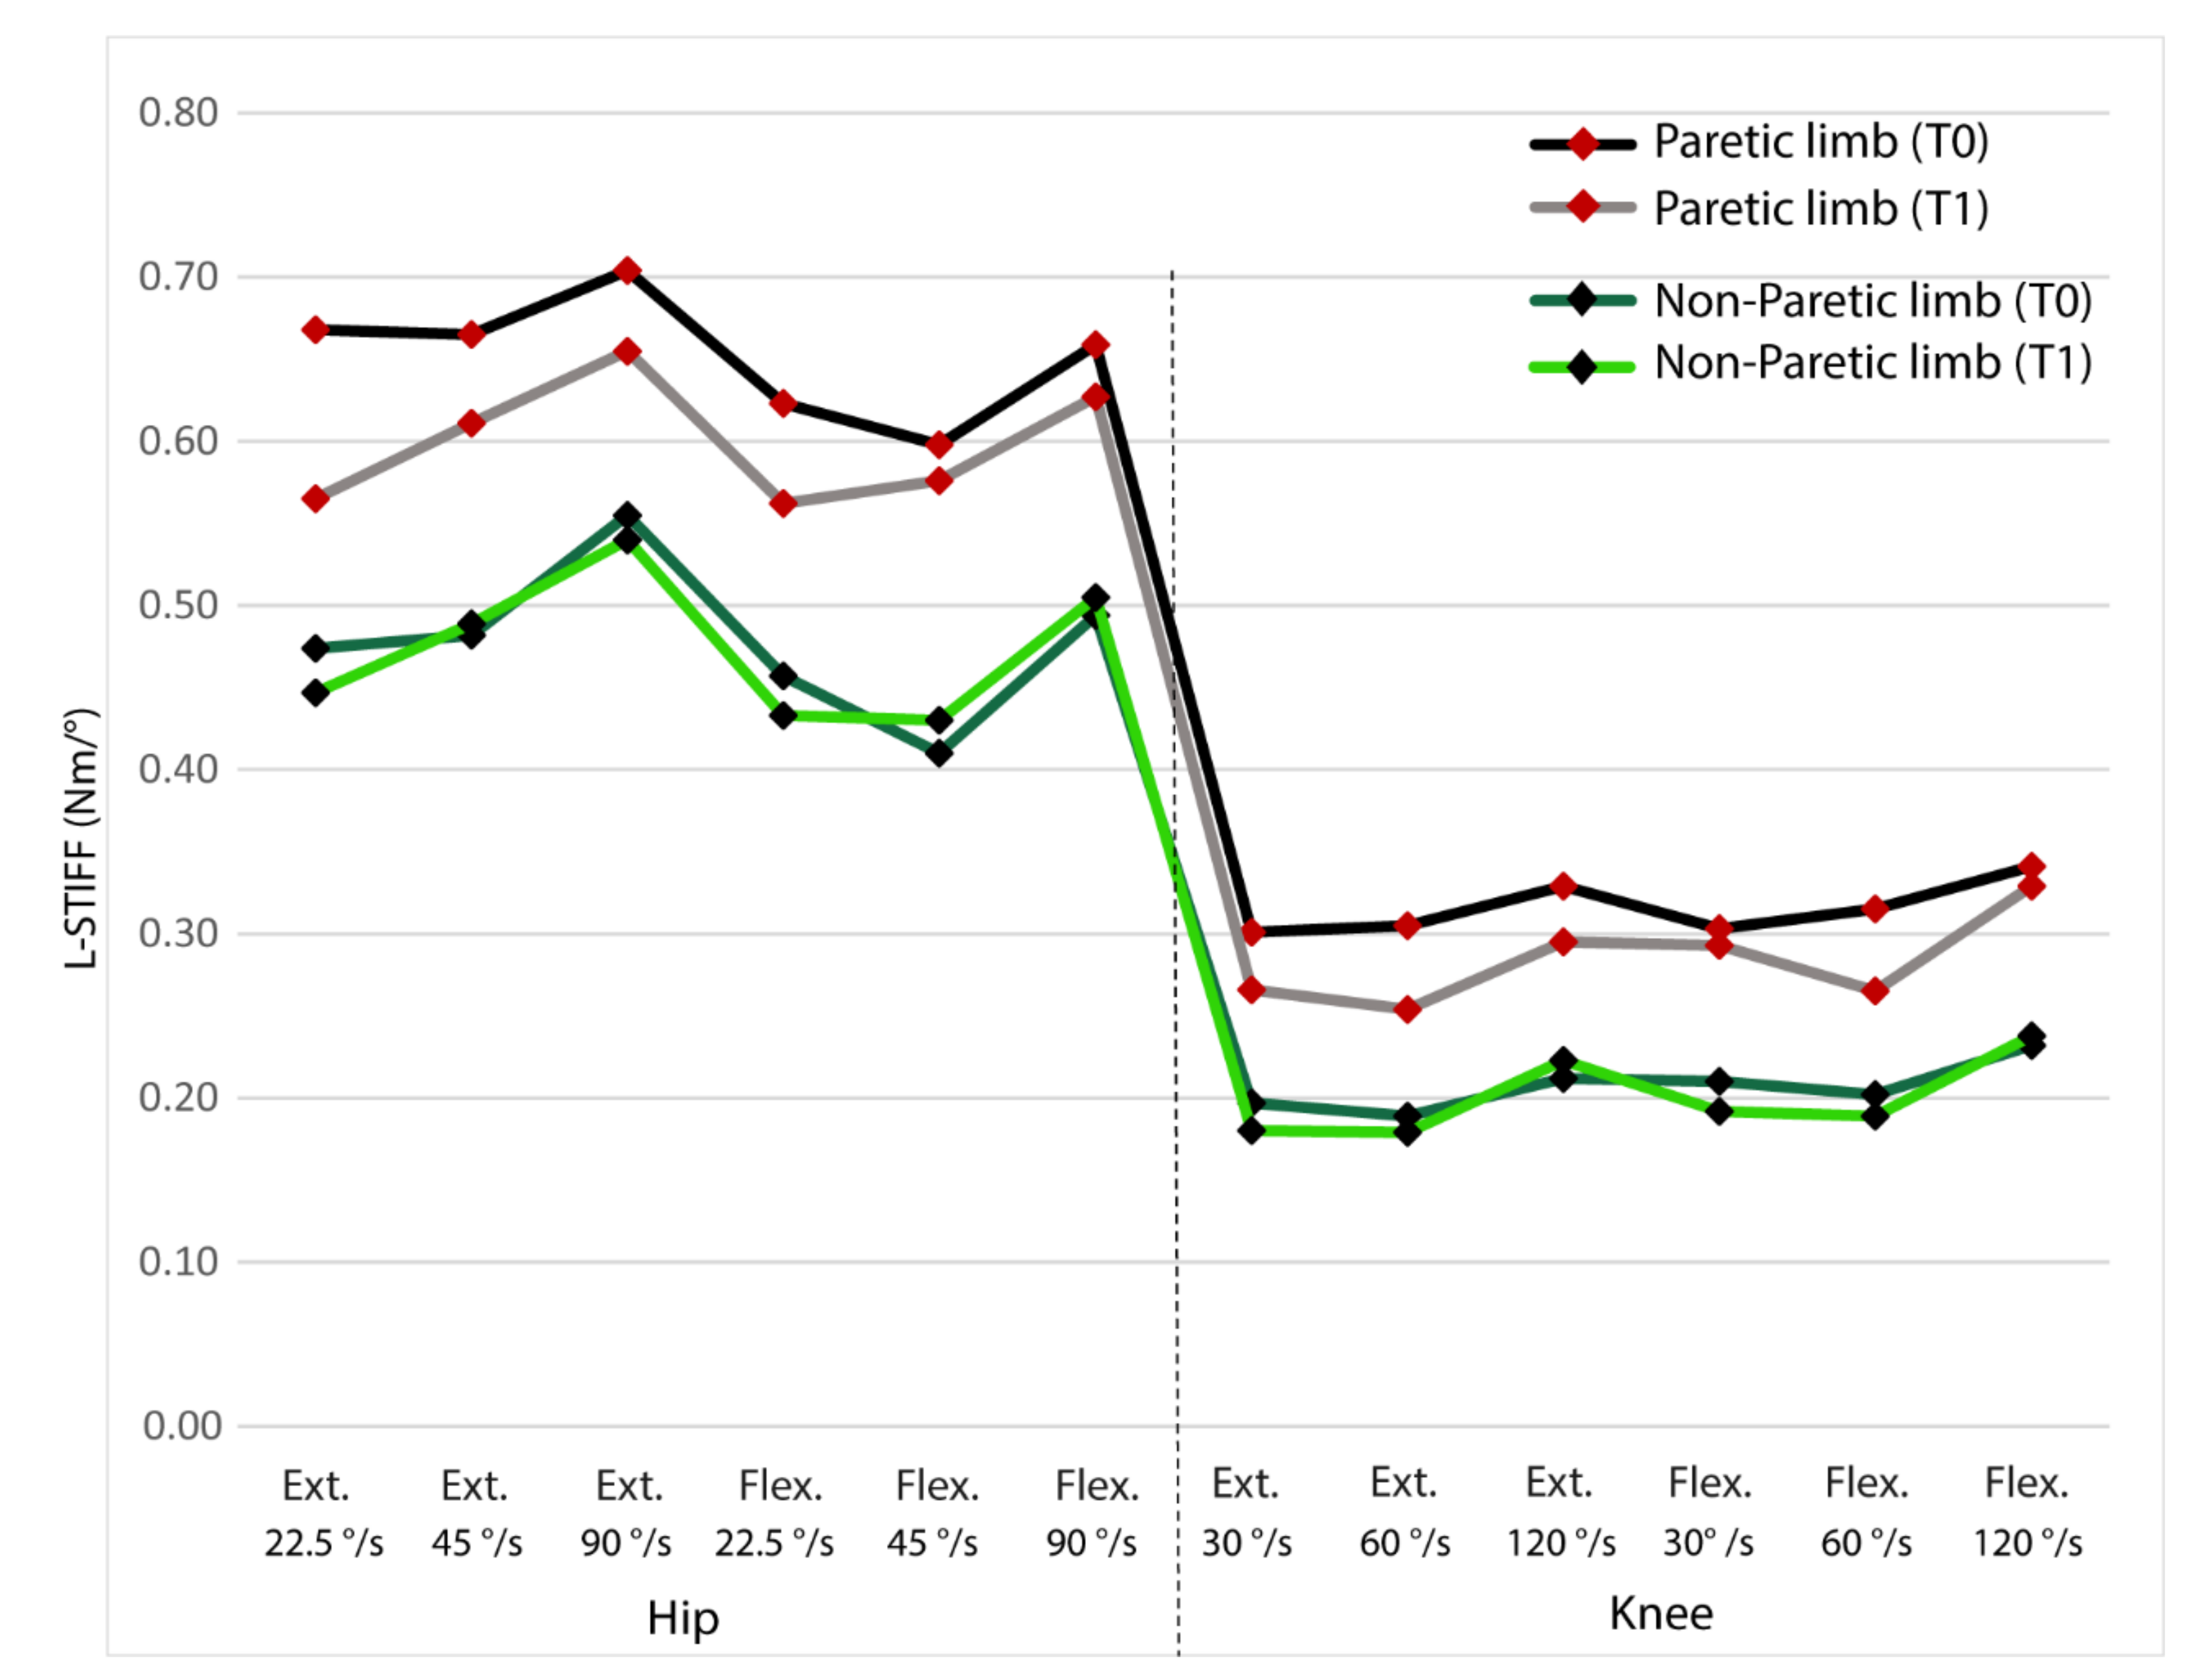
3.1. Stiffness
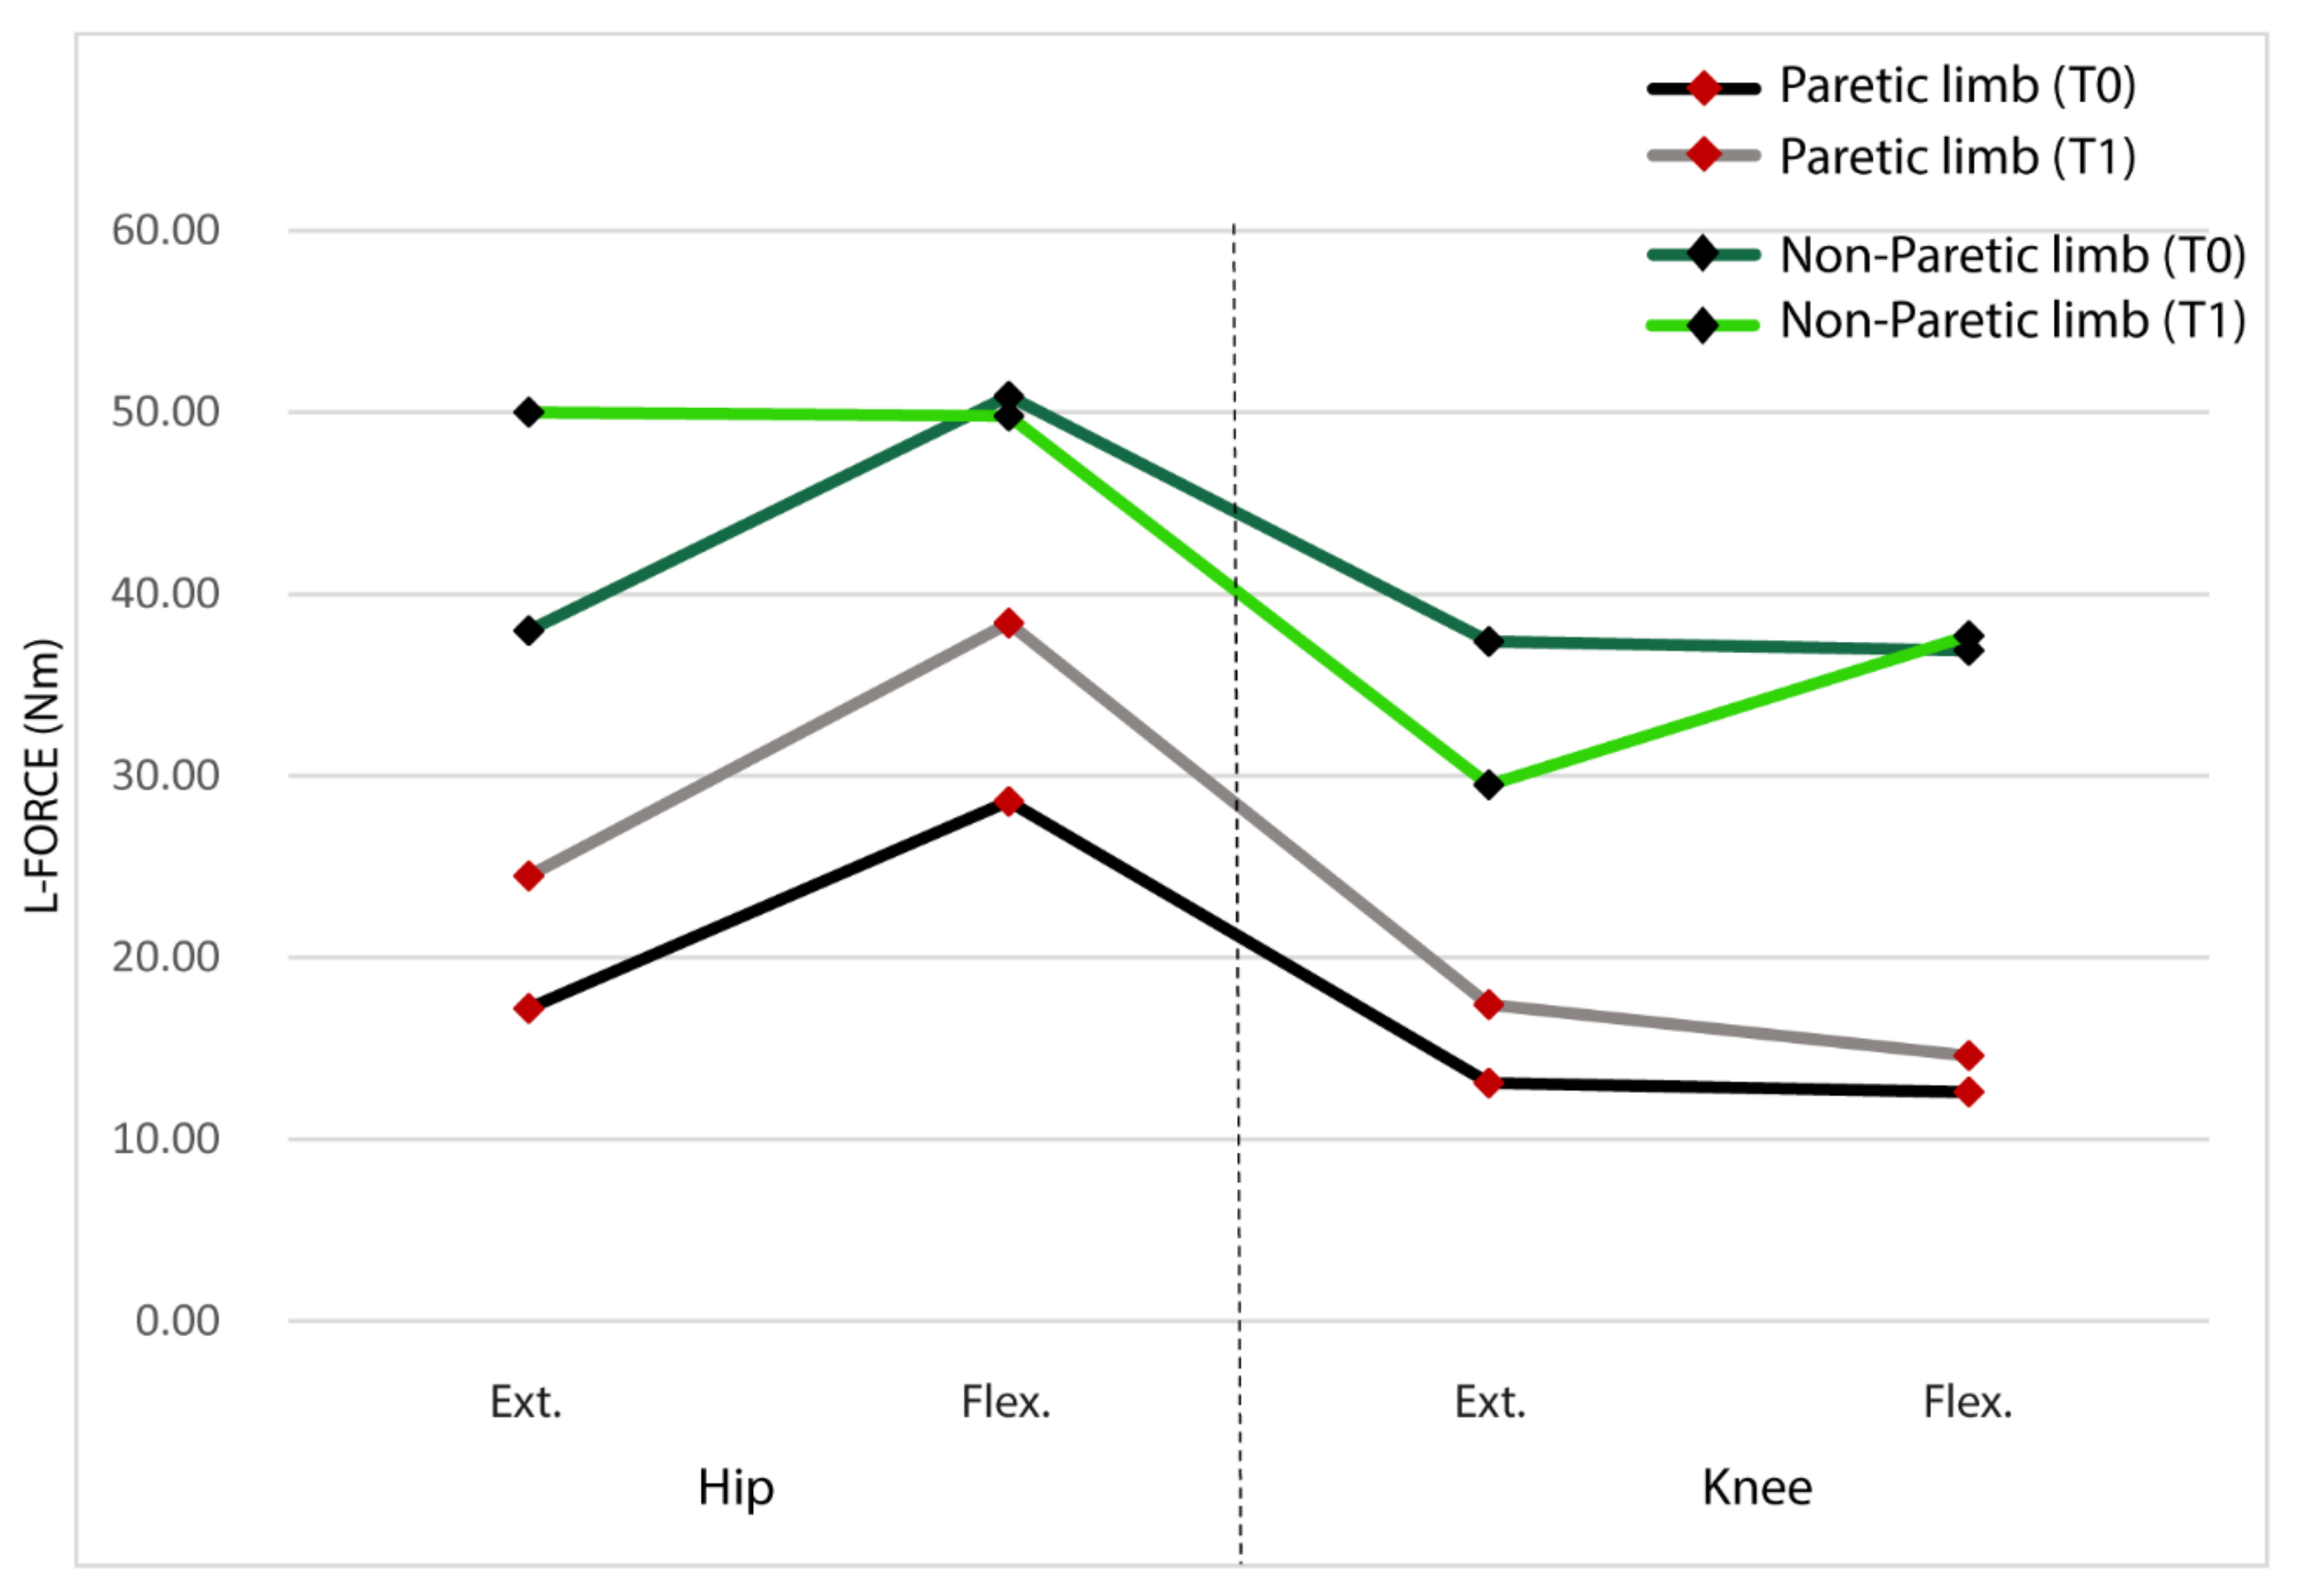
3.2. Joint Torque
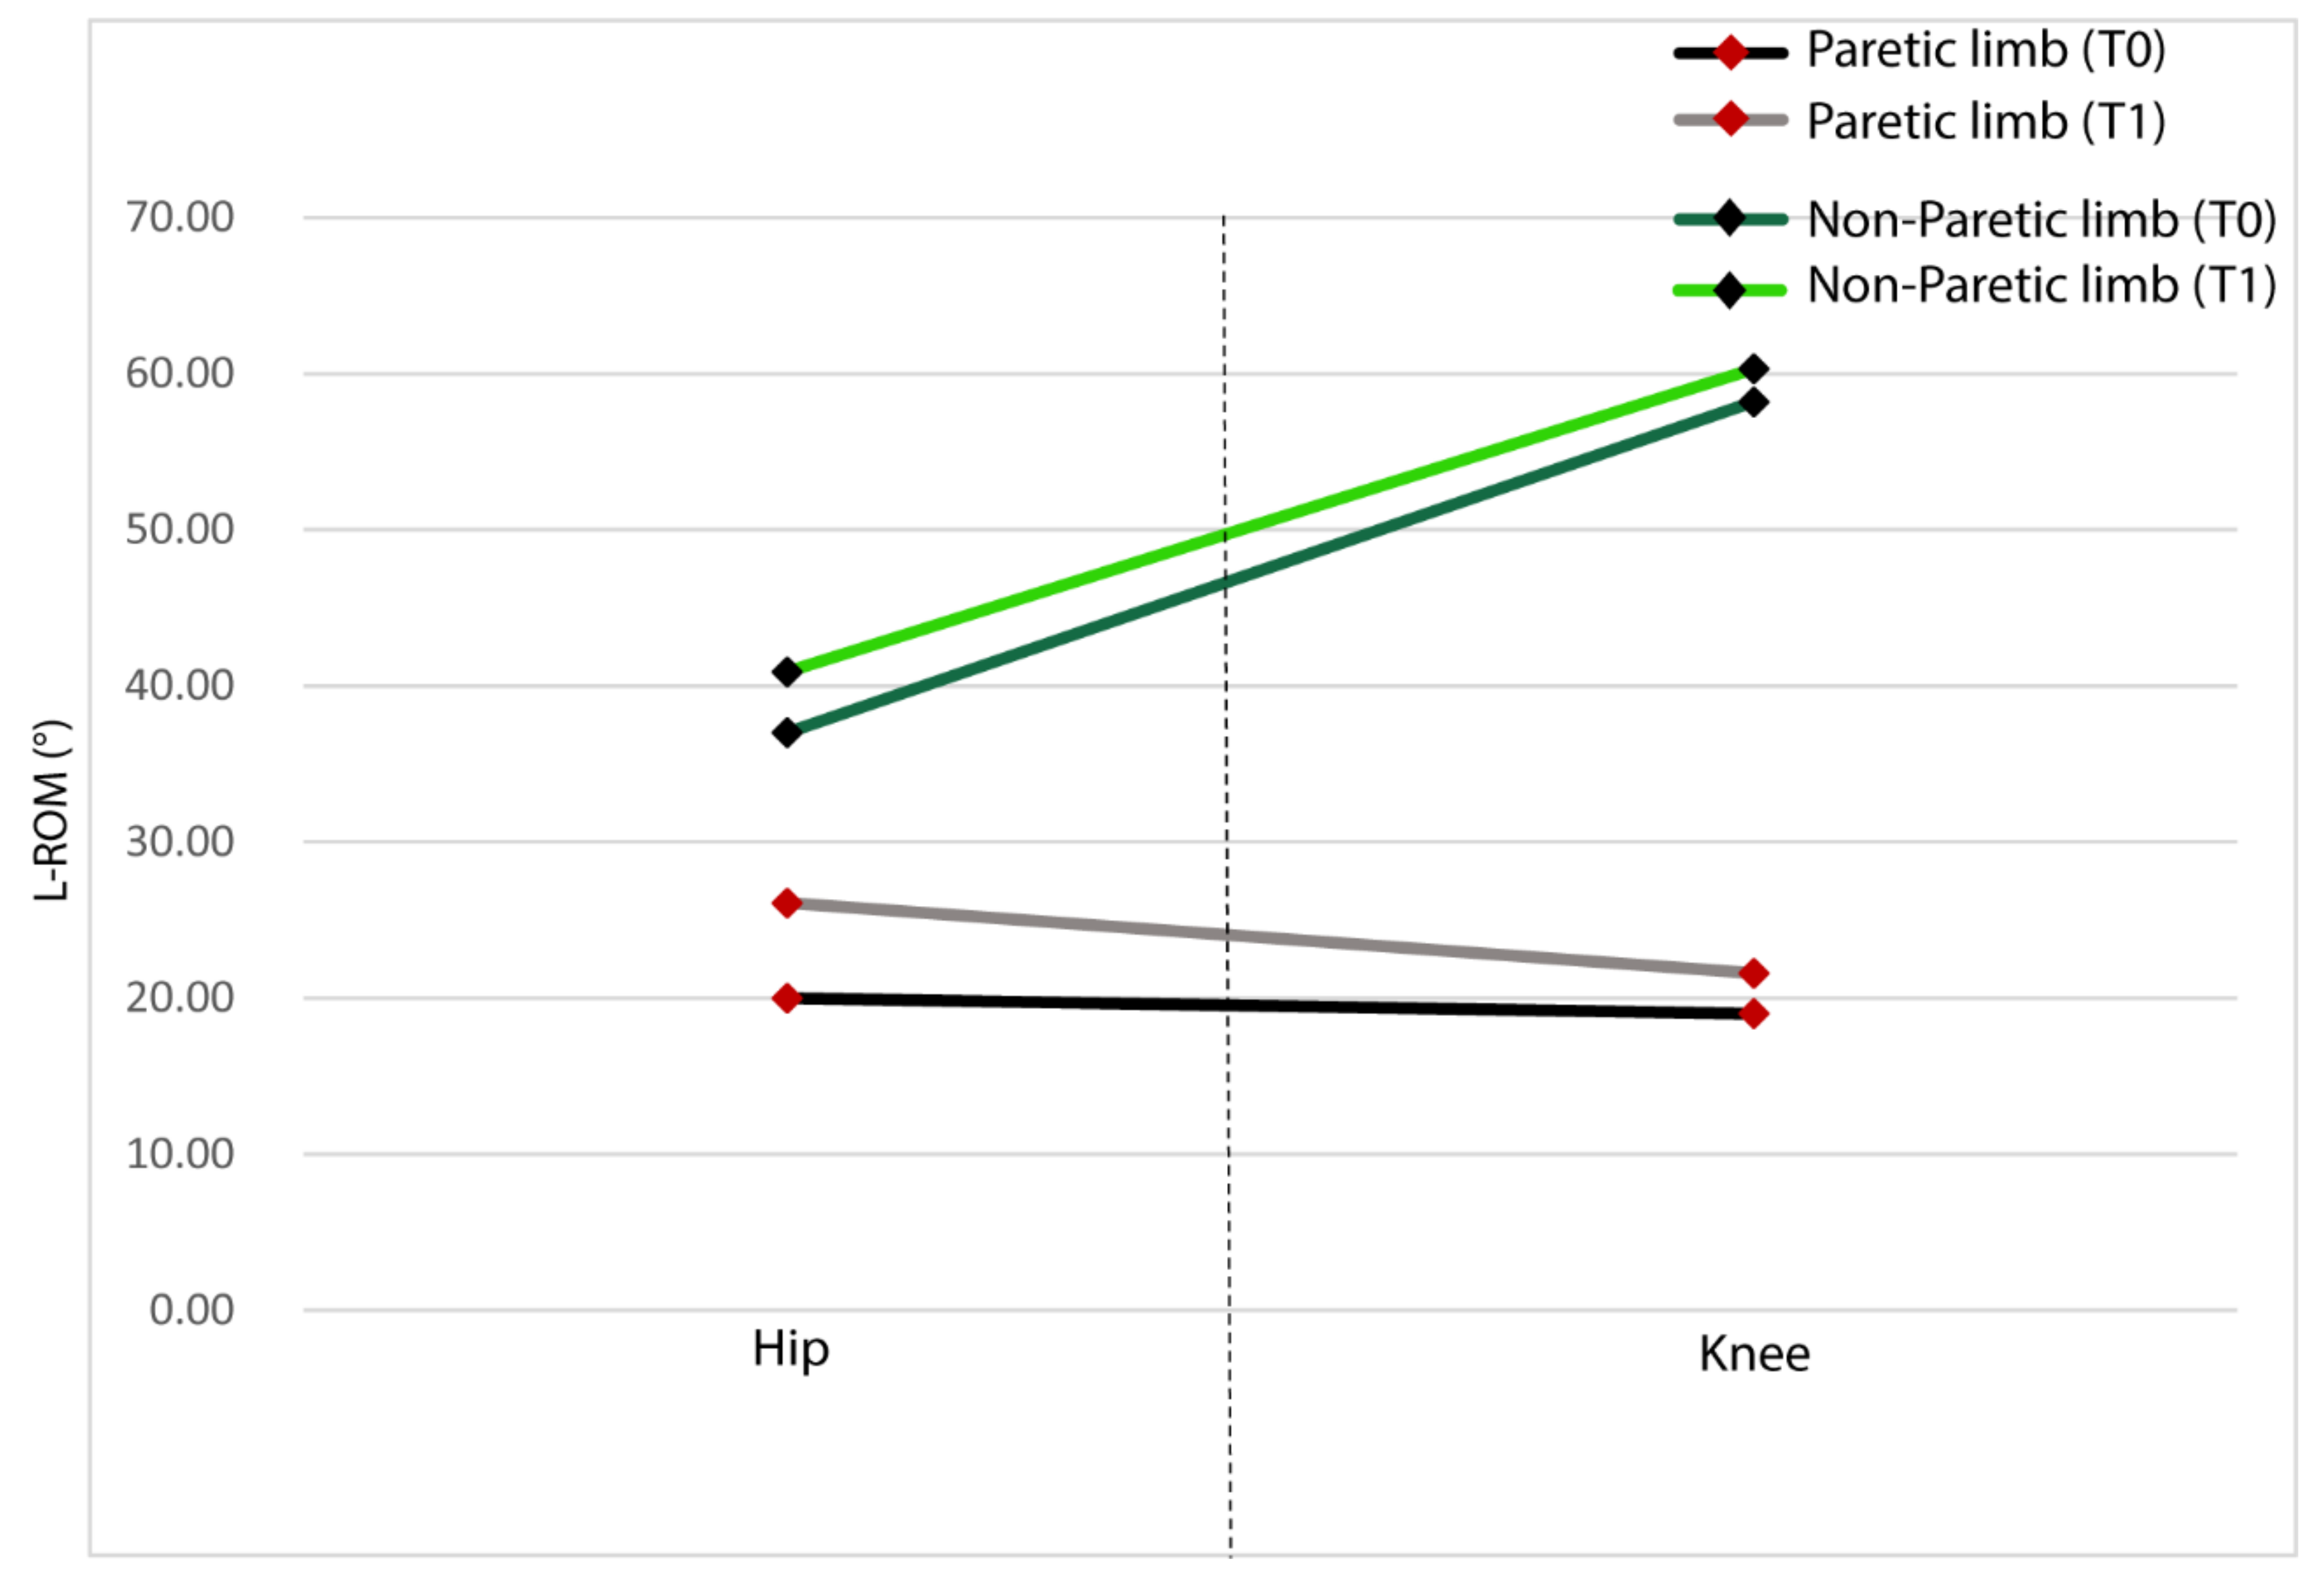
3.3. Range of Motion
4. Discussion
5. Conclusions
Author Contributions
Funding
Conflicts of Interest
References
- Benjamin, E.J.; Blaha, M.J.; Chiuve, S.; Cushman, M.; Das, S.R.; Deo, R.; de Ferranti, S.D.; Floyd, J.; Fornage, M.; Association Statistics Committee and Stroke Statistics Subcommittee; et al. Heart disease and stroke statistics-2017 update: A report from the American Heart Association. Circulation 2017, 135. [Google Scholar] [CrossRef]
- Li, X.; Holobar, A.; Gazzoni, M.; Merletti, R.; Rymer, W.Z.; Zhou, P. Examination of poststroke alteration in motor unit firing behavior using high-density surface EMG decomposition. BME IEEE Trans. 2015, 62, 1242–1252. [Google Scholar] [CrossRef] [PubMed]
- Leathley, M.J.; Gregson, J.M.; Moore, A.P.; Smith, T.L.; Sharma, A.K.; Watkins, C.L. Predicting spasticity after stroke in those surviving to 12 months. Clin. Rehabil. 2004, 18, 438–443. [Google Scholar] [CrossRef] [PubMed]
- Schrama, P.P.M.; Stenneberg, M.S.; Lucas, C.; van Trijffel, E. Intraexaminer reliability of hand-held dynamometry in the upper extremity: A systematic review. Arch. Phys. Med. Rehabil. 2014, 95, 2444–2469. [Google Scholar] [CrossRef] [PubMed]
- Verschuren, O.; Ketelaar, M.; Takken, T.; Van Brussel, M.; Helders, P.J.M.; Gorter, J.W. Reliability of hand-held dynamometry and functional strength tests for the lower extremity in children with Cerebral Palsy. Disabil. Rehabil. 2008, 30, 1358–1366. [Google Scholar] [CrossRef]
- Akpinar, P.; Atici, A.; Ozkan, F.U.; Aktas, I.; Kulcu, D.G.; Sarı, A.; Durmus, B. Reliability of the Modified Ashworth Scale and Modified Tardieu Scale in patients with spinal cord injuries. Spinal Cord. 2017, 55, 944–949. [Google Scholar] [CrossRef]
- Bar-On, L.; Van Campenhout, A.; Desloovere, K.; Aertbeliën, E.; Huenaerts, C.; Vandendoorent, B.; Nieuwenhuys, A.; Molenaers, G. Is an instrumented spasticity assessment an improvement over clinical spasticity scales in assessing and predicting the response to integrated botulinum toxin type a treatment in children with cerebral palsy? Arch. Phys. Med. Rehabil. 2014, 95, 515–523. [Google Scholar] [CrossRef]
- Muñoz-Bermejo, L.; Pérez-Gómez, J.; Manzano, F.; Collado-Mateo, D.; Villafaina, S.; Adsuar, J.C. Reliability of isokinetic knee strength measurements in children: A systematic review and meta-analysis. PLoS ONE 2019, 14, e0226274. [Google Scholar] [CrossRef]
- Akman, M.N.; Bengi, R.; Karatas, M.; Kilinç, S.; Sözay, S.; Ozker, R. Assessment of spasticity using isokinetic dynamometry in patients with spinal cord injury. Spinal Cord. 1999, 37, 638–643. [Google Scholar] [CrossRef] [Green Version]
- Fisahn, C.; Aach, M.; Jansen, O.; Moisi, M.; Mayadev, A.; Pagarigan, K.T.; Dettori, J.R.; Schildhauer, T.A. The Effectiveness and safety of exoskeletons as assistive and rehabilitation devices in the treatment of neurologic gait disorders in patients with spinal cord injury: A systematic review. Glob. Spine J. 2016, 6, 822–841. [Google Scholar] [CrossRef] [Green Version]
- Cherni, Y.; Girardin-Vignola, G.; Ballaz, L.; Begon, M. Reliability of maximum isometric hip and knee torque measurements in children with cerebral palsy using a paediatric exoskeleton—Lokomat. Neurophysiol. Clin. 2019, 49, 335–342. [Google Scholar] [CrossRef] [PubMed]
- Riener, R. Technology of the robotic gait orthosis lokomat. In Neurorehabilitation Technology; Dietz, V., Nef, T., Rymer, W., Eds.; Springer: London, UK, 2012; pp. 221–232. [Google Scholar] [CrossRef]
- Cherni, Y.; Ballaz, L.; Girardin-Vignola, G.; Begon, M. Intra- and inter-tester reliability of spasticity assessment in standing position in children and adolescents with cerebral palsy using a paediatric exoskeleton. Disabil. Rehabil. 2019, 31, 1–7. [Google Scholar] [CrossRef] [PubMed]
- Wallard, L.; Dietrich, G.; Kerlirzin, Y.; Bredin, J. Effects of robotic gait rehabilitation on biomechanical parameters in the chronic hemiplegic patients. Neurophysiol. Clin. Clin. Neurophysiol. 2015, 45, 215–219. [Google Scholar] [CrossRef] [PubMed]
- Kim, S.J.; Lee, H.J.; Hwang, S.W.; Pyo, H.; Yang, S.P.; Lim, M.H.; Park, G.L.; Kim, E.J. Clinical characteristics of proper robot-assisted gait training group in non-ambulatory subacute stroke patients. Ann. Rehabil. Med. 2016, 40, 183–189. [Google Scholar] [CrossRef] [PubMed] [Green Version]
- Schmartz, A.C.; Meyer-Heim, A.D.; Müller, R.; Bolliger, M. Measurement of muscle stiffness using robotic assisted gait orthosis in children with cerebral palsy: A proof of concept. Disabil. Rehabil. Assist. Technol. 2011, 6, 29–37. [Google Scholar] [CrossRef]
- Hidler, J.; Nichols, D.; Pelliccio, M.; Brady, K.; Campbell, D.D.; Kahn, J.H.; Hornby, T.G. Multicenter randomized clinical trial evaluating the effectiveness of the lokomat in subacute stroke. Neurorehab. Neural Repair 2009, 23, 5–13. [Google Scholar] [CrossRef]
- van Nunen, M.P.M.; Gerrits, K.H.L.; Konijnenbelt, M.; Janssen, T.W.J.; de Haan, A. Recovery of walking ability using a robotic device in subacute stroke patients: A randomized controlled study. Disabil. Rehabil. Assist. Technol. 2015, 10, 141–148. [Google Scholar] [CrossRef]
- Schwartz, I.; Sajin, A.; Fisher, I.; Neeb, M.; Shochina, M.; Katz-Leurer, M.; Meiner, Z. The effectiveness of locomotor therapy using robotic-assisted gait training in subacute stroke patients: A randomized controlled trial. PmR 2009, 1, 516–523. [Google Scholar] [CrossRef]
- Holden, M.K.; Gill, K.M.; Magliozzi, M.R.; Nathan, J.; Piehl-Baker, L. Clinical gait assessment in the neurologically impaired. Reliability and meaningfulness. Phys. Ther. 1984, 64, 35–40. [Google Scholar] [CrossRef]
- Lokomat. Hocoma. Available online: https://www.hocoma.com/solutions/lokomat/techincal-data-sheet/ (accessed on 10 July 2020).
- Krithikadatta, J. Normal distribution. J. Conserv. Dent. 2014, 17, 96–97. [Google Scholar] [CrossRef]
- liliestest. Mathworks. Available online: https://es.mathworks.com/help/stats/lillietest.html (accessed on 17 July 2020).
- Scheff, S.W. Chapter 8—Nonparametric statistics. In Fundamental Statistical Principles for the Neurobiologist; Scheff, S.W., Ed.; Academic Press: Lexington, KY, USA, 2016; pp. 157–182. [Google Scholar] [CrossRef] [Green Version]
- Signrank. Mathworks. Available online: https://www.mathworks.com/help/stats/signrank.html (accessed on 17 July 2020).
- O'Dwyer, N.J.; Ada, L.; Neilson, P.D. Spasticity and muscle contracture following stroke. Brain 1996, 119, 1737–1749. [Google Scholar] [CrossRef] [PubMed]
- Ju, M.S.; Chen, J.J.; Lee, H.M.; Lin, T.S.; Lin, C.C.; Huang, Y.Z. Time-course analysis of stretch reflexes in hemiparetic subjects using an on-line spasticity measurement system. J. Electromyogr. Kinesiol. 2000, 10, 1–14. [Google Scholar] [CrossRef]
- Jang, S.H.; Kim, D.H.; Kim, S.H.; Seo, J.P. The relation between the motor evoked potential and diffusion tensor tractography for the corticospinal tract in chronic hemiparetic patients with cerebral infarct. Somat. Mot. Res. 2017, 34, 134–138. [Google Scholar] [CrossRef] [PubMed]
- Lundström, E.; Smits, A.; Terént, A.; Borg, J. Time-course and determinants of spasticity during the first six months following first-ever stroke. J. Rehabil Med. 2010, 42, 296–301. [Google Scholar] [CrossRef] [Green Version]
- Chang, S.H.; Francisco, G.E.; Zhou, P.; Rymer, W.Z.; Li, S. Spasticity, weakness, force variability, and sustained spontaneous motor unit discharges of resting spastic-paretic biceps brachii muscles in chronic stroke. Muscle Nerve 2013, 48, 85–92. [Google Scholar] [CrossRef] [Green Version]
- Ward, N.S. Restoring brain function after stroke—Bridging the gap between animals and humans. Nat. Rev. Neurol. 2017, 13, 244–255. [Google Scholar] [CrossRef]
- Krakauer, J.W.; Carmichael, S.T.; Corbett, D.; Wittenberg, G.F. Getting neurorehabilitation right: What can be learned from animal models? Neurorehabil. Neural Repair 2012, 26, 923–931. [Google Scholar] [CrossRef] [Green Version]
- Zeiler, S.R.; Krakauer, J.W. The interaction between training and plasticity in the poststroke brain. Curr. Opin. Neurol. 2013, 26, 609–616. [Google Scholar] [CrossRef] [Green Version]


| ID 2 | Sex | Age (Yrs. 3) | Days Since Stroke | FAC 1 | Etiology and Imagines | Clinical Pictures | |
|---|---|---|---|---|---|---|---|
| At Basal Assessments (T0) | At One-Month Follow-Up (T1) | ||||||
| 1 | M 4 | 43 | 10 | 1 | 4 | Left temporo insular ischemia | Right hemiparesis and aphasia |
| 2 | M | 60 | 13 | 1 | 4 | Right thalamo capsular haemorragia | Left hemiparesis |
| 3 | M | 77 | 52 | 1 | 5 | Right thalamo capsular haemorragia | Left hemiparesis |
| 4 | M | 63 | 12 | 3 | 6 | Left corona radiata ischemia | Right hemiparesis |
| 5 | M | 70 | 23 | 1 | 2 | Left corona radiata ischemia | Right hemiparesis |
| 6 | M | 36 | 47 | 1 | 1 | Left thalamo capsular haemorragia | Right hemiparesis and aphasia |
| 7 | M | 54 | 51 | 1 | 2 | Left parieto occipital haemorragia | Right hemiparesis and aphasia |
| 8 | F 5 | 73 | 15 | 1 | 3 | Left parieto occipital haemorragia | Right hemiparesis |
| 9 | M | 61 | 60 | 3 | 6 | Left corona radiata ischemia | Right hemiparesis |
| 10 | F | 67 | 16 | 1 | 3 | Left corona radiata ischemia | Right hemiparesis and aphasia |
| L-STIFF ** (Nm/°) | p-Value * | ||||||||||||
|---|---|---|---|---|---|---|---|---|---|---|---|---|---|
| For Paretic Legs | For Non-paretic Legs | P1 1 | P2 2 | P3 3 | P4 4 | ||||||||
| At T0 | At T1 | At T0 | At T1 | ||||||||||
| Angular Velocity | Mean | SD | Mean | SD | Mean | SD | Mean | SD | |||||
| Hip Ext. 5 | 22.50°/s | 0.67 | ±0.26 | 0.57 | ±0.14 | 0.47 | ±0.20 | 0.45 | ±0.19 | <0.05 | ns | ns | ns |
| 45°/s | 0.67 | ±0.27 | 0.61 | ±0.17 | 0.48 | ±0.17 | 0.49 | ±0.11 | <0.01 | <0.05 | ns | ns | |
| 90°/s | 0.70 | ±0.27 | 0.66 | ±0.17 | 0.56 | ±0.22 | 0.54 | ±0.12 | <0.05 | ns | ns | ns | |
| Hip Flex. 6 | 22.50°/s | 0.62 | ±0.26 | 0.56 | ±0.13 | 0.46 | ±0.19 | 0.43 | ±0.19 | <0.05 | <0.05 | ns | ns |
| 45°/s | 0.60 | ±0.25 | 0.58 | ±0.18 | 0.41 | ±0.18 | 0.43 | ±0.11 | <0.01 | <0.05 | ns | ns | |
| 90°/s | 0.66 | ±0.25 | 0.63 | ±0.16 | 0.49 | ±0.19 | 0.51 | ±0.14 | <0.01 | <0.05 | ns | ns | |
| Knee Ext. | 30°/s | 0.30 | ±0.23 | 0.27 | ±0.12 | 0.20 | ±0.20 | 0.18 | ±0.10 | <0.05 | <0.05 | ns | ns |
| 60°/s | 0.31 | ±0.24 | 0.25 | ±0.12 | 0.19 | ±0.18 | 0.18 | ±0.10 | <0.01 | <0.05 | ns | ns | |
| 120°/s | 0.33 | ±0.24 | 0.30 | ±0.11 | 0.21 | ±0.17 | 0.22 | ±0.10 | <0.01 | <0.05 | ns | ns | |
| Knee Flex. | 30°/s | 0.30 | ±0.24 | 0.29 | ±0.17 | 0.21 | ±0.23 | 0.19 | ±0.11 | ns | <0.05 | ns | ns |
| 60°/s | 0.32 | ±0.23 | 0.27 | ±0.13 | 0.20 | ±0.20 | 0.19 | ±0.12 | <0.05 | <0.05 | ns | ns | |
| 120°/s | 0.34 | ±0.23 | 0.33 | ±0.14 | 0.23 | ±0.19 | 0.24 | ±0.10 | <0.05 | <0.01 | ns | ns | |
| L-FORCE ** (Nm) | p-Value * | |||||||||||
|---|---|---|---|---|---|---|---|---|---|---|---|---|
| For Paretic Legs | For Non-Paretic Legs | P1 1 | P2 2 | P3 3 | P4 4 | |||||||
| At T0 | At T1 | At T0 | At T1 | |||||||||
| Mean | SD | Mean | SD | Mean | SD | Mean | SD | |||||
| Hip Ext. 5 | 17.2 | ±15.85 | 24.5 | ±21.44 | 38 | ±23.94 | 50 | ±35.50 | <0.05 | <0.05 | ns | ns |
| Hip Flex. 6 | 28.6 | ±18.46 | 38.4 | ±21.22 | 50.9 | ±26.24 | 49.8 | ±19.45 | <0.01 | ns | <0.05 | ns |
| Knee Ext. | 13.1 | ±9.73 | 17.4 | ±12.76 | 37.4 | ±16.87 | 29.5 | ±16.77 | <0.01 | <0.05 | ns | ns |
| Knee Flex. | 12.6 | ±13.32 | 14.6 | ±12.43 | 36.9 | ±14.48 | 37.7 | ±17.42 | <0.01 | <0.01 | ns | ns |
| L-ROM ** (°) | p-Value * | |||||||||||
|---|---|---|---|---|---|---|---|---|---|---|---|---|
| For Paretic Legs | For Non-Paretic Legs | P1 1 | P2 2 | P3 3 | P4 4 | |||||||
| At T0 | At T1 | At T0 | At T1 | |||||||||
| Hip | 20.00 | ±13.90 | 26.10 | ±15.66 | 37.00 | ±10.19 | 40.90 | ±11.73 | <0.05 | <0.01 | <0.05 | ns |
| Knee | 19.00 | ±20.73 | 21.60 | ±19.94 | 58.20 | ±16.25 | 60.30 | ±18.43 | <0.01 | <0.01 | ns | ns |
© 2020 by the authors. Licensee MDPI, Basel, Switzerland. This article is an open access article distributed under the terms and conditions of the Creative Commons Attribution (CC BY) license (http://creativecommons.org/licenses/by/4.0/).
Share and Cite
Chaparro-Rico, B.D.M.; Cafolla, D.; Tortola, P.; Galardi, G. Assessing Stiffness, Joint Torque and ROM for Paretic and Non-Paretic Lower Limbs during the Subacute Phase of Stroke Using Lokomat Tools. Appl. Sci. 2020, 10, 6168. https://doi.org/10.3390/app10186168
Chaparro-Rico BDM, Cafolla D, Tortola P, Galardi G. Assessing Stiffness, Joint Torque and ROM for Paretic and Non-Paretic Lower Limbs during the Subacute Phase of Stroke Using Lokomat Tools. Applied Sciences. 2020; 10(18):6168. https://doi.org/10.3390/app10186168
Chicago/Turabian StyleChaparro-Rico, Betsy D. M., Daniele Cafolla, Paolo Tortola, and Giuseppe Galardi. 2020. "Assessing Stiffness, Joint Torque and ROM for Paretic and Non-Paretic Lower Limbs during the Subacute Phase of Stroke Using Lokomat Tools" Applied Sciences 10, no. 18: 6168. https://doi.org/10.3390/app10186168