Article

Effect of Sample Preparation Methods on the Prediction Performances of Near Infrared Reflectance Spectroscopy for Quality Traits of Fresh Yam (Dioscorea spp.)

by
Emmanuel Oladeji Alamu
1,2,*,
Michael Adesokan
2,
Asrat Asfaw
3 and
Busie Maziya-Dixon
2
1
Food and Nutrition Sciences Laboratory, International Institute of Tropical Agriculture (IITA), Southern Africa Hub, Chelstone, P.O. Box 310142 Lusaka, Zambia
2
Food and Nutrition Sciences Laboratory, International Institute of Tropical Agriculture (IITA), Oyo Road, Ibadan PMB 5320, Oyo State, Nigeria
3
Yam Breeding Unit, International Institute of Tropical Agriculture (IITA), Oyo Road, Ibadan PMB 5320, Oyo State, Nigeria
*
Author to whom correspondence should be addressed.
Appl. Sci. 2020, 10(17), 6035; https://doi.org/10.3390/app10176035
Submission received: 17 July 2020 / Revised: 13 August 2020 / Accepted: 18 August 2020 / Published: 31 August 2020
(This article belongs to the Special Issue Application of Spectroscopy in Food Analysis: Volume II)

Abstract

:

Featured application

The acceptability and consumption of yam varieties depend on the quality components. Rapid measurement of these components is crucial in yam breeding program and calls for the rapid techniques for yam quality determination. The NIRS application will be beneficial for detecting tuber quality attributes in the yam crop due to its rapid, cost-effective, and non-destructive features. Sample preparation is a prerequisite for the prediction of quality traits by NIRS and sometimes is a big challenge when large populations of breeding materials are to be evaluated. Thus, this study evaluated the effects of different sampling methods on the prediction performances of NIRS in determining selected quality characteristics of different fresh yam species.

Abstract

High throughput techniques for phenotyping quality traits in root and tuber crops are useful in breeding programs where thousands of genotypes are screened at the early stages. This study assessed the effects of sample preparation on the prediction accuracies of dry matter, protein, and starch content in fresh yam using Near-Infrared Reflectance Spectroscopy (NIRS). Fresh tubers of Dioscorea rotundata (D. rotundata) and Dioscorea alata (D. alata) were prepared using different sampling techniques—blending, chopping, and grating. Spectra of each sample and reference data were used to develop calibration models using Modified Partial Least Square (MPLS). The performance of the model developed from the blended yam samples was tested using a new set of yam samples (N = 50) by comparing their wet laboratory results with the predicted values from NIRS. Blended samples had the highest coefficient of prediction (R2 pre) for dry matter (0.95) and starch (0.83), though very low for protein (0.26), while grated samples had the lowest R2 pre of 0.87 for dry matter and 0.50 for starch. Results showed that blended samples gave a better prediction compared with other methods. The feasibility of NIRS for the prediction of dry matter and starch content in fresh yam was highlighted.

1. Introduction

Yam is a starch-rich staple food commonly grown in Africa, the Caribbean, the South Pacific, the Americas, and Asia. In West Africa, yam contributes over 200 dietary calories/day for more than 300 million people [1]. Statistics show that 97% of the 48.7 million tons of yam produced worldwide in 47 countries originate from sub-Saharan Africa, and Nigeria accounts for 68% of global production [2]. Also, yam has a better nutritional value than cassava. The vitamin C content ranges from 40 to 120 mg/g/edible portion; crude protein ranges from 4% to 14%, and starch from 70% to 80% on a dry weight basis [3]. It is an excellent source of carbohydrates, vitamins, protein, and essential amino acids such as arginine, leucine, isoleucine, and valine. It is a good source of complex carbohydrates that help to reduce the constant increase in blood sugar levels; hence it is categorised as a low glycemic index food. Fresh yam tubers also contain approximately 29% vitamin C, according to the USDA National Nutrient Database, and help to boost the immune system [4].
Yam is a key staple crop for smallholders in Africa. It is consumed in various forms depending on the processing approaches—boiling, drying, frying, milling, pounding, roasting, and steaming [5]. Furthermore, yam serves as a valuable source of farm employment and income in Africa, as well as being culturally relevant and involved in society in many life events. In Nigeria and neighbouring West African countries, yam plays an essential role during marriage and fertility ceremonies [6,7,8,9].
Quality components of yam cultivars are essential for their acceptability for cultivation and consumption. Traits such as starch and sugar content, the colour of tuber flesh, and oxidation are routinely measured by breeding programs because they influence the acceptability of new varieties [10,11]. The visual selection has been used by breeding programs in root and tuber crops to distinguish varieties; however, this approach to quality trait selection is quite challenging [12]. Conventional methods of assessing yam tuber quality traits are time-consuming, cost-intensive, and involve the use of hazardous chemicals. The conventional methods for quality assessment of yam include oven drying the fresh samples for 72 h and then ground dried sample to a fine flour (0.05 mm particle size) before chemical analysis, which will, in turn, take some time. However, analysing the samples freshly using NIRS eliminates the time required for drying and grinding in the conventional method. Therefore, techniques to generate data quickly on tuber quality assessment will be of great significance in yam improvement programs. Near-infrared spectroscopy (NIRS) is among the high throughput techniques for the speedy diagnosis of quality traits of yam tubers. The principle of NIRS is based on the interaction of different chemical groups such as C-H, O-H, and N-H in a sample with electromagnetic radiation at a specific wavelength. Near-Infrared spectra comprise broad bands of overlapping absorptions and combinations of vibrational modes involving chemical bonds within the wavelength range of 780 to 2500 nm [13]. Models of NIRS have been developed for the rapid characterisation of essential quality traits in various Dioscorea spp. [12,14,15] and have been successfully applied in many crops, including potato, cassava, and sweet potato [16,17,18,19]. Quantification of dry matter and protein in yam bean using NIRS was reported with an excellent prediction performance of 0.94 and a SEP of 1.2 [20]. This technology could be a useful tool in the breeding of improved yam varieties where thousands of accessions are maintained. Traits such as the physicochemical characteristics of the tubers are vital because they allow the identification of parents as well as the screening of generated progenies with suitable tuber quality.
Due to its rapid, cost-effective, and non-destructive features, the NIRS application will be beneficial for detecting tuber quality attributes in the yam crop. Sample preparation is a prerequisite for the prediction of quality traits by NIRS and sometimes is a big challenge when large populations of breeding materials are to be evaluated. The effects of sample preparations on the prediction performances of NIRS have been reported on other materials such as livestock slurry and forages [21,22,23]. Few, if any, research studies have examined the effects of different sampling techniques on the application of NIRS for nutritional traits in yam. The current study has evaluated different methods of sample preparation for the feasibility of using NIRS as an alternative to wet chemical analysis for the prediction of quality parameters in fresh yam tubers.

2. Materials and Methods

2.1. Sample, Sampling, and Sample Preparation

Two hundred clones representing accessions of D. rotundata and D. alata, grown at two locations (Ibadan and Ubiaja), were used for this study. The samples, 200 of each variety, were split randomly into two sets: calibration and validation. The calibration set consisted of 150 clones, while the cross-validation set contained 50 clones. Each clone was represented by three tubers (big, medium, and small sizes). The sampling protocol reported by Alamu et al. [14] was adopted for sample preparation and homogenisation. The sampled tubers were washed, air-dried, and peeled. Each peeled root was washed, dried with soft tissue, and cut into four portions longitudinally from the proximal to the distal end. Two opposite parts from each tuber were cut into smaller pieces, then pooled and mixed manually.
Samples were prepared using three different methods: chopping, grating, and blending (Figure 1).
  • A portion of the cut pieces was subsampled as chopped, further reduced using a knife, and packed into an adequately labelled sample bag.
  • The grated sample was prepared by using a 2 mm size grater to reduce the yam to shreds that were then packed into a labelled sample bag.
  • The blended sample was made by first decreasing the sizes of the cut pieces, then blending them using an electric blender.
Subsequently, subsamples were taken from the prepared samples for wet chemical analysis for dry matter, starch, and protein. These were all carried out to generate reference data to be used in the development of the calibration.

2.2. Collection of Spectral Data

Samples were prepared and homogenised, thoroughly mixed, and loaded into the sample compartment of the Benchtop NIRS equipment (FOSS XDS, Rapid Content Analyzer) with the use of the sample quartz cell. Spectral data for all samples were collected in duplicate by measuring the diffuse reflectance from the sample in the NIR region within 400‒2498 nm using a NIRS monochromator and a continuous moving cell. The reflectance spectra were collected continuously over a NIR wavelength region with each spectrum represented as absorbance value logs (1/R) at 0.5 nm increments (see Plate 1). The collection of spectra was done with the ISI Scan software, and an average of 60 scans/samples were taken within 60 s. Spectral data were exported to Win ISI software (version 4.9.0) for pre-treatment and subsequent development of the calibration model.

2.3. Spectral Data Pre-Treatment

There are many uncontrollable physical variations, such as the non-homogeneous distribution of the particles, changes in the refractive index, and particle size distribution, that make samples exhibit differences in spectral information during measurement. These also cause light scattering effects and then result in additive or multiplicative effects that are not related to the chemical response and lead to inaccurate results. Thus, to address these effects, the spectra for each sample set were subjected to pre-treatment to minimise background noise (Figure 2). The pre-treatment used standard variate normalisation (SNV), the first derivation was calculated using a Savitzky-Golay filter with a first-order polynomial and a 15-point window smoothing (order 1, windows 15 points), followed by linear detrending as reported by Soldado et al. [24].

2.4. Calibration Model Development

The selected 200 samples were used to construct the near-infrared spectra models with the Win ISI 4 Project Manager, and the modified partial least squares (MPLS) regression and cross-validation techniques were used to calculate the correlation between spectral data and laboratory reference values. The performance of the spectrophotometer and the wavelength stability was checked before the collection of spectra using system diagnostics performance testing tools. MPLS calibration was performed on the calibration data set (N = 100) for each sample presentation, i.e., chopped, blended, and grated, using the Win ISI software within the wavelength of 400–2498 nm.
Cross-validation was conducted on 50 samples randomly selected, which were not part of the calibration set, and were used to optimise the PLS equations for each trait and to choose the number of latent variables that lead to the lower standard validation error (SECV). SECV is considered the best statistical tool to assess the robustness of a calibration model. The t-outliers were set at “t > 2.0” and GH-outliers, which indicates the Mahalanobis distance limit was set at “G > 4.0”. There were two passes for outlier elimination, and samples with t > 2.0 were dropped from the calibration file. The statistical parameters for the calibration models (the coefficient of determination for cross-validation (R2pre), the standard error of calibration (SEC), the standard error of cross-validation (SECV), and the standard deviation) are presented in Figure 2, Figure 3 and Figure 4. The ratio of prediction to deviation (RPD), which shows the correlations between the standard deviation of reference analysis and the predicted data, is also presented.

2.5. Reference Analysis

2.5.1. Determination of Dry Matter

The dry matter content of fresh samples was determined using the approved method 925.09 of the Association of Official Analytical Chemists [25]. Ten grams of the fresh sample was weighed in a pre-weighed aluminium dry matter can and placed in an Air Convectional Oven (Memmert UN 55, GmbH) for 16 h at 105 °C until constant weighed was attained.

2.5.2. Determination of Crude Protein

Crude protein was determined using Kjeltec Model 2300 following procedures described in the FOSS Manual [26], the operational guide for the equipment. Samples were digested at a temperature of 420 °C for 1 h to convert the organically bound nitrogen to ammonium sulphate. The ammonia in the digest (ammonium sulphate) was then distilled into a boric acid receiver solution. The solution was titrated with standard hydrochloric acid to obtain the total nitrogen content. The percentage of crude protein was derived using a conversion factor of 6.25.

2.5.3. Determination of Starch Content
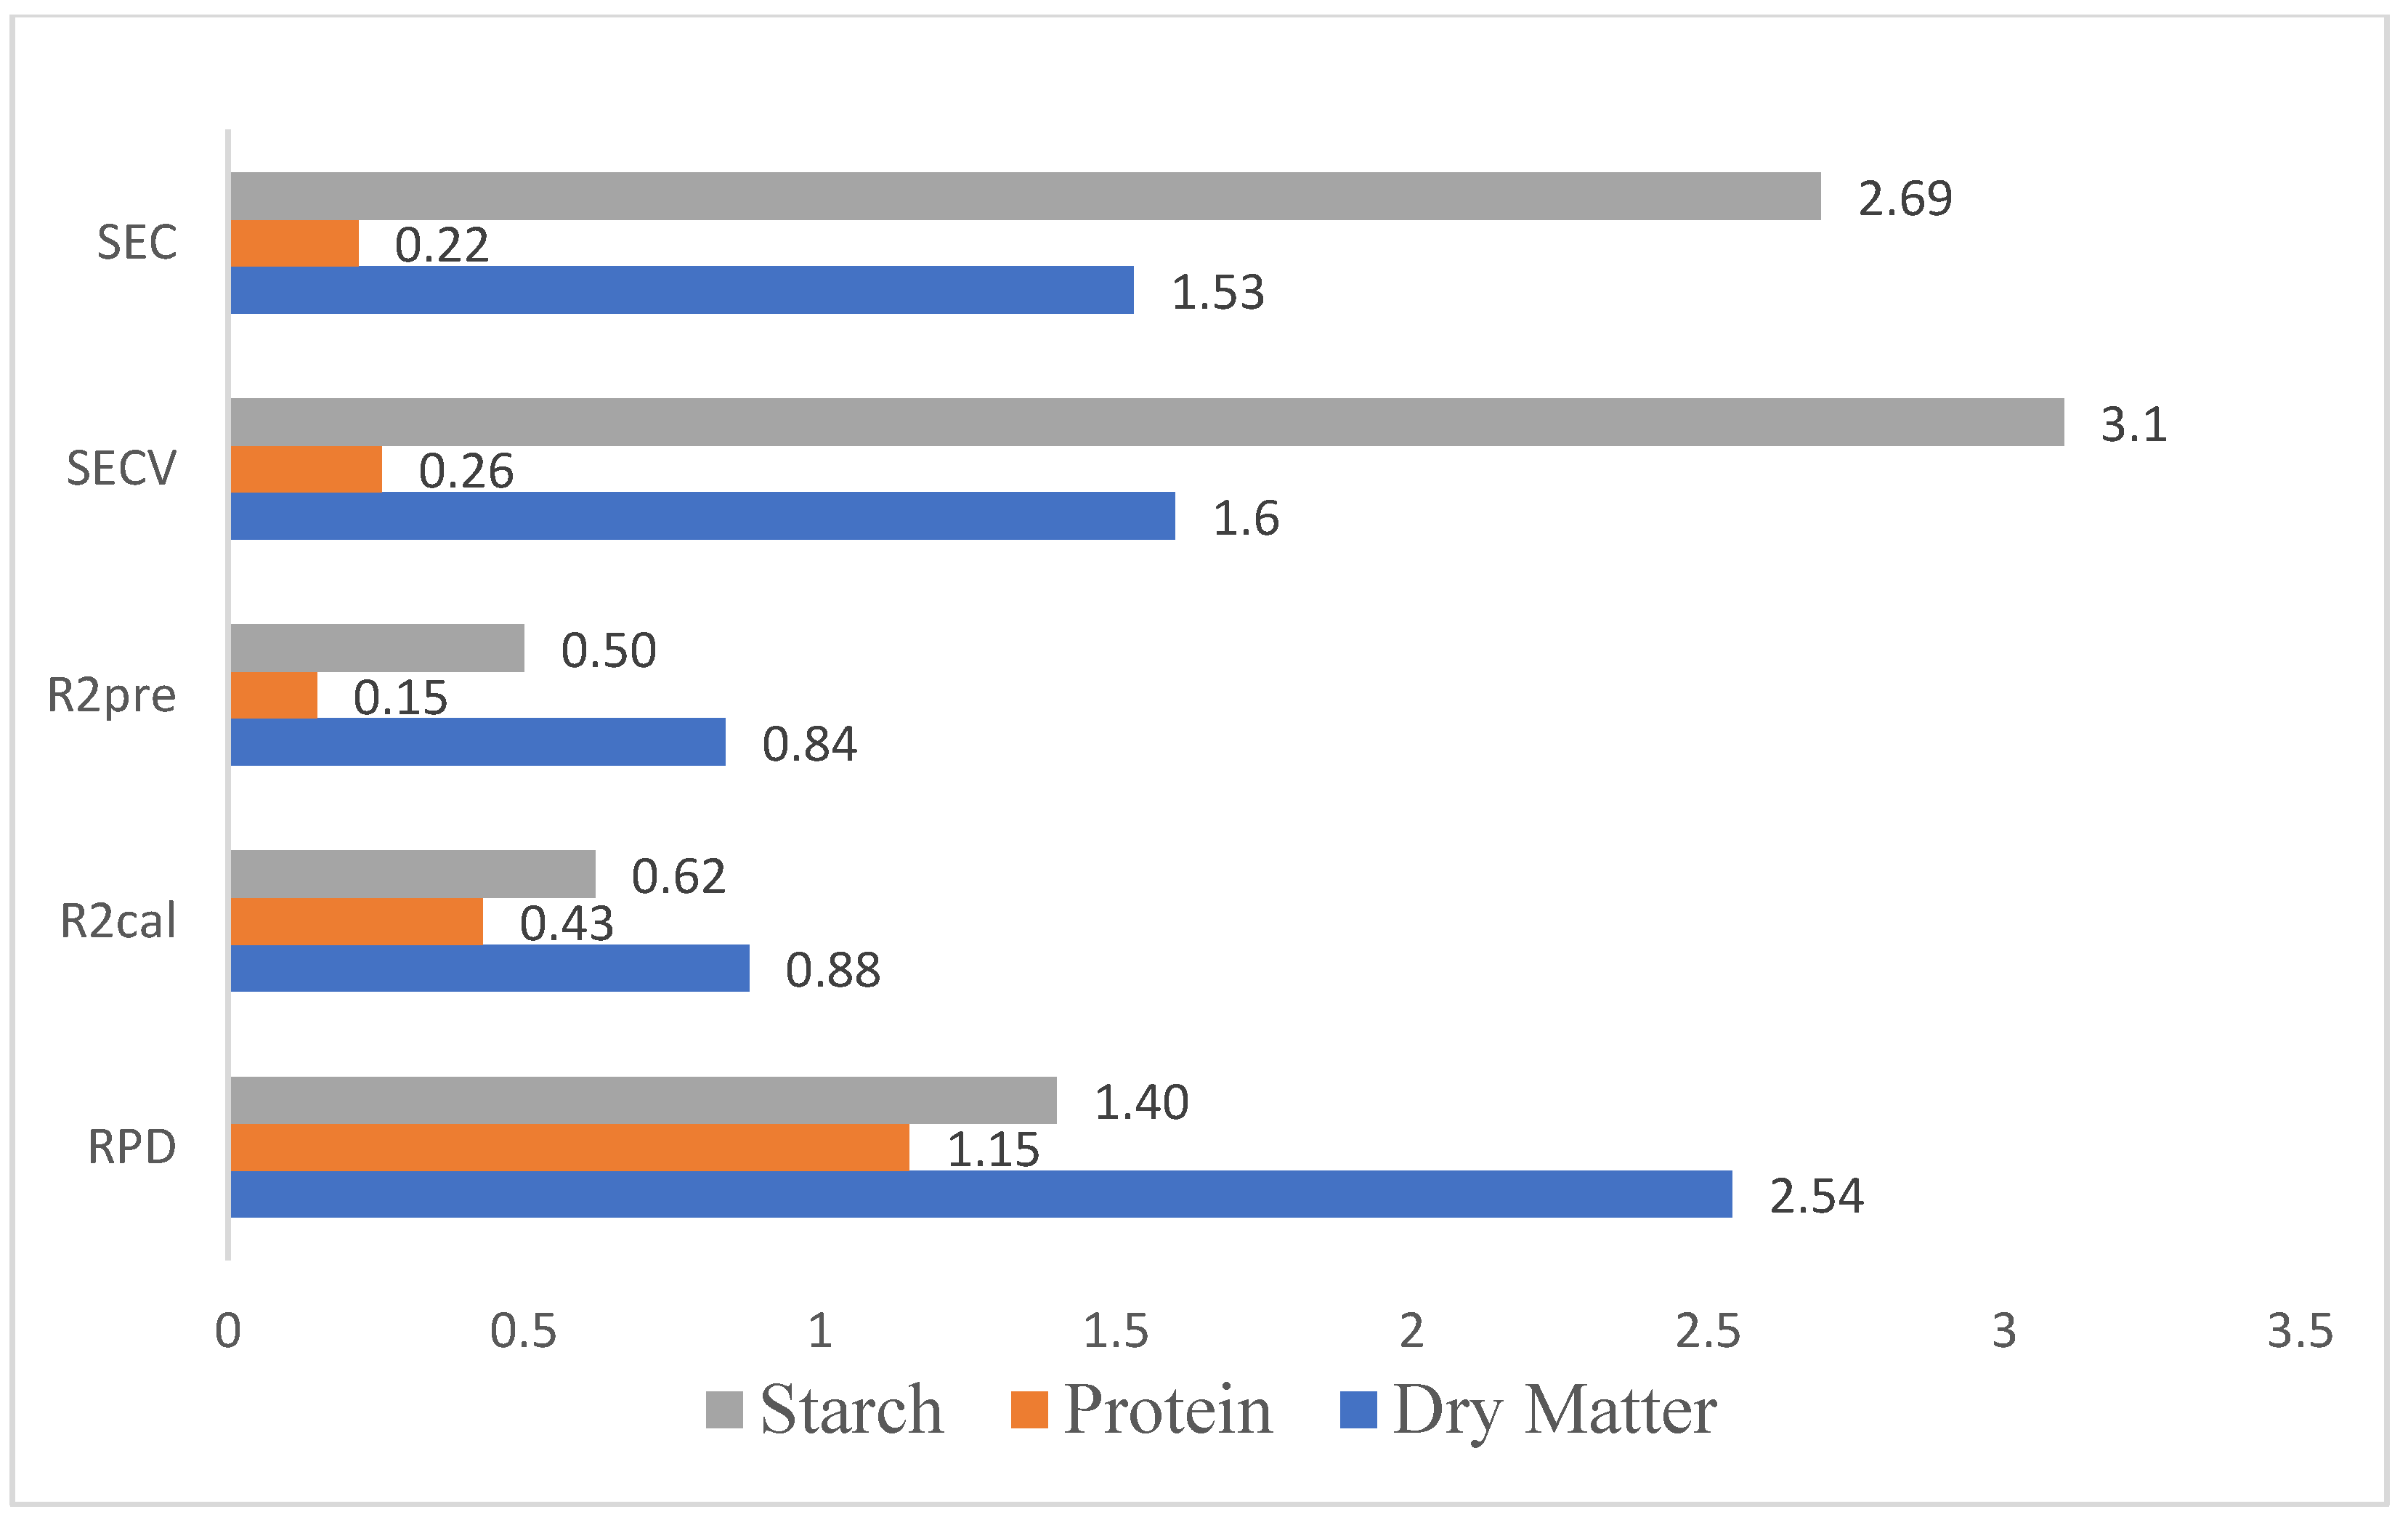
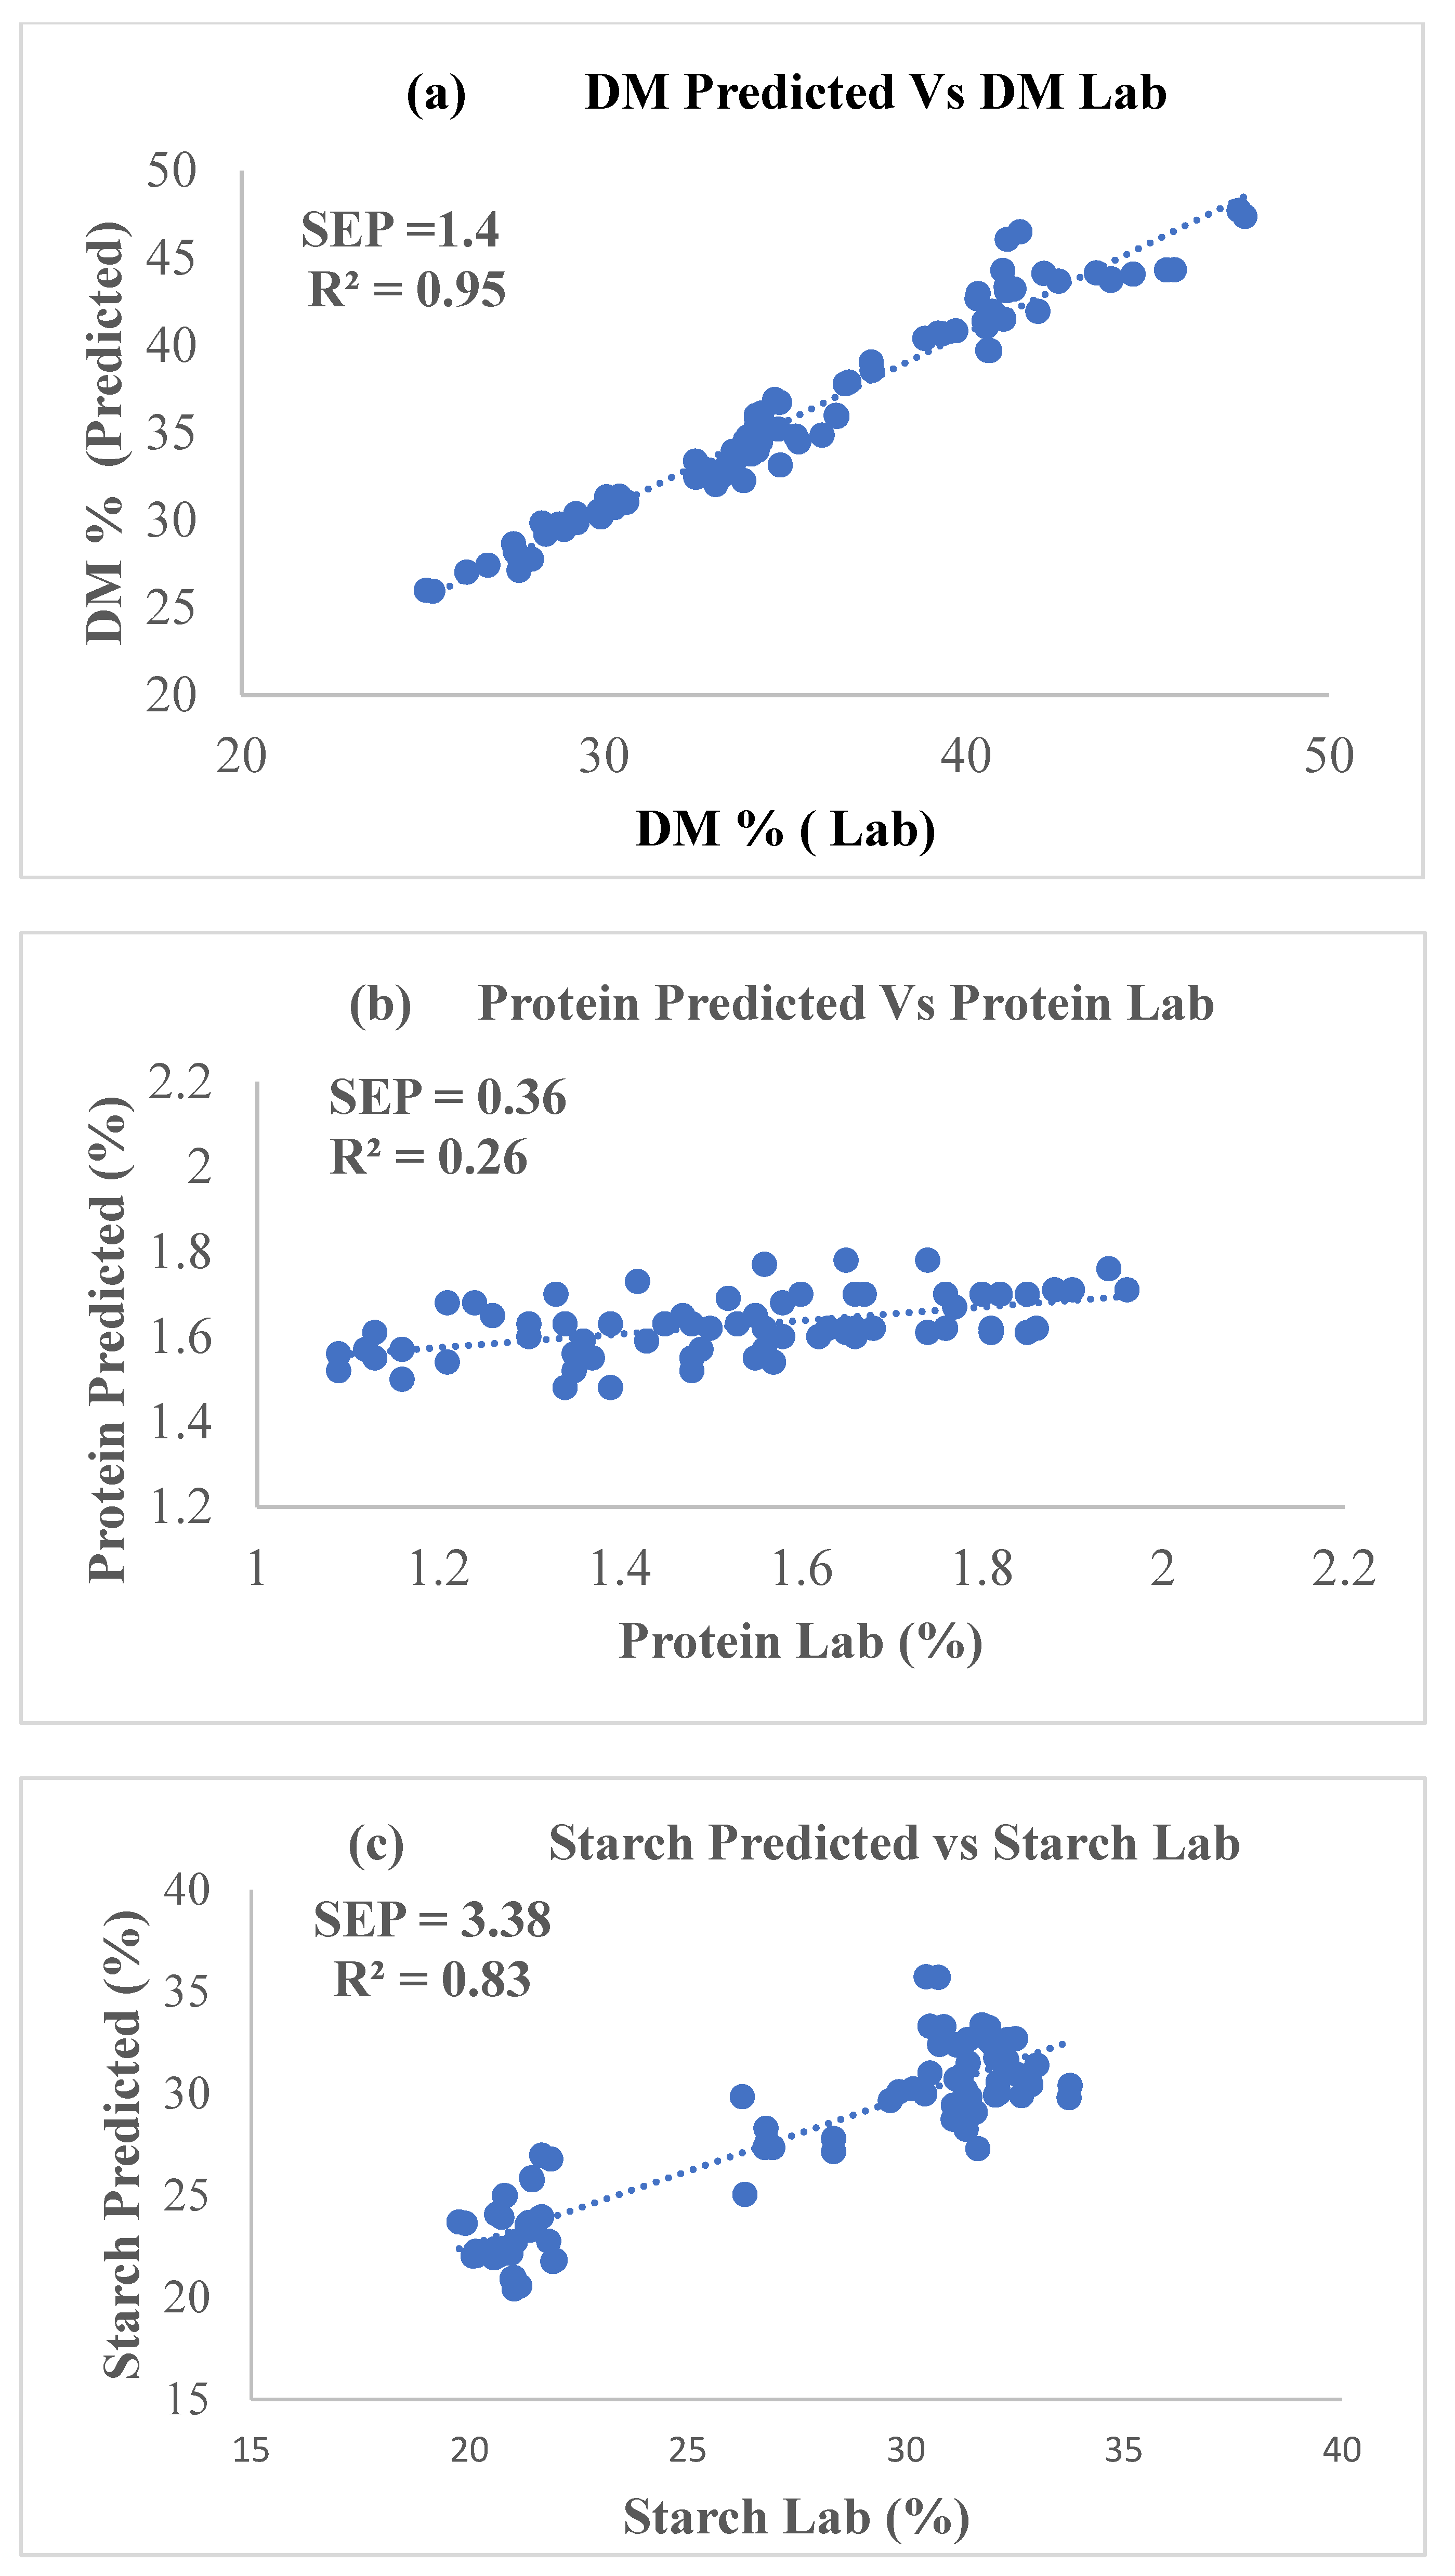
A colourimetric method, earlier described by Onitilo et al. [27], was used to determine the starch content as 0.02 g of the sample was weighed into a clean centrifuge tube and 1 mL ethanol, 2 mL distilled water, and 10 mL boiling ethanol were added. The mixture was vortexed and centrifuged at 2000 rpm for 10 min. The residue was hydrolysed with perchloric acid to determine starch content, and the supernatant was used to estimate sugar. The phenol-sulphuric acid reagent was used for colour development, glucose standard was used to develop a calibration curve for quantification, and absorbance was read using a Genesys 101S UV-Vis Spectrophotometer at a wavelength of 490 nm.

3. Results

Table 1 presents the wet chemistry results of dry matter, protein, and starch content in fresh tuber samples of white Guinea yam (D. rotundata). There was a significant effect (p < 0.05) of method and location on the starch content of D. rotundata, but only location effect (p > 0.05) on dry matter and protein. The average content of dry matter, protein, and starch (%) from the Ibadan location were 36.5 ± 4.24, 1.58 ± 0.36, and 28.75 ± 3.96 in chopped samples; 36.60 ± 4.18, 1.62 ± 0.34, and 27.47 ± 3.84 in grated samples; and 37.14 ± 4.87, 1.60 ± 0.33, and 26.97 ± 3.88 in blended samples, respectively. For tubers collected from the Ubiaja location, the average dry matter content was found as 37.98 ± 6.06, protein 1.69 ± 0.45, and starch 30.97 ± 1.90 in chopped samples. Likewise, the average dry matter content was 38.17 ± 5.19 (grated) and 38.75 ± 5.49% (blended), protein 1.69 ± 0.53 (grated) and 1.84 ± 0.37 (blended), and starch 31.35 ± 1.57 (grated) and 31.49 ± 1.57 (blended).
Table 2 describes the dry matter, protein and starch contents of D. alata. There was a significant effect (p < 0.05) of method and location on the starch content of D. alata, but only location effect (p > 0.05) on dry matter and protein. The average dry matter, protein, and starch for the Ibadan location had a range (mean ± SD) for an average dry matter of 20.61%–44.86% (29.99 ± 4.52%); for the protein of 0.68%–3.11% (1.52 ± 0.33%), and starch of 19.25%–36.93% (21.59 ± 1.68%) for chopped samples. Blended samples had an average of 21.38 ± 1.70% for starch, 1.51 ± 0.31% for protein, and 31.14 ± 5.17% for dry matter. The estimation of starch was, on average, 21.38 ± 1.70% with blended tubers and 21.69 ± 1.79% with grated yam. The protein content of samples was estimated with an average of 1.51 ± 0.31% when blended and 1.58 ± 0.27% when grated. Likewise, the dry matter (%) was estimated as 31.14 ± 5.17 in blended samples and as 30.86 ± 4.25 in grated fresh tuber samples. Also, in the Ubiaja location, the average content of dry matter (%) in chopped tubers was 32.45 ± 4.95, starch 28.41 ± 2.31, and protein 1.64 ± 0.51. Grated samples contained 27.93 ± 2.78% starch, 32.04 ± 4.35% dry matter, and 1.74 ± 43% protein. Blended tubers had values that ranged from 20.18% to 35.48% starch, 22.30% to 47.69% dry matter, and 0.83% to 4.84% protein.
Figure 2, Figure 3 and Figure 4 indicate the parameters for the developed calibration models for dry matter, protein, and starch content of fresh yam using different sample presentations methods (chopping, grating, and blending).

4. Discussion

The sample preparation methods had non-significant differences (p < 0.05) in the predicted content of dry matter and protein in the fresh yam tubers. However, methods and locations had significant effects (p < 0.05) on the starch content for D. rotundata and D.alata (Table 1 and Table 2). Therefore, any of the sampling protocols could be used for dry matter and protein determination, but analysis of starch content is method dependent. The yam tuber from Ubiaja had an average protein content (%) ranging from 1.04 to 2.79 with mean 1.84 ± 0.37 for the blended samples, and this was significantly different (p < 0.05) from results with chopped and grated samples. The average protein content from the blended yam samples in the present studies agrees with the findings of Polycarp et al. [28] where the average protein content ranged from 4% to 6% by dry weight. The starch content varied significantly among samples from the three sampling procedures (p < 0.05). The highest starch content was obtained from blended samples with an average value of 29.93 ± 3.88%, which is about 72.62% on a dry weight (dw) basis; the content in chopped samples with an average of 28.75 ± 3.96% (78.62% dw) was higher than that in grated samples with a mean value of 27.47 ± 3.84% (75.05% dw) from Ibadan (Table 1). This could be because of variations in the particle size of the samples from different sampling methods. Starch content for D. rotundata (Table 1) reported in this study is consistent with average values reported in the literature [29,30,31]. Similarly, the average starch content of chopped D.alata, 28.41 ± 2.31 from Ubiaja (Table 2), was higher when compared with values obtained for samples that were grated (27.93 ± 2.78) and blended (23.32 ± 2.32).

4.1. NIRS Calibration

A calibration model was developed for dry matter, starch, and protein with the laboratory analysis data obtained using standard wet chemistry methods and the near-infrared spectra of the samples. The coefficient of prediction (R2pre) was used to evaluate the performances of the models; this indicates the percentage variation in spectra data that is accounted for by the chemical constituents of the samples and other statistical variables such as SEC, SECV, RPD, and SEP. The standard error of calibration is SEC, while SECV is the standard error of cross-validation; the ratio of performance to deviation (RPD = SD/SECV) was also used for performance evaluation. For fresh chopped samples, R2pre of 0.78% for starch, 0.61% for dry matter, and 0.04% for protein were obtained. Grated samples had R2pre of 0.15% for starch, 0.84% for dry matter, and 0.50% for protein, while samples presented as blended had an excellent prediction performance for dry matter (R2pre = 0.95%), and R2pre of 0.83% for starch, and a very poor R2pre of 0.26% for protein (Figure 2, Figure 3 and Figure 4).

4.2. Prediction Performance of the Developed NIRS Calibration Models

The performance of the model developed from the blended yam samples was tested using a new set of yam samples (N = 50) by comparing their wet laboratory results with the predicted values from NIRS. Figure 5a,c describes the determination coefficient (R2) for dry matter (0.95), protein (0.26), and starch (0.83) respectively. The SEP of 1.4 for dry matter (DM) with R2 of 0.95 indicates the excellent performance of the model for dry matter prediction. R2 of 0.83 for starch is also adequate for screening selection. However, the R2 of 0.26 for protein might be considered too low, but the SEC (0.26), SECV (0.27), and SEP (0.36) values were closed (Figure 5b). It implies that though a model may have a poor R2 value, with closed SEC, SECV, and SEP, the model could be used and improved. The prediction of starch content also showed that the equation is suitable for screening purposes with R2 of 0.80 and SEP of 3.38. However, the SEC (2.2) and SECV (2.10) for starch for the blended samples are similar, indicating the robustness of the model.
In general, models with R2 of 0.66 to 0.81 can be used for screening purposes. In contrast, models with R2 of 0.83 to 0.90 are suitable for many applications, and R2 of 0.92 to 0.96 is ideal for most applications, including quality control [32]. Therefore, R2 of 0.95 for dry matter and 0.83 for starch in blended samples (as shown in Figure 5a,c) make this form of sample preparation most suitable for the rapid prediction of these traits, though not good for protein prediction. Screening stages of breeding can also adopt chopped samples for the determination of starch with R2cal of 0.84 and dry matter with R2cal of 0.64 (Figure 2), though there was a poor R2 for protein (R2 = 0.04). Grated samples had an equally good R2 of 0.88 for dry matter and R2 of 0.62 for starch content, but low R2 of 0.43 for protein content (Figure 4). Figure 4 shows the SEC (1.94) and SECV (1.88) for the dry matter of the blended samples. Blended yam samples had a high RPD value of 2.93 for dry matter, 2.16 for starch, and a low RPD of 1.03 for protein (Figure 3). RPD values below 1.5 are considered not usable, although those between 2.0 and 3.0 are suitable for screening purposes, and values above 2.5 and 3.0 are excellent for quantitative predictions [33,34].

5. Conclusions

The results of the study demonstrate the potential of NIRS for the rapid prediction of dry matter, protein, and starch content of fresh yam samples, which eliminates the tedious, costly, and time-consuming processes of wet chemical analysis. The statistics of model performances showed an excellent coefficient of prediction (R2 pre) and a low standard error of prediction (SECV) for dry matter and starch. The highest R2pre for starch and dry matter was found in blended samples, then in chopped samples. Grated samples had the lowest R2pre for most of the traits; this confirms that blended or chopped fresh yam tubers could result in an accurate prediction for dry matter and starch content using NIRS. However, protein had weak predictions across the three methods of sample presentation with very low R2pre. The successful analysis of fresh tuber crops with NIRS would significantly improve the output of the breeding program by eliminating the tedious sample and sampling preparation processes that involve long hours of oven drying and milling. The sample preparation serves as a rate-limiting step when analysing a larger sample population for the characterisation of biophysical traits.

Author Contributions

The contributions of the authors are provided below. Conceptualisation, E.O.A. and M.A.; methodology, E.O.A. and M.A.; writing—original draft preparation; E.O.A. and M.A.; writing—review and editing: E.O.A., B.M.-D., A.A.; supervision: B.M.-D.; fund acquisition: B.M.-D. All authors have read and agreed to the published version of the manuscript.

Funding

The project was funded by the Bill and Melinda Gates Foundation (BMGF) with subgrant agreement number RTBF-SGA-2018-IIAT between CIRAD and IITA under the BMGF Grant agreement Investment ID OPP1178942.

Acknowledgments

The authors acknowledge the support of the RTBfoods project (funded by BMGF); the CGIAR Research Program on Roots, Tubers, and Bananas (RTB); and the staff of the IITA Yam Breeding Unit and Food and Nutrition Sciences Laboratory.

Conflicts of Interest

The authors declare no competing interests.

References

  1. Darkwa, K.; Olasanmi, B.; Asiedu, R.; Asfaw, A. Review of empirical and emerging breeding methods and tools for Yam (Dioscorea spp.) improvement: Status and prospects. Plant Breed. 2020, 3, 474–497. [Google Scholar] [CrossRef] [Green Version]
  2. FAO. FAOSTAT Database. 2018. Available online: http://bit.ly/NmQzZf (accessed on 30 November 2018).
  3. Baah, F.D.; Busie, M.D.; Asiedu, R.; Ibok, O. Physicochemical and pasting characterisation of water yam (Dioscorea spp.) and relationship with eating quality of pounded yam. J. Food Agric. Environ. 2009, 7, 107–111. [Google Scholar]
  4. USDA. National Nutrient Database for Standard Reference. Release 28 9 Slightly Revised. Available online: http://www.ars.usda.gov/ba/bhnrc/ndl (accessed on 5 November 2019).
  5. Odeku, O.A. Potentials of tropical starches as pharmaceutical excipients: A review. Starch-Stärke. 2013, 65, 89–106. [Google Scholar] [CrossRef]
  6. IITA Healthy Yam Seed Production. 2013. IITA Publications. Available online: https://iita.org (accessed on 12 December 2019).
  7. Izekor, O.B.; Olumese, M.I. Determinants of yam production and profitability in Edo State, Nigeria. Afr. J. Gen. Agric. 2010, 6, 205–221. [Google Scholar]
  8. Bamire, A.S.; Amujoyegbe, B.J. Economic analysis of Land improvement techniques in smallholder Yam-Based Production systems in the Agro-Ecological Zones of South Western, Nigeria. J. Hum. Ecol. 2005, 18, 1–12. [Google Scholar] [CrossRef]
  9. Aidoo, R. An Analysis of Yam Consumption Patterns in Ghanaian Urban Communities. Ph.D. Thesis, Department of Agricultural Economics, Agribusiness and Extension, Kwame Nkrumah University of Science & Technology, Kumasi, Ghana, 2009. [Google Scholar]
  10. De Koeyer, D.; Lopez-Montes, A.; Amele, A.; Bhattacharjee, R.; Abberton, M.; Maziya-Dixon, B.; Asiedu, R. Africa Yam—A Project to Strengthen Yam Breeding in West Africa. Available online: http://www.gcp21.org/wcrtc/abstracts/S13/S1304.DeKoeyerDavid.4214.3280 (accessed on 12 December 2019).
  11. Arnau, G.; Maledon, E.; Nudol, E.; Marie-Claire, G. Progress and challenges in the genetic improvement of Yam (Dioscorea alata L.). In Proceedings of the World Congress on Root and Tuber Crops (WCRTC 2016), Nanning, China, 18–22 January 2020; p. 1. Available online: http://www.gcp21.org/wcrtc/S13.html (accessed on 14 February 2020).
  12. Ehounou, A.E.; Cormier, F.; Cornet, D.; Maledon, E.; Desfontaines, L.; Marie-Magdeleine, C.; Arnau, G. Development of NIRS and molecular marker to improve breeding efficiency in Greater Yam (Dioscorea alata L.) for key quality traits. In Proceedings of the International Conference on Applied Biochemistry and Biotechnology (ABB 2019), Macau, China, 21–24 July 2019; Available online: https://agritrop.cirad.fr/593382/ (accessed on 5 February 2020).
  13. Brian, G.O. Near-infrared Spectroscopy in Food Analysis. In Encyclopedia of Analytical Chemistry; Australia John Wiley & Sons, Ltd.: Hoboken, NJ, USA, 2006. [Google Scholar] [CrossRef]
  14. Alamu, E.O.; Adesokan, M.D.; Maziya-Dixon, B.M. Calibration development for nutritional evaluation of Yam (Dioscorea sp.) using Near-Infrared Reflectance Spectrophotometry (NIRS). Cogent Chem. 2019, 5, 1565623. [Google Scholar] [CrossRef]
  15. Lebot, V.; Malapa, R.; Jung, M. Use of NIRS for the rapid prediction of total N, minerals, sugars, and starch in tropical root and tuber crops. N. Z. J. Crop. Hortic. Sci. 2013, 41, 144–153. [Google Scholar] [CrossRef] [Green Version]
  16. Guo-quan, L.; Hua, H.H.; Dapeng, Z. Application of near infrared spectroscopy to predict sweet potato starch thermal properties and noodle quality. J. Zhejiang Univ. Sci. B 2006, 7, 475–481. [Google Scholar] [CrossRef] [Green Version]
  17. Huang, Y.; Xu, F.; Hu, H.; Dai, X.; Zhang, H. Development of a predictive model to determine potato flour content in potato-wheat blended powders using near-infrared spectroscopy. Int. J. Food Prop. 2018, 21, 2030–2036. [Google Scholar] [CrossRef] [Green Version]
  18. Ikeogu, U.N.; Davrieux, F.; Dufour, D.; Ceballos, H.; Egesi, C.N.; Jannink, J.L. Rapid analyses of dry matter content and carotenoids in fresh cassava roots using a portable visible and near-infrared spectrometer, (Vis/NIRS). PLoS ONE 2017, 12, e0188918. [Google Scholar] [CrossRef]
  19. Belalcazar, J.; Dufour, D.; Andersson, M.S.; Pizarro, M.M.; Luna, J.; Londoño, L. High-throughput phenotyping and improvements in breeding cassava for increased carotenoids in the roots. Crop. Sci. 2016, 56, 2916–2925. [Google Scholar] [CrossRef] [Green Version]
  20. Leonardo, V.; Wolfgang, J.G. Analysis of dry matter and protein contents in fresh yam bean tubers by near-infrared reflectance spectroscopy. Soil Sci. Plant Anal. 1999, 30, 1797–1805. [Google Scholar] [CrossRef]
  21. Alomar, D.; Fuchslocher, R.; de Parblo, M. Effects of preparation on composition and NIR spectra of forage samples. Anim. Feed Sci. Technol. 2003, 107, 19–200. [Google Scholar] [CrossRef]
  22. Finzi, A.; Oberti, R.; Negri, A.S.; Perazzolo, F.; Cocolo, G.; Tambone, F.; Cabassi, G.; Provolo, G. Effects of measurement technique and sample preparations on NIR spectroscopy analysis of livestock slurry and digestates. Biosyst. Eng. 2015, 134, 43–54. [Google Scholar] [CrossRef]
  23. Daniel, A.; Rita, F.; Marjorie, D.P. Effect of preparation method on composition and NIR spectra of forages. Anim. Feed Sci. Technol. 2003, 107, 191–200. [Google Scholar] [CrossRef]
  24. Soldado, A.; Fearn, T.; Martinez-Fernan’ dez, A.; de la Roza-Delgado, B. The transfer of NIR calibrations for undried grass silage from the laboratory to on-site instruments: Comparison of two approaches. Talanta 2013, 105, 8–14. [Google Scholar] [CrossRef]
  25. AOAC. Methods of the association of official analytical chemists. In Official Methods of Analysis, 15th ed.; Virginia Association of Official Analytical Chemistry: Rockville, MD, USA, 1990; p. 1141. [Google Scholar]
  26. FOSS. Manual for Kjeltec System 8400 Distilling and Titration Unit; FOSS: Hilleroed, Denmark; Slangerupgade, Denmark, 2003. [Google Scholar]
  27. Onitilo, M.O.; Sanni, L.; Daniel, I.; Maziya-Dixon, B.; Dixon, A. Physicochemical and functional properties of native starches from cassava varieties in southwest Nigeria. J. Food Agric. Environ. 2007, 5, 10. [Google Scholar]
  28. Knoth, J. Traditional Storage of Yams and Cassava and Its Improvement; TZ-Verlag, Rossdorf: Hamburg, Germany, 1993; p. 116. [Google Scholar]
  29. Polycarp, D.; Afokwa, E.O.; Budu, A.S.; Otoo, E. Characterization of chemical composition and anti-nutritional factors in seven species within the Ghanaian Yam (Dioscorea) germplasm. Int. Food Res. J. 2012, 19, 985–992. [Google Scholar]
  30. Alamu, E.O.; Maziya-Dixon, B.; Okonkwo, O.; Asiedu, R. Physicochemical and bioactive properties of selected white Yam (Dioscorea rotundata) varieties adapted to the riverine area of Nigeria. Afr. J. Food Sci. 2014, 8, 402–409. [Google Scholar] [CrossRef]
  31. Bolanle, O.; Asiedu, R.; Mpoko, B. Effects of Storage on the chemical composition of food quality of Yam. J. Food Process. Preserv. 2012, 3695, 438–445. [Google Scholar] [CrossRef]
  32. Mulualem, T.; Mekbib, F.; Hussein, S.; Gebre, E. Analysis of Biochemical Composition of Yams (Dioscorea spp.) Landraces from Southwest Ethiopia. Agrotechnology 2018, 7, 177. [Google Scholar] [CrossRef]
  33. Lebot, V.; Kuttolamadathil, A.; Kaoh, J.; Rogers, C.; Molisale, T. Development of anthracnose resistant hybrids of the Greater Yam (Dioscorea alata L.) and interspecific hybrids with Dischidia nummularia Lam. Genet. Resour. Crop Evol. 2019, 66, 871–883. [Google Scholar] [CrossRef]
  34. Davrieux, F.; Dufour, D.; Dardenne, P.; Belalcazar, J.; Pizarro, M.; Luna, J. Local regression algorithm improves near-infrared spectroscopy predictions when the target constituent evolves in breeding populations. J. Near Infrared Spectrosc. 2016, 24, 109–111. [Google Scholar] [CrossRef]
Figure 1. Workflow for sample preparation protocols for fresh yam (chopping, grating, and blending).
Applsci 10 06035 g001
Figure 2. NIRS calibration and validation statistics for chopped fresh yam tubers. SEC: standard error of calibration; RPD: the ratio of performance to deviation; SECV: standard error in cross-validation; R2Cal: the determination coefficient for calibration; R2pre: the determination coefficient for prediction.
Applsci 10 06035 g002
Figure 3. NIRS calibration and validation statistics for blended fresh yam tubers. SEC: standard error of calibration; RPD: the ratio of performance to deviation; SECV: standard error in cross-validation; R2Cal: the determination coefficient for calibration; R2pre: the determination coefficient for prediction.
Applsci 10 06035 g003
Figure 4. NIRS calibration and validation statistics for grated fresh yam tubers. SEC: standard error of calibration; RPD: the ratio of performance to deviation; SECV: standard error in cross-validation; R2Cal: the determination coefficient for calibration; R2pre: the determination coefficient for prediction.
Applsci 10 06035 g004
Figure 5. (a) Scatter plot of predicted dry matter vs. actual dry matter; (b) predicted protein vs. actual protein content; (c) predicted starch content vs. actual starch content for blended yam samples. SEP: standard error of prediction.
Applsci 10 06035 g005
Table 1. Showing Starch, Dry matter, and Protein content (%) of yam (D. rotundata).
N = 200StarchDry MatterProtein
Ibadan (Chopped) 28.75 ± 3.96b36.57 ± 4.24a1.58 ± 0.36a
min-max21.78–36.9327.09–44.860.80–3.12
Ibadan (Grated)27.47 ± 3.84a36.60 ± 4.18a1.62 ± 0.34a
min-max21.03–37.7926.66–46.051.01–2.46
Ibadan (Blended)29.93 ± 3.88c37.14 ± 4.87a1.60 ± 0.33a
min-max20.34–36.6024.90–60.370.82–2.56
Ubiaja (Chopped)30.97 ± 1.90a37.98 ± 6.06a1.69 ± 0.45a
min-max26.94–34.8821.20–54.530.70–2.74
Ubiaja (Grated)31.35 ± 1.65ab38.17 ± 5.19a1.69 ± 0.53a
min-max26.63–34.8223.46–50.580.69–3.14
Ubiaja (Blended)31.49 ± 1.57b38.75 ± 5.49a1.84 ± 0.37b
min-max26.26–35.4822.30–47.691.04–2.79
p Method0.00010.5870.631
p Location0.00010.00010.0001
Values with the same alphabet are not significantly different at p < 0.05.
Table 2. Showing Starch, Dry matter, and Protein content (%) of Yam (D alata).
N = 200StarchDry MatterProtein
Ibadan (Chopped)21.59 ± 1.68c29.99 ± 4.52a1.52 ± 0.33a
min-max19.25–36.9320.61-4.860.68–3.11
Ibadan (Grated)21.69 ± 1.79b30.86 ± 4.25a1.58 ± 0.27a
min-max20.04–37.7922.83–46.050.92–2.46
Ibadan (Blended)21.38 ± 1.7a31.14 ± 5.17a1.51 ± 0.31a
min-max19.77–36.6119.24–60.370.80–2.56
Ubiaja (Chopped)28.41 ± 2.31c32.45 ± 4.95a1.64 ± 0.51a
min-max24.08–34.8819.79–54.530.70–4.36
Ubiaja (Grated)27.93 ± 2.78bc32.03 ± 4.35a1.74 ± 0.43b
min-max22.76–34.8222.59–50.590.63–3.14
Ubiaja (Blended)23.32 ± 2.32a32.61 ± 4.49a1.68 ± 0.46ab
min-max20.18–35.4822.30–47.690.83–4.84
p Method0.00010.5870.631
p Location0.00010.00010.0001
Values with the same alphabet are not significantly different at p < 0.05.

