A Novel Artificial Pancreas: Energy Efficient Valveless Piezoelectric Actuated Closed-Loop Insulin Pump for T1DM


1
Department of Mechanical Engineering, TOBB University of Economics and Technology, Ankara 06530, Turkey
2
Department of Mechanical Engineering, Middle East Technical University, Ankara 06800, Turkey
3
Department of Mechanical Engineering, TED University, Ankara 06420, Turkey
*
Author to whom correspondence should be addressed.
Appl. Sci. 2020, 10(15), 5294; https://doi.org/10.3390/app10155294
Submission received: 16 June 2020
/
Revised: 28 July 2020
/
Accepted: 29 July 2020
/
Published: 30 July 2020
(This article belongs to the Special Issue Human Health Engineering Volume II)
Abstract
:The objective of this work is to develop a closed-loop controlled insulin pump to keep the blood glucose level of Type 1 diabetes mellitus (T1DM) patients in the desired range. In contrast to the existing artificial pancreas systems with syringe pumps, an energy-efficient, valveless piezoelectric pump is designed and simulated with different types of controllers and glucose-insulin models. COMSOL Multiphysics is used for piezoelectric-fluid-structural coupled 3D finite element simulations of the pump. Then, a reduced-order model (ROM) is simulated in MATLAB/Simulink together with optimal and proportional-integral-derivative (PID) controllers and glucose–insulin models of Ackerman, Bergman, and Sorensen. Divergence angle, nozzle/diffuser diameters, lengths, chamber height, excitation voltage, and frequency are optimized with dimensional constraints to achieve a high net flow rate and low power consumption. A prototype is manufactured and experimented with different excitation frequencies. It is shown that the proposed system successfully controls the delivered insulin for all three glucose–insulin models.
1. Introduction
Piezoelectric pumps are a compact and lightweight alternative in microfluidic flow control. However, artificial pancreas systems (APSs) typically use syringe pumps for insulin delivery. In this paper, we propose a closed-loop controlled valveless insulin pump to keep the blood glucose level of Type 1 diabetes mellitus (T1DM) patients in the desired range. Our objective is to develop a piezoelectric pump that delivers the right amount of insulin while maintaining energy efficiency. Design and optimization of the pump are accomplished by using multi-physics finite element simulations, and the resulting performance is evaluated by numerical tests on mathematical glucose–insulin models and also by laboratory experiments with a preliminary prototype. The rest of this section reviews the related work in the subject matter. Section 2 presents a mathematical model of the pump and three glucose–insulin models with different complexity. Section 3 explains piezoelectric-fluid-structural coupled finite element implementation and simulation-based design optimization in COMSOL to achieve a high flow rate and low power consumption. The designed closed-loop controllers are outlined in Section 4. Section 5 and Section 6 present model-based simulations in MATLAB/Simulink and the experiments, respectively. Finally, in Section 7, we discuss current and future work.
1.1. Diabetes Mellitus
Insufficient insulin production in islet cells in the pancreas or tissue resistance against secreted insulin leads to excessive glucose concentration in the blood, which is called diabetes mellitus [1]. Insulin and glucagon, the two necessary secretions of the pancreas, regulate the glucose level in the body. Insulin is secreted to stimulate the cells to absorb the extra glucose for the energy needed, and glucagon is secreted to increase the blood glucose level up to its desired level required for the regulation of the system [2].
According to the findings of the IDF (International Diabetes Federation) in 2017, approximately 425 million adult people (20–79 years) were living with diabetes, and this will rise to 629 million by 2045 [3]. Furthermore, diabetes caused 4 million deaths and at least 727 billion dollars in health expenditure in 2017 and 12% of total spending on adults [3]. Furthermore, statistics of the WHO (World Health Organization) predict a dramatic increase of the adult diabetes population from 4% (in 2000, 171 million people) to 5.4% (366 million worldwide) by the year 2030 [4].
1.2. Closed-Loop Insulin Pumps
Manual injection with an insulin pen or pump causes patients to appear twice in a discrete control loop: as the glucose metabolic system which must be controlled and as the controller itself (cognitive system). Since it is difficult to take all external disturbances and internal systems into consideration, the discrete control method is generally followed by hypoglycemic or hyperglycemic events. Thus, to avoid patients having to determine each insulin dose manually, and to limit the variation in blood glucose concentration, an artificial pancreas needs to be developed as an essential scientific research aim. The required insulin dose is calculated using a control algorithm based on continuous glucose measurements obtained via a sensor without human input, and the precise insulin dose is automatically administered via a pump that continuously delivers insulin [5]. Improvement in glycemic control, in terms of glycated HbA1c (hemoglobin A1c) concentration and a reduction in hypoglycemia, and automatic changes in the basal insulin infusion rate at the time of exercise without any extra high-carbohydrate intake are essential advantages of APSs [6].
A T1DM patient needs to calculate his/her meal intake and required exercise interval in order to inject insulin, and glucose level also needs to be measured several times during a loop [4]. In this manual loop, the whole responsibility is on the patient, and if the patient cannot balance the glucose level correctly, it may cause many different diseases. Consequently, using a closed-loop system controlled by an artificial pancreas is quite beneficial for T1DM patients [6]. Artificial pancreases should be convenient to use, accessible, long-lasting, secure, safe, and affordable. Furthermore, they should also consume low energy. In this study, being low-cost and disposable, and consuming low energy are the primary focused features of an artificial pancreas.
Most of the APSs in the market includes a syringe pump such as Medtronic’s MiniMed 670G [7], Beta Bionics’ iLet [8], and Tandem’s t:slim X2 [9]. However, the clinical use of syringe pumps is associated with several risk factors, including overdose or underdose due to lack of control of the infusion speed, bleeding from backflow, and introduction of air. Overdose is the most problematic and significant one among all. It can lead to severe complications such as hypersecretion, respiratory depression, and hypoxia [10]. Additionally, the use of syringe pumps may not be ideal due to their large size and high-power demands for APS applications, where portability and mobility are important requirements. The novel artificial pancreas, which we propose in this study, functions with a piezoelectric actuated pump and can eliminate the accuracy, portability, and power efficiency issues of the old methods and serve as a solution.
1.3. Piezoelectric Actuated Pumps
A piezoelectric material is a smart mechanical material that can deform when the voltage is applied to it [11]. Piezoelectric actuation is advantageous from many aspects such as high actuation force, fast mechanical response, ease of integration, compact design, and low power consumption compared to the power required for the actuation of syringe pumps. Piezoelectric actuators can be used in different configurations such as in cylinder shape encircling a tube and moving the fluid in the tube under compressions and expansions along the radial direction [12] or a disc shape piezoelectric actuator moving the fluid with a dome deflected shape [13,14,15,16,17]. Moreover, even valveless designs of the disc configuration are possible for improved reliability due to the elimination of valves [13]. To manipulate, transport, and control the exact amount of fluid in the order of microliters and milliliters, micropumps are of great importance in the microfluidic systems [14]. In order to predict the flow rate and working of the micropump, analytical and numerical results are compared to each other [15].
Furthermore, Laser and Santiago [16] have categorized the micropumps in terms of valves, chamber, thickness, voltage, frequency, pressure, and flow values. Optimization of diffuser dimensions such as diffuser length, diffuser neck width, and diffuser angle is necessary in order to enhance the performance of the micropump on the net flow [17]. Finally, in order to design and manufacture a low-cost micropump that is useful in a variety of applications, the overall micropump design should enable the use of mass fabrication methods [14].
1.4. Insulin/Glucose Models
Modeling of glucose–insulin control systems has gained significant importance in the last 50 years [18], and various glucose–insulin kinetic models have been found in order to capture the glucose–insulin mechanism [19]. Even though there is a wide range of models from simple expressions to complex mathematical models, there are three general groups for mathematical models including linear models (Ackerman [18], Ceresa [20]), nonlinear models (Bergman [21,22], Furler [23]), and comprehensive models (Sorensen [24], Cobelli [25], and Hovorka [26]) [19]. In this work, the Ackerman model is used for optimal controller design, the Bergman model is used for PID controller parameters, and finally, the Sorensen model is used for validation and reliability of models.
2. Mathematical Modeling
2.1. The Piezoelectric Pump Analytical Modeling
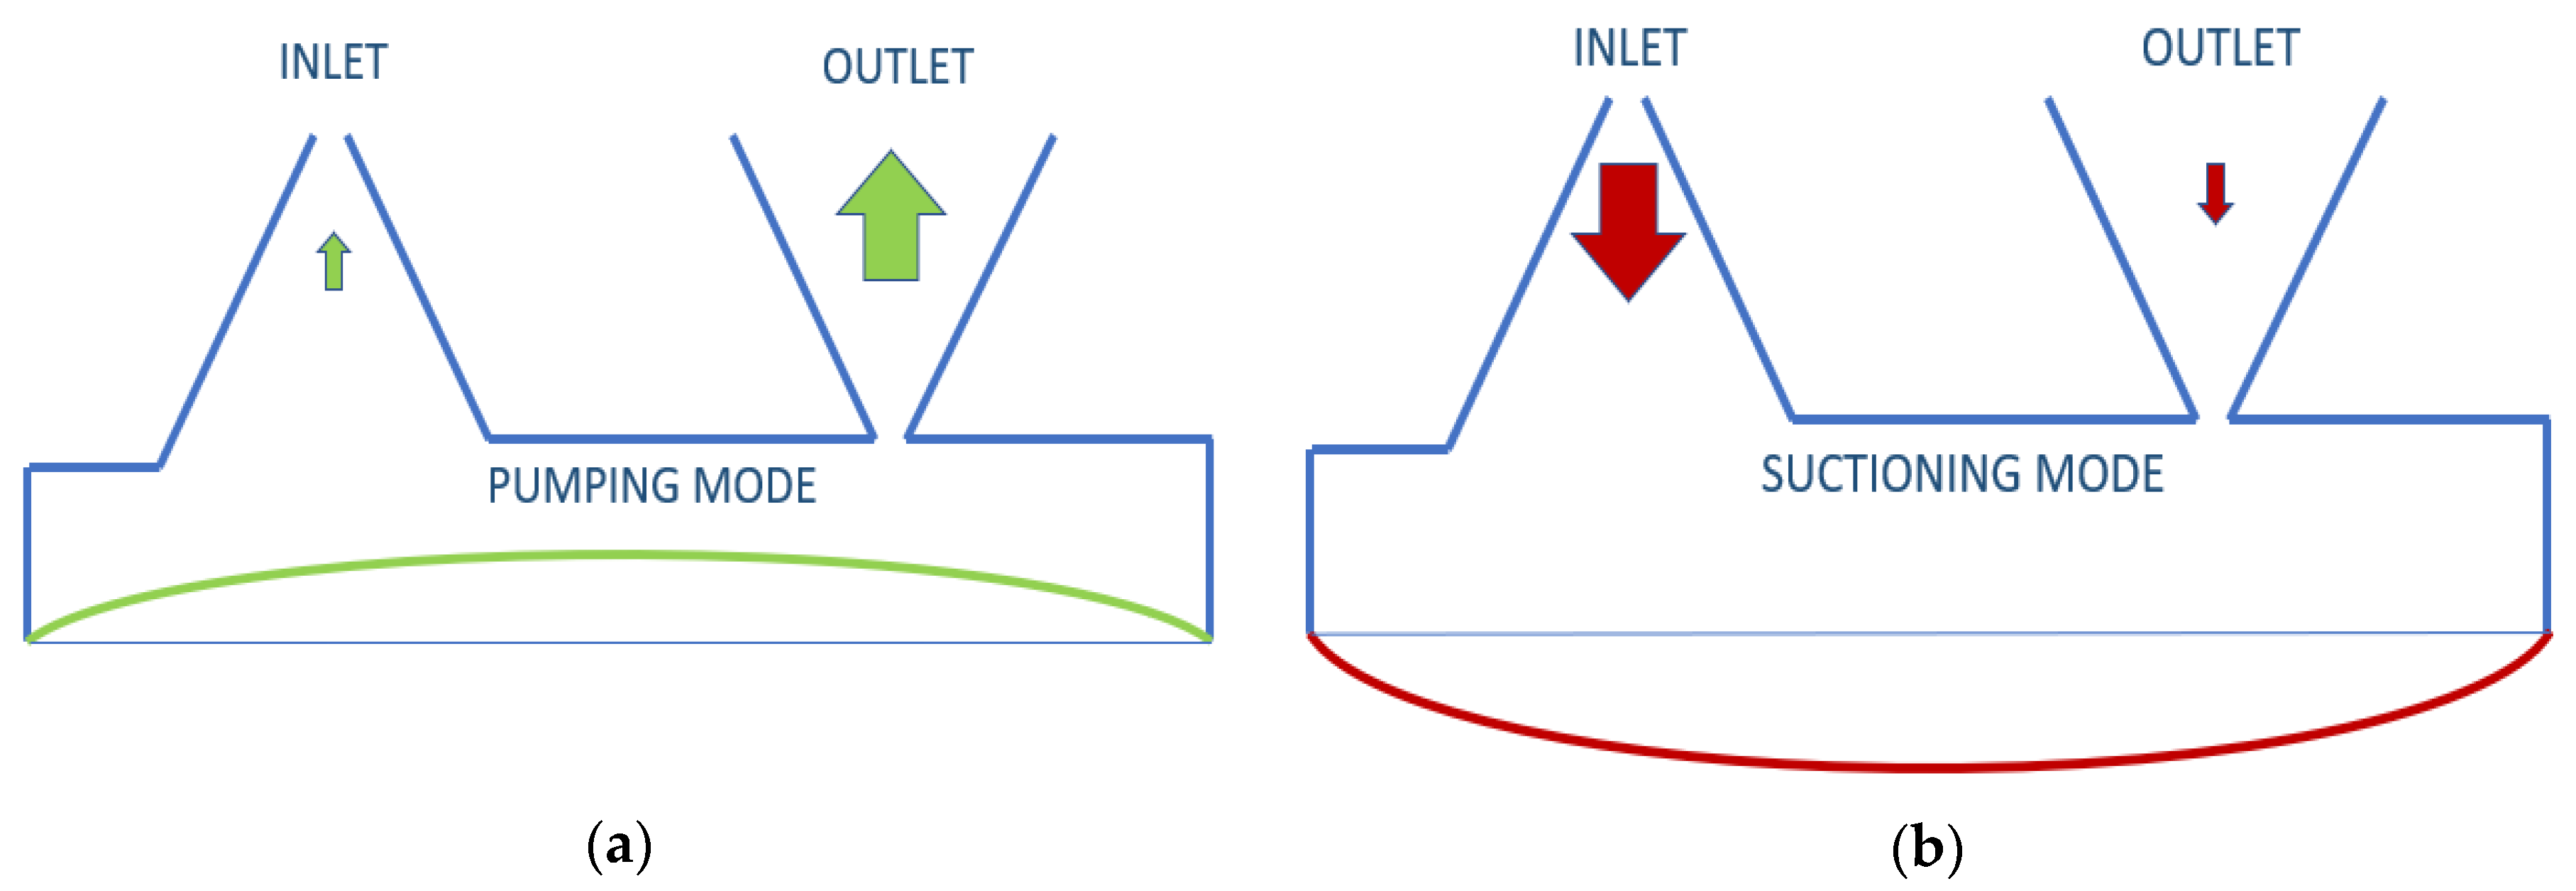
The insulin rate that needs to be pumped for an adult is defined as a minimum of 1.67 μL/min [27]. To pump this amount with piezoelectric disk deflection, the valve selection of the pump is one of the most sensitive parts. Neither active nor passive valves were used in this study because the opening-closing speed and back-pressure constraints of the active valves were inadequate for the designed pump, and passive valves are not only difficult to manufacture but also inapplicable in terms of numerical implementation. Instead, a valveless design was desired to be used. In this valveless design, literature reviews of 3D conical, 2D cone-shaped, or planar cone projected options were examined [16]. When the voltage sent to piezoelectric disk is positive, and it does an upward displacement, insulin is pumped from both inlet and outlet, but more from the outlet. When the voltage is negative, the piezoelectric disk will be in downward displacement, and it will pump insulin from the reservoir from both the inlet and outlet, but more from the inlet. According to the difference in pumping frequency, the speed difference between inlet and outlet can be defined. This is illustrated in Figure 1 below. Nozzle and diffuser cone angle, in other words, divergence angle (2θ°), differs from 5° to 70°. Optimum angle needs to be calculated for each system, but studies have searched for angle-length variances as well [28].
The deformation of the piezoelectric pump dz was calculated using Timoshenko’s theory of thin circular plates with small deflection [29].
where r is the radial coordinate, R is the radius of the piezoelectric disk, and A0 is the time-dependent deflection of the piezoelectric disc. Maximum of is used to calculate the volume. The elliptic conical form is used to calculate the approximate delivered insulin volume analytically. This volume is considered a quarter of one period.
where h is the maximum deflection () of the piezoelectric disk. The total flow rate from both inlet and outlet can be calculated as follows:
and represents time (e.g., 1/400 s for 100 Hz). In order to validate numerical results easily, equation is used to compare total flow rates in a quarter of one period. Therefore, Equation (3) does not calculate the net flow. The net flow occurs from the difference of and instead. The following net flow rate equation is calculated in Section 3 using summation of inlet and outlet flow rate difference [30].
2.2. Insulin/Glucose Plant Modeling
Plant models were developed to see T1DM patients’ blood glucose levels in the simulation environment and to calculate the controller parameters. These models differ in terms of complexity and accuracy. One linear, one nonlinear, and one comprehensive model were chosen among a great many models in the literature. The Ackerman model was used in the design of an optimum controller as a linear model; the Bergman model was selected as the nonlinear model with medium-level detail applied on all of the controllers. Finally, the Sorensen model was used as the model which shows the insulin glucose level in each part of the body in a detailed way [6].
Ackerman [18,31,32], developed a model utilizing four first-order rate constants for the glucose–insulin interactions. The model is described on two poles; the first one is G = blood glucose level; another one is H = hormone level. g and h parameters in the linear model are defined by considering the differences in fasting values for g ≡ G − G0 and h ≡ H − H0.
m1 represents glucose activity, m2 is a parameter for the removal of glucose due to blood hormone concentration, m3 is defined for the duration of insulin action, and m4 is for the removal of hormone for high glucose concentration (typically 0 for T1DM). J(t) and K(t) are rates of exogenous glucose and hormone, respectively.
Although the model of insulin and glucose dynamics adapted from Bergman et al. [21] define a similar model with Ackerman [18] for glucose–insulin interactions, it has three compartments for plasma insulin I(t), remote insulin X(t), and plasma glucose G(t). p1 is a parameter at which glucose is removed from the plasma space independent of the influence of insulin, and the rate of insulin appearance and remote insulin disappearance are governed by p3 and p2, respectively. The time constant for insulin disappearance is defined with n. Subscript B is defined for basal plasma concentrations, and (0) is the level of the parameter at t = 0, and external insulin infusion is defined as u(t), and meal intake is defined with p(t) [23,24].
Finally, the Sorensen model is used for advanced glucose–insulin metabolism modeling. Sorensen [24] used the compartment modeling technique. Six compartments are used: brain, heart/lungs, gut (stomach–intestine), liver, kidney, and periphery (muscle–adipose). Mass balance for glucose of brain is and , heart and lungs: , gut: , liver: , kidney: . The periphery is defined, and periphery equations are given below. First subscripts are defined as follows: B is the brain, G is the gut, H is the heart, L is the liver, K is the kidney, and P is the periphery. Second subscripts are as follows: I is interstitial fluid space, and V is vascular blood space; also B is defined as basal value, and N is defined as normalized value by using basal values [33].
On the other hand, mass balance for insulin of the brain is , and for heart and lungs . In terms of insulin intake, , gut , liver , and kidney . The periphery is represented as follows:
Another part of the model is metabolic sources and sinks for glucose compartment such as peripheral glucose uptake, hepatic glucose production and uptake, and kidney glucose excretion. Additionally, for insulin compartment, liver insulin clearance, peripheral insulin clearance, and kidney insulin clearance variables are used while defining the glucagon model [19]. Sorensen model parameters are defined with delivered insulin i(t), blood glucose concentration G, blood insulin concentration I, vascular blood flow rate Q, metabolic secreting rate Γ, volume V, and trans-capillary diffusion rate T [24]. All glucose–insulin mathematical models were designed with T1DM parameters in MATLAB-Simulink, and minute-based open-loop simulations and step responses were identified. The model parameters of Ackerman can be found in Section 4, the Bergman Model was taken from [22], and the Sorensen model was taken from [19] Appendix B5.
3. Numerical Implementation
3.1. Piezoelectric Pump Finite Element Implementation
Solid mechanics and electrostatics equations were used to calculate piezoelectric dynamics numerically in the stress-charge form.
where T is stress vector, S is elastic strain vector, [cE] is elastic stiffness under constant electric field, [e] is a coupling matrix, and superscript t on [e] means transpose of the matrix [e]. D is electric flux density of piezoelectric material, E is electric field intensity, and is dielectric permittivity under constant strain [34]. The values of these parameters are presented in Table 1 with other material properties. The dimensions of the pump are illustrated in the same table as well. Some of dimensions are optimized in Section 3.2, so initial values are given.
For numerical simulation of the piezoelectric actuator, solid mechanics and two-way electrostatic coupling were used, and appropriate dimensions were determined through iterative design and simulations. Piezoelectric material used in the simulations were decided to be the 27 × 0.5 mm piezoelectric disk of the STEMinc (Davenport, FL, USA) [35] company. Last but not least, the optimum design was found by conducting a three-way analysis (e.g., electrostatics, structural mechanics, and laminar flow) to the system. The requirements for a valveless design are as follows: the flow velocity needs to reach to 1 m/s but should be less than 8 m/s, the piezoelectric disk diameter should be 27 mm, the maximum piezoelectric disk displacement should be 50 μm and minimum displacement should be 2.5 μm, net flows should be at least 2.5 mL/h (~0.1 μL/s), the size of the pump should fit the palm of a hand, the maximum voltage supply should be 100 Vp-p, and, finally, 0.1 A continuous, the instantaneous current (transient) value of one ampere, should be the maximum value needed for current.
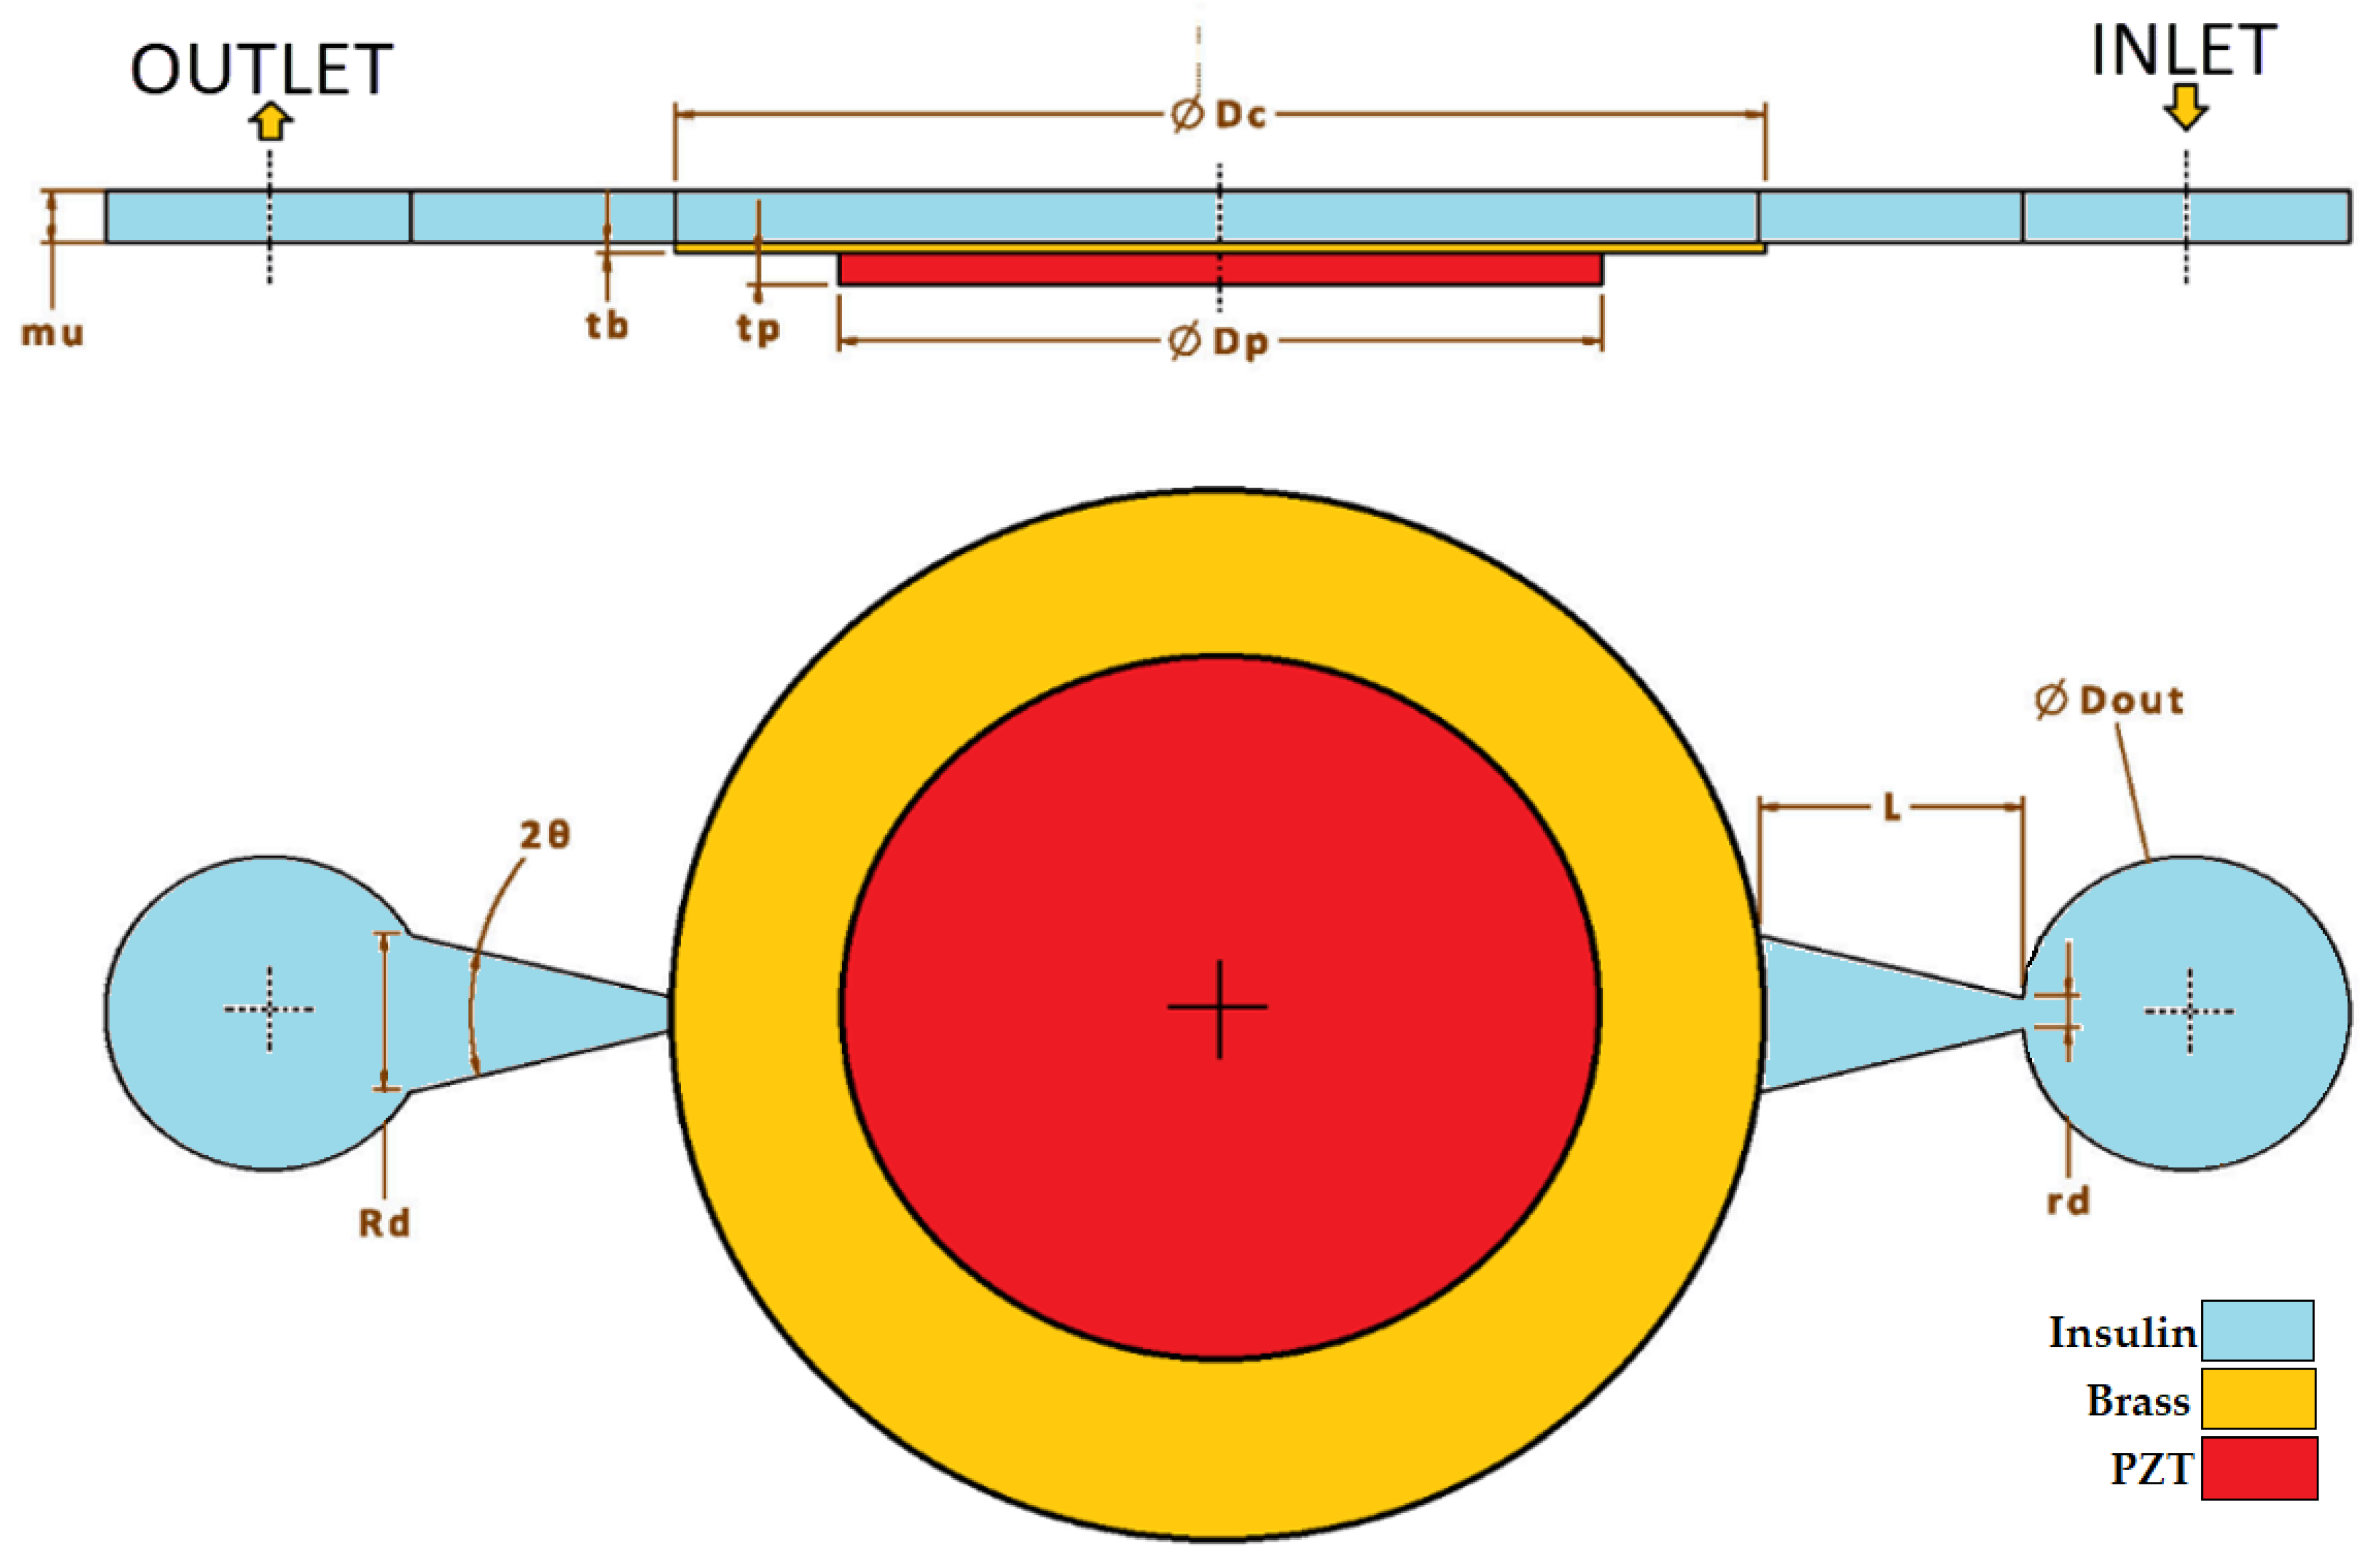
Planar/horizontal design was implemented, as shown in Figure 2, and when this design was finished and after defining a starting point, parameter ranges such as diffuser/nozzle angle, nozzle’s wide diameter, nozzle length, and length of the chamber were decided accordingly. Between the range of minimum 1 degree and maximum 30 degrees, 10-degree nozzle angle; between the range of minimum 0.1 mm and maximum 1 mm, 1 mm nozzle length; and, finally, between the range of minimum 0.5 mm and maximum 2 mm, 0.5 mm nozzle diameter were used for simulation iterations.
The input signal to the piezoelectric pump is defined as follows, where V is voltage, FR is the frequency (in Hz) of applied voltage and t is time:
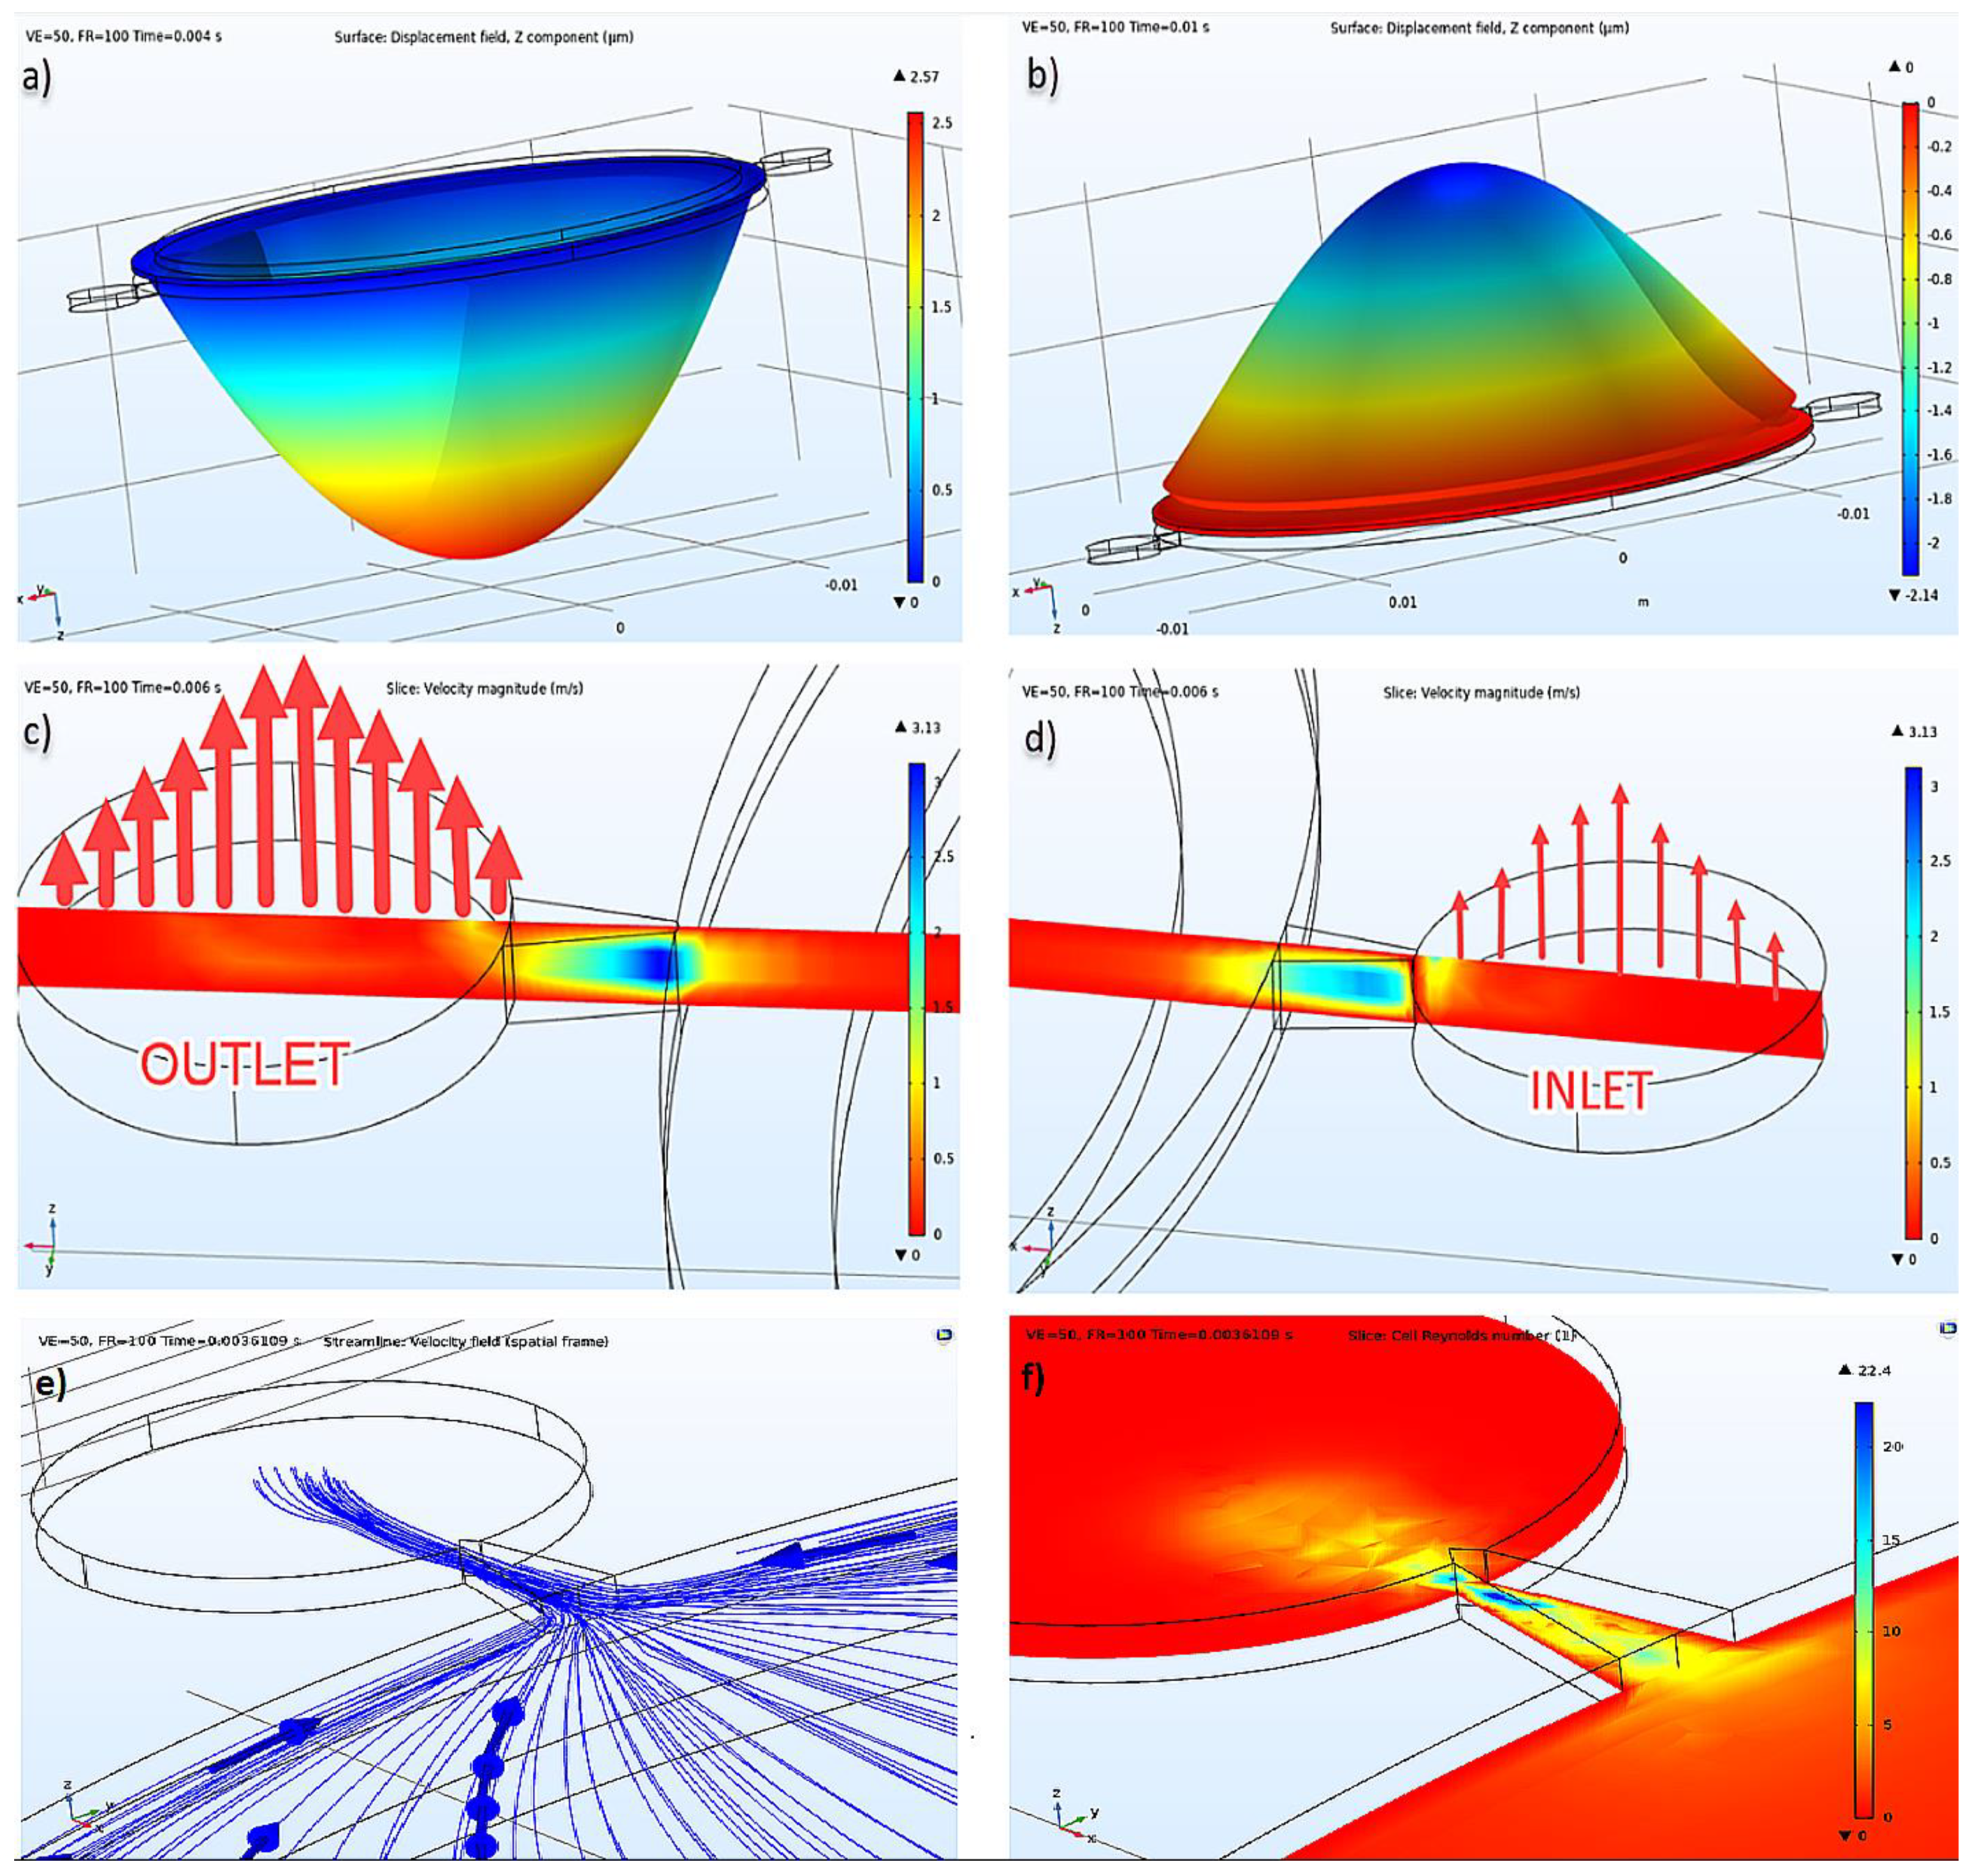
By using COMSOL Multiphysics 5.4 [34], analyses were made in different domains both in a single and a coupled way, and with different time steps, mesh sizes, and discretization values. Different relative tolerance values were tried as well. According to the results of Eigenfrequency study analysis, the piezoelectric actuator’s first natural frequency was calculated as 6373 Hz without fluid. Then the transient analysis setup was started. Damping was defined to the linear elastic material, dielectric loss was defined to the piezoelectric disk, a fixed constraint was defined to the outer surface of the brass located under the piezo, and lastly, the ground was defined to the one surface of the piezoelectric material and terminal to the other surface. Force, displacement, and voltage were assigned as 0 for initial conditions. In the piezoelectric actuator’s first mode shape, it was seen that it had displacements as shown in Figure 3. According to the piezoelectric actuator data [35], expected displacement could reach up to 50 μm at 155 Vp-p; hence, arrangements that provide this displacement were determined. The applied voltage was 100 Vp-p, and the frequency was 100 Hz. How voltage and frequency affected the net flow in the optimization part can also be seen in Section 3.2.
Insulin flow is defined as an incompressible flow, at 293.15 K temperature, under 1 atm reference pressure, and without a turbulence model. Cell Reynold’s numbers shown in Figure 3f verified that there was no need for a turbulence model. As an initial condition, velocity and pressure were given as 0 (zero). As a boundary condition, after defining the stable wall, the wall condition was given as no-slip, and it was defined with inlet and outlet, as seen in Figure 3. For inlet and outlet, 0 Pa pressure condition was given, and no constraint was defined for flow direction. Absolute tolerance was given as 0.001, and the PARDISO solver was used in a coupled analysis study. The results of displacement of the piezoelectric actuator under insulin pressure, the pressure inside the pump chamber, the current passing through the terminal in the electrical circuit, and velocity values in inlet and outlet were calculated and presented in different plots of this study.
3.2. Piezoelectric Pump Optimization
Analyses were done between 100 K to 500 K mesh elements for coupled analysis to prove mesh independency. After mesh convergence analyses, <1% for structure-based error and ~8% flow-based error were calculated for 200 K. The analysis time measured a minimum 2.5 h to 262 h for 100 K to 500 K grid analysis with 1% relative tolerance and 1/40 step size (40 time steps per cycle); as a result, the 200 K grid had an acceptable error, so it was used. There were many analyses done, as well, for different time-steps from 20 steps per cycle to 1600 steps per cycle. These analyses took a minimum of 1.5 h to 48 h for 100 K grid size and 1% relative tolerance. Error was calculated with respect to 1600 steps per cycle. The error was, respectively, >41% for 20 step, 8.5% for 40 step, 7.5% for 100 step, and <1.5% for 400 step per one cycle. i7-7700-32GB hardware was used for this analysis and time optimization.
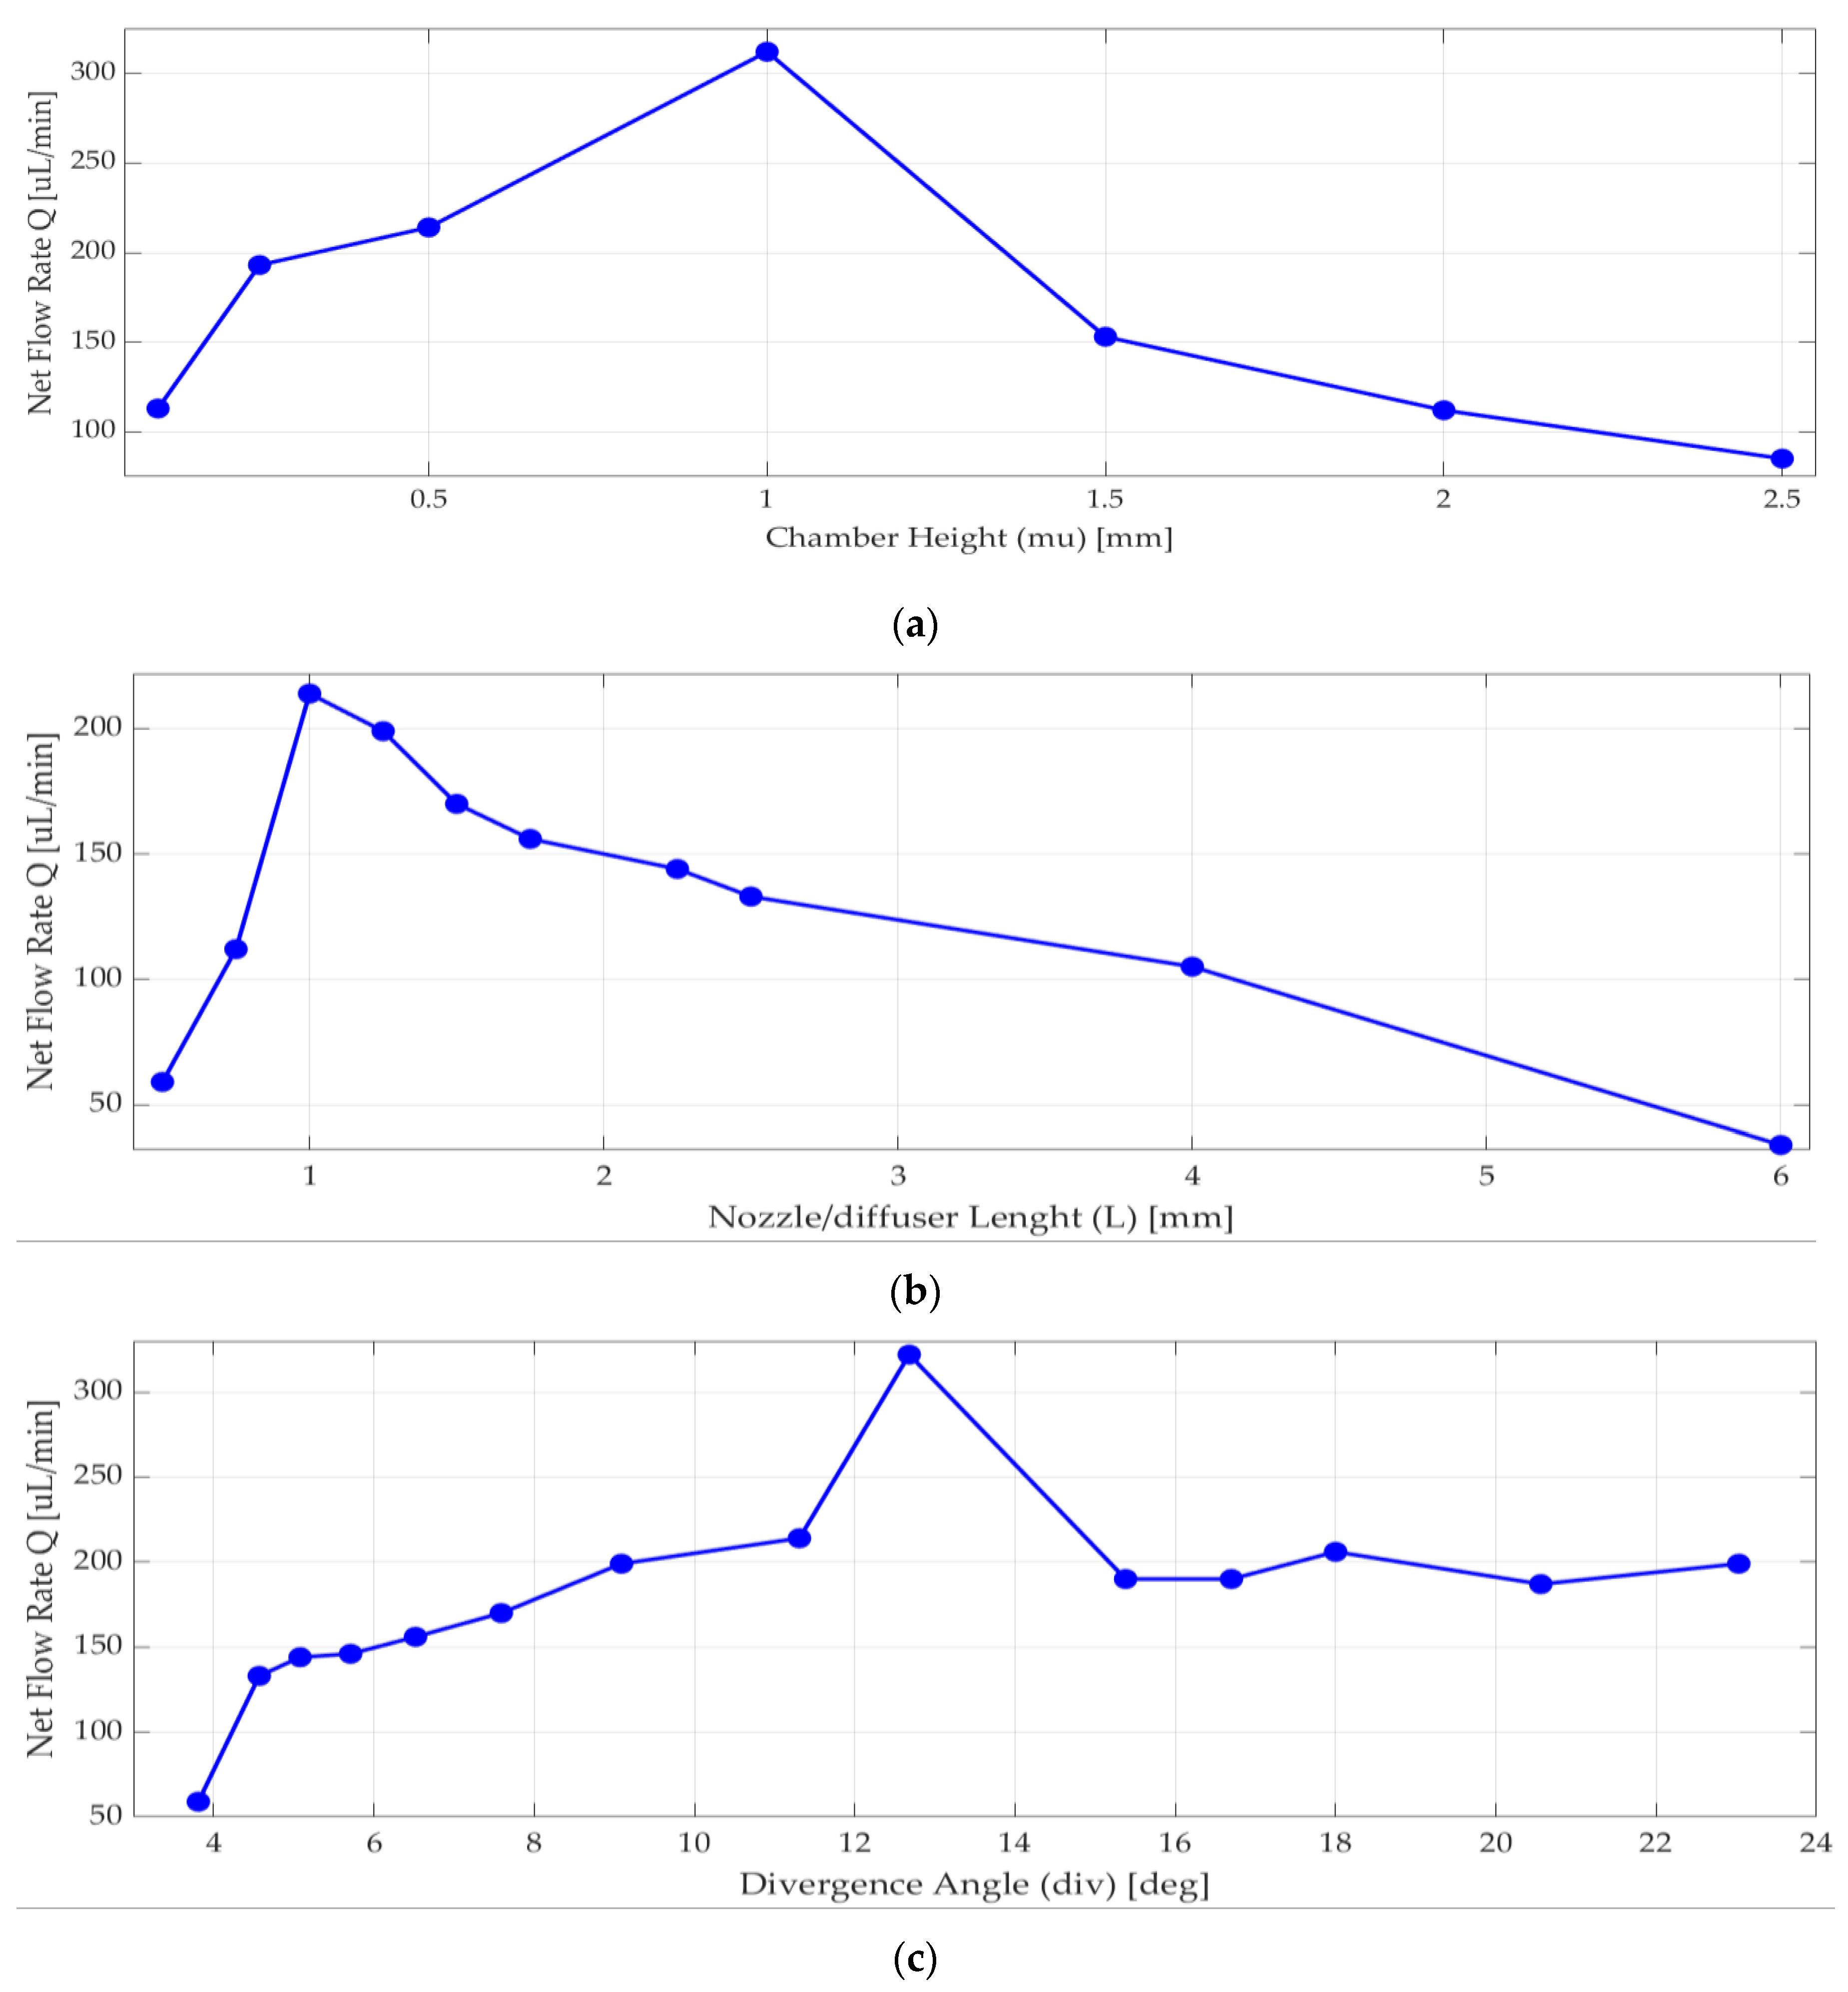
Nozzle/diffuser divergence angle, nozzle/diffuser wide radius, nozzle/diffuser length, and chamber height were optimized. According to [13] and [30], when the chamber diameter increases, the efficiency of nozzle/diffuser and the net flow increases. When diameter of the piezoelectric disk increases, the expected deformation of the piezoelectric disk increases as well. These parameters were optimized for best efficiency, maximum deflection, maximum velocity, and net flow, as well as manufacturability considerations. Analyses were performed to achieve the most efficient nozzle and diffuser design. Since chamber diameter was fixed by piezoelectric actuator selection, only chamber height (mu) was optimized in a range of 0.2 mm to 2.5 mm, and the one with the highest net flow rate using Equation (4) was 1 mm, shown in Figure 4a.
As seen in Figure 4b, nozzle/diffuser length affects the net flow rate, so more than 10 different lengths were analyzed. The net flow rate significantly changed around 1 mm. There are many published pieces of research about nozzle and diffuser design [13,30,36,37] that are typically above 4 degrees half angle. When the nozzle and diffuser angle increases, the net flow rate increases too. However, there are some velocity values and venturi effects that may constrict the flow, so analyses were done to have the most efficient planar nozzle/diffuser. As seen in Figure 4c above, the most efficient nozzle and diffuser selected half-angle value θ was in between 12 and 14 degrees.
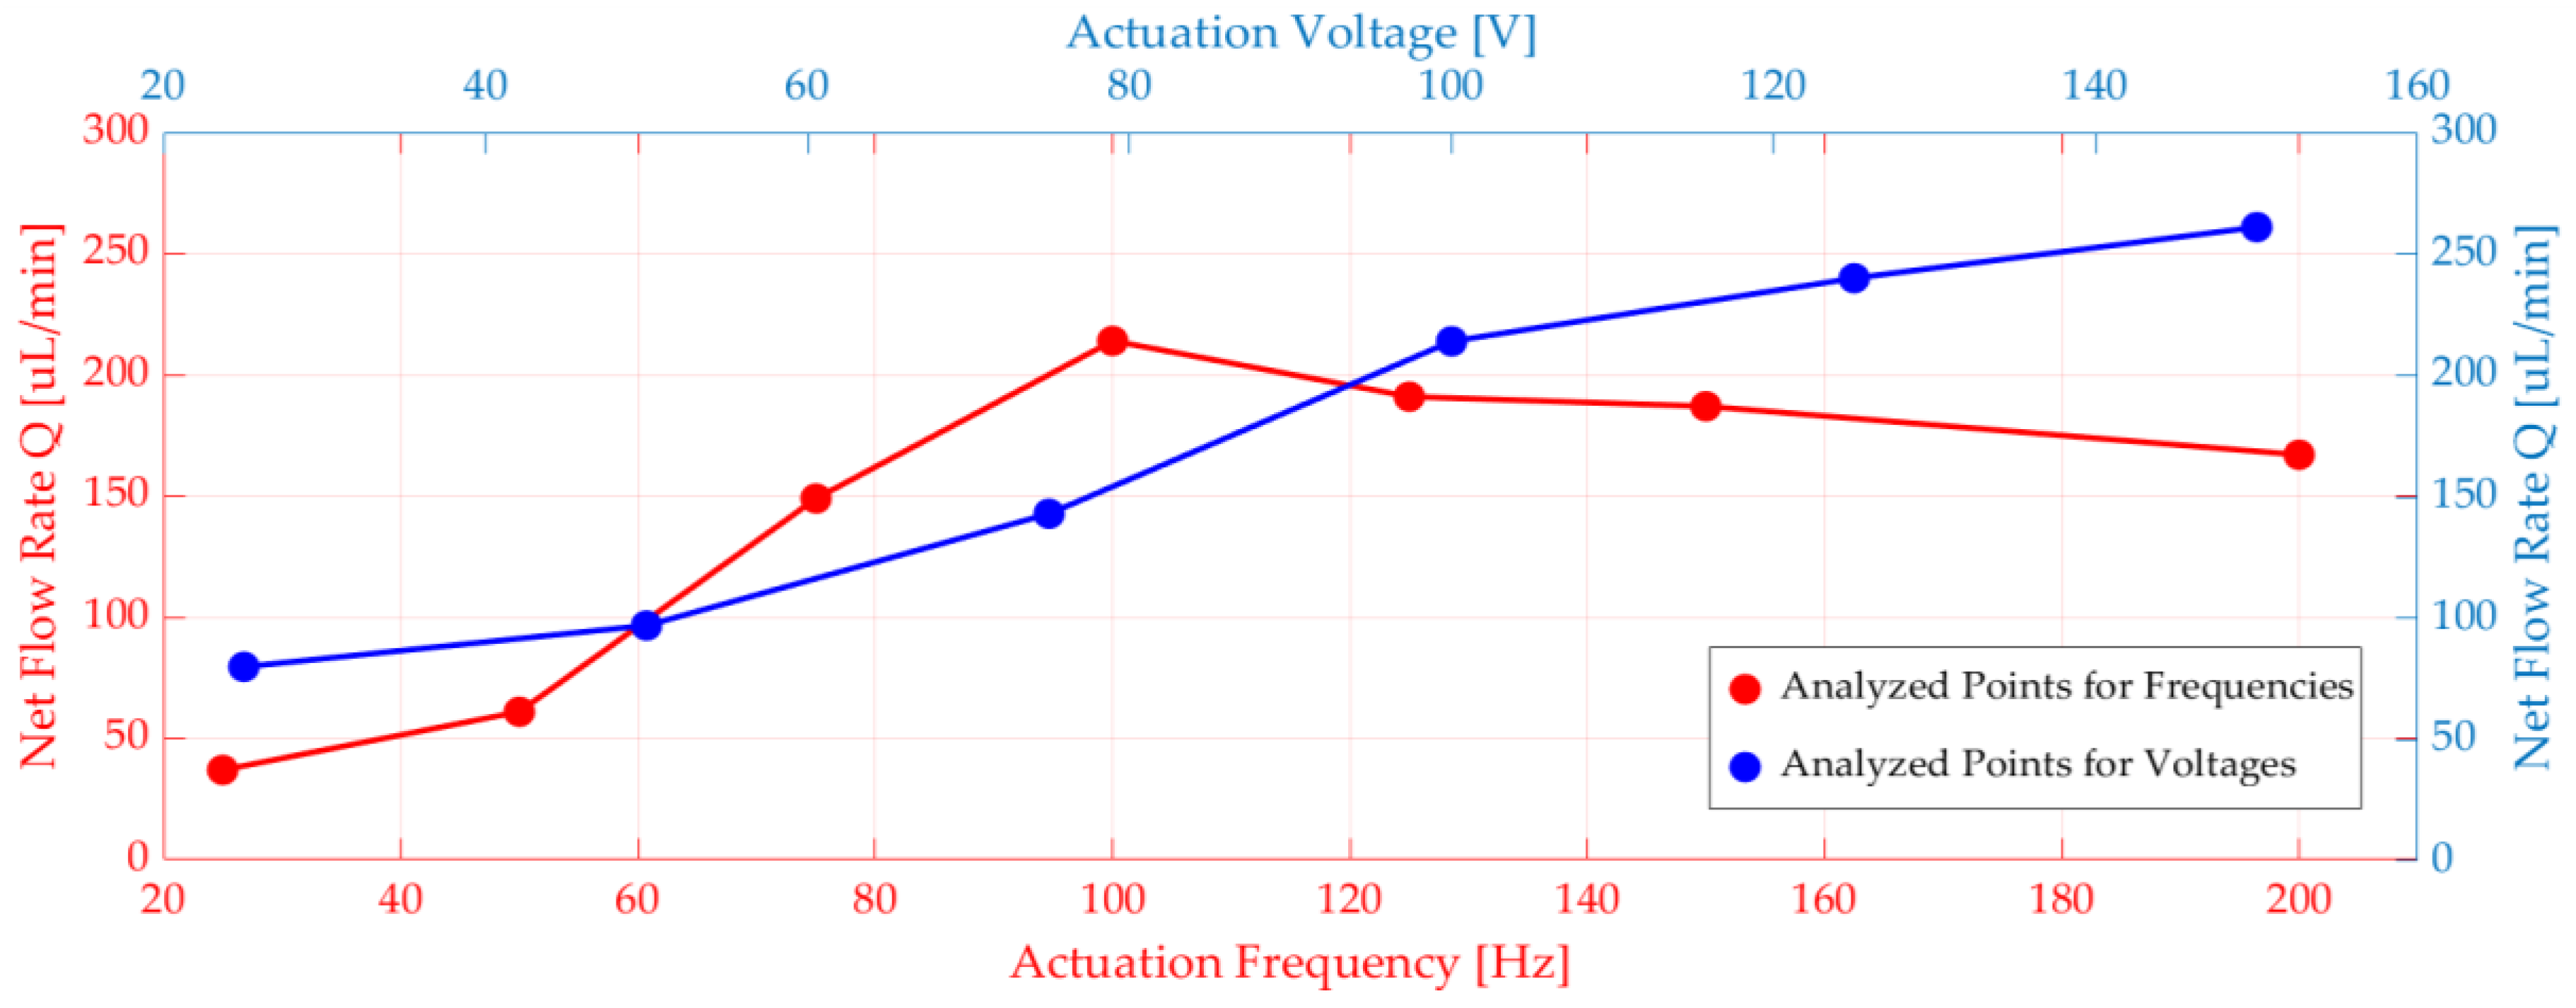
In addition to that, voltage and frequency parameters sweep was done. The piezoelectric actuator terminal was connected to an electrical circuit, and there was a voltage source in the circuit. Different voltages and frequencies were applied to the voltage source (see Figure 5). When the voltage increased, displacement and net flow increased explicitly. It was observed that the flow rate peaked at 100 Hz for the frequency range between 20 Hz and 200 Hz. (see Figure 5).
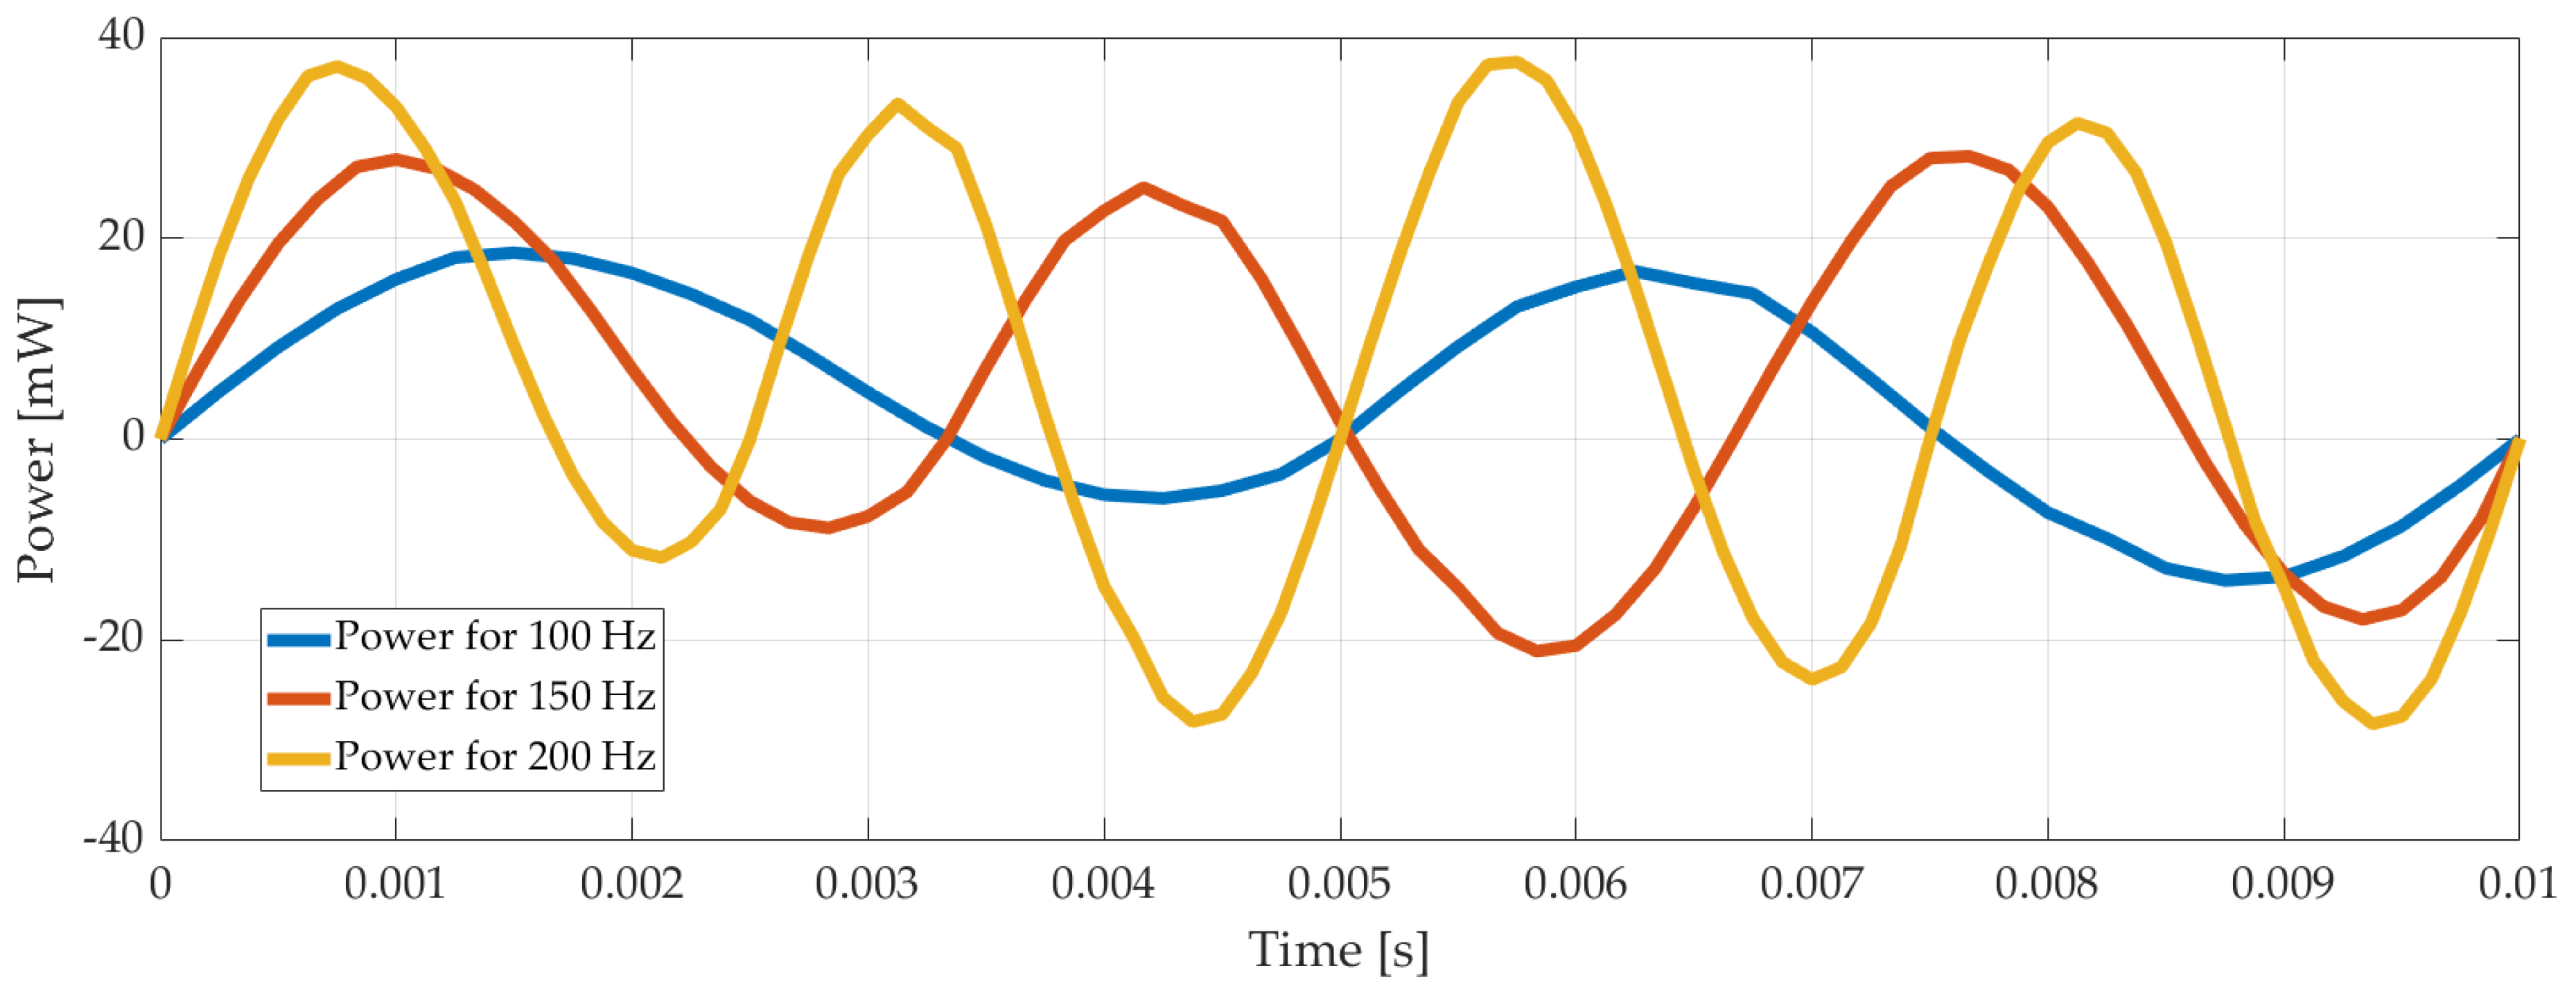
Another case considered was the calculation of the current drawn by the piezoelectric disk. There is an electrical circuit defined in COMSOL workspace, and the cable connected between the electrical source and the piezoelectric actuator was used as a resistor; the current through the cable was calculated. As expected, it increased when the voltage increased. Using the voltage and the current values, power consumption was calculated for different voltage and frequencies applied to the system. It is shown in Figure 6 below.
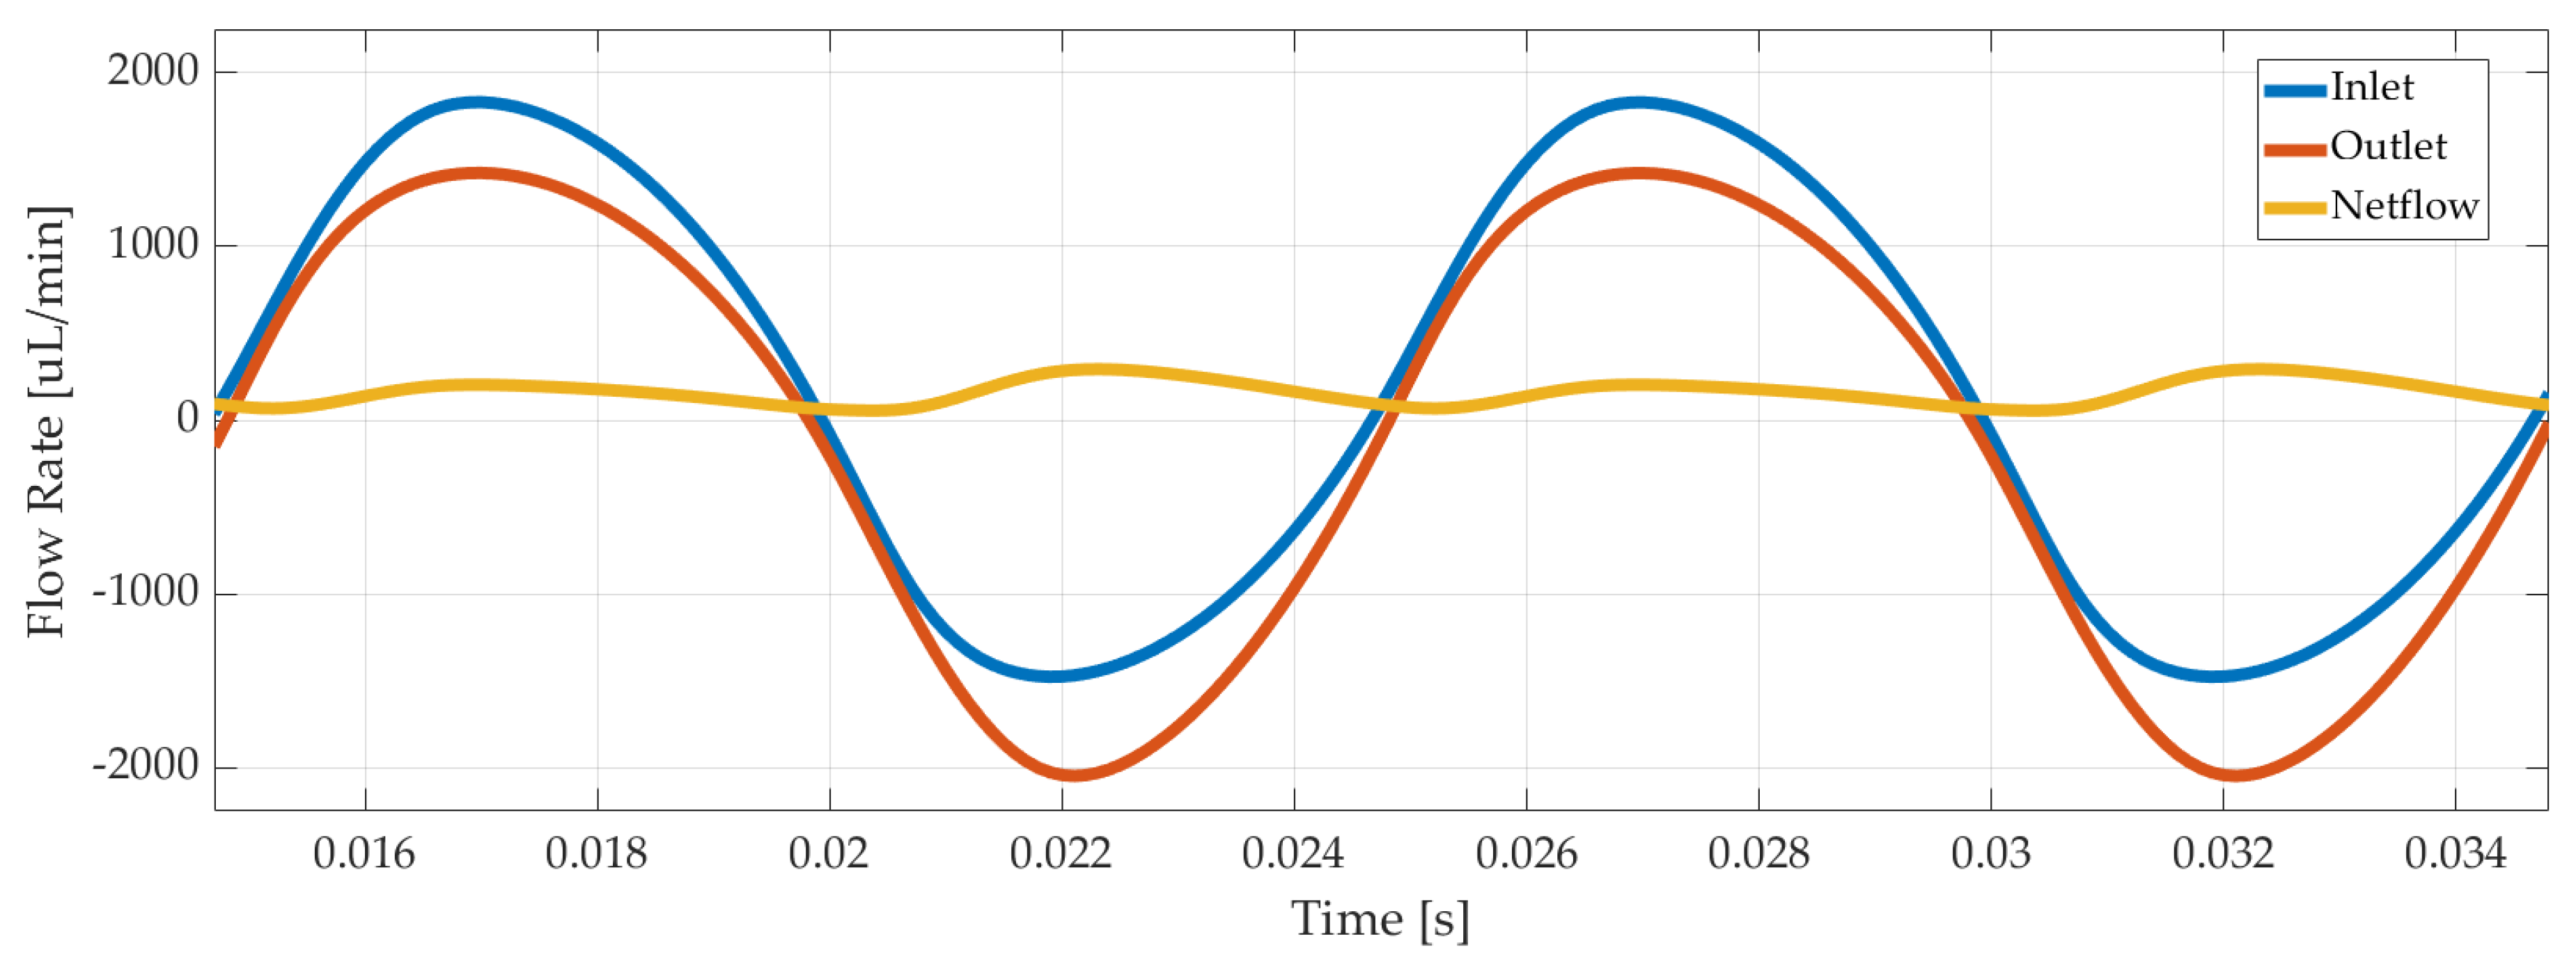
Last but not least, outlet and inlet flow rates were recorded, as illustrated in Figure 7 for 3 µm displacement amplitude of the piezoelectric disc. The net flow was calculated with Equation (4) as 220 µL/min in average.
4. Controller Design
First, Ackerman [18], Sorensen [24], and Bergman [21] glucose–insulin models were implemented in MATLAB-Simulink. Additionally, for each of these three models, a PID controller was designed. Additionally, the optimum controller gains, calculated by using Ackerman model, were implemented on all these models. It is known that daily insulin delivery and human glucose levels should be in the desired range [3] of 70–130 mg/dl. The three models used in this study have parameters for different patients. It is easy to observe that Ackerman’s model can be used as a state-feedback controller design. Bergman’s minimal model is easier to adopt, and using this simpler non-linear model can be less time-consuming than a more complicated non-linear model. The Sorensen model is comprehensive and detailed, so insulin and glucose levels all-around the body can be simulated with it. It is also very complex and contains several parameters.
After the glucose–insulin models are established, control of glucose level is the next step. For those controllers, there are two types of control reference methods: target tracking (e.g., 90 mg/dl) and reference tracking (e.g., 80–110mg/dl) [19]. For this article, PID with bang–bang coupling, and optimal controllers were selected from control algorithms, and the target tracking method was used [6].
To design the optimal controller, state–space forms had to be established. Since Sorensen and Bergman’s models are nonlinear, the optimal controller was designed regarding Ackerman’s linear model. Ackerman equations are formed in the state–space form as shown using Equations (5) and (6).
After the state–space model is defined, a performance criterion is defined considering the deviation from the target of blood glucose level and delivered insulin; also, δ is taken as the balance between them. δ defines the coefficiency of the effect of input, which typically describes the delivered insulin.
While Q is defined as 1, and P is as δ, Ricatti’s equation is applied for A and B from (15) as follows:
For calculated R, m1 = 0.005, m2 = 0.001, m3 = 0.002, m4 = 0, for δ = 0.25, 0.5, 0.75, 1 parameters applied, and from the gain equation, K is observed and u0 input is derived from following equation. On the other hand, u is defined as pump working time, which represents the power consumption of the pump as well, so δ = 0.25 represents a less power efficient pump, and δ = 1 represents a more power-efficient pump.
Finally, the PID algorithm is established, and the reference glucose and actual glucose measurement information is transmitted to the PID controller and delivered to the bang–bang controller and ROM of the piezoelectric actuated pump at the input of the plant model. The flowing insulin is transmitted to the insulin/glucose model. PID controller parameters Kp, Ki, Kd, is optimized for the best performance for overshoot Me = 40% rising time tr = 5 mins and settling time ts = 15 mins for all glucose–insulin models [38].
5. Model-Based Simulation and Results
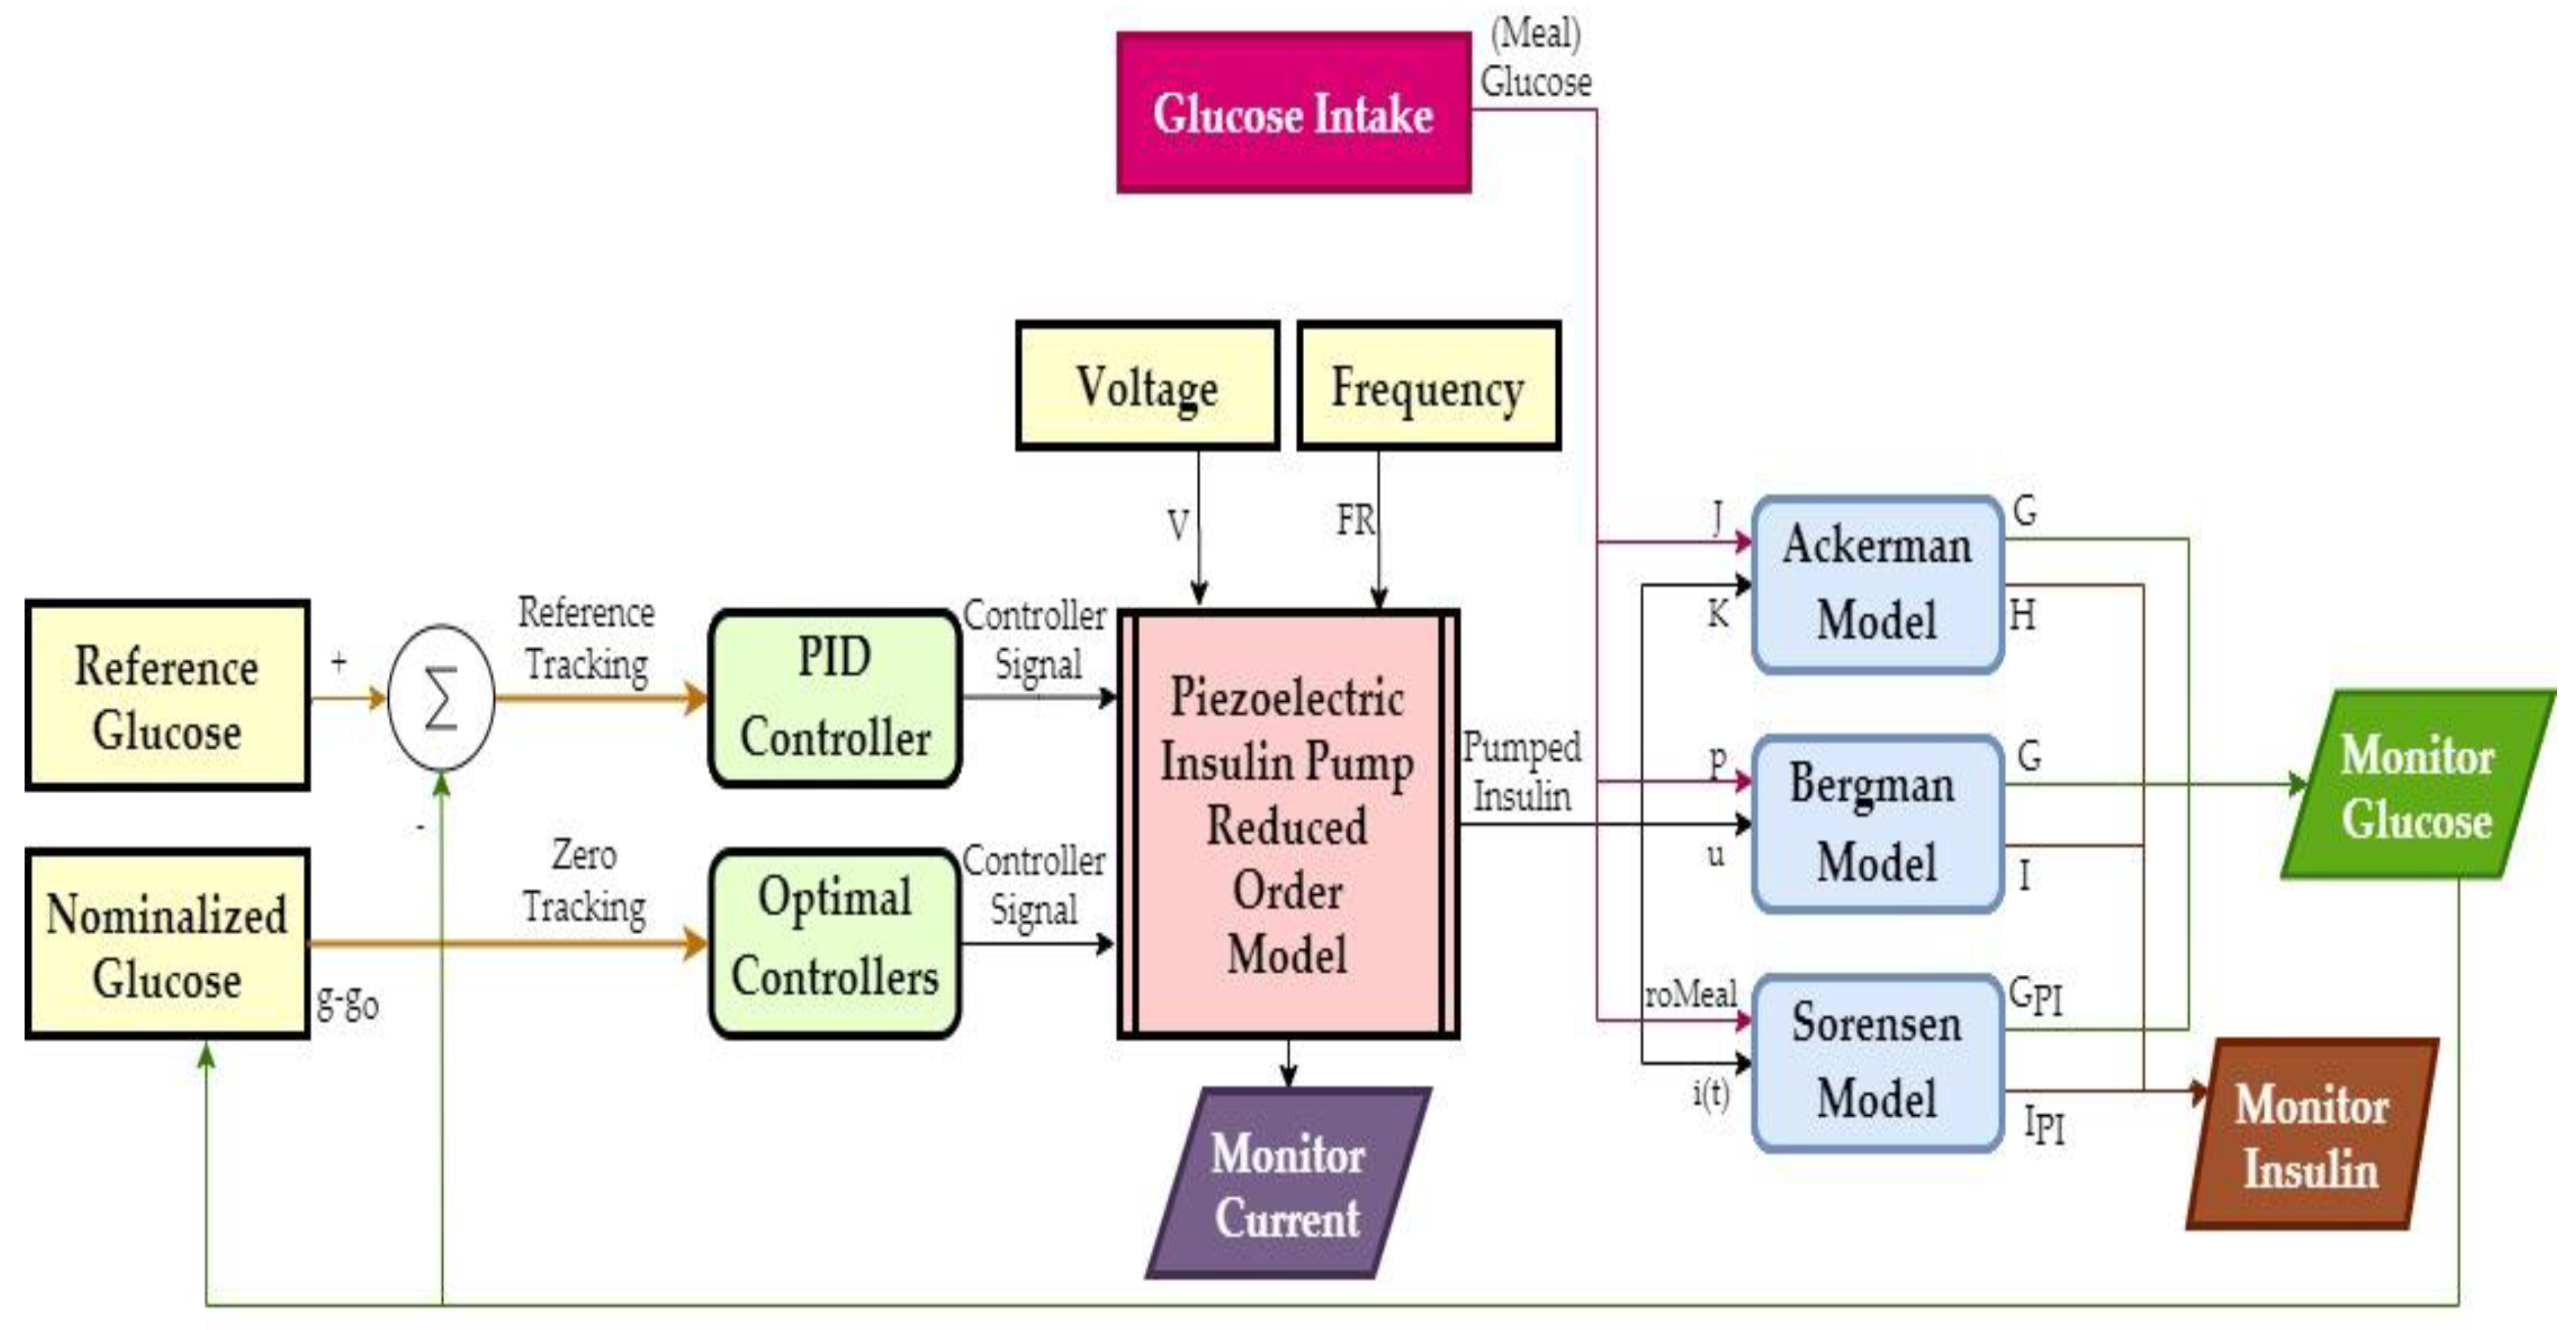
Based on the results of COMSOL simulations, a reduced-order model (ROM) of the pump was generated in the form of a look-up table. This model output time-dependent net flow and electrical current from excitation voltage and frequency inputs. Figure 8 shows an overview of the closed-loop control simulations in MATLAB/Simulink, where the pump supplied insulin to Ackerman, Bergman, and Sorensen glucose–insulin models with T1DM parameters. The R2019b version of MATLAB was used, and the solver settings were configured as 6 × 10⁻⁷ minutes minimum step size, auto solver selection, 1 × 10⁻⁴ relative tolerance, adaptive zero-crossing, 1440 min. (i.e., one day) stop time.
The glucose intake model supplied glucose input to the glucose–insulin models. On top of the 100 mg/dL basal glucose, a 150 mg/dL increase lasted for 18 min after each meal. This increase was supplied via a 1/(2s + 1) delay transfer function. Voltage and frequency of the pump excitation signal were constant, and the controllers switched the pump on/off based on the difference between the reference and measured glucose. Pump displacement and the electrical current were monitored as well as the inlet and outlet flow rates. The amount of delivered insulin was calculated from the net flow rate and the volume integral of the outlet.
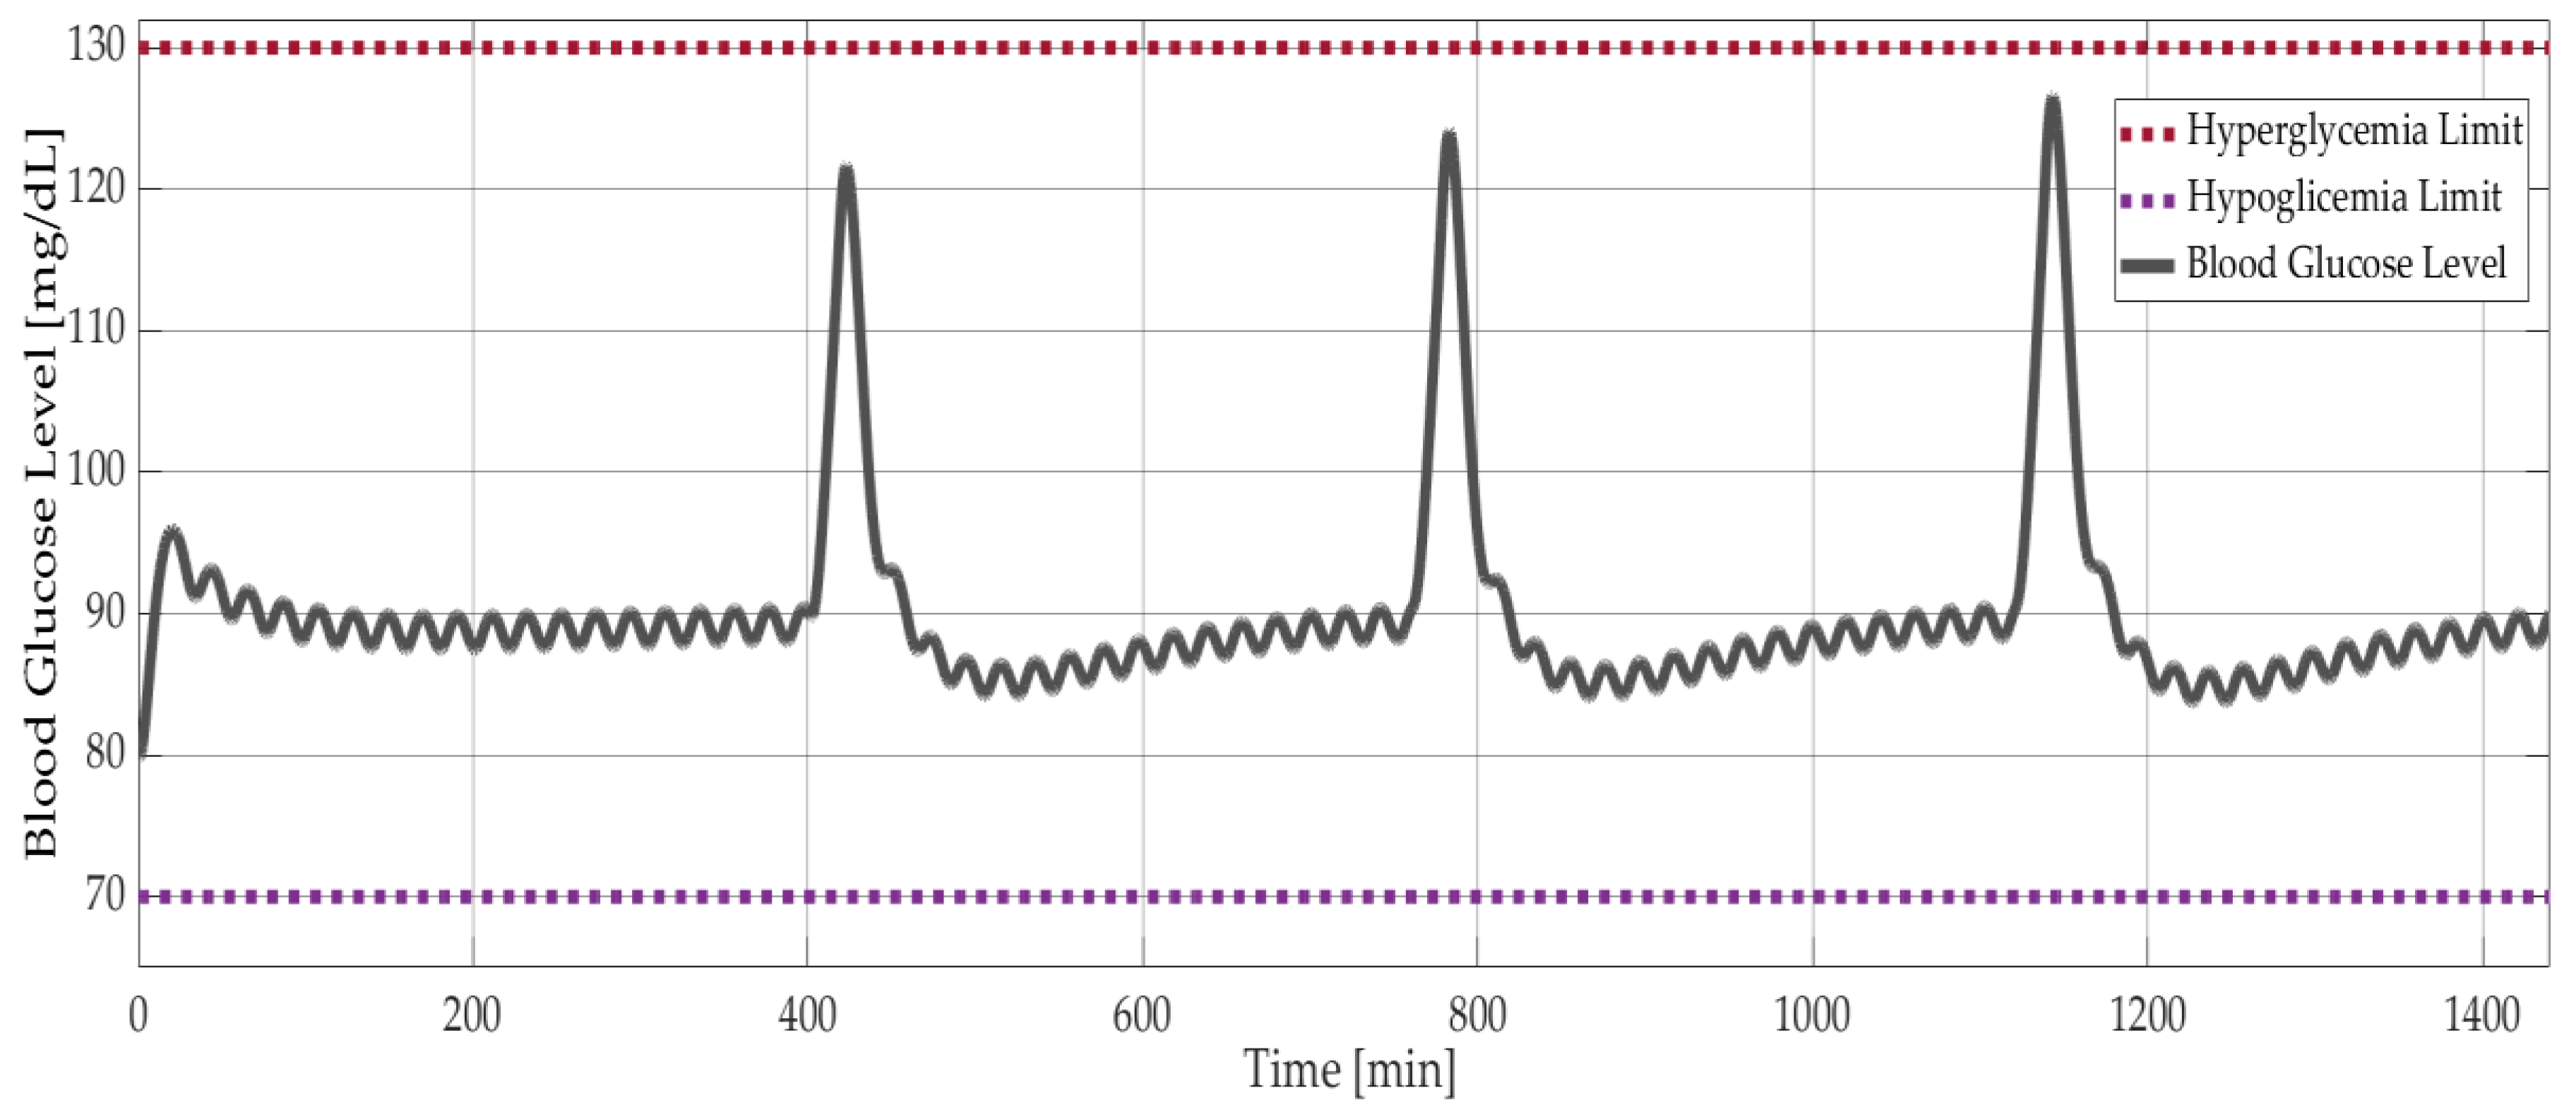
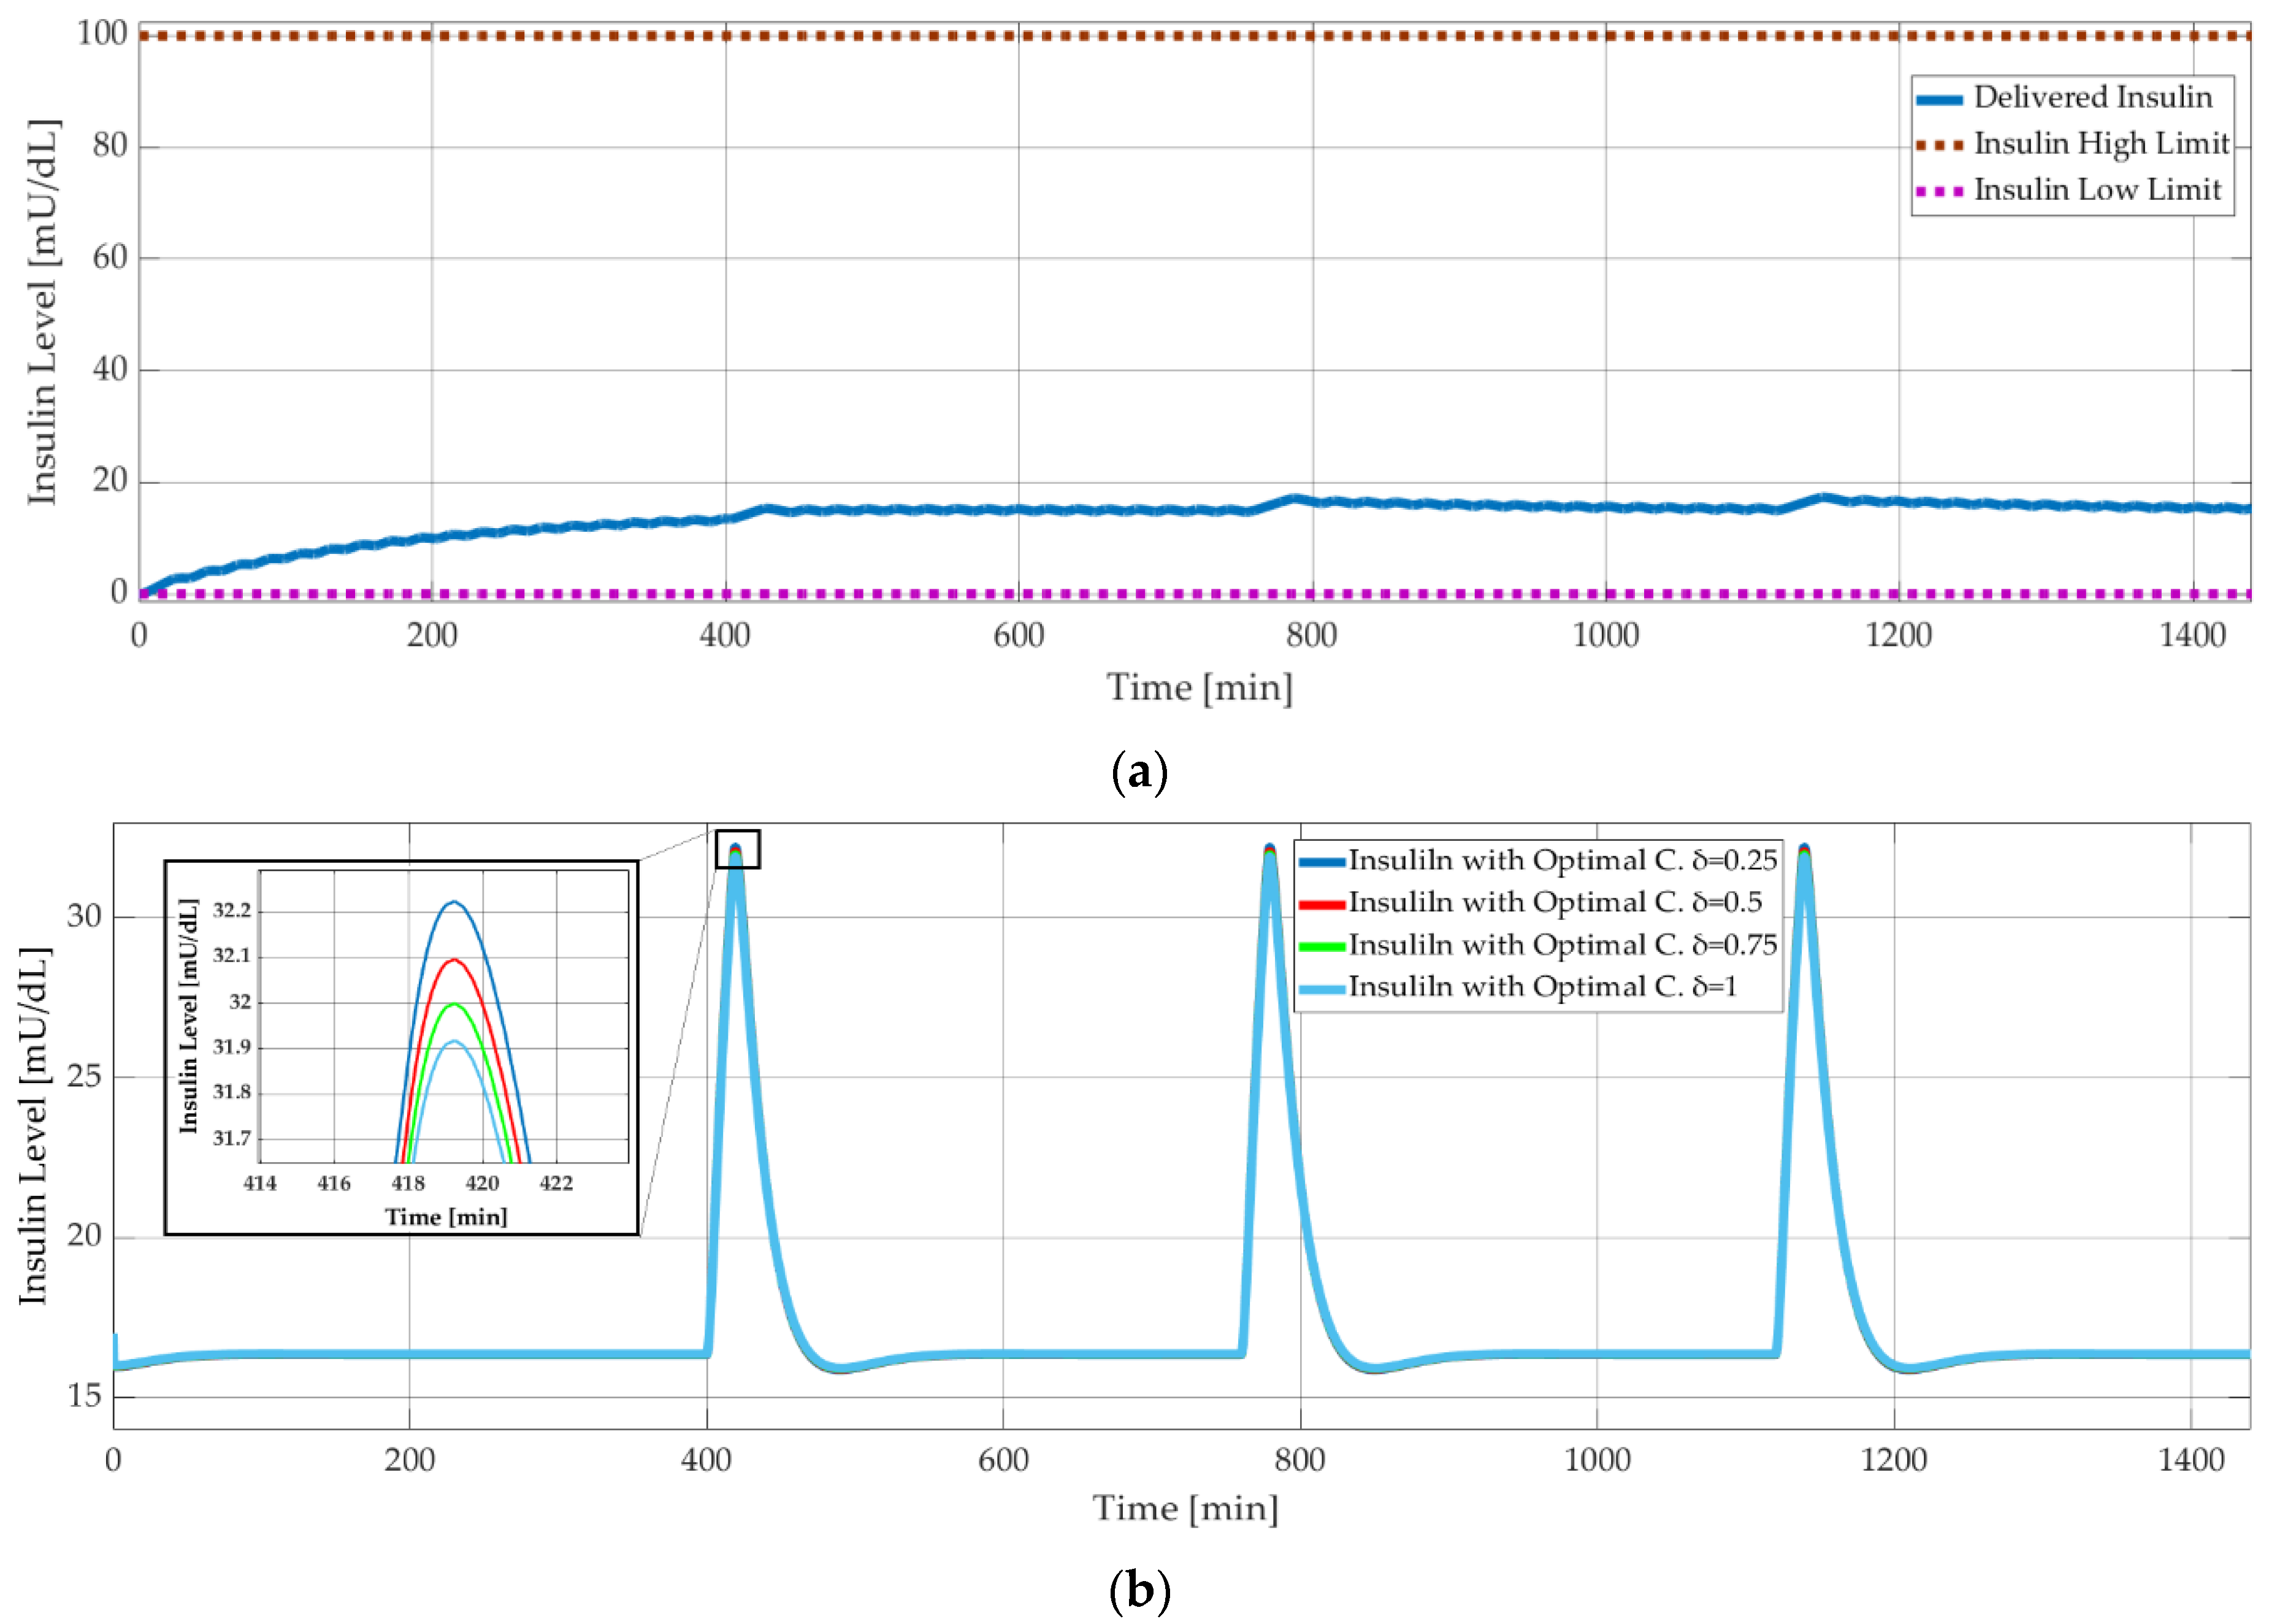
As explained in Section 1.4, the simpler models, Ackerman and Bergman, are used for controller design, whereas the comprehensive Sorensen model is used for validation. Figure 9 shows the results of model-based simulations with three meal disturbances at 400, 750, and 1150 minutes. The PID controller successfully maintained the blood glucose level of the Sorensen model at around 90 mg/dL (Figure 9) and kept the insulin level at 18 mU/dL (Figure 10a). On the other hand, the δ value of the optimal controller had a negligible effect on the insulin level. This was shown with the Bergman model, as seen in Figure 10b, where the insulin level decreased minimally with increasing δ. The corresponding difference between the glucose levels was smaller than 0.05 mg/dL.
6. Experimental Verification and Results
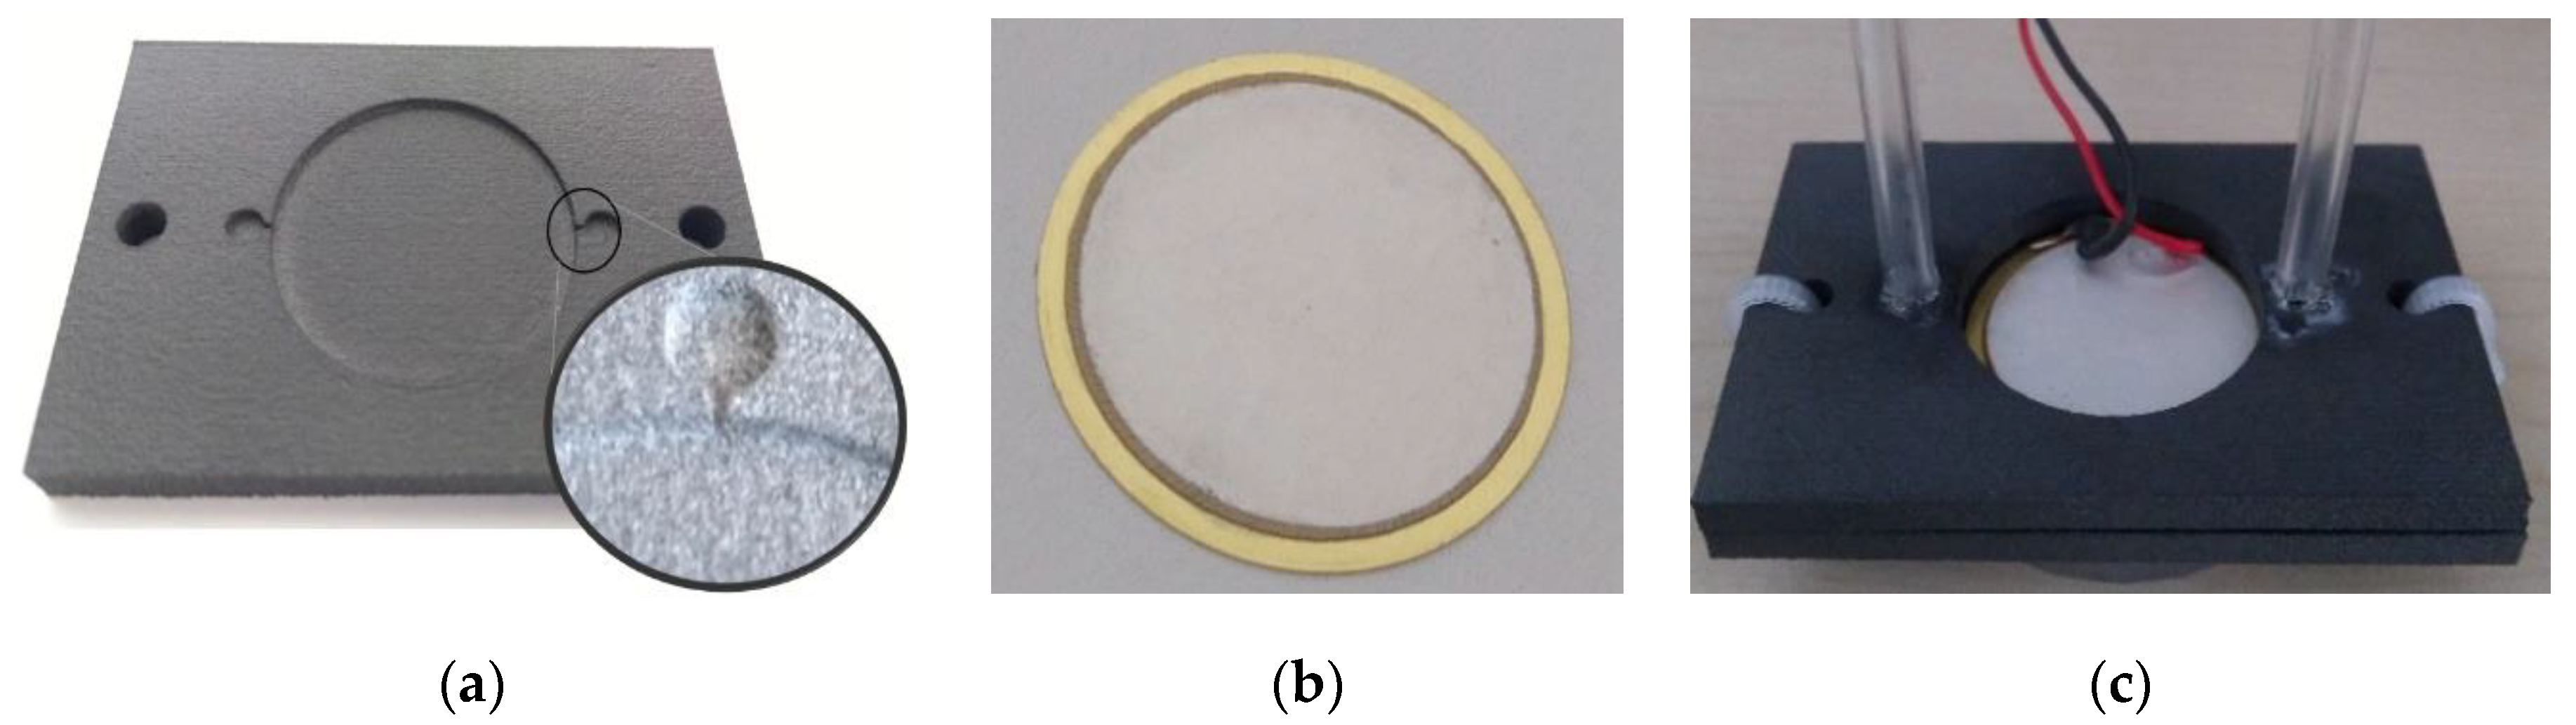
The prototype pump consisted of two 3D printed closures (Figure 11a) and the piezoelectric actuator (STEMinc SMBA27T05PP), as seen in Figure 11b. Wires of the actuator were soldered and then it was glued at the brass substrate and sealed between the closures. The sealing was tested with compressed air at 100 kPa. Plastic hoses with a 3 mm inner diameter were attached to the inlet and outlet of the pump, as shown in Figure 11c.
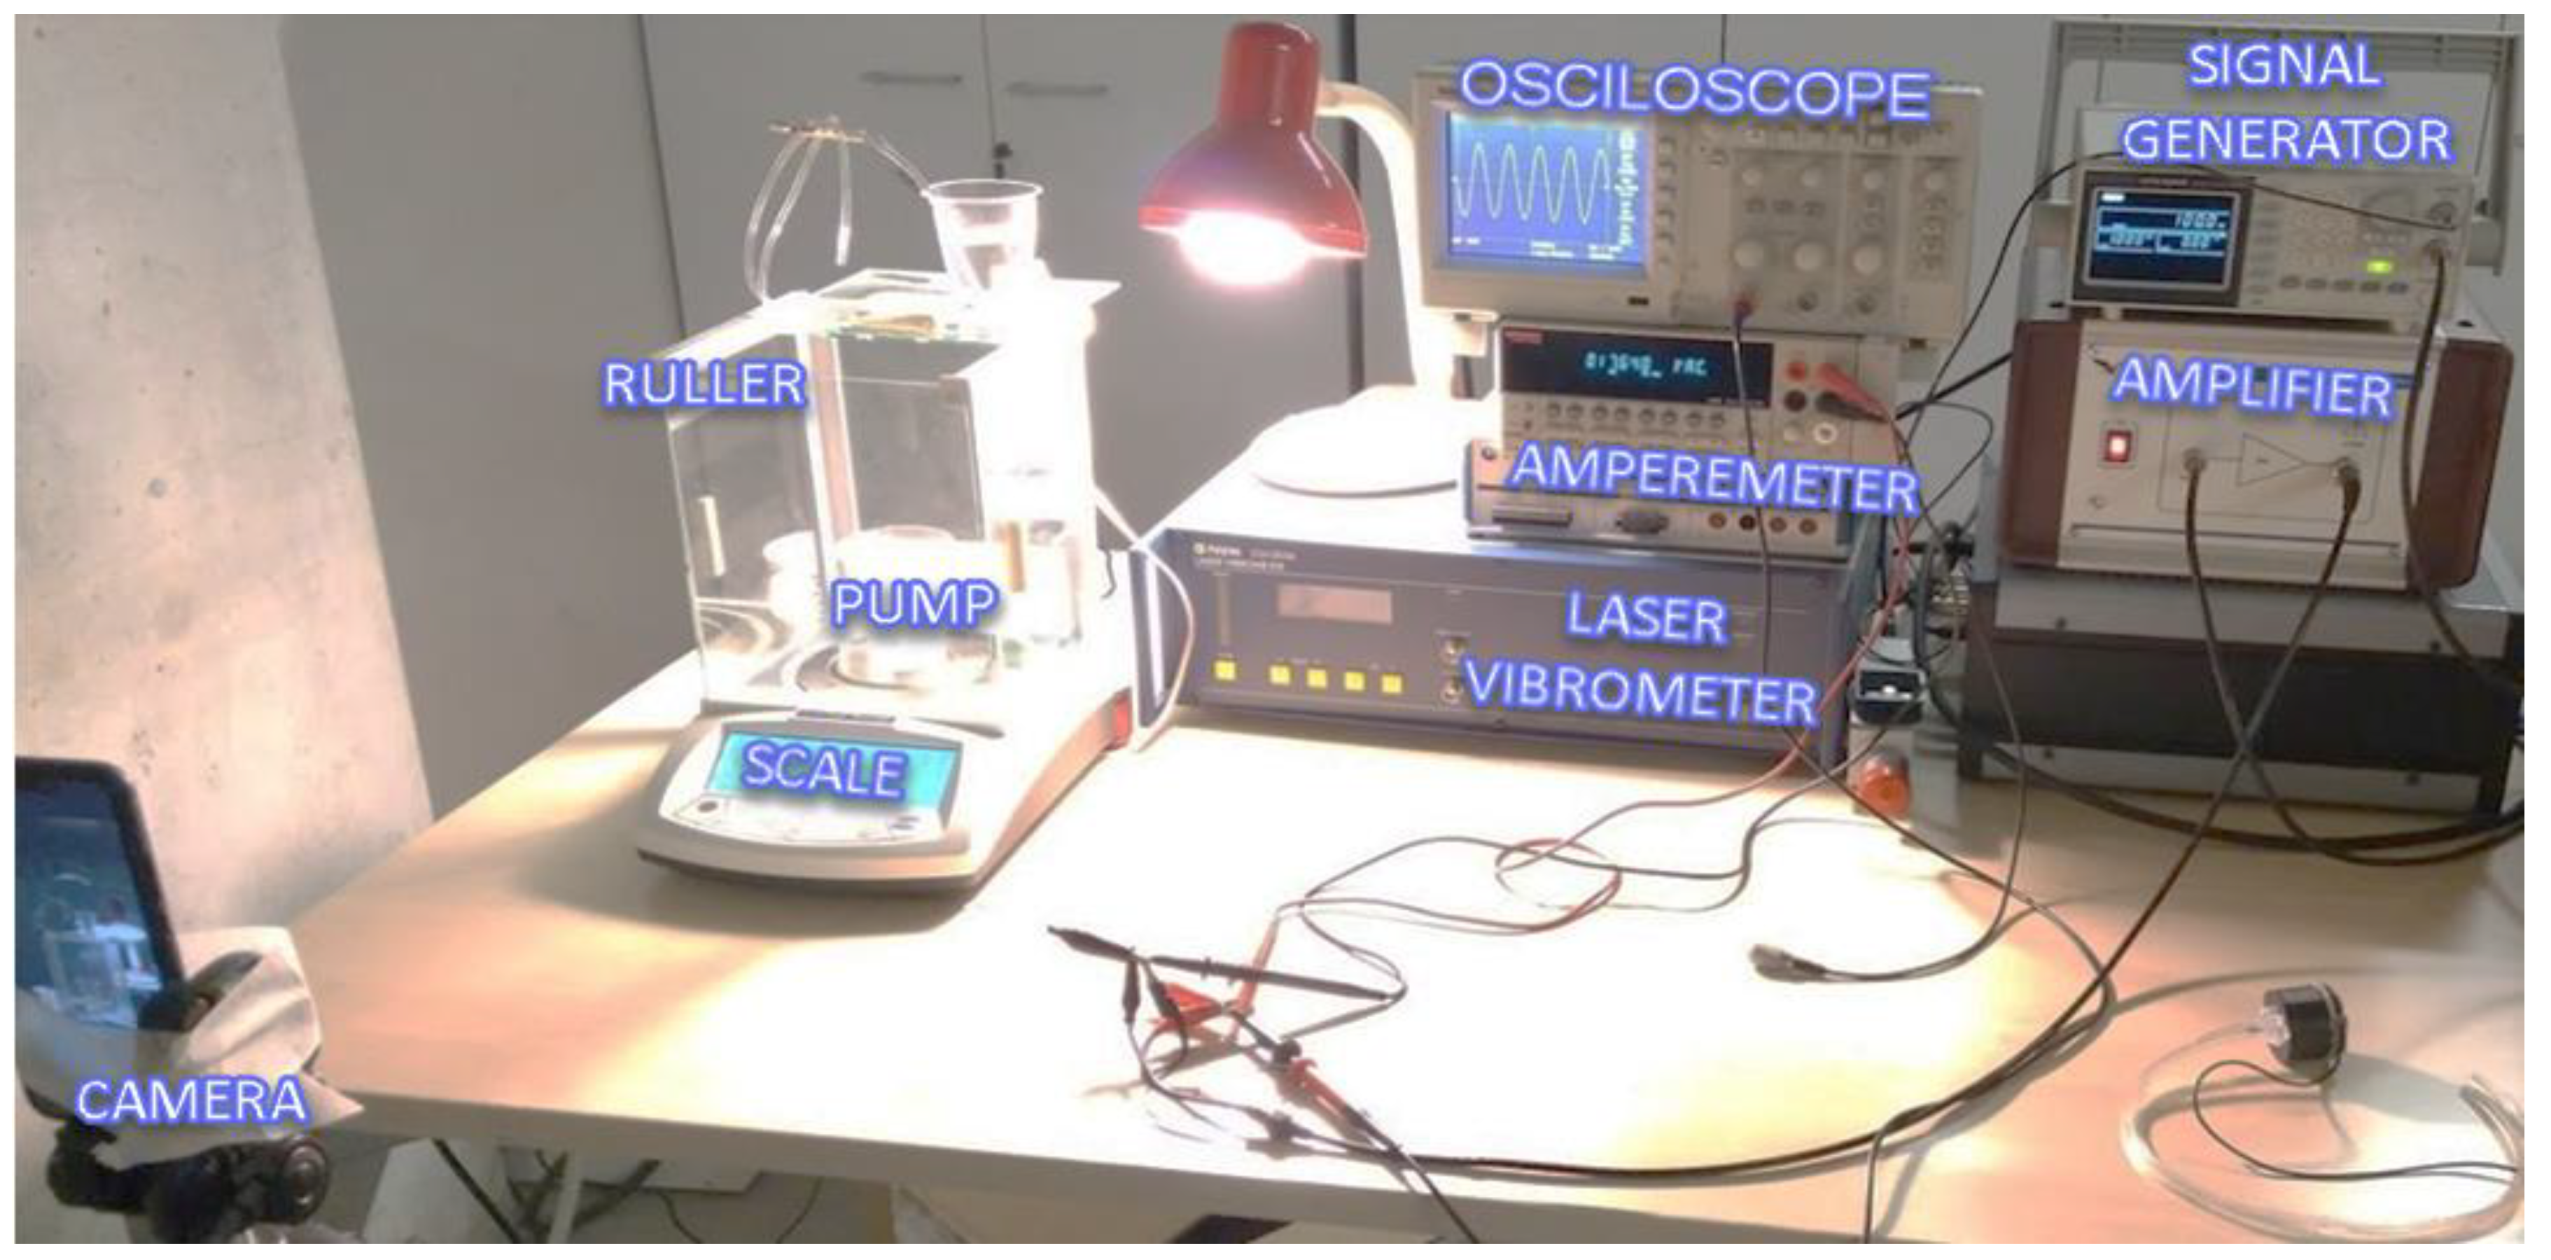
The test stand is shown in Figure 12. The signal generator could provide a 2 Vp-p sinus signal with an adjustable frequency between 1 Hz and 3 kHz. The amplitude could be increased up to 100 Vp-p at the Falco Systems WMA-300 amplifier. An amperemeter (Keithley 2000 Series Digital Multimeter) was connected in series between the amplifier and the pump to measure the electrical current. A Polytec CLV-2534 laser vibrometer measured the velocity of the piezoelectric actuator and displays on the oscilloscope.
Water was used to simulate insulin in the experiments. The hoses were attached side-by-side to a vertical ruler to ensure equal water level at the initial condition (i.e., 0 Pa boundary condition). A 100 Vp-p sinusoidal voltage with different frequencies was applied to the pump until the head difference reached 1 mm. The change in boundary conditions was ignored in this interval when calculating net flow rates.
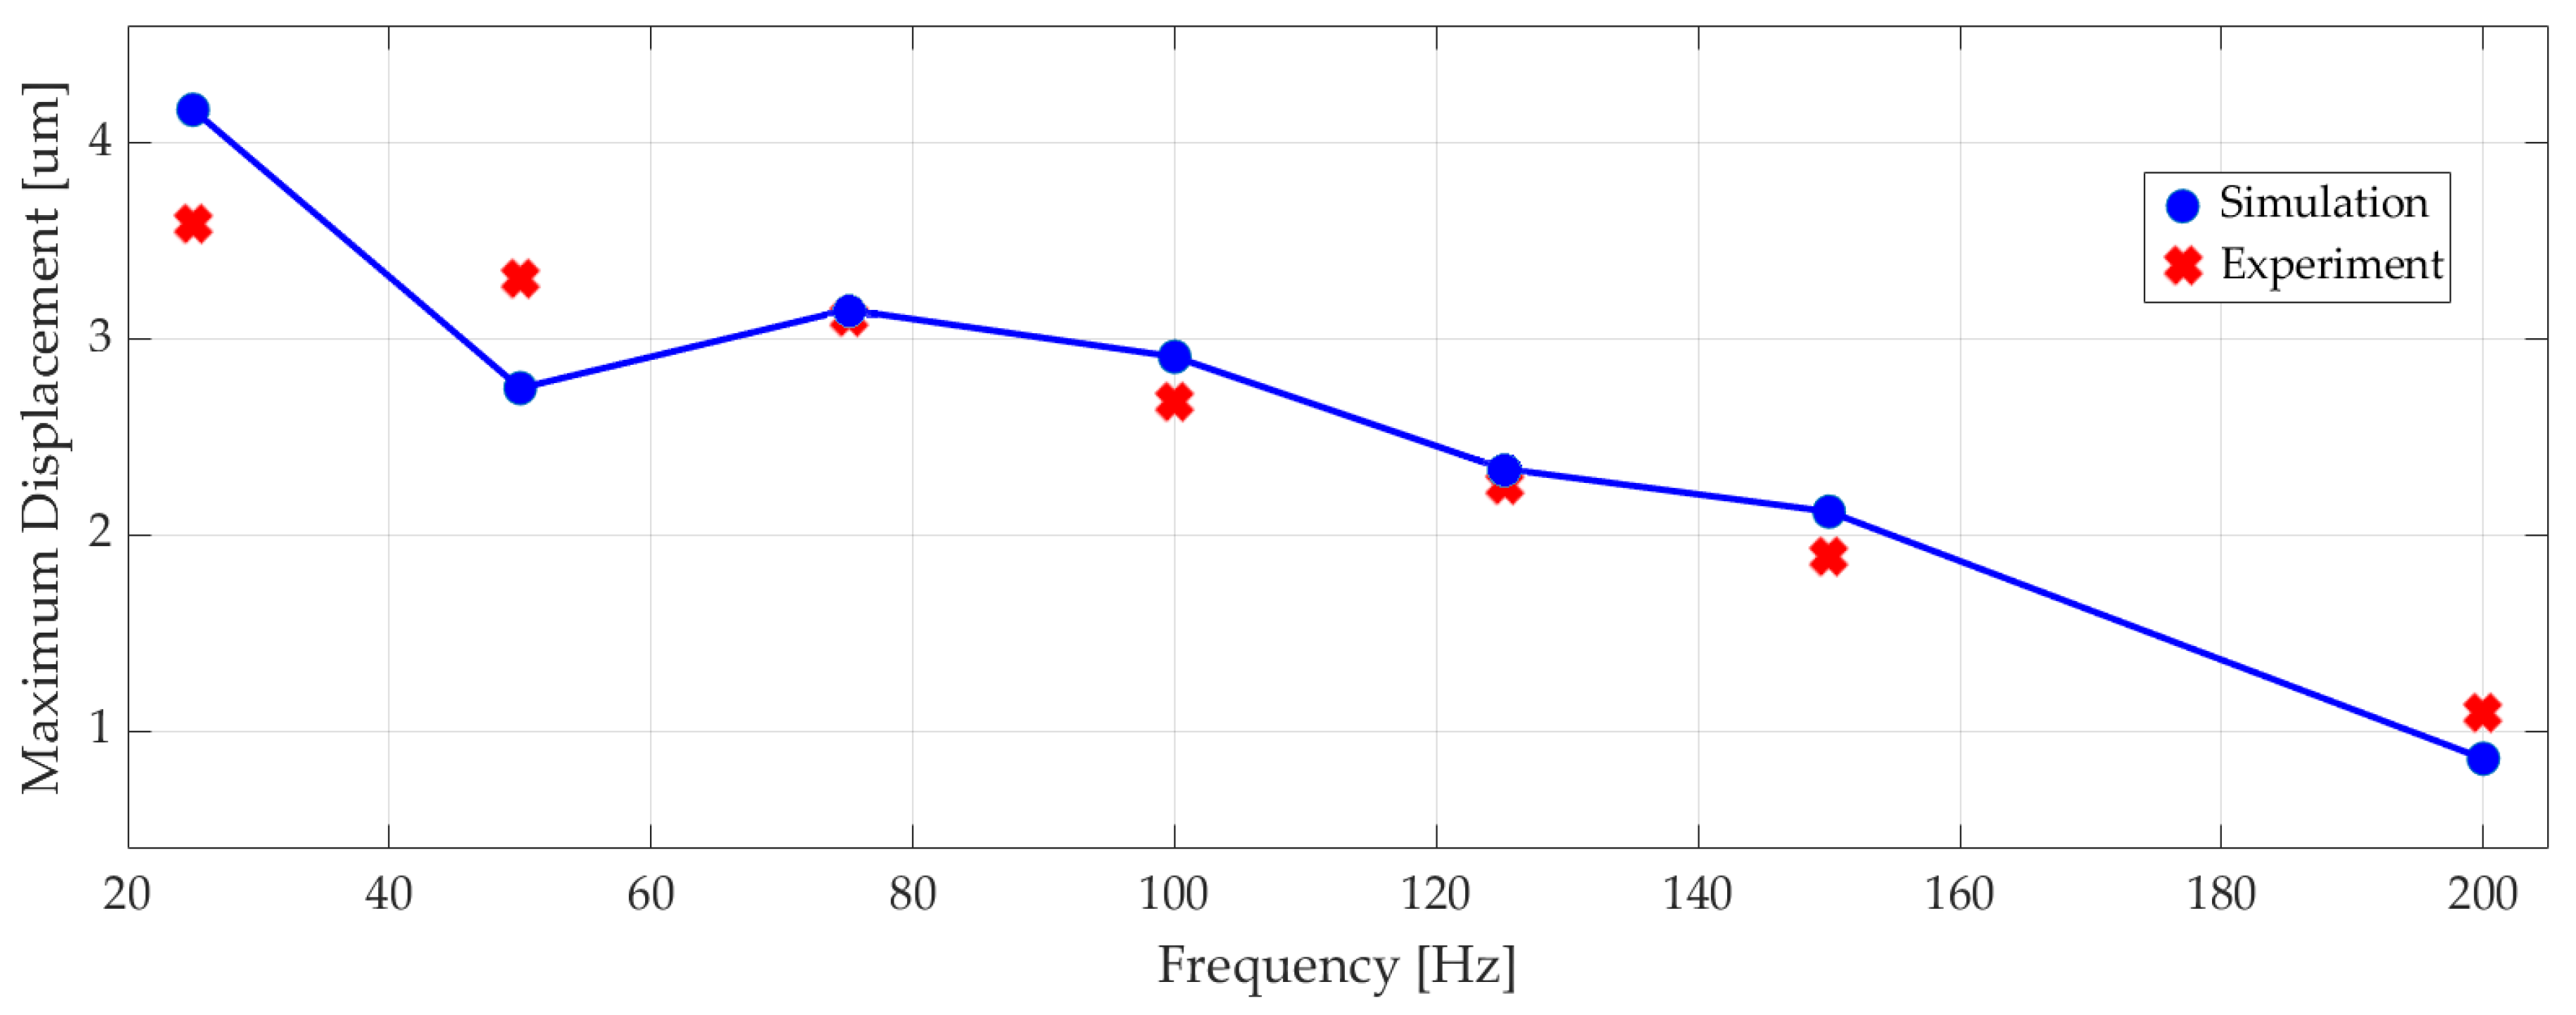
Figure 13 shows the measured maximum displacement of the actuator at different frequencies alongside the corresponding numerical results, since the differences between numerical simulation results and experiments were less than 10%.
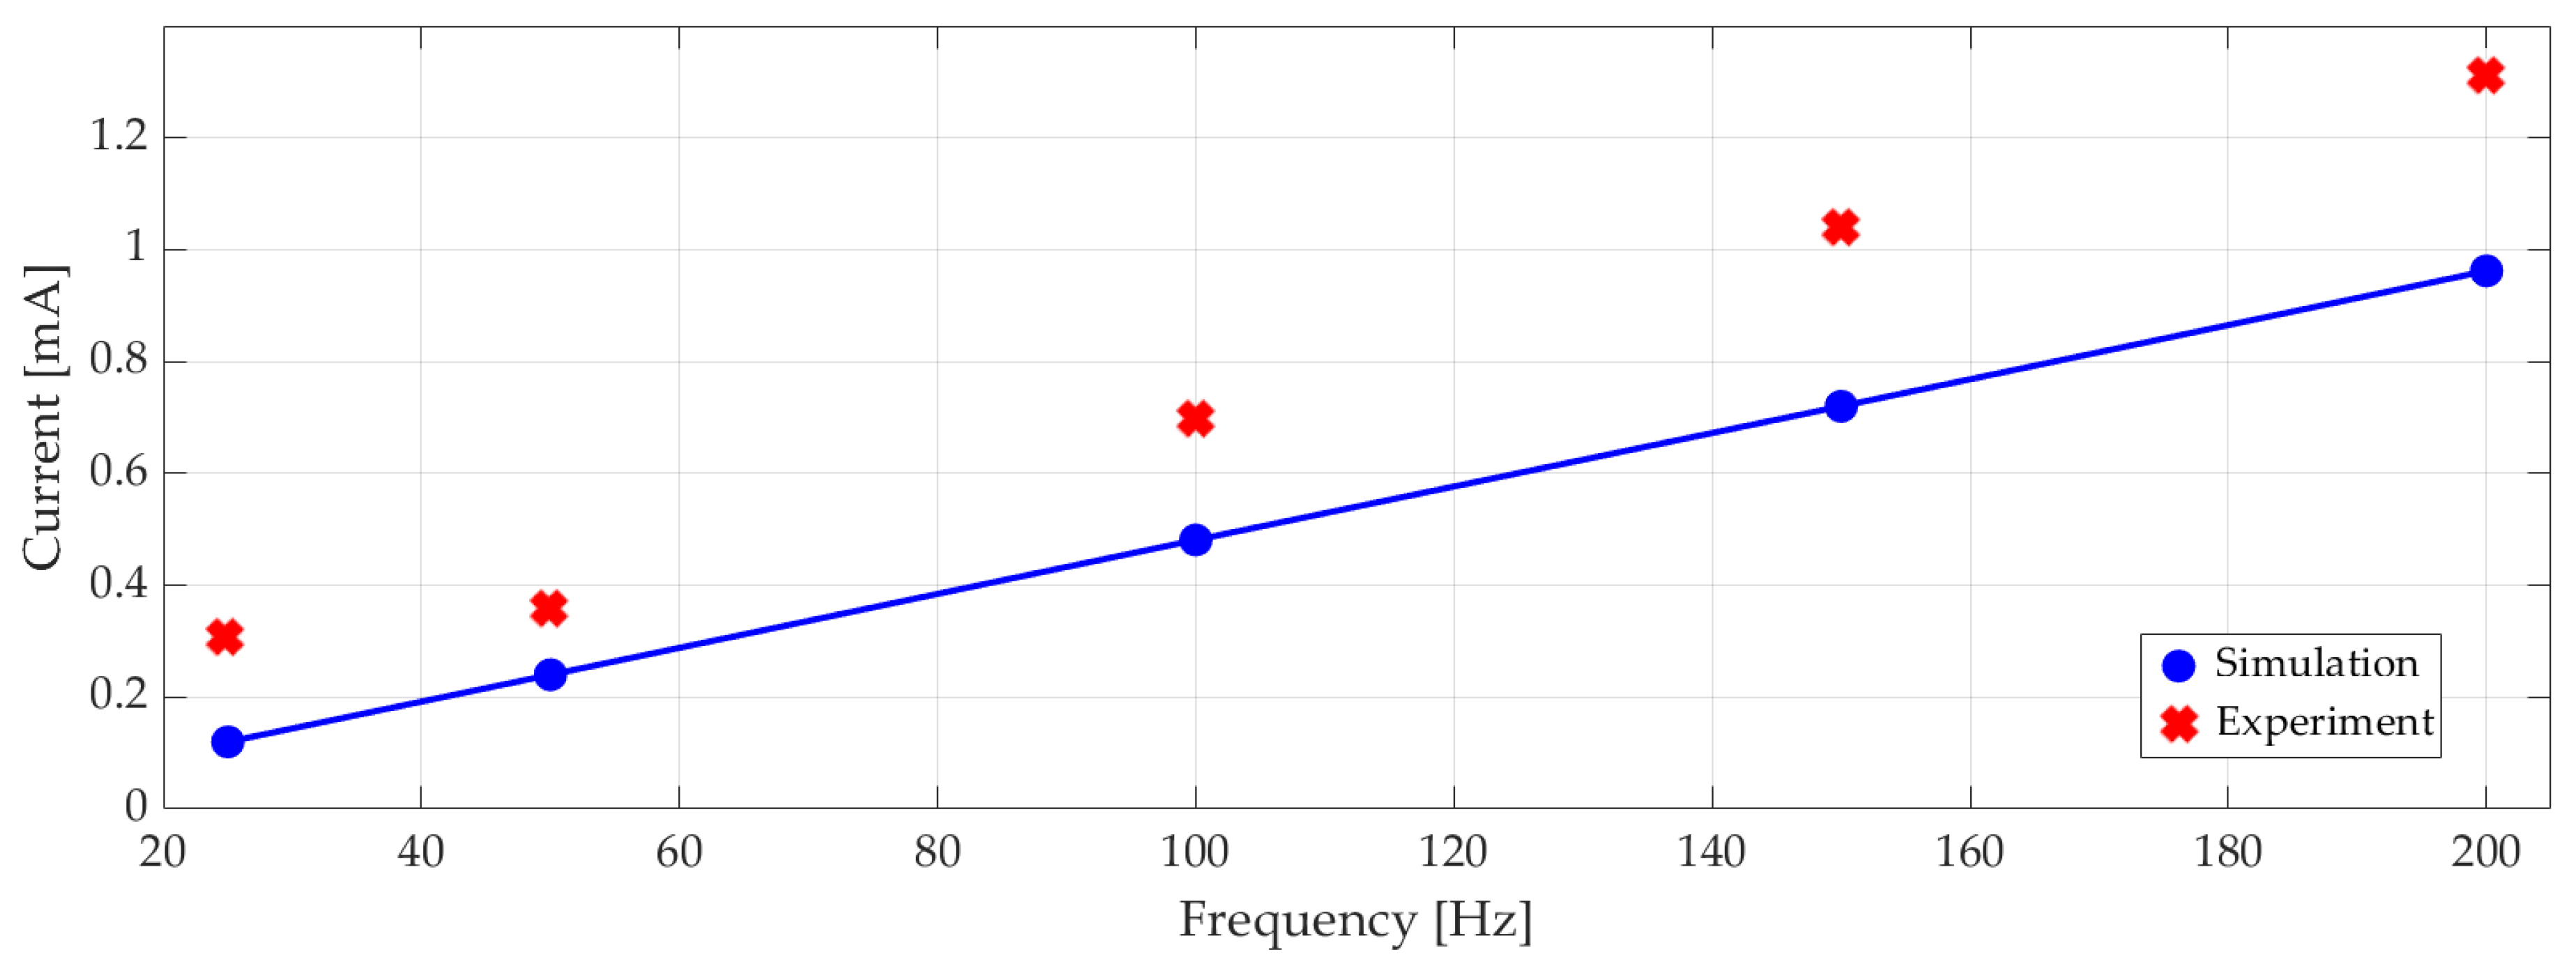
Measured RMS electrical current versus excitation frequency is plotted in Figure 14 with the corresponding numerical results. On average, the experiments showed 22% higher current draw than the simulations. At 100 Hz with 100 Vp-p 0.7 mA RMS current corresponded to 18 mW RMS power consumption.
7. Discussion and Future Work
In this paper, we demonstrated a novel artificial pancreas system with a valveless piezoelectric pump. Although the pump is mechanically simple, its design requires detailed analysis to ensure efficient operation. We optimized our design, based on high net flow rate and low power consumption objectives, by using numerical multi-physics simulations in COMSOL. Once satisfied, we derived a reduced-order mathematical model of the pump in MATLAB/Simulink for model-based closed-loop control of blood glucose level in T1DM. In these simulations, the pump supplies insulin to three commonly used insulin–glucose models, namely, Ackerman, Bergman, and Sorensen. It must be noted that these models have parameters of different T1DM patients. The input to the controllers is the difference between the target glucose level and measured blood glucose level of the patient. The reference value is given and the instantaneous value is the output of the insulin–glucose model. A standalone APS gets the instantaneous value from a sensor known as a continuous glucose monitor. Integrating a continuous glucose monitor model in our simulations is a part of future work.
The produced prototype includes two closures and a piezoelectric actuator. A multi-jet fusion 3D printer successfully printed the closures with embedded inlet and outlet nozzles, which require high precision. The piezoelectric actuator is selected due to availability and it consists of a PZT disk attached to a thin brass substrate. Although the PZT is lead-based, and potentially toxic, it is not exposed to insulin in our design since the brass side faces the chamber. Lead-free piezoelectric materials, such as alkaline niobates or bismuth titanate [39], are interesting alternatives for future work. Another option is to use a separating layer, like a non-toxic coating or diaphragm, between the actuator and the chamber.
The prototype pump does not include embedded electronics at this stage because it is experimented in a laboratory test setup. This enables us to test the pump with a range of inputs and to observe a multitude of outputs during development phase. A fully coupled simulation model of the APS is one of the major contributions of this work. Hence, the experiments serve as a basis and validation for the development of the simulation model as well as the pump. The main drawback of the existing test setup is the lack of an accurate flow sensor. Because of this, instead of measuring the net flow rate we measured the maximum displacement of the actuator and compared with the simulations to find that the values are within 10% of each other at the experimented frequencies. This discrepancy can be extended to net flow rate, but supporting this with experimental proof is our first priority in future work.
In the literature, there are several studies [13,30] that investigate the dynamics of valveless piezoelectric pumps. Our contribution here is that we coupled the piezoelectric pump dynamics with three types of well-known glucose–insulin models. Furthermore, we applied PID and optimal controllers on the blood glucose level control problem. For blood glucose level control with an APS, it is crucial to show that the proposed pump can deliver insulin with the flow rates required by the blood glucose controller. The Ackerman’s and Bergman’s glucose–insulin models are relatively simple so that they are used for the design of optimal and PID controllers, respectively. The comprehensive Sorensen model is used for performance assessment in model-based simulations. Because of its complexity, the Sorensen model requires more computational power and time. This issue must be considered when electing an embedded controller for a standalone APS.
We showed with analysis and experiment that a valveless piezoelectric pump is significantly more energy-efficient compared to a syringe pump, which is typically used in APS applications. Both the numerical and experimental studies of the proposed pump predicted a power requirement of nearly 20 mW for a flow rate in the range of 200–300 µL/min. A commercial syringe pump’s technical specification document states that almost 5 W is required for pumping (additional power requirement on top of the standby condition of the pump) [40]. Such orders of magnitude decreases in the power requirement are essential for APS applications where portability and battery life considerations are crucial.
Author Contributions
Conceptualization, A.K. and M.B.Ö.; methodology, A.K., Y.T., and M.B.Ö.; mathematical modeling, A.K.; numerical implementation, A.K.; writing—original draft preparation, A.K.; writing—review and editing, M.B.Ö. and Y.T. All authors have read and agreed to the published version of the manuscript.
Funding
This research received no external funding.
Conflicts of Interest
The authors declare no conflict of interest.
References
- Ntaganda, J.M.; Minani, F.; Banzi, W.; Mpinganzima, L.; Niyobuhungiro, J.; Gahutu, J.B.; Rutaganda, E.; Kambutse, I.; Dusabejambo, V. Simplified mathematical model of glucose-insulin system. Am. J. Comput. Math. 2018, 8, 233–244. [Google Scholar] [CrossRef] [Green Version]
- Saleem, M.U.; Farman, M.; Meraj, M.A. Stability analysis of sorensen’s model for controllability and observability. Proc. Pak. Acad. Sci. Part B 2017, 54, 133–145. [Google Scholar]
- IDF. IDF Diabetes Atlas, 9th ed.; IDF: Brussels, Belgium, 2019. [Google Scholar]
- Kovacs, L.; Kulcsar, B.; Bokor, J.; Benyo, Z. Model-based nonlinear optimal blood glucose control of Type I diabetes patients. In Proceedings of the 2008 30th Annual International Conference of the IEEE Engineering in Medicine and Biology Society, Vancouver, BC, Canada, 20–25 August 2008; pp. 1607–1610. [Google Scholar] [CrossRef]
- Lunze, -I.K.; Singh, T.; Walter, M.; Brendel, M.D.; Leonhardt, S. Blood glucose control algorithms for type 1 diabetic patients: A methodological review. Biomed. Signal Process. Control 2013, 8, 107–119. [Google Scholar] [CrossRef]
- Nath, A.; Biradar, S.; Balan, A.; Dey, R.; Padhi, R. Physiological models and control for type 1 diabetes mellitus: A brief review. IFAC PapersOnLine 2018, 51, 289–294. [Google Scholar] [CrossRef]
- MiniMedTM 670G Insulin Pump System. Available online: https://www.medtronicdiabetes.com/products/minimed-670g-insulin-pump-system (accessed on 1 June 2020).
- Beta Bionics: Introducing the iLet. Available online: http://www.betabionics.com/ (accessed on 1 June 2020).
- T:slim X2 Insulin Pump w/ Dexcom G6 CGM. Available online: https://www.tandemdiabetes.com/products/t-slim-x2-insulin-pump (accessed on 1 June 2020).
- Jung, B.; Seo, K.-S.; Kwon, S.J.; Lee, K.; Hong, S.; Seo, H.; Kim, G.-Y.; Park, G.-M.; Jeong, J.; Seo, S.W. Efficacy evaluation of syringe pump developed for continuous drug infusion. J. Dent. Anesthesia Pain Med. 2016, 16, 303–307. [Google Scholar] [CrossRef]
- Yang, J. An Introduction to the Theory of Piezoelectricity; Kluwer Academic Publishers: Boston, MA, USA, 2005; Volume 9. [Google Scholar]
- Lumentut, M.; Friswell, M.I. A smart pipe energy harvester excited by fluid flow and base excitation. Acta Mech. 2018, 229, 4431–4458. [Google Scholar] [CrossRef] [Green Version]
- Singh, S.; Kumar, N.; George, D.; Sen, A.K. Analytical modeling, simulations and experimental studies of a PZT actuated planar valveless PDMS micropump. Sens. Actuators A Phys. 2015, 225, 81–94. [Google Scholar] [CrossRef]
- Khalilian, S. Development of a Low Cost Micro-Pump. Master’s Thesis, University of Calgary, Calgary, AB, Canada, 2012; pp. 1–185. [Google Scholar] [CrossRef]
- Atul, S.T.; Lenin Babu, M.C. Characterization of valveless micropump for drug delivery by using piezoelectric effect. In Proceedings of the 2016 International Conference on Advances in Computing, Communications and Informatics (ICACCI), Jaipur, India, 21–24 September 2016; pp. 2138–2144. [Google Scholar] [CrossRef]
- Laser, D.J.; Santiago, J.G. A review of micropumps. J. Micromech. Microeng. 2004, 14, R35–R64. [Google Scholar] [CrossRef]
- Nisar, A.; Afzulpurkar, N.; Tuantranont, A.; Mahaisavariya, B. Three dimensional transient multifield analysis of a piezoelectric micropump for drug delivery system for treatment of hemodynamic dysfunctions. Cardiovasc. Eng. 2008, 8, 203–218. [Google Scholar] [CrossRef]
- Yipintsoi, T.; Gatewood, L.C.; Ackerman, E.; Spivak, P.L.; Molnar, G.D.; Rosevear, J.W.; Service, F.J. Mathematical analysis of blood glucose and plasma insulin responses to insulin infusion in healthy and diabetic subjects. Comput. Boil. Med. 1973, 3, 71–78. [Google Scholar] [CrossRef]
- Chee, F.; Fernando, T. Closed-Loop Control of Blood Glucose; Springer: Berlin/Heidelberg, Germany, 2007; Volume 368. [Google Scholar]
- Ceresa, F.; Ghemi, F.; Martini, P.F.; Martino, P.; Segre, G.; Vitelli, A. Control of blood glucose in normal and in diabetic subjects: Studies by compartmental analysis and digital computer technics. Diabetes 1968, 17, 570–578. [Google Scholar] [CrossRef]
- Bergman, R.N.; Phillips, L.S.; Cobelli, C. Physiologic evaluation of factors controlling glucose tolerance in man: Measurement of insulin sensitivity and beta-cell glucose sensitivity from the response to Intravenous glucose. J. Clin. Investig. 1981, 68, 1456–1467. [Google Scholar] [CrossRef] [PubMed] [Green Version]
- Roy, A.; Parker, R.S. Dynamic modeling of exercise effects on plasma glucose and insulin levels. J. Diabetes Sci. Technol. 2007, 1, 338–347. [Google Scholar] [CrossRef] [PubMed] [Green Version]
- Furler, S.M.; Kraegen, E.W.; Smallwood, R.H.; Chisholm, D. Blood glucose control by intermittent loop closure in the basal mode: Computer simulation studies with a diabetic model. Diabetes Care 1985, 8, 553–561. [Google Scholar] [CrossRef] [PubMed]
- Sorensen, J.T. A Physiologic Model of Glucose Metabolism in Man and Its Use to Design and Assess Improved Insulin Therapies for Diabetes. Ph.D. Thesis, University of California, Berkeley, CA, USA, 1985; p. 557. [Google Scholar]
- Cobelli, C.; Mari, A. Control of diabetes with artificial systems for insulin delivery algorithm independent limitations revealed by a modeling study. IEEE Trans. Biomed. Eng. 1985, 32, 840–845. [Google Scholar] [CrossRef]
- Hovorka, R.; Shojaee-Moradie, F.; Carroll, P.V.; Chassin, L.J.; Gowrie, I.J.; Jackson, N.C.; Tudor, R.S.; Umpleby, A.M.; Jones, R.H. Partitioning glucose distribution/transport, disposal, and endogenous production during IVGTT. Am. J. Physiol. Metab. 2002, 282, E992–E1007. [Google Scholar] [CrossRef] [Green Version]
- Kaçar, A.; Özer, M.B.; Taşcıoğlu, Y. Piezoelectric actuated insulin pump simulation model and controller design. In Proceedings of the 8th International Conference, ICAT’19, Sarajevo, Bosnia and Herzegovina, 26–30 August 2019; pp. 351–356. [Google Scholar]
- Chandrasekaran, A.; Packirisamy, M. Improved efficiency of microdiffuser through geometry tuning for valveless micropumps. J. Fluids Eng. 2015, 138, 031101. [Google Scholar] [CrossRef]
- Nguyen, A.V.; Huang, X. Miniature valveless pumps based on printed circuit board technique. Sens. Actuators A Phys. 2001, 88, 104–111. [Google Scholar] [CrossRef]
- Gidde, R.R.; Pawar, P.M.; Dhamgaye, V.P. Fully coupled modeling and design of a piezoelectric actuation based valveless micropump for drug delivery application. Microsyst. Technol. 2019, 26, 633–645. [Google Scholar] [CrossRef]
- Hariri, A.; Wang, L.Y. Observer-based state feedback for enhanced insulin control of type ‘I’ diabetic patients. Open Biomed. Eng. J. 2011, 5, 98–109. [Google Scholar] [CrossRef] [Green Version]
- Swan, G.W. An optimal control model of diabetes mellitus. Bull. Math. Biol. 1982, 44, 793–808. [Google Scholar] [CrossRef]
- Acikgoz, S.U.; Diwekar, U.M. Blood glucose regulation with stochastic optimal control for insulin-dependent diabetic patients. Chem. Eng. Sci. 2010, 65, 1227–1236. [Google Scholar] [CrossRef]
- COMSOL: Multiphysics Software for Optimizing Designs. Available online: https://www.comsol.com/ (accessed on 1 June 2020).
- Piezo Round Bimorph Actuator for Pumps 27 × 0.5mm. Available online: https://www.steminc.com/PZT/en/piezo-round-bimorph-actuator-for-pumps-27x05mm (accessed on 1 June 2020).
- Schmandt, B.; Herwig, H. Diffuser and nozzle design optimization by entropy generation minimization. Entropy 2011, 13, 1380–1402. [Google Scholar] [CrossRef]
- Ben Mansour, R.; Sahin, A.Z. Optimization of conical micro-diffusers and micro-nozzles considering entropy generation. Arab. J. Sci. Eng. 2012, 38, 3161–3170. [Google Scholar] [CrossRef] [Green Version]
- Laxminarayan, S.; Reifman, J.; Steil, G.M. Use of a food and drug administration-approved type 1 Diabetes mellitus simulator to evaluate and optimize a proportional-integral-derivative controller. J. Diabetes Sci. Technol. 2012, 6, 1401–1412. [Google Scholar] [CrossRef]
- Maeder, M.D.; Damjanovic, D.; Setter, N. Lead free piezoelectric materials. J. Electroceram. 2004, 13, 385–392. [Google Scholar] [CrossRef]
- SPETEC—Syringe Pump Symax. Available online: https://www.spetec.de/en/products/laboratory-equipment/syringe-pumps/syringe-pump-symax (accessed on 1 June 2020).
Figure 1.
Working principle of valveless piezoelectric pump illustration: (a) pumping mode; (b) suctioning mode.
Figure 1.
Working principle of valveless piezoelectric pump illustration: (a) pumping mode; (b) suctioning mode.

Figure 2.
Geometry and dimensions.

Figure 3.
(a) Displacement of the piezoelectric actuator at pumping mode, (b) suction mode, (c) inlet velocity illustration, (d) outlet velocity illustration at the same time, (e) velocity field streamlines, (f) cell Reynold’s number.
Figure 3.
(a) Displacement of the piezoelectric actuator at pumping mode, (b) suction mode, (c) inlet velocity illustration, (d) outlet velocity illustration at the same time, (e) velocity field streamlines, (f) cell Reynold’s number.

Figure 4.
Numerical simulation results for net flow rate versus (a) chamber height; (b) length of nozzle/diffuser, (c) divergence angle.
Figure 4.
Numerical simulation results for net flow rate versus (a) chamber height; (b) length of nozzle/diffuser, (c) divergence angle.

Figure 5.
Numerical simulations of net flow rate versus voltage and frequency.

Figure 6.
Power consumption of the pump with time for 100 Vp-p, 100 Hz, 150 Hz, and 200 Hz.

Figure 7.
Numerical simulation results of inlet, outlet, and net flow rate of the piezoelectric pump.
Figure 7.
Numerical simulation results of inlet, outlet, and net flow rate of the piezoelectric pump.

Figure 8.
Overview of the closed-loop control simulations.

Figure 9.
Model-based simulation results: Blood glucose level versus time with PID controlled Sorensen model.
Figure 9.
Model-based simulation results: Blood glucose level versus time with PID controlled Sorensen model.

Figure 10.
Model-based simulation results: (a) insulin level versus time with PID controlled Sorensen model; (b) insulin level versus time with optimal controlled Bergman model.
Figure 10.
Model-based simulation results: (a) insulin level versus time with PID controlled Sorensen model; (b) insulin level versus time with optimal controlled Bergman model.

Figure 11.
Pump prototype: (a) 3D printed bottom closure, (b) the piezoelectric actuator, (c) assembled and sealed pump.
Figure 11.
Pump prototype: (a) 3D printed bottom closure, (b) the piezoelectric actuator, (c) assembled and sealed pump.

Figure 12.
Experiment setup and architecture.

Figure 13.
The experimental and simulated maximum displacement of the piezoelectric actuator at different excitation frequencies.
Figure 13.
The experimental and simulated maximum displacement of the piezoelectric actuator at different excitation frequencies.

Figure 14.
Experimental and simulated electrical current (RMS) at different excitation frequencies.


| Material/Dimensions | Parameter | Value | Unit |
|---|---|---|---|
| PZT-5J | Density | 7800 | kg/m3 |
| Diameter (Dp): 25 mm Thickness (tp): 0.4 mm | Elasticity matrix | N/m2 | |
| Chamber Dimensions: Inlet/Outlet Diameter (Dout): 3 mm Nozzle Small Radius (rd): 50 µm | Piezoelectric Coupling Matrix | C/m2 | |
| Nozzle Big Radius (Rd): 0.25 mm (Initial) Chamber Height (mu): 0.5 mm (Initial) | Permittivity , where | 1 | |
| Nozzle Length (L): 0.5 mm (Initial) | Damping (Isotropic Loss Factor) ηs | 0.02 | 1 |
| Divergence Angle (θ): 11° (Initial) | Dielectric Loss (Isotropic Loss Factor) for Electrical Permittivity | 0.02 | 1 |
| Brass | Density | 8500 | kg/m3 |
| Diameter (Dc): 27 mm | Young modulus | 90,000 | MPa |
| Thickness(tb): 0.2 mm | Poisson’s ratio | 0.32 | 1 |
| Insulin | Density | 997 | kg/m3 |
| Kinematic viscosity | 0.0014 | kg/m.s |
© 2020 by the authors. Licensee MDPI, Basel, Switzerland. This article is an open access article distributed under the terms and conditions of the Creative Commons Attribution (CC BY) license (http://creativecommons.org/licenses/by/4.0/).
Share and Cite
MDPI and ACS Style
Kaçar, A.; Özer, M.B.; Taşcıoğlu, Y. A Novel Artificial Pancreas: Energy Efficient Valveless Piezoelectric Actuated Closed-Loop Insulin Pump for T1DM. Appl. Sci. 2020, 10, 5294. https://doi.org/10.3390/app10155294
AMA Style
Kaçar A, Özer MB, Taşcıoğlu Y. A Novel Artificial Pancreas: Energy Efficient Valveless Piezoelectric Actuated Closed-Loop Insulin Pump for T1DM. Applied Sciences. 2020; 10(15):5294. https://doi.org/10.3390/app10155294
Chicago/Turabian StyleKaçar, Alp, Mehmet Bülent Özer, and Yiğit Taşcıoğlu. 2020. "A Novel Artificial Pancreas: Energy Efficient Valveless Piezoelectric Actuated Closed-Loop Insulin Pump for T1DM" Applied Sciences 10, no. 15: 5294. https://doi.org/10.3390/app10155294
Note that from the first issue of 2016, this journal uses article numbers instead of page numbers. See further details here.