Experimental and Numerical Simulation Study of the Vibration Properties of Thin Copper Films Bonded to FR4 Composite


1
Department of Mechanical Engineering, Umm Al-Qura University, Makkah 21955, Saudi Arabia
2
Departament d’Enginyeria Química, Universitat Rovira i Virgili, 43007 Tarragona, Spain
*
Authors to whom correspondence should be addressed.
Appl. Sci. 2020, 10(15), 5197; https://doi.org/10.3390/app10155197
Submission received: 5 July 2020
/
Revised: 24 July 2020
/
Accepted: 26 July 2020
/
Published: 28 July 2020
(This article belongs to the Special Issue Experimental Mechanics, Instrumentation and Metrology)
Abstract
:Featured Application
Hole and size effect on the vibration properties of thin copper films bounded to FR4 fiber epoxy laminates.
Abstract
Printed circuit boards constitute the basis of most electronic devices and are mainly fabricated of thin copper films bounded to fiber epoxy laminates, such as FR4. Vibrational stress can induce device failure, and hence, studies addressing their modal properties have important applications. In this paper, cantilever samples made of bare copper bounded to FR4 have been studied to analyze, for the first time, the vibration behavior of specimens with different aspect ratios, with and without central holes of different diameters. Natural frequencies and damping ratios were determined experimentally and analytically using a finite element method for four groups of samples with a very good correspondence between both methods. The fundamental resonance frequency of all the specimens was found to be less than 40 Hz and the influence of a central hole was not significant to affect the modal properties.
1. Introduction
Smart electronic devices used over the years mostly consist of printed circuit boards (PCBs) and micro-electromechanical systems (MEMS). These boards are mainly made of thin copper films bounded to fiber epoxy laminates, such as FR4. PCB board sizes can vary from about 2 cm to 50 cm and most commonly have a rectangular shape in the electronic industry [1]. When attached to a machine structure, circuit boards can undergo various vibrating forces. Statistics show that about 20% of airborne electronic equipment failures occur due to vibration factors [2]. Damage, or even total failure, can occur when shock and vibration produce high stress on substrate, components, and joints. The type of damage is dependent on the frequency and amplitude of bending moments and inertial loads imposed on the PCB structure [3]. Since the dynamic loading is very critical for electronic equipment, studies to analyze and isolate vibrations in these systems are very important. However, market pressure and shortened development stages have rendered reliability analysis gradually unaffordable and, hence, simulations based on failure physics have been proposed to test the reliability of circuit boards [4].
Modal analysis is the study of the dynamic characteristics of a system by evaluating natural frequencies and damping factors, among other dynamic parameters. This analysis is used to formulate a mathematical model that explains the dynamic behavior of the studied system and is an important tool to optimize the dynamic characteristics of structures and materials [5]. In the case of PCB boards and integrated circuits, their reliability depends, among other factors, on the possibility to endure vibration loads and impacts that can affect their performance. Modal analysis can thus be a very useful tool for engineers to reveal vulnerable areas and avoid premature failure [6,7,8].
Different studies have addressed the problem of determining the dynamic properties of PCB boards, using either experimental or analytical methods. In an early work, Cifuentes [9] determined the factors that play a critical role in the dynamic behavior of a PCB having three components of similar mass density. This author found that the first vibration mode should account for more than 90% of the mass of the structure and minor rearrangements of the components on the board cause major redistributions of the dynamic response towards higher modes. Aytekin and Ozguven [10] suggested an analytical model of a simply supported PCB with a component and studied the vibrating responses of the critical elements on a PCB for different design alternates. They found that a two-degree-of-freedom spring mass model can accurate predict the response to a random vibration profile and could be used in preliminary design stages. Ren et al. [11] performed modal analysis on a PCB, by the finite element method and successfully predicted the changes in natural frequencies associated to changing the board thicknesses. Nilesh et al. [12] determined the mechanical properties of a multi-layered PCB and validated their results using Ansys® and Sherlock® (Canonsburg, PA, USA; Gwynedd, PA, USA) computer software. They observed frequency changes by changing material properties such as the out-of-plane modulus (Ez), Poisson’s ratio, and shear modulus.
On the other hand, Veilleux [13] described various methods for reducing the destructive resonant amplitude of PCBs in electronic systems. He compared the effectiveness of isolation, extensional damping, and shear damping techniques with a standard printed circuit board. Veprik [14] solved vibration isolation problems in electronic boxes, by using a two-degree-of-freedom mass, spring, and damper system in order to minimize the dynamic response of internal sensitive components of the electronic platform. Recently, Prashant [15] has introduced the presence of connector, tray, and ribs as a boundary condition in a finite element model of a PCB. It was found that the presence of these elements should not be neglected when studying the vibration modes and the developed analysis can help in identifying optimal connector location in the design of PCB platforms. Other studies have addressed the presence of holes in different positions of the board that can affect the dynamic properties of the PCB [16,17].
Glass fiber reinforced epoxy resin (referred to commercially as FR-4) is the most common board material used in computers and communication equipment [18]. Studies on the mechanical properties of this composite material are thus of important, in order to estimate the reliability of FR-4-based PCBs. We have recently studied the essential work of fracture on copper/FR-4 specimens of different sizes using a double edge notched test with and without open holes of different diameters [19]. The tested composites behaved as quasi-brittle hybrid materials due to the anisotropy of the FR-4 support that is in part compensated by the isotropic copper layer. Hence, a hole size effect was found to decrease the strength by up to 15% for smaller size specimens.
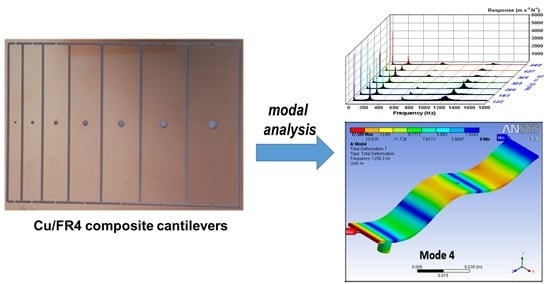
In this paper, a bare copper/FR-4 composite structure is considered, to study for the first time the size effect on the vibration behavior of samples with different aspect ratios, with and without central holes of different diameters. An experimental modal analysis tool is carried out to determine their dynamic properties and compared with finite element method (FEM) analytical results, in order to gain basic knowledge of the vibration characteristics of copper/FR-4 PCBs.
2. Materials and Methods
2.1. Materials
The specimens used in this study were made of single-layer Cu film (thickness 35 µm) bonded to FR4 epoxy laminate sheet (thickness 1.6 mm). The specimens were categorized into four groups, as shown in Table 1, Table 2, Table 3 and Table 4 and Figure 1. The specimens were cut from a 305-mm long and 210-mm wide panel to equal lengths of 150 mm, using a Protomat S103 (LPKF GmbH, Garbsen, Germany) circuit board plotter.
2.2. Experimental Vibration Analysis
Figure 1 shows a schematic diagram of the specimen under test and the experimental setup. An accelerometer type 4393 (Brüel & Kjær, Wien, Austria) with a charge amplifier type 2635 (Brüel & Kjær) was mounted below the specimen by using bees wax to measure vibrations excited by an Impact Hammer type 8206 (Brüel & Kjær) with a plastic tip at locations 1, 2, and 3 in Figure 1. Five hammer impacts were given at each location and the results were averaged to scale back the effect of noise within the acquired signal. A strong clamping structure was used to fix one end of the test specimen, while the other side was kept free to be considered as a cantilever, as shown in Figure 2.
The averaged vibration data was captured using a LAN XI type 3050-A-060 (Brüel & Kjær) hardware module (Figure S1). The data was then analyzed by PULSE LabShop V13.5.0 (Brüel & Kjær) to determine the dynamic properties such as natural frequencies, mode shapes, and damping ratios by extracting information from frequency response function (FRF) curves. The damping ratios were calculated by the PULSE LabShop using the Half Power Band Width method [20]. To validate the experimental data, the natural frequencies of a rectangular beam of 150 mm × 24 mm × 1.6 mm and a plate of 150 mm × 48 mm × 1.6 mm were calculated using the Rayleigh method [1]. According to this method, the natural frequency (fn) of a uniform composite rectangular cantilever beam is:
where C is the modal constant (0.56 [1]), EI is the composite beam stiffness factor for FR4 (1.45 × 10⁻² kg⋅m2, g is the acceleration of gravity (9.81 m/s2), w is the linear mass density for FR4 (0.1169 kg/m), and L is the length of the composite beam (130 mm).
2.3. Theoretical Model
The natural frequency of a uniform rectangular cantilever plate is:
where C is the modal constant (0.56 [1]), a is the length of the plate (130 mm), D is the plate stiffness factor for FR4 (5110 kg⋅m), and ρ is the mass per unit area (5.64 × 10⁻⁵ kg⋅s2⋅m−3).
Since the Young Modulus (E) is the key element in the vibration response of any structure, the estimation of E was done both theoretically and experimentally. The estimated Young modulus of a rectangular PCB (EPCB) was calculated to be 20.6 GPa from the stiffness of the two composing materials [21] and their material fraction according to Equation (3).
where EFR4 is the Young modulus of FR4 (18.60 GPa), VPCB is the volume of the PCB (5.6 × 10⁻⁶ m3), VCu is the volume of the copper layer (1.26 × 10⁻³ m3), and ECu is the Young modulus of copper (108 GPa). Figure 3 shows the stress–strain curve and the broken specimen corresponding to specimen 3 of Group 2). The experimental value of EPCB was found to be 21.59 GPa. The parameters for the tension test were taken from a previous work [22].
The measured first four modes of vibration, obtained from experimental modal analysis of all the specimens, were then compared by analytical modal analysis using FEM with ANSYS 13.0 with Mechanical APDL solver using a fixed end (cantilever) as boundary condition. Figure 4 shows typical mesh models used for samples with (a) and without (b) holes. The shell element SOLSH190 (size 2 mm) was used and element numbers varied from 1698 to 3721, depending on sample dimensions. To analyze the measured and predicted natural frequencies, an experimental value was plotted against the predicted one for each of the modes included in the comparison. This plot provides a set of correlated mode pairs (CMPs) [5] used to check the degree of correlation between the two sets of results.
3. Results
3.1. Frequency Spectra and Mode Shapes
The values of the natural frequencies in terms of auto spectrum analysis were obtained from the PULSE program by applying FRFs, as shown in Figure 5. In this waterfall plot of frequency versus amplitude, the first peak represents the values of the natural frequencies of the different specimens in each group.
The extraction of modal parameters, such as natural frequencies and damping ratios from FRF data, was done by using the peak amplitude method [5]. The predicted mode shapes were obtained by Ansys. Figure 6 and Figure 7 show the results for W = 24 mm samples with and without a central 4 mm hole, respectively. Figure 8 and Figure 9 show the results for W = 24 mm and W = 30 mm samples with D = 8 mm central holes, respectively. In general, all samples have similar mode shapes, with no obvious influence of the hole. Figure S2 shows a comparison of each mode shape in all groups and Supplementary Materials Movies S1 to S4 show an animation of the vibration modes of a sample of Group 2 (W = 24 mm). At mode 1 (first natural frequency), all of the specimen groups show high amplitudes of vibration. In all cases, the mode shape around 650 Hz presented the lowest amplitude of all modes. This mode presents an area of very low deflection very close to the position of the accelerometer (20 mm from the free end of the cantilever), which also coincides with one of the impact points (see Supplementary Materials Movie S3). This cancelling effect is not present in modes 1 and 2 and is attenuated in mode 4 where deflection is minimal 5 mm below the accelerometer.
3.2. Natural Frequencies and Damping Ratios
Figure 10 and Figure 11 show the variations in the first four natural frequencies and their corresponding damping ratios for all the specimens in the different groups, respectively. The fundamental natural frequency of Group 1 (with central hole) is slightly lower than for Group 2 (no central hole) for all the samples, but Group 1 shows a slightly higher damping, due to the presence of the center holes in the middle of the specimens. In both groups, a frequency increase is observed as the specimen width also increases. This indicates that the W/D aspect ratio does not play a significant role and the modal behavior is governed by specimen stiffness and mass in spite of the fact that the size effect reduces nominal strength up to 15% [19].
Interestingly, the change in center-hole diameter at constant width in Groups 3 and 4 shows a very little difference in frequency for mode 1 in all the specimens. The vibration mode 4 in all the groups show high damping values as compared to other modes. This behavior can also be seen in the waterfall plot that shows low vibration amplitudes in this mode.
3.3. Comparison of Results with a Theoretical Model
For the comparison of extracted experimental natural frequencies, a uniform composite cantilever beam of 24 mm width was first modeled mathematically, and the results were then used for the finite element modeling using Ansys 13. Figure 12 shows a comparison of the experimental natural frequencies for all the specimens with the value calculated by the finite element method. As it can be seen, there is a very good correspondence between the values, especially for Groups 3 and 4, while the calculation predicts slightly lower values (between 2 and 4%) for the high frequency modes of Groups 1 and 2.
As an example of validity of the selected model, Table 5 shows a comparison of the modeled frequency with experimental and FEM results for sample 3 of Groups 1 and 2, and sample 6 of Group 3, i.e., samples with W = 24 mm with and without central holes. Similarly, Table 6 shows the results calculated for the cantilever plate (W = 48 mm) and compared with sample 7 of Groups 1 and 2 (W = 48 mm with and without central hole).
The correlated mode pairs (CMPs) were plotted to check the degree of correlation between the two sets of results for a single specimen in each group (sample 3), as shown in Figure 13. The two sets of data show a high degree of correlation, since the points lie near or close to the straight line of slope equal to 1.
3.4. Normalized Frequency Shift Calculations
The values of the normalized frequency shift [23] for sample 1 in each group, with respect to the rest of the samples of the same group, are presented in Figure 14. Due to the geometrical variations and high amplitude of vibrations, there is up to 33% frequency change in Group 1 for mode 1, while the other modes show a small frequency shift between the first and the rest of the samples. A similar behavior of frequency change is seen in Group 2, although the maximum frequency shift is less than 30%. The frequency change between the 2-mm center hole sample and the rest of the samples in groups 3 and 4 is very little as compared to the change due to aspect ratio, as in groups 1 and 2. This further indicates that in groups 3 and 4, sample mass is the dominating factor in the frequency changes.
4. Conclusions
Thin copper films of 35-µm thickness bounded to FR4 epoxy laminate of 1.5-mm thickness were studied in this paper. The vibrational characteristics, such as natural frequencies and damping ratios, were determined experimentally and analytically using a finite element method for four groups of samples, in order to study the geometric effects and the presence of a central hole of different diameters. It has been found that these sizes are suitable to be used as electronic circuit boards that undergo significant frequency changes ranging from 40 Hz to 1 kHz. The fundamental resonance frequency of all the specimens was found to be less than 40 Hz and the influence of a central hole was not significant to affect the modal properties. Ongoing work is focused on studying the influence of copper and FR4 thickness on the vibration properties of these composites. Further studies will also address the influence of high cycle vibration fatigue on their electrical properties, with and without thermal variations, in order to study the possible damage mechanisms that these materials undergo and how they affect their performance.
Supplementary Materials
The following are available online at https://www.mdpi.com/2076-3417/10/15/5197/s1, Figure S1: Top: Input signals recorded by the impact hammer. Bottom: Output signals recorded by accelerometers. All signals correspond to sample 3 of each group, Figure S2: Comparison of mode 1–4, Video S1: mode 1, Video S2: mode 2, Video S3: mode 3, Video S4: mode 4.
Author Contributions
S.A.A. conceptualization, investigation, data curation, writing—original draft preparation; A.F. conceptualization, writing—review and editing, supervision. All authors have read and agreed to the published version of the manuscript.
Funding
This research received no external funding.
Acknowledgments
We thank the Department of Mechanical Engineering, Umm Al Qura University, for allowing the free use of their experimental facilities during the realization of this work.
Conflicts of Interest
The authors declare no conflict of interest.
References
- Steinberg, D.S. Vibration Analysis for Electronic Equipment, 3rd ed.; Wiley: Hoboken, NJ, USA, 2008. [Google Scholar]
- Gharaibeh, M.A.; Pitarresi, J.A. Random vibration fatigue life analysis of electronic packages by analytical solutions and Taguchi method. Microelectron. Reliab. 2019, 102, 113475. [Google Scholar] [CrossRef]
- Amy, R.A.; Aglietti, G.S.; Richardson, G. Reliability Analysis of Electronic Equipment Subjected to Shock and Vibration—A Review. Shock Vibrat. 2009, 16, 45–59. [Google Scholar] [CrossRef]
- Jiao, J.; De, X.; Chen, Z.; Zhao, T. Integrated circuit failure analysis and reliability prediction based on physics of failure. Eng. Fail. Anal. 2019, 104, 714–726. [Google Scholar] [CrossRef]
- Ewins, D.J. Modal Testing: Theory, Practice and Application, 2nd ed.; Wiley: Hoboken, NJ, USA, 2009. [Google Scholar]
- Armentani, E.; Caputo, F.; Esposito, L.; Giannella, V.; Citarella, R. Multibody Simulation for the Vibration Analysis of a Turbocharged Diesel Engine. Appl. Sci. 2018, 8, 1192. [Google Scholar] [CrossRef] [Green Version]
- Armentani, E.; Giannella, V.; Citarella, R.; Parente, A.; Pirelli, M. Substructuring of a Petrol Engine: Dynamic Characterization and Experimental Validation. Appl. Sci. 2019, 9, 4969. [Google Scholar] [CrossRef] [Green Version]
- Bianco, D.; Adamo, F.P.; Barbarino, M.; Vitiello, P.; Bartoccini, D.; Federico, L.; Citarella, R. Integrated Aero–Vibroacoustics: The Design Verification Process of Vega-C Launcher. Appl. Sci. 2018, 8, 88. [Google Scholar] [CrossRef] [Green Version]
- Cifuentes, A.O. Estimating the dynamic behavior of printed circuit boards. IEEE Trans. Comp. Packag. Manuf. Technol. B 1994, 17, 69–75. [Google Scholar] [CrossRef]
- Aytekin, B.; Ozguven, H.N. Vibration Analysis of a Simply Supported PCB with a Component—An Analytical Approach. In Proceedings of the IEEE Proceedings 10th Electronics Packaging Technology Conference, Singapore, 9–12 December 2008; pp. 1178–1183. [Google Scholar] [CrossRef]
- Ren, G.; Li, B.; Li, D.; Jiao, Y. Modal Analysis of the Printed Circuit Board Based on Finite Element Method. In Proceedings of the 2014 International Conference on Computer Science and Electronic Technology, Shenzhen, China, 27–28 December 2014; Atlantis Press: Paris, France, 2014; pp. 150–154. [Google Scholar] [CrossRef] [Green Version]
- Bhavsar, N.R.; Shinde, H.P.; Bhat, M. Determination of Mechanical Properties of PCB. Int. J. Mech. Eng. Robot. 2014, 2, 23–27. Available online: http://www.irdindia.in/journal_ijmer/pdf/vol2_iss4/6.pdf (accessed on 5 June 2020).
- Veilleux, E. Vibration Control of Printed-Circuit Boards in a Dynamic Environment. IEEE Trans. Parts Mater. Packag. 1970, 6, 100–105. [Google Scholar] [CrossRef]
- Veprik, A.M. Vibration Protection of Critical Components of Electronic Equipment in Harsh Environmental Conditions. J. Sound Vibrat. 2003, 259, 161–175. [Google Scholar] [CrossRef]
- Prashanth, M.D. Vibration Analysis of Printed Circuit Boards: Effect of Boundary Condition. AIP Conf. Proc. 2018, 1943, 020018. [Google Scholar] [CrossRef]
- Qi, X.; Zhou, B.; Li, G.; Zhang, P.; En, Y. Effect of fixation method on solder joint vibration fatigue reliability of high density PCB assembly. In Proceedings of the IEEE Proceedings 12th International Conference on Electronic Packaging Technology and High Density Packaging, Shanghai, China, 8–11 August 2011; pp. 1–4. [Google Scholar] [CrossRef]
- Rao, V.P.; Singh, A.K.; Ranganath, S. Vibration Analysis of Printed Circuit Board Plate with Varying Boundary Conditions. Indian J. Sci. Technol. 2016, 9, 1–3. [Google Scholar] [CrossRef] [Green Version]
- Hall, W.J.; Williams, P.T. Separation and recovery of materials from scrap printed circuit boards. Res. Cons. Recycl. 2007, 51, 691–709. [Google Scholar] [CrossRef] [Green Version]
- Hassan, M.K.; Abdellah, M.Y.; ElAbiadi, T.; Mohamed, A.F.; Azam, S.; Marzouk, W.W. Essential Work of Fracture and Size Effect in Copper/Glass-Reinforced Epoxy Laminate Composites Used as MEMS Devices. Am. J. Mech. Eng. 2017, 5, 234–238. Available online: http://www.sciepub.com/ajme/abstract/8369 (accessed on 18 June 2020). [CrossRef] [Green Version]
- Maia, N.M.M.; Silva, J.M.M. Theoretical and Experimental Modal Analysis, 1st ed.; Wiley: Hoboken, NJ, USA, 1997; p. 217. [Google Scholar]
- Guojun, H.; Yong, G.K.; Jing-en, L.; Chin, L.W.; Baraton, X. Thermoelastic properties of printed circuit boards: Effect of copper trace. In Proceedings of the IEEE Proceedings 2009 European Microelectronics and Packaging Conference, Rimini, Italy, 15–18 June 2009; pp. 1–6. Available online: https://ieeexplore.ieee.org/document/5272860 (accessed on 18 June 2020).
- Hassan, M.K.; Abdellah, M.Y.; Mohamed, A.F.; ElAbiadi, T.; Azam, S.; Marzouk, W.W. Fracture Toughness of Copper/Glass-Reinforced Epoxy Laminate Composites. Am. J. Mater. Eng. Technol. 2018, 6, 1–7. Available online: http://pubs.sciepub.com/materials/6/1/1/ (accessed on 15 June 2020).
- Negru, I.; Gillich, G.R.; Praisach, Z.I.; Tufoi, M.; Gillich, N. Natural frequency changes due to damage in composite beams. J. Phys Conf. Ser. 2015, 628, 012091. [Google Scholar] [CrossRef] [Green Version]
Figure 1.
(a) Specimen dimensions (in mm): width (W) and diameter (D) are variable, as indicated in Table 1, Table 2, Table 3 and Table 4. (b) Schematic layout of the experimental setup. The numbered positions (1–3) in blue in both figures indicate the hammer impact positions.

Figure 2.
Photograph of the experimental setup and specimen pictures of Group 1.

Figure 3.
Experimental estimation of EPCB. (a) Specimen under test (sample 3 of Group 2), (b) stress–strain curve of the specimen depicted in (a).
Figure 3.
Experimental estimation of EPCB. (a) Specimen under test (sample 3 of Group 2), (b) stress–strain curve of the specimen depicted in (a).

Figure 4.
Examples of mesh models used for finite element method (FEM) analysis: (a) Group 3 sample (W = 24, D = 8); (b) Group 2 sample (W = 24).
Figure 4.
Examples of mesh models used for finite element method (FEM) analysis: (a) Group 3 sample (W = 24, D = 8); (b) Group 2 sample (W = 24).

Figure 5.
Auto spectrum analysis for all groups of samples.

Figure 6.
Mode shapes for a single specimen (W = 24 mm, D = 4 mm) in Group 1.

Figure 7.
Mode shapes for a single specimen (W = 24 mm) in Group 2.

Figure 8.
Mode shapes for a single specimen (W = 24 mm, D = 8 mm) in Group 3.

Figure 9.
Mode shapes for a single specimen (W = 30 mm, D = 8 mm) in Group 4.

Figure 10.
Natural frequency plots for all specimen groups and frequency modes. Mode 1 (■), mode 2 (●), mode 3 (▲), and mode 4 (▼).
Figure 10.
Natural frequency plots for all specimen groups and frequency modes. Mode 1 (■), mode 2 (●), mode 3 (▲), and mode 4 (▼).

Figure 11.
Damping ratio plots for all specimen groups and frequency modes.

Figure 12.
Comparison of experimental (closed symbols, solid line) and analytical (open symbols, dotted line) frequencies for all the specimens.
Figure 12.
Comparison of experimental (closed symbols, solid line) and analytical (open symbols, dotted line) frequencies for all the specimens.

Figure 13.
Correlated mode pairs for sample 3 of all groups. The black diagonal line represents a slope equal to 1.
Figure 13.
Correlated mode pairs for sample 3 of all groups. The black diagonal line represents a slope equal to 1.

Figure 14.
Normalized frequency shifts for samples 2–7 of all groups.


Table 1.
Group 1: Constant width/diameter ratio with center hole.
| W † (mm) | D ‡ (mm) | D/W * |
|---|---|---|
| 12 | 2 | 6 |
| 18 | 3 | 6 |
| 24 | 4 | 6 |
| 30 | 5 | 6 |
| 36 | 6 | 6 |
| 42 | 7 | 6 |
| 48 | 8 | 6 |
† W: width; ‡ D: diameter; * D/W: aspect ratio.
Table 2.
Group 2: Constant aspect ratio without center hole (D = 0).
| W (mm) | D/W |
|---|---|
| 12 | 6 |
| 18 | 6 |
| 24 | 6 |
| 30 | 6 |
| 36 | 6 |
| 42 | 6 |
| 48 | 6 |
Table 3.
Group 3: Constant width (24 mm) with variable center holes.
| W (mm) | D (mm) |
|---|---|
| 24 | 2 |
| 24 | 3 |
| 24 | 4 |
| 24 | 5 |
| 24 | 6 |
| 24 | 7 |
| 24 | 8 |
Table 4.
Group 4: Constant width (30 mm) with variable center holes.
| W (mm) | D (mm) |
|---|---|
| 30 | 2 |
| 30 | 3 |
| 30 | 4 |
| 30 | 5 |
| 30 | 6 |
| 30 | 7 |
| 30 | 8 |
Table 5.
Comparison of the natural frequency of a uniform composite rectangular cantilever beam (W = 24 mm) with experimental and FEM results for samples of the same width.
Table 5.
Comparison of the natural frequency of a uniform composite rectangular cantilever beam (W = 24 mm) with experimental and FEM results for samples of the same width.
| Mode | Natural Frequency (Hz) | ||||||
|---|---|---|---|---|---|---|---|
| W = 24 mm No Hole | W = 24 mm D = 4 mm | W = 24 mm D = 8 mm | Model (Beam) 3 | ||||
| Exp. 1 | FEM 2 | Exp. 1 | FEM 2 | Exp. 1 | FEM 2 | ||
| 1 | 31.9 | 31.1 | 31.5 | 31.0 | 30.4 | 30.7 | 36.6 |
| 2 | 244.6 | 235.9 | 244.0 | 235.4 | 233.2 | 234.2 | 229.3 |
| 3 | 688.0 | 658.0 | 686.5 | 656.9 | 665.6 | 656.7 | 641.5 |
| 4 | 1275.7 | 1259.9 | 1303.0 | 1256.3 | 1264.0 | 1257.4 | 1254.2 |
1 Exp.: experimental. 2 FEM: calculated by Ansys. 3 Model: calculated for a cantilever beam.
Table 6.
Comparison of the natural frequency of a uniform composite rectangular cantilever plate (W = 48 mm) with experimental and FEM results for samples of the same width.
Table 6.
Comparison of the natural frequency of a uniform composite rectangular cantilever plate (W = 48 mm) with experimental and FEM results for samples of the same width.
| Mode | Natural Frequency (Hz) | ||||
|---|---|---|---|---|---|
| W = 48 mm, No Hole | W = 48 mm, D = 8 mm | Model (Plate) 3 | |||
| Exp. 1 | FEM 2 | Exp. 1 | FEM 2 | ||
| 1 | 35.0 | 34.8 | 34.9 | 34.6 | 38.0 |
| 2 | 246.8 | 241.7 | 254.8 | 240.9 | 238.2 |
| 3 | 697.8 | 678.6 | 699.3 | 677.5 | 666.4 |
| 4 | 1295.0 | 1300.4 | 1345.3 | 1297.6 | 1302.9 |
1 Exp.: experimental. 2 FEM: calculated by Ansys. 3 Model: calculated for a cantilever plate.
© 2020 by the authors. Licensee MDPI, Basel, Switzerland. This article is an open access article distributed under the terms and conditions of the Creative Commons Attribution (CC BY) license (http://creativecommons.org/licenses/by/4.0/).
Share and Cite
MDPI and ACS Style
Azam, S.A.; Fragoso, A. Experimental and Numerical Simulation Study of the Vibration Properties of Thin Copper Films Bonded to FR4 Composite. Appl. Sci. 2020, 10, 5197. https://doi.org/10.3390/app10155197
AMA Style
Azam SA, Fragoso A. Experimental and Numerical Simulation Study of the Vibration Properties of Thin Copper Films Bonded to FR4 Composite. Applied Sciences. 2020; 10(15):5197. https://doi.org/10.3390/app10155197
Chicago/Turabian StyleAzam, Sufyan A., and Alex Fragoso. 2020. "Experimental and Numerical Simulation Study of the Vibration Properties of Thin Copper Films Bonded to FR4 Composite" Applied Sciences 10, no. 15: 5197. https://doi.org/10.3390/app10155197
Note that from the first issue of 2016, this journal uses article numbers instead of page numbers. See further details here.