1. Introduction
Because of their durability and versatility, reinforced steel bars (rebar) are extensively used in construction. However, corrosion of rebar leads to cracks and spalling on the surface, affecting the safety and durability of reinforced concrete. The main challenge for conventional rebar is how to minimize corrosion due to oxide or passive layer breakdown. The apprehension about chloride-induced corrosion has motivated researchers to focus on carbon materials, such as carbon steel, as reinforcement for concrete. To calculate the required chloride percentage for passivation, three methods are used: the total chloride amount in weight percent (wt. %), the free chloride concentration (Cl%), and the chloride/hydroxide (Cl/OH) ratio [
1]. In addition, different methods are used to measure the chloride content percentage, such as electrochemical impedance, potentiodynamic polarization, gravimetric measurement [
2,
3,
4,
5,
6,
7,
8,
9,
10,
11].
Failure of the oxide or passive layer is usually due to the reaction of Cl
− ions with the rebar surface in an appropriate alkaline environment [
12,
13,
14,
15,
16]. Various experiments have been conducted to understand the relationship between corrosion rate and Cl% in the environment surrounding rebar reinforcing concrete, especially under alkaline conditions [
17,
18,
19,
20,
21,
22], in order to optimize the different conditions and generate a susceptible Cl% suitable for pitting. Studies have reported that Cl% varies depending on many parameters. Li and Sagues [
16] showed that the critical Cl% is between 0.01 and 0.04 M in saturated calcium hydroxide and 0.4–0.6 M in simulated concrete pore solution (SCPS-PH-13.5). Bertolini et al. [
18] reported a relationship between the critical Cl% of carbon steel and the solution pH, and Cl% increased from 0.17 M at pH 12.5 to >0.27 M at pH 13.8 in sodium hydroxide solution.
The mechanical performance, reliability, and durability of the rebar surface are significantly affected by its corrosion behavior. Alonso et al. [
17] described how mechanical properties are affected by pitting corrosion on the rebar surface. A pitting morphology leads to stress concentration, initiating cracks and fatigue failure due to crack propagation. Therefore, analyzing the corrosion behavior of pits is important for estimating the life of reinforced concrete structures [
20].
In non-cracked concrete, corrosion of reinforced steel starts from the high-concentration chloride area via an anodic localized reaction. In cracked concrete, corrosion of reinforced steel starts from the area where small anodes formed around the crack line [
18]. In active corrosion, macro- and microcell corrosion can exist simultaneously [
19]. Many factors affect the corrosion of reinforced steel in cracked concrete, such as concrete composition and resistance, loading, and exposure conditions [
20,
23].
The dual-phase (DP) steel microstructure is characterized by a matrix of fine ferrite with S.M.A.ll spots of a second, harder phase—high-strength steel. Although some of bainite or retained austenite might be present, the second phase mainly comprises martensite. The martensite volume fraction ranges between 5% and 30%. Martensite offers significant strengthening, while the ductile ferrite matrix offers good formability [
24,
25,
26]. DP rebar acquires its mechanical properties from the two phases [
27,
28,
29,
30,
31,
32,
33], and the presence of a dual phase in reinforced concrete structured steel induces good corrosion resistance.
Many variables affect the ductility of an element while it is subjected to different loads, especially a bending moment, such as the element material, cross-sectional geometry, and mechanical properties. Especially, for reinforced concrete, these variables are represented by strength, the concrete’s mechanical properties, reinforcement ductility, bonding between reinforcement and concrete, cross-sectional geometry, structural details, transverse shear and longitudinal force, and element slenderness. Intercritical quenching (IQP) is an effective method of improving the ferrite–martensite structure by enhancing the density of mobile dislocations and increasing residual stresses.
This study investigated the effect of Cl− ions on the electrochemical corrosion behavior of DP rebar over conventional rebar in SCPS.
2. Materials and Methods
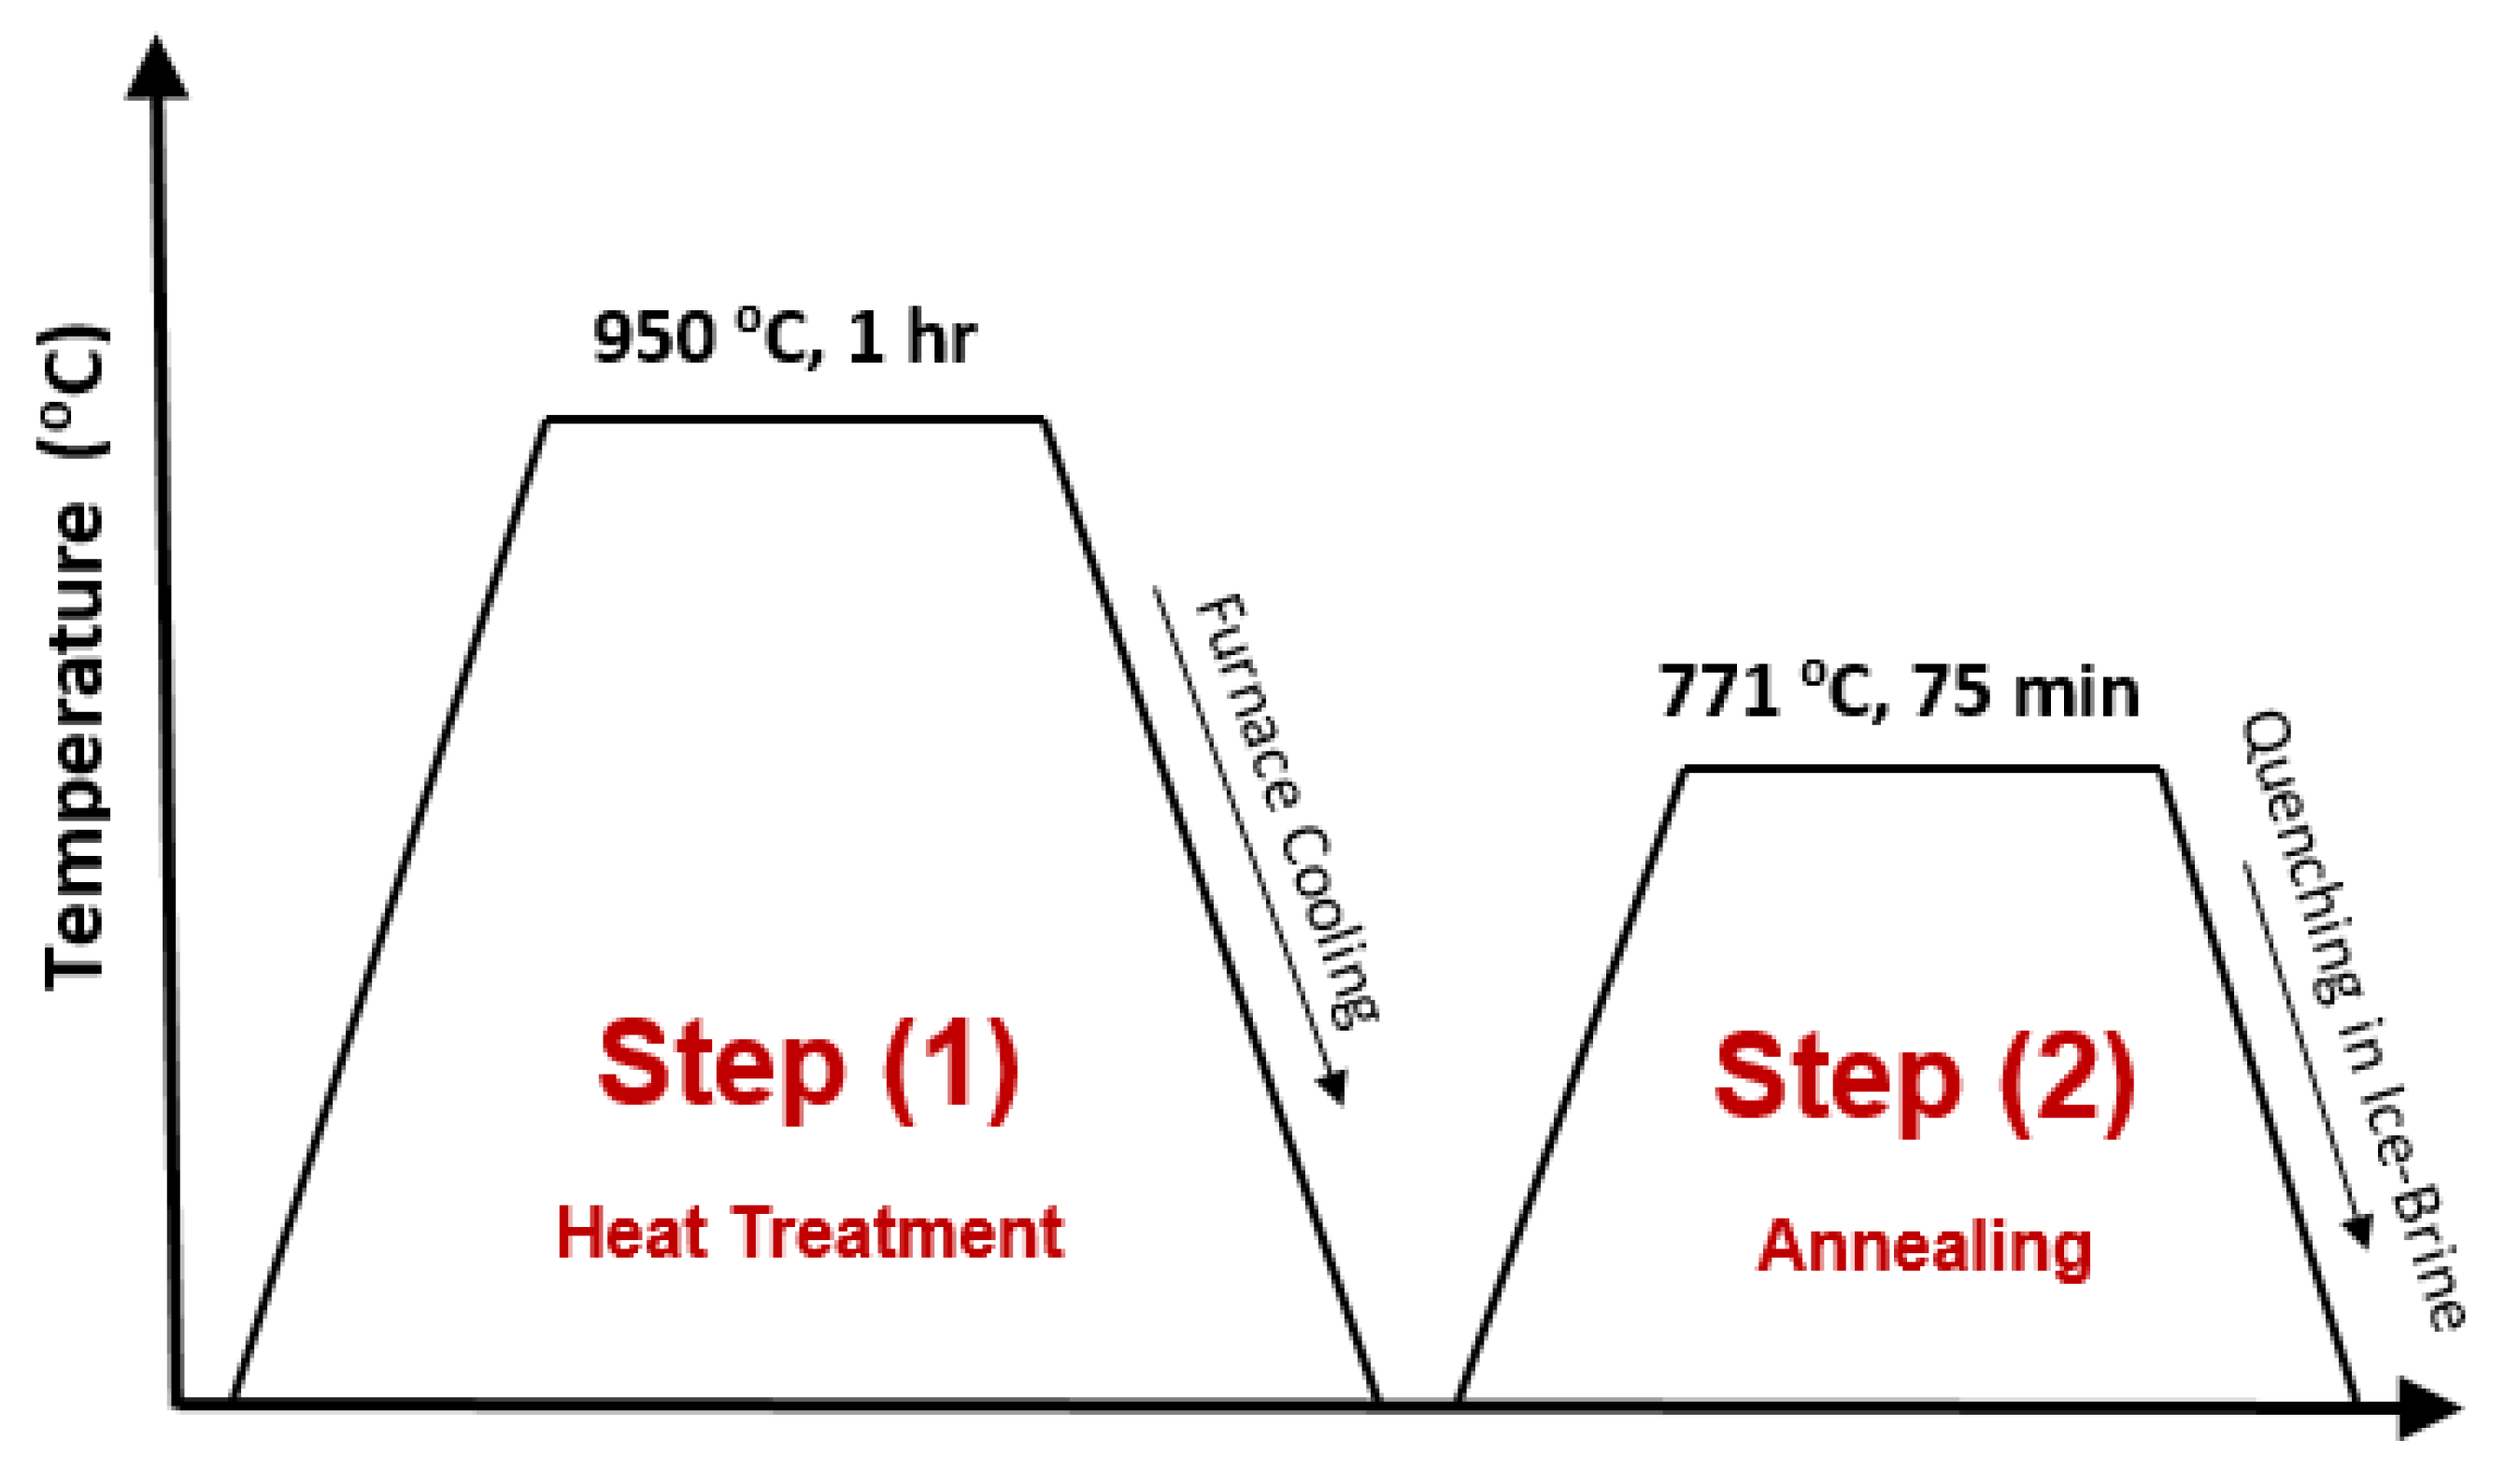
2.1. Heat Treatment
A DP structure was produced from low-carbon steel via two heat treatment steps, as shown in
Figure 1. Step 1 was a normalizing process for 60 min at 950 °C in a tube furnace, and Step 2 was an annealing process for 75 min at 770 °C before quenching in ice-brine water at an average temperature of −10 °C.
2.2. Metallography
To investigate the microstructure, we cut out samples from the as-received rebar using a StruersSecotom-10 saw. Grinding was performed using silicon carbide paper with different grades (320–2500). Next, fine polishing was performed using a SPECTRUM SYSTEMTM 1000 automatic fine polisher with ferrous alumina as a lubricant in order to obtain a smooth surface without scratches. The samples surfaces were washed with distilled water (DW) and carefully cleaned twice with ethanol to get a polished mirror surface. Finally, etching was performed, where the polished surface was immersed in 2% nital solution for 8 s to get a clear grain boundary view, and microstructure images were taken using a Leica DM 2500M optical microscope (Leica Camera, Wetzlar, Germany). The SEM images were acquired using a Carl Zeiss ultra 55 Field-Emission Scanning Electron Microscope operated at 5 kV.
2.3. Hardness
Vickers hardness was measured for both rebar and DP rebar using a Vickers Buehler-Micro-Met 5114 Microhardness Tester (Akashi Corporation, Tokyo, Japan) with an applied load of 100 g for 10 s. The hardness values reported were the average of five different positions per sample.
2.4. Volume Fraction
The martensite volume fraction for DP rebar was calculated via image processing using a Leica material workstation software (Leica Microsystems, Wetzlar, Germany). To obtain statistically reliable results, images of etched surfaces were taken at different magnifications from at least 10 positions, and the average volume fraction was calculated.
2.5. Corrosion
The SCPS used was the same as described previously [
16]. The authors investigated the SCPS chemistry of alkali-activated fly ash and found that the percentage of dissolved elements, such as Ca, Al, P, and Si, was in the range of 0.5–1 mM. To simulate SCPS chemistry, we used an alkali hydroxide solution: NaOH solution was prepared with a concentration of 0.80 M using ACS reagent–grade sodium hydroxide pellets, and 0.02 and 0.05 M sodium chloride was added to study the effect of Cl
− ions on corrosion initiation.
Electrochemical impedance spectroscopy (EIS) and potentiodynamic polarization were used to study corrosion performance using a three-electrode potentiostat device. Briefly, 1 cm
2 from each sample as an exposed surface mounted with epoxy resin was considered the working electrode, while the saturated calomel electrode (SCE) was the reference electrode, and a graphite rod was the counter-electrode. To prepare the sample surface for microstructure imaging, the same preparation steps were used as in
Section 2.2. After fine polishing and washing (with acetone and DW), samples were immersed for 30 min in the electrolyte for stabilization and to steady the open-circuit potential before each experiment. EIS was performed over a wide frequency range (100 kHz to 0.01 Hz), and polarization curves were obtained at a potential of −1000 to +1200 mV (SCE) with a constant scan rate of 1 mV/s.
3. Results and Discussion
3.1. Microstructure
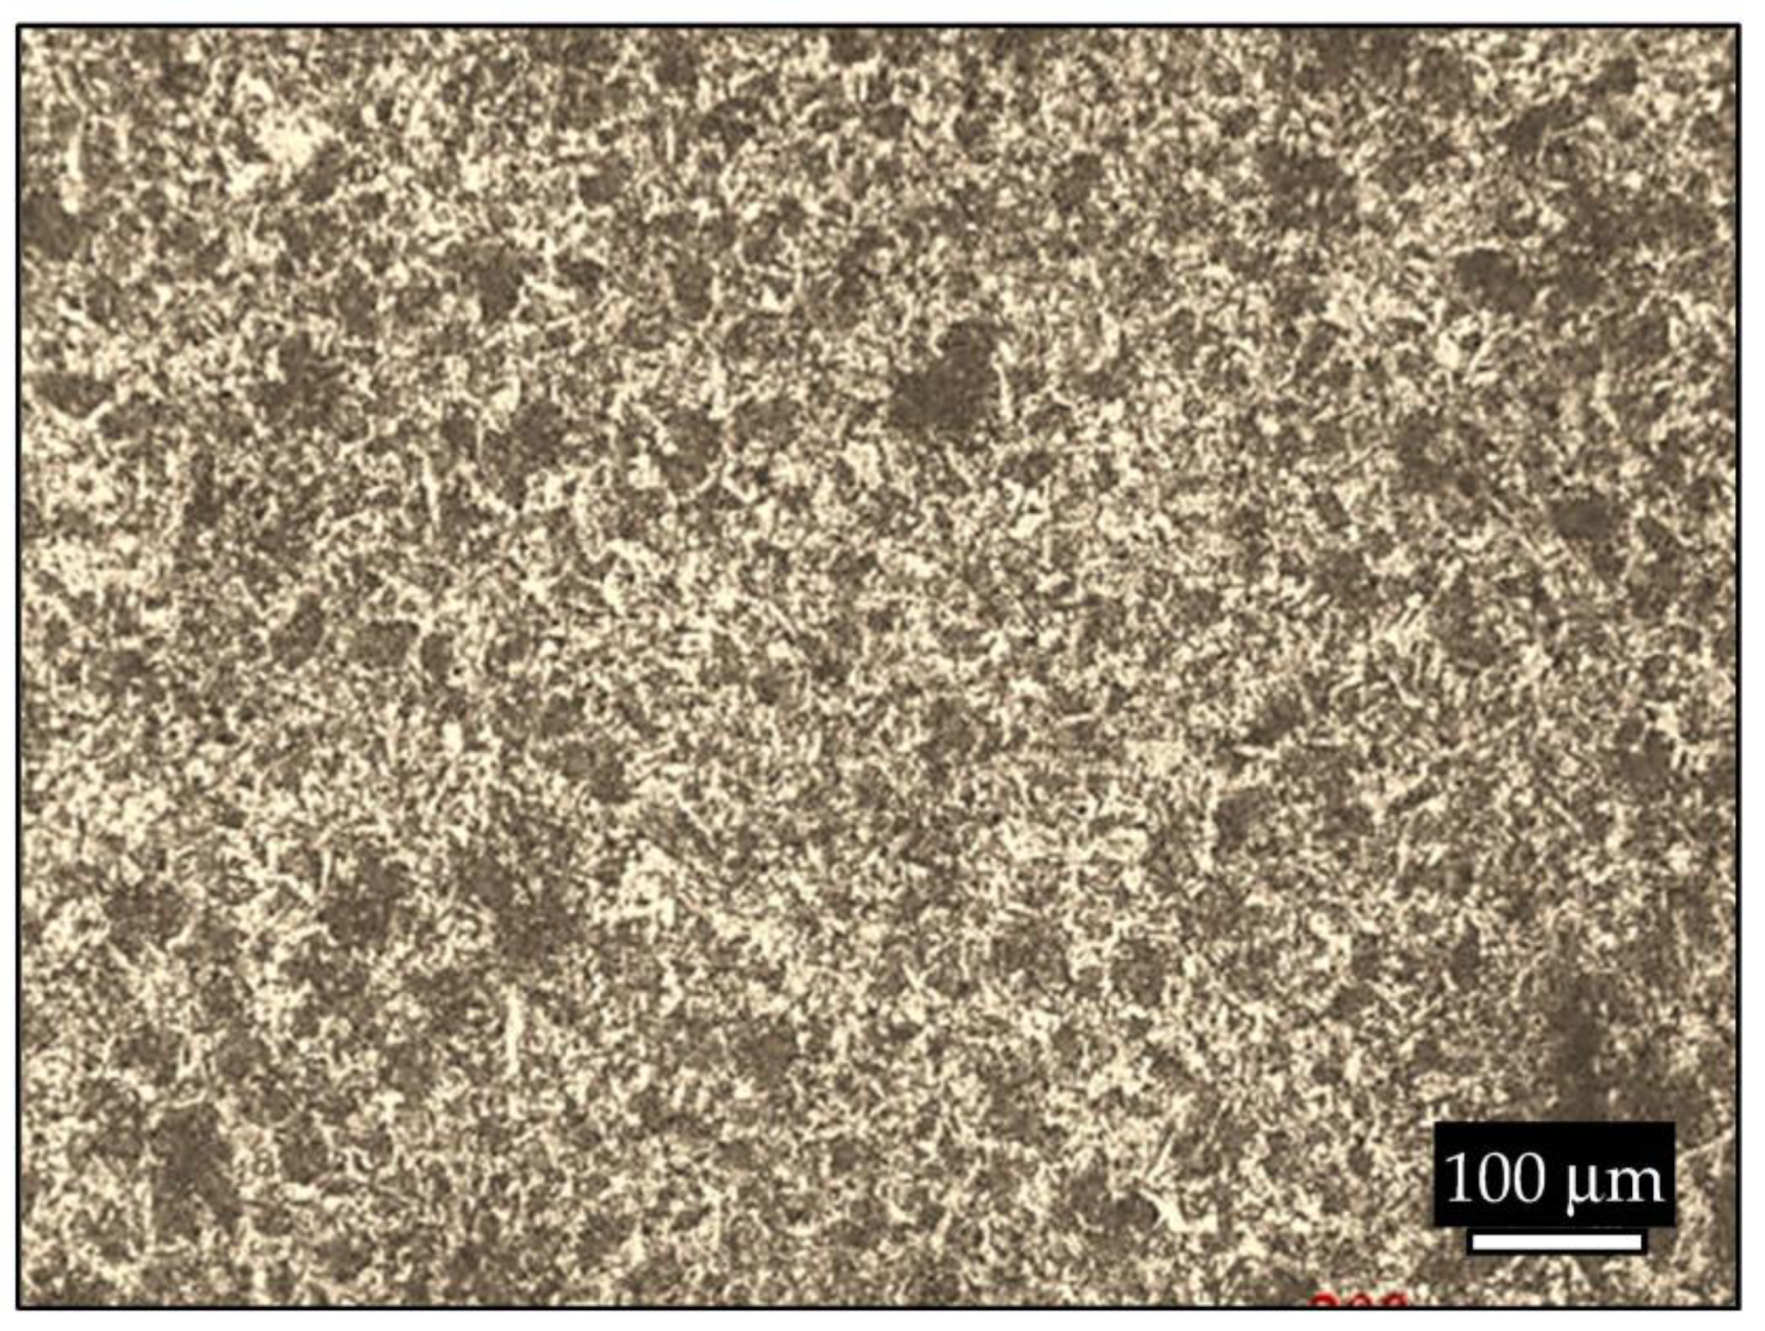
Figure 2 and
Table 1 show the as-received rebar microstructure. It comprised two phases, a ferrite phase (white regions) and a pearlite phase (dark regions). The grains were oriented in a random direction, and we observed homogeneous distribution of the two phases in the microstructure.
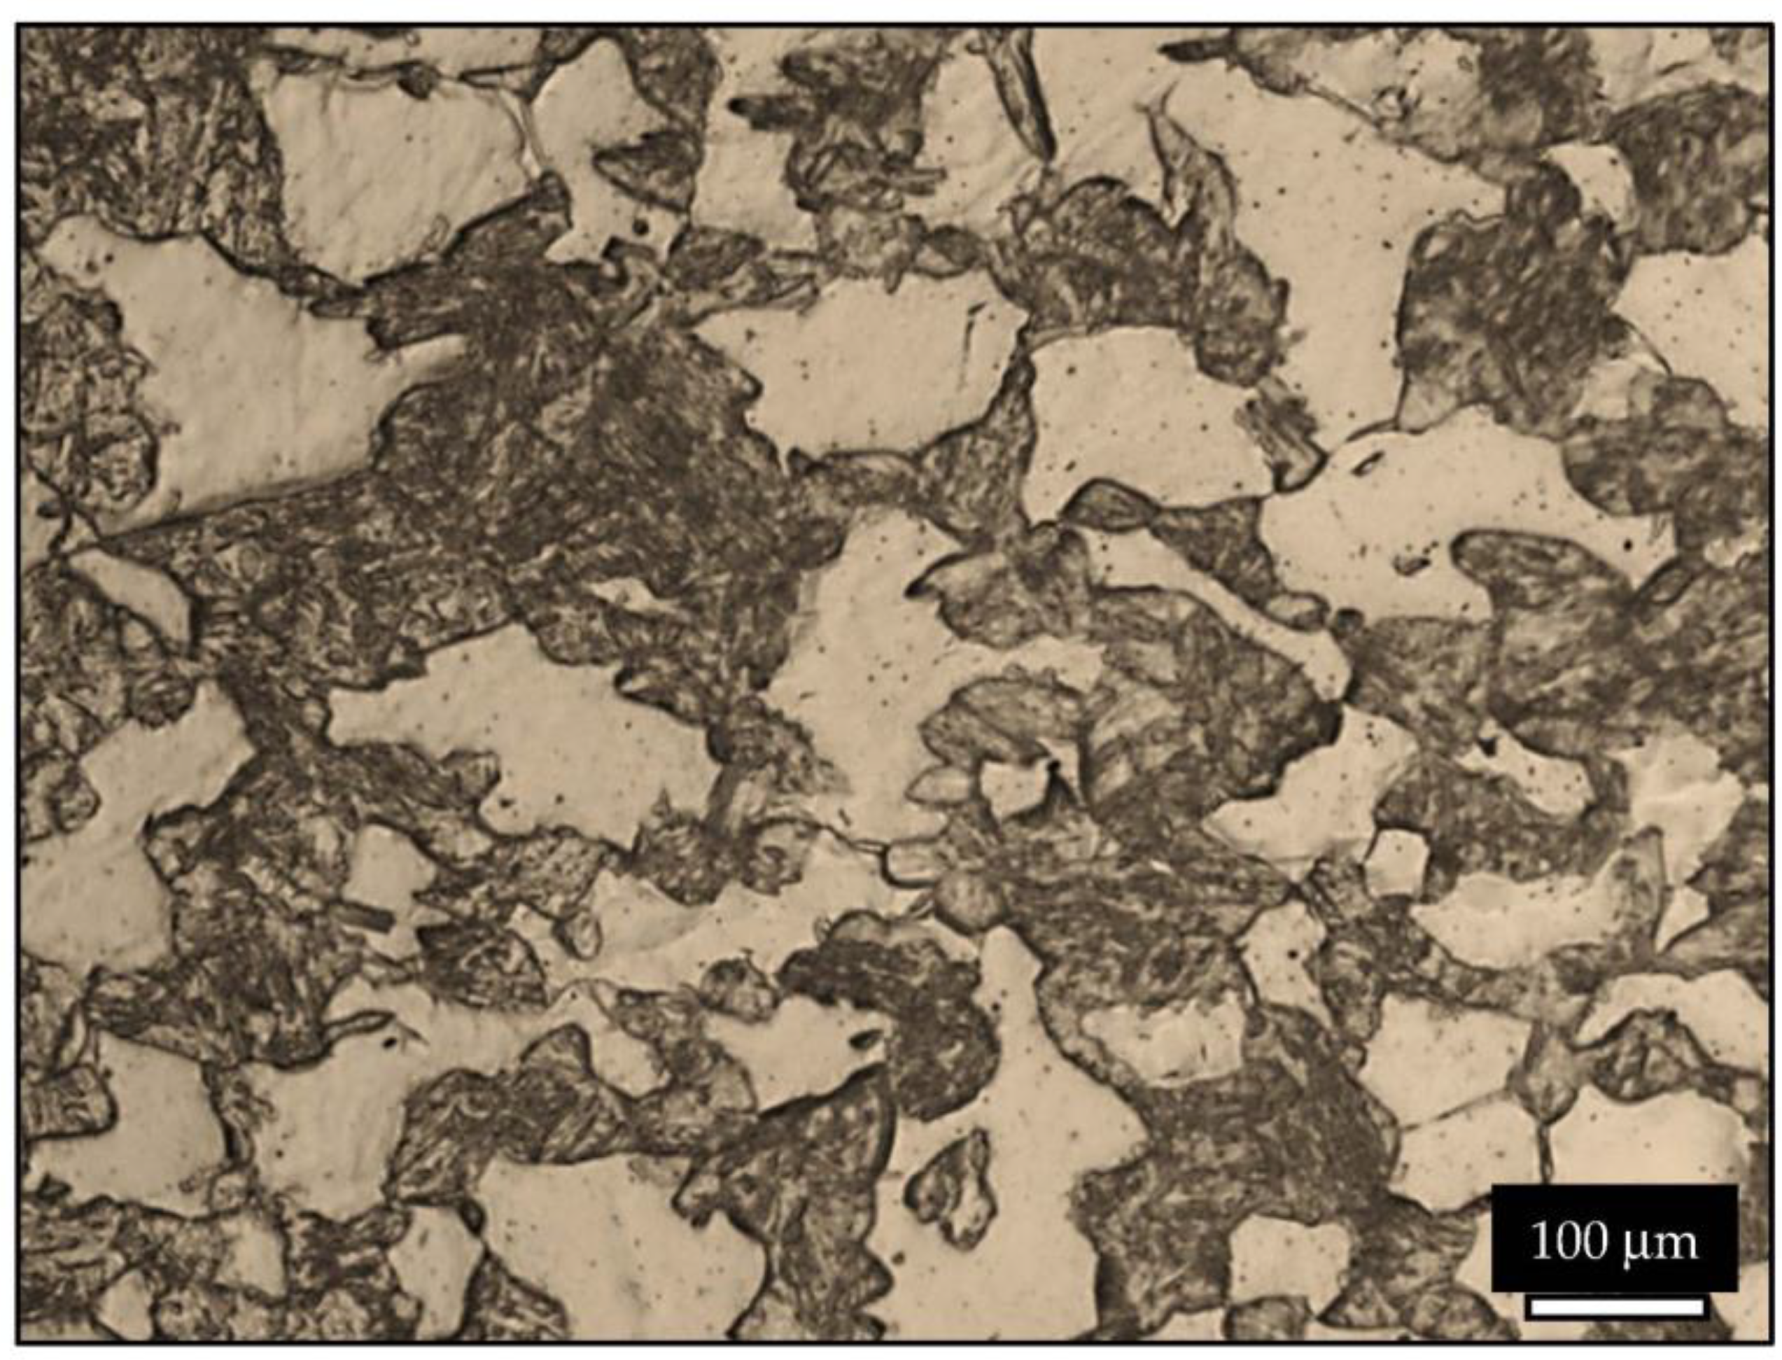
Figure 3 shows the DP rebar microstructure. It also comprised two phases, a soft ferrite phase (white regions) and a hard martensite phase (dark regions). The grains looked larger compared to rebar and were oriented in a random direction. We determined the relative amount of ferrite and martensite via image processing using Leica LS image analyzer software. The martensite volume fraction was almost equal to the area fraction because the sample was thin (900 mm), which came to ~22% in DP rebar.
3.2. Hardness
The average hardness values for conventional rebar and DP rebar samples were 257 and 310 VHN, respectively. Hardness measurements were obtained from five indentations in different areas per sample.
3.3. Potentiodynamic Polarization
3.3.1. Influence of Cl− ions on Passivity in Alkaline Solution
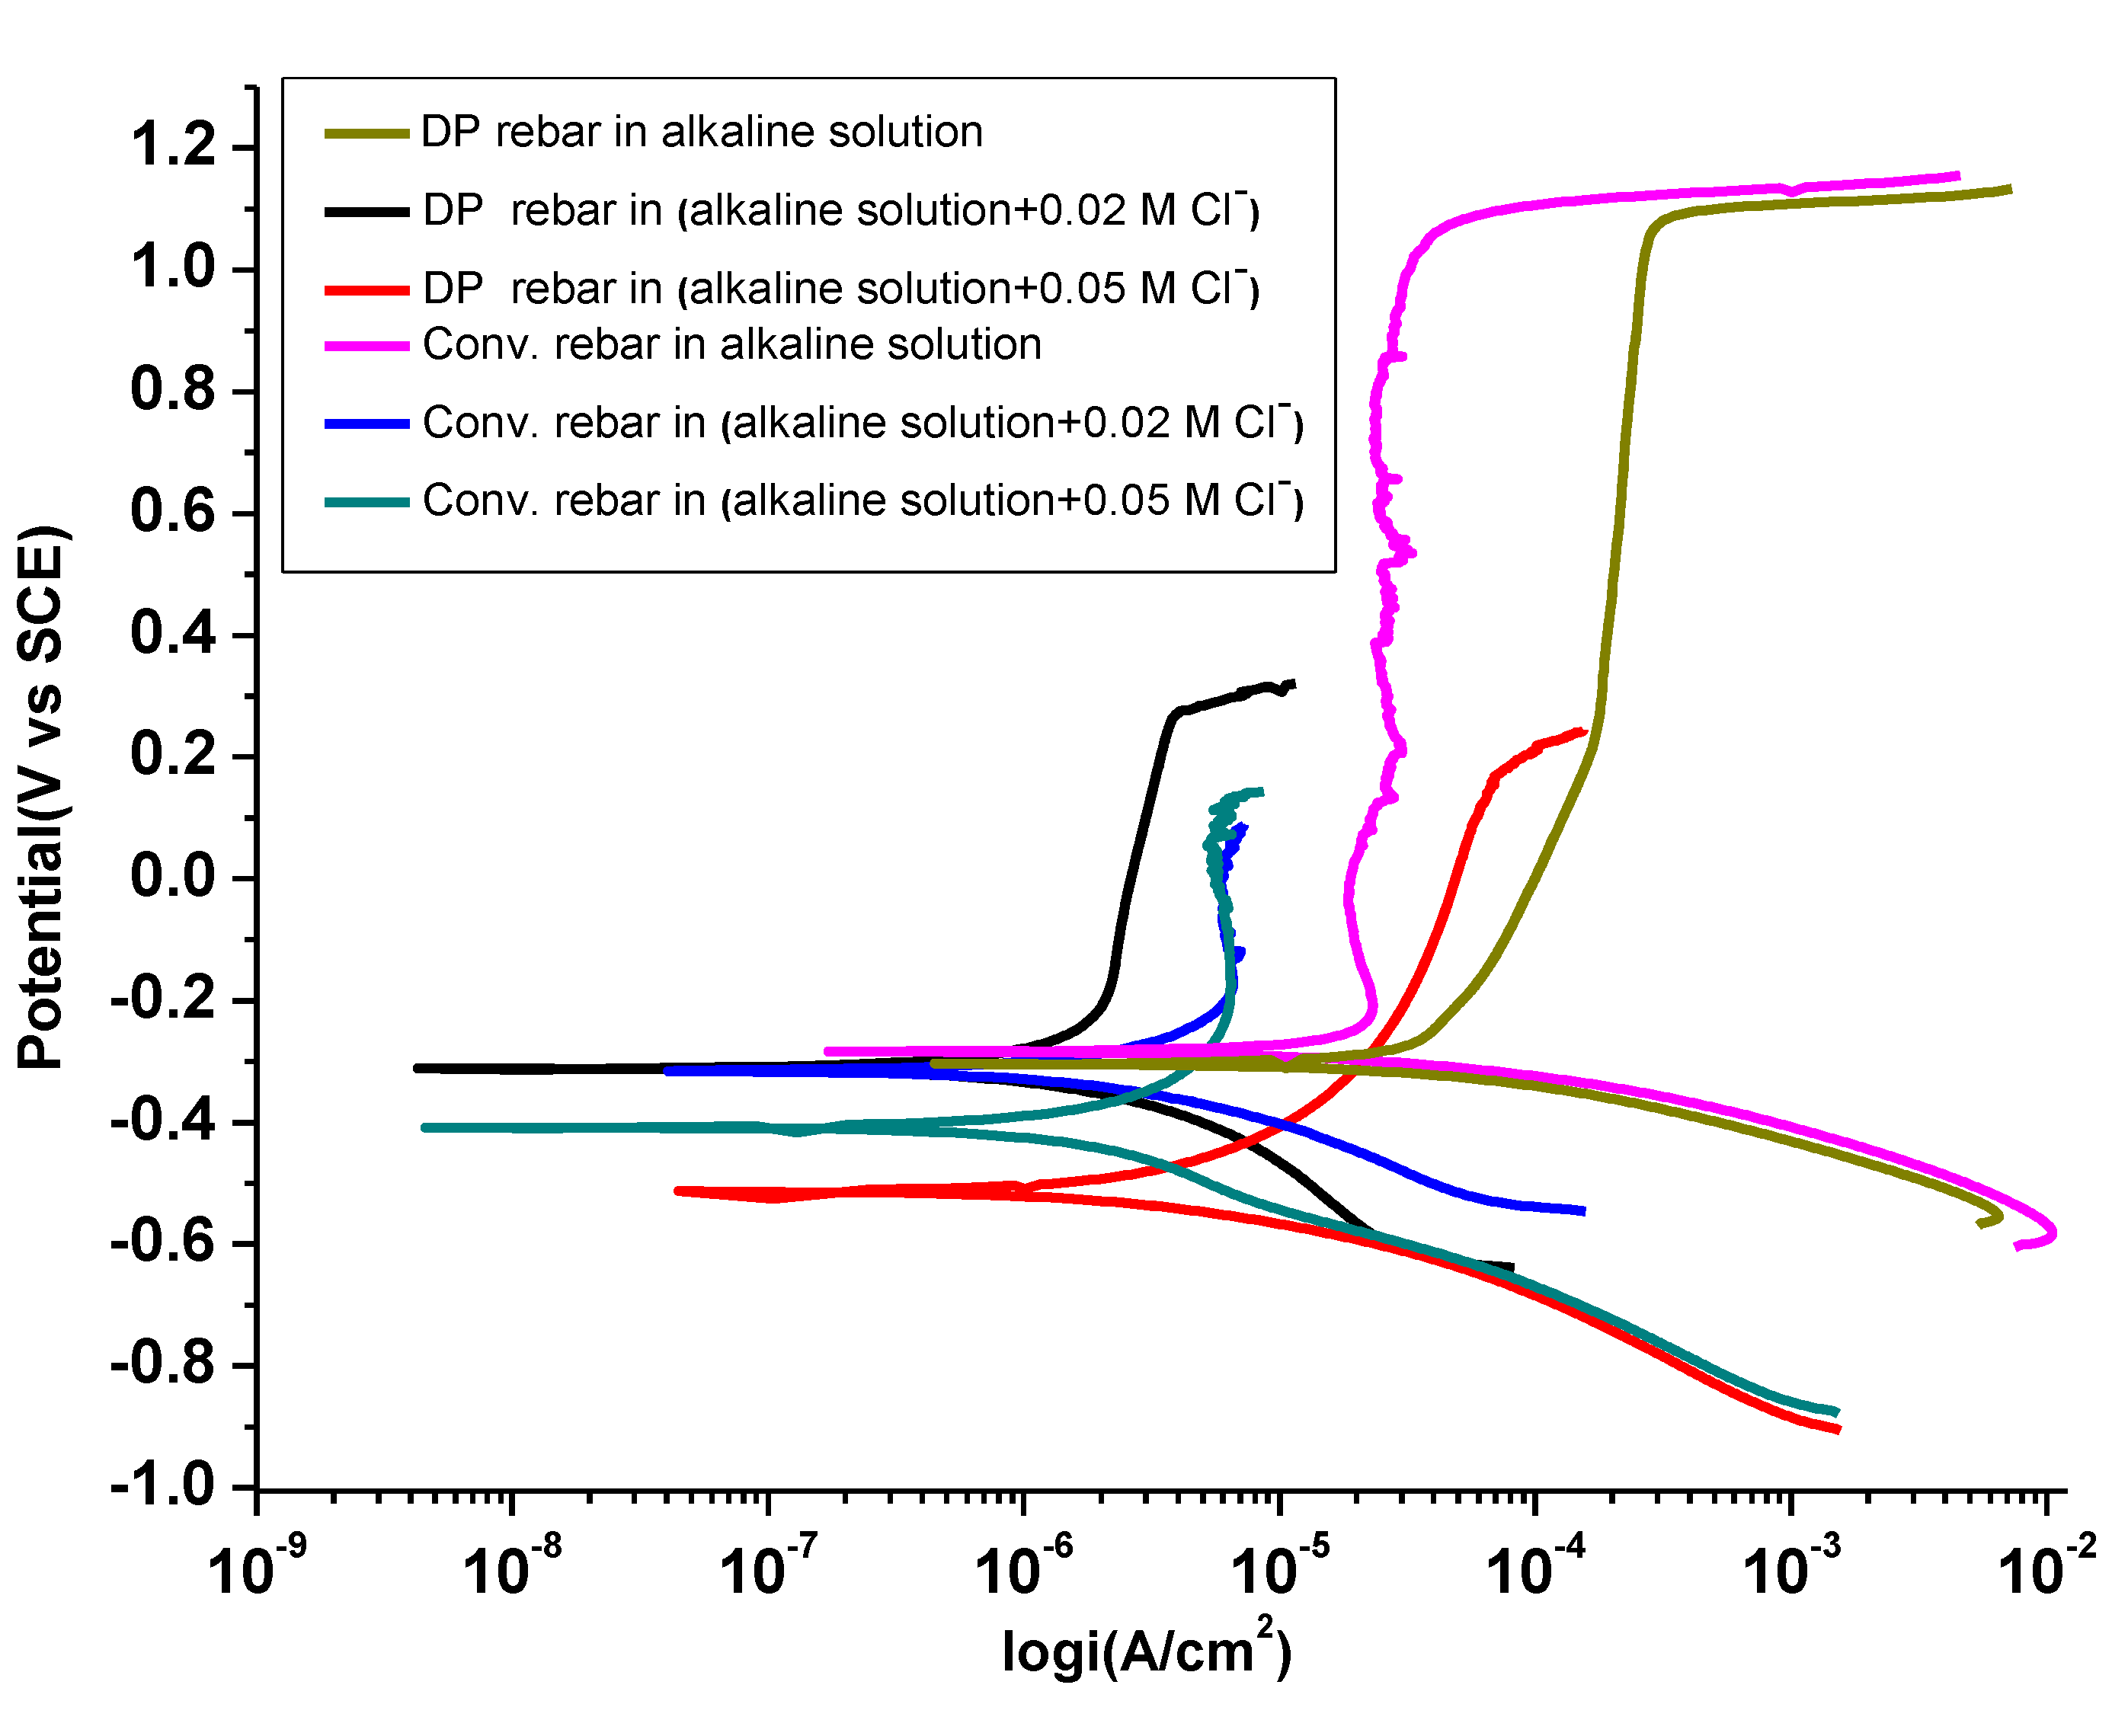
Figure 4 shows potentiodynamic polarization curves for SCPS with and without NaCl. As explained by Pourbaix diagram [
34], DP rebar shows spontaneous passivity in the presence of an alkaline medium compared to conventional rebar. High Cl
− ion concentrations may affect the passive state [
35].
We observed oxide or passive layer breakdown at Cl
− ion concentrations of 0.02 and 0.05 M and potential of >200 mV (SCE). The higher Cl
− ion concentration shifts the critical pitting potential toward a less noble range, as seen at 0.05 M. It is well known that among different factors contributing to the initiation of pitting corrosion is the damage to passive layer. Moreover, pitting corrosions limits the possibility of re-passivation leading to complete destruction of the oxide layer. In other words, the lower the destruction in the passive layer the better the corrosion resistant property of the material. Thus, it can be confirmed that DP rebar has a better corrosion resistance than the conventional rebar. This is clearly seen from the behaviour of these materials as depicted in
Figure 4 where the dissolution rate of the passive layer in the DP rebar is far slower than that of conventional rebar.
Sodium chloride was added to the base electrolyte prior to potentiodynamic polarization, which helped in investigating the susceptibility of the oxide or passive layer formed in the local breakthrough. Low Cl
− ion concentrations are instrumental in preventing the formation of a protective layer on substrates [
36]. The oxide or passive layer dissolves actively with high current densities beginning at the free corrosion potential, which is shown for a Cl
− ion concentration of 0.05 M for conventional rebar and DP rebar in
Figure 4. At all solution concentrations, the corrosion rate was higher for conventional rebar compared to DP rebar, probably because the oxide or passive layer of DP rebar was more stable compared to conventional rebar. By increasing the Cl
− ion concentration, the free corrosion and passive current densities increased, while the free corrosion potential decreased to a less noble potential. Because of an increase in surface reactivity for conventional rebar in SCPS with increasing Cl
− ion concentration (0.02 and 0.05 M), we observed current scattering increasing in the current anodic range with high passive current density. The reason was the presence of an oxide or passive layer during anodic polarization, which dissolved and reformed dynamically. At 200 mV (SCE), the current density rapidly increased by 2 orders of magnitude. Oxygen evolution reaction was not the only reason for this increase, because on decreasing the applied potential, the current density did not decrease [
37]. Oxide or passive layer breakthrough was evident from the formation of high quantities of flakes on the electrode surface.
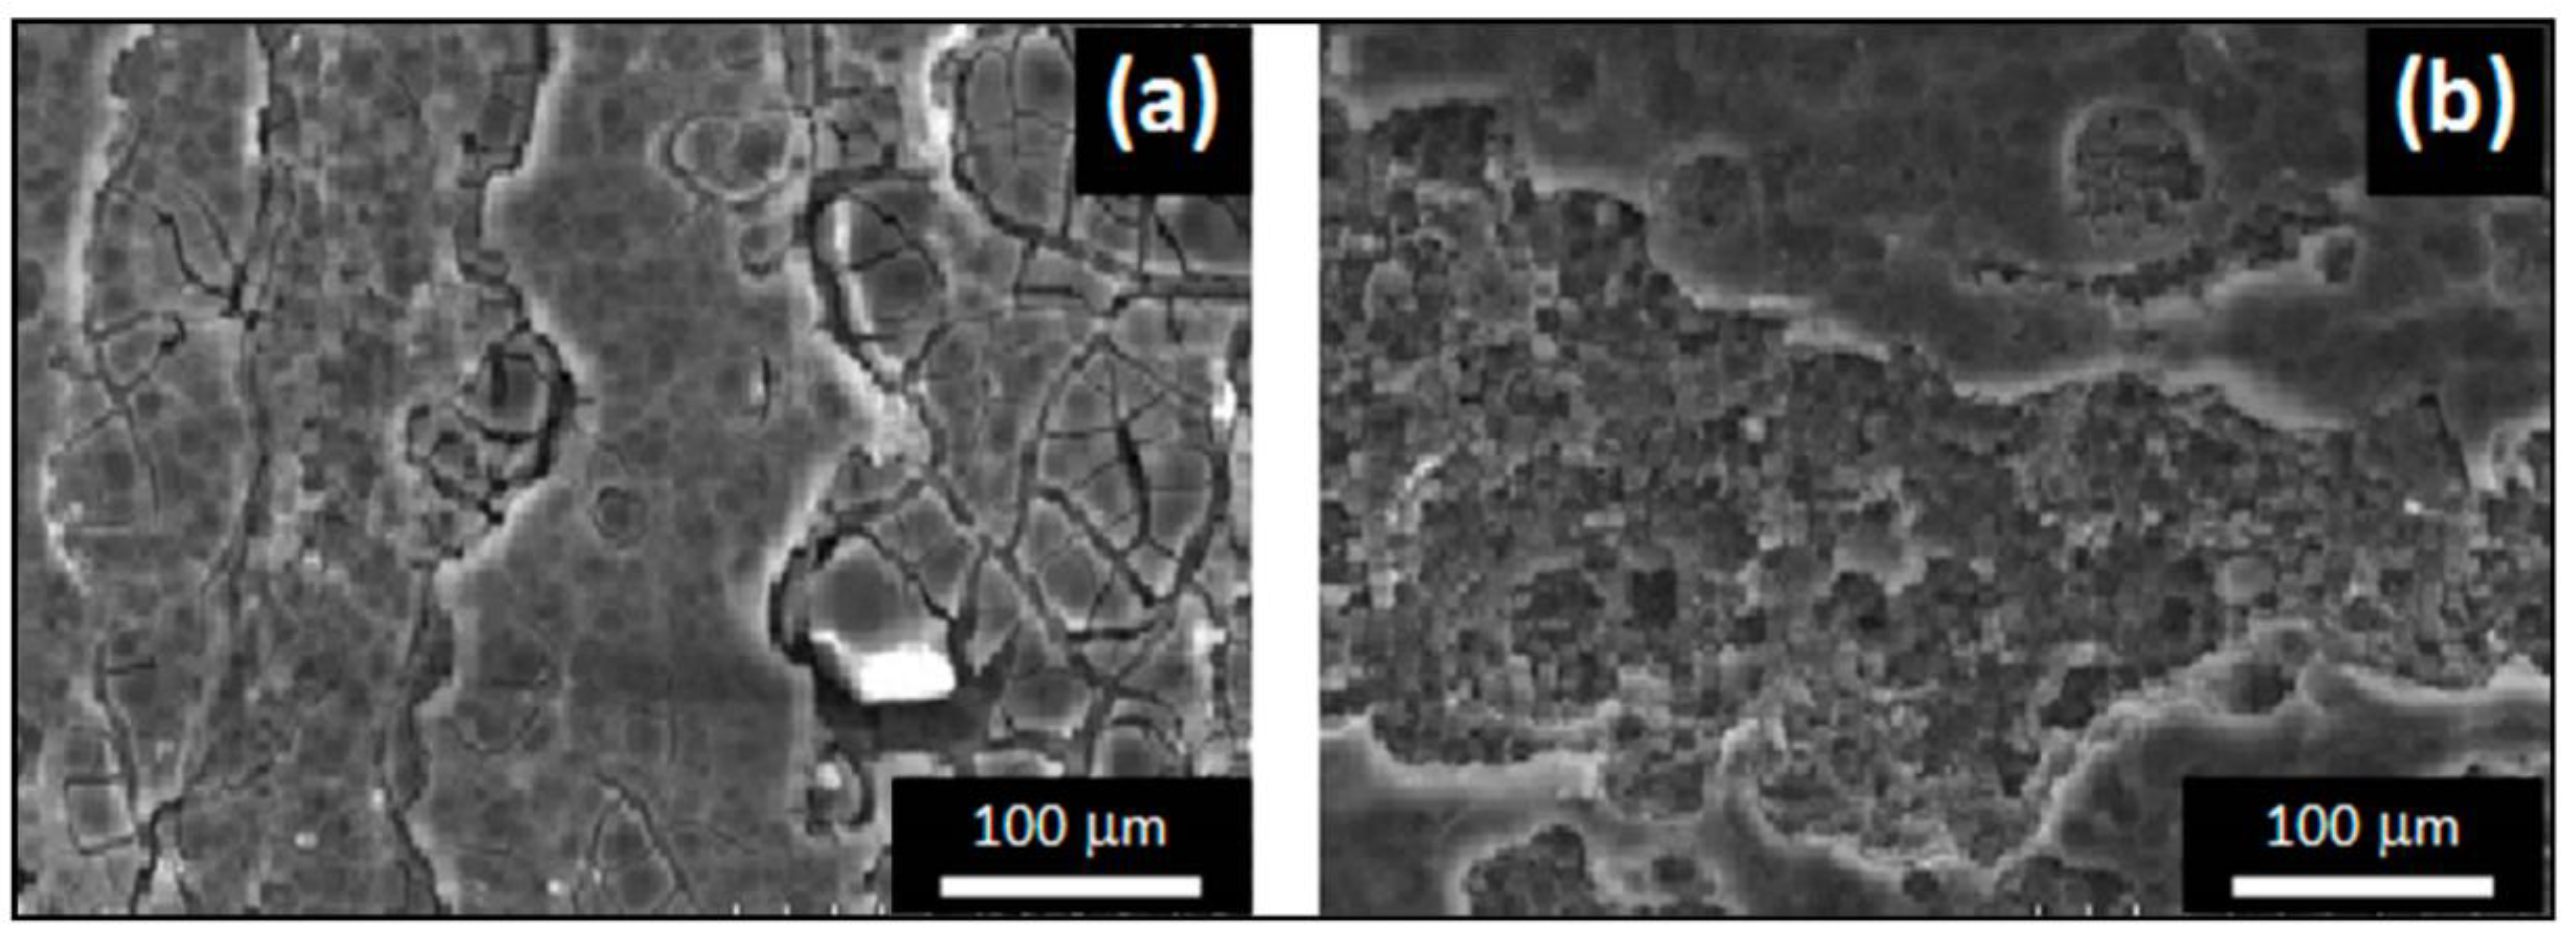
3.3.2. Oxide or Passive Layer Breakdown Mechanism and Pit Morphology
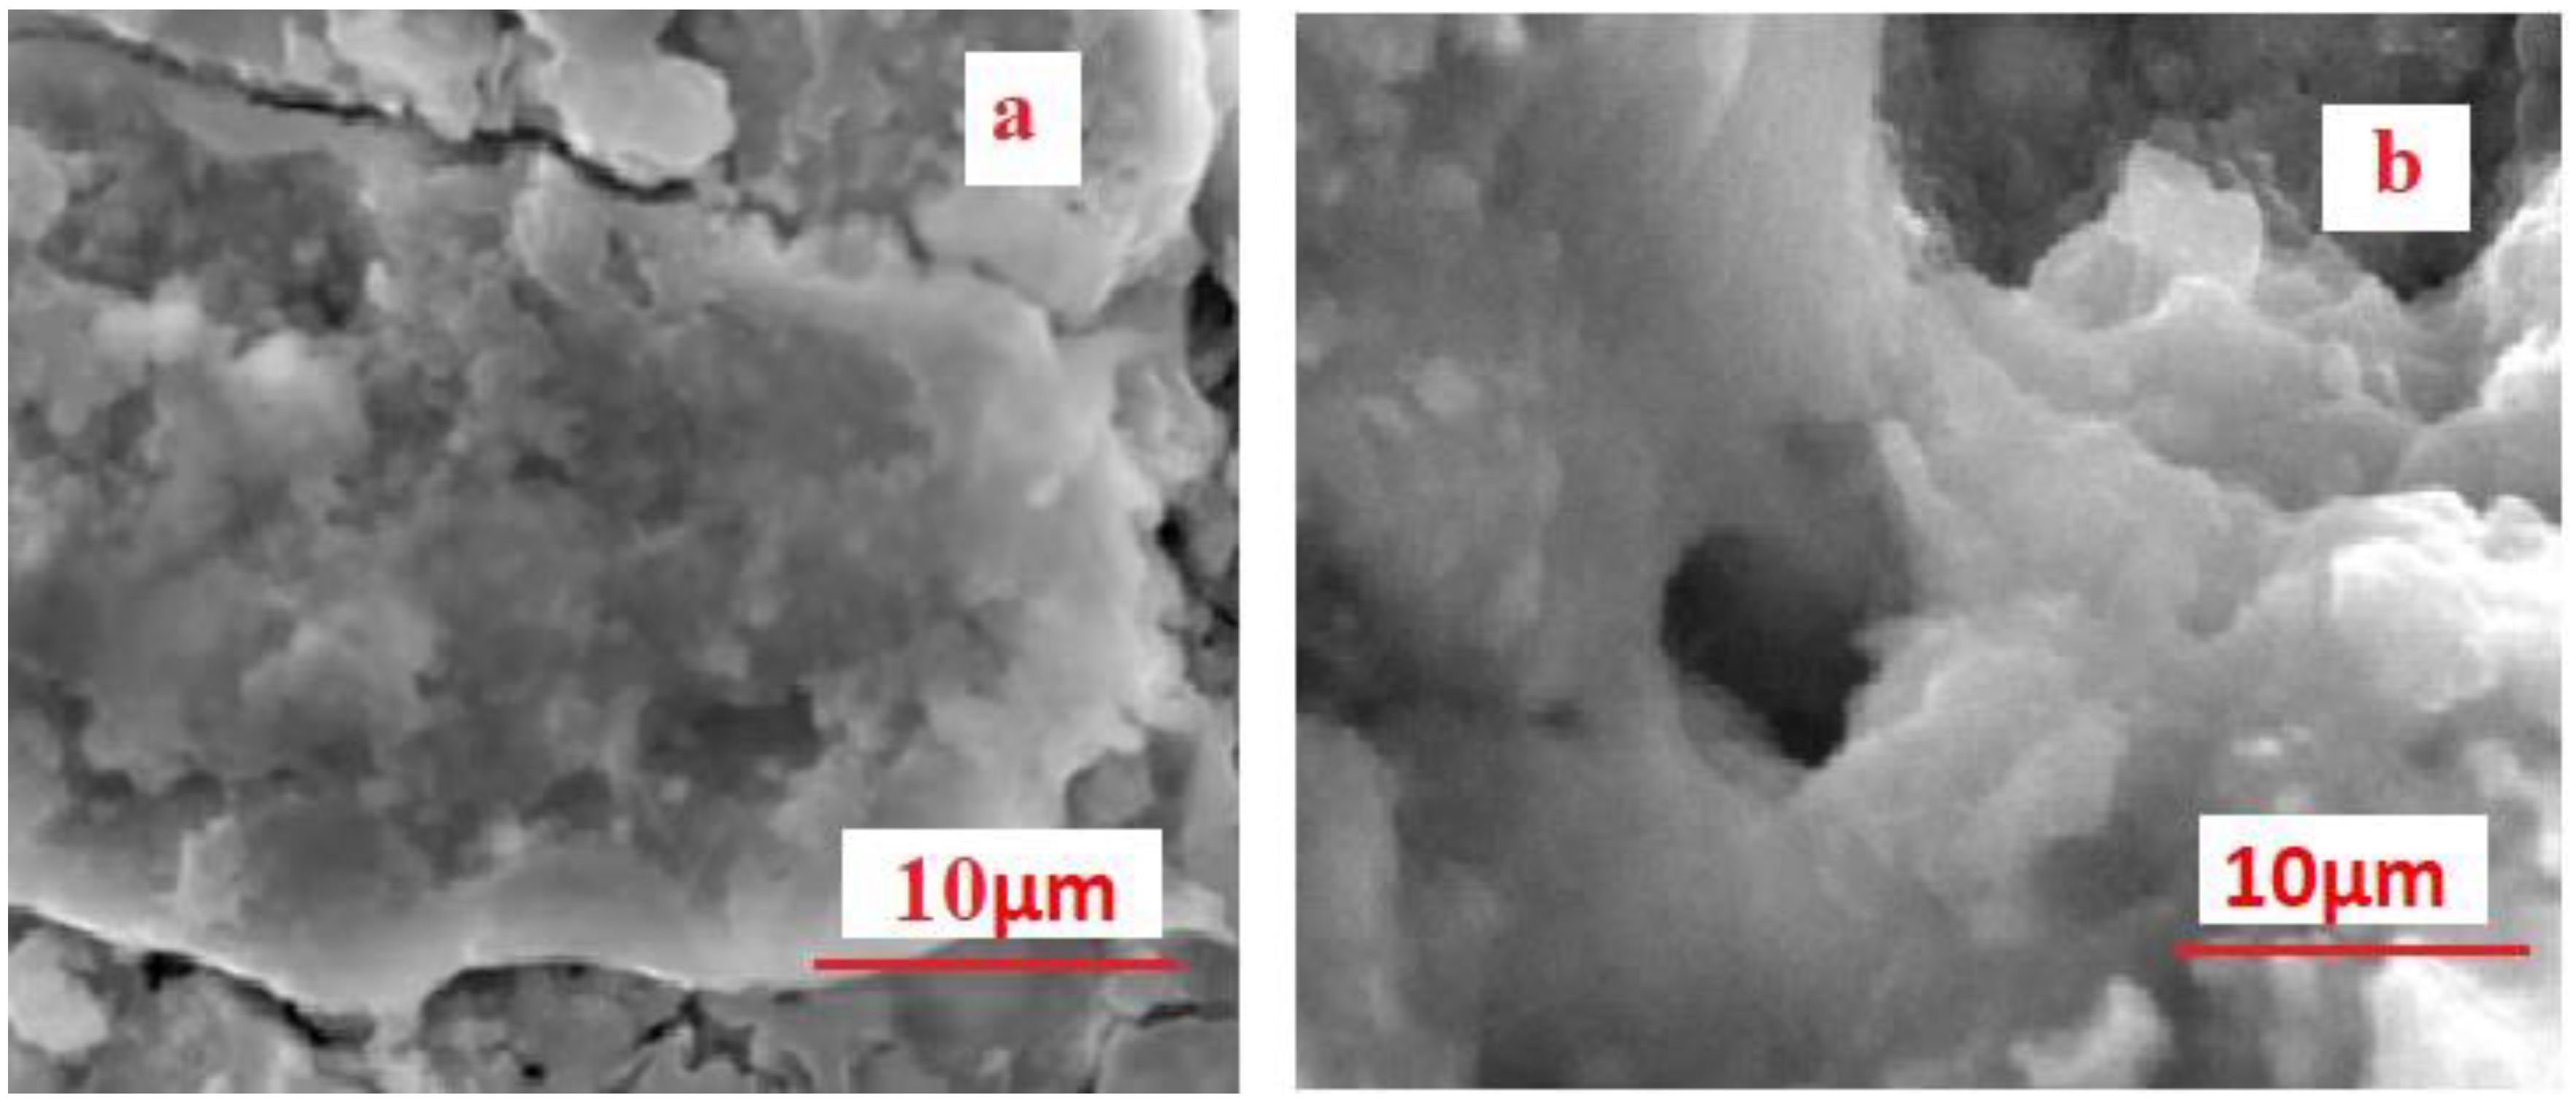
Figure 5a,b shows the surface morphology of conventional rebar and DP rebar after oxide or passive layer breakdown during anodic polarization in SCPS containing NaCl. The surface morphologies showing pitting on the surface seemed different, although the electrolyte composition used was the same. We observed cracks beside the pits formed by corrosion. In addition, we observed cracks initiating oxide or passive layer breakthrough at other places. Hydrogen absorption at the metal surface might be possible. Water molecules or hydrogen ions might get reduced at the metal surface and seep through the broken oxide or passive layer, facilitating hydrogen absorption, which might form hydrides [
34,
38]. This generates tensile stress, leading to crack initiation in the oxide or passive layer. Cracking inhibits repassivation and promotes active dissolution. Anodic dissolution and crack propagation are responsible for the growth of pits in the vertical (depth) and lateral directions, respectively.
We also observed unprompted passivity for DP rebar in alkaline solution with Cl− ions, which was stable under anodic polarization. Cl− ions showed a stronger effect, and alkaline layers revealed a greater steadiness for DP rebar. High Cl− ion concentrations in a strongly alkaline solution can induce breakdown of DP rebar passivity.
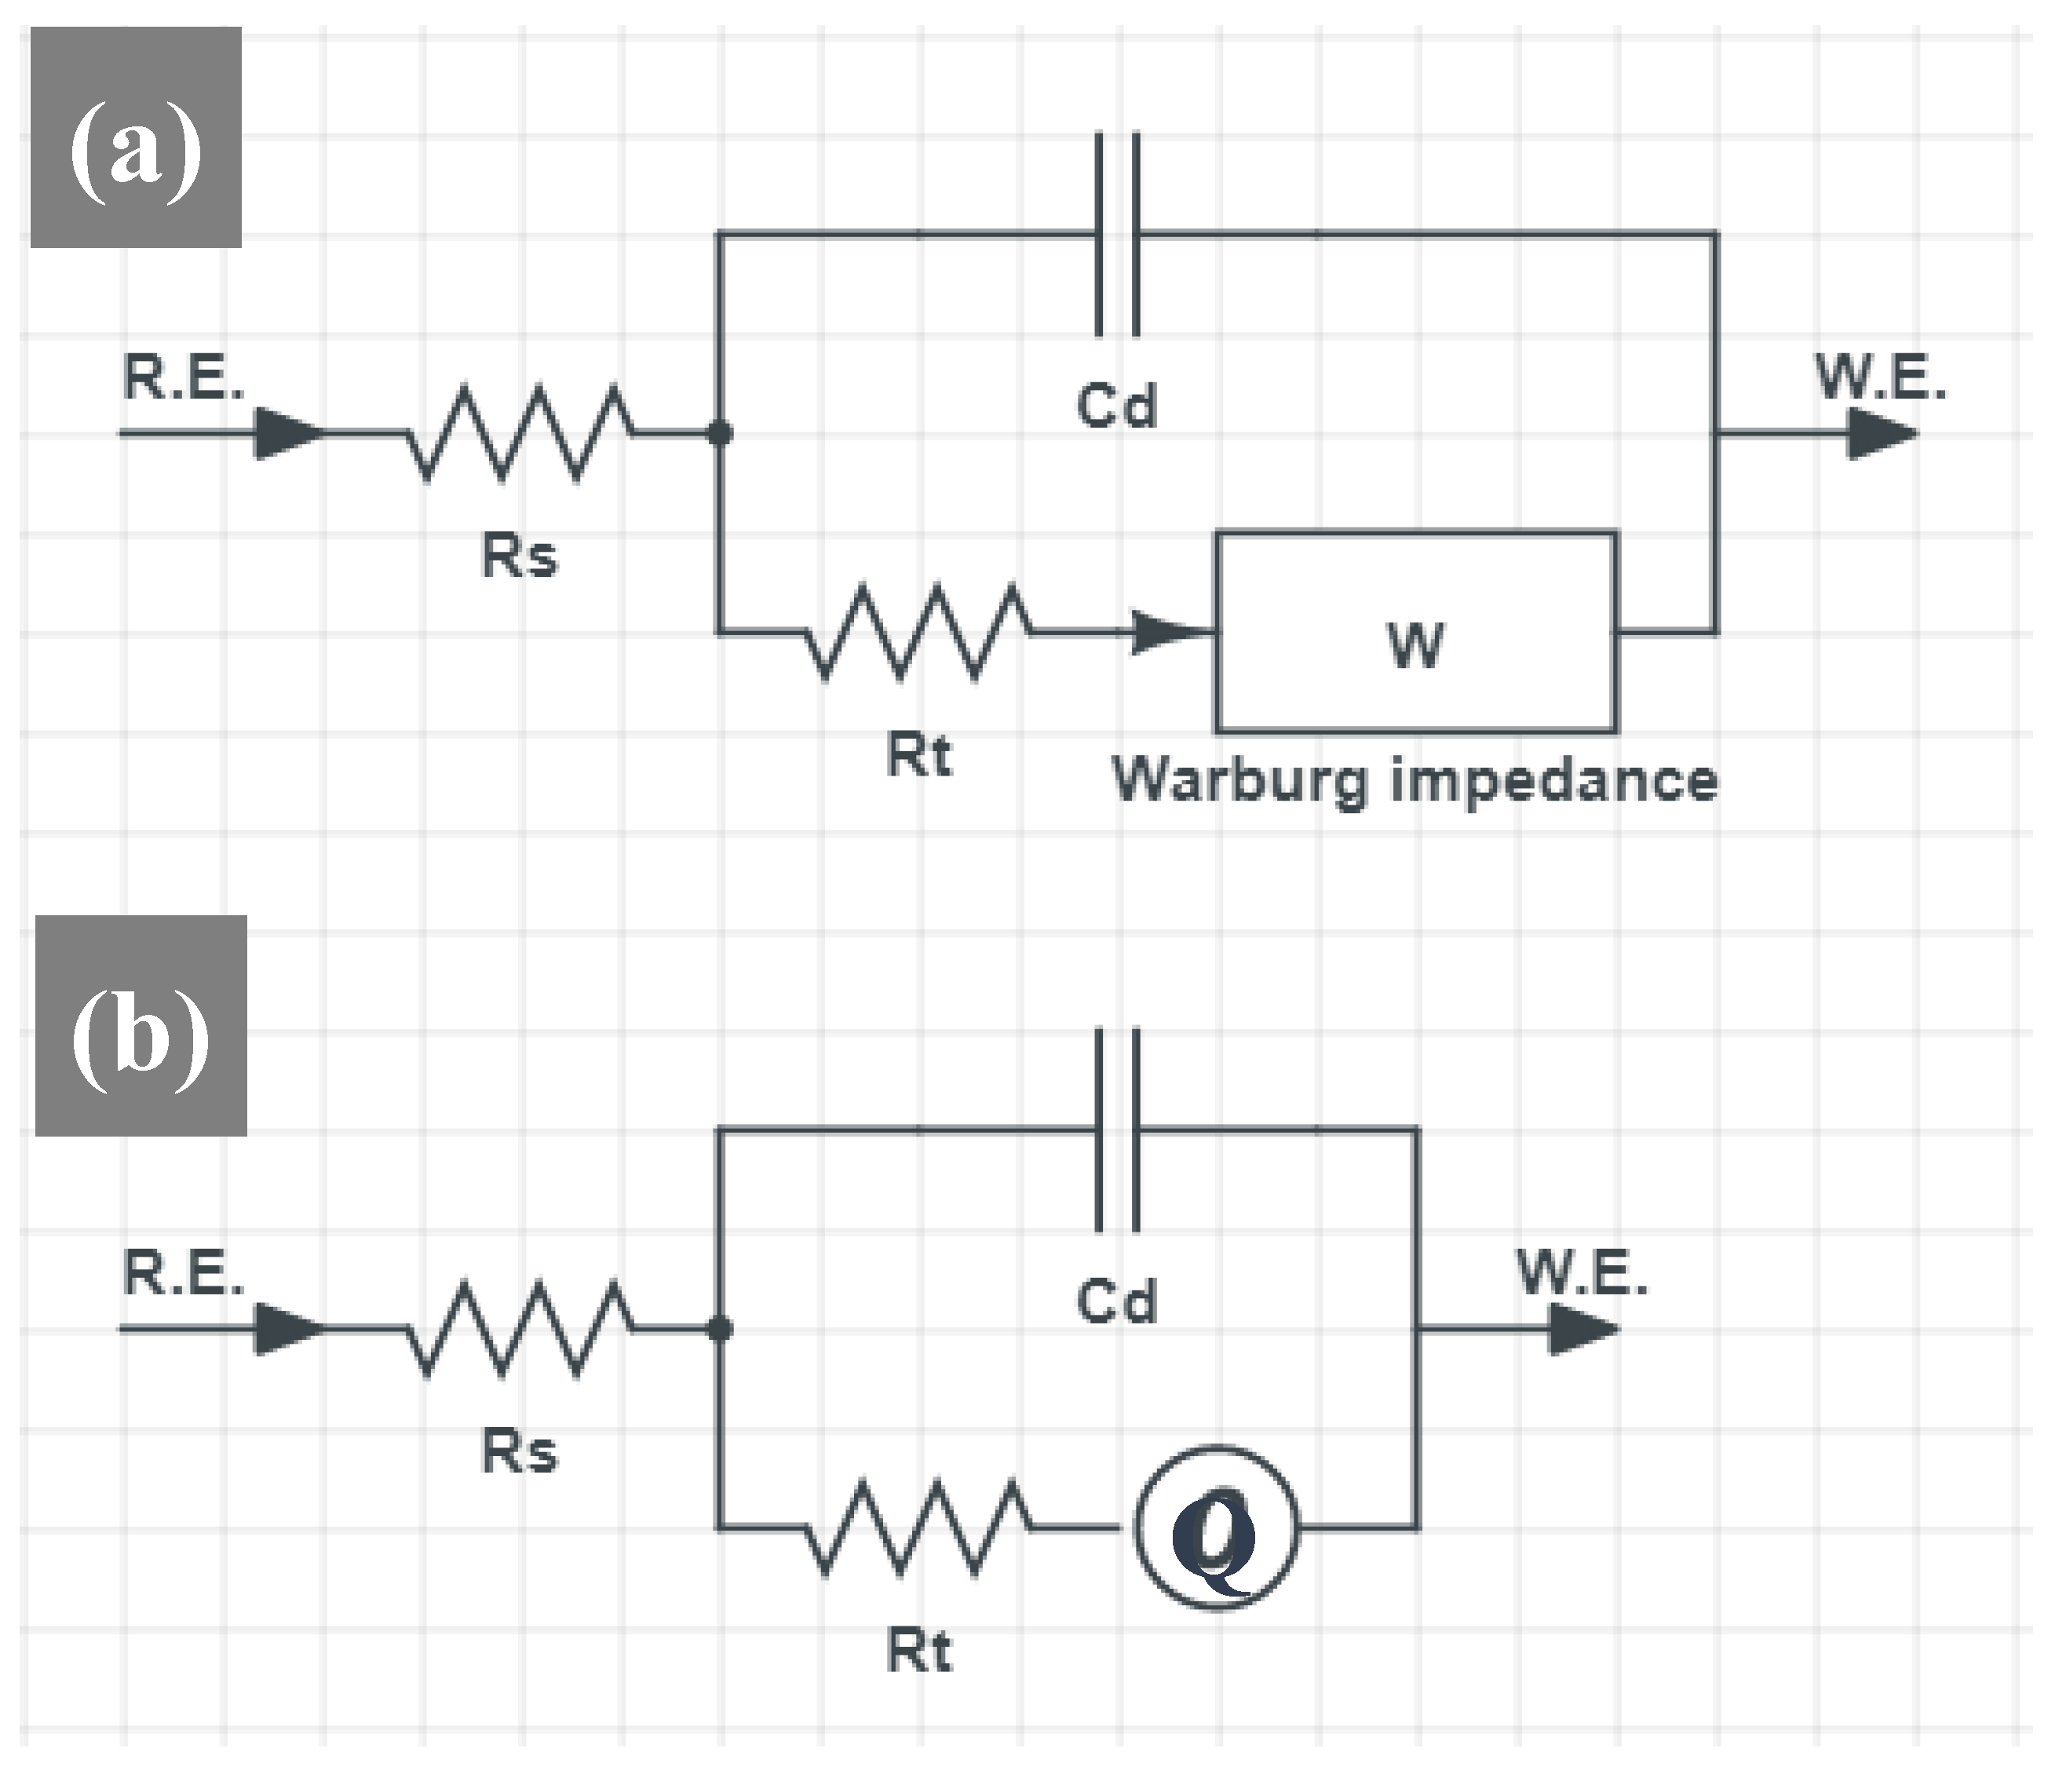
3.4. Electrochemical Impedance Spectroscopy
EIS results at 0 V (SCE) showed that diffusion controls oxide or passive layer growth in conventional rebar and DP rebar.
Figure 6 shows the equivalent circuit, where
Q is the constant phase element CPE,
RS the solution resistance,
W the Warburg impedance, and
Rt the layer transition resistance. According to diffusion boundary conditions, there are three types of diffusion impedances for plane electrodes [
39,
40].
Warburg impedance, one of the common diffusion impedances, assumes the infinity diffusion layer thickness. This equivalent circuit impedance can be expressed as follows:
where
the Faraday impedance and
ZW the Warburg impedance.
and
ZW are expressed as follows:
where
IF the Faraday current,
γ the series of the reactant in the electrode reaction,
ω the sine potential frequency,
n the chemical coefficient of electrode,
F the Faraday constant, and
D the diffusion coefficient.
When the Warburg impedance controls the electrode reaction, impedance is expressed as follows:
The second impedance is represented by cotangent hyperbolic (O) diffusion, and the impedance (
ZF) is expressed as follows:
where Q is the magnitude of admittance of the constant phase element CPE and n is the CPE exponent. The n value refers to the phase shift and can characterize different surface phenomena such as surface heterogeneity (inhomogeneity) resulting from surface roughness, dissolution of the metal, impurities, distribution of the active sites, or porous layer formation. The value of the coefficient (n) gives the frequency dependence.
Limiting values of the coefficient (n) are zero for a pure resistor and one for an ideal capacitor. Intermediate values of (n) indicate imperfect capacitive behavior and a CPE with (n = 0.5) usually referred to a Warburg Element, where χ2 gives the overall regression coefficient for the fit.
The interfacial charge transfer resistance Rt and the double layer capacitance Cd are the key parameters characterizing the passive behavior of ductile iron, while higher Rt and lower Cd on the surface of ductile iron results is meaning better corrosion resistance.
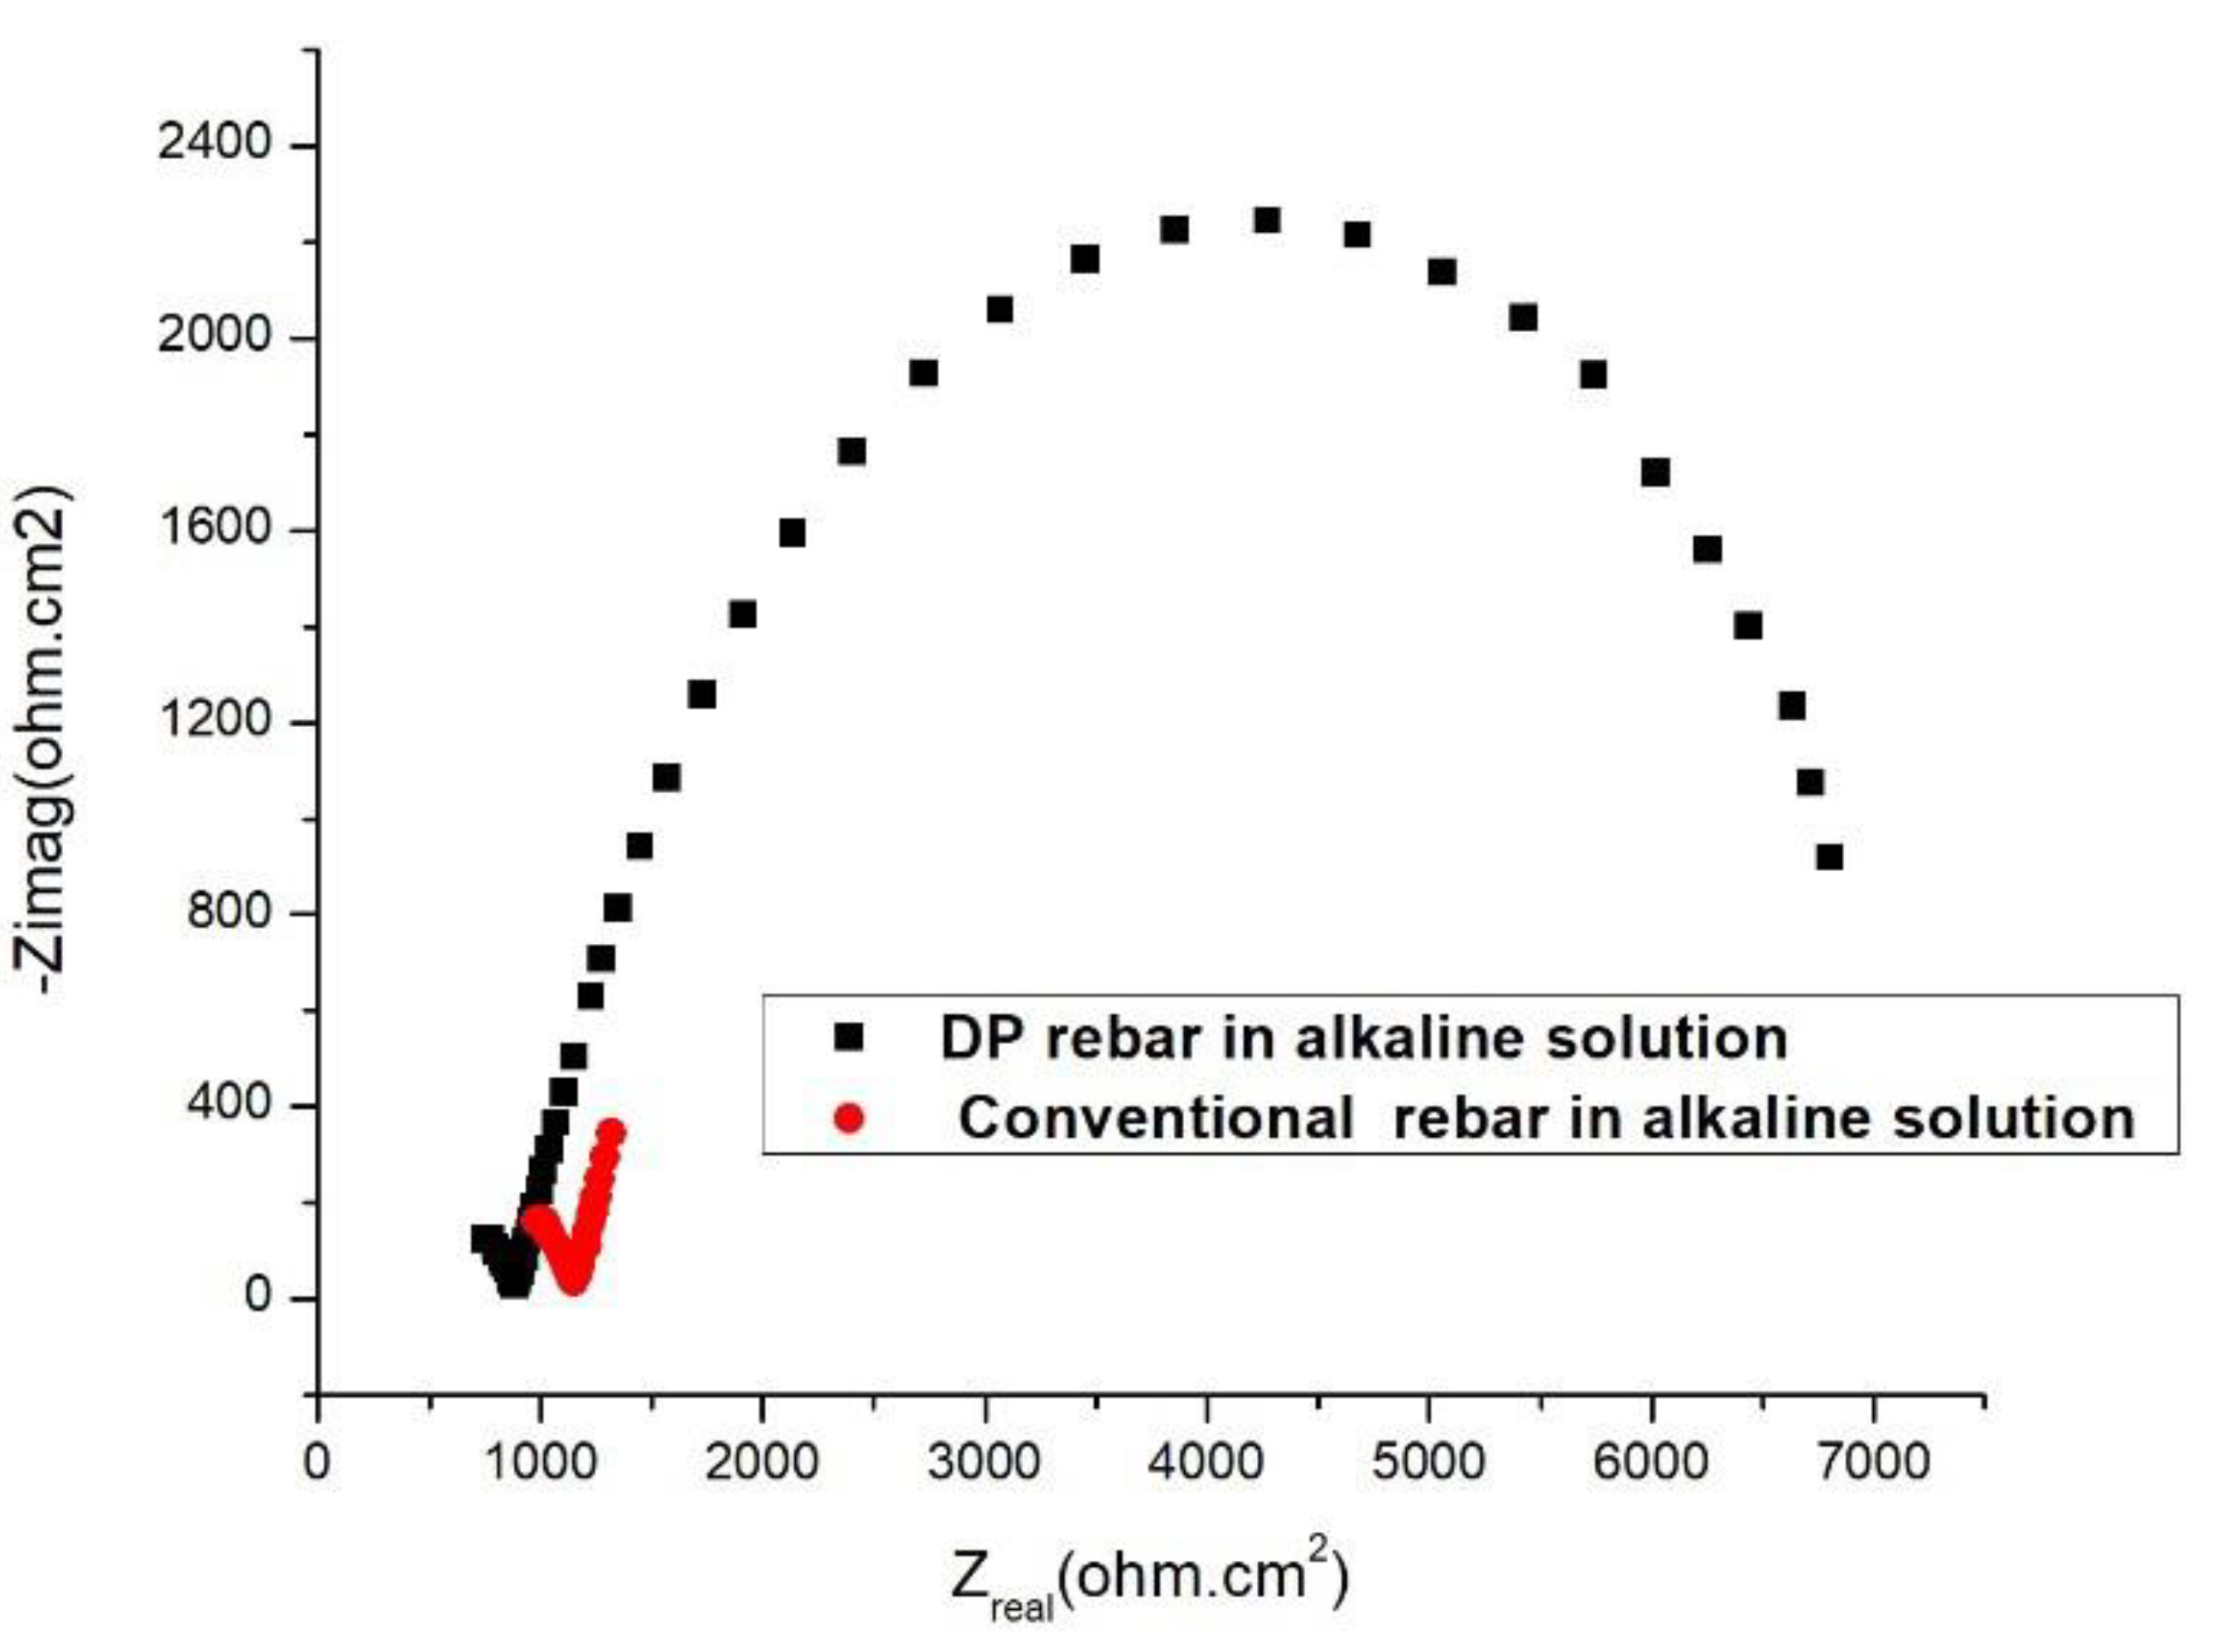
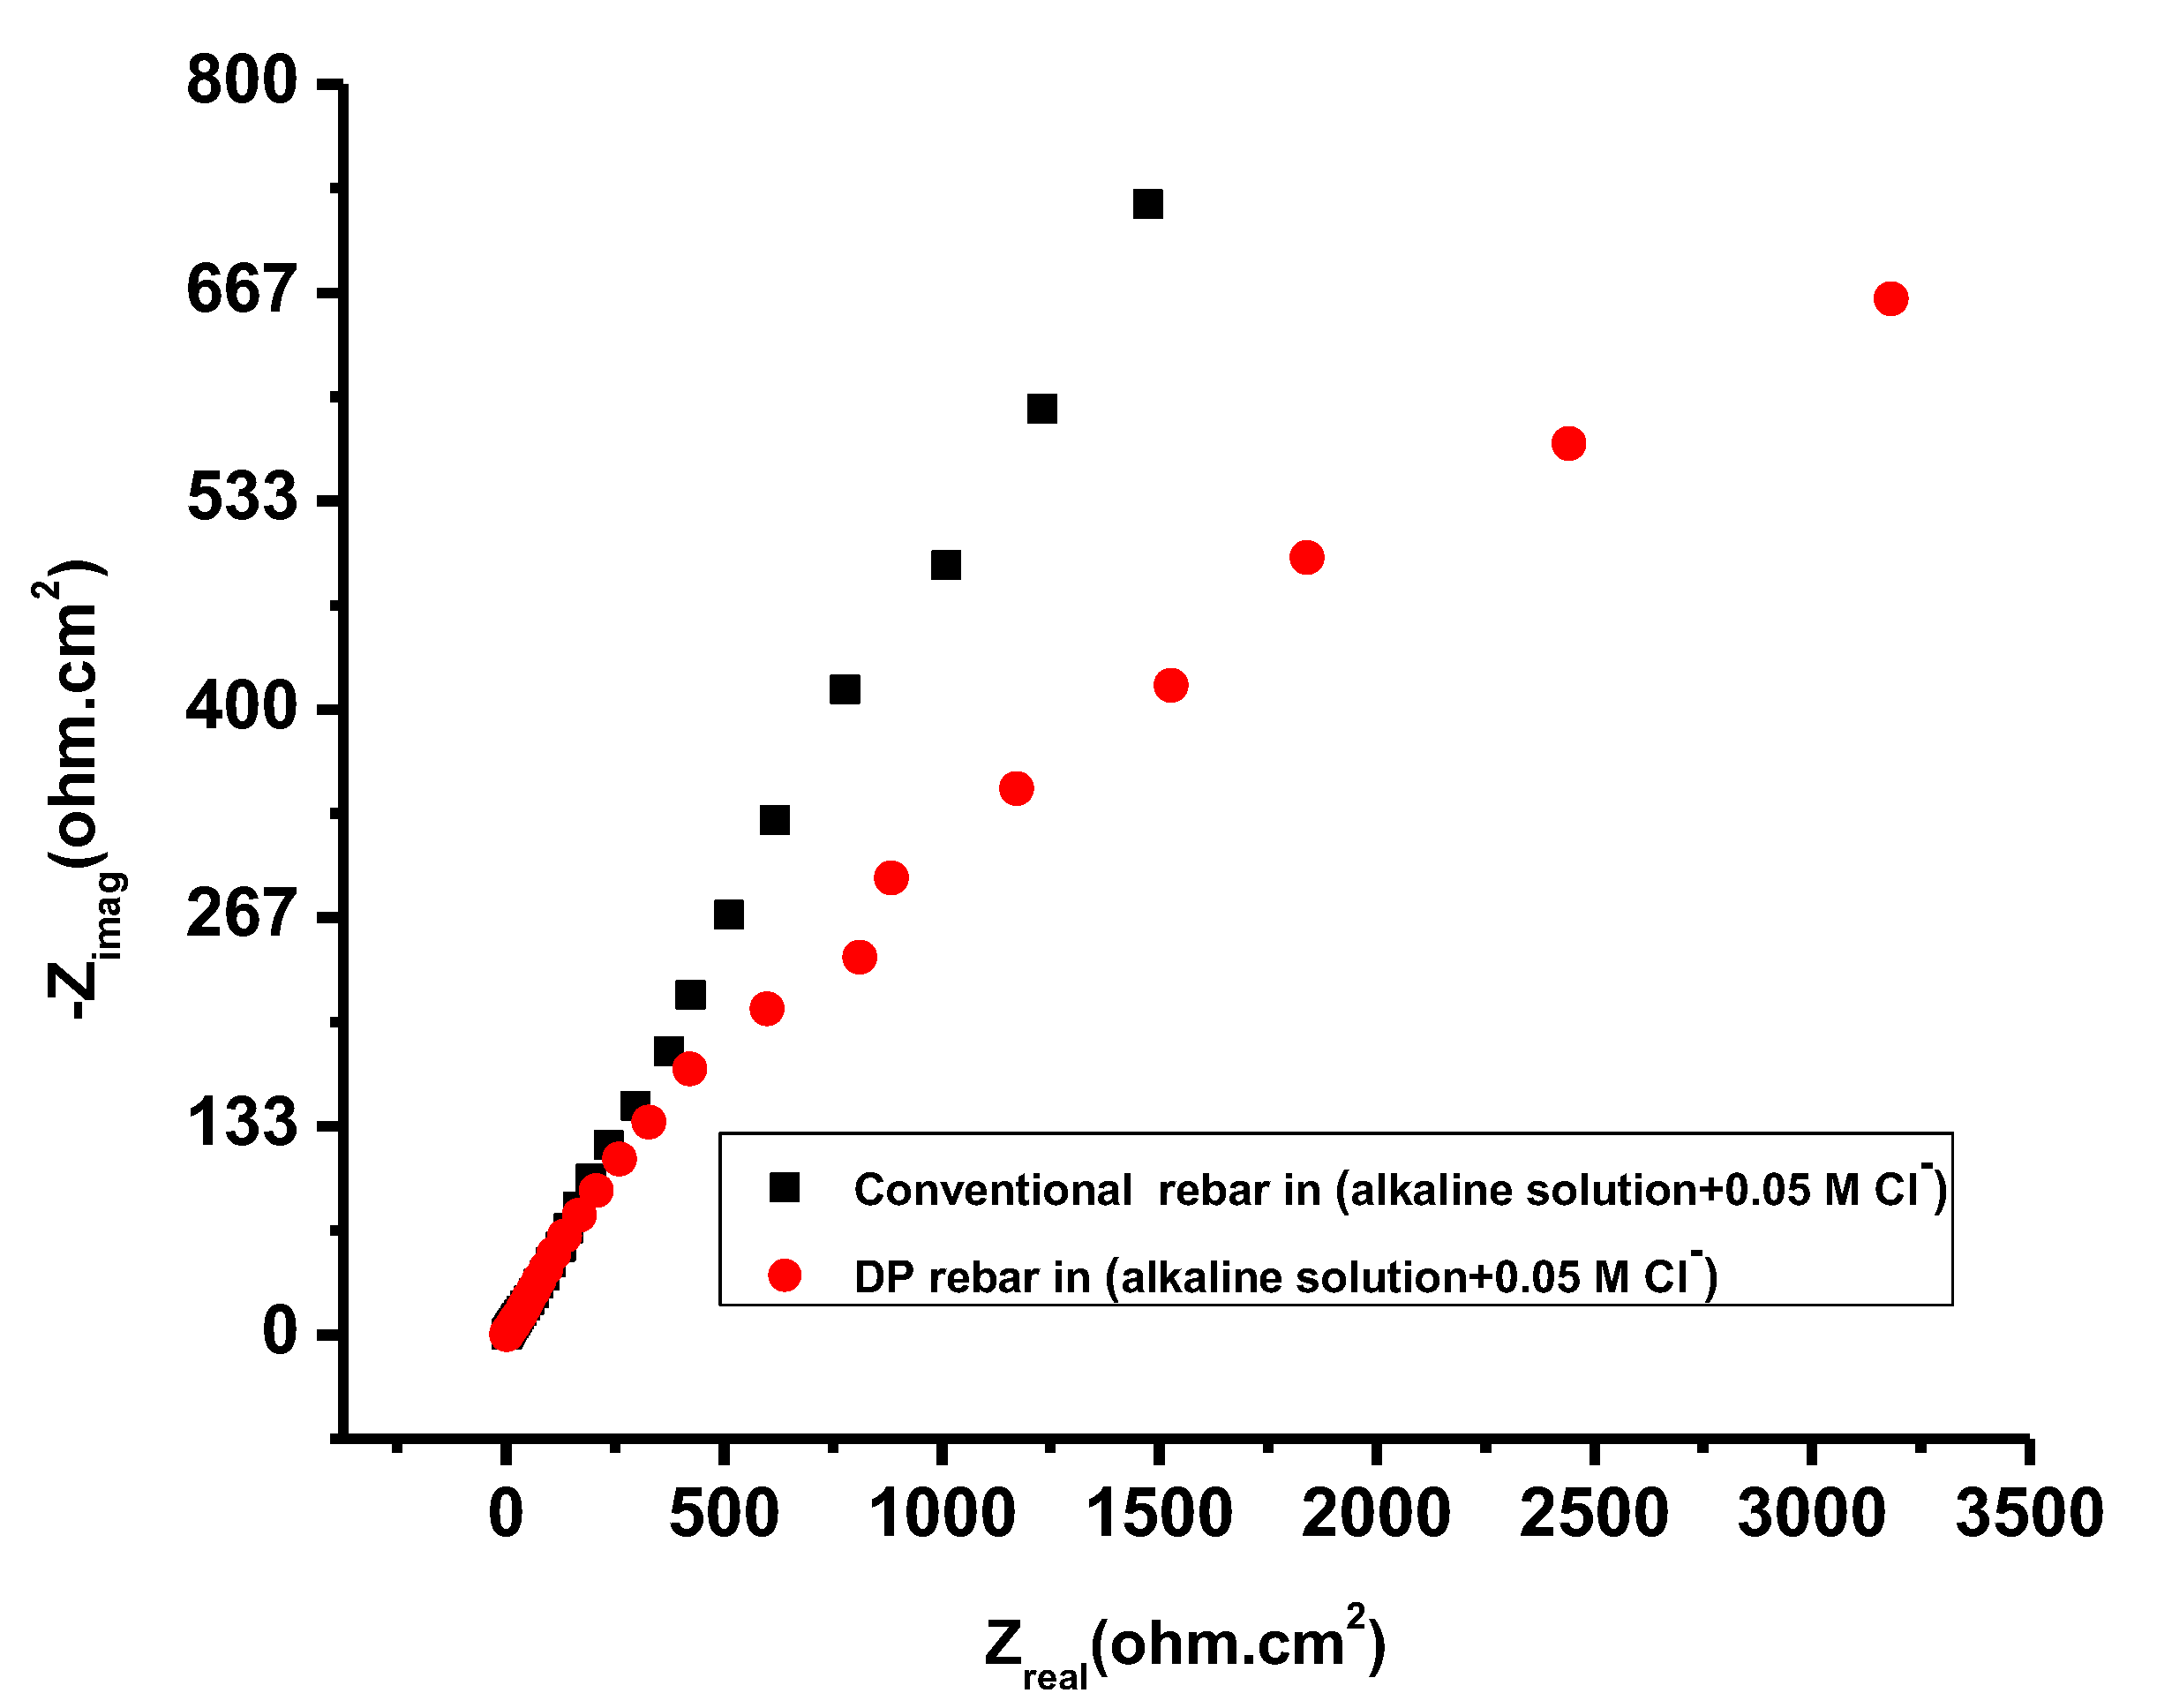
Figure 7,
Figure 8 and
Figure 9 show Nyquist planes for the above two diffusion elements. Experimental EIS spectra of conventional rebar and DP rebar are shown in
Figure 7. For DP rebar, the Nyquist plot indicates hyperbolic diffusion, which existed only in the passive process. In contrast, conventional rebar diffusion changed from the Warburg impedance (
W) to a high-frequency capacitive loop.
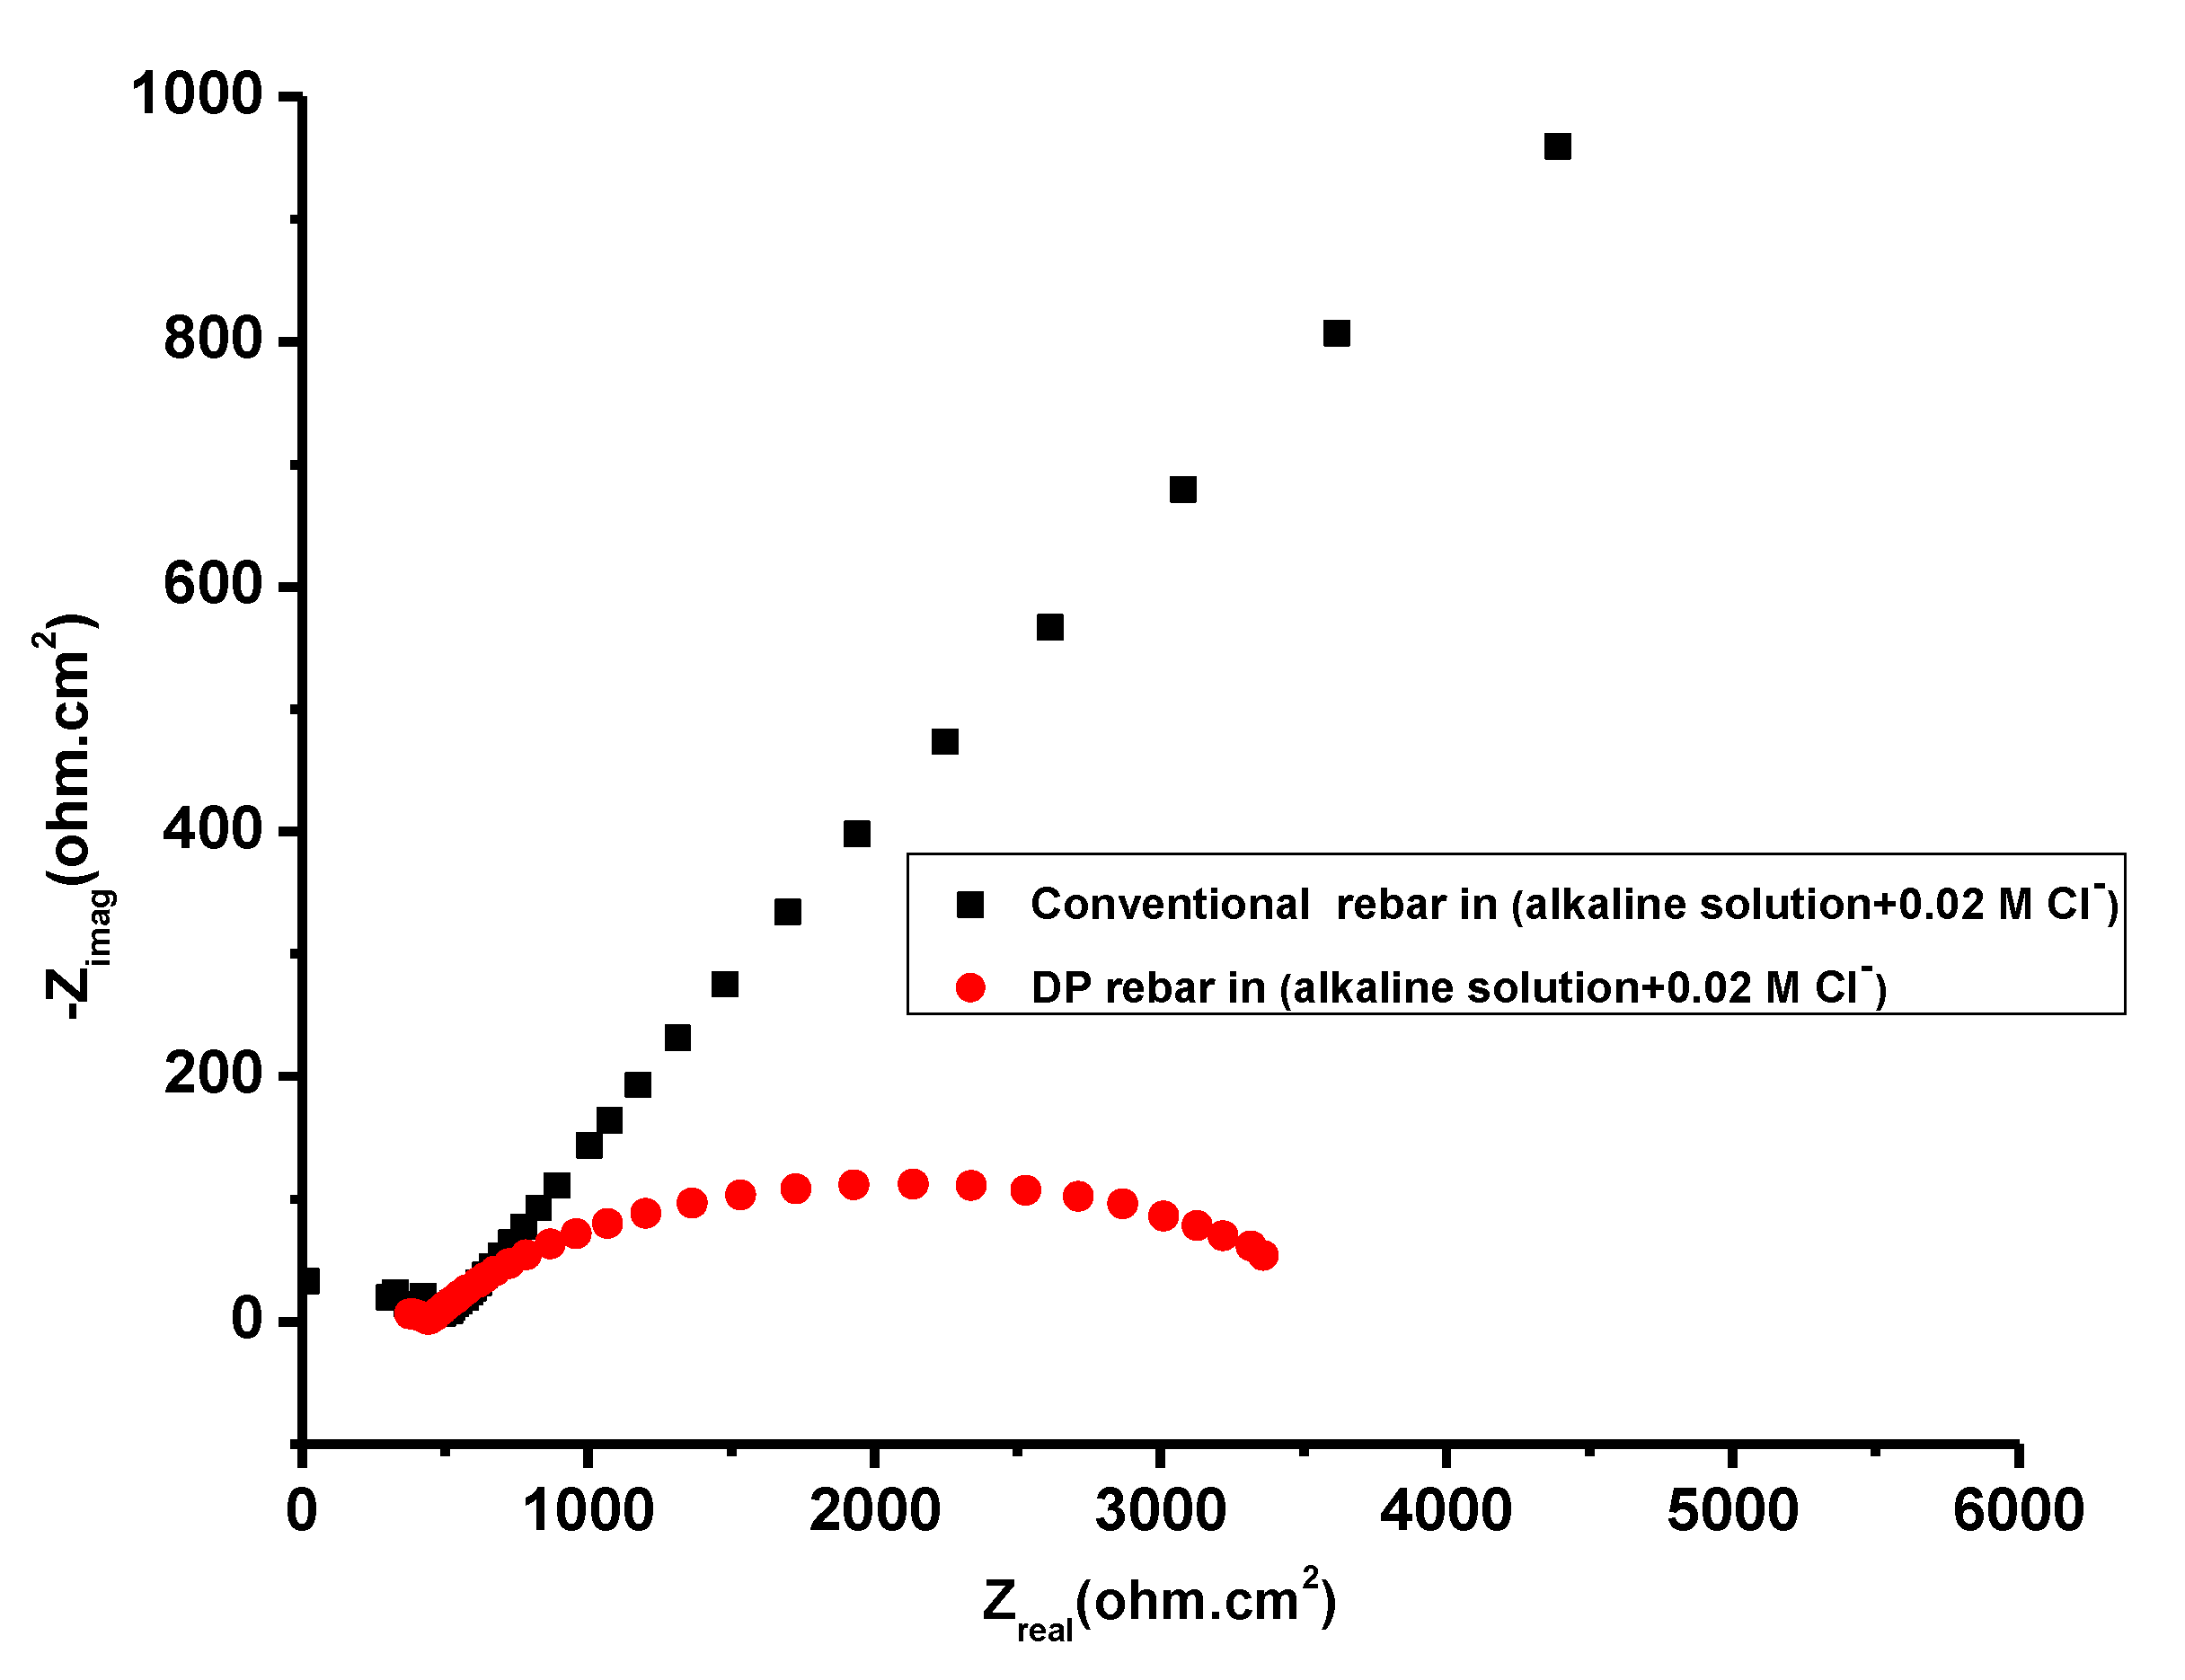
All parameters of potentiodynamic polarization and EIS results in an alkaline solution with and without different Cl
− ion concentrations are listed in
Table 2. The polarization resistance (
Rt) for the DP rebar oxide or passive layer was larger compared to conventional rebar. This result also verified that the passive current density of DP rebar is lower compared to conventional rebar as concluded from
Figure 8 and
Figure 9.
3.5. Capacitance
The oxide or passive layer formed on metals significantly affects corrosion resistance [
41]. The layer usually exhibits semiconducting properties [
42,
43]. The most common technique for investigating the electronic properties of an oxide or passive layer is Mott–Schottky plot measurement, which characterizes the oxide or passive layer generated on metal surfaces. In this study, we used electrochemical capacitance measurements to characterize the electron properties of the oxide or passive layer formed on conventional rebar and DP rebar.
Capacitance
C is equal to the space charge capacitance
Csc. Referring to the Mott–Scottky principle, the relation between 1/
C2 and potential
E can be written as follows [
43]:
where
q is the electron charge,
Efb the flat band potential,
ε0 the vacuum permittivity,
ε the dielectric constant,
T the absolute temperature,
k the Boltzmann constant,
A the electrode area and
N the carrier concentration. We can calculate the semiconductor type from the
V versus 1/
C2 plot. A p-type semiconductor can be detected from the negative slope, while an n-type semiconductor is associated with the positive slope of the oxide or passive layer.
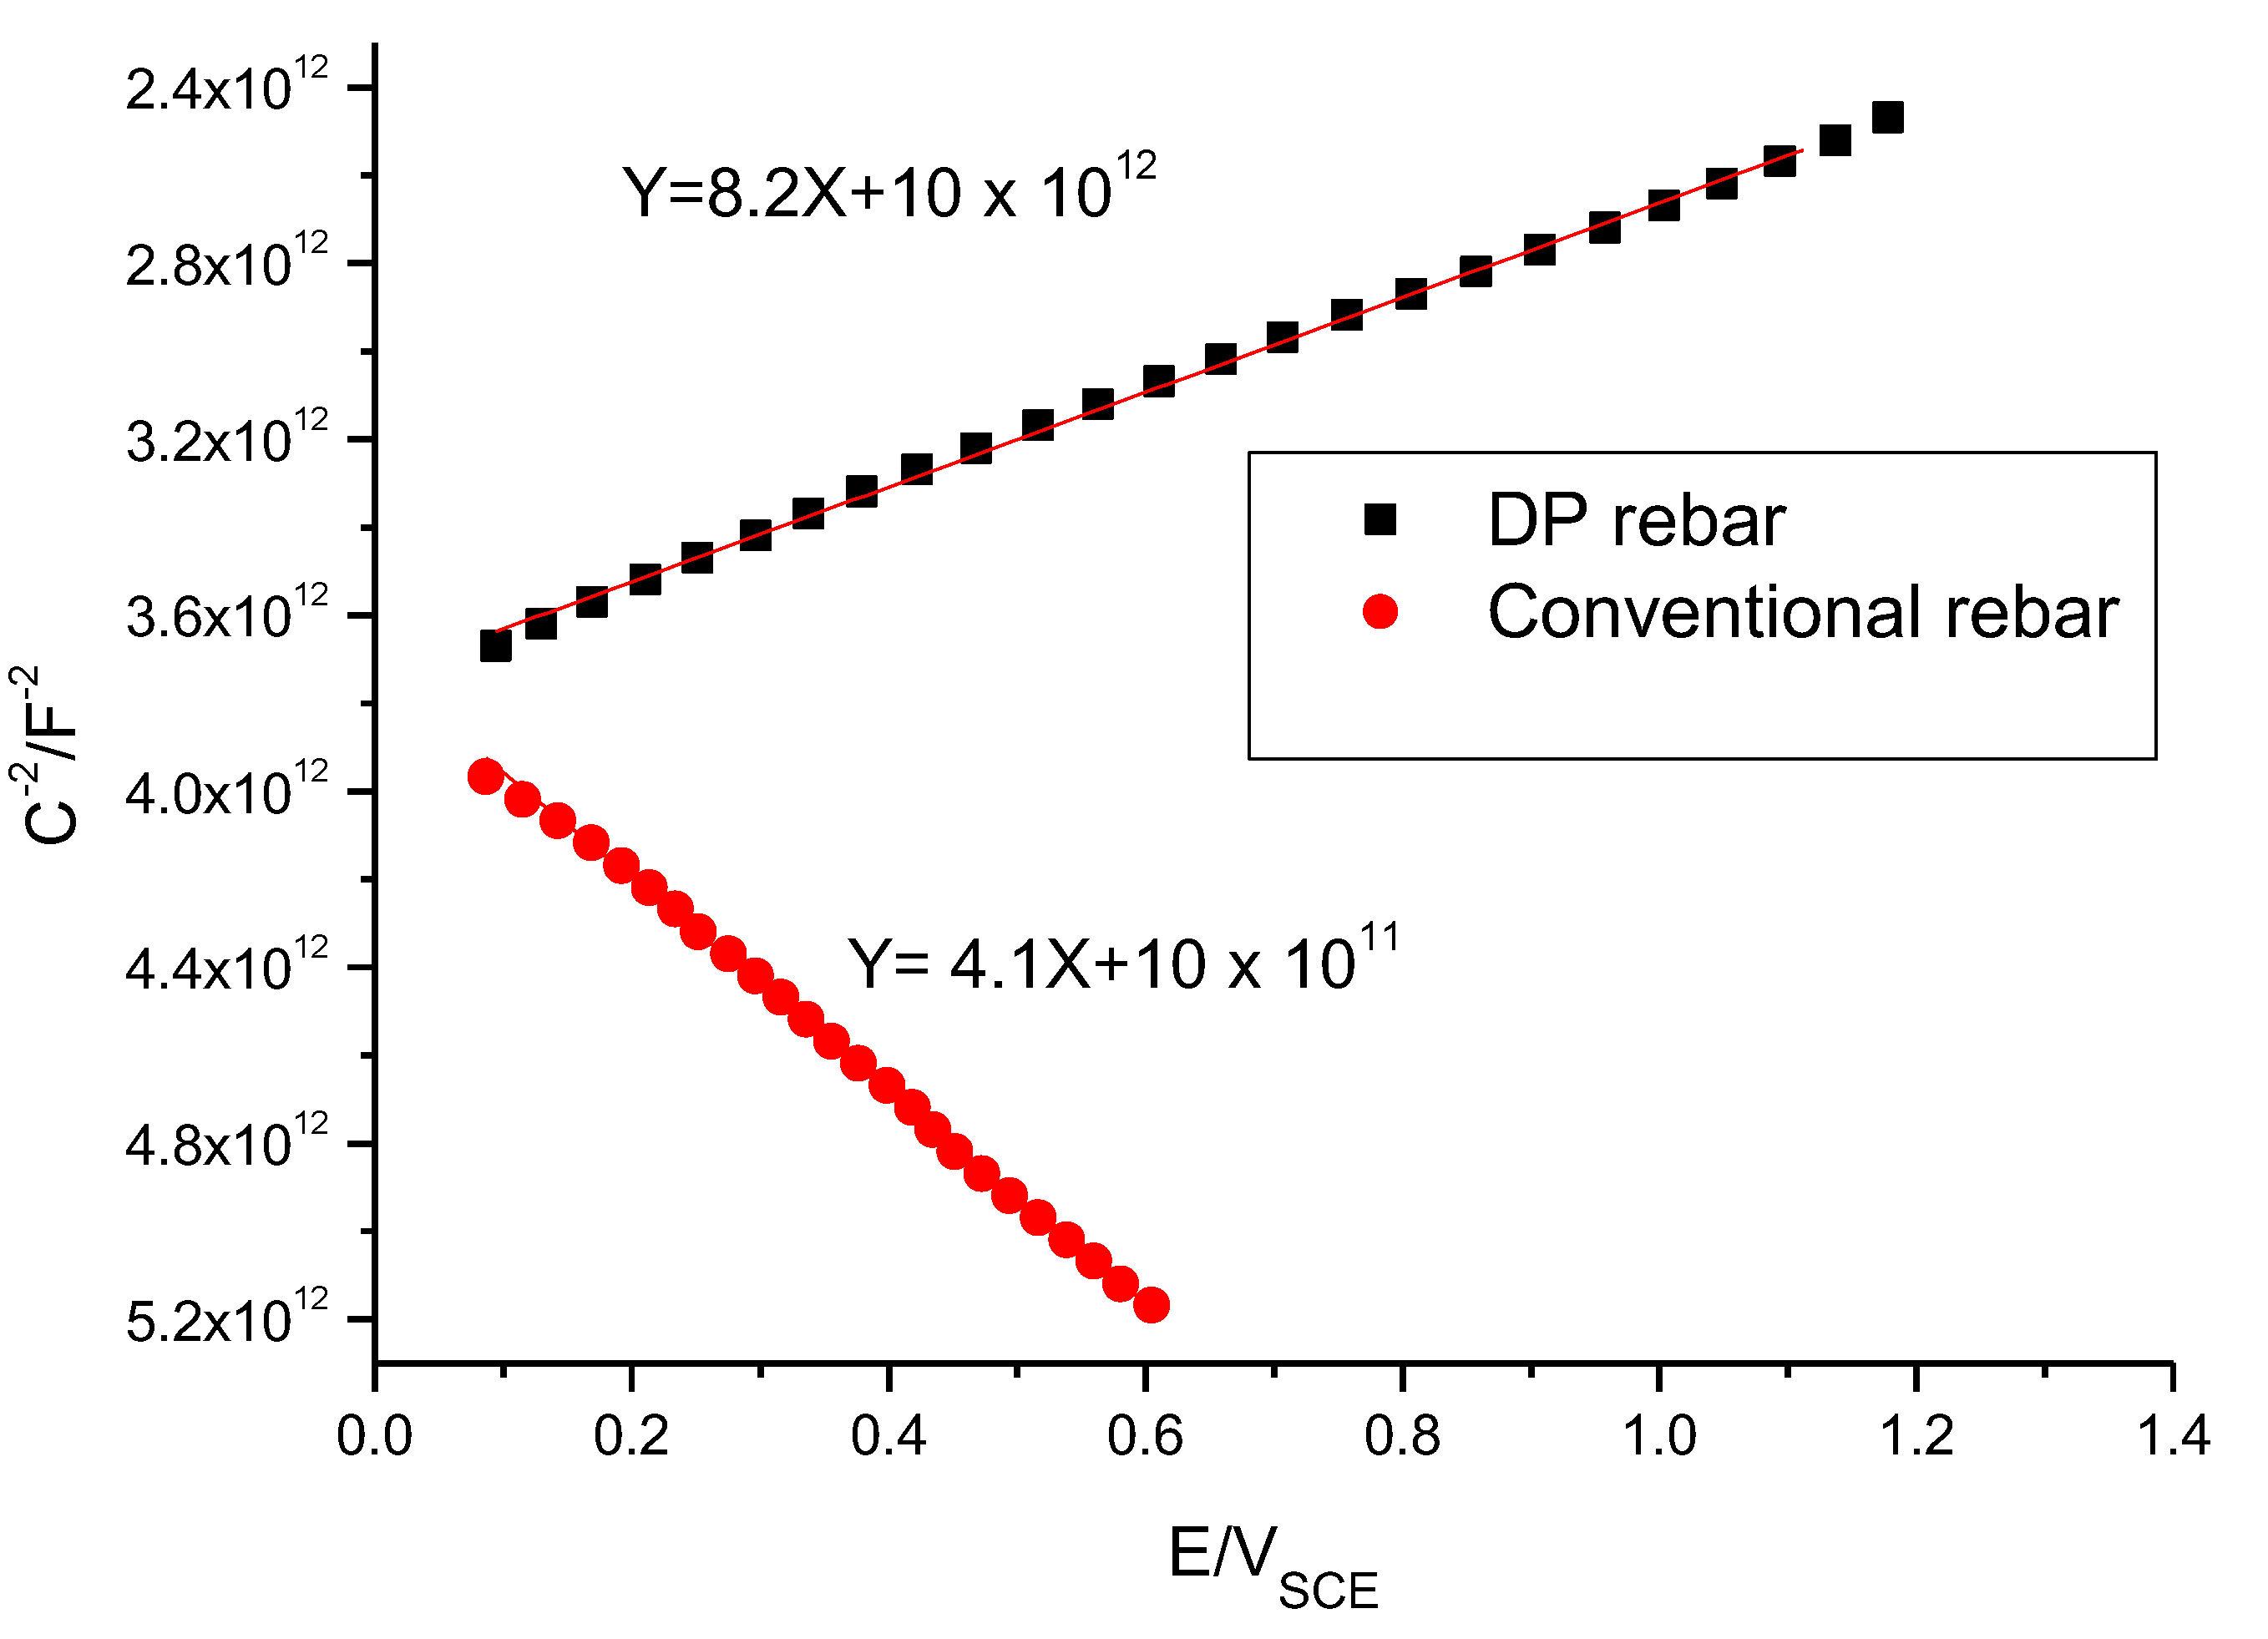
Figure 10 shows the Mott–Schottky plot of the oxide or passive layers for conventional rebar and DP rebar. The positive slopes obtained were associated with n-type semiconductors of the oxide or passive layer of both conventional rebar and DP rebar. Specifically, the rebar phase did not affect or change the semiconductor type. The slope of the
V versus 1/
C2 plot was contrariwise relational to the carrier concentration. The slope of DP rebar was larger compared to conventional rebar, indicating that the donor concentration in the oxide or passive layer of DP rebar is lower compared to conventional rebar.
Nd was obtained from the slopes: 1.67 × 10
22 cm
−3 for conventional rebar and 9.07 × 10
20 cm
−3 for DP rebar.
EIS results showed that passive layer formation of conventional rebar and DP rebar was diffusion controlled. During passive layer formation, the electrochemical stage is faster than the diffusion stage. The electrochemical stage is activated at the layer–metal interface, where metal ionization occurs. Oxygen vacancies or metal ions predominate in the oxide or passive layer because of a rapid electrochemical process. The oxide or passive layer is an n-type semiconductor, so the oxide or passive layers of conventional rebar and DP rebar are n-type semiconductors. The EF of the electrode decreases if anode polarization is applied to the passive electrode, which bends the energy band upward to the side of the electrolyte.
In conventional rebar, the electron (e−) originated from the conductive range in the oxide or passive layer, which resulted in increasing the magnitude of Nd. The more the donors the oxide or passive layer has, the easier the anodic reaction process is. In addition, the passive current density for conventional rebar is larger compared to DP rebar. The main conclusion is that in conventional rebar, an inner layer from pearlite oxide is formed in the oxide or passive layer, increasing the passive current density and forming an unstable oxide or passive layer.
As it can be seen from
Table 2, the current density is becoming higher with increasing chlorine percentage but increasing rate higher in case of conventional rebar compare to DP steel, which is in accordance with the values of E
corr. For the present study, the polarization curves are important because the anodic and cathodic slopes βa and βc were determined to be used in the calculation of corrosion rates. The Tafel regions in the polarization curves are well defined. Especially, βa and the Tafel slopes were the largest values, indicating that the diffusion of the specimens can have an influence on the rate-controlling step, whereas Tafel slopes with larger values βc are typical for systems, which are not purely activation, or diffusion controlled which will be associated to oxygen diffusion. In general, the cathodic curves pattern in all solution indicated the reduction reactions of both: hydrogen ions and oxygen.
3.6. Raman Spectroscopy
The rust compositions for conventional rebar and DP rebar were determined using Raman spectroscopy. The main products were oxyhydroxides or iron oxides, which represent the corrosion products of conventional rebar used for reinforcing construction cement. The composition of rust is iron (Fe) and iron oxide (Fe3O4). Low oxygen availability and the restricting concrete surrounding are the main reasons for Fe3O4 formation. Iron chloride (FeCl2) is generated because of the chloride augmented layer. The comparatively low-intensity peaks of FeCl2 might be due to the thin FeCl2 layer. In some regions, the Fe3O4, γ-FeOOH, and α-FeOOH formation indicates more oxidation, which might contribute to the cracking characteristics of the rust formed. There is a greater probability of γ-Fe2O3 formation because of additional crystallization and dehydration at higher oxygen levels in external areas.
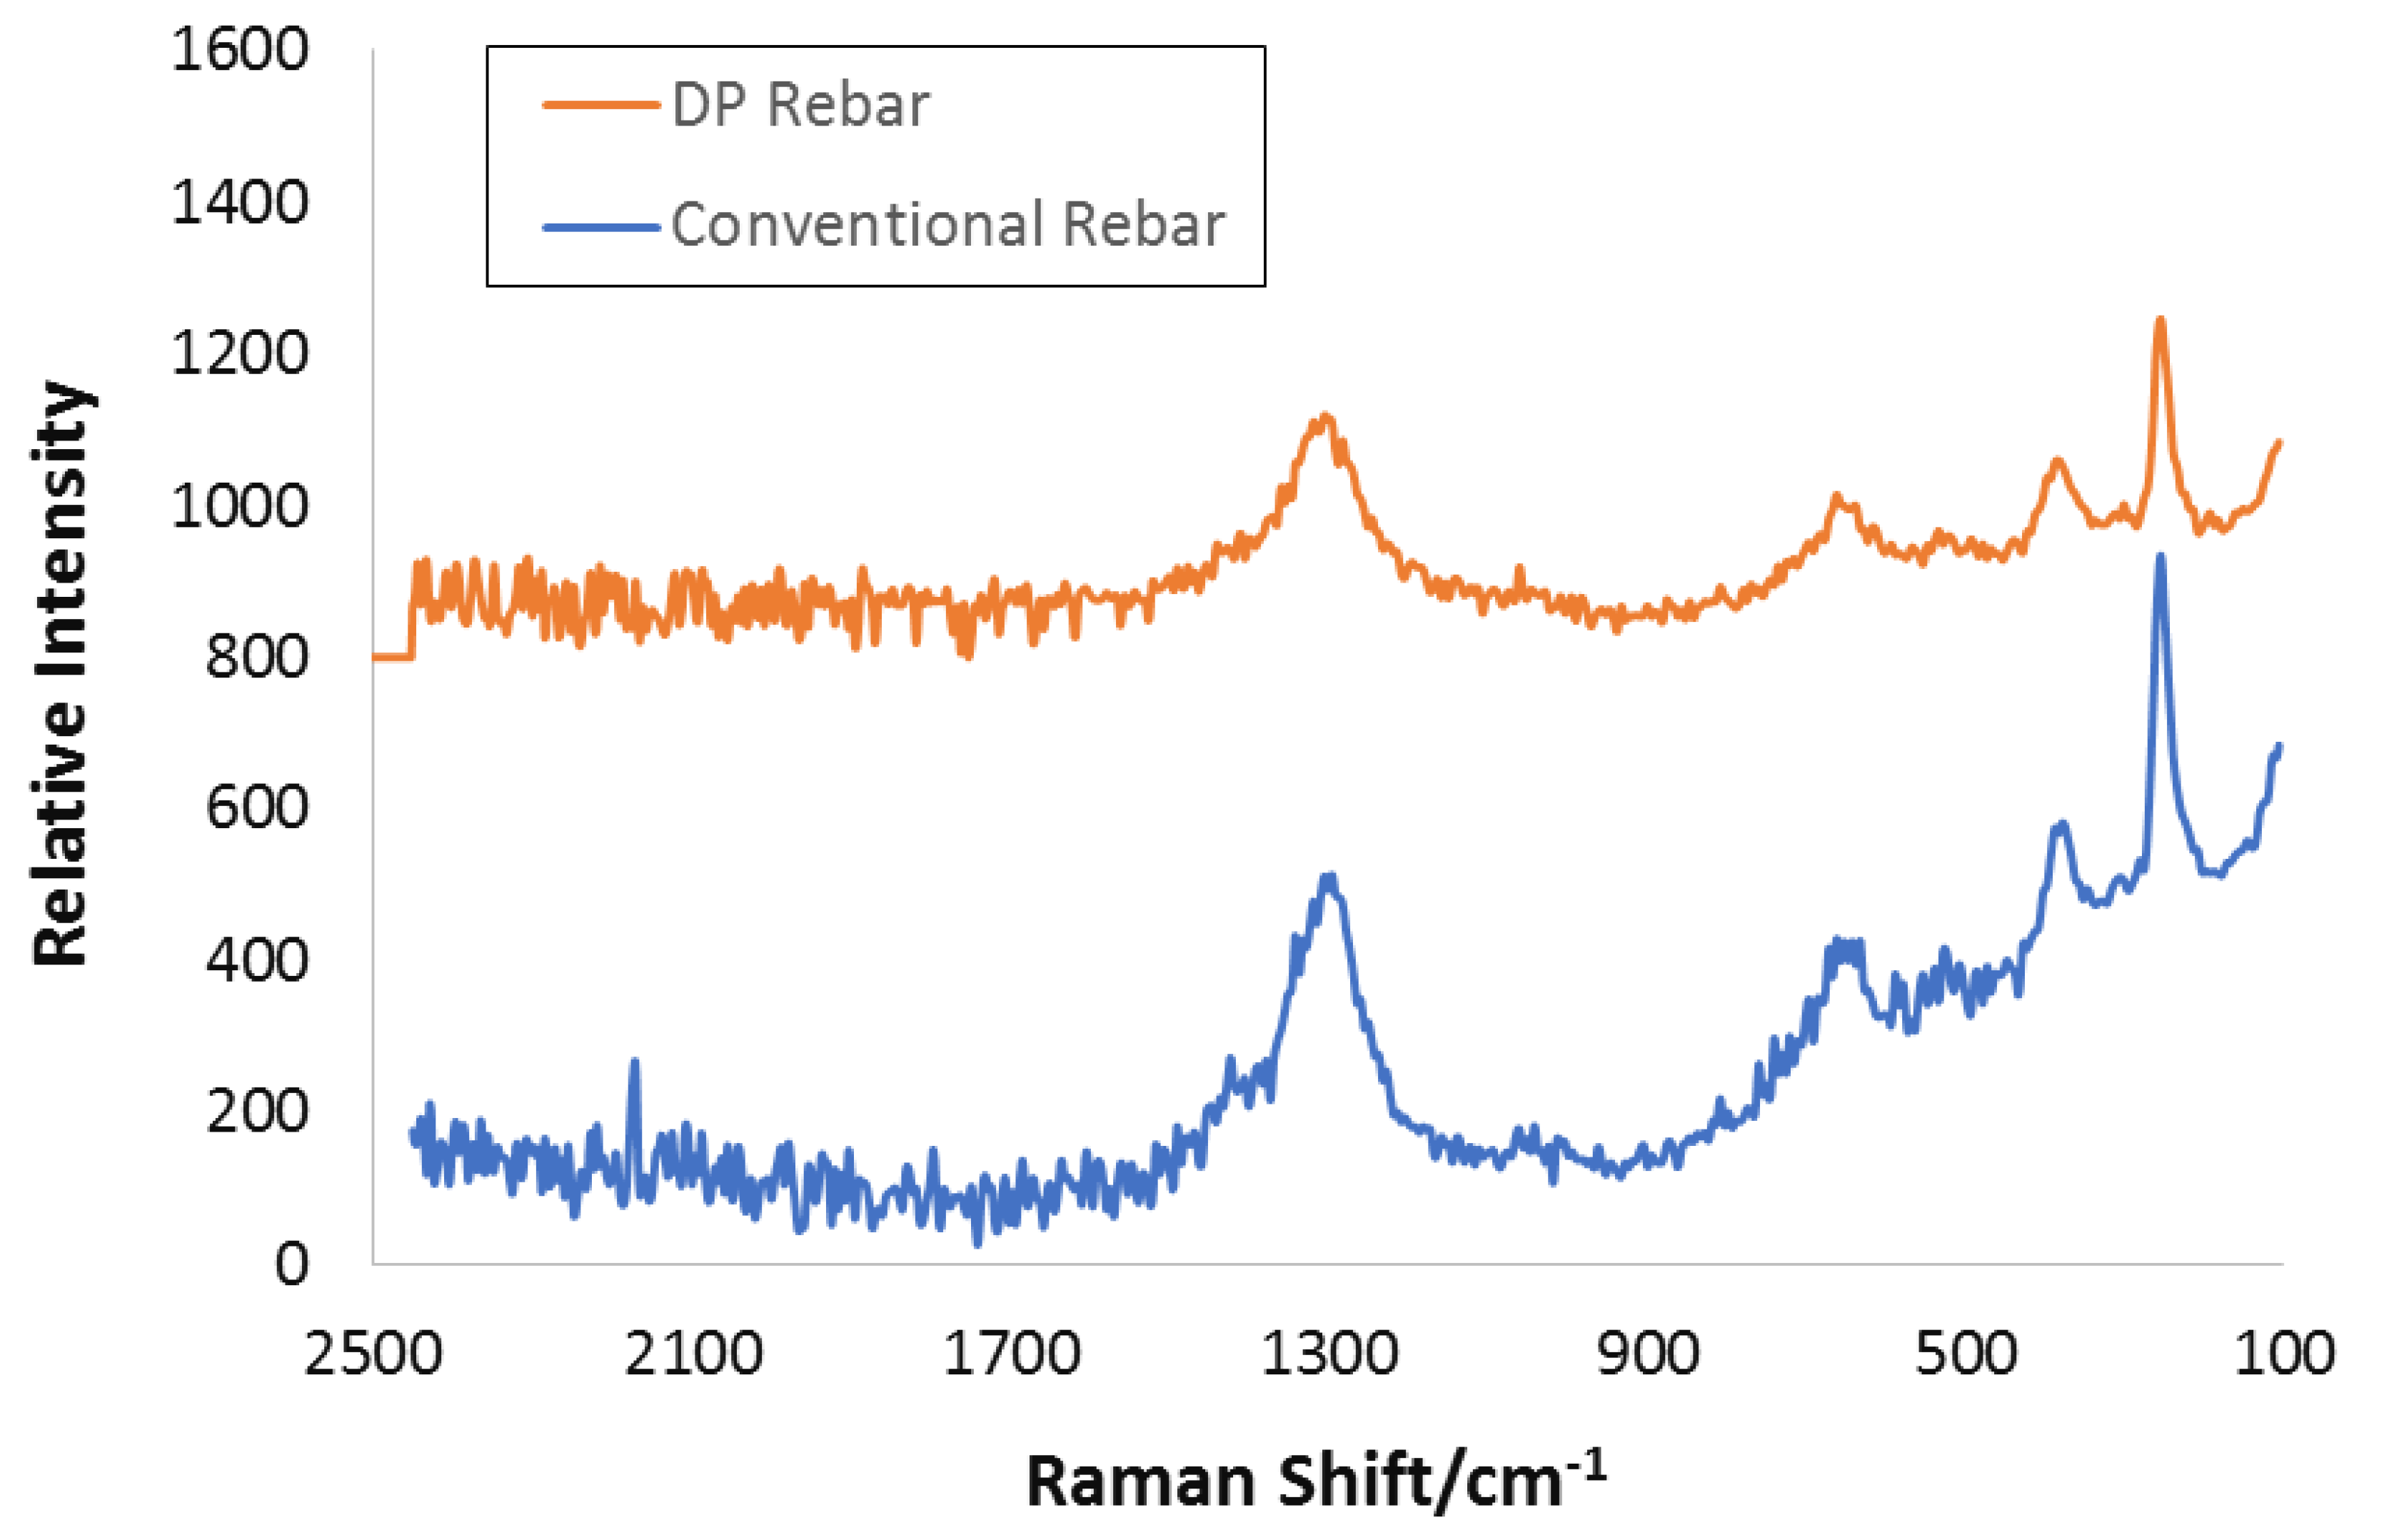
Raman spectroscopy helps in determining the composition of steel surfaces and hence corrosion behavior.
Figure 11 shows in situ Raman spectra for reinforcing steel submerged in SCPS (saturated Ca(OH)
2 solution) with and without NaCl. The wide peak close to 1650 cm
−1 clearly showed the bending vibration of H
2O in SCPS [
44]. In addition, the peaks at 277 and 713 cm
−1 belonged to γ-Fe
2O
3 and α-Fe
2O
3, respectively [
45,
46]. Steel can maintain passivity in chloride-free SCPS. In addition, the oxide or passive layer deposition (restoration) and dissolution occur all together in dynamic steadiness on the steel surface [
47].
In this study, oxide or passive layer dissolution formed Fe2+ at the SCPS–steel interface, indicating that in chloride-free SCPS, there is no reaction because of the absence of Fe2+, while in SCPS containing chloride, more Fe2+ ions are produced to react with SCPS for the same duration.
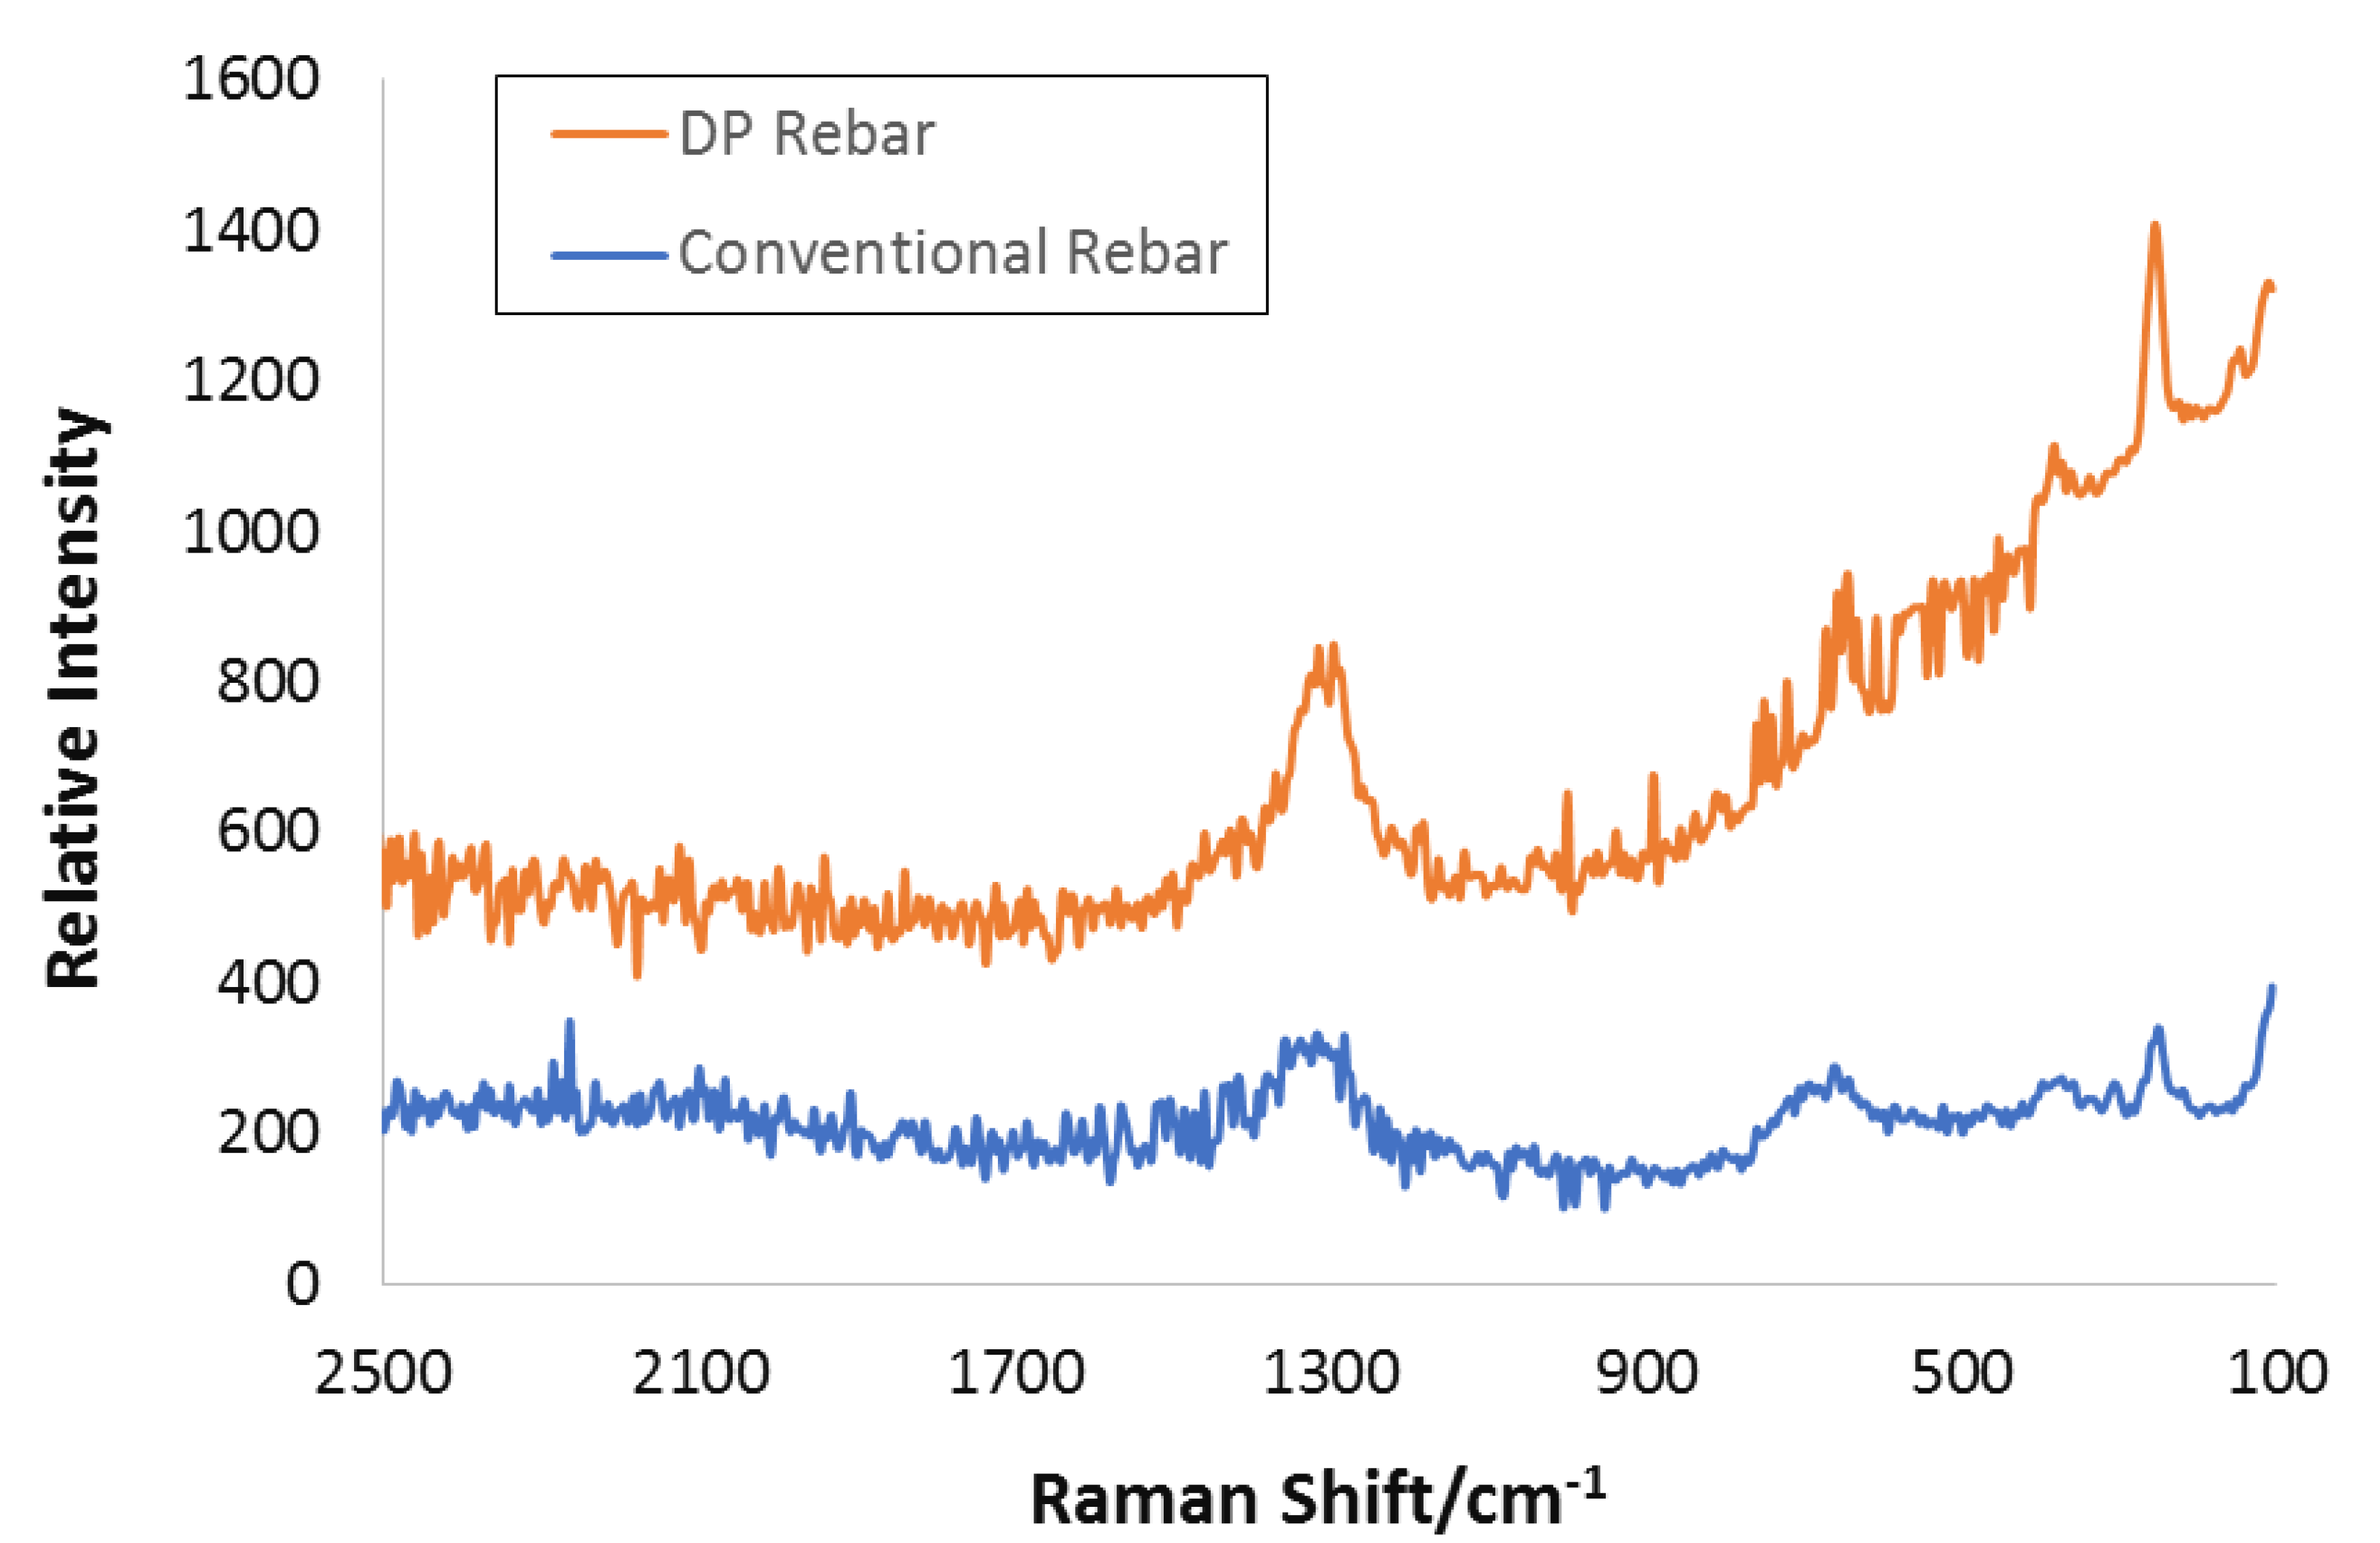
For conventional rebar, the Fe
2O
3 Raman spectrum became more intense, displaying acceleration or oxide or passive film dissolution because of the chloride effect, confirmed by electrochemical studies. The low-intensity peaks at 722 and 282 cm
−1 showed γ-Fe
2O
3 and α-Fe
2O
3, respectively (
Figure 12) [
48,
49]. Subsequently, γ-Fe
2O
3 and α-Fe
2O
3 could be measured, compared to chloride-free SCPS, and were identified to be constituting the upper surface layer of steel [
50,
51].
3.7. Scanning Electron Microscopy
The bowl shape is the favored spot for pit nucleation, and it represents pitting growth initiation locations. The bowl shape takes a downward concave form because of gravity and its effect on electrolyte streaming, and it is the shortest path for mass transportation. In this study, an increase in time broadened the pit concave, and Fe(II) cations were formed generated because of Cl
− ions flowing into the widening pit. These Fe(II) cations are the main reason for charge neutrality in the spot location. Scanning electron microscopy (SEM) image topography showed a pearlite phase in the deepest area all over the concave spot, indicating the aggressive effect of pearlite toward pit progression. Anion and cation vacancies at the chloride–metal interface form voids in the pit (
Figure 13). If these vacancies penetrate the metal phase at a slower rate compared to their transference through the layer, it would cumulate at the chloride–metal interface [
52,
53]. Pitting is often responsible for the high concentration of ions, which may promote pit depth [
52].
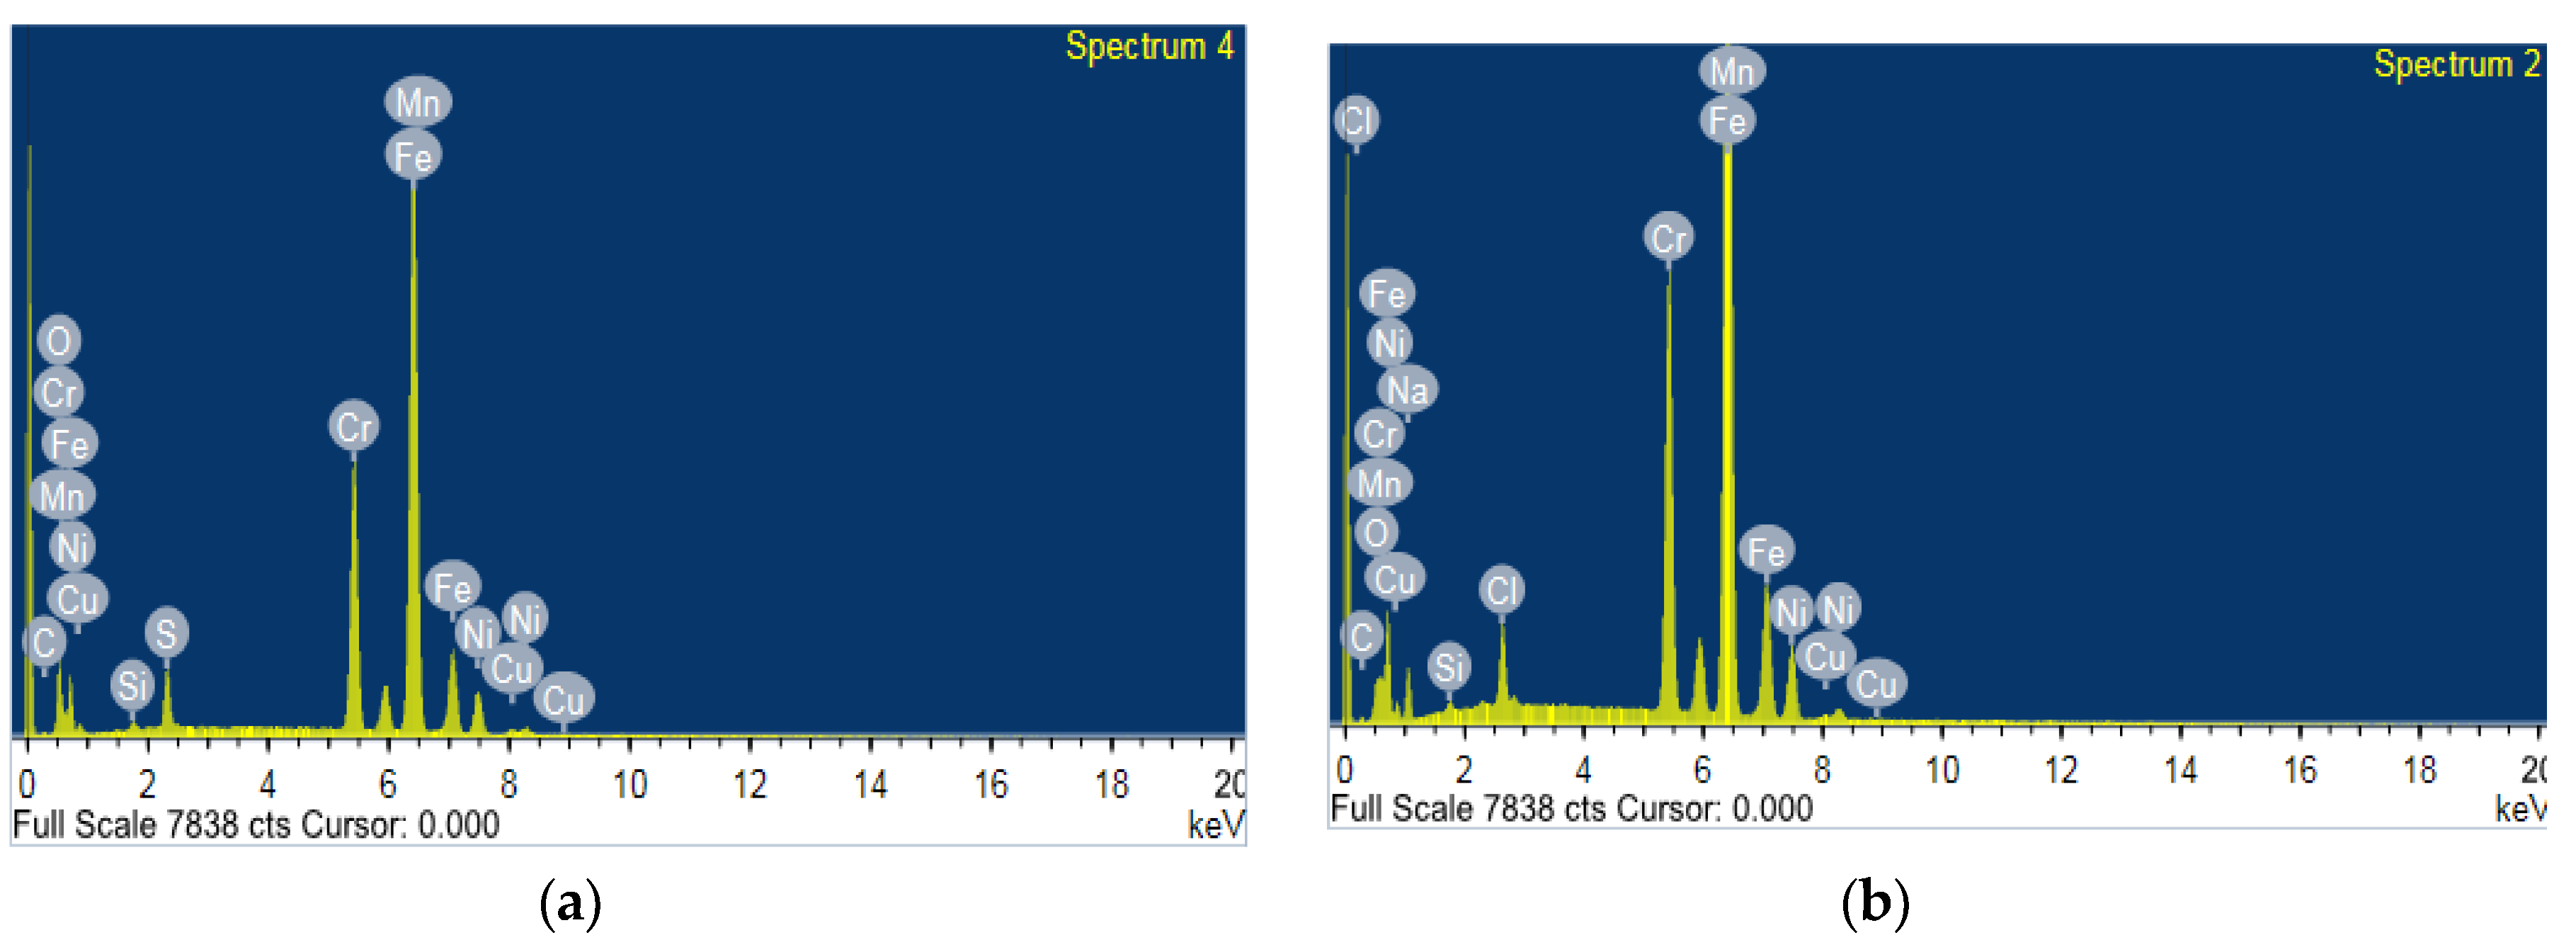
Energy dispersive X-ray (EDS) analysis technique were conducted along with SEM examination to identify the elements in the oxide layers of the different samples. The results of the EDS spectra are shown in
Figure 14. The atomic percentage content of iron, chlorine and oxygen representative data are presented graphically in
Figure 14a conventional rebar and
Figure 14b for DP rebar. The predominant elements detected on all samples were Fe and O. Trace amounts of Mn, S and Si were also detected. It is not possible to obtain quantitative compositional information from EDS analyses. However, qualitative or at best semi quantitative information can be derived from a careful comparison of the peak energy heights of the different elements. Thus, considering the peak heights of Fe and O in
Figure 14b indicates that presence of Fe oxide, most likely in the form of Fe
2O
3 or Fe
3O
4 is higher in case of DP steel compared to non-conventional rebar.

 ,
, 


