Probability-Based Concrete Carbonation Prediction Using On-Site Data


1
Safety Inspection Division, KISTEC, 16, Sadeul-ro 123beon-gil, Jinju-si, Gyeongsangnam-do 52856, Korea
2
Research Institute for Infrastructure Performance, KISTEC, 16, Sadeul-ro 123beon-gil, Jinju-si, Gyeongsangnam-do 52856, Korea
3
Department of Architectural Engineering, Sejong University, 209, Neungdong-ro, Gwangjin-gu, Seoul 05006, Korea
*
Authors to whom correspondence should be addressed.
Appl. Sci. 2020, 10(12), 4330; https://doi.org/10.3390/app10124330
Submission received: 26 May 2020
/
Revised: 22 June 2020
/
Accepted: 22 June 2020
/
Published: 24 June 2020
(This article belongs to the Special Issue Recent Advances in Structural Health Monitoring and Nondestructive Testing in Civil Engineering)
Abstract
:This study proposes a probability-based carbonation prediction approach for successful monitoring of deteriorating concrete structures. Over the last several decades, a number of researchers have studied the concrete carbonation prediction to estimate the long-term performance of carbonated concrete structures. Recently, probability-based durability analyses have been introduced to precisely estimate the carbonation of concrete structures. Since the carbonation of concrete structures, however, can be affected by material compositions as well as various environmental conditions, it is still a challenge to predict concrete carbonation in the field. In this study, the Fick’s first law and a Bayes’ theorem-based carbonation prediction approach is newly proposed using on-site data, which were obtained over 19 years. In particular, the effects of design parameters such as diffusion coefficient, concentration, absorption quantity of CO2, and the degree of hydration have been thoroughly considered in this study. The proposed probabilistic approach has shown a reliable prediction of concrete carbonation and remaining service life.
1. Introduction
Carbonation is one of the critical durability issues in concrete structures in terms of structural integrity and safety. Carbonation may cause fatal deterioration and corrosion of steel reinforcement of concrete structures. Furthermore, increasing atmospheric pollution can accelerate the deterioration of concrete structures, so a more effective carbonation prediction model in the field is needed to securely maintain existing structures. Thus, many researchers have conducted a considerable amount of studies to predict the carbonation of concrete structures. However, it is still challenging to predict carbonation in concrete structures because the carbonation progress can be affected by various conditions such as curing time and quality, sheltering, CO2 concentration in the atmosphere, air voids included in the concrete, the concrete mix, binder and aggregate type, existence of cracks, and concrete finishing materials [1,2,3,4,5,6,7,8,9].
Most studies for proposing carbonation prediction models are based on their laboratory experiments with accelerated testing, but some review articles indicated that the accelerated test has limitations for estimation of the concrete carbonation in the fields [6,10,11]. Furthermore, existing research still shows conflicting findings [10], so a field-oriented carbonation prediction approach needs to be developed. Recently, several researchers have employed field inspection data to effectively predict concrete carbonation. Han et al. have studied the carbonation progress with respect to concrete strength and concrete cover depth [11]. They analyzed 436 data sets from 80 harbor facilities and compared them with existing prediction models. Although Kishitani and RILEM 130 models can predict the carbonation progress within an acceptable safety margin, their field data showed large variation from the prediction models. Also, Luo et al. proposed the particle swarm optimization algorithm based on the BP neural network to effectively predict carbonation in their field [12]. The algorithm reduced the learning time and increased the accuracy of the carbonation estimation, but only considered cement content, w/c ratio, and relative humidity. Thus, a comprehensive analysis reflecting various conditions is required to accurately predict carbonation progress in the field. Cho et al. employed field inspection data from nine different buildings and predicted carbonation using an adaptive neurofuzzy inference system which is an AI algorithm [13]. They considered chloride attack, compressive strength, and crack width as input variables in the algorithm. Although the approach proposed a carbonation model for the target buildings with relatively good accuracy, more information was required for a precise prediction. To consider the regional and environmental effects of the carbonation, Rizvi et al. investigated the carbonation progress of 25 concrete structures located in the semitropical region of India [14]. They examined carbonation with respect to different concrete covers, structural ages, and compressive strengths and proposed a carbonation velocity of RC structures located in the semitropical regions. Additionally, Ekolu proposed a carbonation prediction model reflecting natural carbonation in South Africa after examining 163 field survey data sets for 10 years [15]. He compared his model with fib model code resulting in similar trends with the code. However, both prediction models are only available to estimate a representative carbonation model for each area where the on-site data was obtained. Furthermore, the models might be difficult to consider a carbonation progress to maintain a specific concrete structure under different environmental and construction conditions.
To better consider various environmental conditions in the field, many researchers have introduced a probability-based approach for durability analysis [1,2,3,4,5,16]. Recently, several researchers have utilized Bayes’ theorem in their analysis to reflect field conditions and to estimate future environmental conditions [2,5,16]. Jung et al. estimated the corrosion resistivity of reinforced concrete structures exposed to chloride attacks, and their remaining service life, using Bayes’ theorem [16]. They estimated the remaining service life of seashore RC structures, which are mainly deteriorated by chloride attack, without considering carbonation effects in their durability analysis. Kim et al. estimated the carbonation progress of concrete structures and also employed a Bayesian approach to better consider the effect of changing environmental conditions, such as sunlight and wind speed, in the analysis [5]. However, their estimation approach only considered experimental data for carbonation and employed climate data in their Bayesian approach. Thus, the approach might be available in the design stage but not for maintaining existing structures. Jacinto et al. also employed Bayes’ theorem to reflect the uncertainty of the field condition while executing an assessment of an existing bridge [17]. They assessed the deterioration of a concrete bridge using basic design data and field surveys, such as concrete strength and rebar size. Although they estimated the deterioration of a concrete structure considering on-site data, their approach does not consider carbonation progress in the field. Similarly, Zanini et al. proposed a bridge element deterioration curve for estimating the residual life of bridges based on visual inspection with Bayesian theory [18]. The approach might be used to effectively manage an existing bridge from the proposed degradation curve, but cannot predict the carbonation of concrete structures before corrosion initiation. Greve-Dierfeld et al. compared the descriptive rules in Euro code with previous prescriptive rules in the study and a proposed probability design approach using Bayes’ theorem [2]. In their approach, they investigated various field inspection data in Europe and updated the carbonation model which was initially predicted by prescriptive rules suggested by the code. Although the study proposed a probability-based design approach, it is not appropriate to precisely estimate carbonation propagation in existing structures.
In this study, an approach predicting carbonation progress was developed using Bayesian statistics with previous field inspection data. First, an initial prediction of the carbonation of a concrete structure and its remaining service life was introduced based on Fick’s first law and Latin hypercube sampling (LHS) with existing statistic data. The revised prediction of carbonation progress and remaining service life was then proposed using Bayesian statistics with previous on-site data. In the prediction approach, important design variables including CO2 diffusion coefficients, atmospheric CO2 concentrations, quantity of CO2 absorbed, and cement hydration for the initial carbonation velocity coefficient were also considered to reduce uncertainties that might arise in early stages.
The proposed approach applies to three bridges located in different areas such as land, river, and sea in South Korea and considered on-site data using Bayesian theory. The results of the developed prediction approach represent a suitable estimation of carbonation progress for each bridge, so it is expected to effectively predict concrete carbonation for maintaining existing bridges in the field. Thus, the carbonation prediction approach can also be used to make a flexible and proper decision for the operation and maintenance of deteriorated concrete structures in use.
2. Durability Prediction Approach for Carbonated Concrete Structures
First, the proposed carbonation prediction approach employed an existing carbonation prediction model to initially estimate the carbonation of concrete structures. Thus, the basic carbonation model for a prior prediction and required design variables applied in this study is described here. Furthermore, the Bayes’ theorem introduced in this study and the reliability analysis for estimating the remaining service life of concrete structures are then explained as follows.
2.1. One-Dimensional Concrete Carbonation Model
In general, Fick’s first law has been used as a model to determine the movement of material in porous media such as concrete. In order to express the carbonation speed in concrete structures, the fluid flow in stationary flow using Fick’s first law has been utilized by several researchers [19,20]. Equation (1) exhibits a carbonation velocity model of concrete structures using Fick’s first law:
where is the carbonation depth(cm); denotes CO2 (g/cm3) concentration introduced from outside; is the CO2 concentration (g/cm3) of the boundary between carbonated and uncarbonated parts in concrete; is CO2 diffusion coefficient; is time elapsed (in seconds); and is the amount of CO2 (g/cm3) per unit volume required for concrete carbonation.
If the distance from the carbonation boundary to the concrete surface is regarded as the carbonation depth and CO2 concentration introduced from outside is substituted with atmospheric CO2 concentration, Equation (2) can be obtained [21]:
where denotes the carbonation velocity coefficient (cm2/s), and is elapsed time after concrete carbonation (seconds). is the carbonation depth (cm) at elapsed time; is CO2 diffusion coefficient (cm2/s); is the atmospheric CO2 concentration (g/cm3); and is CO2 (g/cm3) uptake.
2.1.1. CO2 Diffusion Coefficient
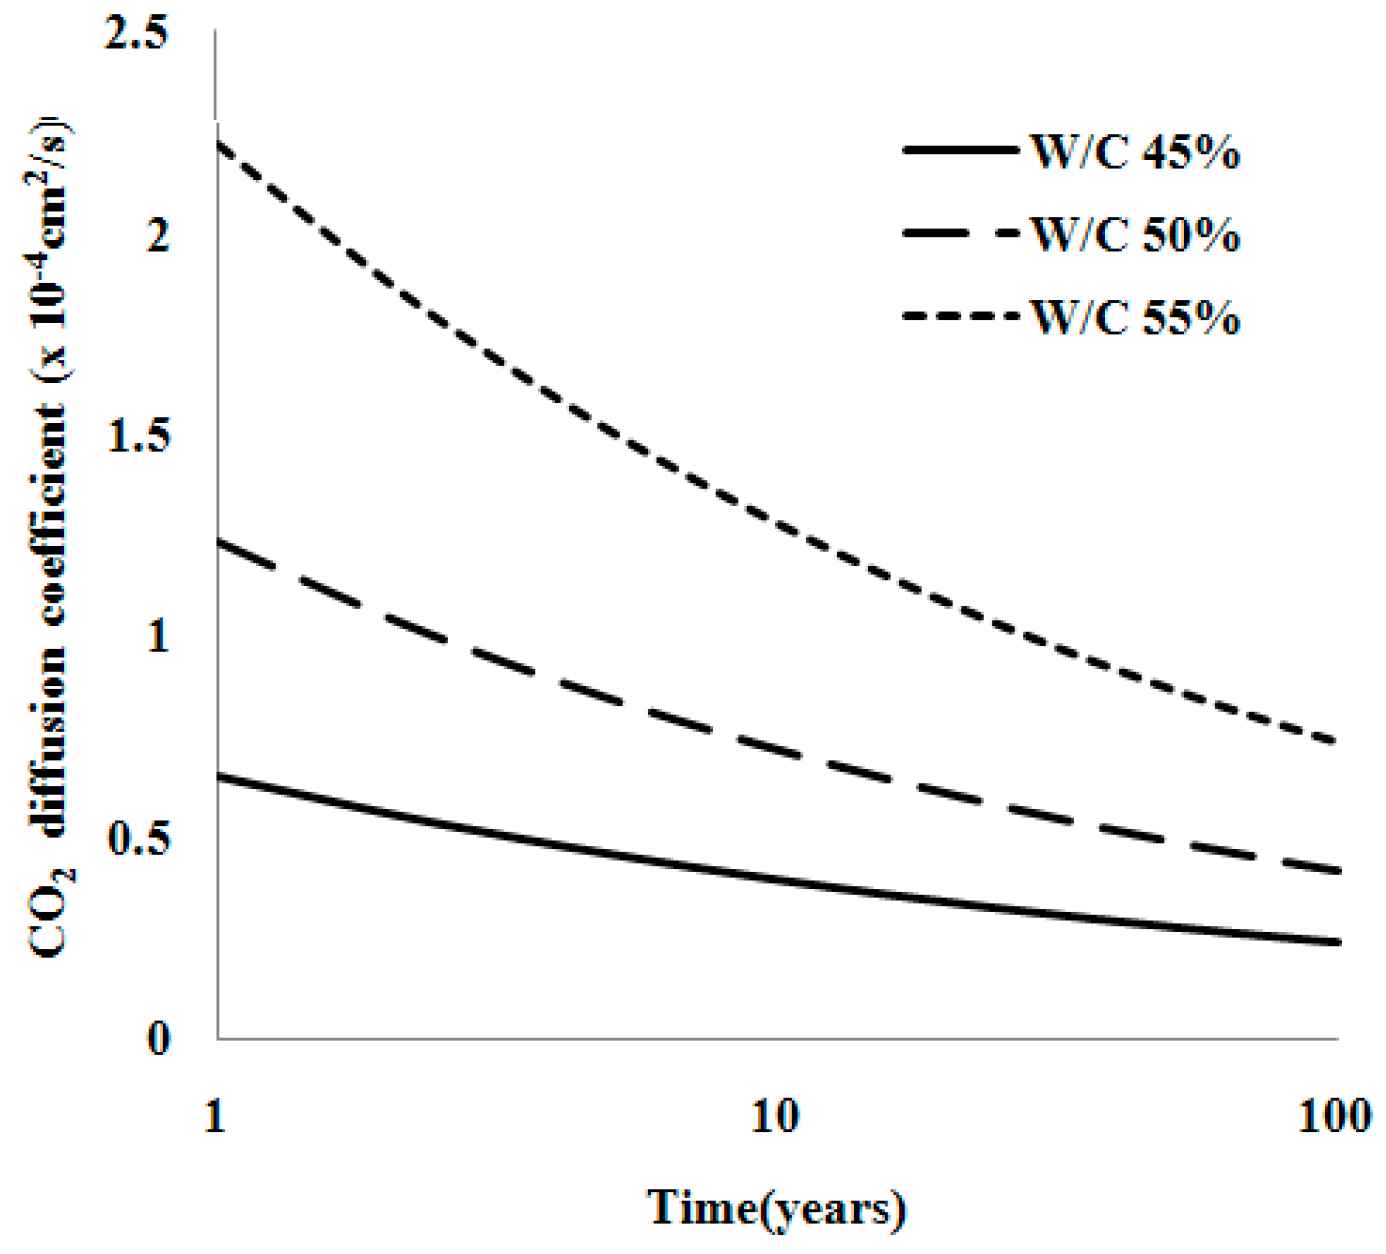
can be expressed as Equation (3) based on a previous study [20]. CEB-FIP 1990 proposes CO2 and O2 diffusion coefficients of concrete in the range of 0.5 × 10⁻⁴∼6.0 × 10⁻⁴ [19,21].
where is the CO2 diffusion coefficient after one year and is the time coefficient reflecting reduction of the diffusion coefficient. The time coefficient () significantly depends on the w/c ratio.
Figure 1 shows that the higher the w/c of concrete mix, the higher the CO2 diffusion coefficient. Similar to existing study results, as carbonation is progressed, the diffusion coefficient gets decreased by the compaction of the concrete porous structure.
2.1.2. Atmospheric CO2 Concentration
Based on the previous study for predicting CO2 concentration considering the increase in atmospheric temperature in Seoul, the following estimation formula, Equation (4), has been used in this approach [20].
2.1.3. CO2 Uptake, a
The amount of CO2 required to completely carbonate concretes depends on the types of cement, chemical composition, mixing conditions, and elapsed years. Given the chemical reaction of carbonation, amounts of CaO and CO2 are dominant factors in carbonation and these elements are considered in this study. CO2 uptake under external exposure and in the atmosphere can be calculated using Equation (5) based on the relationship between hydration and the amount of CO2 in cement [22].
where C is the unit volume of cement (g/cm3); CaO is the amount of CaO in cement; is cement hydration; and M is molecular weight (CO2: 44 g/M and CaO: 56 g/M).
2.1.4. Cement Hydration,
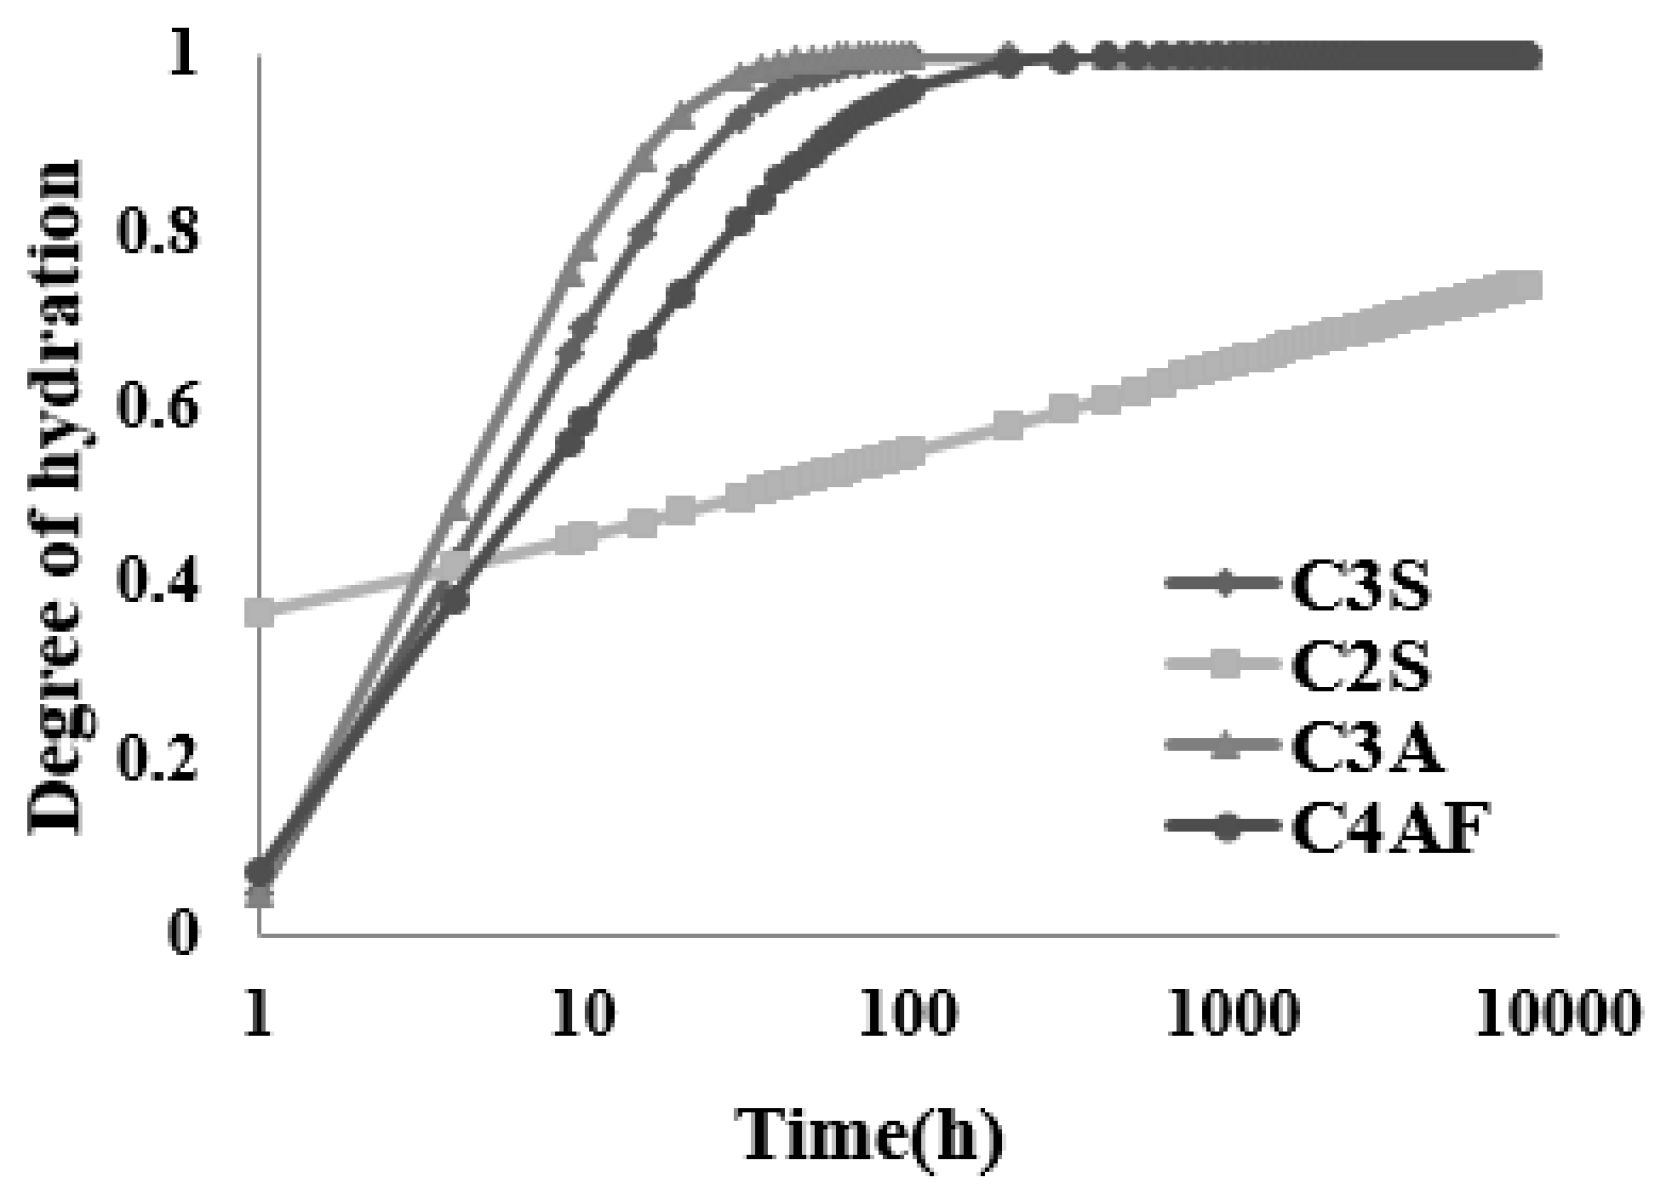
The main constituents of Portland cement include alite, belite, aluminate, and ferrite. Their formulas are C3S, C2S, C3A, and C4AF, respectively. The hydration of each constituent can be calculated by obtaining a weighted average as each compound shows different hydration behaviors even under the same curing condition. Hydration of cement can be calculated using the following Equation (6):
where is hydration of alite; is hydration of belite; is hydration of aluminate; is hydration of ferrite; and is the percentage of the weight of the compound for the volume of concrete.
The overall hydration reaction kinetics of concrete for each constituent according to types of cement (Table 2) can be obtained using a weighted average as shown in Figure 3.
In this study, the degree of hydration of each compound was calculated using Equation (7) based on the Avrami equation [22]. The Avrami equation is strongly applicable to the early stage of crystallization, but not to the later stage process because the second crystallization takes place. Bayesian statistics, which shifts initial values to measurement data to fit posterior predicted values, can supplement the limitations of the Avrami equation.
where Table 2 can be referred to for , , and . These are constants according to compounds in cement. Table 1 is used to apply them in this model.
2.2. Analysis of Carbonation Durability
2.2.1. Carbonation Prediction Using Stochastic Analysis Techniques
In order to precisely determine a model through a stochastic analysis, sufficient data for random variables are needed. Random variables are obtained by a statistical method with a standard normal distribution. While prior predicted values are calculated using a statistical and deterministic method, the posterior predicted values should be obtained by considering field measurement data reflecting various environmental conditions, uncertainties of material properties, and curing conditions, etc.
In this study, the Bayesian approach that was used to predict a chloride attack problem by Jung et al. was introduced to precisely predict the carbonation durability [16]. The carbonation prediction approach using Bayesian statistics requires previous on-site data. The probability of uncertainties in initial model variables is and the probability of uncertainties reflecting the field trend from measurement data is expressed as . The following relation in Equation (8) between these two probabilities is defined by Bayes’ theorem [24].
where is the model variable. In this study, the CO2 diffusion coefficient () was used as the model variable and is a constant determined under the former probability condition. is the uncertainty of on-site measurement data in the presence of model variable .
2.2.2. Predicted Values Using Latin Hypercube Sampling (LHS)
LHS is useful for analyzing a large number of parameters. In experimental points, it can be used to evenly distribute in the area of model parameters and fill the space while carrying out a small simulation [28]. LHS divides the range of input variables into K ranges and then selects K samples evenly, choosing one from each K range randomly and non-repetitively [29]. If carbonation depth is at the measured time, , the mean and standard deviation of the carbonation depth can be initially predicted from the aforementioned one-dimensional concrete carbonation model with statistical data of selected design variables in Equation (10). Here, the section showing equivalent probability was divided by the number of .
where and represent functions of time .
After measuring the carbonation depth of at the time in the field inspection, the likelihood function of is calculated using Equation (11):
where the standard deviation of the likelihood function is estimated from existing experimental values or measurement data.
The mean of model predictive values is calculated using Equation (12) with a Bayesian approach for statistical distribution.
where is the reciprocal number for the sum of k likelihood functions.
The standard deviation of the mean predictive value of the improved carbonation depth can be obtained via the following Equation (13).
2.3. Deterministic Limit State Function
If CO2 penetrates and diffuses into concrete, alkaline properties of the concrete will be neutralized due to carbonation with age. When the depth of carbonation in concrete continues to grow and reaches the reinforcing steel, the passive film can break down. This breakdown causes the corrosion of reinforcing steel and the reduction in the durability of structures. The condition when the carbonation progresses and reaches the rebar that causes the corrosion of reinforcing steel is defined as the serviceability limit. The probability of corrosion at this time is then calculated. The limit state is defined by Equations (14) and (15) to calculate the probability of corrosion in the limit state.
where R is the thickness of concrete cover (D); the load function (S) is carbonation depth changing with age; and means a function. The limit state function (G) can be expressed as the probability of damage (). In practice, the reliability index () rather than the probability of damage is used to obtain the probability of corrosion.
The relationship between the probability of damage and the reliability index is expressed by the following Equations (16) and (17).
where is the probability density function, denotes the standard deviation of G, and denotes the mean of G.
3. Carbonation Prediction Approach
In this study, the following procedures were used to effectively predict carbonation progress and remaining service life of concrete structures:
- (1)
- Selection of design variables and generation of their cumulative density functions (CDF) using normal distribution;
- (2)
- Extraction of sample design variables from the CDF using LHS;
- (3)
- Arrangement of extracted samples randomly to create a combination of design variables;
- (4)
- Calculation of prior predicted values using combined design variables;
- (5)
- Calculation of the initial likelihood function with previously measured on-site data and revision of prior predicted values using it;
- (6)
- To determine resistance value R, the mean and standard deviation of concrete cover thickness were calculated to obtain a reliability index using the limit state function;
- (7)
- Assuming reliability index for managing each structure, prediction of remaining service life of concrete structures.
4. Sensitivity Analysis of Carbonation Prediction Approach
Based on the carbonation prediction approach described earlier, several sample design variables using LHS need to be selected to estimate a priori prediction model. Furthermore, on-site inspection data for carbonation are required to update the priori prediction model. To identify the efficient number of data required in the proposed approach, sensitivity analyses are executed as follows.
4.1. Number of LHS
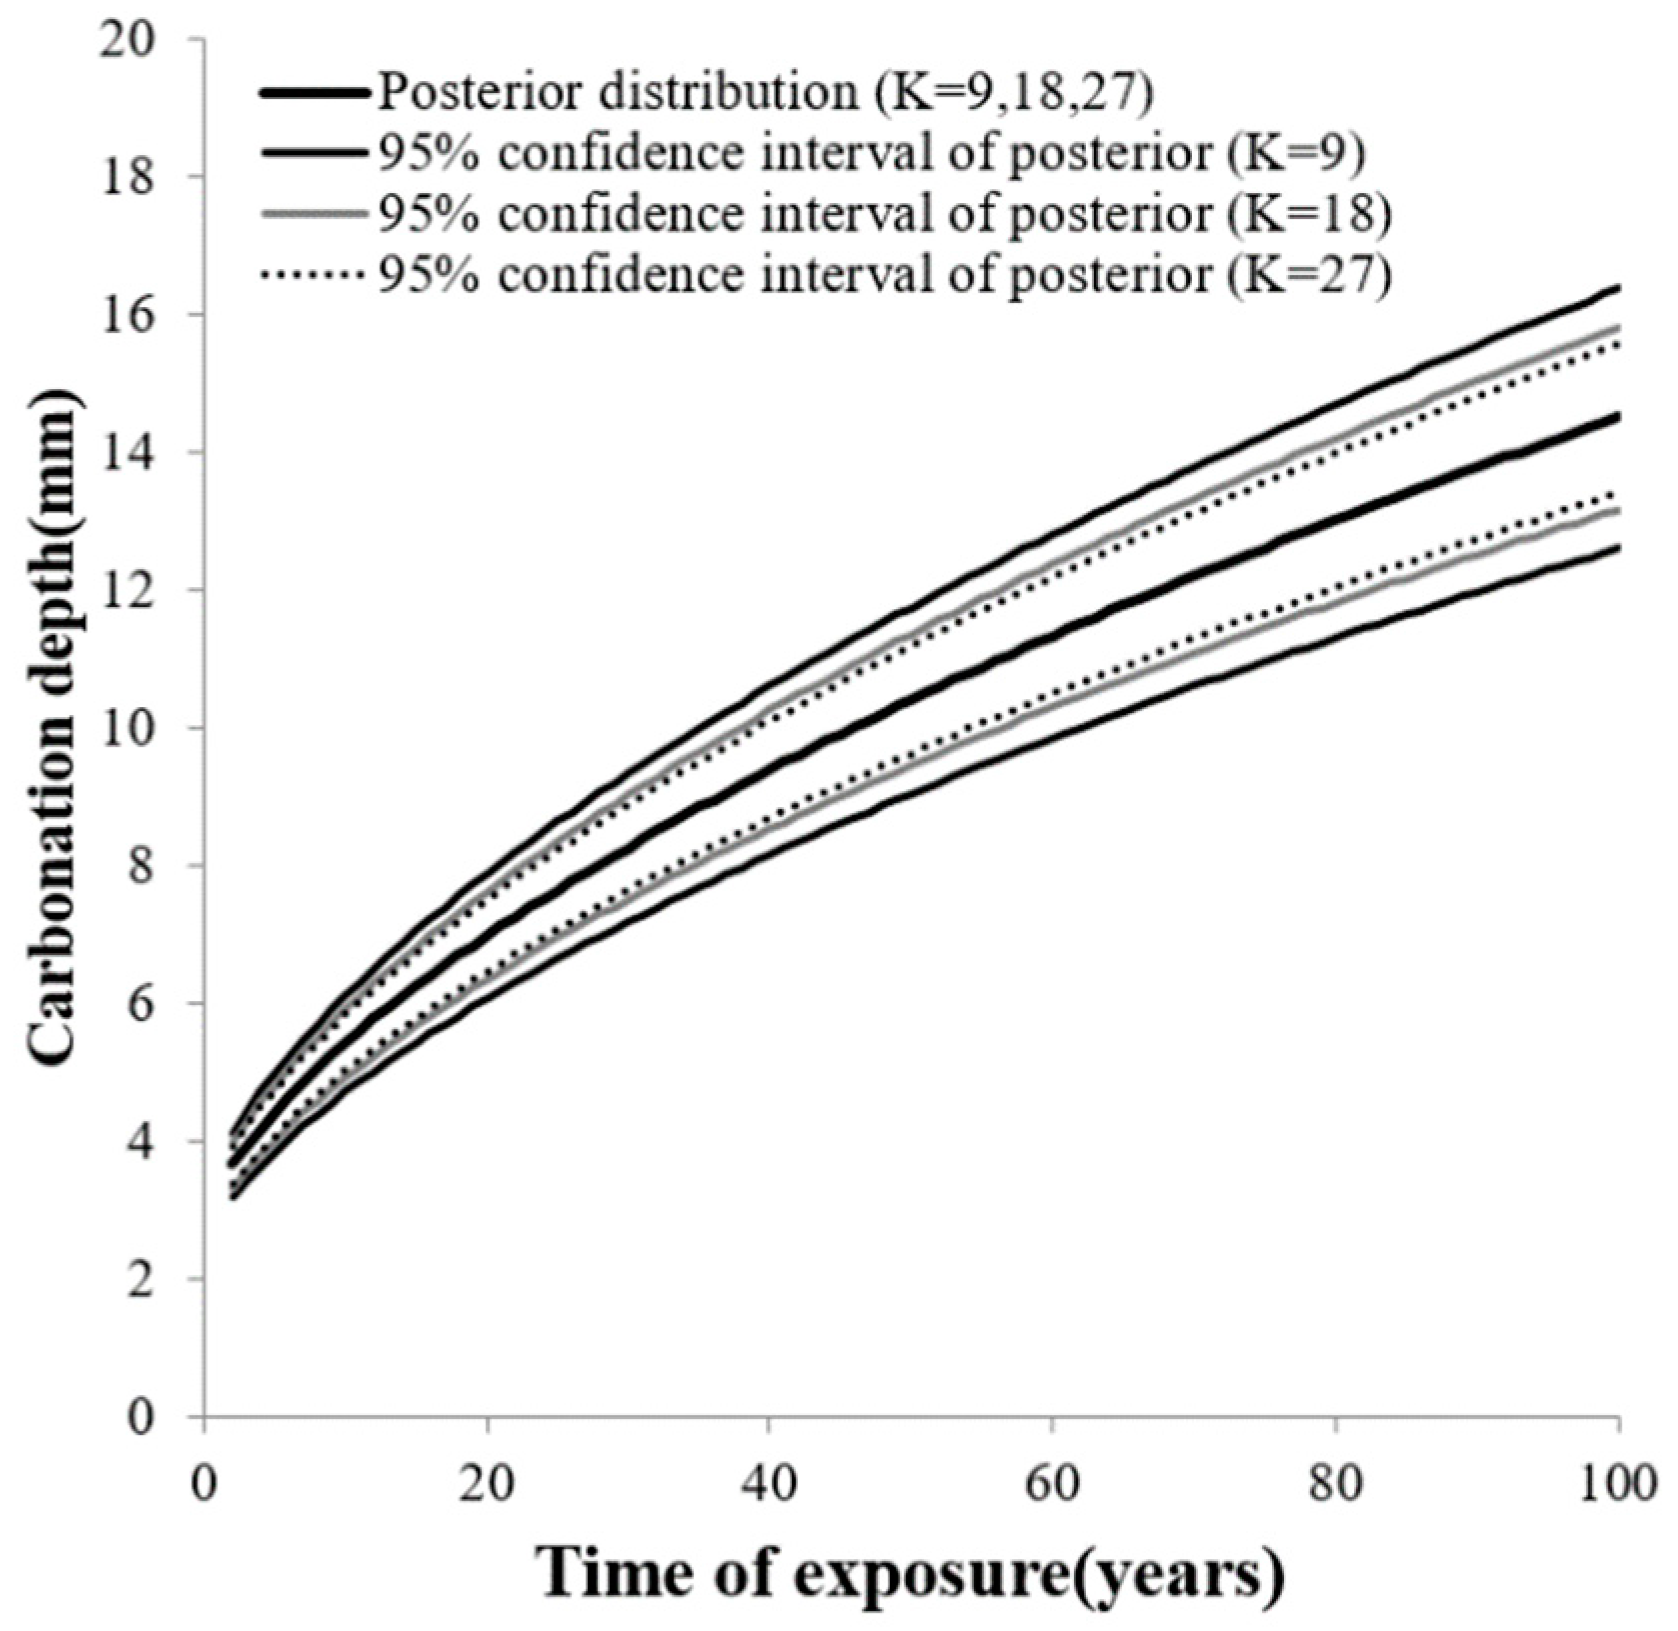
According to the previous study for LHS, a doubled number of design variables, 2n, will converge to the result of the total number of design variables [25]. Moreover, Jung et al. demonstrated that triple design variables, 3n, converge to the result of the total number of design variables considering relatively few design variables [16]. Figure 4 shows that posterior predicted values converge as the number of LHS increases. The proposed carbonation prediction considers three design variables because the cement hydration is directly related to CO2 uptake in Equation (5). The results in Figure 4 show similar trends with results considering 6n (K = 18). Thus, nine samples were considered from an efficiency point of view in this study.
4.2. Optimized Number of Field Inspection Data
In order to identify the inspection on-site data required, a sensitivity analysis for an optimized number for Bayesian analysis has been performed in this study. Table 3 shows the depth of carbonation in bridges regularly examined in the field [30]. The carbonation depth of on-site data was measured following the guidelines for inspection and assessment of infrastructure safety [31].
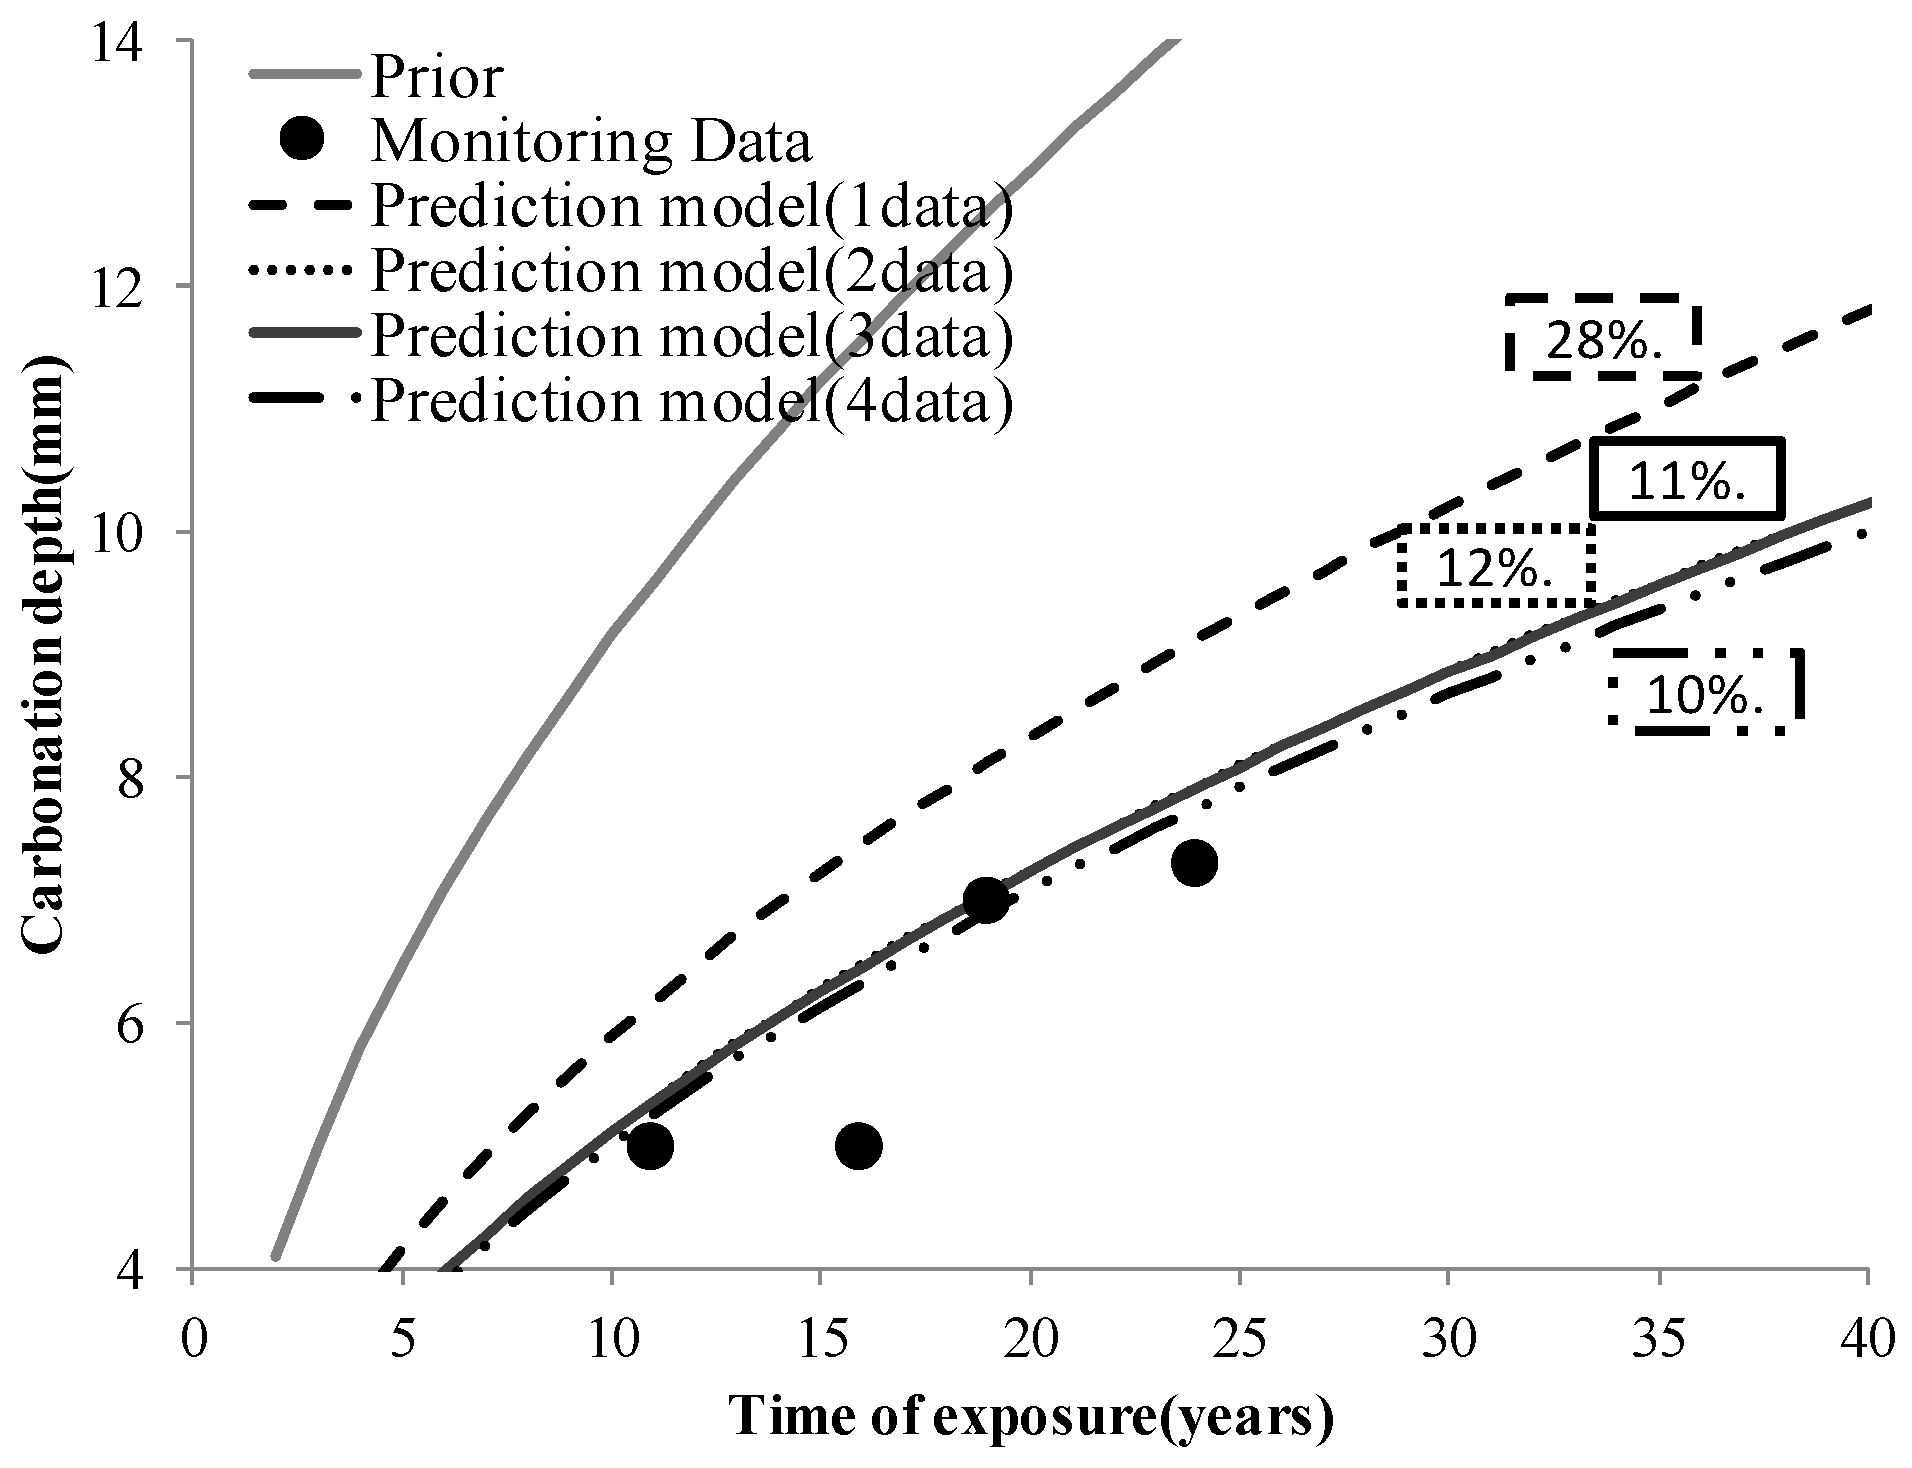
The prior prediction of carbonation depth using design variables was updated according to the different numbers of on-site data. Figure 5 shows prior prediction and updated prediction models as increasing numbers of inspection data in the Gajwa IC viaduct.
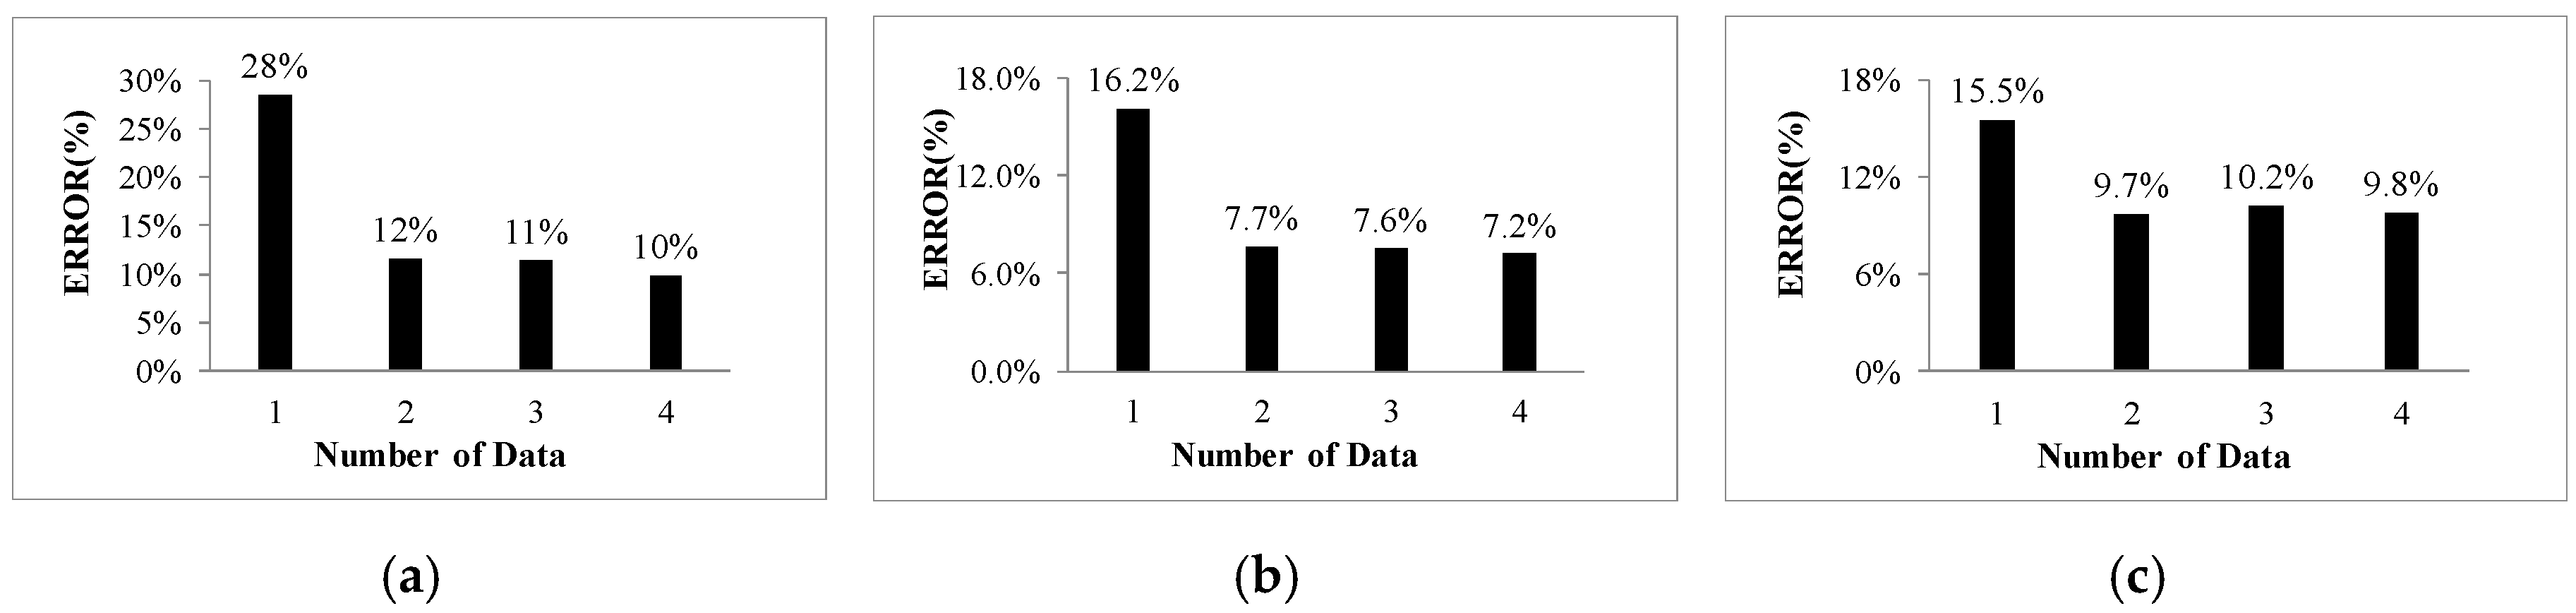
The sensitivity analysis to identify the optimized number for the proposed approach has been compared with increasing on-site inspection data from three different bridges in Table 3. Figure 6 presents the results of a sensitivity analysis for the optimized number of on-site data. The results show that the updated prediction converges while considering more than two on-site data in the analysis. Thus, two field inspection data are required to effectively predict the progress of concrete carbonation in the proposed approach.
5. Application Examples
To verify the carbonation prediction approach proposed in this study, field inspection data for bridge structures under different environmental conditions were selected and then analyzed.
5.1. Subject Bridges
The following three different concrete bridges were used to validate the proposed approach in this study: (1) The Gajwa IC viaduct applied in this study was constructed in 1986. It is a type-1 infrastructure with a total length of 500 m. It is located in Gajwadong, Seogu, Incheon. The superstructure is a steel box girder and its substructure is an inverted T-type with a pile foundation. (2) The Noryang bridge (old bridge), which is made of concrete structures is a type-1 infrastructure located in Dongjakgu, Seoul, the center of the city. It was constructed in 1987. Its superstructure is comprised of PSC box girders and its substructure is Rahmen type with pile and well foundations. (3) The Geoje bridge, a concrete structure, is a type-2 infrastructure with a total length of 740 m. It is located in Geoje, Gyeongsangnam-do, Korea. It was constructed in 1971. The superstructure comprises PSC-beams, RC box girders, and steel-plate girders while its substructure is Rahmen type with pile and well foundations.
As part of an in-depth safety examination, cores were collected from an inverted T-type RC pier from the Gajwa IC viaduct in 1997, 2002, 2005, and 2010. From a pier at the Noryang bridge, cores were collected in 1997, 2004, 2009, and 2014 to measure carbonation. From a girder of the Geoje bridge, cores were collected in 1998, 2005, 2010, and 2015 [30]. To calculate the reliability of the concrete structures, the means and standard deviations of concrete covers under similar environmental conditions with the subject bridges were investigated, as shown in Table 4. These on-site data of concrete structures reflect different environmental conditions. As shown in Table 5, the design variables of carbonation in the subject bridges were considered in the proposed carbonation prediction approach. Random variables of CO2 diffusion coefficient , atmospheric CO2 concentration , and CO2 uptake with cement hydration were used as design variables to determine durability. Values shown in Table 5 were used due to the absence of data to determine prior probability distribution. Except for the CO2 diffusion coefficient, each design variable in the proposed approach was applied in the form of a constant using tables and equations for Portland cement (TYPE Ⅰ) in this study.
On-site inspection data of carbonation depth, which is an in-depth safety examination conducted for five year terms, were applied to the proposed approach. In addition, the durability analysis for predicting the remaining life of the subject bridges was carried out through reliability indices.
5.2. Durability Analysis of Carbonated Concrete Structures
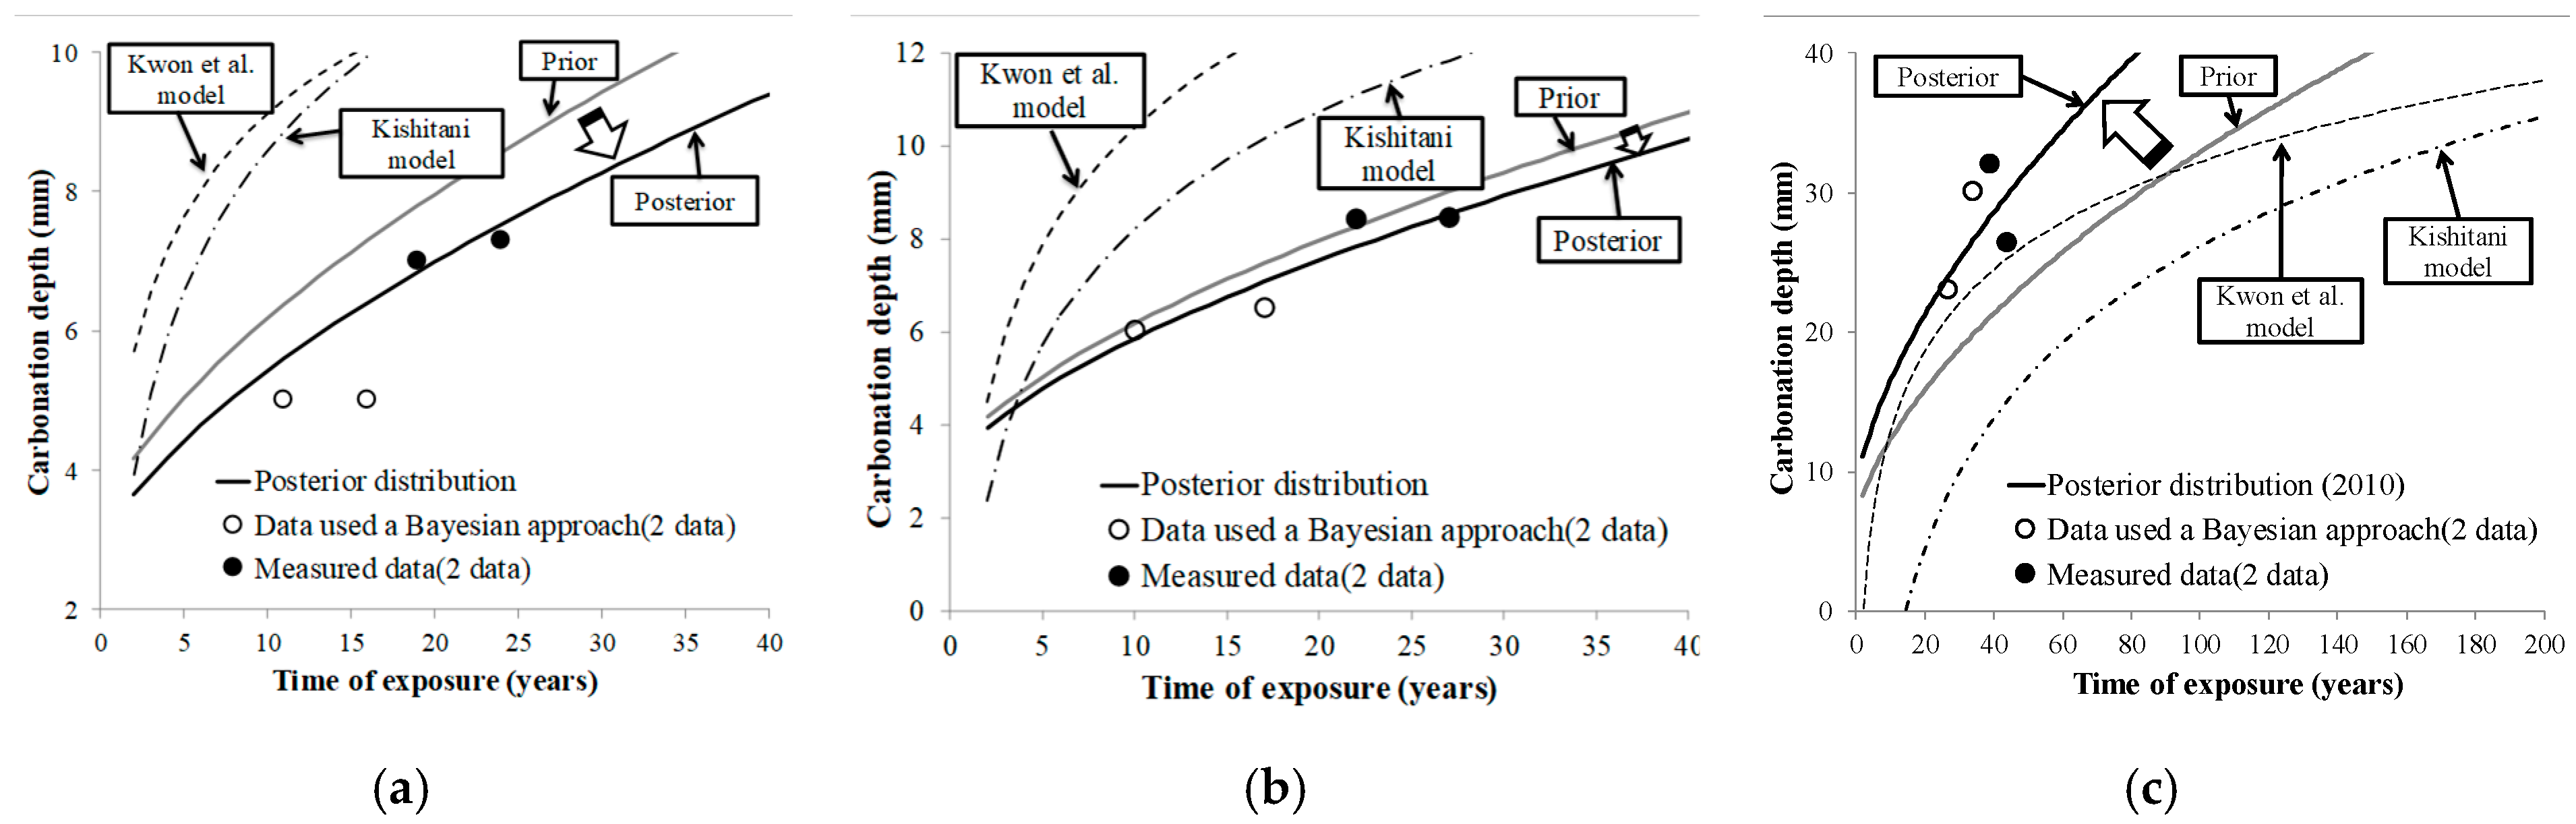
Based on the results of the sensitivity analysis, nine samples for LHS were applied in the proposed durability analysis and the first two field inspection data were then used to revise prior predicted values for carbonation depth of the subject bridges. To compare the effectiveness of the proposed durability analysis, two carbonation prediction models were compared in this study. In the previous studies, Han et al. and Yang have compared several carbonation prediction models and reported that the Kishitani prediction model was suitable for the concrete structures in Korea [11,32]. Moreover, Kwon et al. investigated various field inspection data of carbonation in Korea and proposed the correction factors to revise previous prediction models [33]. Thus, the proposed prediction approach compared with the Kishitani model and the Kwon et al. model is illustrated in Figure 7. The figures show that the updated posterior results are more suitable for predicting carbonation depth with time.
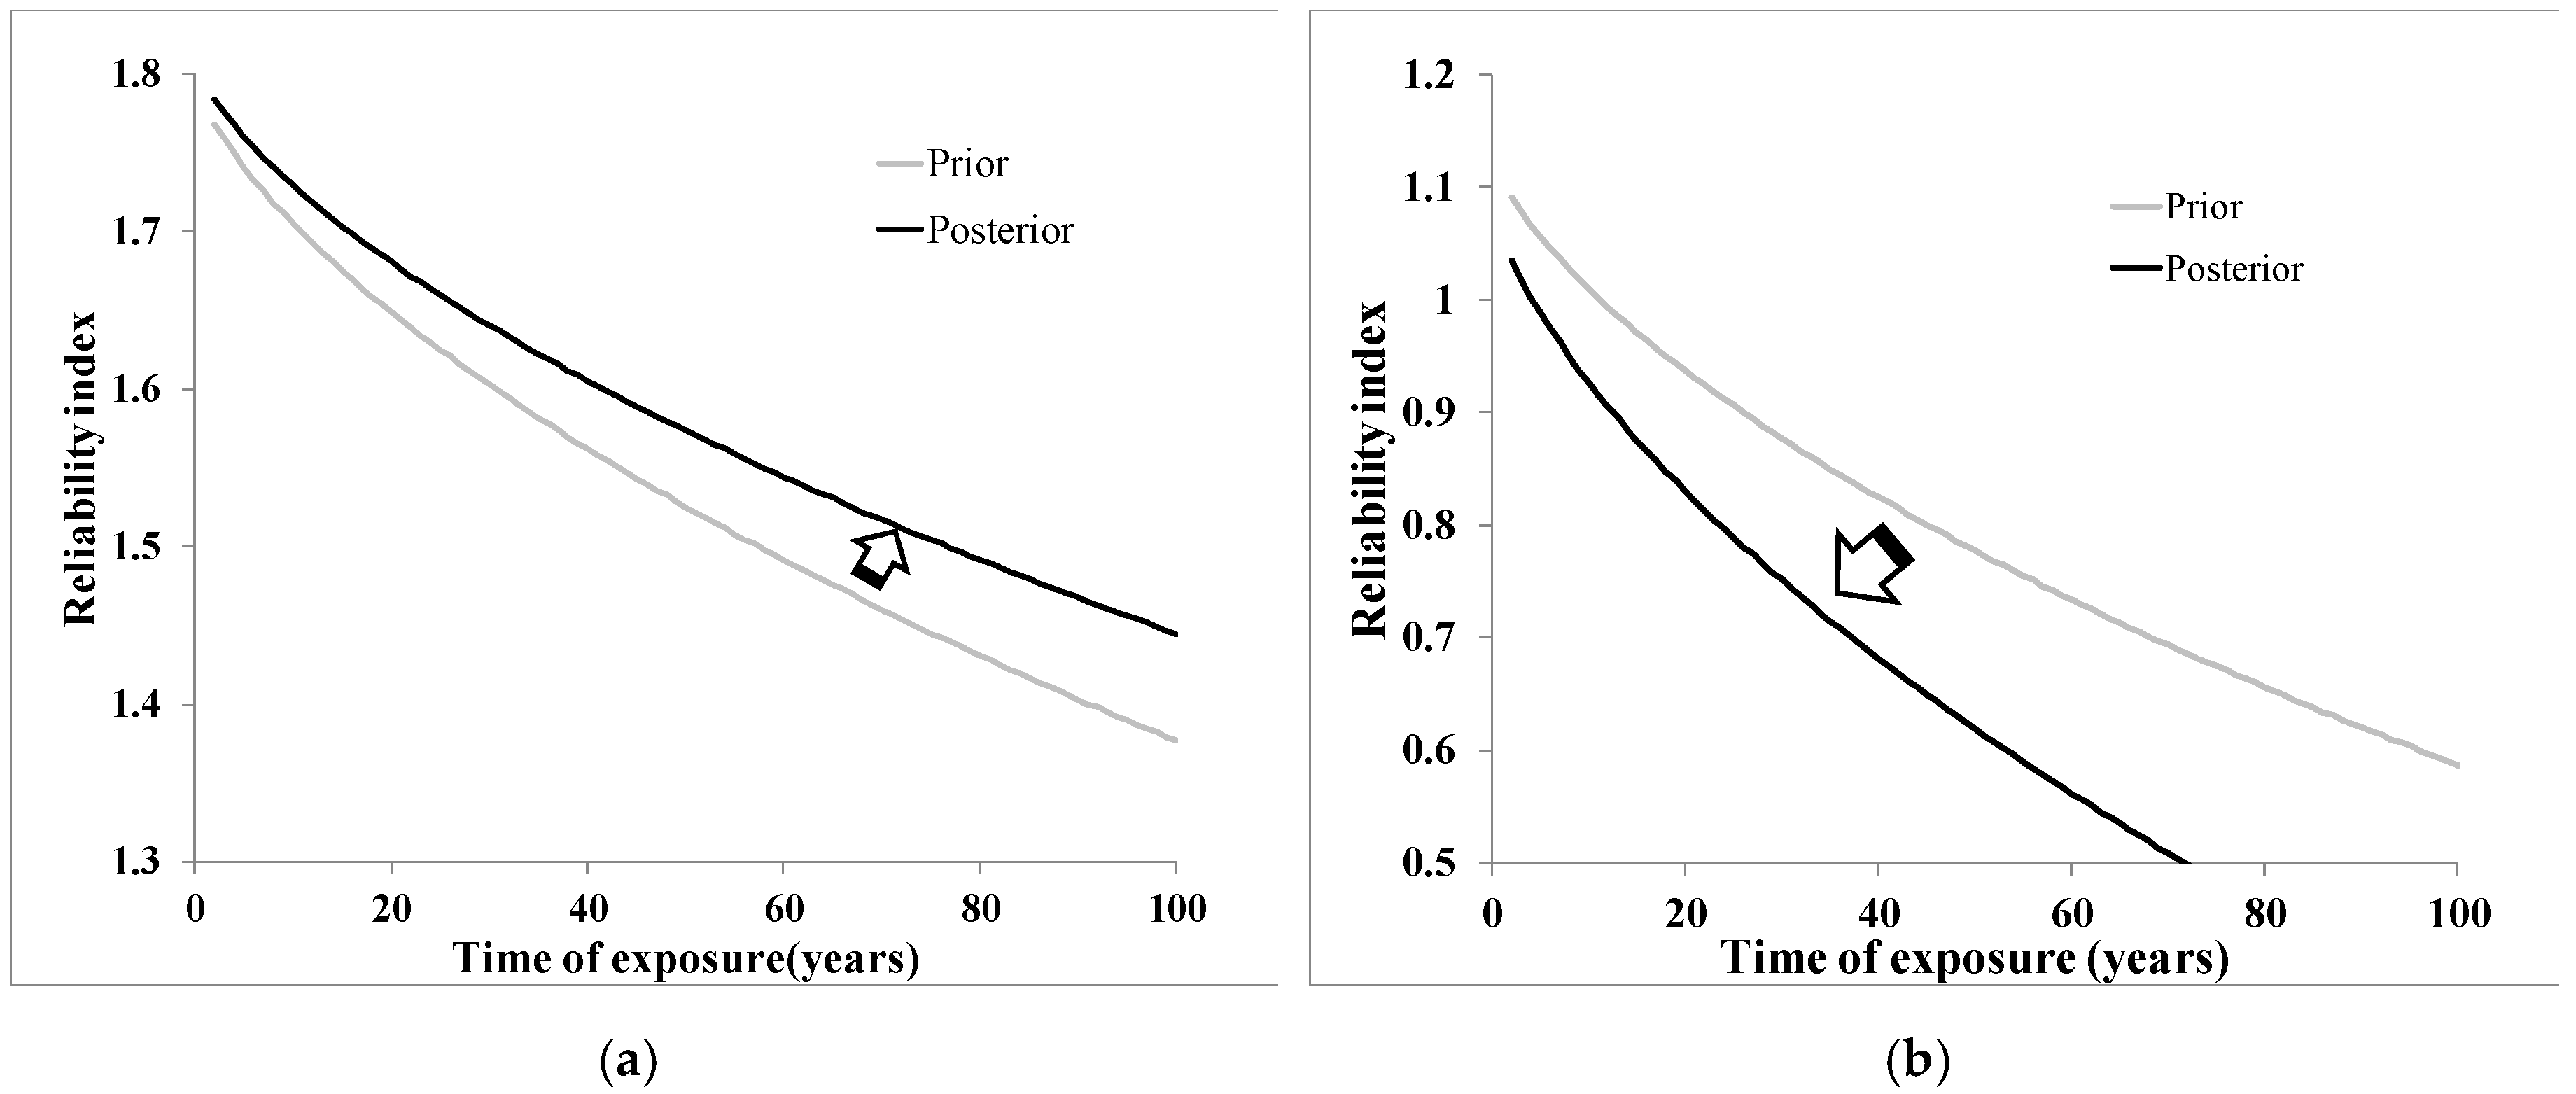
Carbonation reliability indices according to elapsed years from prior prediction and posterior prediction have been calculated for the subject bridges. Figure 8 shows reliability indices for the Gajwa IC viaduct and the Geoje bridge. As described earlier, each bridge has different environmental and design conditions, and the inspection data for predicting reliability indices are also used for different parts of the bridge (Gajwa IC viaduct: pier, Geoje bridge: girder). Thus, the reliability index of the Gajwa IC viaduct was higher than that of the Geoje bridge in this analysis.
The reliability index for effective management in the field is hard to standardize in the field because of various conditions such as environment, design, materials, etc. In this analysis, the structural damage was assumed to occur at reliability indices of 1.5 and 0.7 for the Gajwa IC viaduct and Geoje bridge, respectively.
Damage in the Gajwa IC viaduct was initially estimated to occur in 57 years, and its remaining service life was then increased to 77 years after considering field inspection data. Furthermore, damage to the Geoje bridge was initially predicted to occur in 68 years, but its remaining service life was then critically reduced to 37 years after updating. Therefore, it is recommended to intensively monitor and manage the deterioration of superstructures in the Geoje bridge.
6. Conclusions
This study proposes an effective prediction approach to estimate carbonation in existing concrete structures for better maintenance of deteriorated structures. The carbonation prediction approach initially determined a prior prediction using existing statistical data of design variables such as CO2 diffusion coefficient, CO2 concentration in air, and CO2 uptake with cement hydration. To efficiently apply these design parameters in the prediction, LHS was introduced while analyzing the optimal number of samples. The initial prediction was then revised using Bayesian statistics with previously inspected on-site data obtained from the in-depth safety examination. Moreover, a sensitivity analysis for identifying the optimized number of inspection data was carried out in this study. The proposed prediction approach yielded reliable results of concrete carbonation progress for the three different bridges and estimated their remaining service life, respectively. Since this carbonation prediction approach is able to accurately estimate the carbonation in the fields based on the initial two measurements, it is appropriate to identify the deterioration progress of concrete structures. Thus, it represents an effective tool for proper decision making regarding deteriorated structures in the field.
Although the estimation of the proposed approach reveals strongly reliable results, the requisite data of design variables for performing the initial prediction are needed. Thus, the previous research results for design parameters reflecting field conditions in Korea were introduced in this study, and this approach might be best suitable for application in Korea. For universal use of this approach, therefore, a more effective approach for determining an initial prediction model representing a carbonation velocity coefficient in Equation (2) is required in future work.
Author Contributions
H.J. and Y.-K.A. conceived and design this study. H.J. and S.-B.I. performed the durability analysis in the study and wrote the entire manuscript. All authors have read and agreed to the published version of the manuscript.
Funding
This work was supported by the National Research Foundation of Korea (NRF) grant funded by the Korea government (MSIT) (2018R1A1A1A05078493), and Ministry of the Interior and Safety as Human Resource Development Project in Disaster Management.
Conflicts of Interest
The authors declare that they have no conflict of interest.
References
- Kwon, H.W.; Song, K.J.; Byun, K.J. Durability design for cracked concrete structures exposed to carbonation using stochastic approach. KSCE J. Civ. Eng. 2005, 25, 741–750. [Google Scholar]
- Greve-Dierfeld, S.; Gehlen, C. Performance based durability design, carbonation part 1—Benchmarking of European present design rules. Struct. Concr. 2016, 3, 309–328. [Google Scholar] [CrossRef]
- Greve-Dierfeld, S.; Gehlen, C. Performance based durability design, carbonation part 2—Classification of concrete. Struct. Concr. 2016, 4, 523–532. [Google Scholar] [CrossRef]
- Greve-Dierfeld, S.; Gehlen, C. Performance based durability design, carbonation part 3—PSF approach and a proposal for the revision of deemed-to-satisfy rules. Struct. Concr. 2016, 5, 718–728. [Google Scholar] [CrossRef]
- Kim, T.K.; Choi, S.J.; Kim, J.H.J.; Chu, Y.S.; Yu, E. Performance based evaluation of carbonation resistance of concrete according to various curing conditions from climate change effect. Int. J. Concr. Struct. Mater. 2017, 11, 687–700. [Google Scholar] [CrossRef]
- Ekolu, S.O. A review on effects of curing, sheltering, and CO2 concentration upon natural carbonation of concrete. Constr. Build. Mater. 2016, 127, 306–320. [Google Scholar] [CrossRef]
- Tongaria, K.; Mandal, S.; Mohan, D. A review on carbonation of concrete and its prediction modelling. J. Evniron. Nanotechnol. 2018, 7, 75–90. [Google Scholar] [CrossRef]
- Ashraf, W. Carbonation of cement-based materials: Challenges and opportunities. Constr. Build. Mater. 2016, 120, 558–570. [Google Scholar] [CrossRef]
- Lee, H.-M.; Lee, H.-S.; Min, S.-H.; Lim, S.; Singh, J.K. Carbonation-induced corrosion initiation probability of rebars in concrete with/without finishing materials. Sustainability 2018, 10, 3814. [Google Scholar] [CrossRef] [Green Version]
- Torgal, F.P.; Miraldo, S.; Labrincha, J.A.; Brito, J.D. An overview on concrete carbonation in the context of eco-efficient construction: Evaluation, use of SCMs and/or RAC. Constr. Build. Mater. 2012, 36, 141–150. [Google Scholar] [CrossRef] [Green Version]
- Han, S.H.; Park, W.S.; Yang, E.I. Evaluation of concrete durability due to carbonation in harbor concrete structures. Constr. Build. Mater. 2013, 48, 1045–1049. [Google Scholar] [CrossRef]
- Luo, D.; Niu, D.; Dong, Z. Application of Neural Network for Concrete Carbonation Depth Prediction. In Proceedings of the 4th International Conference on the Durability of Concrete Structures, West Lafayette, IN, USA, 24–26 July 2014; pp. 66–71. [Google Scholar]
- Cho, H.C.; Ju, H.; Oh, J.Y.; Lee, K.J.; Hahm, K.W.; Kim, K.S. Estimation of concrete carbonation depth considering multiple influencing factors on the deterioration of durability for reinforced concrete structures. Adv. Mater. Sci. Eng. 2016, 2016, 1–18. [Google Scholar] [CrossRef] [Green Version]
- Rizvi, S.S.; Akhtar, S.; Verma, S.K. Carbonation induced deterioration of concrete structures. Ind. Concr. J. 2017, 65–70. [Google Scholar] [CrossRef]
- Ekolu, S.O. Model for practical prediction of natural carbonation in reinforced concrete: Part 1-formulation. Cement Concr. Compos. 2018, 86, 40–56. [Google Scholar] [CrossRef]
- Jung, H.J.; Zi, G.S.; Kong, J.S.; Kang, J.G. Durability prediction for concrete structures exposed to chloride attack using a Bayesian approach. J. Korea Concr. Inst. 2008, 20, 77–88. [Google Scholar] [CrossRef] [Green Version]
- Jacinto, L.; Neves, L.C.; Santos, L.O. Bayesian assessment of an existing bridge: A case study. Struct. Infrastruct. Eng. 2015, 12, 61–77. [Google Scholar] [CrossRef] [Green Version]
- Zanini, M.A.; Faleschini, F.; Pellegrino, C. Bridge residual service-life prediction through Bayesian visual inspection and data updating. Struct. Infrastruct. Eng. 2017, 13, 906–907. [Google Scholar] [CrossRef]
- Sanjuán, M.A.; Olmo, C. Carbonation resistance of one industrial mortar used as a concrete coating. Build. Environ. 2001, 36, 949–953. [Google Scholar] [CrossRef]
- Lee, C.S.; Yoon, I.S. Prediction of carbonation progress for concrete structures considering change of atmospheric environment. J. Korea Concr. Inst. 2003, 15, 574–584. [Google Scholar] [CrossRef]
- Comite Euro-International du Beton. CEB-FIP Model Code 1990; Thomas Telford Ltd.: London, UK, 1993. [Google Scholar]
- Lee, C.S.; Yoon, I.S.; Kim, Y.H. Probability analysis on carbonation rate of concrete structures in Seoul metropolitan area. Seoul Stud. 2004, 5, 95–104. [Google Scholar]
- Cha, S.W. Mathematical modeling of degree of hydration and adiabatic temperature rise. J. Korea Concr. Inst. 2002, 14, 118–125. [Google Scholar]
- Ang, A.H.-S.; Tang, W.H. Probability Concepts in Engineering Planning and Design: Basic Principles, Volume 1; John Wiley & Sons: Hoboken, NJ, USA, 1975; pp. 329–359. [Google Scholar]
- Bazant, Z.P.; Kim, J.K. Segmental box girder: Deflection probability and Bayesian updating. J. Struct. Eng. 1989, 115, 2528–2547. [Google Scholar] [CrossRef] [Green Version]
- Oh, B.H.; Yang, I.H. Realistic estimation method of compressive strength in concrete structures. J. Korea Concr. Inst. 1999, 11, 241–249. [Google Scholar]
- Yang, I.H. Long-term prediction of prestress in concrete bridges by nonlinear regression analysis method. J. Korea Concr. Inst. 2006, 18, 507–515. [Google Scholar] [CrossRef]
- Mckay, M.D.; Beckman, R.T.; Conover, W.J. A comparison of three methods for selecting values of input variables in the analysis output from a computer code. Technometrics 1979, 21, 239–245. [Google Scholar] [CrossRef]
- Olsson, A.; Sandberg, G.; Dahlblom, O. On Latin hypercube sampling for structural reliability analysis. Struct. Safety 2003, 25, 47–68. [Google Scholar] [CrossRef]
- Korea Infrastructure Safety Corporation. In-depth Safety Examination Report, 1995–2016. Available online: http://www.fms.or.kr (accessed on 24 June 2020).
- Ministry of Land, Infrastructure and Transport; Korea Infrastructure Safety Corporation. Guidelines for Inspection and Assessment of Infrastructure Safety; KISTEC: Seoul, Korea, 2018. [Google Scholar]
- Yang, J.W. A Study on Evaluation of Probability Based Service Life in Carbonated RC Structure. Master’s Thesis, Hanyang University, Kyonggido, Korea, 2011. [Google Scholar]
- Kwon, S.J.; Park, S.S.; Nam, S.H. A suggestion for carbonation prediction using domestic field survey data of carbonation. J. Korea Inst. Struct. Maint. Insp. 2007, 11, 81–88. [Google Scholar]
Figure 1.
CO2 diffusion coefficient according to time.

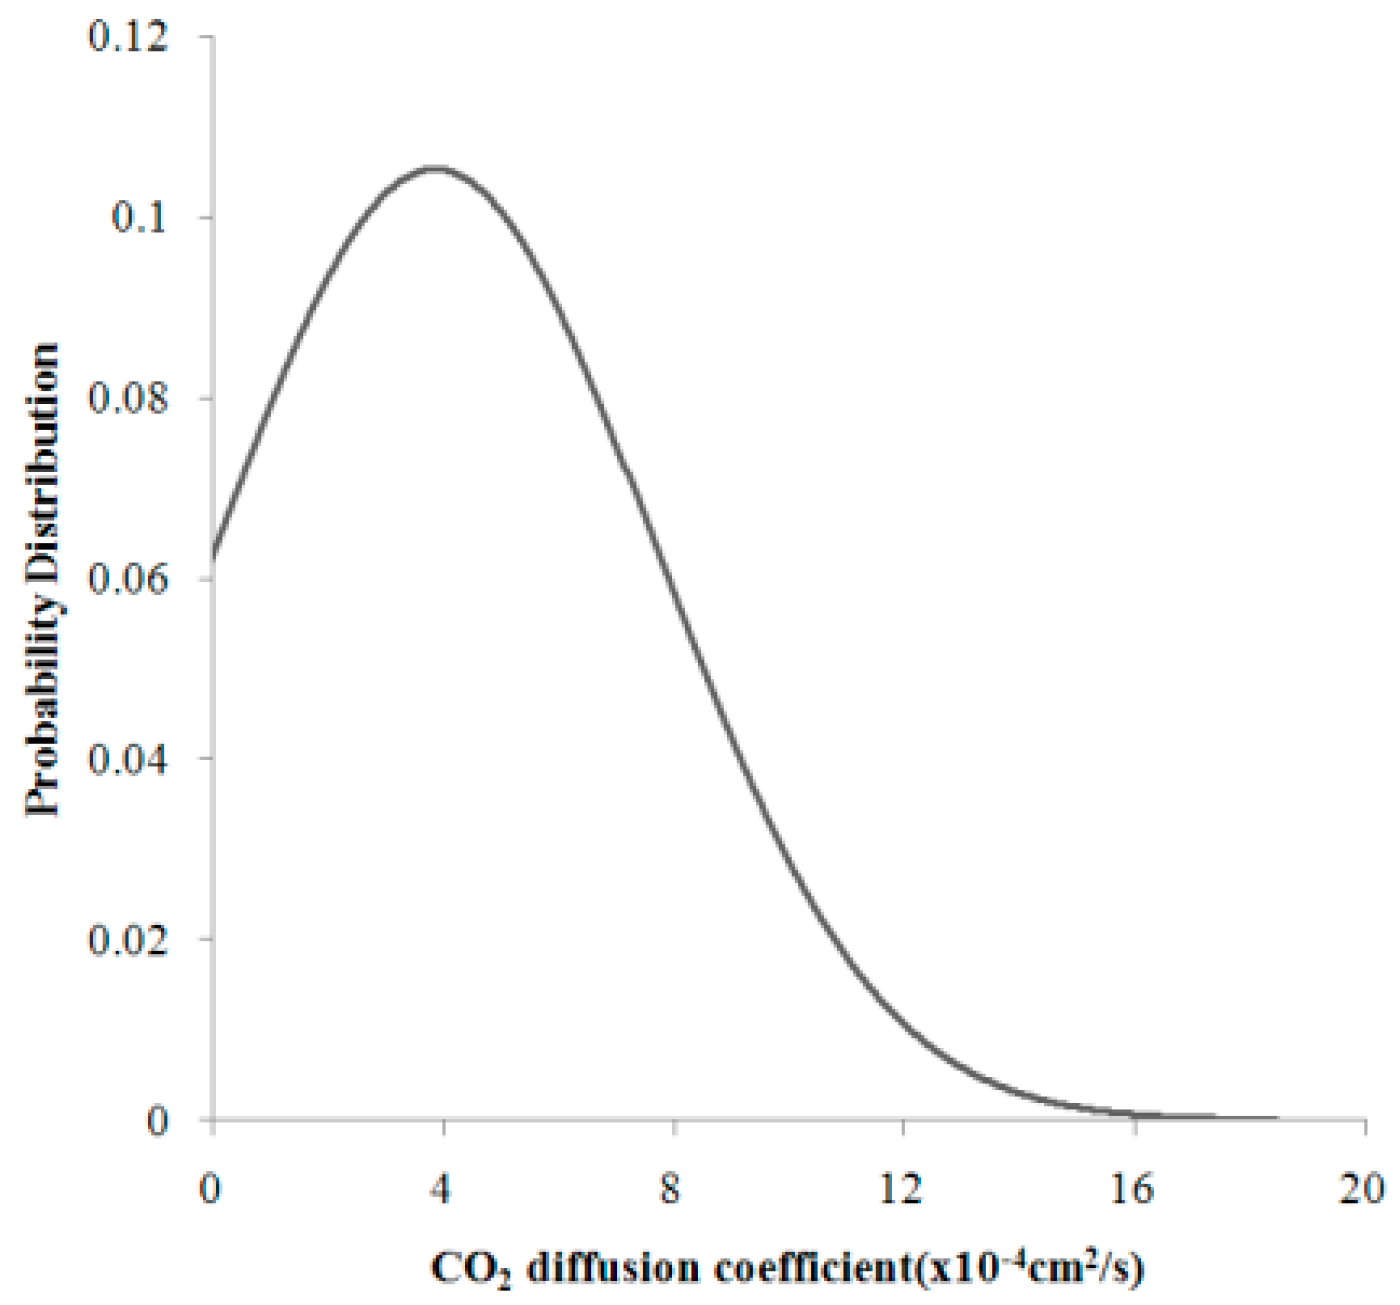
Figure 2.
Probability distribution of CO2 diffusion coefficient [22].
Figure 2.
Probability distribution of CO2 diffusion coefficient [22].

Figure 3.
Hydration rates of main constituents of Portland cement [22].
Figure 3.
Hydration rates of main constituents of Portland cement [22].

Figure 4.
Changes in posterior predicted values of carbonation depth according to changes in the number of Latin hypercube sampling (LHS) values.
Figure 4.
Changes in posterior predicted values of carbonation depth according to changes in the number of Latin hypercube sampling (LHS) values.

Figure 5.
Updated prediction model considering different numbers of on-site data of the Gajwa IC viaduct.
Figure 5.
Updated prediction model considering different numbers of on-site data of the Gajwa IC viaduct.

Figure 6.
Sensitivity analysis for the optimized number of on-site data. (a) Gajwa IC viaduct; (b) Noryang bridge; (c) Geoje bridge.
Figure 6.
Sensitivity analysis for the optimized number of on-site data. (a) Gajwa IC viaduct; (b) Noryang bridge; (c) Geoje bridge.

Figure 7.
Changes in prior and posterior predicted values for carbonation depth of the subject bridge. (a) Gajwa IC viaduct; (b) Noryang bridge; (c) Geoje bridge.
Figure 7.
Changes in prior and posterior predicted values for carbonation depth of the subject bridge. (a) Gajwa IC viaduct; (b) Noryang bridge; (c) Geoje bridge.

Figure 8.
Changes in prior and posterior predicted values for reliability index of the subject bridge. (a) Gajwa IC viaduct; (b) Geoje bridge.
Figure 8.
Changes in prior and posterior predicted values for reliability index of the subject bridge. (a) Gajwa IC viaduct; (b) Geoje bridge.


Table 1.
Chemical composition of Portland cement [23].
Table 1.
Chemical composition of Portland cement [23].
| Classification | Type of Portland Cement | |||
|---|---|---|---|---|
| TYPE I | TYPE II | TYPE IV | TYPE V | |
| C3S (%) | 49 | 42 | 23 | 46 |
| C2S (%) | 23 | 37 | 58 | 32 |
| C3A (%) | 10 | 6 | 3 | 4 |
| C4AF (%) | 9 | 12 | 9 | 13 |
Table 2.
Constants of compounds in cement [22].
Table 2.
Constants of compounds in cement [22].
| C3S (%) | 0.25 | 0.90 | 0.70 |
| C2S (%) | 0.46 | 0 | 0.12 |
| C3A (%) | 0.28 | 0.90 | 0.77 |
| C4AF (%) | 0.26 | 0.90 | 0.55 |
Table 3.
Carbonation on-site data of subject bridges.
| Bridge | Environmental Condition | Measured Point | Age (Years) | Carbonation Depth (mm) |
|---|---|---|---|---|
| Gajwa IC viaduct | On land | Pier | 11 | 5 |
| 16 | 5 | |||
| 19 | 7 | |||
| 24 | 7.3 | |||
| Noryang bridge | Above the river * | Pier | 10 | 6 |
| 17 | 6.5 | |||
| 22 | 8.4 | |||
| 27 | 8.44 | |||
| Geoje bridge | Above the sea | Girder | 27 | 23 |
| 34 | 30 | |||
| 39 | 32 | |||
| 44 | 26.4 |
* Located in the center of the city.
Table 4.
Statistical data of concrete cover thickness of subject bridges according to environmental conditions.
Table 4.
Statistical data of concrete cover thickness of subject bridges according to environmental conditions.
| Environmental Conditions | Number of On-Site Data | Mean (mm) | Standard Deviation (mm) |
|---|---|---|---|
| On land | 540 | 61.66 | 32.50 |
| Above the river * | 399 | 57.17 | 33.73 |
| Above the sea | 117 | 62.44 | 49.57 |
* Located in the center of the city.
Table 5.
Mean and standard deviation according to design variables.
| Design Variables | Prior Values (Mean, Standard Deviation) |
|---|---|
| (×10−4 cm2/s) | |
| (g/cm3) | Using Equation (4), (0.74) |
| (g/cm3) | Using Equation (5) and Table 1, (1.65) |
| Using Equations (6) and (7), (0.12) |
© 2020 by the authors. Licensee MDPI, Basel, Switzerland. This article is an open access article distributed under the terms and conditions of the Creative Commons Attribution (CC BY) license (http://creativecommons.org/licenses/by/4.0/).
Share and Cite
MDPI and ACS Style
Jung, H.; Im, S.-B.; An, Y.-K. Probability-Based Concrete Carbonation Prediction Using On-Site Data. Appl. Sci. 2020, 10, 4330. https://doi.org/10.3390/app10124330
AMA Style
Jung H, Im S-B, An Y-K. Probability-Based Concrete Carbonation Prediction Using On-Site Data. Applied Sciences. 2020; 10(12):4330. https://doi.org/10.3390/app10124330
Chicago/Turabian StyleJung, Hyunjun, Seok-Been Im, and Yun-Kyu An. 2020. "Probability-Based Concrete Carbonation Prediction Using On-Site Data" Applied Sciences 10, no. 12: 4330. https://doi.org/10.3390/app10124330
Note that from the first issue of 2016, this journal uses article numbers instead of page numbers. See further details here.