Mechanical and Fiber-Bridging Behavior of Slag-Based Composite with High Tensile Ductility


1
Biohousing Research Center, Chonnam National University, Gwangju 61186, Korea
2
School of Architecture, Chosun University, 309 Pilmun-daero, Dong-gu, Gwangju 61452, Korea
3
School of Architecture, Chonnam National University, 77 Yongbong-ro, Buk-gu, Gwangju 61186, Korea
*
Author to whom correspondence should be addressed.
Appl. Sci. 2020, 10(12), 4300; https://doi.org/10.3390/app10124300
Submission received: 1 June 2020
/
Revised: 18 June 2020
/
Accepted: 20 June 2020
/
Published: 23 June 2020
(This article belongs to the Special Issue Assessment of High-Performance Fiber-Reinforced Concrete Properties)
Abstract
:This paper presents an experimental and analytical investigation of the fundamental mechanism of the highly ductile behavior of strain-hardening slag-based composite reinforced by polyethylene fibers. Composite properties, including compressive strength and tensile behavior of the composite, were identified. Micromechanical characteristics, including matrix fracture toughness and interfacial properties between matrix and fiber, were investigated and the fiber-bridging behavior of the composite was simulated. The tensile behavior of the composite was evaluated by micromechanical analysis. Test results showed that the composite had extremely high tensile ductility of up to 7.5% and high tensile strength of 8.5 MPa, along with a moderate compressive strength of 36.8 MPa. Saturated cracking patterns with controlled crack width of 59.8 μm were also observed in the composite. Considering the variation of matrix properties and fiber distribution, the theoretical fiber-bridging curve simulated the tensile behavior of the composite well, and the micromechanical analysis results supported the tensile behavior of the composite.
1. Introduction
It has been reported that approximately 1 ton of CO2 is produced to produce 1 ton of cement and that annual CO2 emission by the cement industry contributes approximately 7% of the world-yearly emissions of greenhouse gases [1]. Beside the environmental problems of cement, the number and the magnitude of natural and manmade disasters have increased due to environmental, social, and political problems. Therefore, high performance and material sustainability are becoming important in research on construction materials [2]. Highly-ductile fiber-reinforced cementless composite is a promising construction material due to its high tensile performance and material sustainability.
Recently, several feasibility studies on highly ductile fiber-reinforced cementless composite were reported [3,4,5,6,7,8,9]. Although the reported materials had lower compressive and tensile strength values than those of cement composites, certain types of cementless composites showed higher tensile ductility, smaller crack width, and tighter crack spacing than those of cement composites. Lee et al. demonstrated the strain-hardening behavior and high ductility of alkali-activated slag based cementless fiber-reinforced composite under tension load [3]. Polyvinyl alcohol (PVA) fiber of 2 vol.% was used as reinforcement. The compressive strength was 30.6 MPa and the tensile strength and tensile ductility were 4.7 MPa and 4.5%, respectively. Ohno and Li also established the feasibility of highly ductile fly-ash based cementless composite with high tensile ductility of up to 4.3% [4]. The compressive strength of composite was 27.6 MPa. After that, relatively high strength fly-ash based cementless composites with a compressive strength of 63.7 MPa and tensile ductility of 4.3%, called engineered geopolymer composites, were developed [6,7].
In Choi et al. [8] it was experimentally proved that high ductility of up to 7.5% and high tensile strength of 13.1 MPa in a cementless composite can be achieved by using polyethylene (PE) fiber with high strength of up to 2 700 MPa. The effect of a defoamer on the tensile behavior of a cementless composite was also investigated [9]. Mechanical properties were investigated between cement and cementless composites with identical water to binder ratios and levels of fiber reinforcement (PE fiber) [10].
As described above, it has been demonstrated that, compared to cement-based composites, alkali-activated slag-based cementless composites reinforced with synthetic fibers have high tensile performance. However, to the best of the authors’ knowledge, there is limited information available on the fundamental mechanisms that support the strain-hardening and highly ductile behavior of slag-based composite.
The tensile behavior of fiber-reinforced composite depends on the characteristics of the matrix, fiber, and interface between matrix and fiber. It also depends on the structure and morphology. Therefore, to understand the fundamental mechanism on the strain-hardening and highly ductile behavior of the composite, it is necessary to investigate the micromechanical properties and evaluate the stress performance index () and energy performance index () [11,12,13]. Here, the two indices refer to the calculated values of the stress and energy conditions for the strain-hardening and steady-state multiple cracking behavior of composite. More specifically, for the stress condition, the maximum fiber-bridging stress must be higher than the cracking strength of the composite, while for the energy condition the complementary energy must be higher than the fracture energy of the matrix. The higher the two performance indexes are, the greater the likelihood is that the composite will exhibit strain-hardening and steady-state multiple cracking behavior.
The purpose of this study is to experimentally investigate the micromechanical characteristics including matrix fracture toughness of alkali-activated slag matrix and interfacial properties between matrix and PE fiber, and to analyze theoretically the fiber-bridging behavior of the composite.
2. Materials and Methods
2.1. Materials and Mixture Proportion
This study was designed from our previous study, which considered the workability of mixtures; Table 1 lists the investigated materials and the mixture proportion [8]. Ground-granulated blast furnace slag (GS) was used a source material. Chemical compositions of the GS were obtained by X-ray fluorescence analysis and are shown in Table 2. GS has a high amount of calcium oxide and silicon dioxide of over 71%; these are the main minerals that compose the calcium silicate hydrate (C-S-H) structure in the hydration reaction with water. The Blaine fineness and specific gravity of the GS were 4 320 cm2/g and 2.92, respectively. Powders of Ca(OH)2 and Na2SO4, with purities over than 95%, were used to activate the GS. For uniform fiber distribution, a polycarboxylate-based superplasticizer (SP) and viscosity modifying admixture (VMA) were used to proper fluidity and viscosity of matrix. One previous study reported that fiber distribution depended on the plastic viscosity of fresh mixtures, and that there is an optimal range of this viscosity for good fiber distribution [14]. In order to obtain highly tensile strength and ductility of the composite, PE fiber with high aspect ratio (1500) and high strength was adopted as a reinforcing fiber. The diameter and length of the fiber were 12 μm and 18 mm, respectively. The tensile strength and elastic modulus of the fiber were 2700 MPa and 88 GPa, respectively.
2.2. Specimen Preparation
Powder type materials, i.e., GS, Ca(OH)2, and Na2SO4 were dry-mixed in a planetary mixer for three minutes for homogeneous dispersion of each component. Liquid materials, i.e., water and superplasticizer were then added in the mixer and mixed for three minutes more. Once the liquid mixture was homogenous, PE fiber was added and mixing was performed again. After checking for homogenous dispersion of the fiber, without fiber balling, specimens were manufactured to measure the compressive strength and tensile properties of the composite. Three 50 mm-cube specimens for the compressive strength test and seven dumbbell-shaped specimens for the tension test were prepared. To prevent evaporation of water, which can induce plastic shrinkage, plastic sheets were used to cover each specimen. All specimens were cured in molds in a room with controlled temperature of (23 ± 3) °C and 60% R.H. for two days to achieve sufficient strength for demolding. After demolding, all specimens were cured in water at a temperature of (23 ± 3) °C until an age of 28 days.
For the matrix fracture toughness and fiber pullout tests, a procedure identical to that used in the composite property test was adopted to make a matrix without fibers. Three bending specimens with notches, in accordance with ASTM E399, were made and cured under conditions identical to those of the composite property tests [15]. Five specimens, in which a single fiber was embedded in the matrix with an embedment length of 2 mm, were made and cured in a sealed plastic box under moist condition in a room with controlled temperature of (23 ± 3) °C.
2.3. Mechanical Tests
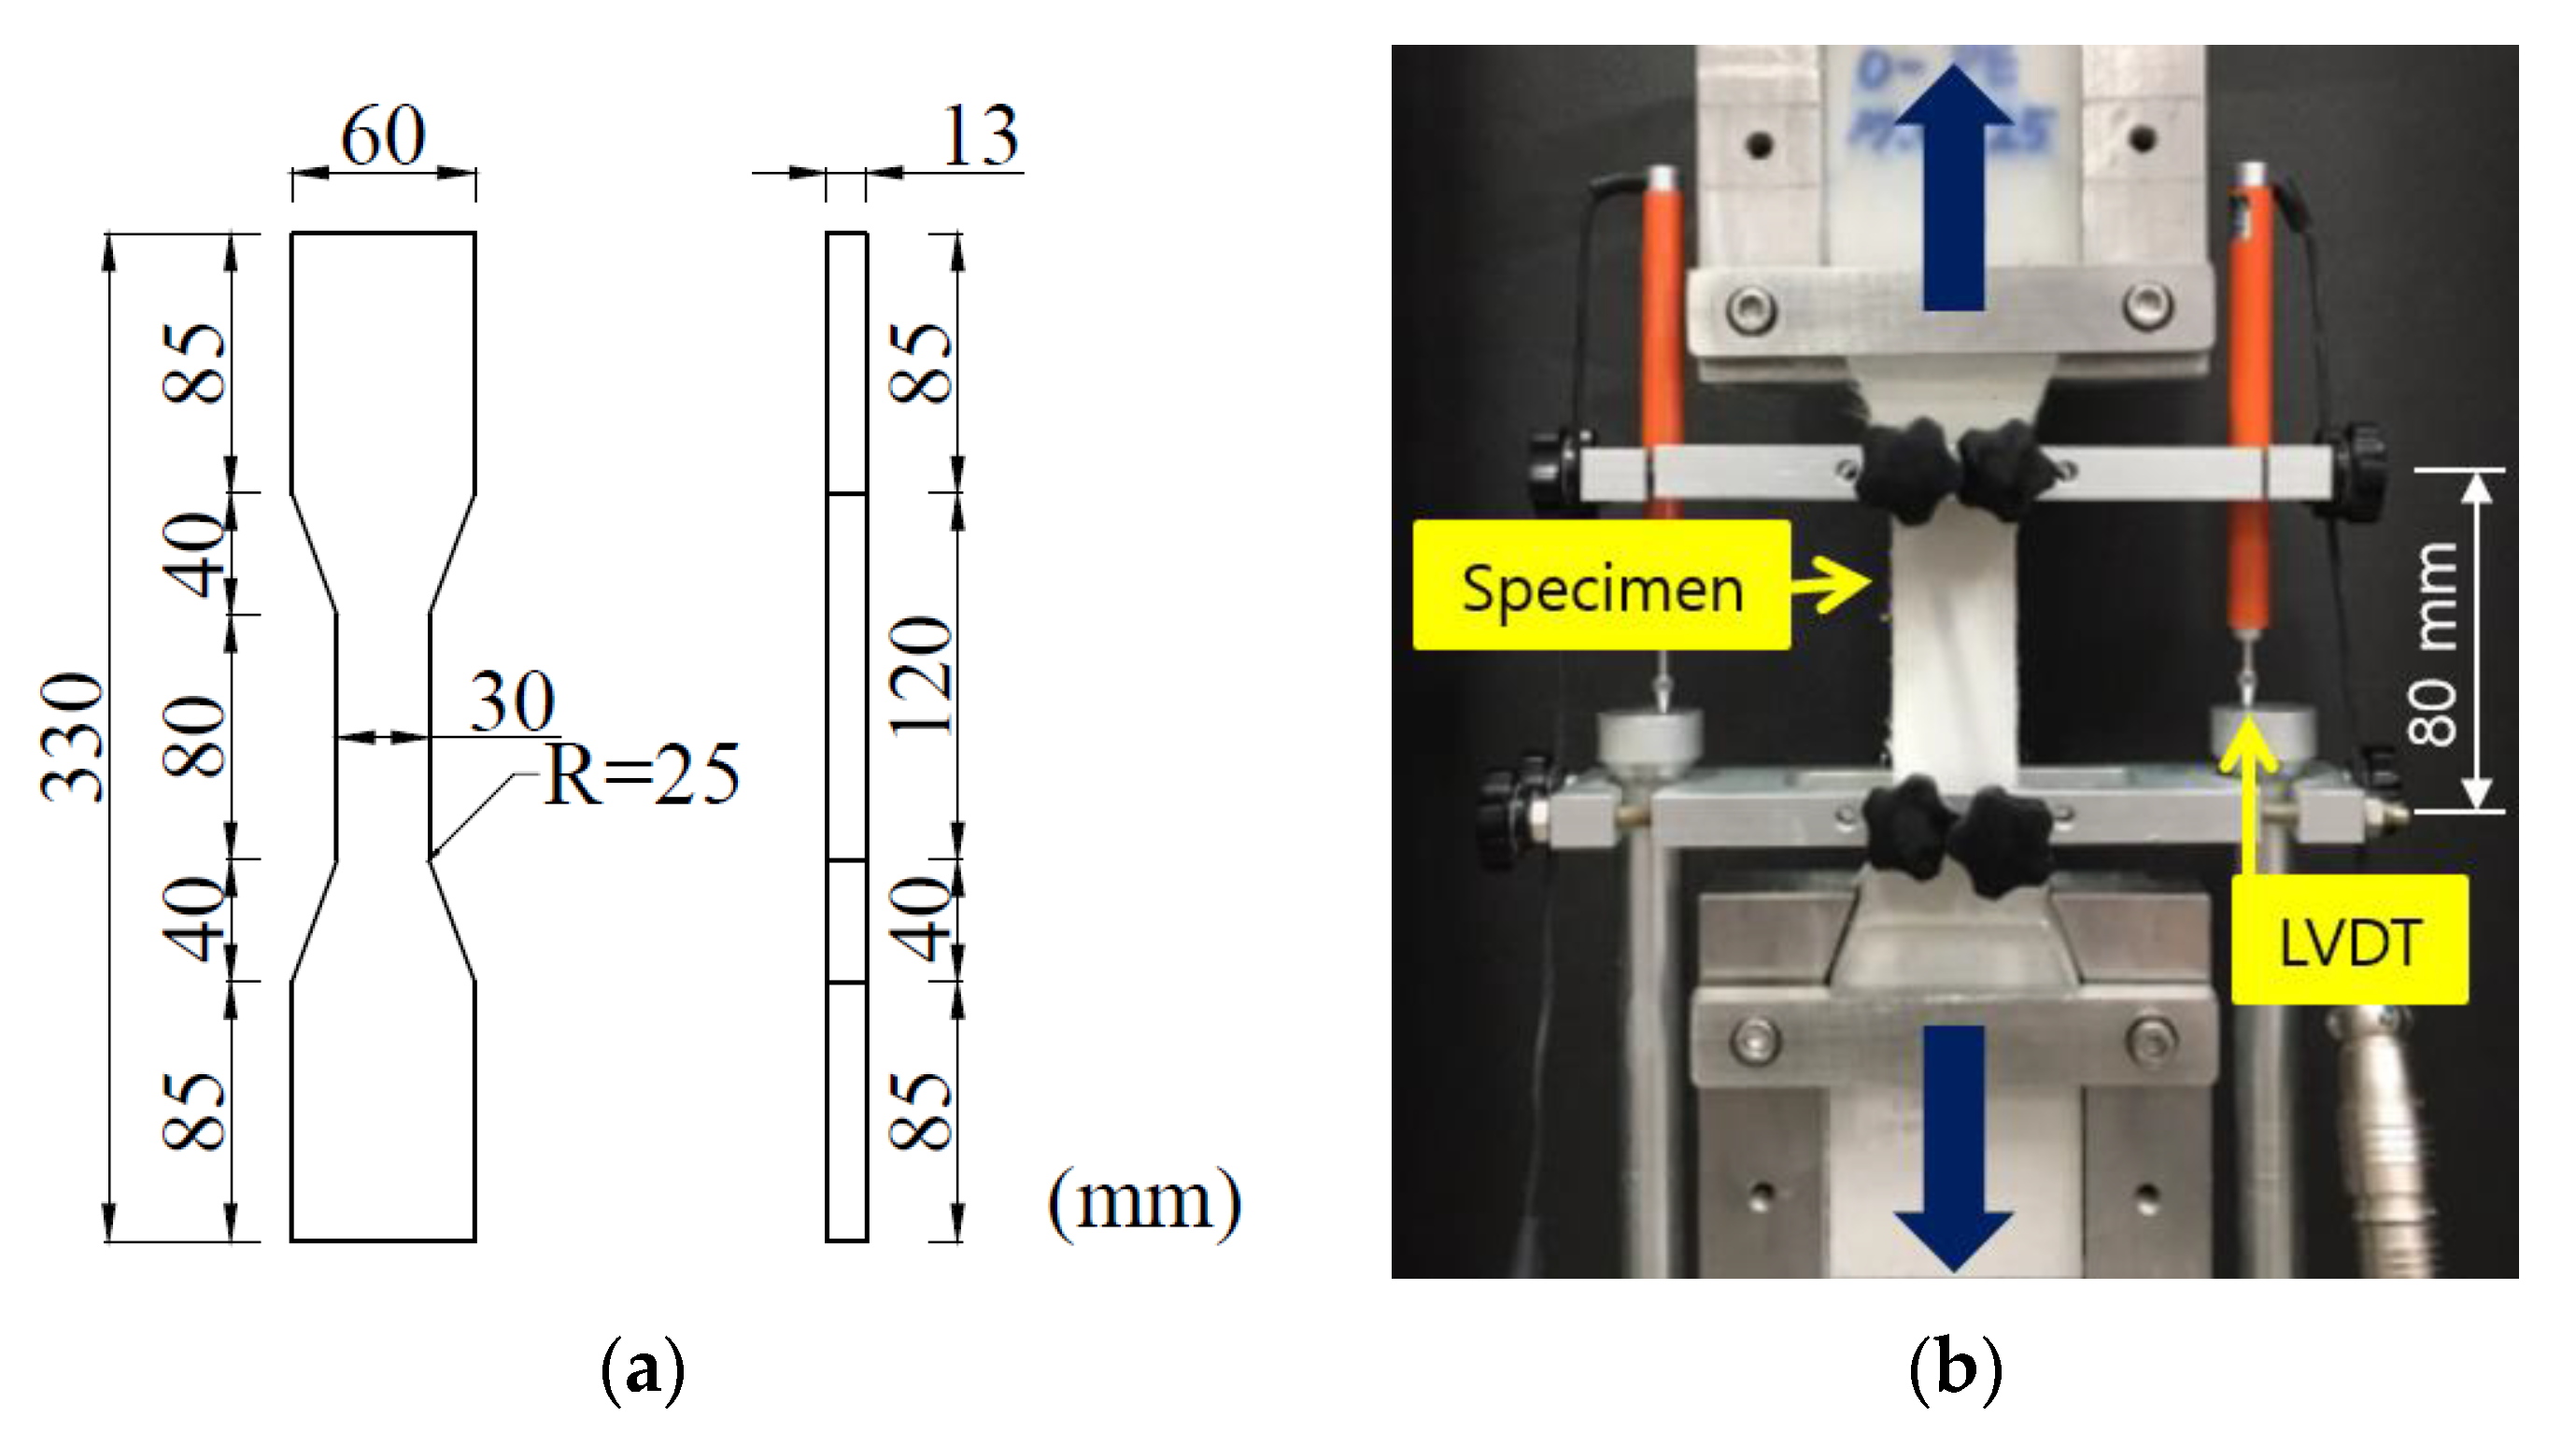
The compressive strength () was measured using the 50-mm cube specimens according to ASTM C109/C109M [16]. At 28 days after mixing, uniaxial tension tests were performed according to the method proposed by the Japanese Society of Civil Engineers (JSCE 2008) [17]. Figure 1 shows the dimensions of the specimen and the test setup for the tension tests [8]. The test was performed using an electrical test machine under displacement-control mode at a rate of 0.1 mm/min. The displacement of each specimen was measured using two linear variable differential transformers (LVDT) attached to the right and left sides of the specimen. More specifically, deformation of each specimen within the gauge length (80 mm) was measured and converted into the strain. The width and thickness of the specimen within the gauge length were 30 mm and 13 mm, respectively. Additionally, scanning electron microscopy (SEM) was applied to analyze the morphology of the interface between the hardened matrix and the PE fiber.
2.4. Fracture Toughness Test
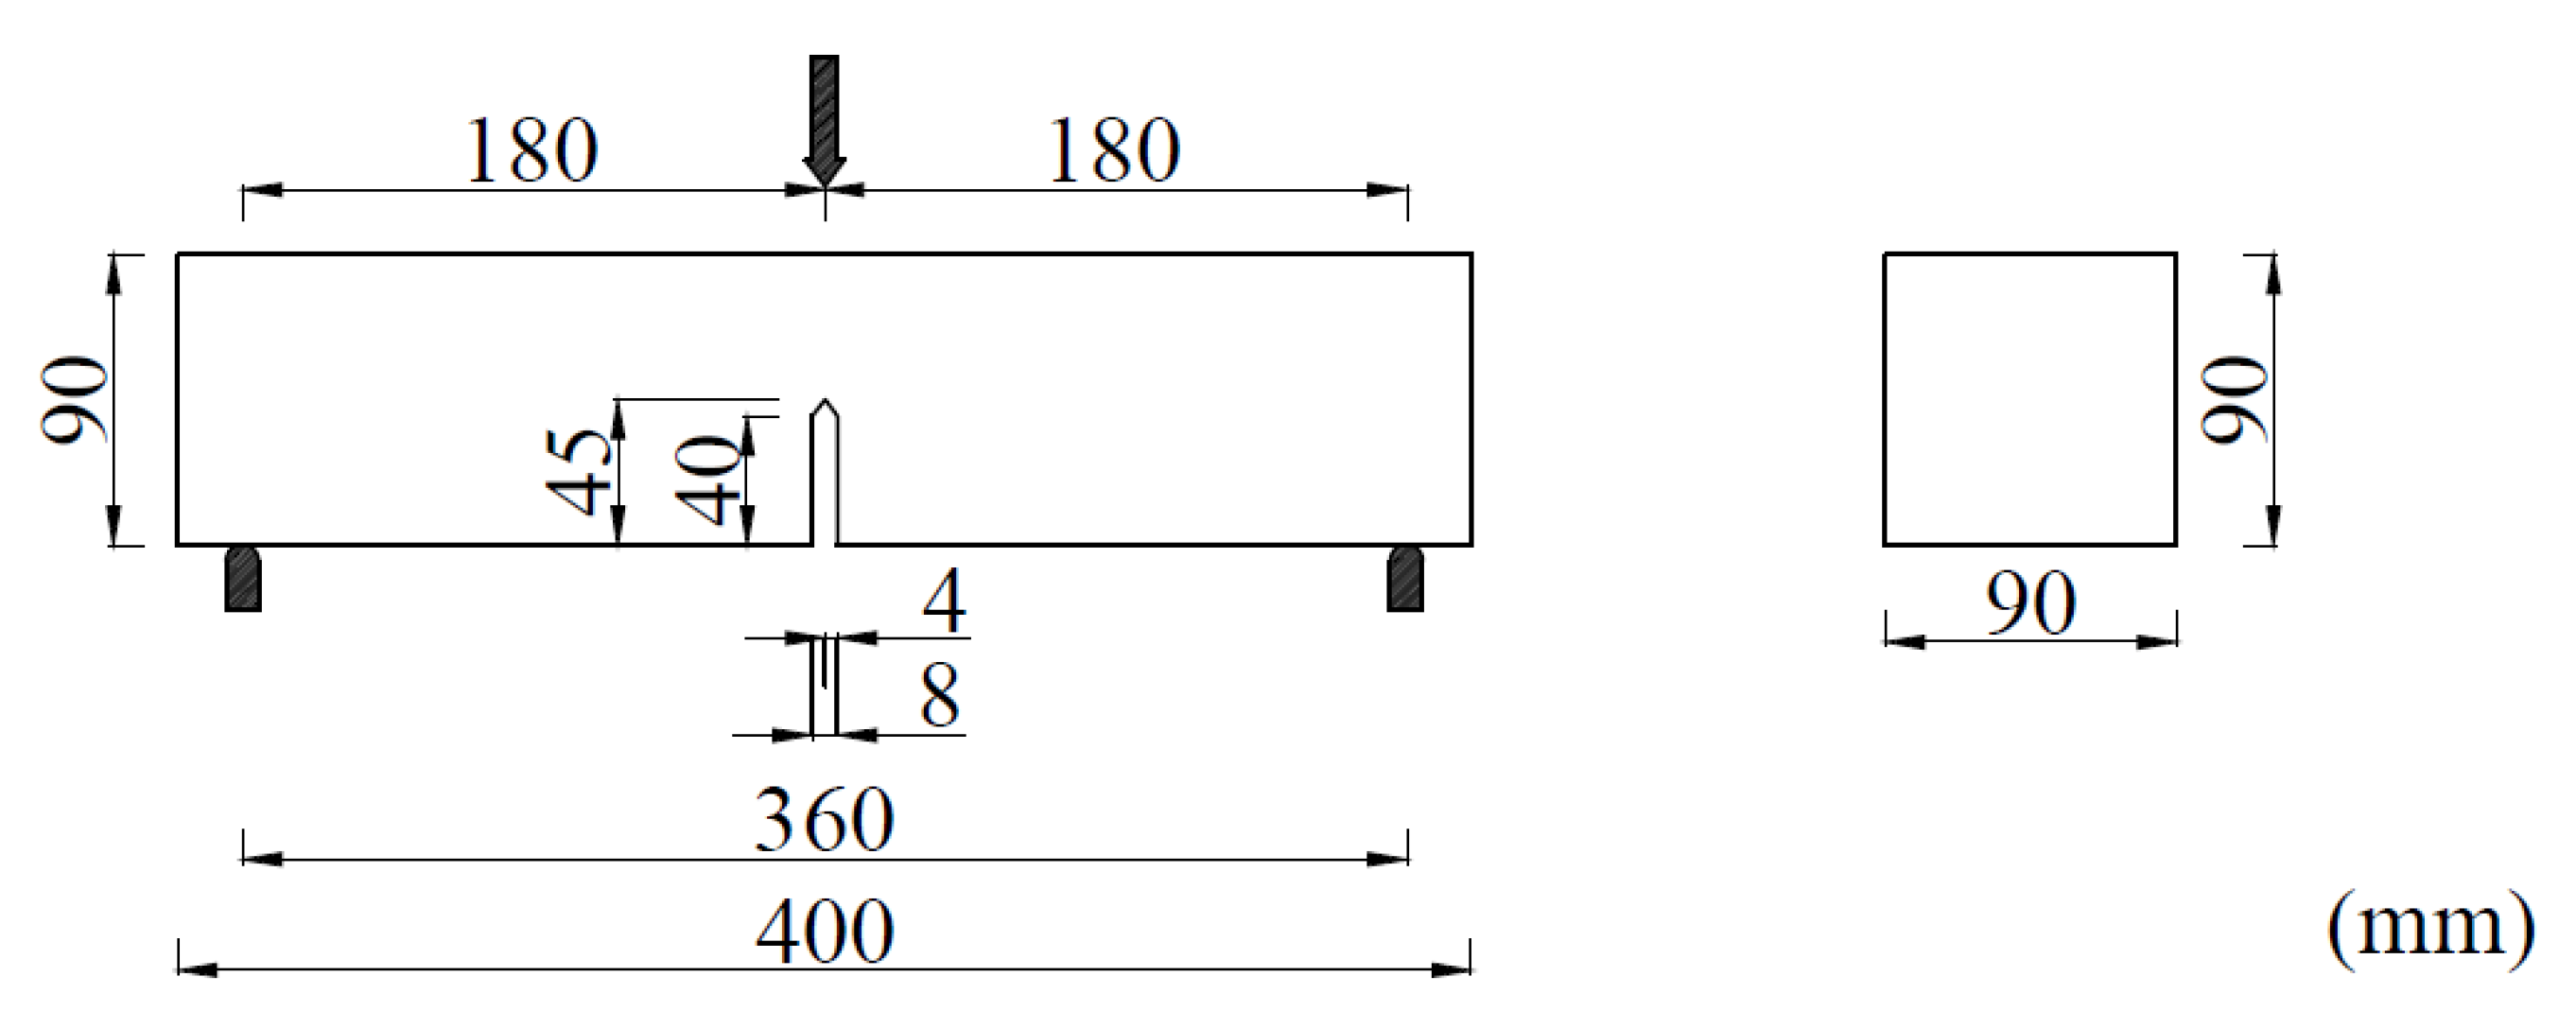
In accordance with the method, as specified in the ASTM E399, fracture toughness tests were performed to evaluate the fracture toughness of the matrix [15]. Figure 2 shows the dimensions of the specimen and the test setup for the matrix fracture toughness test. The specimen dimensions were 90 mm × 45 mm × 400 mm; and a 45-mm notch location was at the center of each specimen. The span was four times the depth of the specimen as specified in ASTM E399. The load was applied at the center using an electrical test machine.
2.5. Fiber Pullout Test
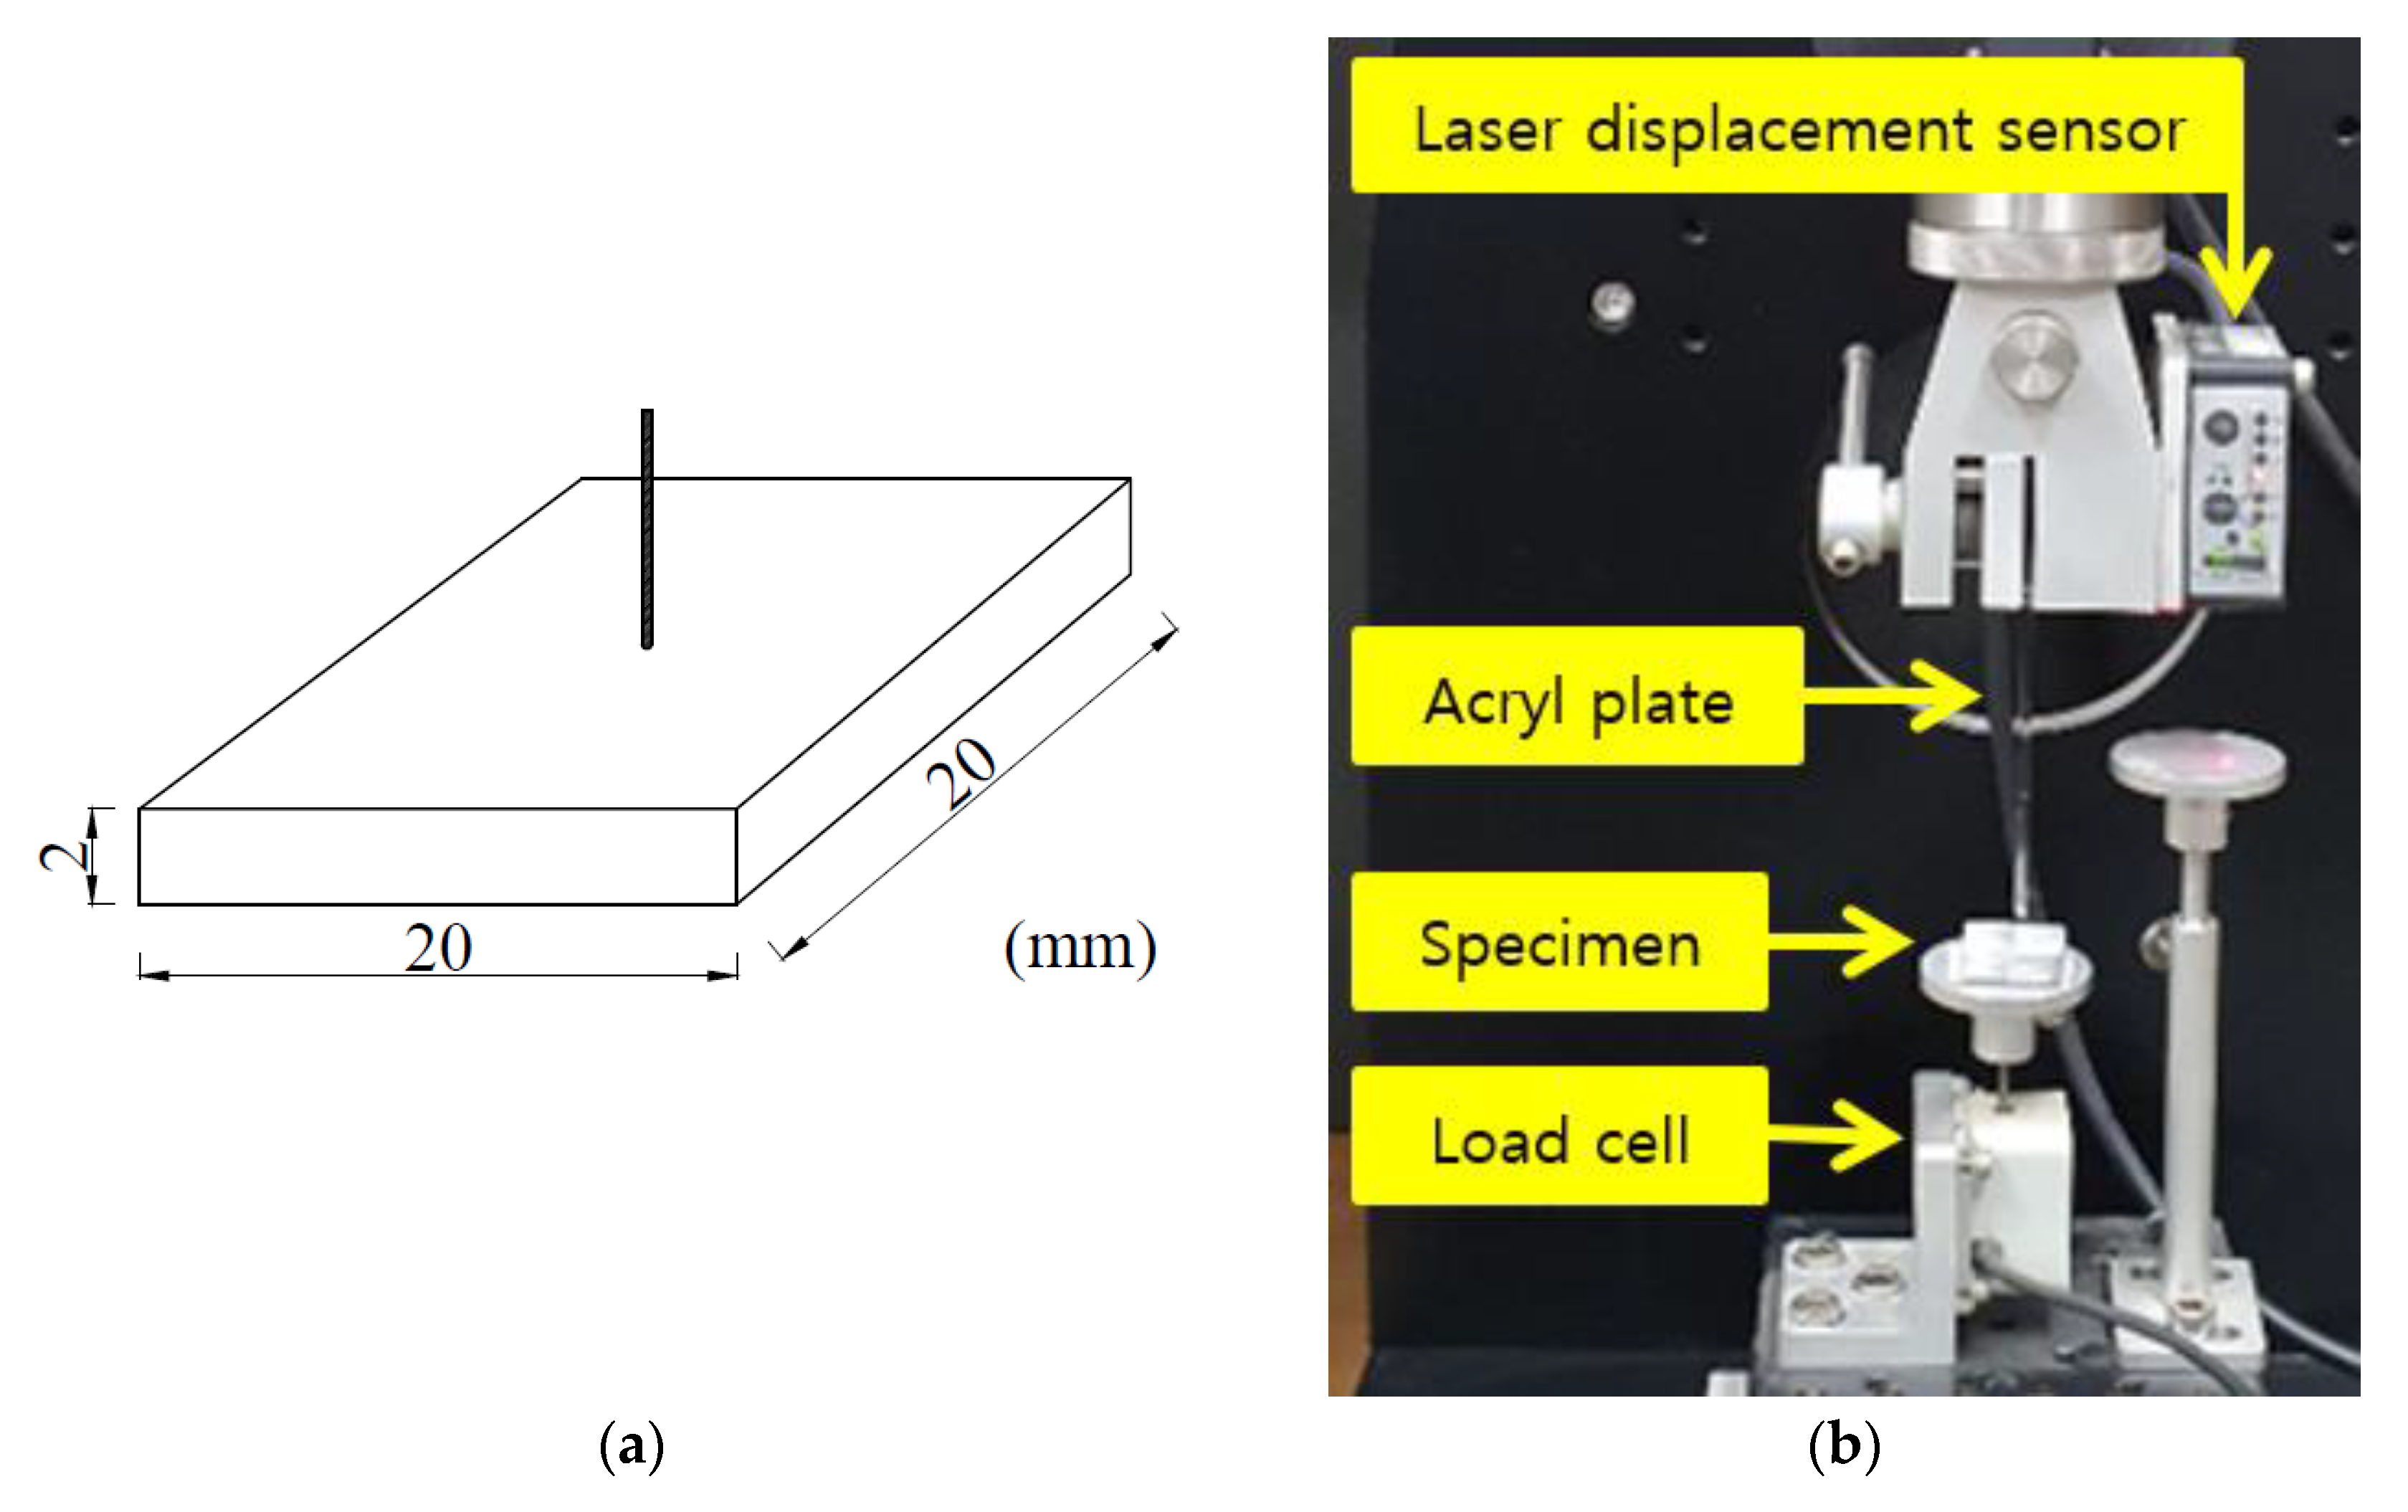
Fiber pullout tests were conducted according to the method proposed by Redon et al. [18]. Figure 3 shows the dimensions of the specimen and the test setup of the fiber pullout test. Fiber pullout tests were conducted using an electrical test machine, to which a 5 N load cell and a laser displacement sensor were attached. The load was applied under displacement-control mode at a rate of 10 μm/s.
3. Results and Discussion
3.1. Composite Properties
The value of of the composite was 36.8 MPa; the coefficient of variation of was 4.5%. The value of of the composite is lower than that of the previous study, which had an identical water-to-binder ratio [8]. This is attributed to the fact that the chemical compositions of the slag used in this study are different from those of previous study and the fiber volume fraction (1.50%) in this study is lower than that (1.75%) of the previous study.
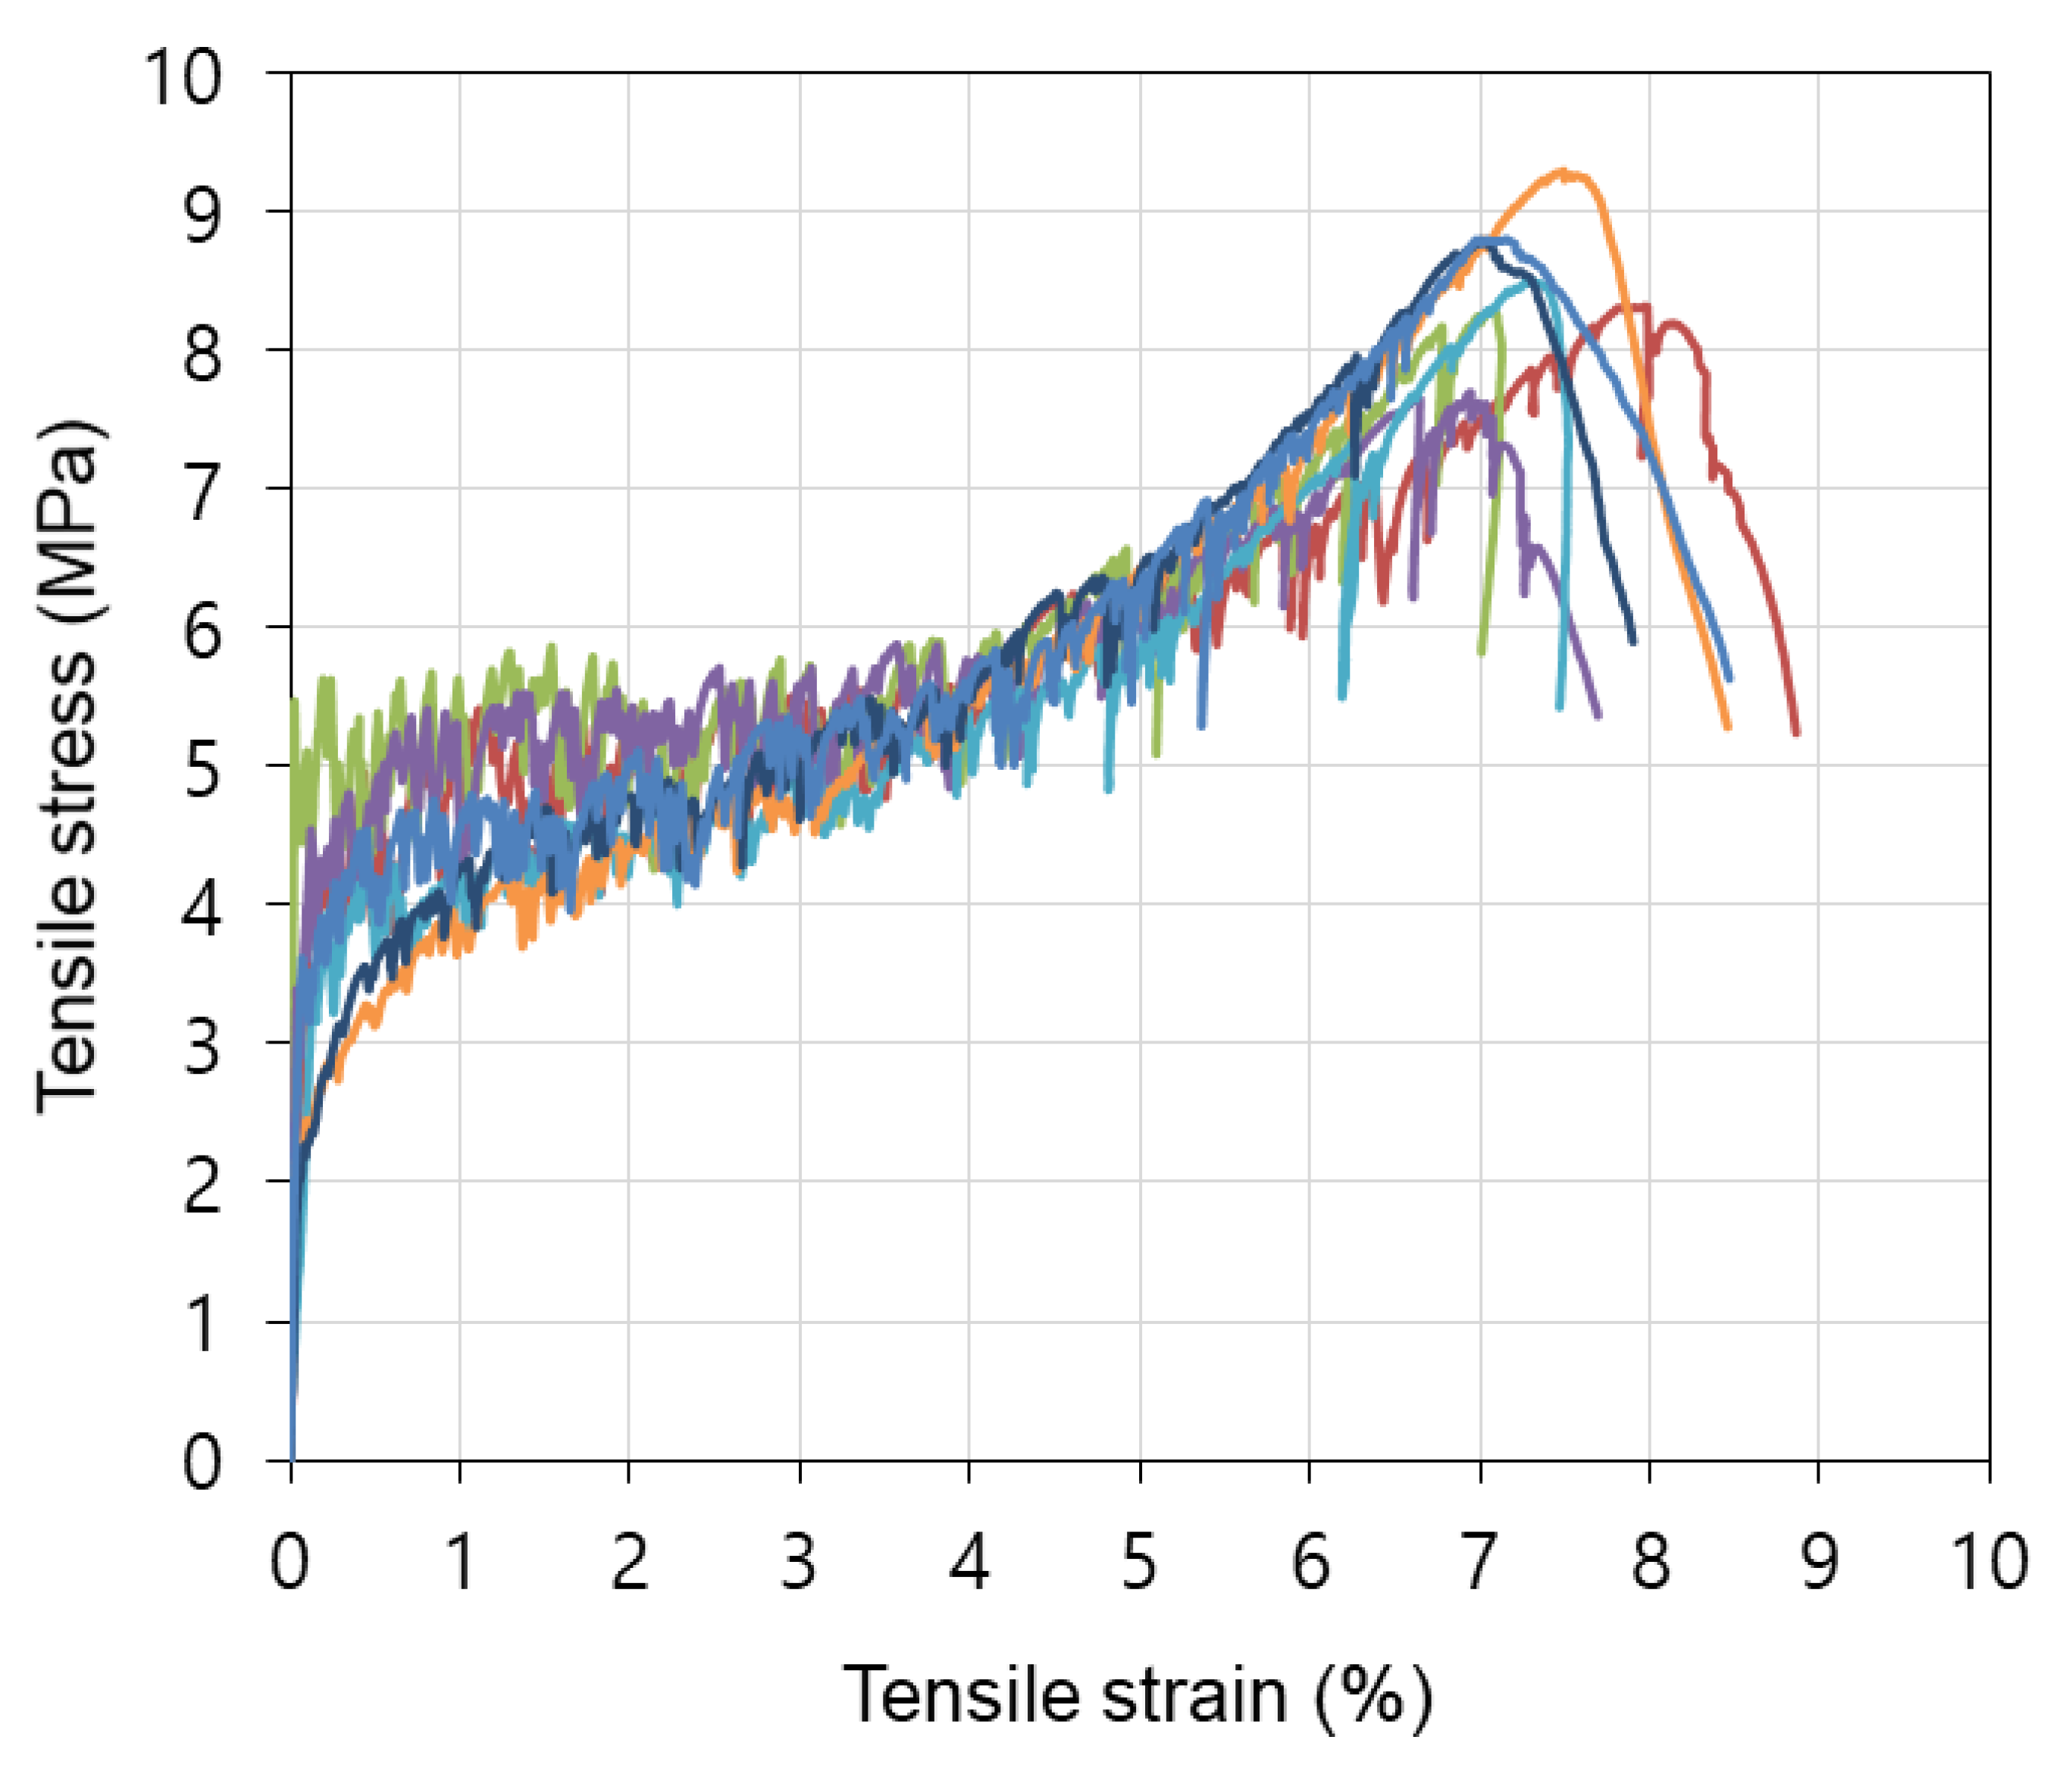
The tensile stress and tensile strain curves of the composite are shown in Figure 4. Strain-hardening behavior, a further increase in stress and strain after first cracking, was clearly observed in all specimens. Because the stresses of the matrix and of existing cracks are released when a new crack occurs, the stress after first cracking fluctuated until it reached maximum stress. The compressive strength and representative values of tensile behavior, i.e., the first cracking strength (), tensile strength (), and tensile ductility of the composite, are listed in Table 3. Note that the first cracking strength implied a proportional limit, i.e., a maximum stress of the mixture that is directly proportional to strain.
The value of of the composite was 3.4 MPa and the ratio of to was 9.3%, similar to that of normal concrete [19]. This demonstrates that the value of of this composite was affected by the strength of the matrix and that the effect of fiber on is not significant. It should be noted that the coefficient of variation of was 27.5%p higher than that of .
The value of of the composite was 8.5 MPa, and the ratio of to was 23%. This ratio is 2.3 times higher than that of normal concrete, whose is approximately 10% of ; also, normally, the value of of normal concrete is identical to . This indicates that the value of of the composite depends on the fiber-bridging behavior. refers to the ratio of to . When the index is greater than 1, multi-cracking occurs. The value of of the composite was 2.5, which means that the composite satisfied the stress condition for strain-hardening and steady-state multiple cracking behavior and is approximately two times higher than the value (=1.3) in the practical design criterion proposed by Kanda and Li [11]. From this analysis, it can be expected that the composite will show high tensile ductility based on multiple cracking.
The tensile ductility was defined as the tensile strain corresponding to the tensile strength. The tensile ductility of the composite was 7.5%, which is approximately seven hundred times higher than that of normal concrete. The high tensile ductility of the composite is due to multiple micro-cracking and controlled crack width. It should be noted that the values of the coefficient of variation of and the tensile ductility were similar to that of .
Toughness represents the comprehensive energy absorption capacity of a composite, encompassing and the tensile ductility. Toughness was calculated using the tensile strength and the area that represents the tensile ductility. The toughness of the composite was 0.44 MPa m/m, 16% higher than that of UHPC, with a compressive strength of 166 MPa [20].
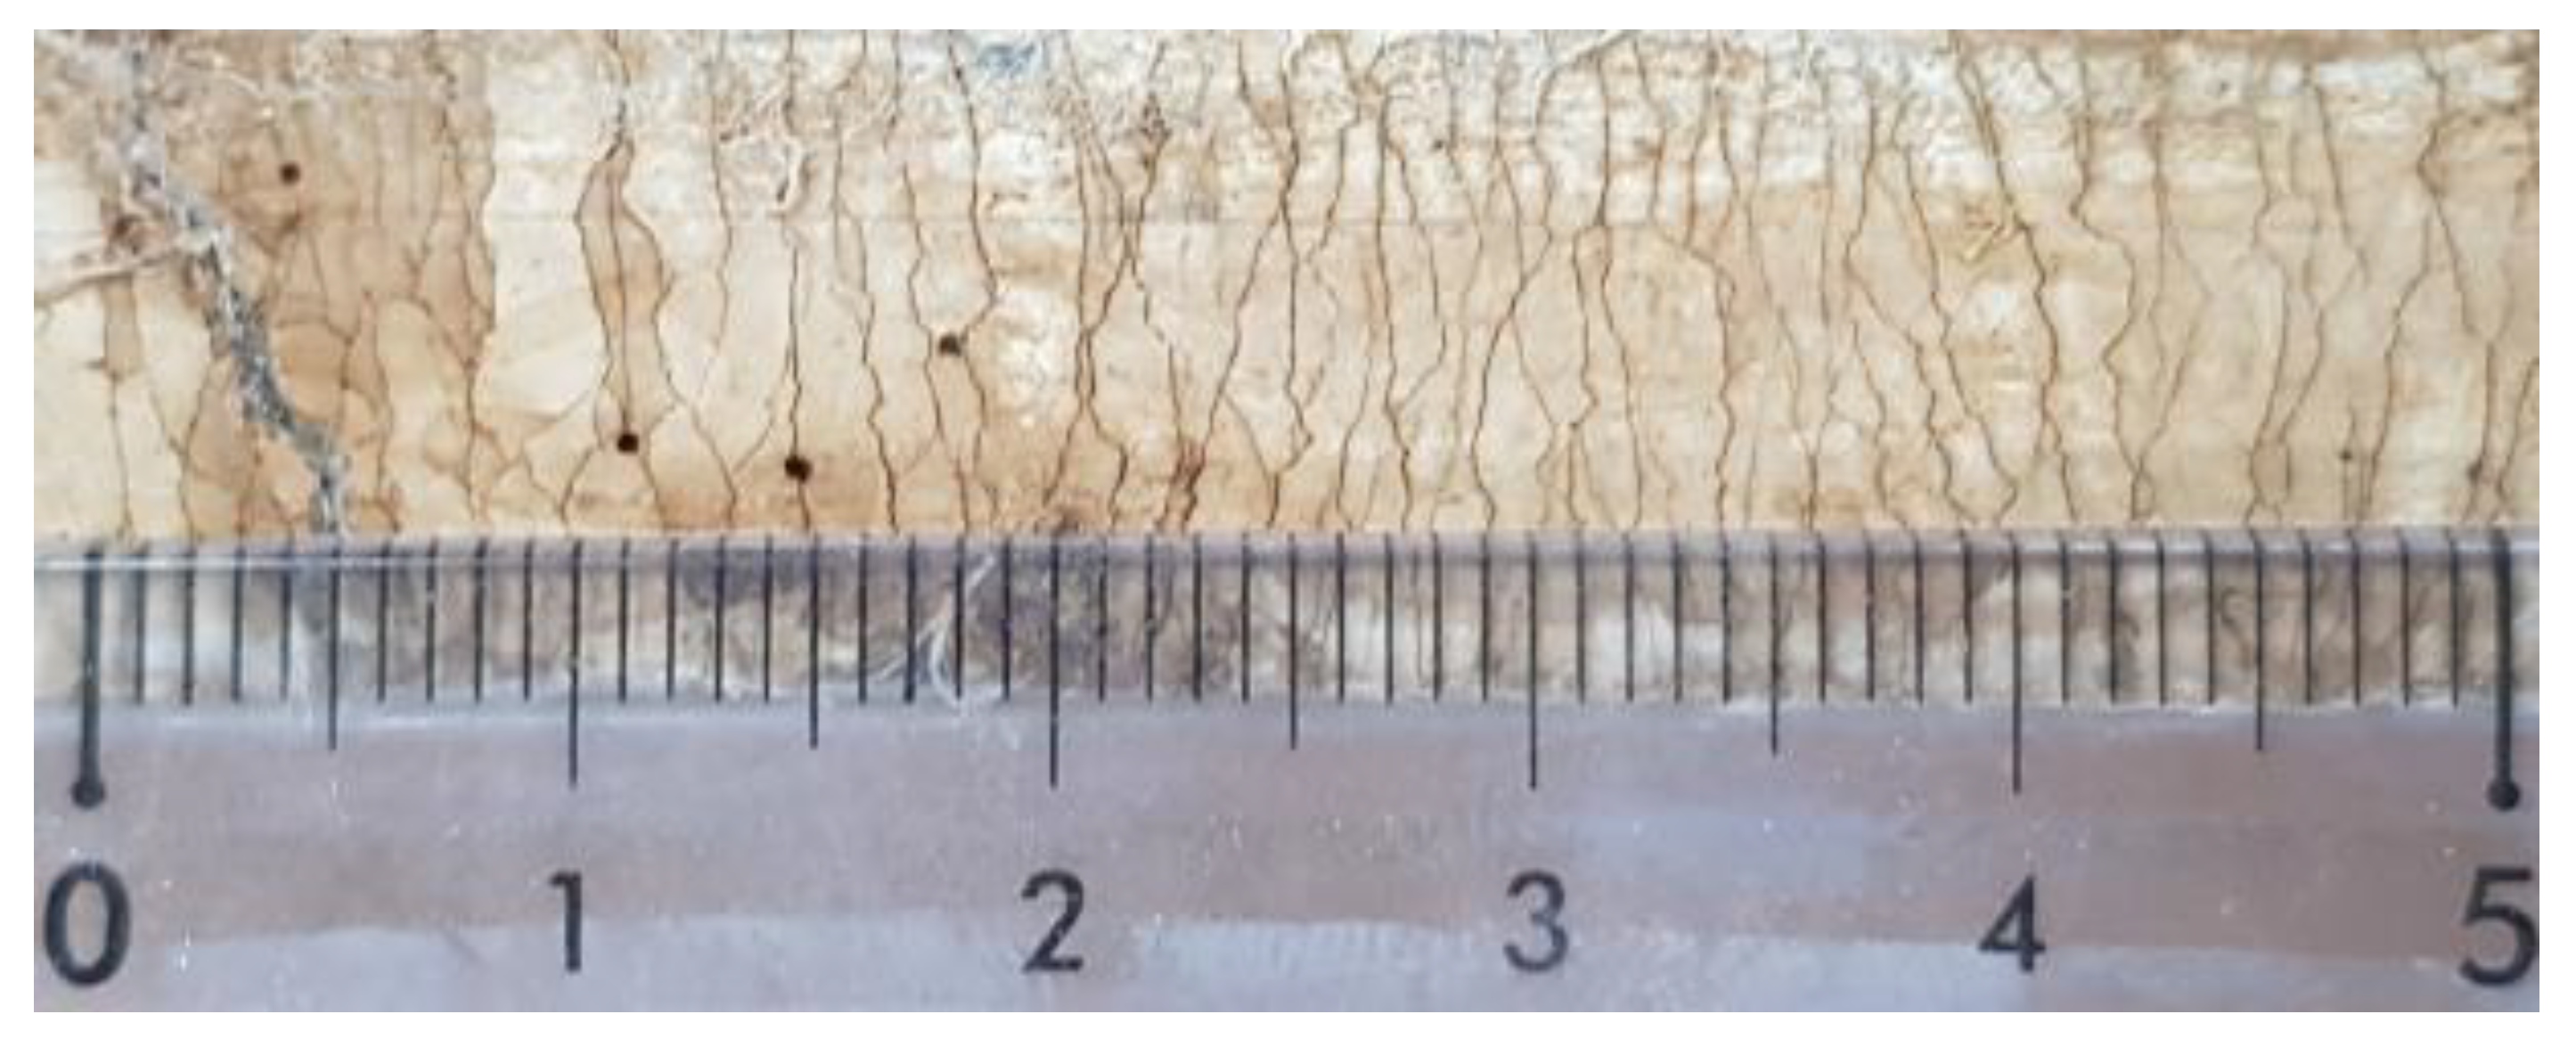
Figure 5 shows the representative cracking pattern of the composite. As expected from the tensile stress and strain curves, the composite showed saturated multiple cracks and controlled crack width. It can be assumed that tensile deformation of the composite was mainly induced by crack creating and growth, which are related to the fiber reinforcement, rather than by the deformation of the matrix itself. That deformation is negligibly small compared to the crack width. Accordingly, the tensile ductility of the composite is determined by the number and width of the cracks. The number of the cracks (), the crack spacing (), and the crack width () of the composite are observed using a magnifying glass and are listed in Table 4. The average within the gauge length was found to be 100, and was 0.8 mm. was calculated by dividing the gauge length by . Therefore, is inversely proportional to . was measured and found to be 59.8 μm. A previous study reported that a value of of about 60 μm did not lead to a change in the water permeability of the composite [21].
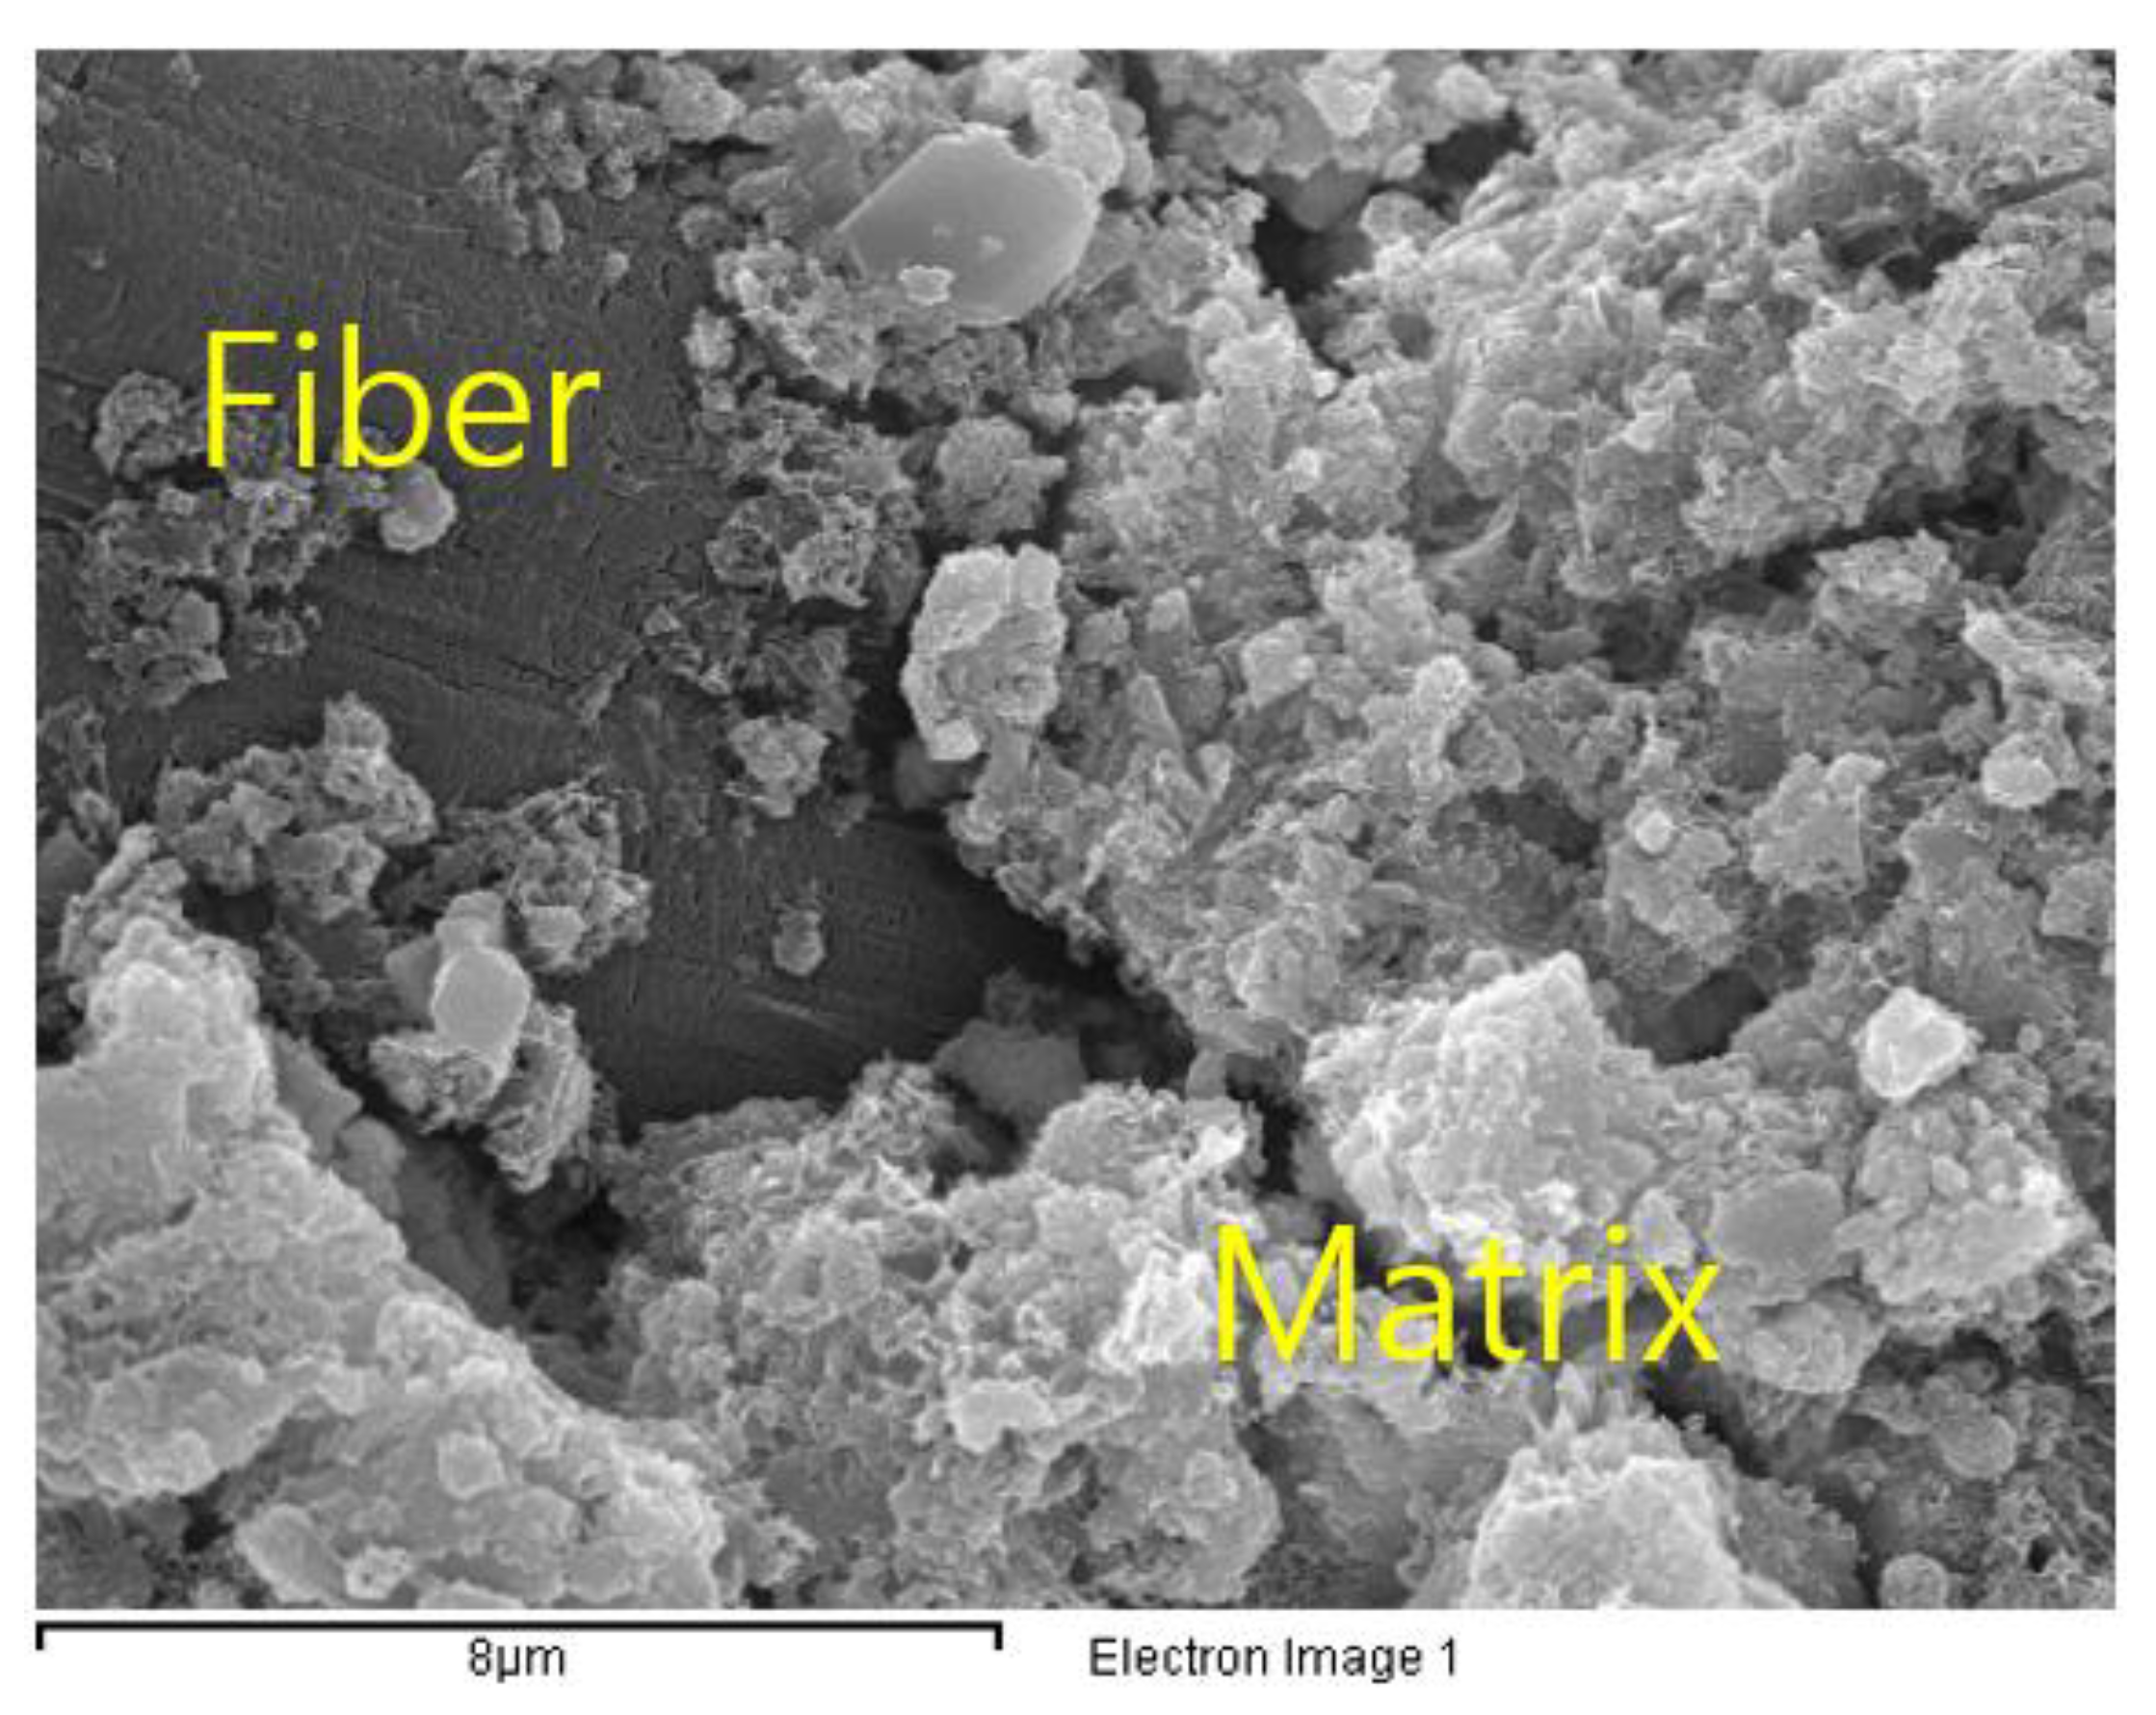
Figure 6 shows SEM images of the composite. The boundary between matrix and fiber can be clearly observed and it seems that the hydration products close to fiber are similar to pure matrix without large defects, which helps to increase the bond strength between matrix and fiber.
3.2. Micromechanical Properties
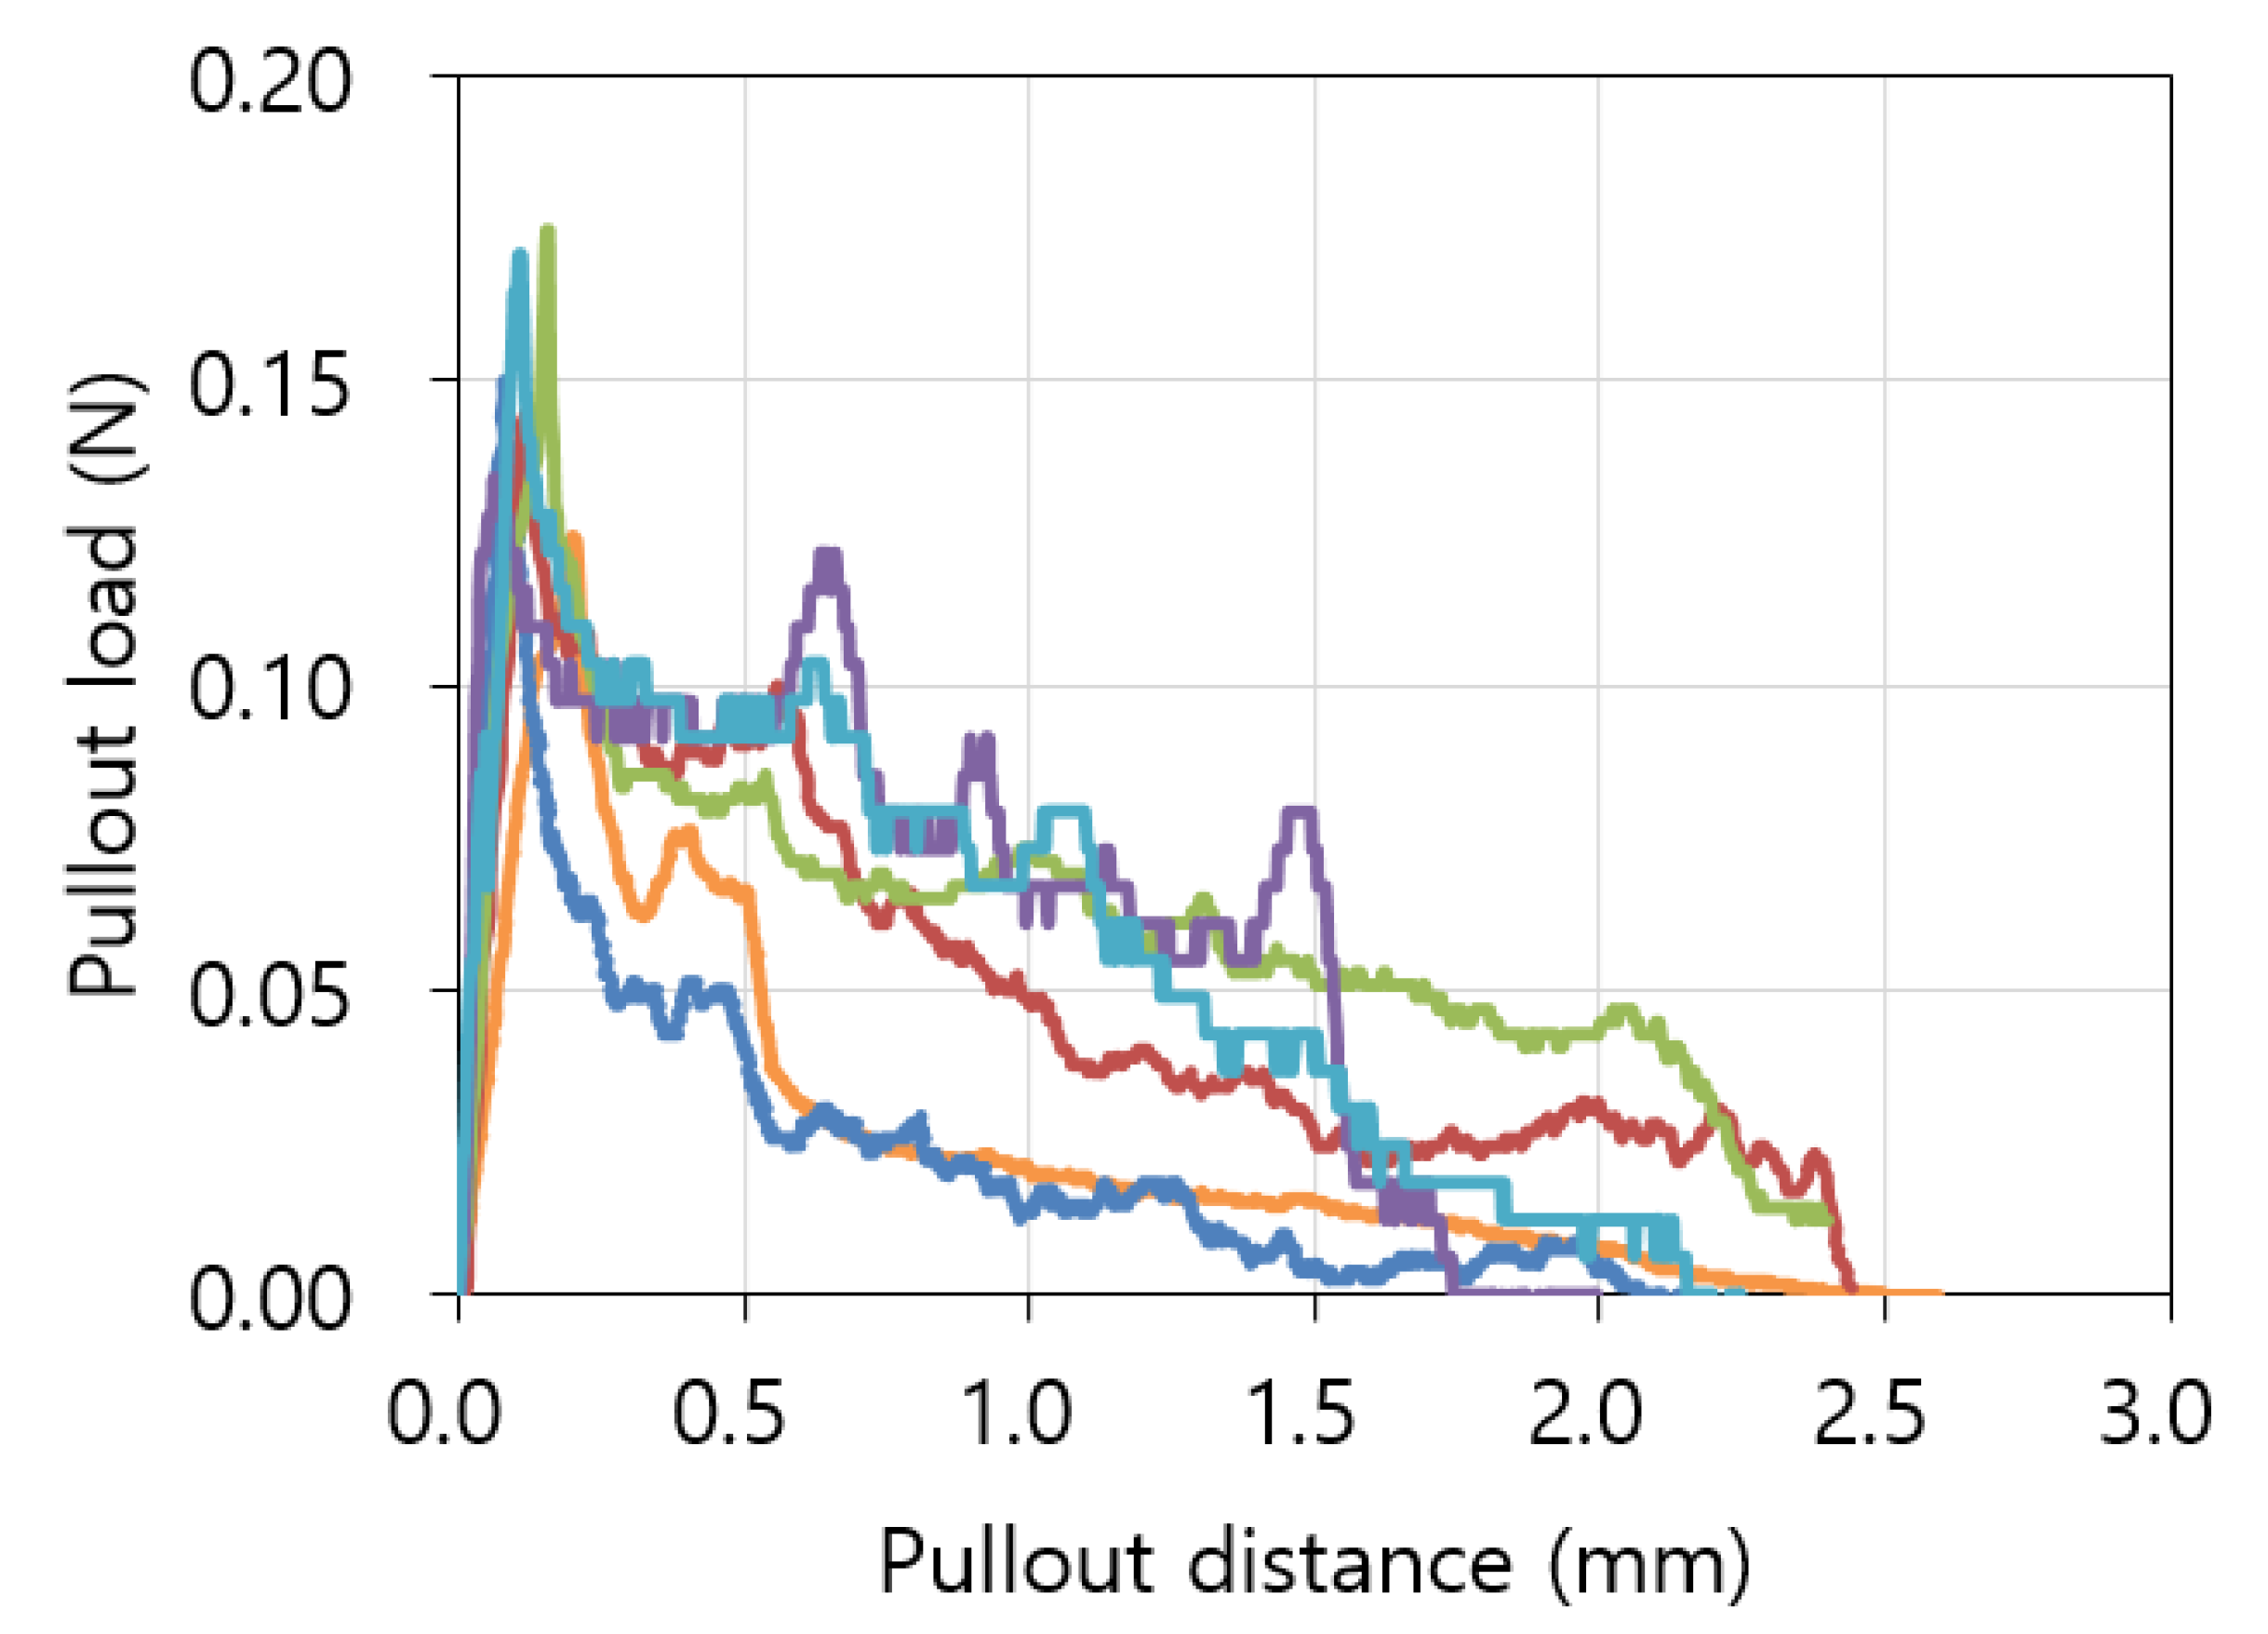
Single fiber pullout load and pullout distance curves of specimens for micromechanical analysis are shown in Figure 7. Single fiber pull-out test results showed that there were two stages. In the initial stage, the load increased with a constant slope until the maximum load was reached; in the next stage, the load gradually decreased. As mentioned above, the proportional (linear) increase in load (in the first stage) was attributable to elongation of the fibers according to their elastic modulus. Meanwhile, the load decreased after exceeding the maximum value because the fibers started to be pulled out. Load drops were observed in all specimens directly after load peak and gradual drops were observed after that. Table 5 lists the micromechanical properties obtained from the matrix fracture toughness and the fiber pullout tests, including the matrix fracture toughness (), and the interfacial properties between the matrix and fiber, i.e., the frictional bond strength (), chemical bond strength (), and strain-hardening coefficient ().
was calculated using Equation (1) [15].
Here, is the load, is the distance between each node, is the specimen thickness, and is the specimen height. in Equation (1) was calculated using Equation (2) below:
Here, is the notch length.
can be calculated with the peak pullout load . When if exceeded, fiber pull-out begins. The frictional bond strength was calculated using Equation (3) [18]:
Here, and are the diameter and embedment length of fibers, respectively.
Using Equation (4) [18], was calculated from the initial slope of the pullout load and pullout distance curves at the point of .
Here, is the variation in fiber pull-out load and is the slip between matrix and fiber.
In the present work, the chemical reaction between PE fiber and the matrix was not considered. Instead, the slip softening behavior in the fiber pullout test results was reflected by the strain-hardening coefficient, which was a constant value of zero when the pullout load decreases linearly as the pullout distance increases. The strain-hardening coefficient had a negative value because slip softening behavior was observed in the specimens.
3.3. Micromechanical Analysis
In order to analyze the mechanism of the strain-hardening and highly ductile behavior of the composite, and were evaluated based on the micromechanical properties of the materials and by fiber-bridging analysis.
A theoretical fiber-bridging curve of the composite was obtained based on fiber-bridging constitutive law, expressed in the form of Equation (5) [22]:
Here, is the fiber volume fraction and ) is the pull-out load of each fiber with respect to its inclined angle (), embedment length (), and crack opening displacement (. is the probability density function with respect to the inclined angle of the fibers.
Additional information for the analysis, such as spalling coefficient, fiber strength reduction factor, and snubbing coefficient, were adopted from the literature; those values are 500, 0.475, and 0.3, respectively [23,24,25].
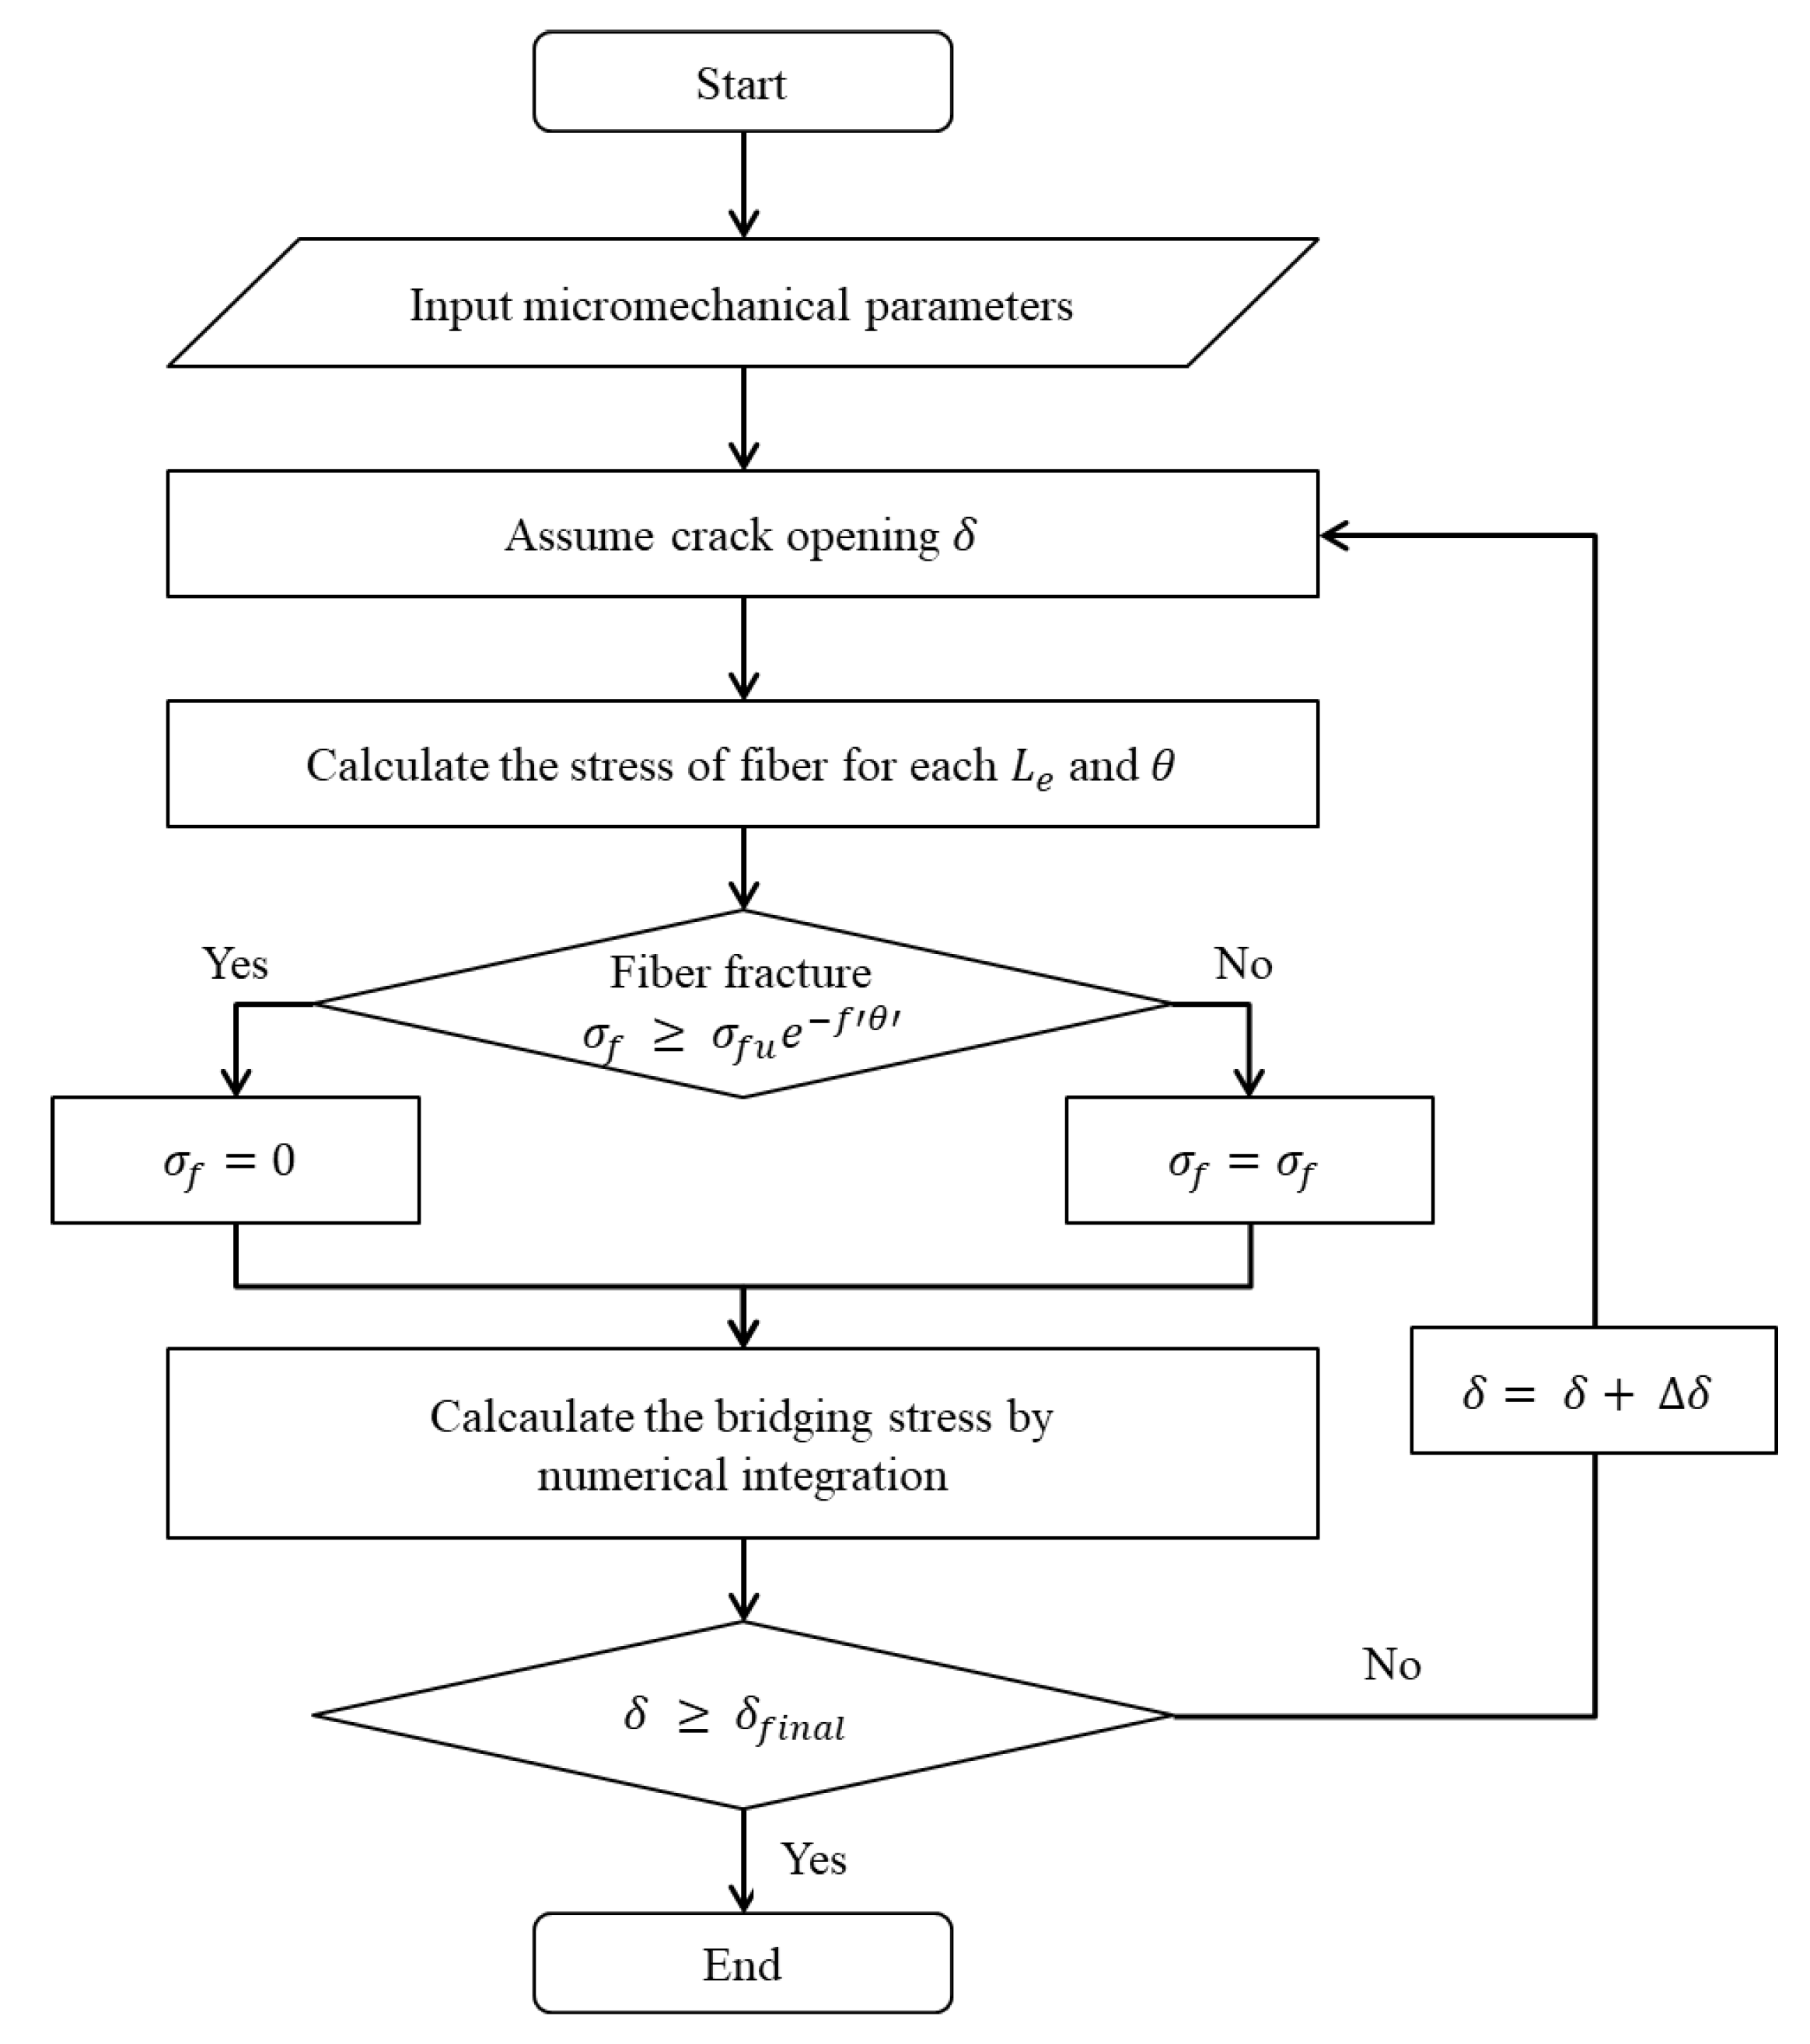
Figure 8 shows the numerical procedure to obtain the fiber-bridging curve. First, crack opening displacement is assumed. Following that, for a given crack opening displacement, the stress induced on the fiber is determined with respect to the embedment length and inclined angle of the fibers. Next, based on the calculated level of induced stress, it is determined whether the fibers have been fractured or not. For a given crack opening displacement, the pullout loads for all fibers in the crack are numerically integrated. This procedure is repeated until the assumed fiber opening displacement reaches the final crack opening displacement.
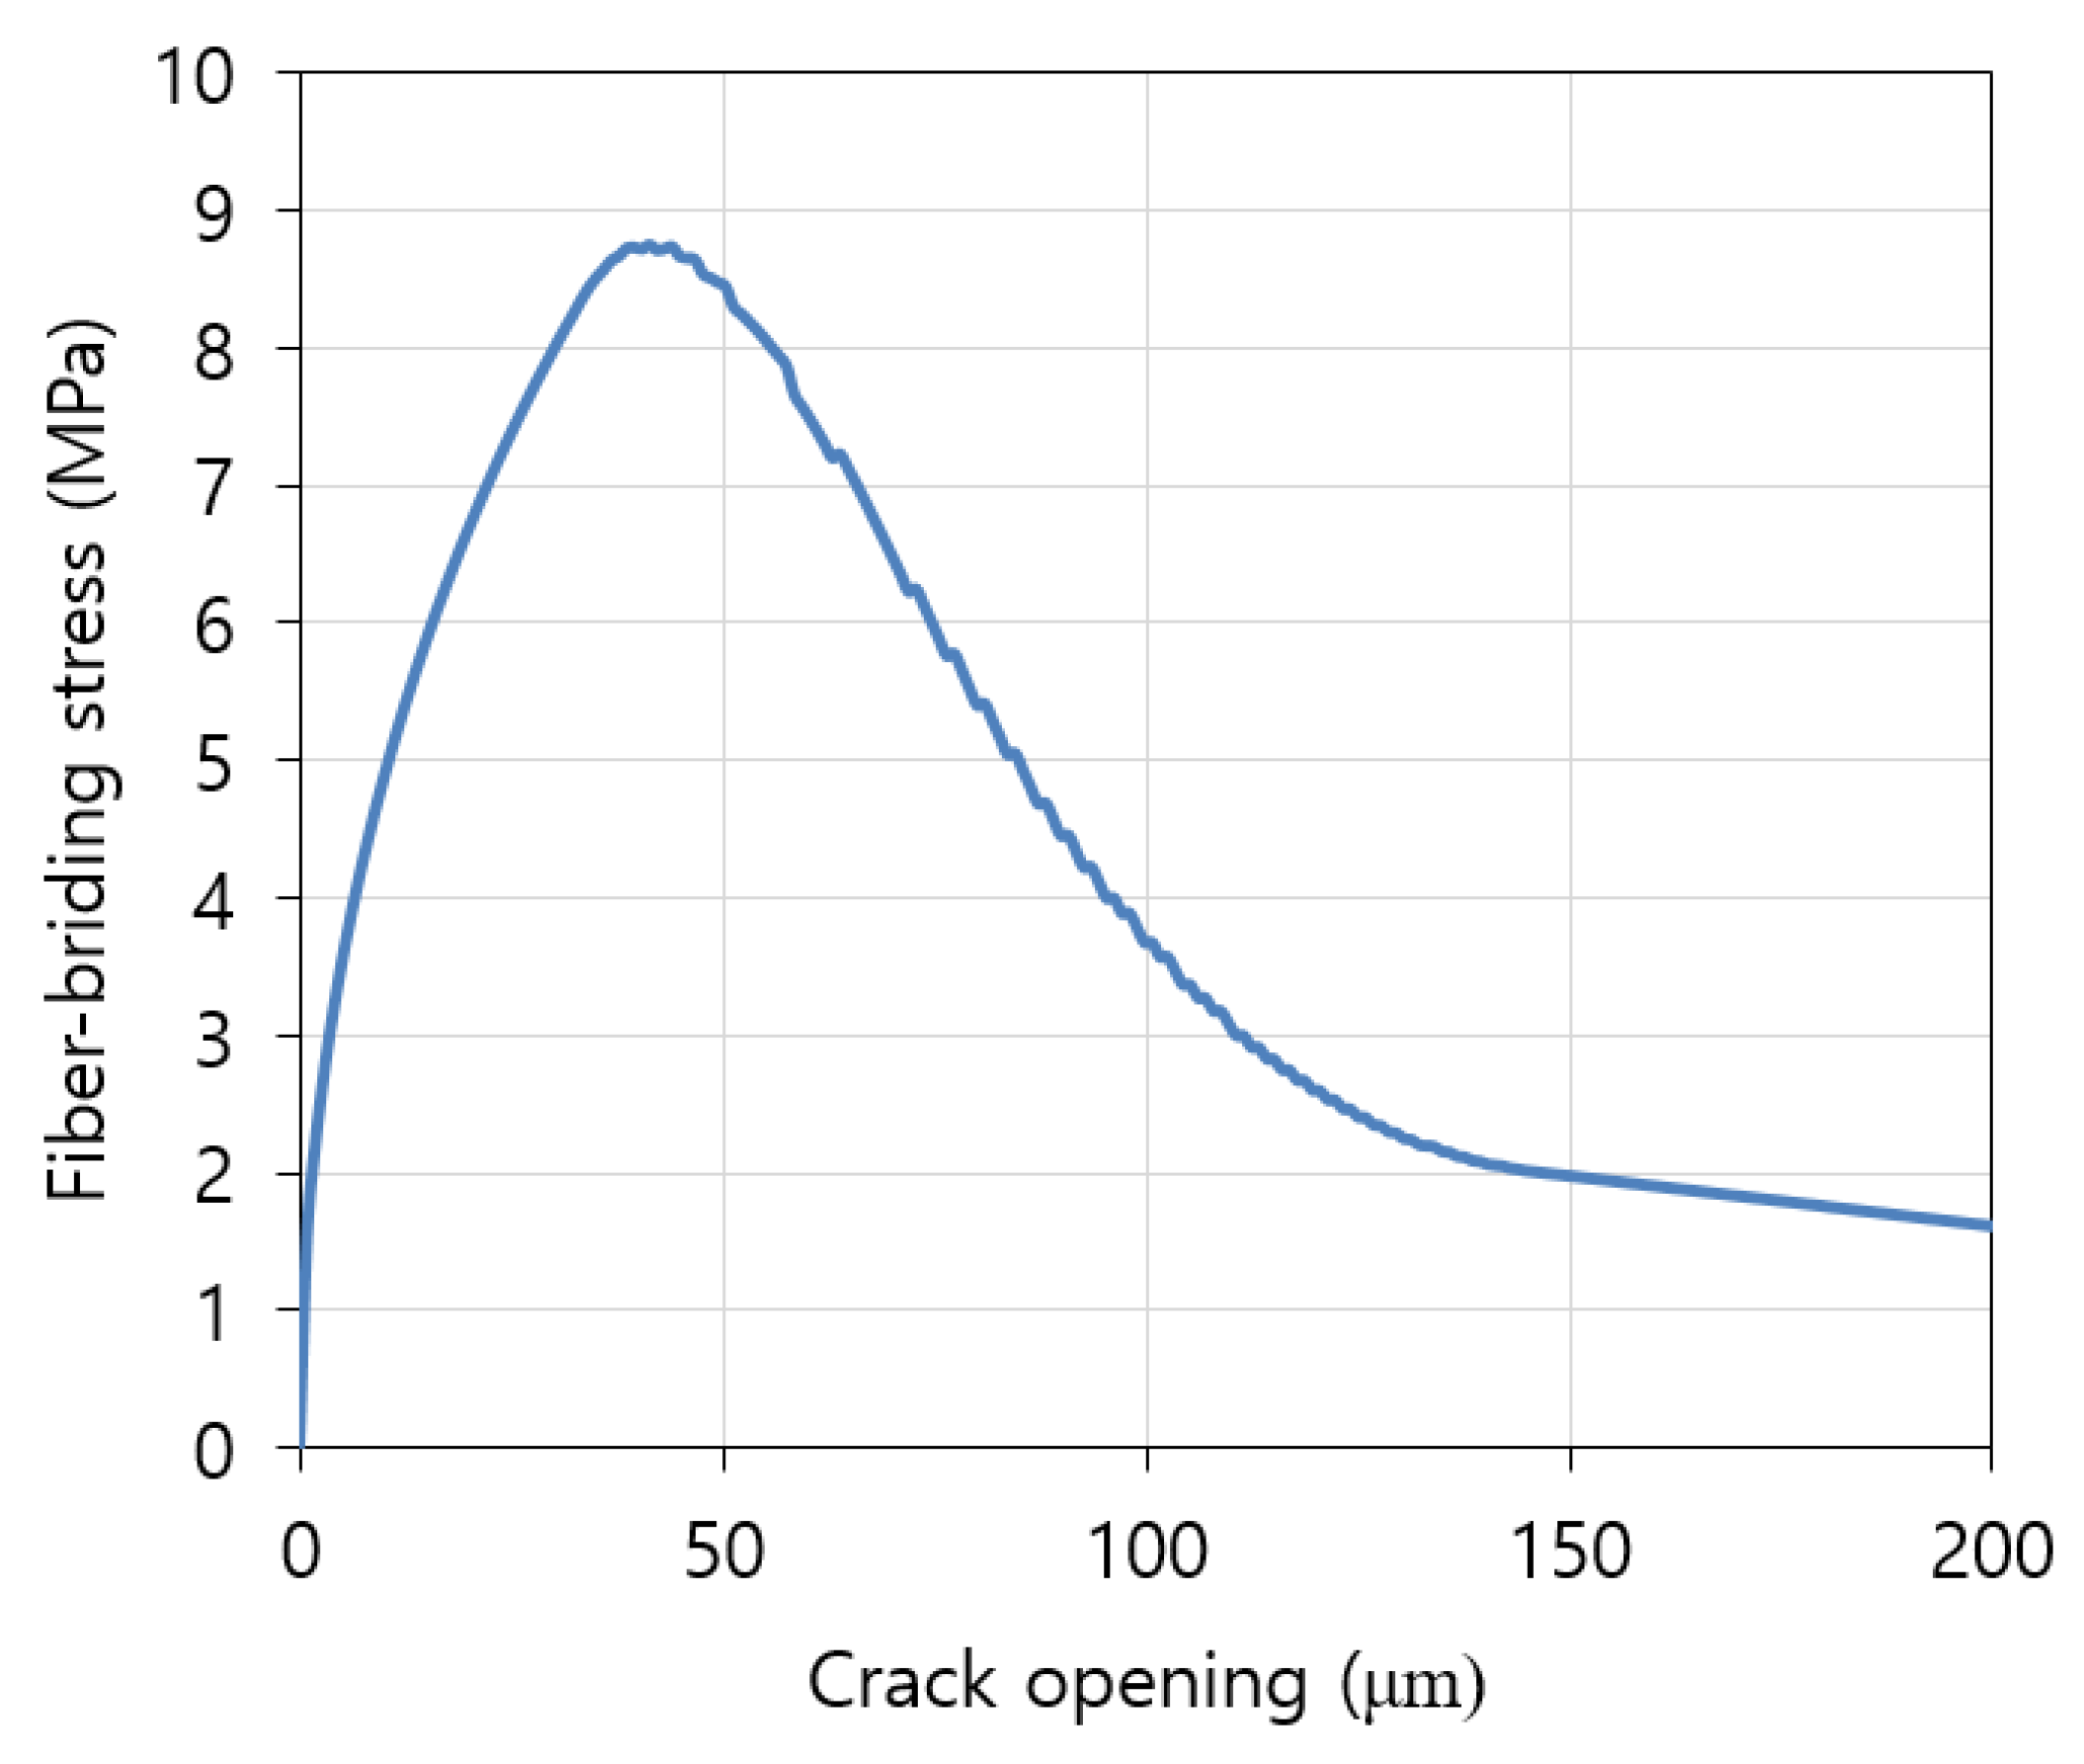
The theoretical fiber-bridging curve of the composite is shown in Figure 9. Given that PE fiber is hydrophobic, there was no fiber-bridging stress observed in the initial part of the curve. The maximum fiber-bridging stress was 8.7 MPa and corresponding crack opening was 44.1 μm. The complementary energy () was 100 J/m2.
When the composite is homogenous and isotropic, the maximum fiber-bridging stress is identical to the value of of the composite. Otherwise, because the fiber-bridging capacity depends on matrix properties and fiber distribution, it is generally observed that the tensile strength is lower than the theoretical maximum fiber-bridging stress. The specimen fractured at the section with the lowest fiber-bridging capacity. Details of a comparison of and between the micromechanical analysis and the experimental results are provided in Table 6. The maximum fiber-bridging stress was only 2.3% higher than the value of of the composite. Although a relatively high difference was observed between analytical and experimental results for crack width, it seems that the theoretical fiber-bridging curve simulate the tensile behavior of the composite well, especially considering the variation of matrix properties and the fiber distribution. This implies that the fiber-bridging analysis performed in this study is appropriate to investigate the fundamental mechanisms of the strain-hardening and highly ductile behavior of the composite.
The matrix fracture energy (), which is the energy for crack propagation of the matrix at the crack tip, was calculated using Equation (1) [26].
Here, is the matrix fracture toughness, defined in the previous section. is the elastic modulus of the matrix and was found to be 10.3 GPa. It was obtained in the linear elastic region of the tensile stress and tensile strain curves.
The values of properties on the energy are listed in Table 7. The values of of the composite was 8.9, which means that the composite satisfied the energy condition for strain-hardening and steady-state multiple cracking behavior; this value is approximately three times higher than the value (=2.7) in practical design criterion proposed by Kanda and Li [11]. From the micromechanical investigation and fiber-bridging analysis, it can be concluded that the composite in this study satisfied both strength and energy conditions for strain-hardening and steady-state multiple cracking behavior. Furthermore, the excellent tensile properties of the composite are explained by micromechanical principles and steady-state cracking theory.
4. Conclusions
This study investigated the mechanical properties of a strain-hardening slag-based composite with high ductility of up to 7.5% and also the micromechanical characteristics of the composite. The fiber-bridging behavior of the composite was theoretically analyzed to investigate the mechanism of strain-hardening and highly ductile behavior. The following conclusions have been drawn:
- (1)
- The PE fiber-reinforced slag-based composite with a moderate compressive strength of 36.8 MPa showed excellent tensile performance. Although the first cracking strength (3.4 MPa) was similar to that of normal concrete with a similar range of compressive strength, the tensile strength of the composite after strain hardening reached 8.5 MPa. Composite also showed also excellent tensile ductility of up to 7.5%. It was found that the values of coefficient of variation of tensile strength and tensile ductility were similar to that of the compressive strength. The composite also showed saturated cracking patterns. The crack width and crack spacing of the composite were 59.8 μm and 0.8 mm, respectively.
- (2)
- From single-fiber pullout test, the frictional bond strength between matrix and fiber was found to be 1.49 MPa. The slip softening behavior of the fiber pullout test results was considered by the strain-hardening coefficient. Therefore, the strain-hardening coefficient had a negative value because slip softening behavior was observed.
- (3)
- The maximum fiber-bridging stress was just 2.3% higher than the tensile strength of the composite, a negligible gap. It seems that the theoretical fiber-bridging curve simulate the tensile behavior of the composite well, especially considering the variation of the matrix properties and the fiber distribution. This implies that the fiber-bridging analysis performed in this study is appropriate to investigate the fundamental mechanism of the strain-hardening and highly ductile behavior of the composite.
- (4)
- The stress performance index of the composite was 2.5, which is approximately two times higher than the value (=1.3) in the practical design criterion. The energy performance index of the composite was 8.9, which is approximately three times higher than the value (=2.7) in the practical design criterion. Both indices explain the strain-hardening and steady-state multiple cracking behavior of the composite and supports the excellent tensile behavior of the composite.
Author Contributions
Conceptualization, J.-I.C. and B.Y.L.; methodology, J.-I.C. and B.Y.L.; software, J.-I.C. and B.Y.L.; validation, H.-K.K. and B.Y.L.; formal analysis, J.-I.C.; investigation, J.-I.C.; writing—original draft preparation, J.-I.C. and B.Y.L.; writing—review and editing, H.-K.K. and B.Y.L.; visualization, J.-I.C.; supervision, H.-K.K. and B.Y.L.; funding acquisition, B.Y.L. All authors have read and agreed to the published version of the manuscript.
Funding
This work was supported by the National Research Foundation of Korea (NRF) grant funded by the Korea government (MSIT) (No. 2019R1A2C4069794).
Conflicts of Interest
The authors declare no conflict of interest.
References
- Malhotra, V. Introduction: Sustainable development and concrete technology. Concr. Int. 2002, 24, 22. [Google Scholar]
- Oakes, L.; Magee, B.; McIlhagger, A.; McCartney, M. Strength prediction and mix design procedures for geopolymer and alkali-activated cement mortars comprising a wide range of environmentally responsible binder systems. J. Struct. Integr. Maint. 2019, 4, 135–143. [Google Scholar] [CrossRef]
- Lee, B.Y.; Cho, C.G.; Lim, H.J.; Song, J.K.; Yang, K.H.; Li, V.C. Strain hardening fiber reinforced alkali-activated mortar—A feasibility study. Constr. Build. Mater. 2012, 37, 15–20. [Google Scholar] [CrossRef]
- Ohno, M.; Li, V.C. A feasibility study of strain hardening fiber reinforced fly ash-based geopolymer composites. Constr. Build. Mater. 2014, 57, 163–168. [Google Scholar] [CrossRef]
- Choi, S.J.; Choi, J.I.; Song, J.K.; Lee, B.Y. Rheological and mechanical properties of fiber-reinforced alkali-activated composite. Constr. Build. Mater. 2015, 96, 112–118. [Google Scholar] [CrossRef]
- Nematollahi, B.; Sanjayan, J.; Ahmed Shaikh, F.U. Tensile Strain Hardening Behavior of PVA Fiber-Reinforced Engineered Geopolymer Composite. ASCE J. Mater. Civ. Eng. 2015, 27, 04015001. [Google Scholar] [CrossRef]
- Nematollahi, B.; Sanjayan, J.; Shaikh, F. Strain Hardening Behavior of Engineered Geopolymer Composites: Effects of the Activator Combination. J. Aust. Ceram. Soc. Vol. 2015, 51, 54–60. [Google Scholar]
- Choi, J.I.; Lee, B.Y.; Ranade, R.; Li, V.C.; Lee, Y. Ultra-high-ductile behavior of a polyethylene fiber-reinforced alkali-activated slag-based composite. Cem. Concr. Compos. 2016, 70, 153–158. [Google Scholar] [CrossRef]
- Lee, Y.; Choi, J.I.; Kim, H.K.; Lee, B.Y. Effects of a defoamer on the compressive strength and tensile behavior of alkali-activated slag-based cementless composite reinforced by polyethylene fiber. Compos. Struct. 2017, 172, 166–172. [Google Scholar] [CrossRef]
- Choi, J.I.; Song, K.I.; Song, J.K.; Lee, B.Y. Composite properties of high-strength polyethylene fiber-reinforced cement and cementless composites. Compos. Struct. 2016, 138, 116–121. [Google Scholar] [CrossRef]
- Kanda, T.; Li, V.C. Practical design criteria for saturated pseudo strain hardening behavior in ECC. J. Adv. Concr. Technol. 2006, 4, 59–72. [Google Scholar] [CrossRef] [Green Version]
- Li, V.C.; Leung, C.K. Steady-state and multiple cracking of short random fiber composites. J. Eng. Mech. 1992, 118, 2246–2264. [Google Scholar] [CrossRef] [Green Version]
- Marshall, D.; Cox, B. A J-integral method for calculating steady-state matrix cracking stresses in composites. Mech. Mater. 1988, 7, 127–133. [Google Scholar] [CrossRef]
- Li, M.; Li, V.C. Rheology, fiber dispersion, and robust properties of Engineered Cementitious Composites. Mater. Struct. 2013, 46, 405–420. [Google Scholar] [CrossRef] [Green Version]
- ASTM. Standard Test Method for Linear-Elastic Plane-Strain Fracture Toughness KIc of Metallic Materials; American Society for Testing and Materials: West Conshohocken, PA, USA; ASTM International West Conshohocken: West Conshohocken, PA, USA, 2012. [Google Scholar]
- ASTM. Standard test method for compressive strength of hydraulic cement mortars (Using 2-in. or [50-mm] cube specimens). In ASTM C109/C109M-07; American Society for Testing and Materials: West Conshohocken, PA, USA; ASTM International West Conshohocken: West Conshohocken, PA, USA, 2007. [Google Scholar]
- JSCE. Recommendations for Design and Construction of High Performance Fiber Reinforced Cement Composites with Multiple Fine Cracks (HPFRCC); Concrete Engineering Series; Japan Society of Civil Engineers: Tokyo, Japan, 2008. [Google Scholar]
- Redon, C.; Li, V.C.; Wu, C.; Hoshiro, H.; Saito, T.; Ogawa, A. Measuring and modifying interface properties of PVA fibers in ECC matrix. J. Mater. Civ. Eng. 2001, 13, 399–406. [Google Scholar] [CrossRef]
- Mindess, S.; Young, J.F.; Darwin, D. Concrete, 2nd ed.; Pearson Education, Inc.: Upper Saddle River, NJ, USA, 2002; p. 644. [Google Scholar]
- Ranade, R.; Li, V.C.; Stults, M.D.; Heard, W.F.; Rushing, T.S. Composite properties of high-strength, high-ductility concrete. ACI Mater. J. 2013, 110, 413–422. [Google Scholar]
- Lepech, M.D.; Li, V.C. Water permeability of engineered cementitious composites. Cem. Concr. Compos. 2009, 31, 744–753. [Google Scholar] [CrossRef]
- Lee, B.Y.; Lee, Y.; Kim, J.K.; Kim, Y.Y. Micromechanics-Based Fiber-Bridging Analysis of Strain-Hardening Cementitious Composite Accounting for Fiber Distribution. CMES Comput. Modeling Eng. Sci. 2010, 61, 111–132. [Google Scholar]
- Choi, J.-I.; Lee, B. Bonding Properties of Basalt Fiber and Strength Reduction According to Fiber Orientation. Materials 2015, 8, 6719–6727. [Google Scholar] [CrossRef] [Green Version]
- Wu, C. Micromechanical Tailoring of PVA-ECC for Structural Applications. Ph.D Thesis, University of Michigan, Ann Arbor, MI, USA, 2001. [Google Scholar]
- Yang, E.H.; Wang, S.; Yang, Y.; Li, V.C. Fiber-bridging constitutive law of engineered cementitious composites. J. Adv. Concr. Technol. 2008, 6, 181–193. [Google Scholar] [CrossRef] [Green Version]
- Li, V.C. Tailoring ECC for special attributes: A review. Int. J. Concr. Struct. Mater. 2012, 6, 135–144. [Google Scholar] [CrossRef] [Green Version]
Figure 1.
Uniaxial tension test: (a) dimensions of specimen and (b) test setup.

Figure 2.
Dimension of specimen and test setup for fracture toughness test.

Figure 3.
Fiber pullout test: (a) dimensions of specimen and (b) test setup.

Figure 4.
Tensile stress and tensile strain curves of specimens (different color of lines indicates different samples with identical mixture.).
Figure 4.
Tensile stress and tensile strain curves of specimens (different color of lines indicates different samples with identical mixture.).

Figure 5.
Cracking pattern of uniaxial tension test specimen (unit of number: cm).

Figure 6.
SEM images of composite.

Figure 7.
Single fiber pullout load and pullout distance curves of specimens (Different colors of lines indicate different samples with identical mixture.).
Figure 7.
Single fiber pullout load and pullout distance curves of specimens (Different colors of lines indicate different samples with identical mixture.).

Figure 8.
Numerical procedure for obtaining fiber-bridging curve.

Figure 9.
Theoretical fiber-bridging curve of composite.


Table 1.
Mixture proportion (weight ratios of binder).
| Binder | Water | SP | VMA | Anti-Foam | Fiber (Vol.%) | ||
|---|---|---|---|---|---|---|---|
| GS | Ca(OH)2 | Na2SO4 | |||||
| 0.895 | 0.075 | 0.030 | 0.30 | 0.005 | 0.002 | 0.001 | 1.50 |
Table 2.
Chemical compositions of GS.
| SiO2 | Al2O3 | Fe2O3 | CaO | MgO | SO3 | TiO2 | K2O | etc. |
|---|---|---|---|---|---|---|---|---|
| 30.6 | 13.8 | 0.5 | 40.4 | 8.0 | 4.0 | 0.9 | 0.5 | 1.3 |
Table 3.
Composite properties.
| Properties | Tensile Ductility (%) | |||
|---|---|---|---|---|
| Values | 36.8 (±1.7) | 3.4 (±1.1) | 8.5 (±0.5) | 7.5 (±0.4) |
| Coefficient of variation (%) | 4.5 | 32 | 5.5 | 5.0 |
Table 4.
Cracking patterns.
| Deformation in Gauge Length (mm) | |||
|---|---|---|---|
| 100 (±7) | 0.8 (±0.1) | 6.0 (±0.3) | 59.8 (±3.3) |
Table 5.
Matrix fracture toughness and interfacial properties.
| 0.34 | 1.49 (±0.11) | 0 | −0.06 (±0.03) |
Table 6.
Comparison between micromechanical analysis and experimental results.
| Micromechanical Analysis Results | Experimental Results | |
|---|---|---|
| (MPa) | 8.7 | 8.5 |
| (μm) | 44.1 | 58.9 |
Table 7.
Energy condition.
| 11.3 | 100 | 8.9 |
© 2020 by the authors. Licensee MDPI, Basel, Switzerland. This article is an open access article distributed under the terms and conditions of the Creative Commons Attribution (CC BY) license (http://creativecommons.org/licenses/by/4.0/).
Share and Cite
MDPI and ACS Style
Choi, J.-I.; Kim, H.-K.; Lee, B.Y. Mechanical and Fiber-Bridging Behavior of Slag-Based Composite with High Tensile Ductility. Appl. Sci. 2020, 10, 4300. https://doi.org/10.3390/app10124300
AMA Style
Choi J-I, Kim H-K, Lee BY. Mechanical and Fiber-Bridging Behavior of Slag-Based Composite with High Tensile Ductility. Applied Sciences. 2020; 10(12):4300. https://doi.org/10.3390/app10124300
Chicago/Turabian StyleChoi, Jeong-Il, Hyeong-Ki Kim, and Bang Yeon Lee. 2020. "Mechanical and Fiber-Bridging Behavior of Slag-Based Composite with High Tensile Ductility" Applied Sciences 10, no. 12: 4300. https://doi.org/10.3390/app10124300
Note that from the first issue of 2016, this journal uses article numbers instead of page numbers. See further details here.