Study on New Bolted T-Stub Connection with Inserted Plates under Axial and Cyclic Loads


College of Civil Engineering, Fuzhou University, Fuzhou 350108, China
*
Author to whom correspondence should be addressed.
Appl. Sci. 2020, 10(7), 2631; https://doi.org/10.3390/app10072631
Submission received: 16 March 2020
/
Revised: 6 April 2020
/
Accepted: 8 April 2020
/
Published: 10 April 2020
(This article belongs to the Special Issue Mechanics of Structural Joints)
Abstract
:The bolted T-stub connection joining beam with column is being widely applied. To enhance the energy dissipation capacity of conventional T-stub connections, two rectangular plates are proposed to be inserted between the T-stub and column, so that the T-stub flange can yield both under tensile and compressive loads. This study put forward a mechanical model of a new T-stub connection with inserted plates and investigated important factors that could affect its mechanical behavior through experimental tests. Thirty specimens were designed with different configurations that differed according to the existence or absence of inserted plates, the fabrication method and the width of inserted plates. These configurations were tested under axial and cyclic loading conditions, and results showed that the proposal aiming to improve the energy dissipation capacity was feasible. The mechanical model presented coincided with the test observation and data. The advent of two inserted plates elevated the load bearing capacity, stiffness and ductility of connections under compression, whereas in tension the properties were not substantially enhanced. The welded T-stub connections outperformed those cut from standard section steel. The energy dissipated by connections with inserted plates was about 150% of that by traditional connections without inserted plates. Only within a reasonable range can the increment of plate width promote the energy dissipation capacity of T-stub connections. The optimum width of plates in terms of energy consumption accounted for around 31% of the overall width of connections.
1. Introduction
Beam-to-column joints are critical to ensuring that beams and columns work together to assemble whole building structures while resisting external loads. The early popular type of steel beam-to-column connection was the welded flange and bolted web, which was deemed capable of providing enough plastic rotational capacity for most seismic applications. However, during the Northridge (1994) and Kobe (1995) earthquakes [1,2], a number of steel moment-frame buildings experienced unexpected brittle fractures with these types of joints, rather than showing desirable performances.
Following investigations mostly focused on understanding the causes of damage to beam-to-column connections, improvements have been suggested for those connections. The main measures to ameliorate traditional beam-to-column connections are as follows: reducing beam sections [3,4,5], augmenting welding details of joints [6,7,8], strengthening connection parts [9,10,11], completely using bolted connections [12,13] and welding the web of the beam to the column [6,8,14,15].
The design principle of those improved beam-to-column joints is either to strengthen the end of the beam or to weaken the beam section, so that the location of a plastic hinge on the beam can be a certain distance from the column during an earthquake, which deepens the seismic understanding of strong joints and weak components. However, in these improved connections, it is the frame beams that are supposed to provide plastic deformation. As the main structures, once the beams are damaged, retrofitting will become quite tough.
In order to make the structure return to service after an earthquake, new connection configurations have also been proposed based on the passive control concept [16]. In these joints, the dissipative zones are constituted by replaceable damping devices located at the beam ends, to prevent the plastic engagement of other components and then to achieve the ambitious goal of building frames structures that are free from damage. The stable hysteretic performance of beam-column joints with U-shaped metal energy dissipating elements at the bottom beam flange has been proven in literature [17], but the U-type dissipater could only be fit in the weak axis direction of the connection. Similarly, the beam-column joint with a slit energy dissipater was able to take the upper flange of the beam as the rotation center and successfully concentrate the plastic deformation on the lower dissipater [18]; however, the large volume of the slit energy dissipater will inevitably take occupancy of the available space. Studies working on the integration parameters or optimization of components themselves have also been performed. Research [19] has proposed an hourglass shape for T-stub flange to elevate the energy-dissipation capacity of classical rectangular T-stubs. A variety of geometric dimensions and material types were attempted in [20] to explore the optimal energy dissipation capacity and deformation features of T-stub connections.
Solutions for friction dampening have begun to emerge as well. One study [21] proposed a strategy of inserting two friction pads made from metallic or rubber materials between the upper/lower T-stub stem and beam flange based on classical double split tee joints. The dissipation of a large amount of energy by friction pads was achieved, but the structure damage could not be entirely avoided. Low-damage seismic resistant connections, such as sliding hinge joints and asymmetric friction connections with friction interfaces made of brass, steel or aluminum were subsequently investigated [22]. Presently, a novel configuration friction kit was employed containing removable haunches or ribs with slotted holes, and stainless steel friction pads were horizontally or vertically equipped together with L-stubs at the lower beam flange (based on [23]), aiming to detach the friction dampening device from both the bottom beam flange or the column surface and thus simplify the reparability. The results demonstrated that the rotation action of the beam around the pin at the top T-stub had a promising energy concentration as a result of the detachable friction damper, as well as negligible plastic deformation in other components; however, the disadvantage of occupying available height cannot be overlooked.
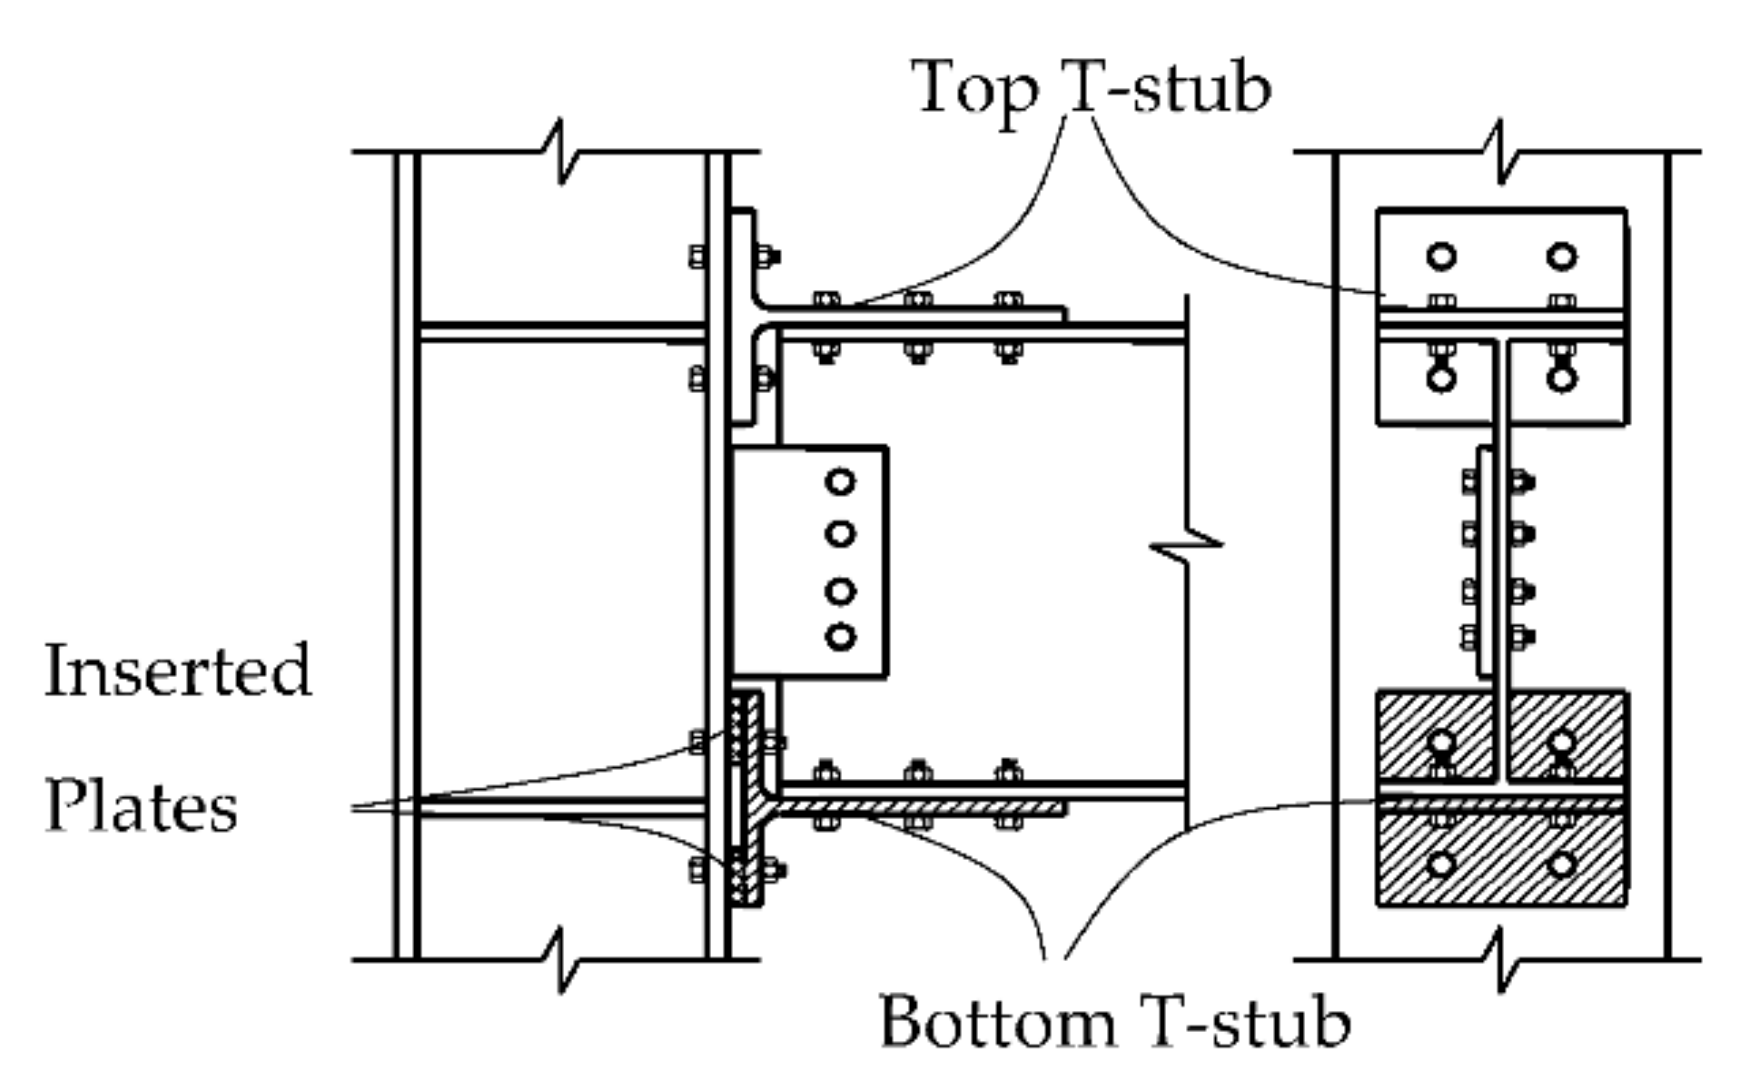
Motivated by the above considerations, a new T-stub connection in which two steel plates are inserted between the T-stub connection at the bottom of the beam and the column flange was presented in [24], as shown in Figure 1. Such a connection offers advantages to both seismic performance and rehabilitation. First of all, the space formed by two steel plates provides deformation and yield conditions for the bottom T-stub connection of the beam end under negative bending. The new T-stub connection has outperformed the traditional one (in which yielding is only possible under positive bending), thus effectively increasing the plastic deformation and energy dissipation capacity of joints. Secondly, the failure of beam-to-column joints is centered only on new T-stub connections with inserted plates at the lower flange of the beam, while most of the middle and upper sections of the beam are still in an elastic working state, rendering large-scale repair unnecessary. By only replacing the damaged bottom T-stub connection, convenient and cost-saving restoration can be ensured. Thirdly, the new T-stub connection with inserted plates does not reduce the height of space below, and can be manufactured and installed with ease.
Along with the introduction of the new T-stub connection with inserted plates, other vital factors are worth exploring. For instance, it is important to determine which kind of T-stub connection shows the better performance, whether the connection it is produced by welding or cut from a steel section, to what extent the inserted plates will improve the energy dissipation capacity of the T-stub connection and what is the optimum width of inserted plates is that can maximize mechanical behavior.
This study takes as its research object T-stub connections that use inserted plates from a steel beam-to-column joint. Specifically, it focuses on the component formed by bolting one T-stub flange and two steel plates with two high-strength bolts. In order to fully investigate the mechanical properties of the new connections, this paper first establishes the calculation model of load bearing capacity of the innovative connection based on two distinctive failure types. Next, uniaxial tensile, compressive and cyclic experiments are conducted on T-stub connections with or without inserted plates to verify the accuracy of the model and probe the influence of fabrication method, length of T-stub flange and width of plate on the strengths, stiffness and energy dissipation capacity of connections.
2. Mechanical Model
To establish the mechanical model of the T-stub connection with inserted plates, predictions of both the initial stiffness and load bearing capacity are required. Firstly, the stiffness of the T-stub connection is determined by following the approach of an equivalent cantilever model in [25]. Secondly, the tensile bearing capacity of the T-stub connection with inserted plates is assumed to be similar to that of a conventional T-stub connection without inserted plates, so the mechanical model tension can be directly drawn upon traditional T-stub connections from previous studies [26,27]. Hence, this paper is primarily concerned with the compressive bearing capacity of the mechanical model. Based on speculations of two different failure modes, two calculation methods of compressive bearing capacity are deduced.
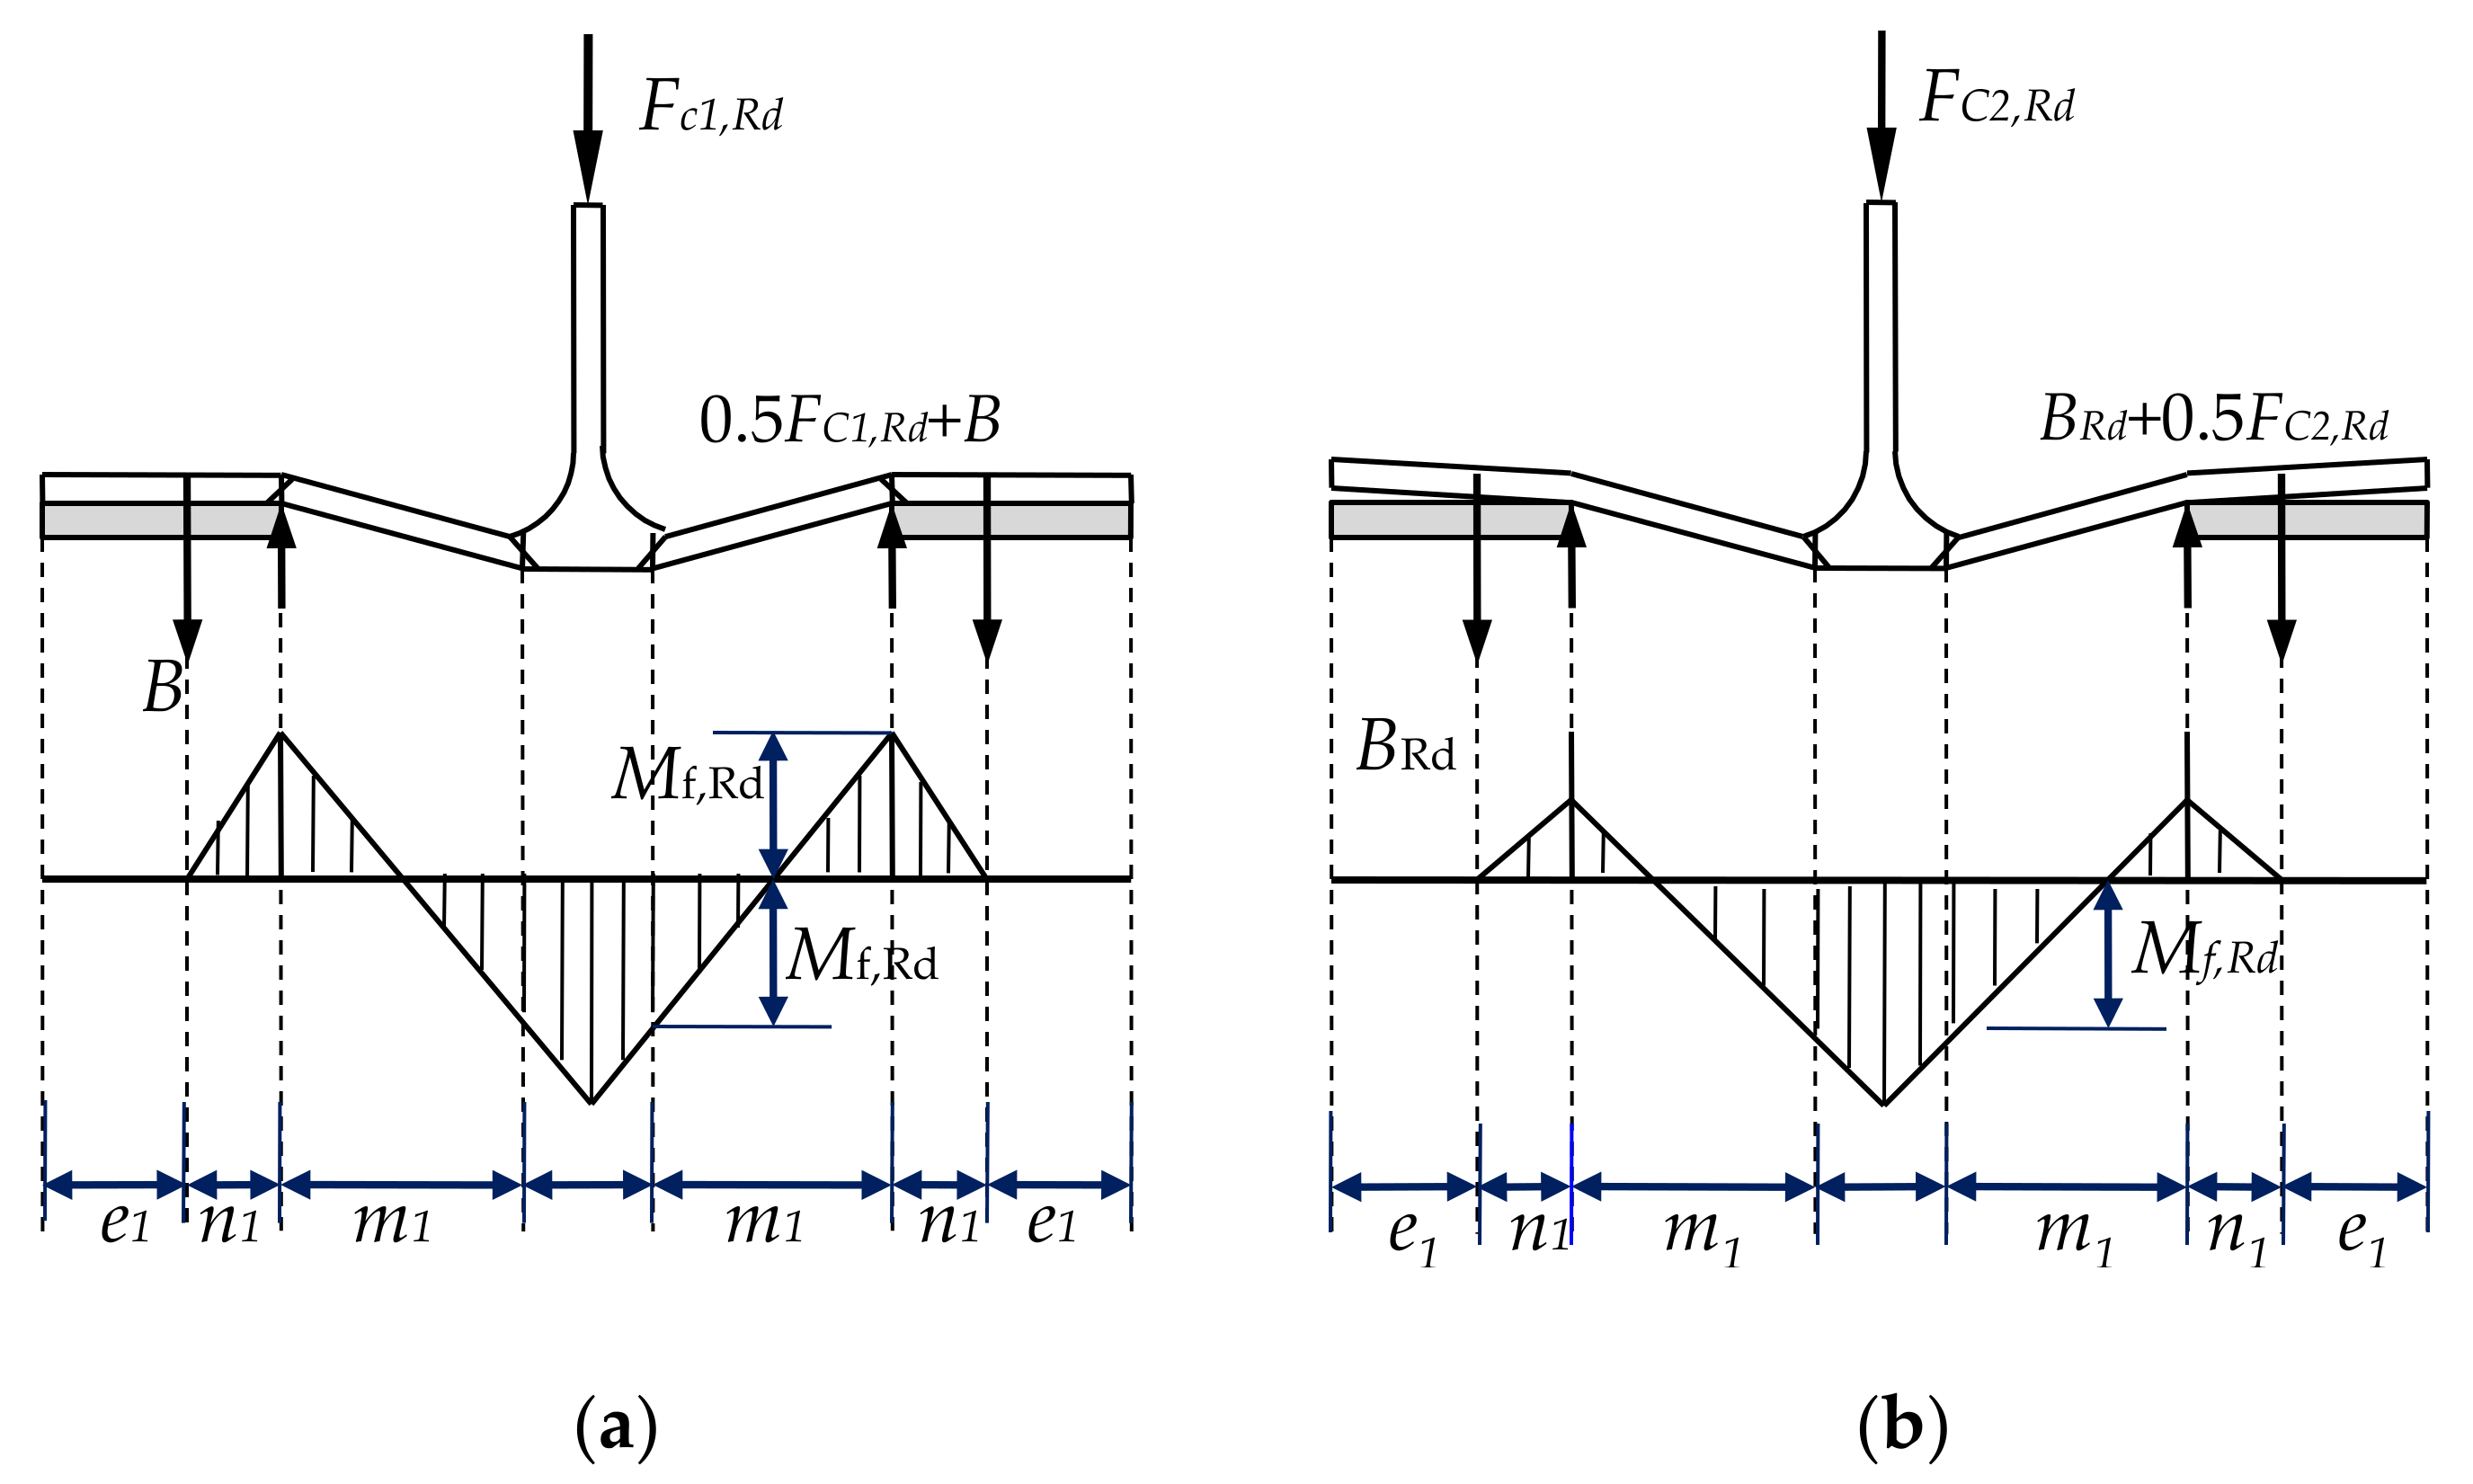
The type of compression failure mechanism used in the new connection is subject to the relative strength between the T-stub flange and the two bolts. The Type 1 failure mode is characterized by the formation of four plastic hinges in the T-stub flanges, two of which are on the sections over the inner edge of the inserted plates, while the other two are located at the sections corresponding to the flange-to-web connections, as shown in Figure 2a. This occurs when the strength of the T-stub is weaker and the strength of two bolts is stronger, which is partially similar to the Type 1 failure mode of traditional T-stub connections under tension [27,28]. By contrast, when the T-stub strength is greater than that of two bolts, the Type 2 failure mode appears, which is represented by the formation of two plastic hinges located at the sections corresponding to the flange-to-web connection, as well as the two bolts (see Figure 2b).
According to the formation of the two plastic hinges on the flange sections corresponding to the flange-to-web connections in Figure 2a, an equilibrium equation is developed as follows:
where Fc1,Rd and Fc2,Rd indicate the compressive bearing capacity of failure Type 1 and Type 2, respectively; B is the prying force of high-strength bolts; Mf,Rd represents the bending capacity of the T-stub flange; m1 is the distance from the inside of the inserted plate to the flange-to-web connection of T-stub; and e1 and n1 are the distance from the center line of the bolt to the outside and inside of the inserted plate, respectively.
(0.5Fc1,Rd + B) m1 − B (m1+ n1) = Mf,Rd
Moreover, based on the two plastic hinges on the flange sections at the inner edge of inserted plates, another equation can be set up:
B * n1 = Mf,Rd
Therefore the final equation corresponding to the compressive resistance of failure Type 1 can be derived by taking Equation (2) to Equation (1) as follows:
Fc1,Rd = 4Mf,Rd/m1
Similarly, another equilibrium equation can be formed according to the position of plastic hinges following on the basis of Figure 2b,
Mf,Rd + BRd * n1 = 0.5Fc2,Rd * m1
Correspondingly, the final equation for compressive resistance of failure Type 2 can be described by
Fc2,Rd = 2(Mf,Rd + BRd * n1)/m1
3. Test Specimen, Test Setup and Instrumentation
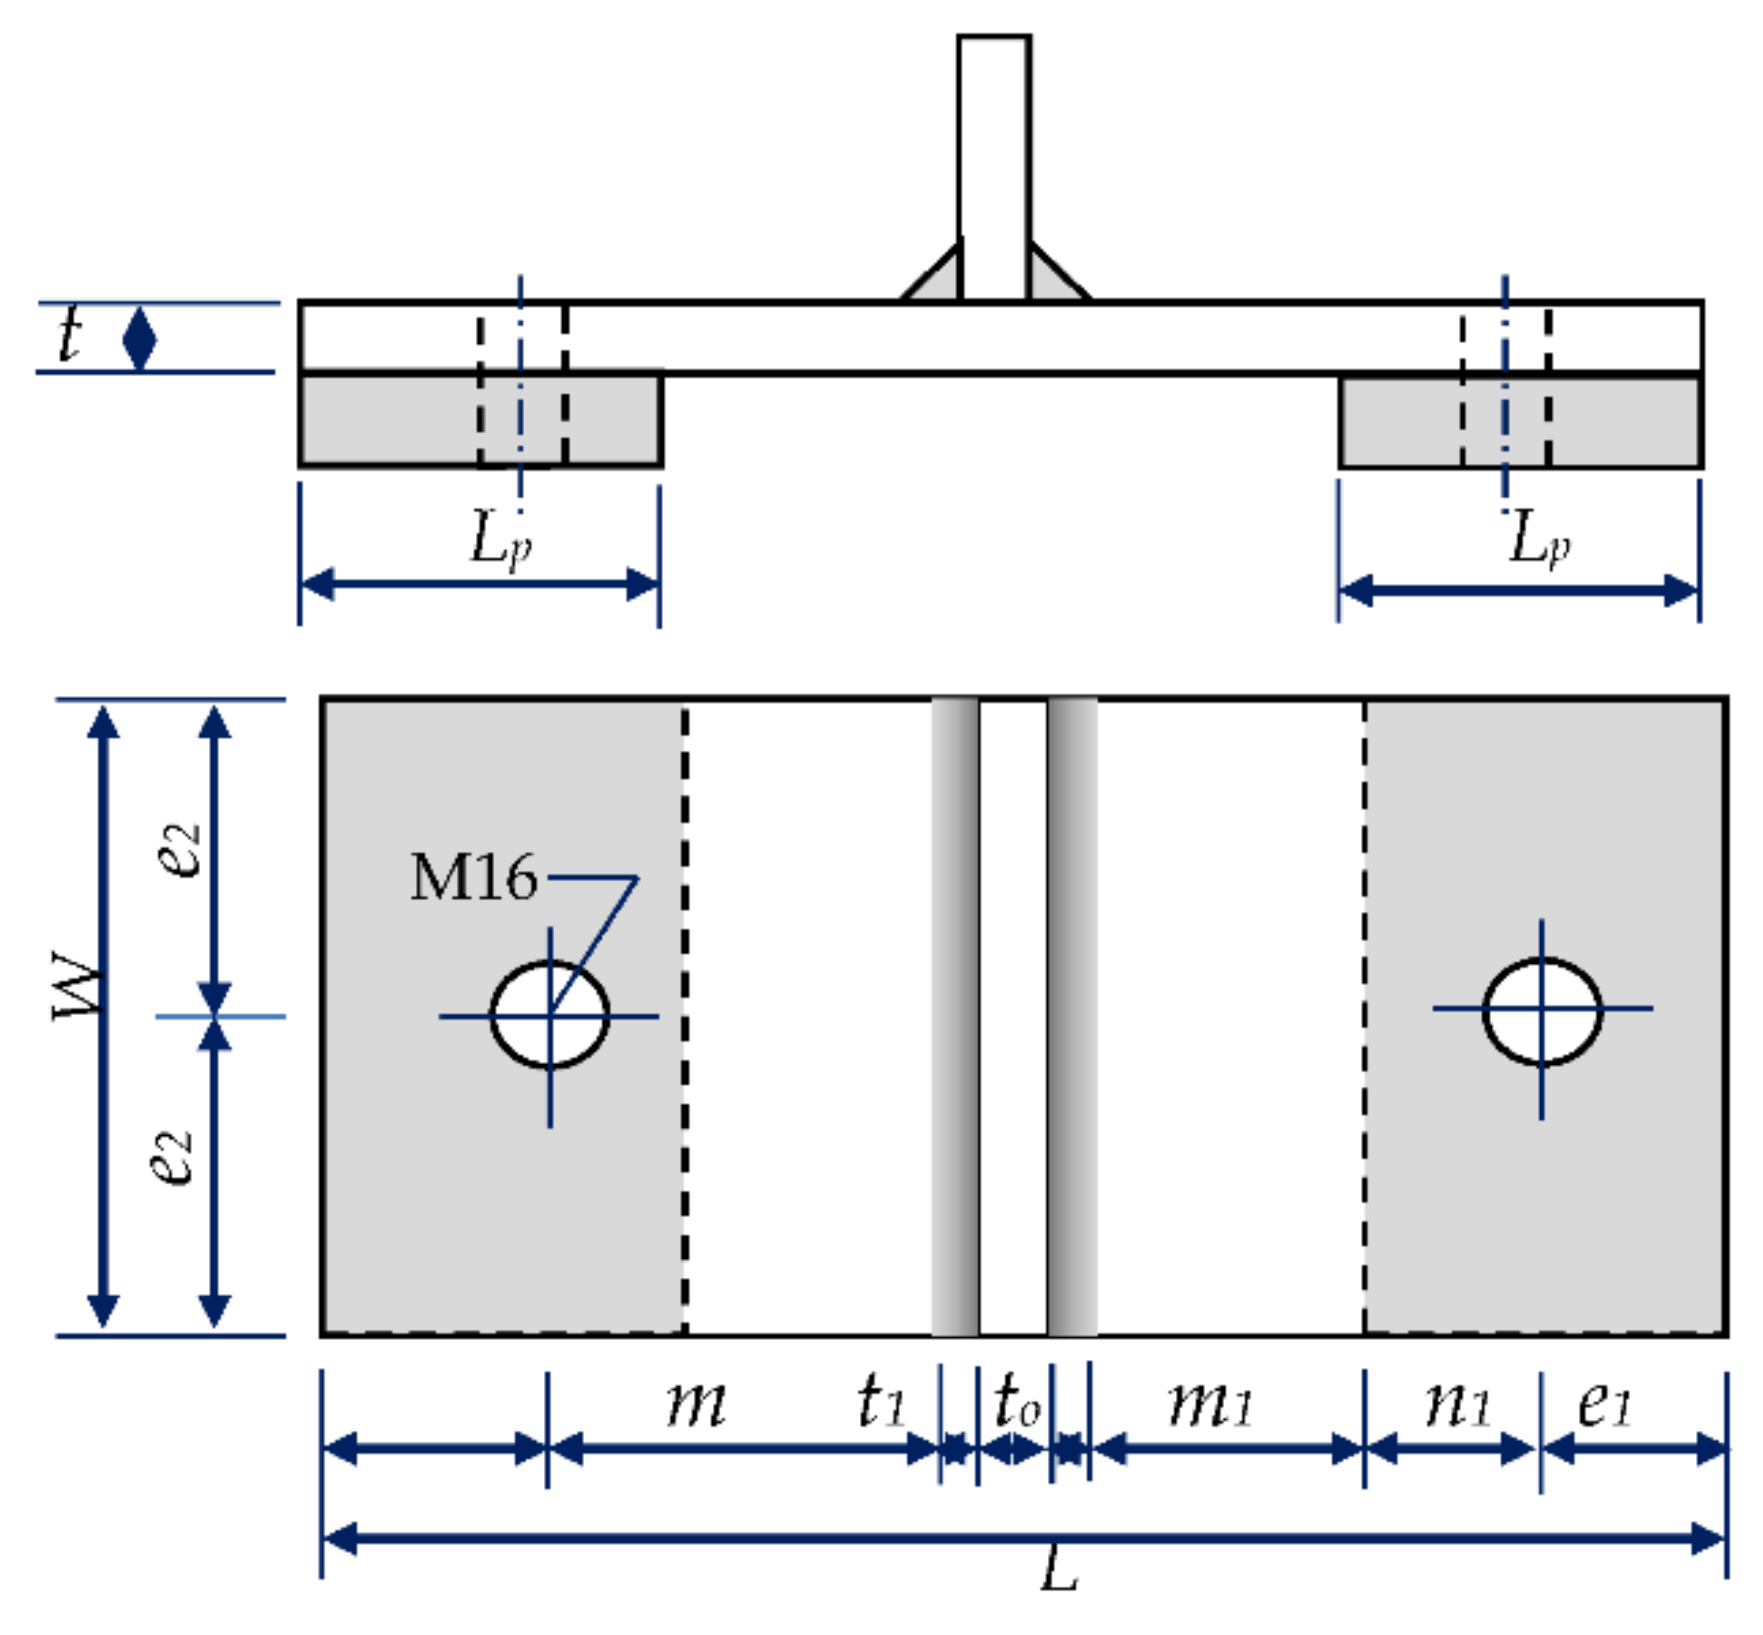
A total of 30 T-stub connection specimens with distinctive configurations were tested under different types of loading conditions, including uniaxial tension, uniaxial compression and cyclic loads. In each specimen, the T-stub flange was bolted to a rigid base serving as the column flange in the beam-to-column joint by two high-strength bolts at the two sides with two rectangular steel plates being assembled between them. Figure 3 depicts an elevation view and cross-section of the T-stub connection with inserted plates.
In the graph, L and W are the width and length of the specimen, respectively; the former was constant at 150 mm in the test, while the latter varied depending on the strength of the T-stub designed. Lp is the width of inserted plates, which is a significant value by design. t and t0 represent the thickness of T-stub flange and web, respectively, both of which were determined by the strength of the T-stub designed like W. e2 is the distance from the bolt centerline to the front or rear ends of the specimen, which is always half of W. t1 is the effective width of the flange-to-web connection or the thickness of weld, depending on the fabrication method, which was taken as 0.8 times the inner arc radius of a rolled steel section and √2 times the thickness of a fillet weld of welding steel by referring to the specifications in [28,29]. m is the distance from the bolt centerline to the edge of the flange-to-web connection or the edge of the weld. e1, m1 and n1 represent the same as mentioned in Section 2; more specifically, e1 is determined by specifications, while m1 and n1 can be obtained based on other values.
The primary parameters in this study can be summarized as follows:
- Setting or not setting the inserted plates, to measure the influence of plates on the mechanical properties of the connection (and the dissipation capacity in particular).
- Relative strength of T-stub flange and two high-strength bolts, to verify the reliability of the proposed mechanical model for failure modes and load bearing capacity calculation.
- Fabricating the connection by cutting from a standard steel section or welding two steel plates, to compare the impacts of setup on the mechanical properties of the connection.
- Length of the T-stub flange and width of the inserted plates, to investigate the energy dissipation capacity of the connection then determine the optimum width of plates.
On account of the research aims, this test is divided into three groups. Table 1 shows the target controlling parameters of specimens in different group with reference to symbols in Figure 3, as well as the force type (FT) of each specimen during test. The specimens in the first group T-stub Connection (TC) were manufactured from cutting part of the rolled profiles HN300×150×6.5×9 of steel grade Q235 [29]. The specimens in group Welding Connection A WA were composed by welding two plates of steel grade Q235 with thicknesses equal to 9 and 6.5 mm, while in group Welding Connection B WB two plates of steel grade Q235 with a thickness of 13 mm were employed. All the inserted plates were fabricated from steel grade Q345 [29] with a constant thicknesses value of 20 mm. In series TC and WA, the bolt of property class 10.9s (with a diameter of 16 mm) was selected to form the relative strength relationship with weaker flange and stronger bolts. While the bolt of property class 8.8s (with a diameter of 16 mm) was applied in series WB to shape the opposite relationship of stronger flange and weaker bolts [30]. The tags in Table 1 also allow identification of all the examined specimens. After the letters TC, WA or WB, the letters P or N denote the existence or absence of inserted plates, respectively, while the following two numbers represent the length of T-stub W and the width of inserted plate Lp, respectively.
The coupon tensile tests of steel plates with different thicknesses and grades were performed first. The sample plates were cut from the base metal according to the requirements of specification [31], processed with the test specimens at the same time following the stipulations of each specification [32], then tested in uniaxial tensile loads, to measure the elastic modulus, yield strength, tensile strength, yield strain, strengthening strain and so on to provide a basis for the test results analysis. The basic mechanical properties of both 10.9s and 8.8s bolts were also determined by axial tensile tests. Under the pure tensile force, the failure modes of all bolt assemblies (including bolt head, shank and nut) were featured by shank necking in threaded parts during yielding and fracturing at the same location at the end. This type of failure mode is attributed to a reduced cross-section resulting from threads, after which the bolts can be sorted as high-resistance (HR), according to literature [33]. The average value of yield strength, ultimate strength, percentage elongation and section shrinkage for property classes 10.9s and 8.8s were 1046 and 782 MPa, 1156 and 931 MPa, 12.4% and 16.4%, and 45.1% and 53.1%, respectively.
The experimental tests were carried out at the Structures Laboratory at the Fujian Academy of Building Research. In tension and compression tests, specimens were loaded under displacement control through the jaws of the testing machine, the PWS-1000 Servohydraulic Fatigue Testing Machine (maximum test load ± 1000 kN, piston stroke ± 200 mm). The cyclic tests followed the loading pattern of force-to-displacement control regulated by the Specification of Seismic Test of Buildings (JGJ/T 101-2015) [34]. Specifically, the force-control loading was adopted before the specimen yielded, while after that, the displacement-control loading went ahead until the specimen failed. The loading force amplitude and displacement amplitude circled one time before yielding and three times after yielding, respectively.
4. Test Observations, Results and Analysis
4.1. Tension Test
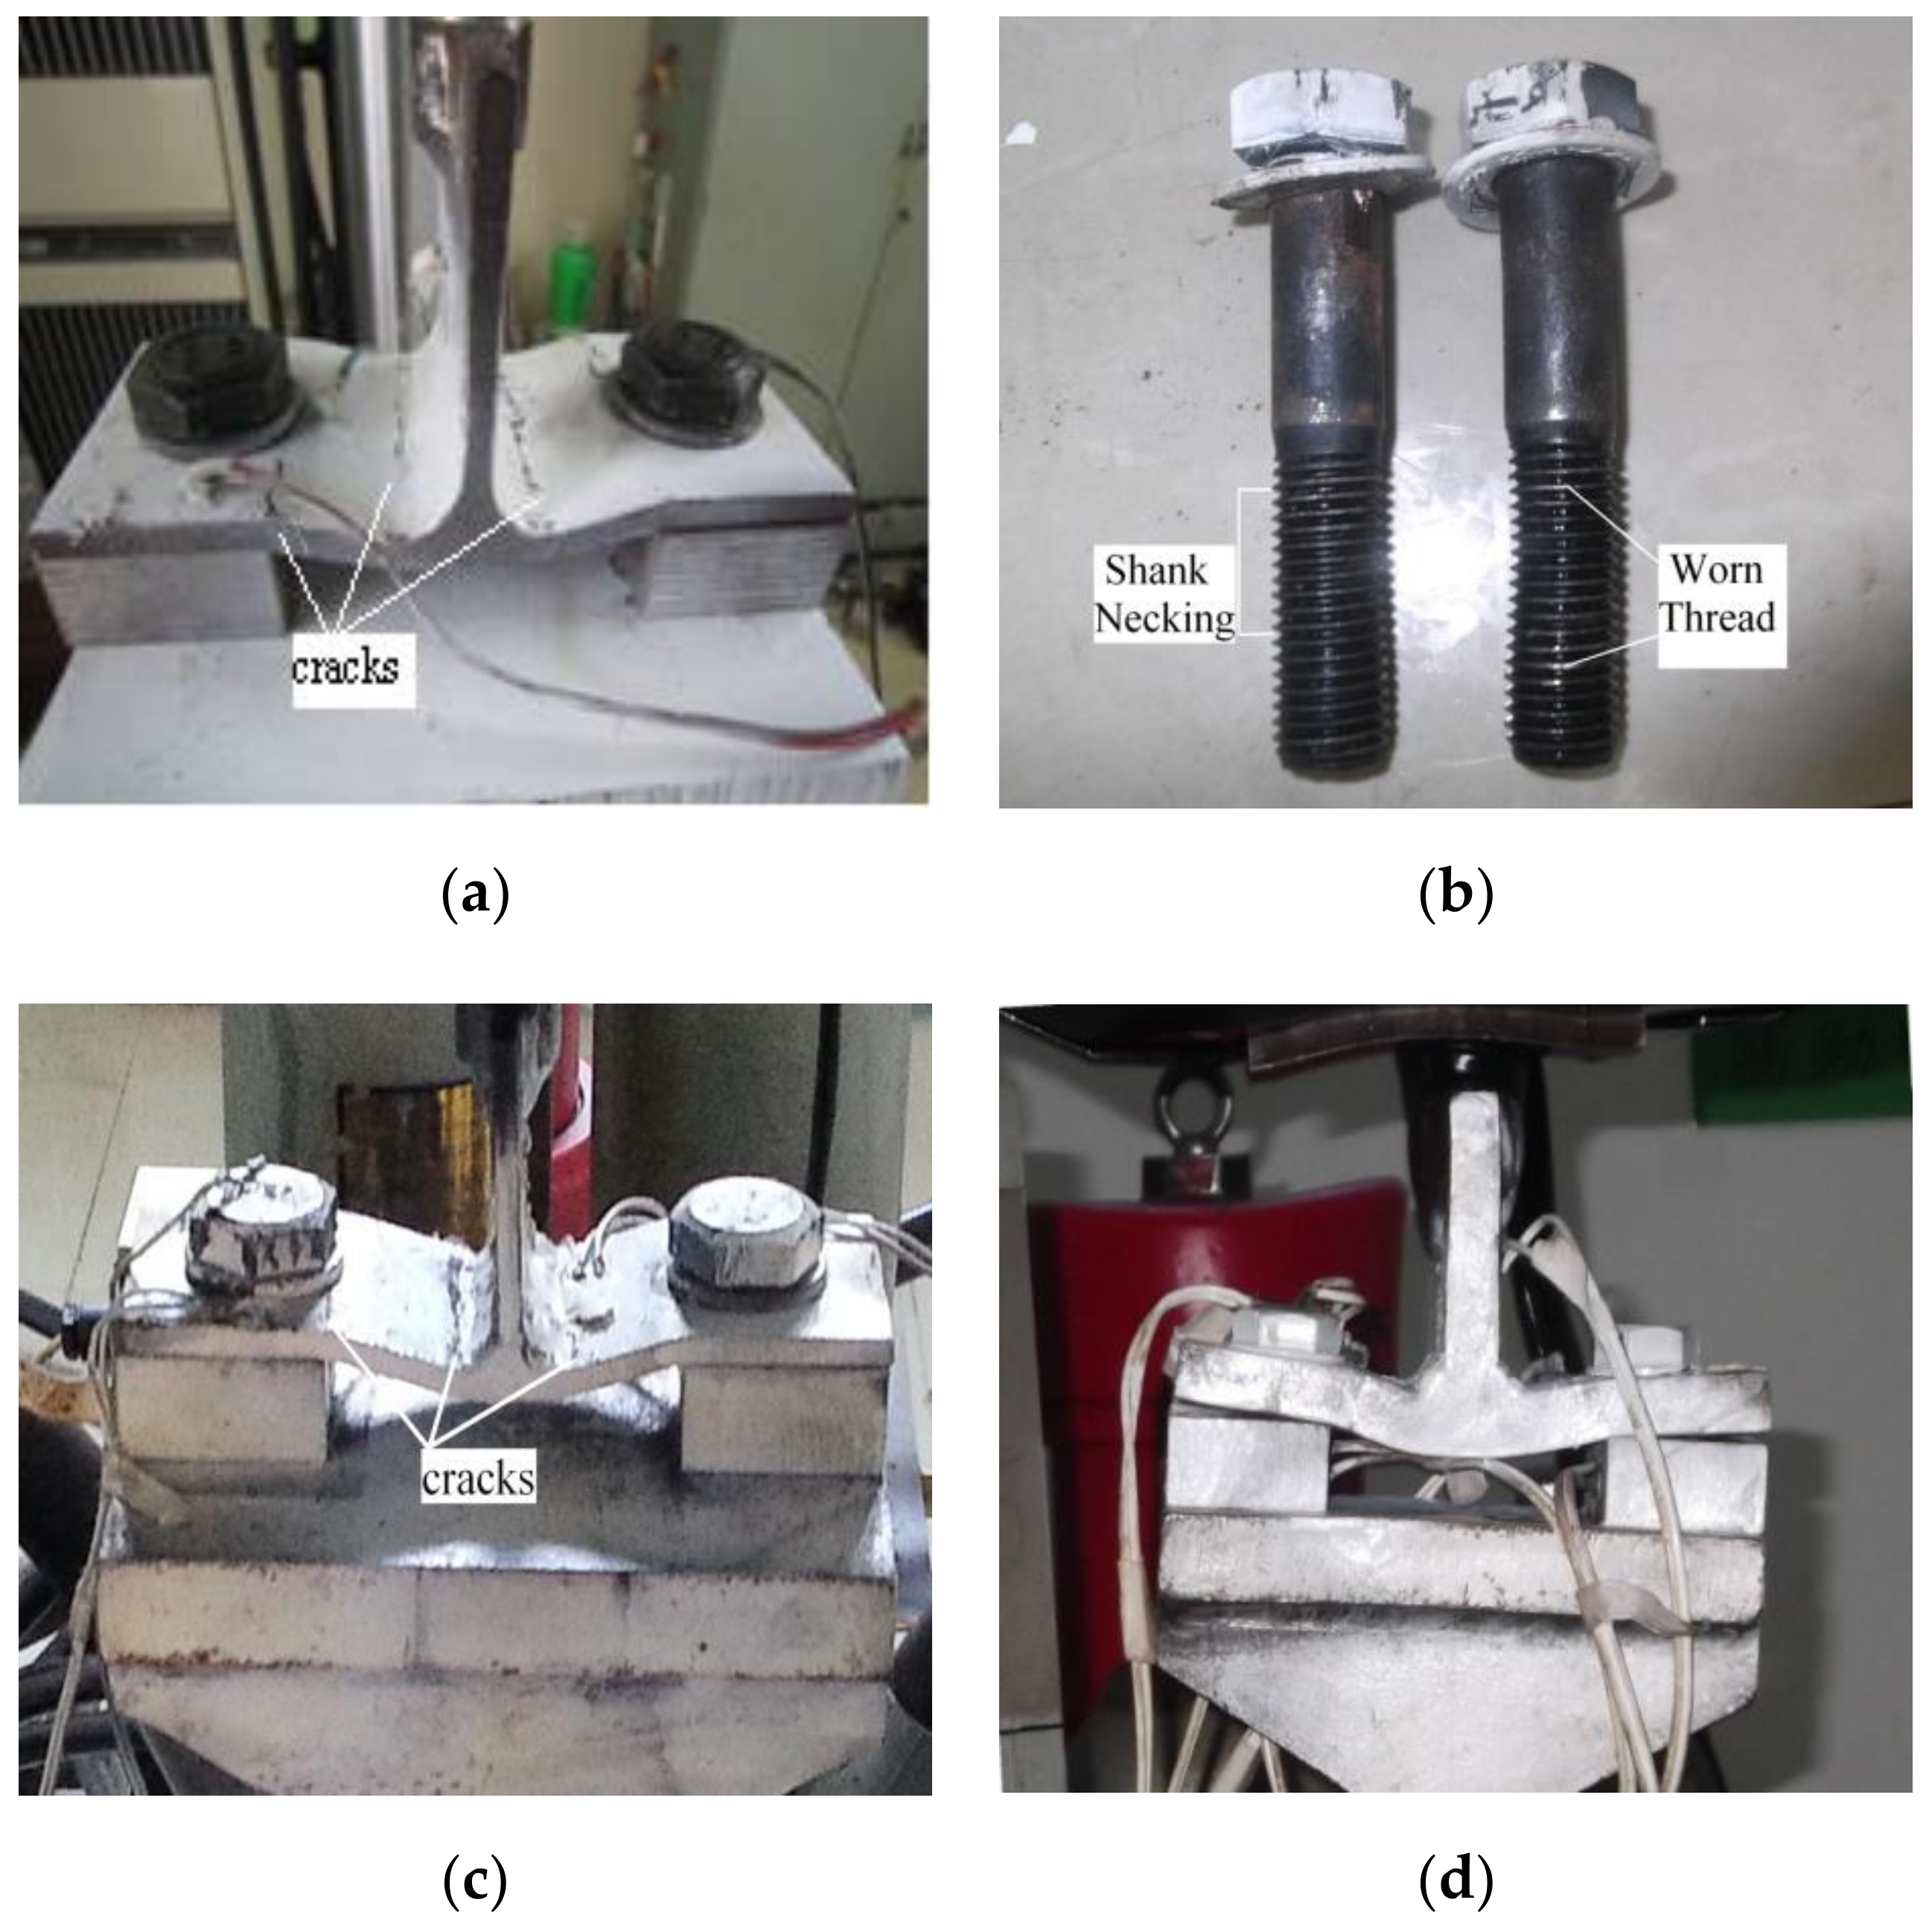
Nine specimens were tested under tensile loads. Two main failure modes appeared after loading that were highly aligned with the description in Eurocode 3 [28]. The middle part of the flange in the TC and WA groups evidently deformed and bulged. Cracks occurred on the flange-to-web connection and flange surface perpendicular to the bolt centerline, forming four plastic hinges in total. There was only a slight extrusion trace on bolts. On the other hand, the failure mode of specimens in group WB was mainly characterized by the failure of high-strength bolts. The inserted plates in all specimens were kept in place, nearly intact. The failure mode of TC-N-50-0 was not different from that of specimen TC-N-50-40, illuminating that inserting two plates does not have a prominent effect on the tensile properties of a T-stub connection, as expected. The final tensile deformations of three typical specimens in the different groups are shown in Figure 4.
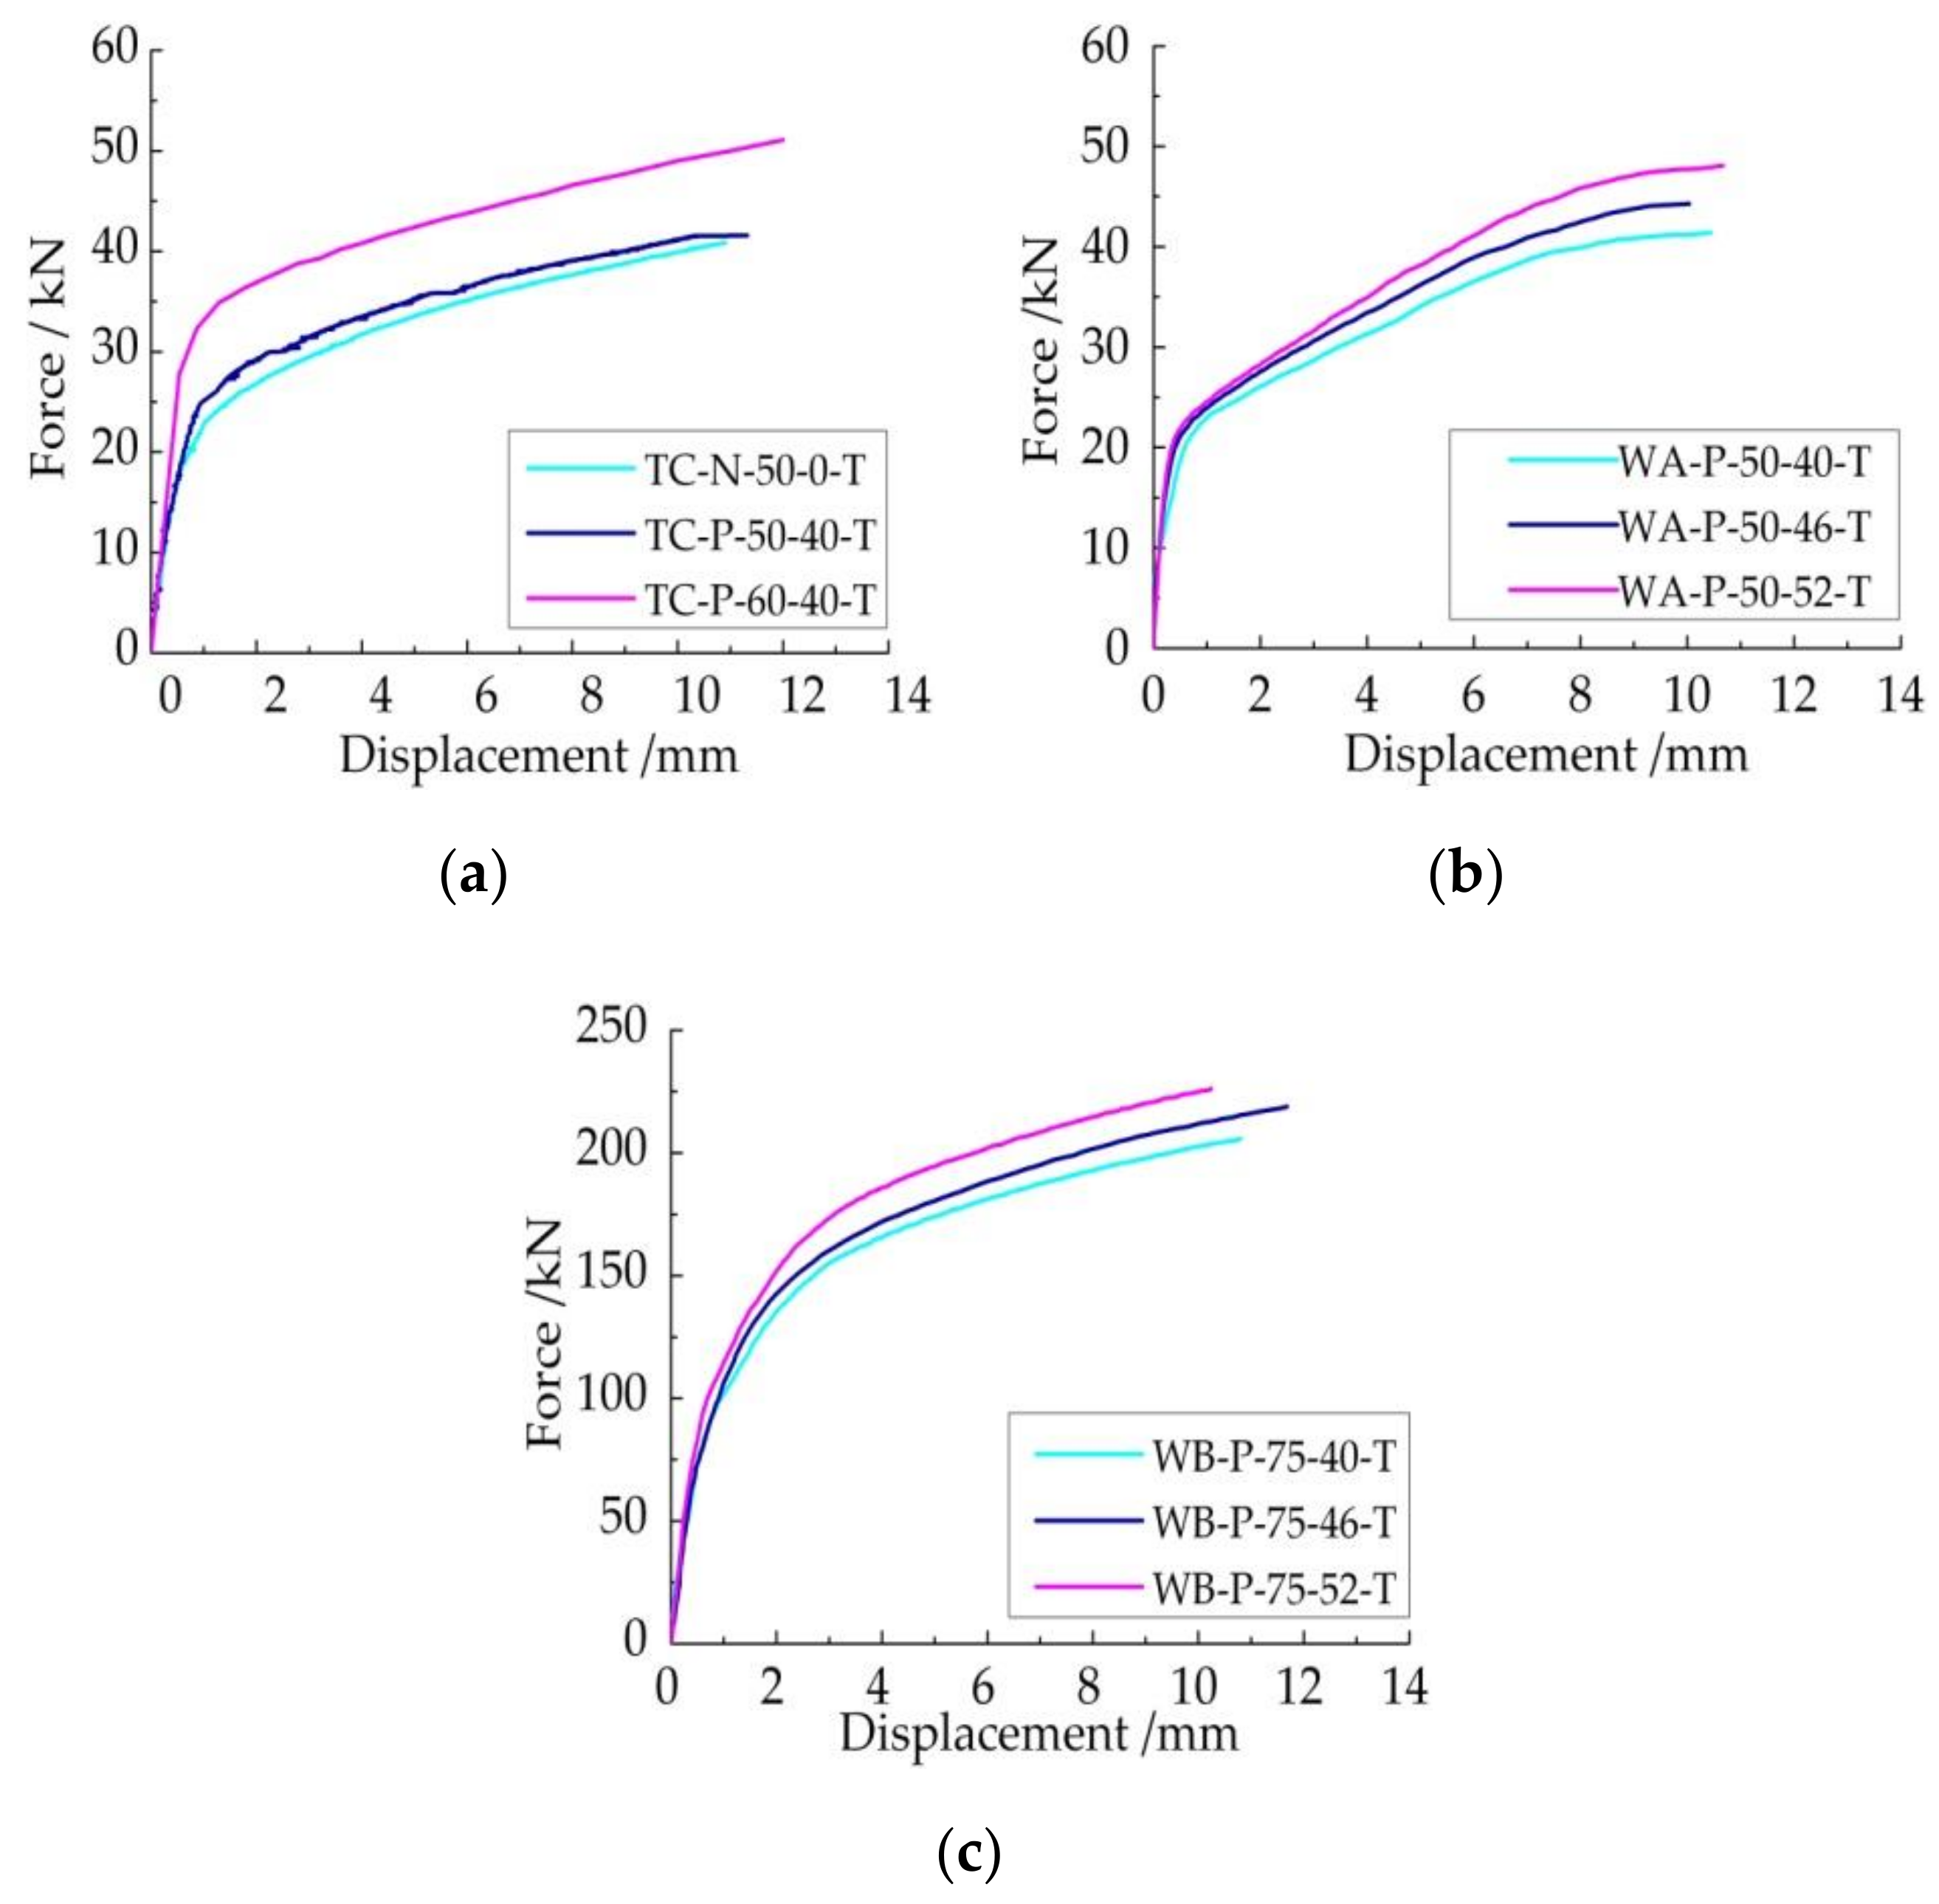
The measured relation curves between tensile force and deformation are presented in Figure 5. As illustrated in Figure 5a, the specimen TC-P-50-40-T with inserted plates had a slightly higher carrying capacity and stiffness than the traditional T-stub connection TC-N-50-0-T in the elastic and plastic stages. After enlarging the section of T-stub flange, both the stiffness and load bearing capacity of the connector improved significantly for TC-P-50-40-T and TC-P-60-40-T. The welded T-stub connections with inserted plates exhibited greater rigidity than those fabricated from steel section in the elastic phase, but the tensile strength and ductility were nearly the same (see specimens TC-P-50-40-T and WA-P-50-40-T in Figure 5a,b). In Figure 5c, it can be seen that in the WA and WB groups, the tensile properties of the specimens did not improve remarkably with growth of the widths of the inserted plates, but only a slight climb of tensile force was revealed. The existence of an inserted plate or change of its width did not have a substantial impact on the relative position and mutual restraint relationship between the T-stub flange and high-strength bolts in the tensile loading process, so the tensile behavior was not be affected markedly.
4.2. Compression Test
4.2.1. Test Results
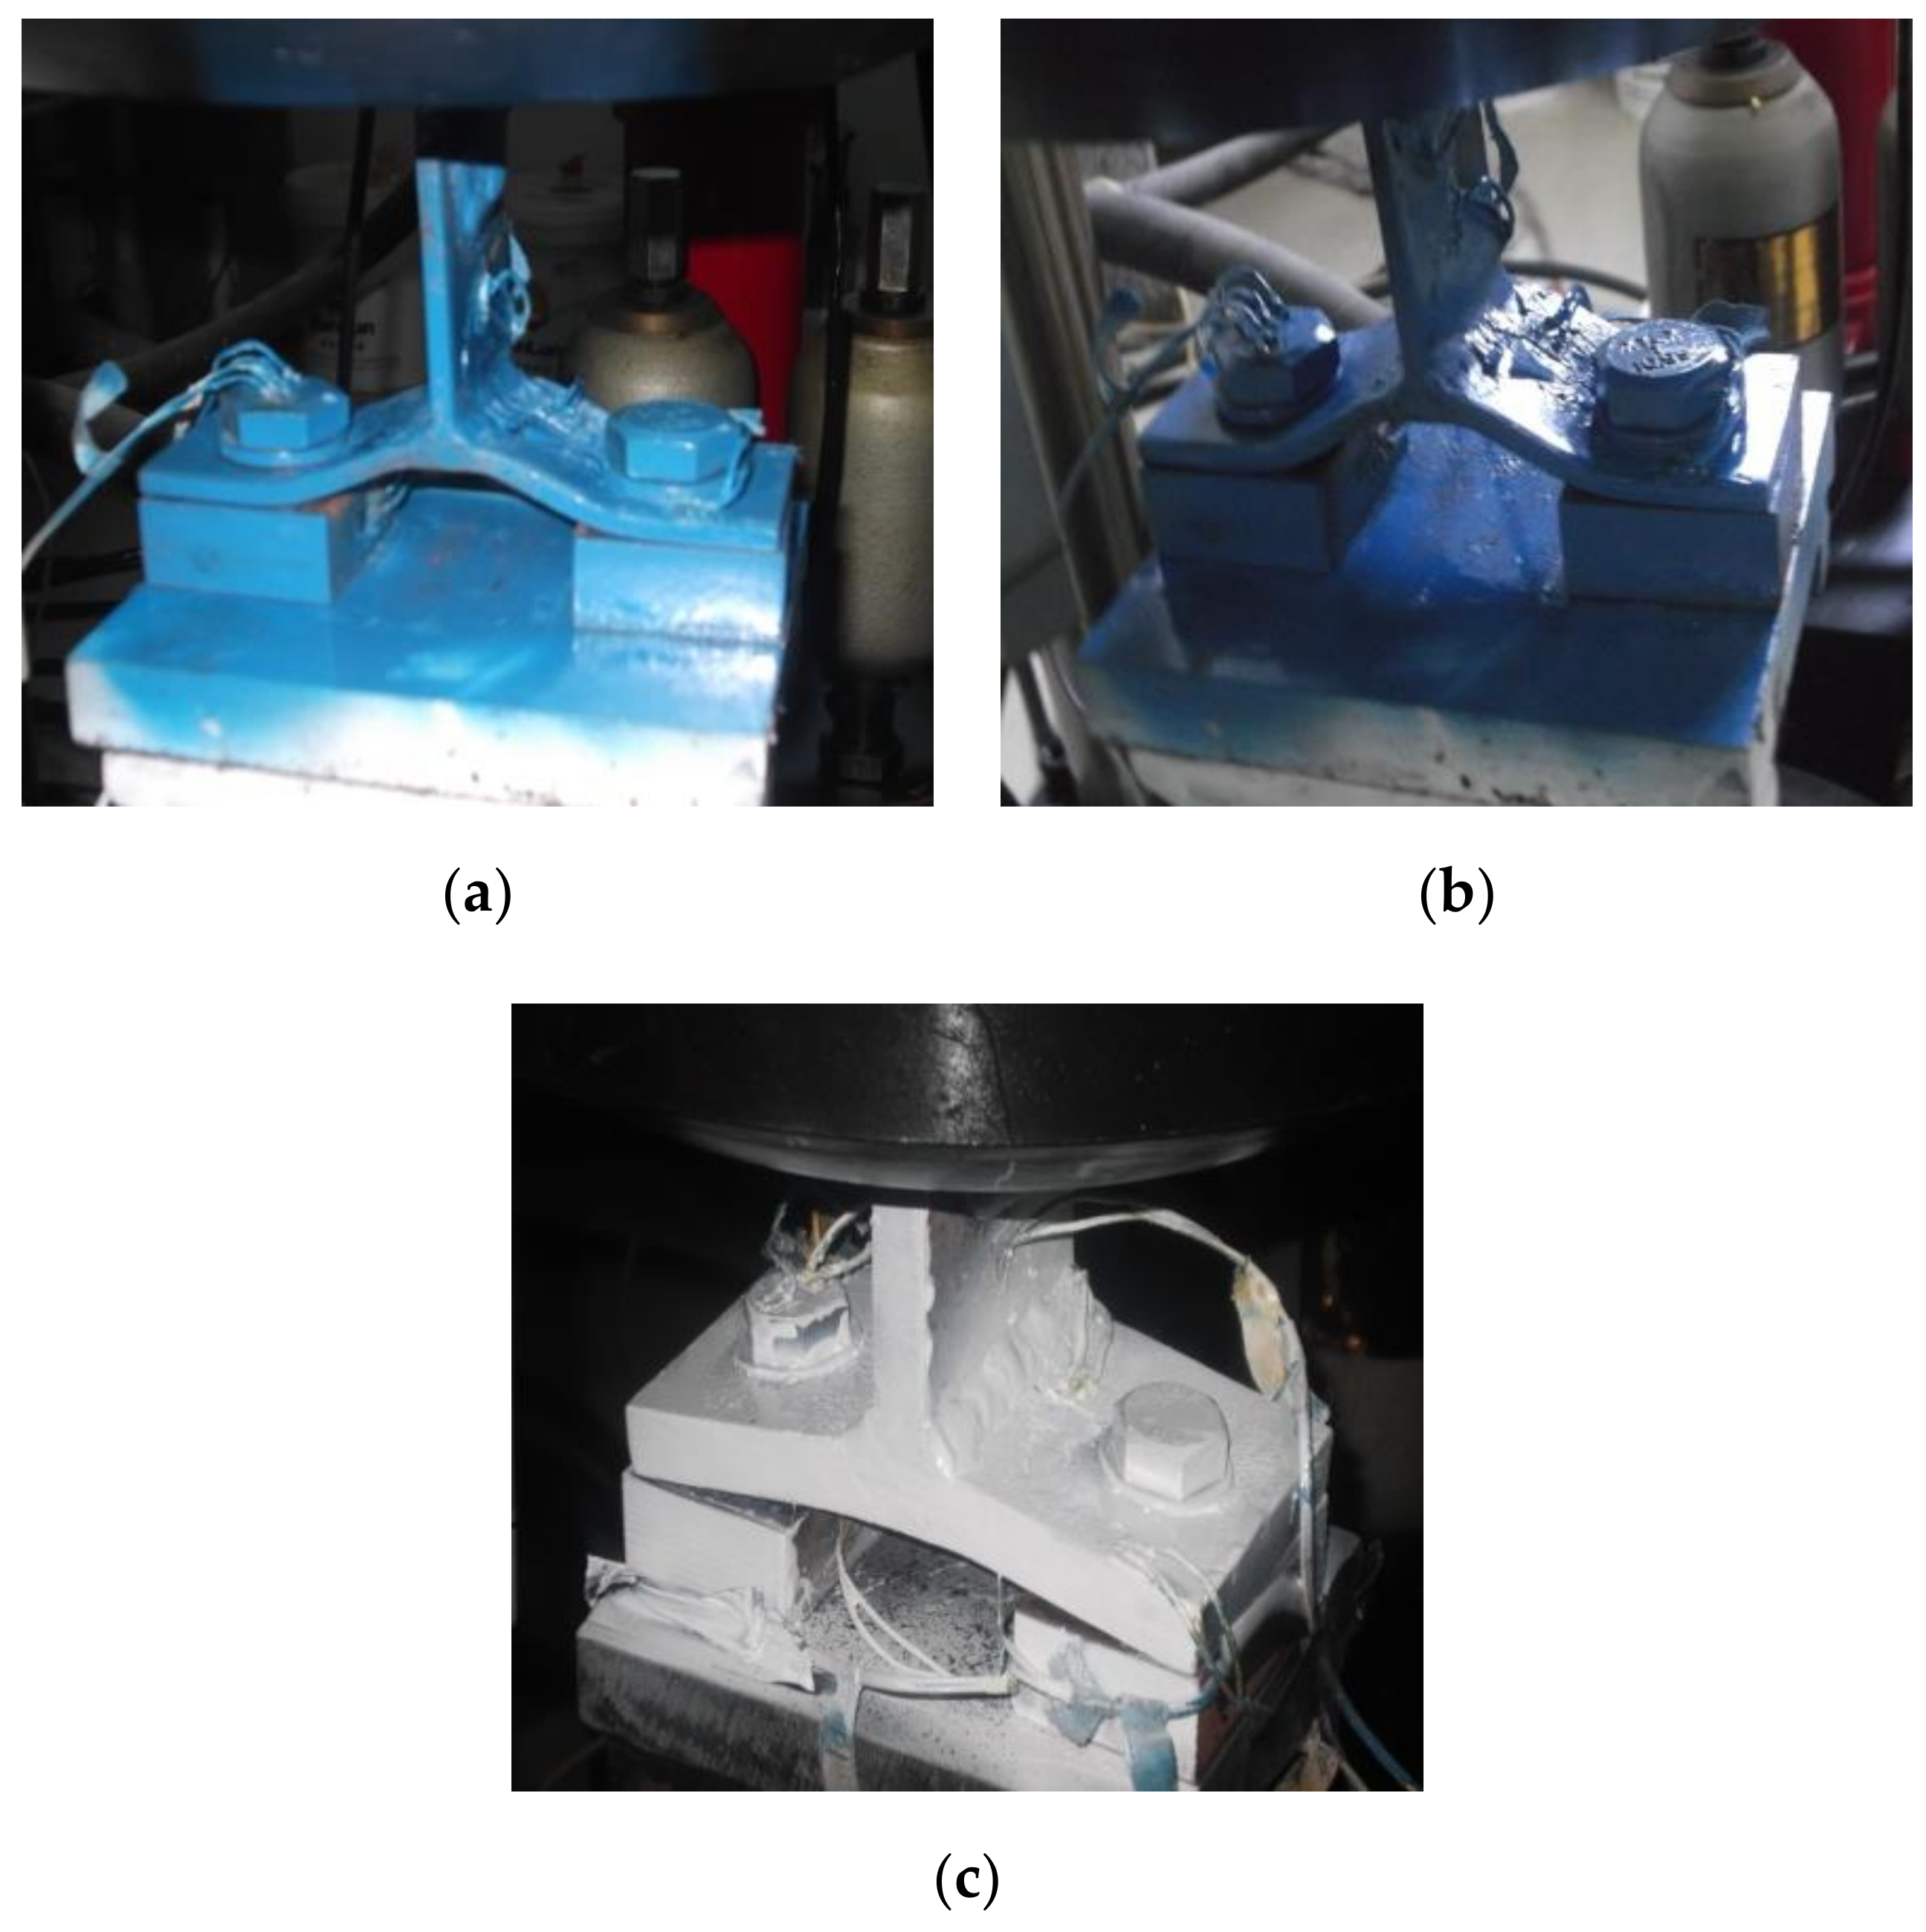
Ten specimens with different configurations were tested under monotonic compressive loads, and two distinctive failure modes could ultimately be generalized. Figure 6 provides the failure situation of typical specimens for each group. As shown in Figure 6a,b, in the TC and WA groups, enough deformation space between the two plates caused the T-stub flanges to clearly protrude along the compressive direction, with cracks appearing on the surface of the flange-to-web connections and the flange above the inner side of the plates, while the contact parts between the plates and flange were always tightly attached without separation. The inserted plates were not pushed outwards and the position remained unchanged. After disassembly, it can be seen there was no sign of extrusion on the inside of the bolt hole or thread failure on the surface of the bolts. In Figure 6c, the T-stub flange in group WB did not deform substantially, the two ends of flange were raised and a clear gap between the flange and inserted plates was formed. Furthermore, the compressive loads also caused cracks at the flange-to-web connection. After dismantling, the worn surface at the thread section and shank necking of the bolts could be clearly recognized (see Figure 6d), demonstrating the clear evidence of bolts yielding. All phenomena are consistent with the prediction of the mechanical model in Section 2.
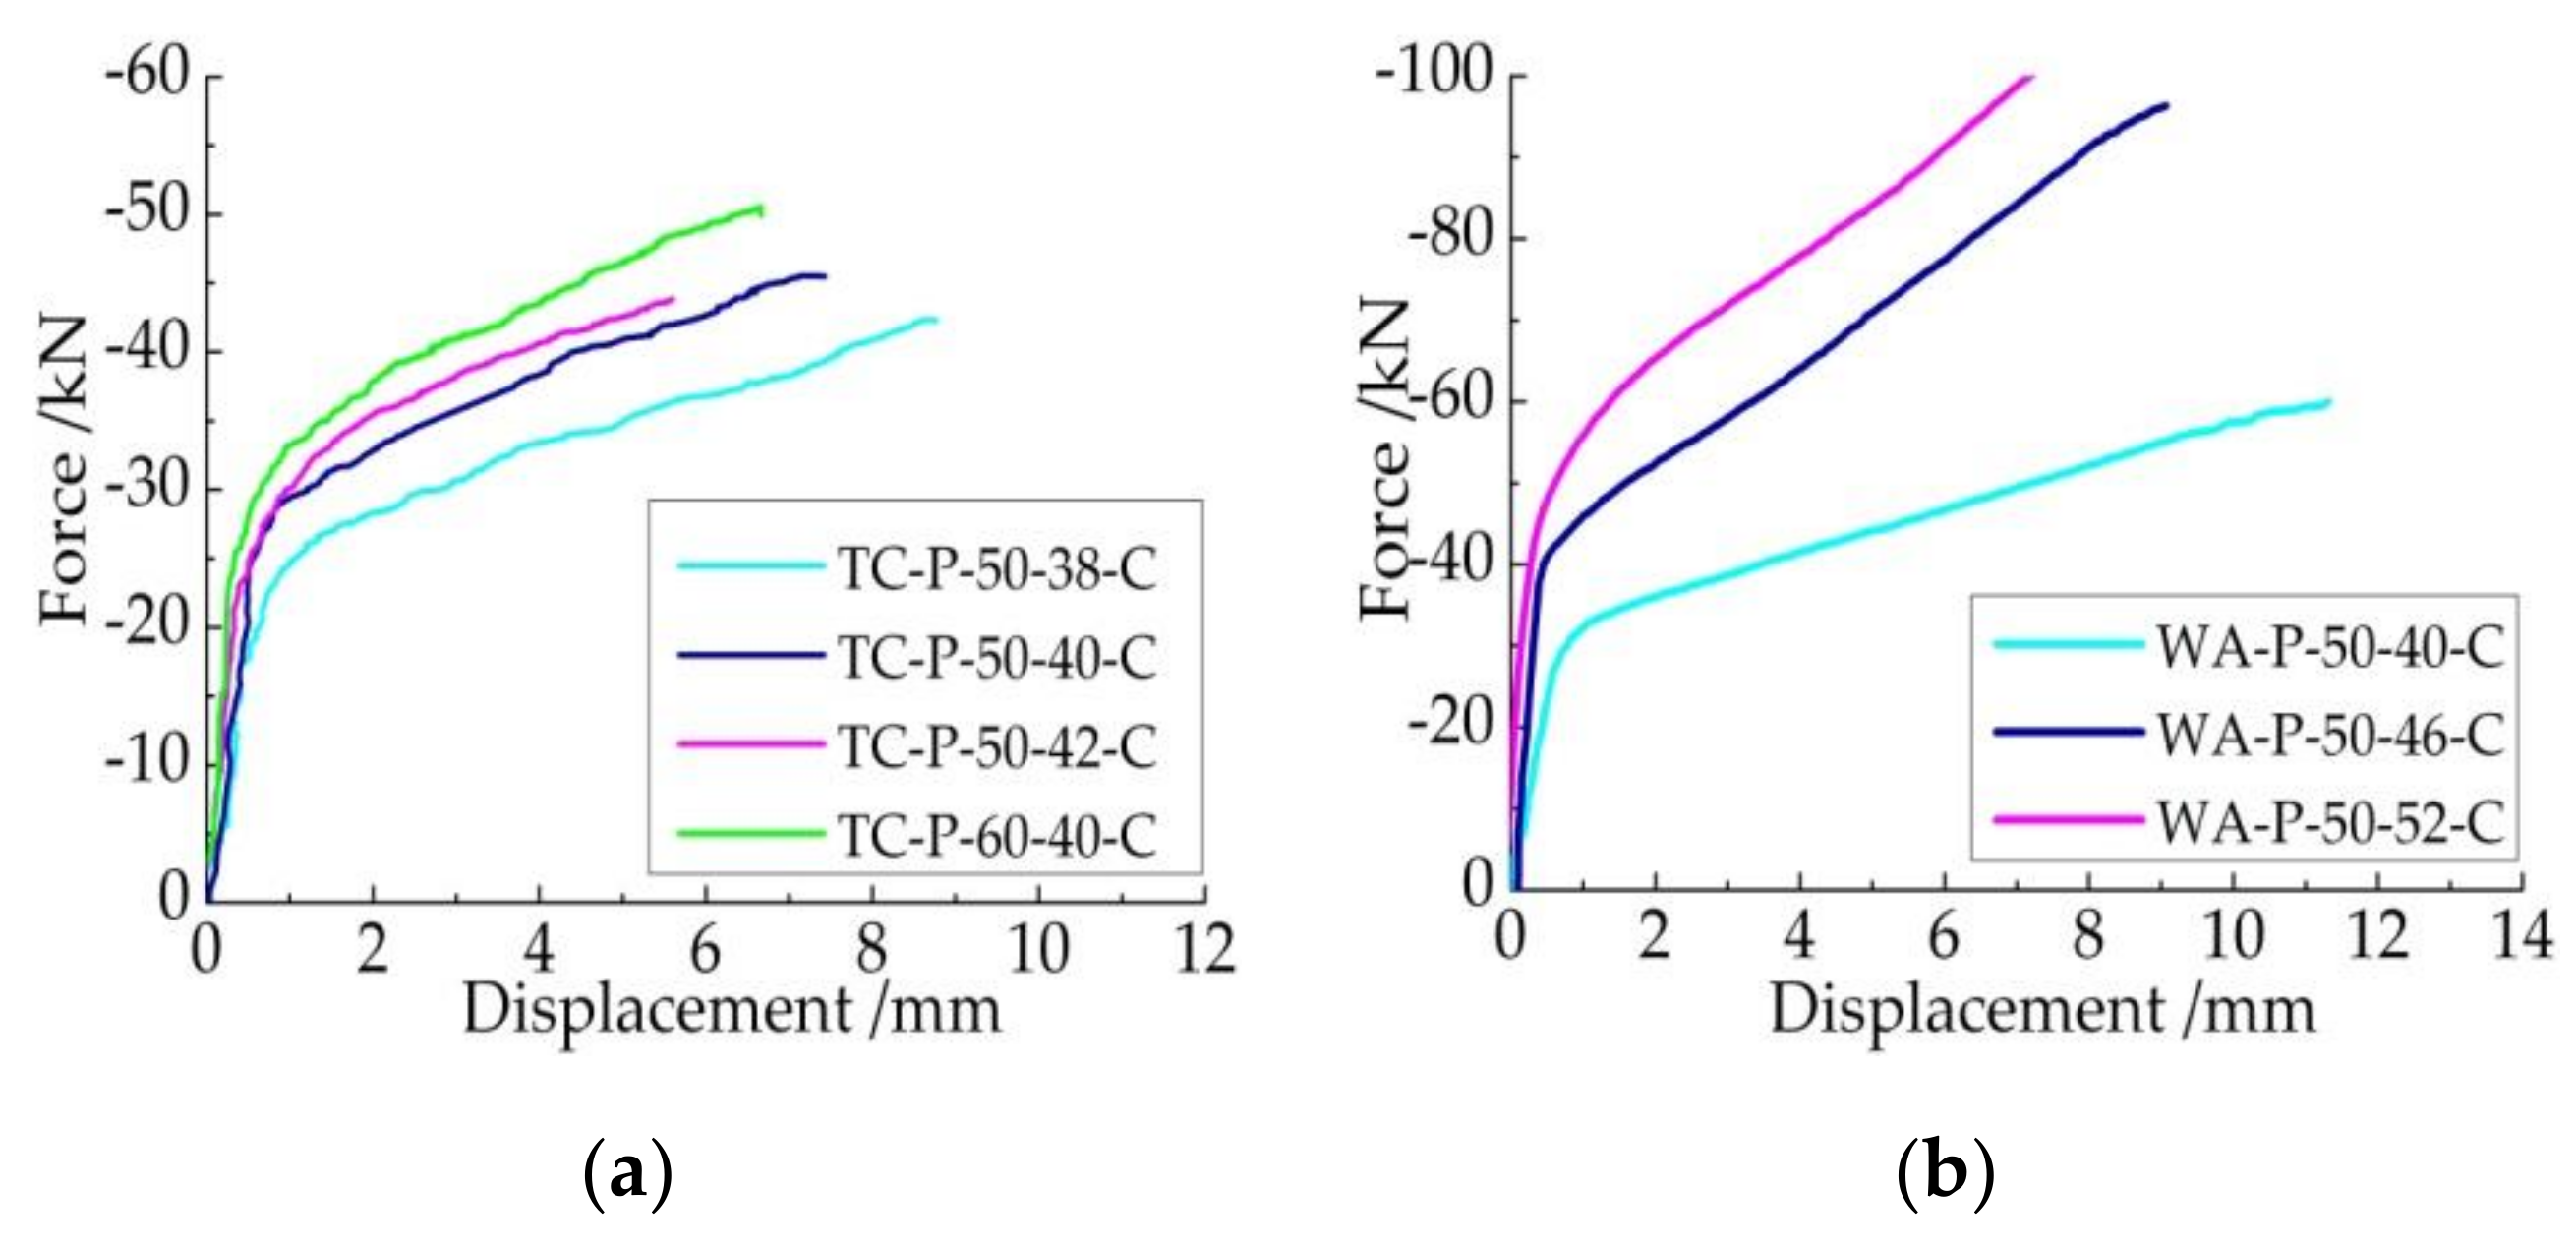
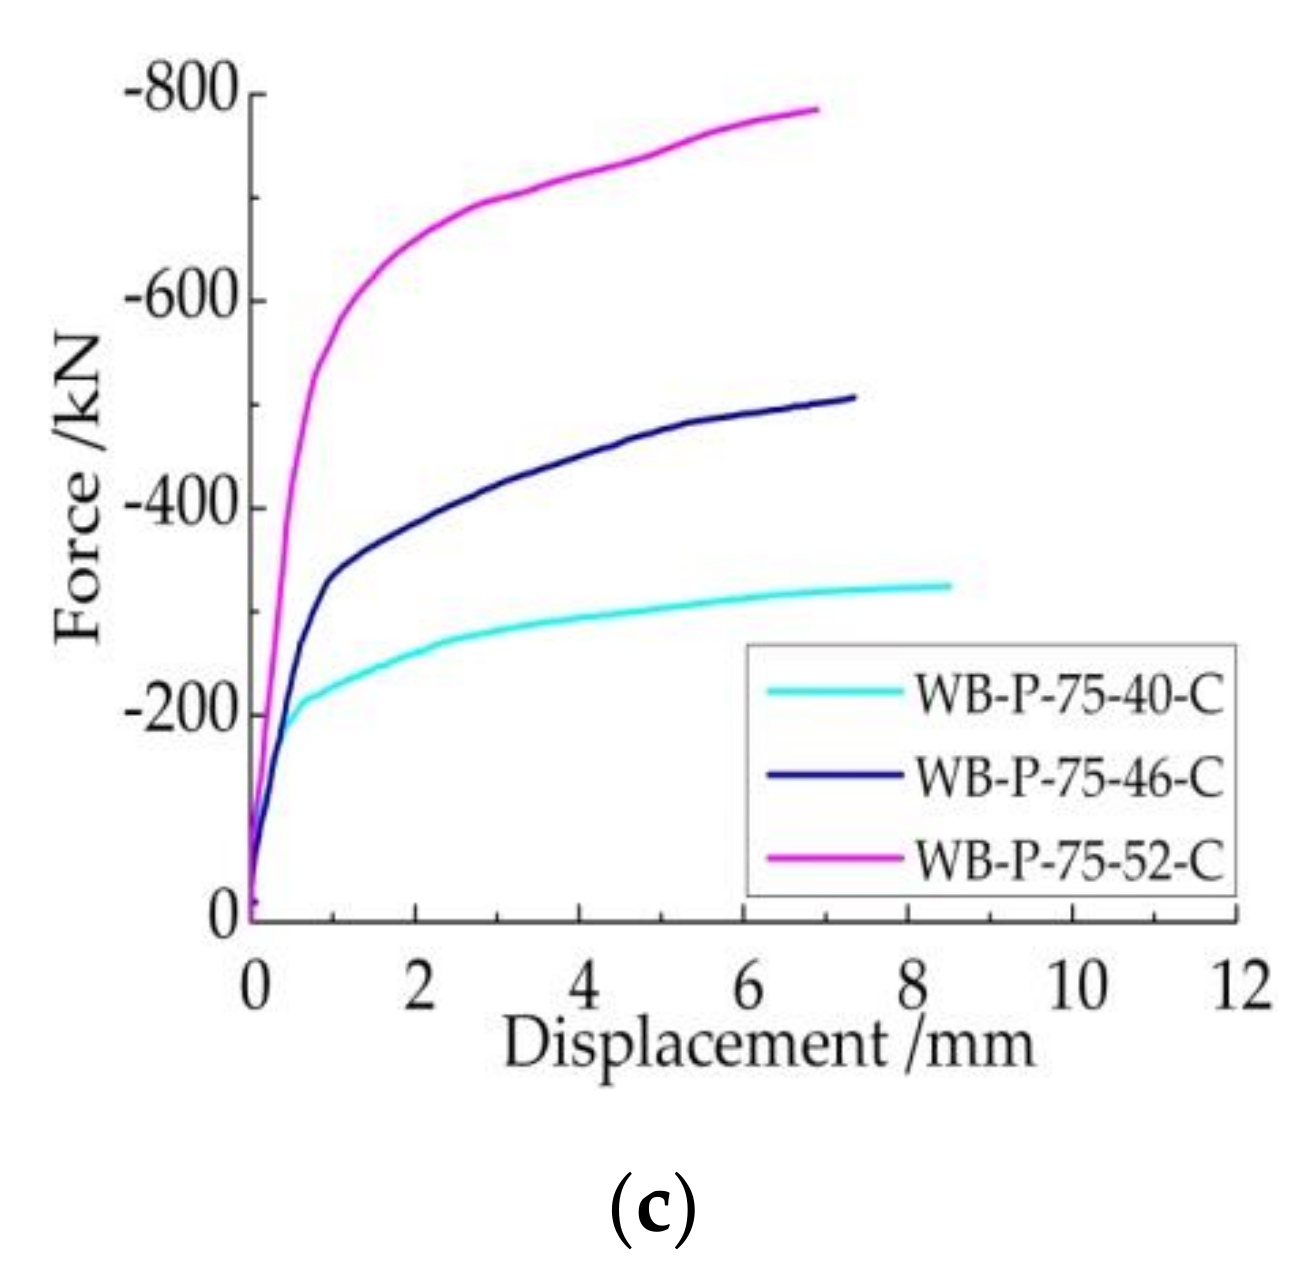
Figure 7 illustrates the results of the force-displacement curves of all compressed specimens. Comparing TC-P-50-40-C with TC-P-60-40-C, it is transparent that the compressive bearing capacity and stiffness incrementally improved the T-stub length, as seen in Figure 7a. The welded T-stub connections outperformed those manufactured from steel sections in rigidity and ductility performance, while they showed a similar load-bearing capacity; see TC-P-50-40-C and WA-P-50-40-C in Figure 7b,c, which are similar to the results in the tensile test. Most importantly, the compressive properties including yielding force, stiffness and ductility of all specimens increased with the growth of plate width, from 38 to 42 mm in group TC, and from 40 to 52 mm in groups WA and WB. It is noteworthy, however, that there was no significant rise in ductility after the plate width became larger than 46 mm. The reasonable width range of plates is further explored in the following sections.
4.2.2. Test Data Validation
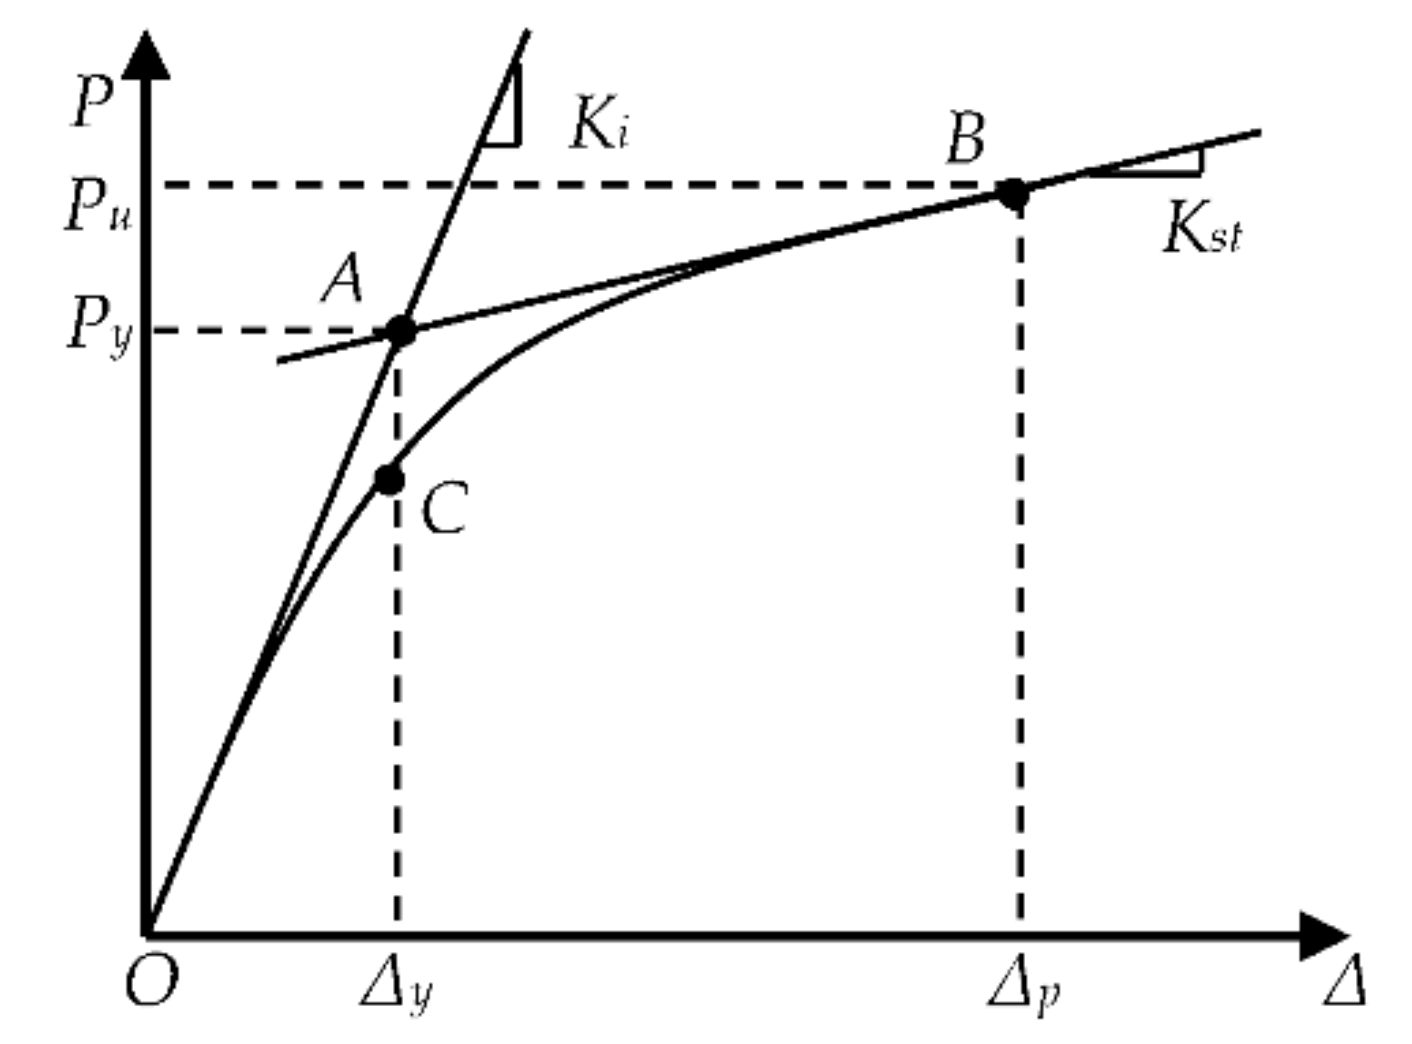
The test results in Figure 7 also provide the basis for verifying the mechanical model of compressive bearing capacity proposed in Section 2. In order to confirm the feature points on the test curve, including the yield point and the ultimate bearing point, a classical solution was adopted that can be summarized as follows: firstly, the secant stiffness of the elastic stage of the curve is defined as the initial stiffness Ki, and the characteristic stiffness Kst is determined through the mean value of stiffness in the strain hardening stage of the curve. Secondly, two lines OA and AB are drawn with slopes equal to the stiffness values of Ki and Kst, respectively, which pass through the intersection point of lines AB and OA. A third line perpendicular to the X axis will intersect the monotonic curve at point C, which is the yield characteristic point. The corresponding coordinate values are the yield force Py and displacement Δy. Similarly, the intersection point between line AB and the curve is the ultimate bearing point, allowing the ultimate load Pu and the displacement Δu to be fixed according to the coordinate values, as shown in Figure 8.
Applying the approach of defining feature points to this study, the yield strength Py of specimens was figured out using a monotonic compressive test that combined the calculation values based on the design equations proposed above (the comparison results are listed in Table 2). The theoretical bearing capacity of specimens in groups TC and WA was derived from Equation (3), while that of the specimens in group WB was calculated using Equation (5) in Section 2. The deviations between the test values and the theoretical values were quite reasonable, and in most situations the latter was less than the former, which indicates the design formulas were conservative. It is noteworthy that the strength of the weld could not be fully considered in this study, which is another reason for the lower theoretical value in groups WA and WB. The negative difference that occurred in specimen WB-P-75-52-C lied in the overall strength loss from the local buckling of web during the test. The thick flange and wide plate together resulted in a very limited deformation capacity and flange space, meaning that the web buckling occurred as a phenomenon of the compression of the classical T-stub connection, rather than the bolts yielding as expected in the theoretical prediction. This demonstrates that Equation (5) is not applicable when the T-stub strength is greater than that of the bolts and the plate width exceeds a certain range (which this paper later determines). The corresponding configuration is also not recommended in practice. The experimental results prove the good reliability of the mechanical model this paper put forward in general.
4.3. Cyclic Test
4.3.1. Test Results
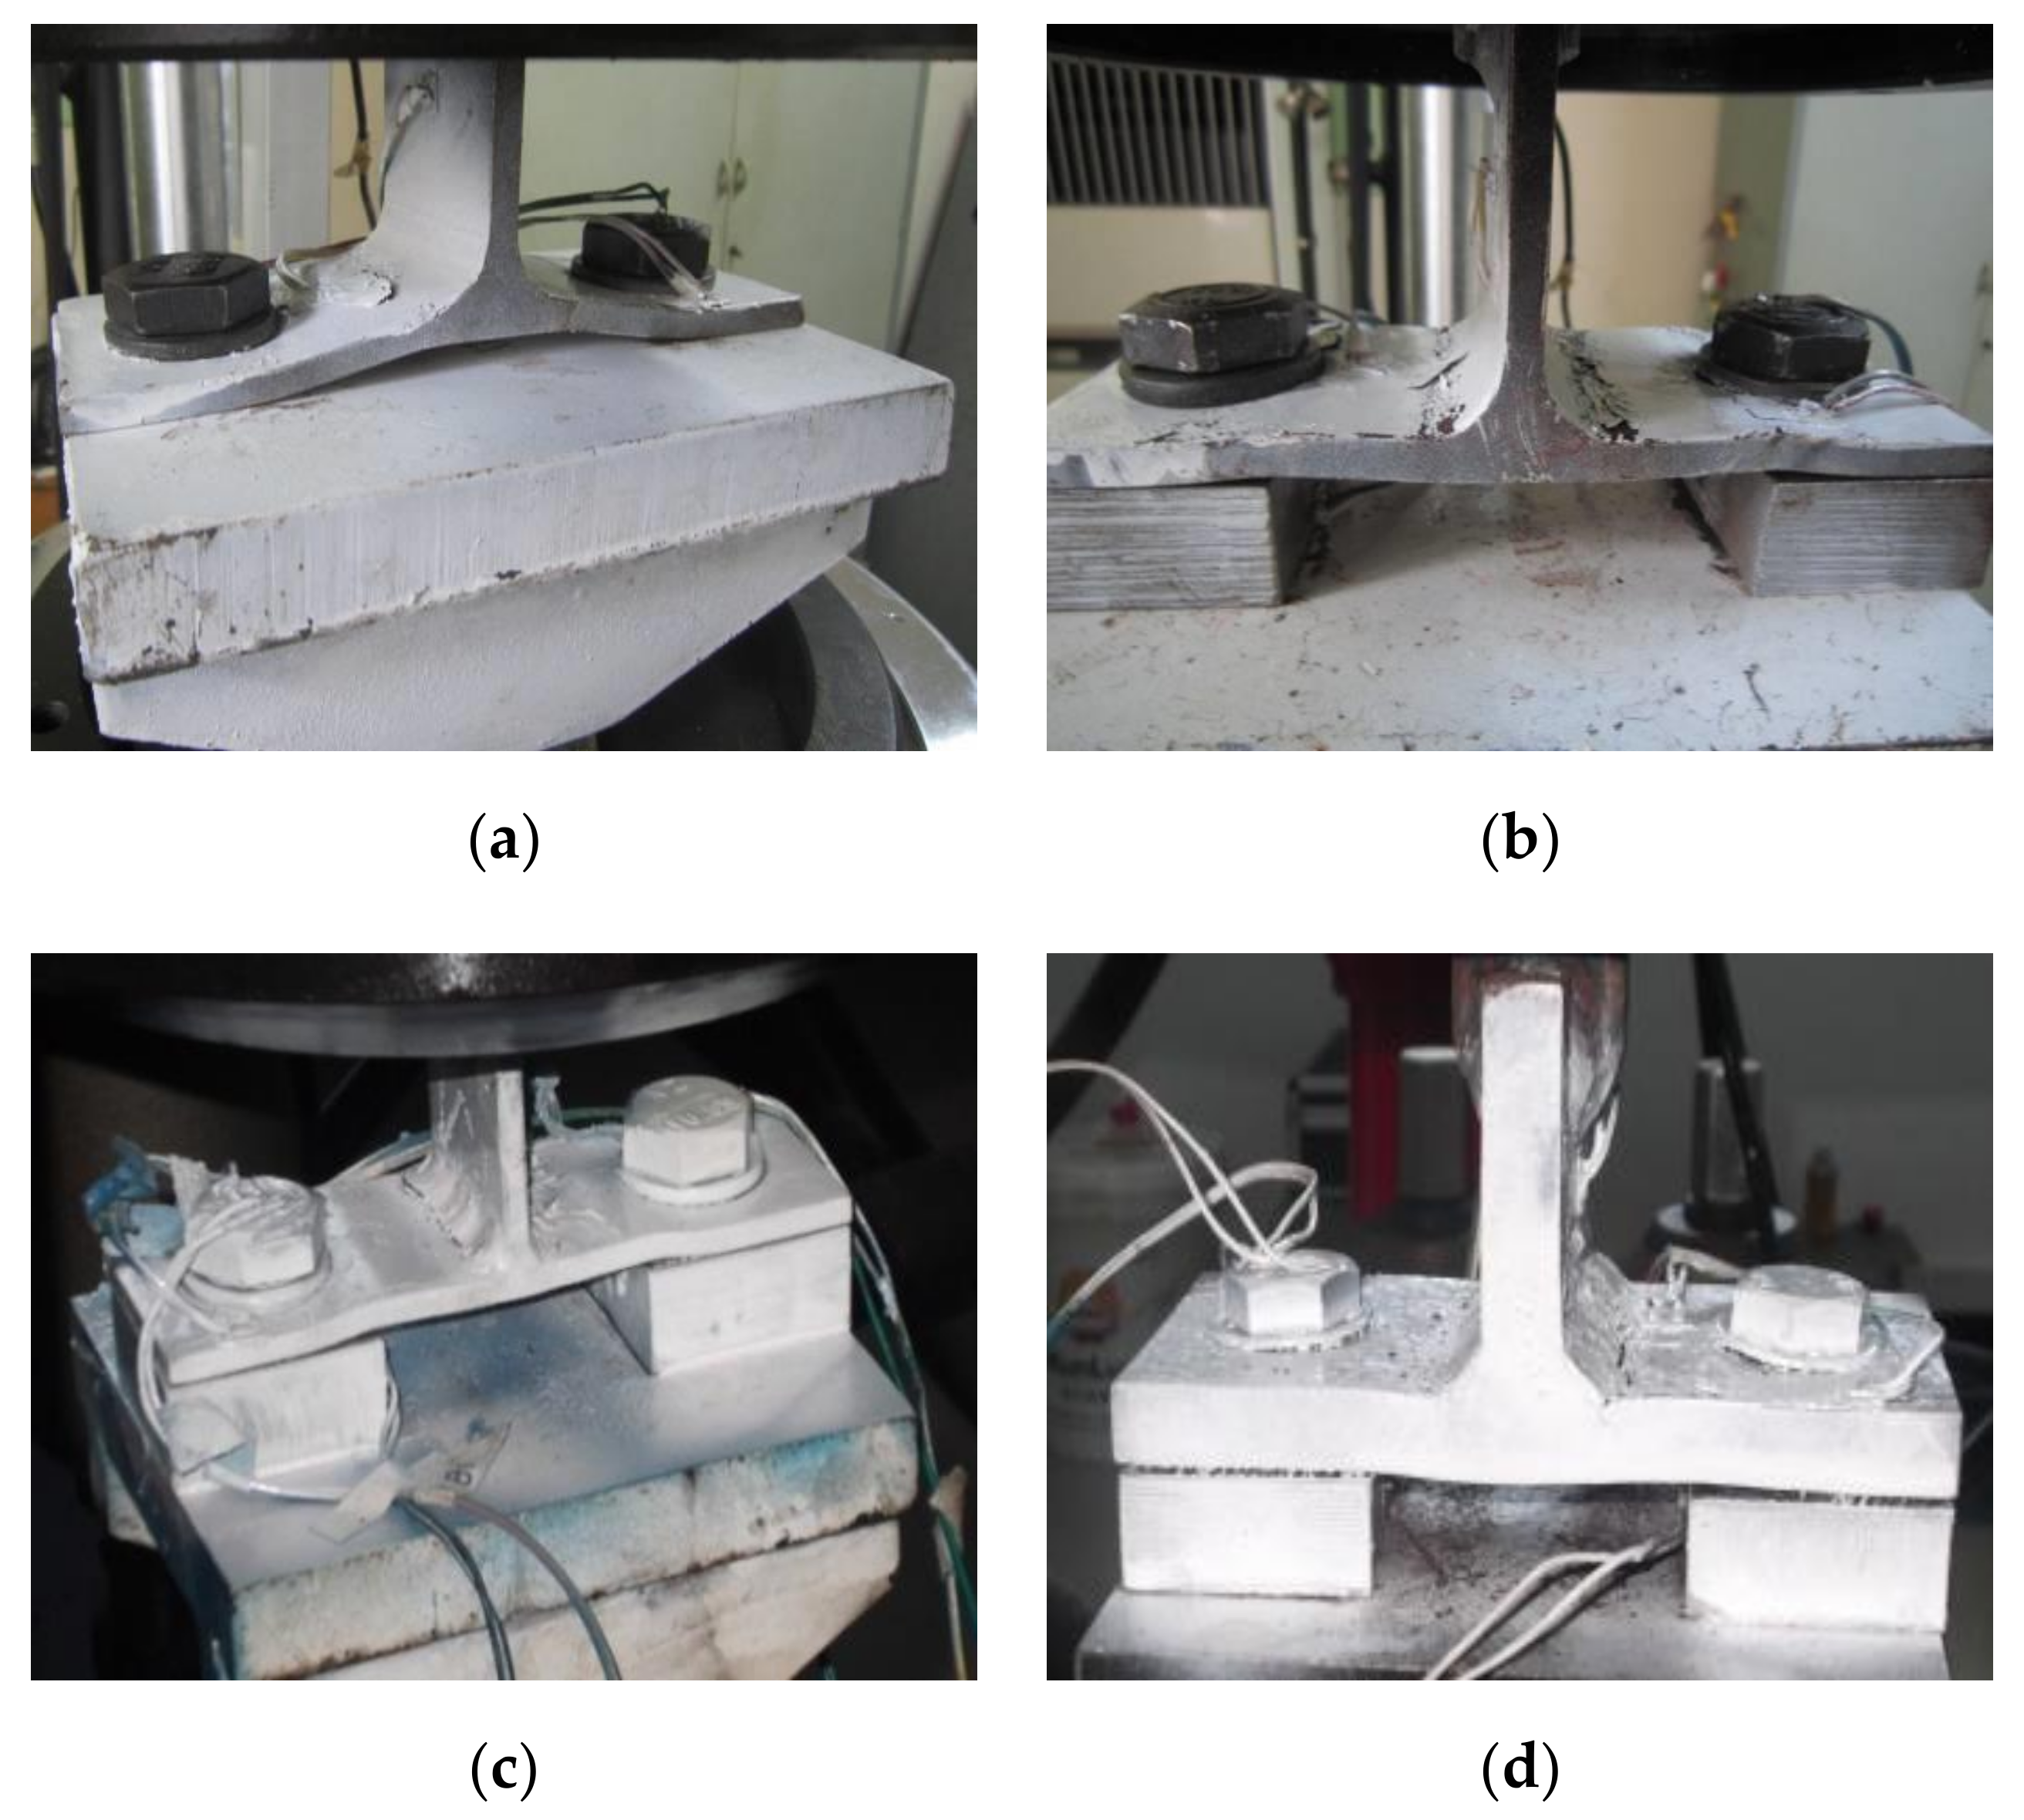
For evaluating the dissipative capacities of the T-stub connections with inserted plates and investigating the optimum width of plates, a total of 11 specimens were tested under the low-cycle loading conditions. The states of four representative specimens after loading are given in Figure 9. The deformation of the traditional specimen TC-P-50-0-H was limited when subjected to compression, and the main yielding was located at the flange-to-web connection, where cracks could be clearly identified, although no other obvious failure could be detected (see Figure 9a).
All other specimens in group TC and WA demonstrated the bidirectional deformation of tension and compression, and experienced uplift or depression alternately under hysteretic loads, which can be confirmed by the wave deformation on each flange and through the cracks adjacent to the flange-to-web connections that gradually emerged (see Figure 9b,c). At the end of the loading, specimens finally fractured at the flange-to-web connections, due to the expansion and propagation of cracks. Further, the bulge of flange sections above the inner side of the plates and the hollow of flange sections perpendicular to the bolt centerline pointed out the other two locations of plastic hinges. It was found that there was only a minor abrasion on the inside of the bolt hole, with no necking observed in the bolts, and that the inserted plates remained in good condition by disassembling specimens. In contrast, the cracks on the flange-to-web connections in group WB were conspicuous, but the overall deformation of the flange sections was far less obvious than that of specimens in the other two groups. There was almost no shaped wave and only an insignificant convex or concave on the flange surface. The high-strength bolts showed a necking phenomenon in the thread section, which can be concluded by the clear gap between the flange and the inserted plates seen in Figure 9d.
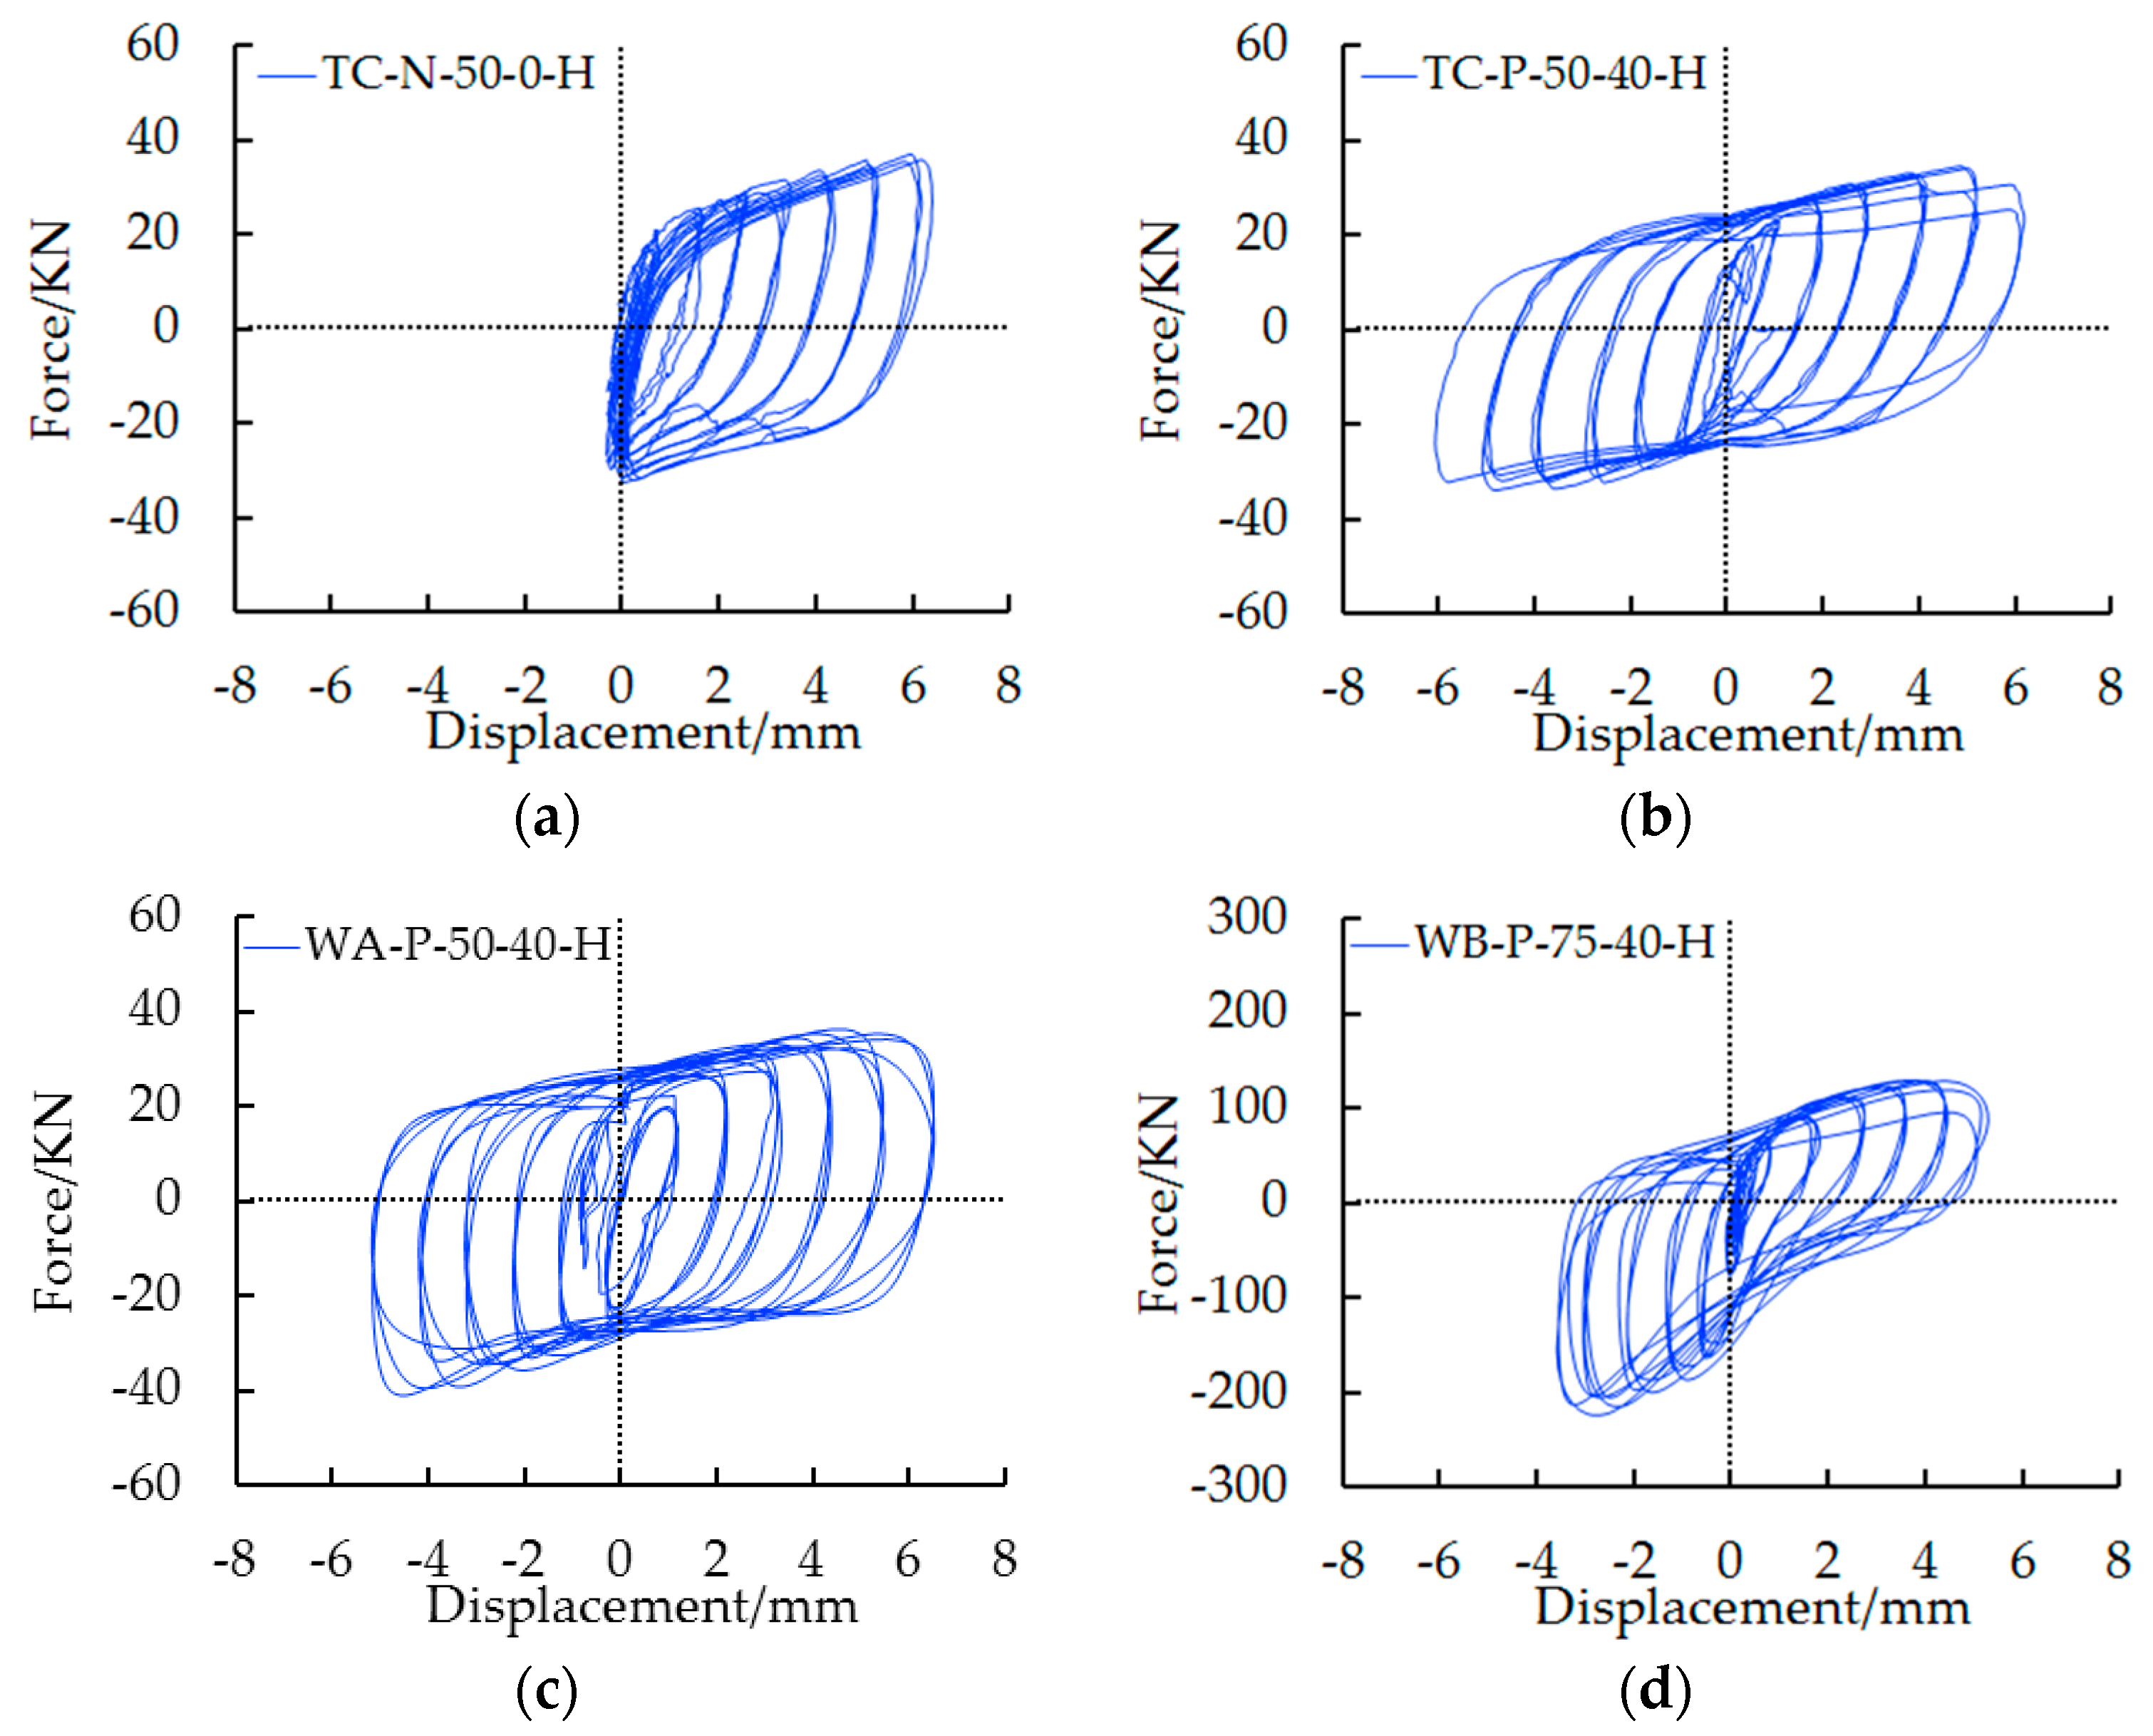
The force-deformation hysteretic curves obtained from four representative specimens are depicted in Figure 10. The traditional specimen TC-P-50-0-H dissipated energy only under tensile force, as shown in Figure 10a, while the other specimens with inserted plates were capable of dissipating energy in two directions. Moreover, the load bearing capacity and stiffness of all innovative specimens were relatively higher when subjected to a compressive direction relatively higher than those under tensile one.
The hysteresis loops of specimen TC-P-50-40-H in Figure 10b and specimen WA-P-50-40-H in Figure 10c were full and stable, generally belonging to a classical fusiform curve. Neither showed a pinch effect with the increment of cycles. Furthermore, the hysteresis loops of the former were less plump than those of latter, indicating specimens made of welding had a better overall elastoplastic performance. The other loops of specimens in groups TC and WA had lots of details that cannot be listed and were also stable, demonstrating a superior performance except for specimen WA-P-50-52-H, in which a clear pinching phenomenon was identified due to the excessively wide plates.
Figure 10d shows that specimen WB-P-75-40-H had inferior hysteresis loops with a pinch phenomenon in the middle (also called a “bow-shaped curve”). In this study, that was attributed to the detachment of the T-stub flange and inserted plates, which was caused by the bolt shrinkage failure during cyclic loading. The hysteresis loops of other specimens in group WB were not full either, and specimen WB-P-75-52-H in particular suffered a serious pinch effect. Overall, when the width of inserted plates was within 46 mm, the elastic-plastic performance and energy consumption capacity of specimens could be significantly enhanced as expected, but when it continued to increase to 52 mm, exceeding the reasonable range of plate width, the reverse effect of hindering energy consumption occurred. Since plates that are too wide limit the deformation space of flange, this is equivalent to the traditional T-stub connection without plates being inserted.
4.3.2. Energy Dissipation Capacity
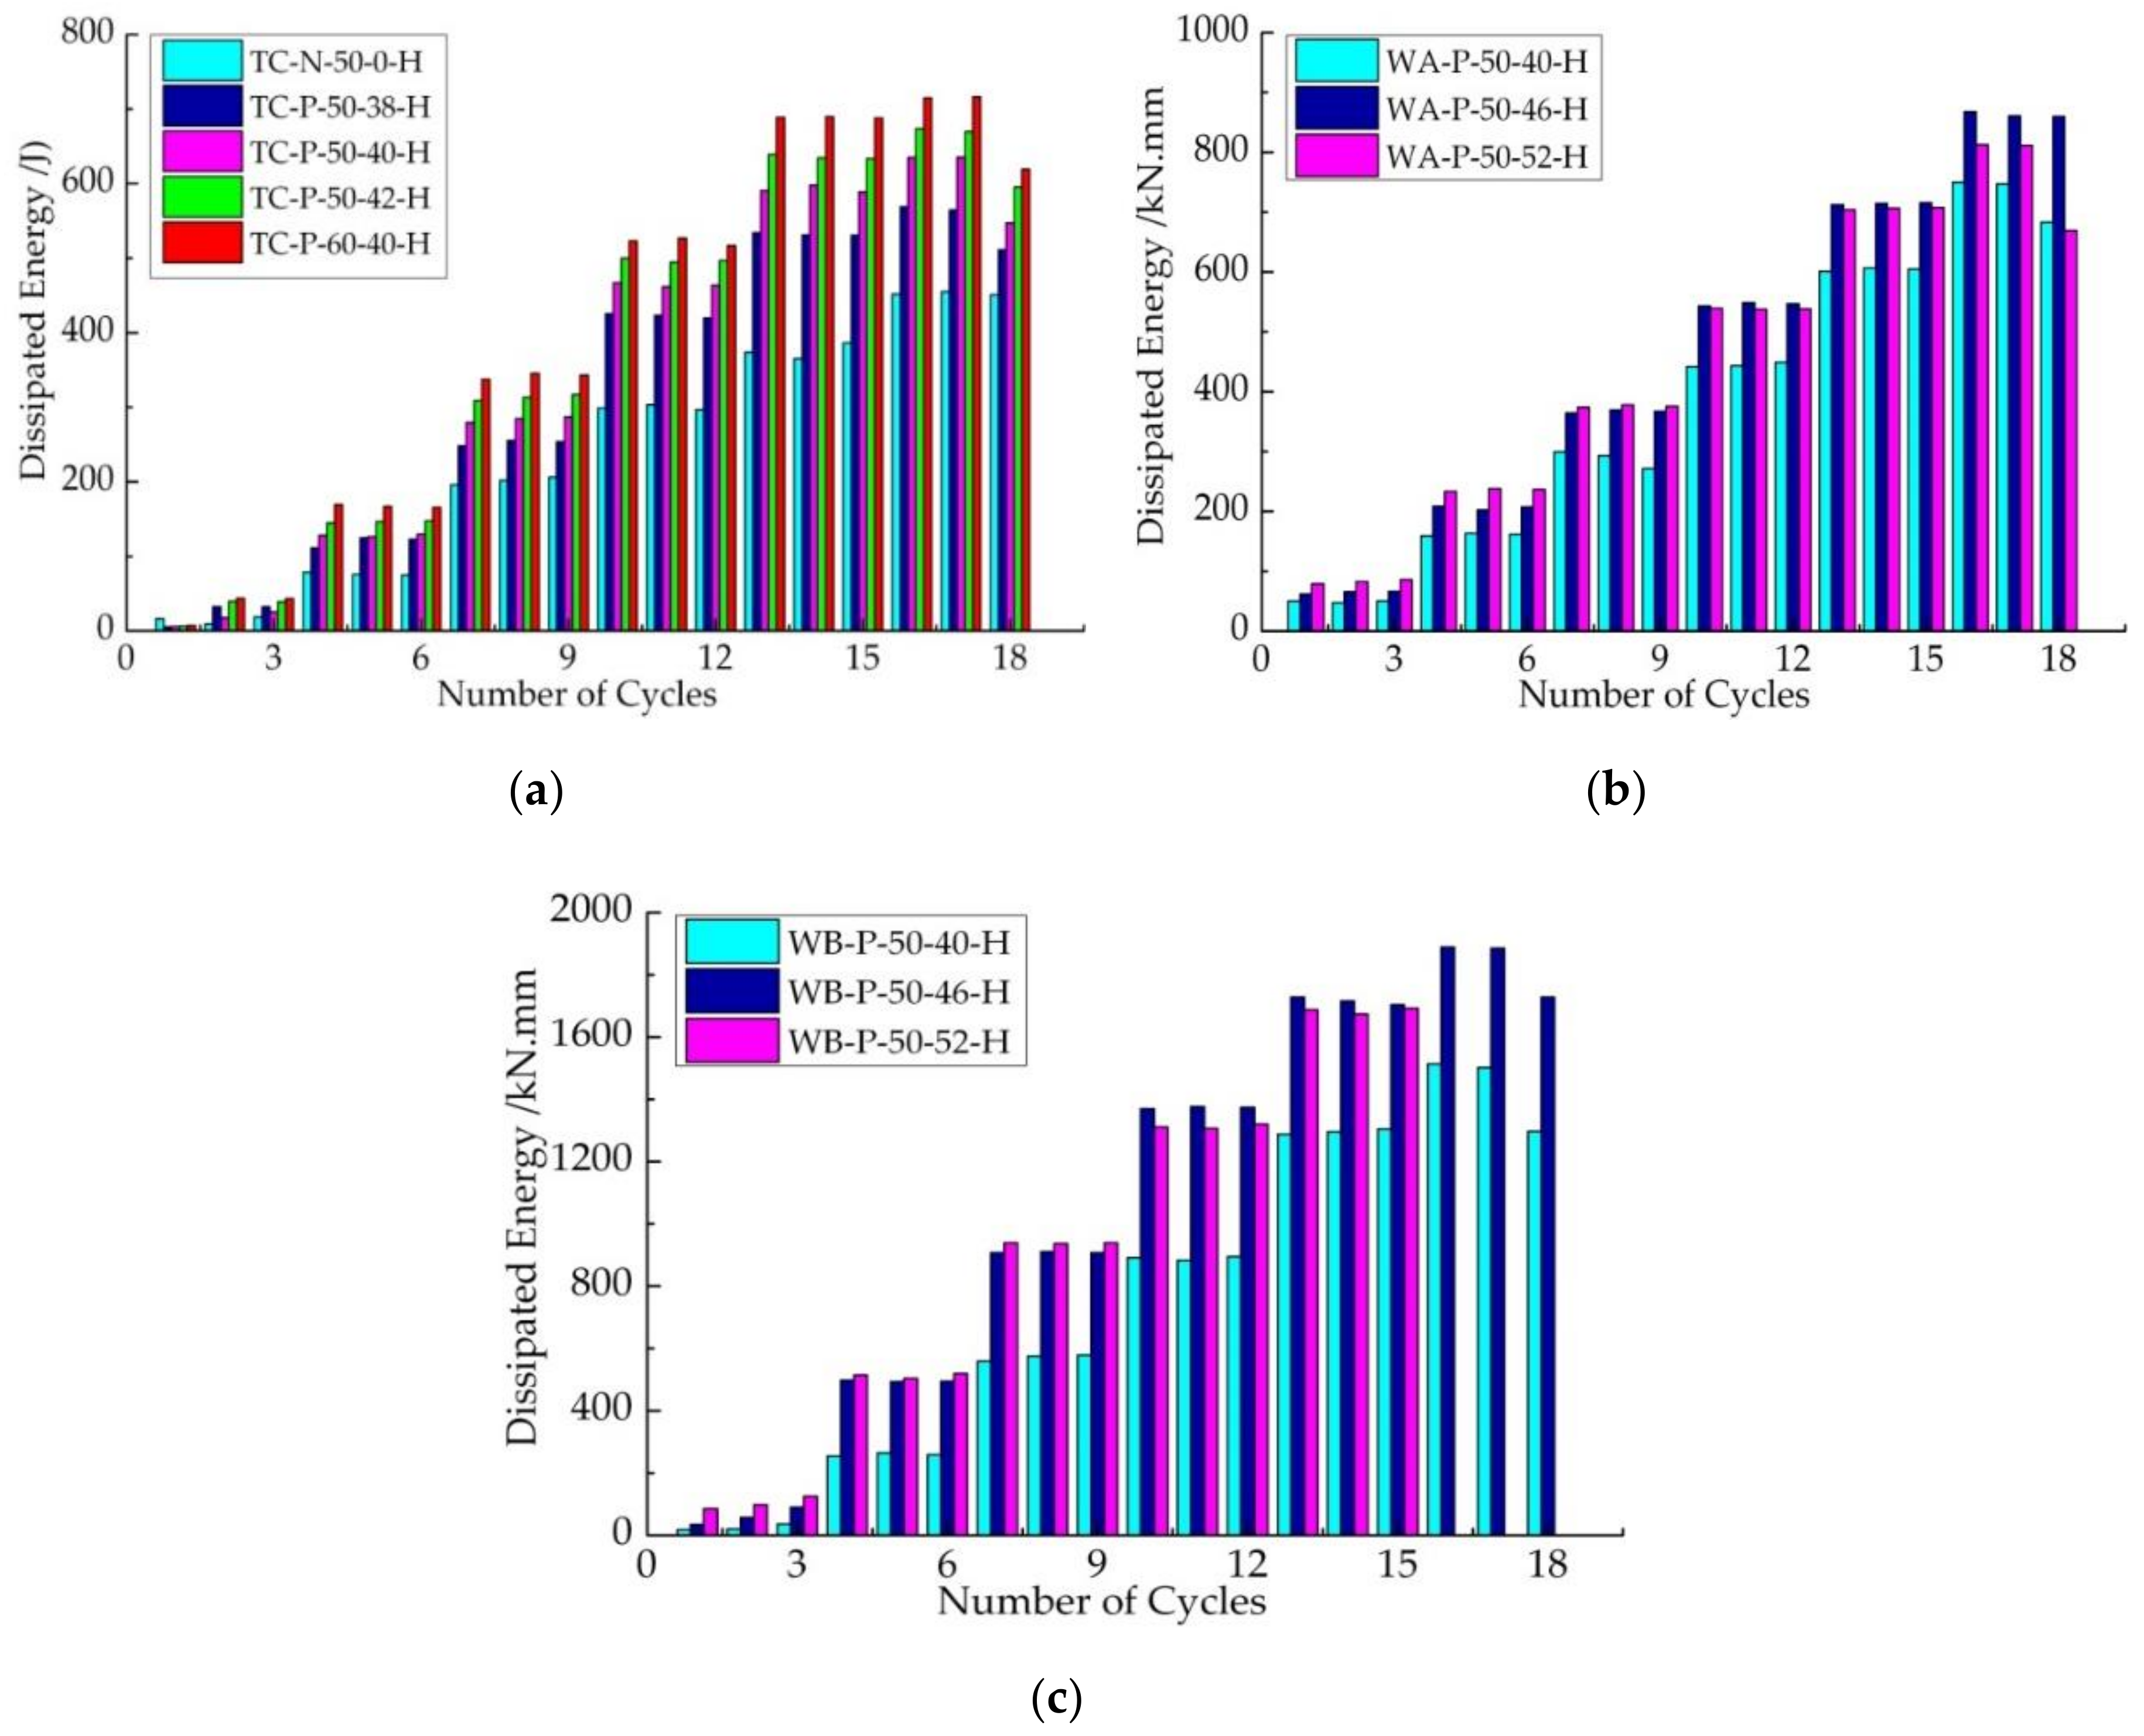
In order to further probe into the influence of existent plates and their widths, as well as the length of flange on the energy dissipation capacity of specimens, energy dissipated in each cycle was estimated by determining the area surrounding each loop, as illustrated in Figure 11.
According to Figure 11a, the average energies consumed by specimens TC-P-50-38-H, TC-P-50-40-H and TC-P-50-42-H were about 1.35, 1.5 and 1.65 times as much as specimen TC-N-50-0-H, further confirming that the addition of plates can effectively strengthen the energy dissipation capacity, mainly thanks to the deformation space available under compression. As a plate’s width grows from 38 to 42 mm, the energy consumed increases steadily. For every 2-mm increase in width, the energy consumption rises by about 10%. With reference to specimen TC-P-50-40-H and specimen TC-P-60-40-H, the 10-mm growth in length of flange resulted in an increase of about 16% in energy dissipation capacity. Therefore, an increase of flange length by 10 mm was more effective than a 2-mm plate width when comparing average energy dissipation among specimens TC-P-50-40-H, TC-P-60-40-H and TC-P-50-42-H.
Figure 11b demonstrates that the average energy dissipated by specimen WA-P-50-40-H was about 14% larger than that consumed by specimen TC-P-50-40-H; namely, under the same conditions, the overall energy dissipation performance of welded specimens was better than that of rolled specimens. This result aligns with the previous analyses of tension-displacement, compression-displacement and hysteretic curves in which the better elastic-plastic performance of welded specimens was verified.
When the width of plates rose from 40 to 46 mm, the energy dissipation capacity of specimens presented an average growth of about 23% and 38% in groups WA and WB, respectively (see Figure 11b,c). When it continued to rise to 52 mm, the growth of energy consumption capacity was been guaranteed, but declined by about 3% as a whole. It is shown that unduly wide plates seriously degrade energy dissipation performance. In addition, it should be noted that due to the excessive wide plates and too-thick T-stub flange and web, the two bolts of specimen WB-P-50-52 showed a shank necking action in the late period of cyclic loading, and failed to go through as many cycles as the other specimens did (see Figure 11c).
4.3.3. Equivalent Viscous Damping Ratio
In order to evaluate the energy dissipation capacity of specimens more scientifically and comprehensively, different coefficients for measurement have been put forward, such as the energy ductility coefficient [35], the hysteresis energy coefficient [36] and the equivalent viscous damping (EVD) ratio [37]. Here, the EVD coefficient is adopted, since it is the analysis method advocated in JGJ/T 101-2015 [34], and has gained widespread use so far [38]. Physically it represents the ratio of energy dissipated by the specimen to the energy required to generate the same displacement by an equivalent elastomer [39], depicting the degree of fullness of the hysteresis curve. The larger EVD coefficient reflects the better energy dissipation capacity of specimens. Figure 12 shows the relationship between the EVD ratio and the displacement of specimens.
Figure 12a suggests the ratios of specimens in group TC are alike at the initial stage. With the rise of displacement, the existence of inserted plates began to exert positive impacts, which led to a growth of approximately 30% in the damping coefficient relative to specimen TC-N-50-0-H. When the plate width increased from 38 to 40 mm, the damping ratio remained a small climb. Similarly, the increment of flange length also showed a slight increase of 3% in the ratio.
In comparison with Figure 12b, specimen WA-P-50-40 shared a similar changing feature of damping coefficients to specimen TC-P-50-40 during the first half of loading. After the displacement exceeded 4 mm, the ratio of specimen WA-P-50-40 was capable continuing to rise until the specimen failed, while specimen TC-P-50-40 stayed nearly unchanged. The coefficients of the former were about 25% more than the latter for second half stage alone, and increased by about 14% as a whole. This again proves that the welded specimen had better ductility and energy dissipation capacity compared with the rolled specimen.
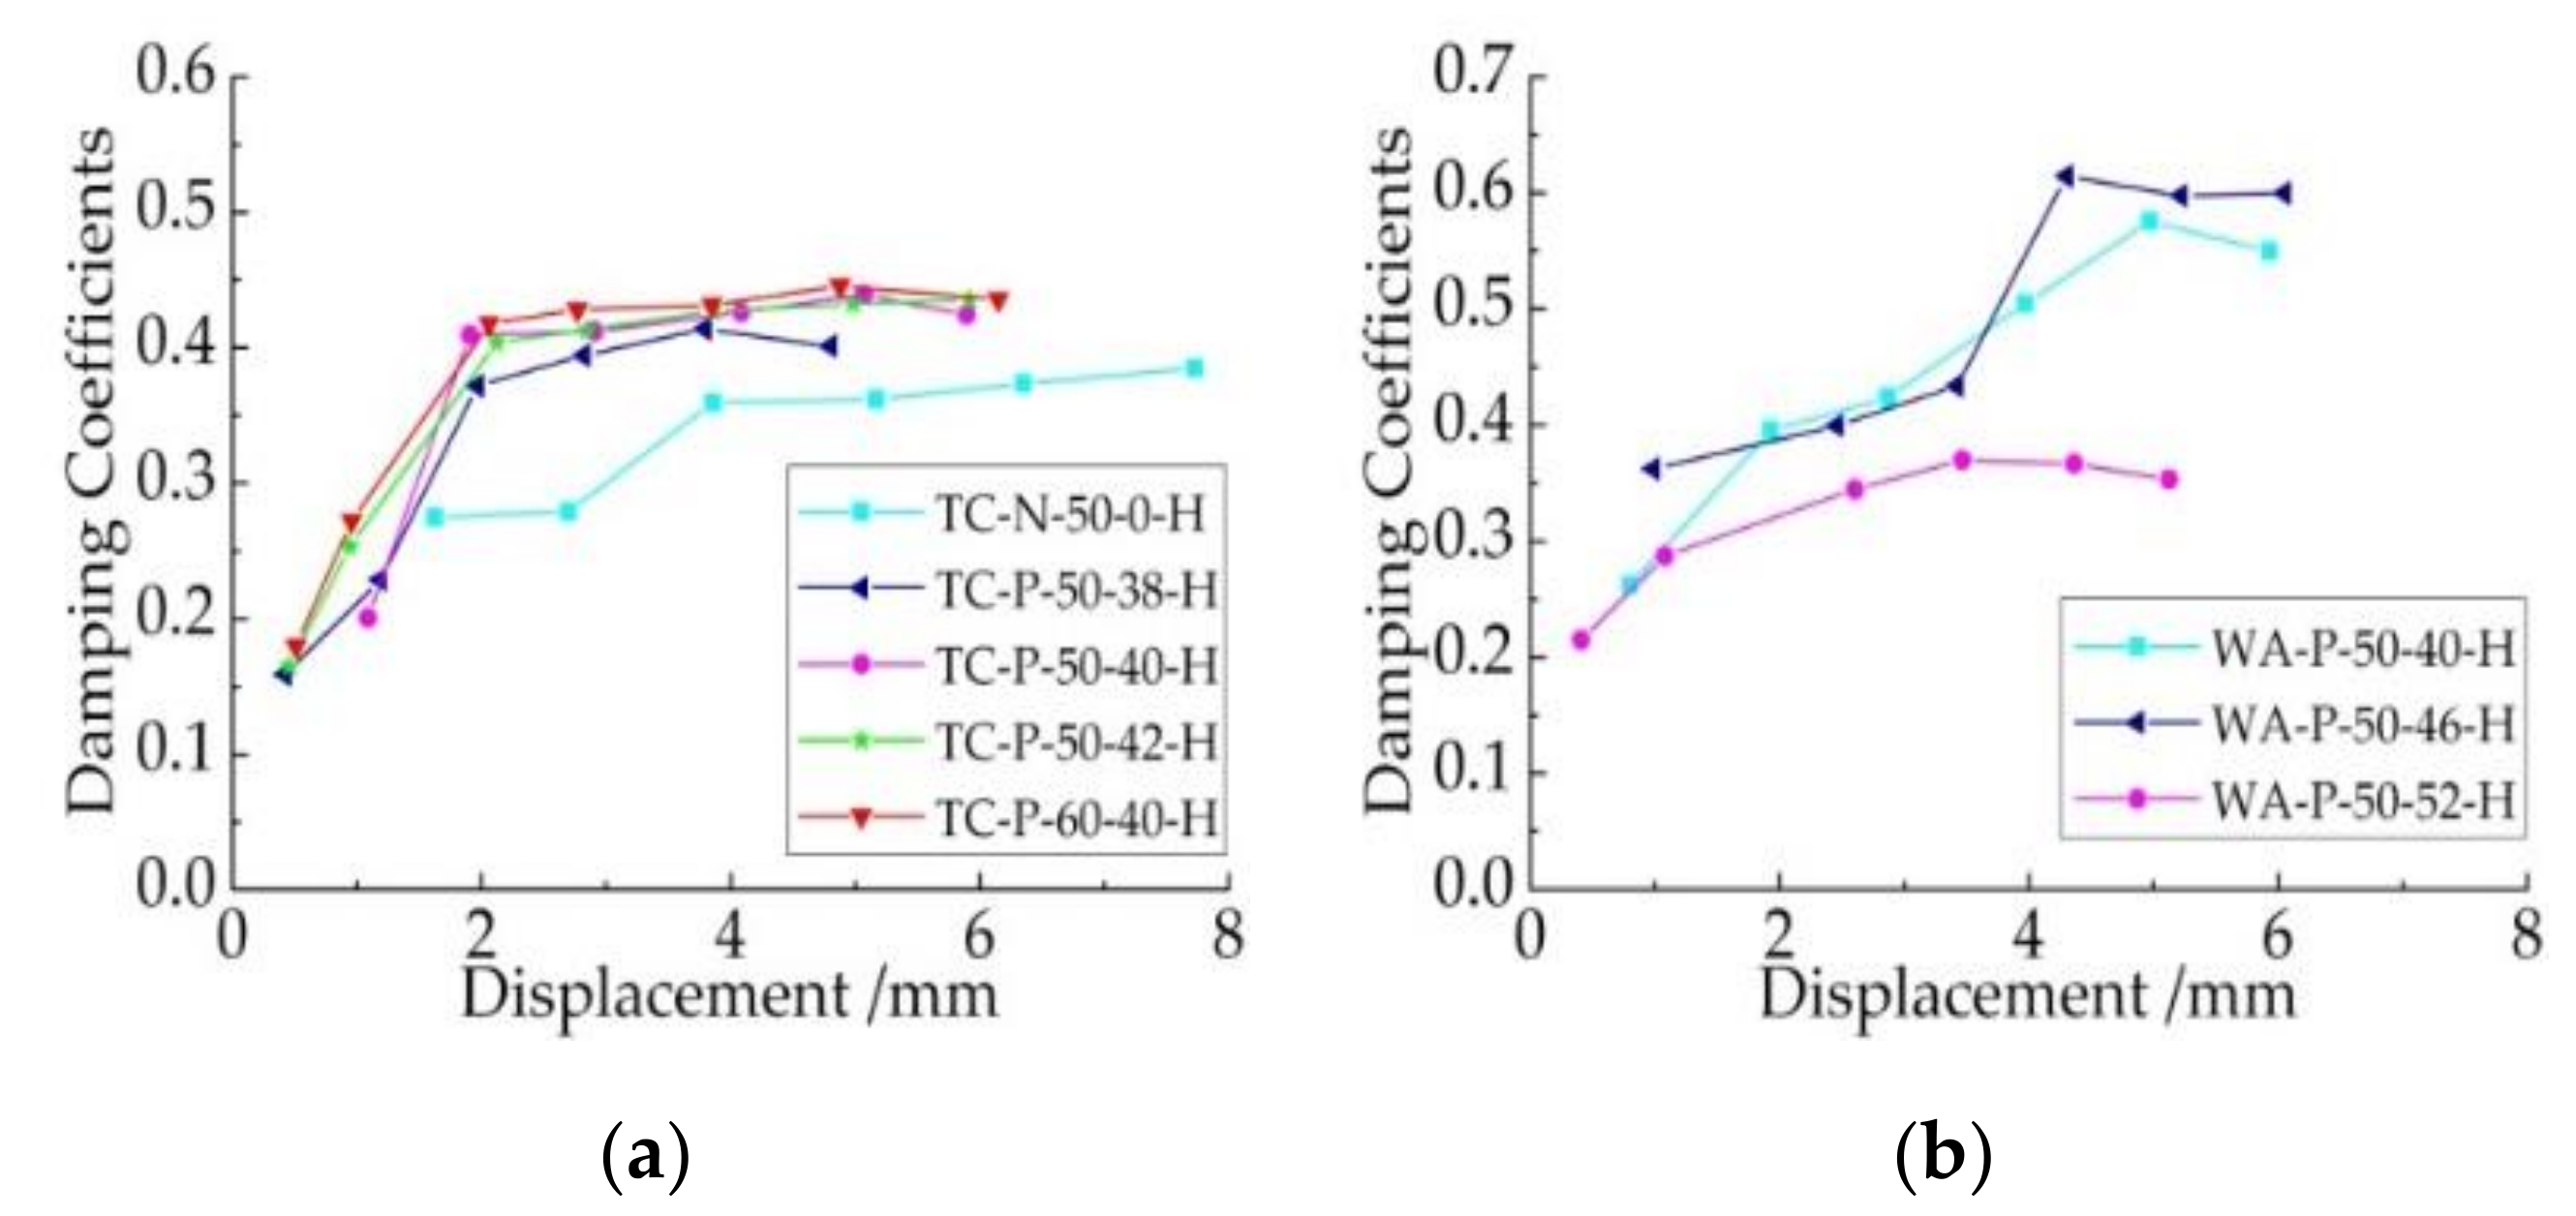
The maximum EVD ratio emerged in specimen WA-P-50-46, demonstrating a superior energy dissipation capacity that involved a rise of around 10% over that of specimen WA-P-50-40. In this case, a width of 46 mm plates refers to a ratio of Lp to W, which is equal to 31% and the ratio of n1 to m1 (equivalent to 4:3, roughly).
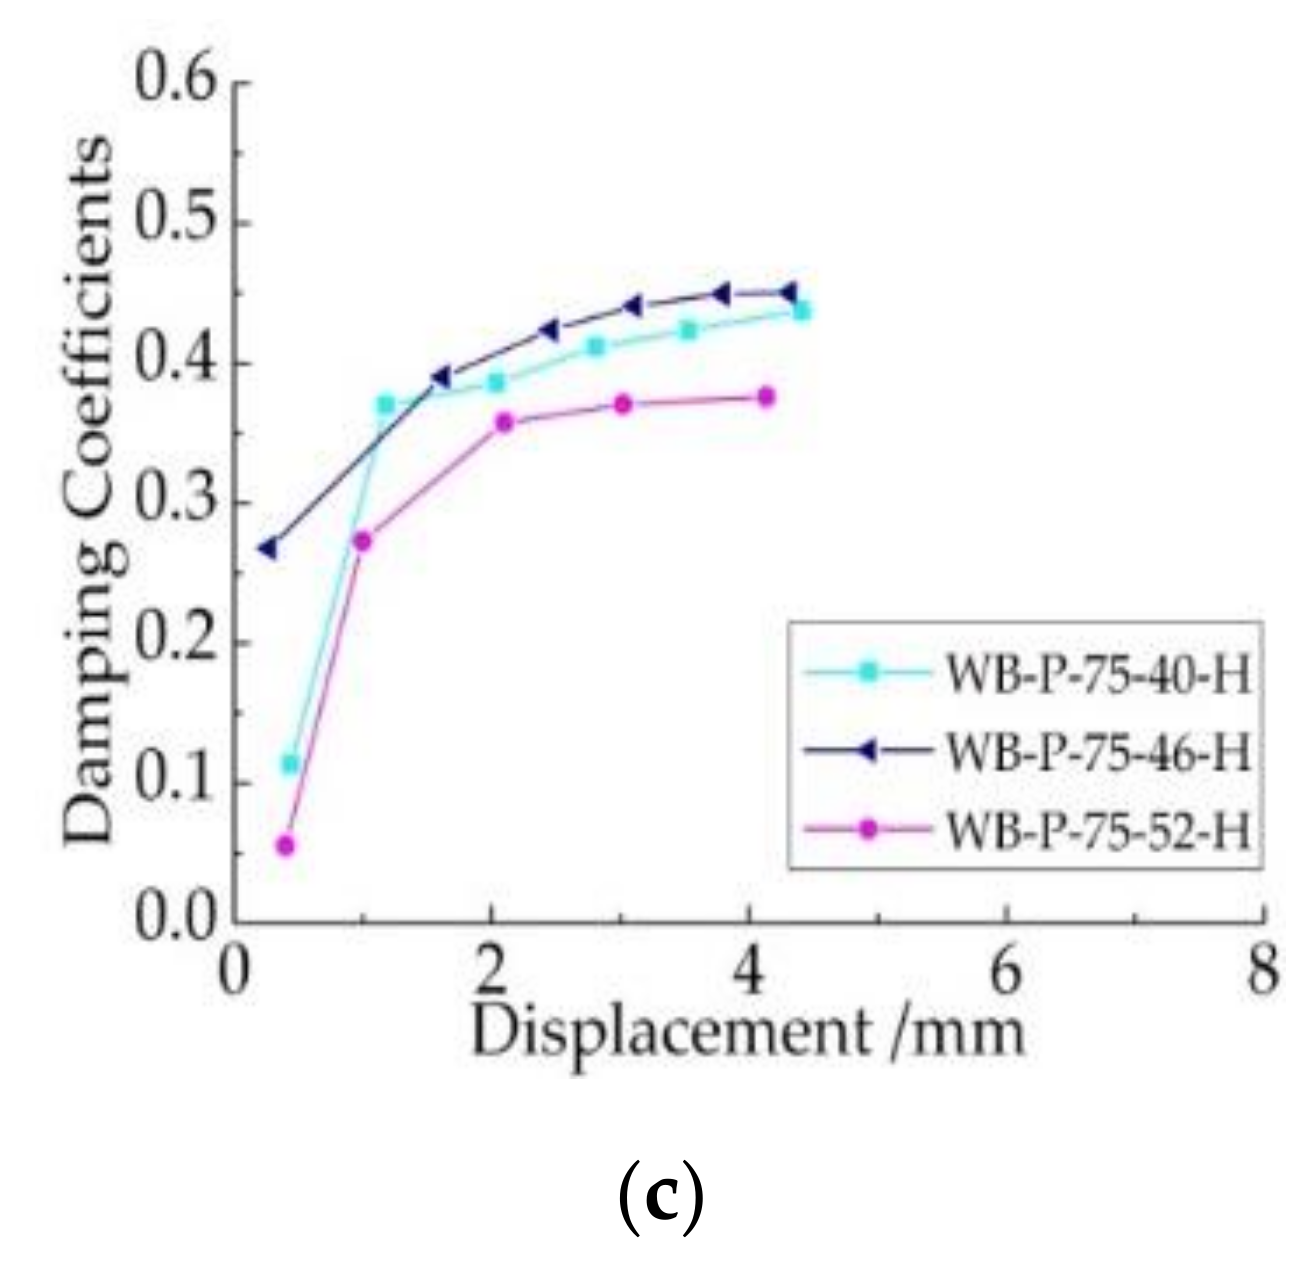
Similarly, EVD ratios of specimen WB-P-75-46 grew by 6% over those of specimen WB-P-75-40 in general (see Figure 12c). However, specimen WB-P-75-52 showed inferior ratios throughout the whole stage. Within the group WB, a 46-mm plate width was best, whereas a 52-mm width was worst in terms of energy dissipation capacity. The ratios in specimens of group WB were not as large as those in group WA on the whole. The reason for this can be attributed to the noticeable pinch action of their hysteresis loops. As a result, discussion of the best plate width is not necessary for group WB, and related practical design is not recommended.
5. Discussion
This study provides an experimental and theoretical basis for a new steel T-stub connection design, but there are deficiencies that need to be improved. The solution of directly inserting two plates against the column cannot thoroughly ease the retrofitting difficulty. In fact, the detaching the dissipater from beam-column joint deserves more attention. At the same time, the mechanic model fails to consider weld strength and the local buckling of special specimens with a thick flange and wide plates, which may cause deviations in bearing capacity and failure mode prediction. The optimal plate width should be based on extensive and elaborately designed parameter analysis using more comprehensive criteria.
Reliable finite element analysis (FEA) models will be built to trace the precise strengths and stiffness contributions of components, the local deformations and damages, the contact force distributions and so on, to optimize proposal.
6. Conclusions
This study focused on the energy dissipation capacity of T-stub connections of semi-rigid steel beam-column joints. A new T-stub connection with two plates being inserted between T-stub flange and column flange is put forward. To fully understand its mechanical performance, the corresponding compressive mechanical model was figured out, then three groups of 30 specimens with distinctive configurations were analyzed through axial and cyclic loading experiments, and the following conclusions were drawn:
- (1)
- The proposal regarding the insertion of two rectangular plates beneath the T-stub flange to promote the mechanical properties of the component is feasible.
- (2)
- The two failure modes of new T-stub connections under tension in the test are identical to those explored in previous studies, as expected. Meanwhile, the two compressive failure modes from tests conformed to the mechanical model this study set up. The first mechanism featured plastic hinges forming a flange-web connection with the flange above the inner sides of two plates, while the second involved plastic deformation occurring at the flange-web connection, as well as two bolts.
- (3)
- The existence of two plates did not substantially strengthen the tensile properties, but effectively elevated the compressive strength, stiffness and ductility of the specimens. Furthermore, the compressive forces obtained through the tests agreed well with the formulas presented in terms of compression bearing capacity.
- (4)
- The hysteresis loops of specimens designed according to the Type 1 failure mode were plump and stable, while those based on the Type 2 failure mode revealed a pinched effect, as did the specimens with a plate width exceeding 46 mm.
- (5)
- The T-stub connections fabricated by means of welding surpassed those from hot rolled steel sections in terms of rigidity and ductility performance, with the overall energy consumed by former capable of rising by about 14% compared with the latter.
- (6)
- An average of 50% improvement on energy dissipation capacity can be expected after the two plates are assembled. An increase of 16% energy dissipation capacity is possible for each 10 mm increment in flange length. The energy dissipation capacity also increased by 10% and 23% for every 2 or 6 mm growth in plate width, respectively, up to 46 mm in total.
- (7)
- The geometric relationship matching the optimal width of the plates herein refers to the plate width roughly taking up 31% of flange width; in this case, the ratio of distance between the inside of the plates and the bolt centerline to the distance between the bolt centerline and the flange-web connection was about 4:3.
Author Contributions
Conceptualization, Z.W.; methodology, X.Z.; Data curation, X.Z.; Conceived and designed the experiments, X.Z.; Performed the experiments, X.Z.; Analyzed the data, X.Z.; Contributed reagents/materials/analysis tools, Z.W.; Writing, X.Z. All authors have read and agreed to the published version of the manuscript.
Funding
This research has been supported by National Natural Science Foundation of China, grant number 51008081.
Acknowledgments
The authors would like to acknowledge Fujian Academy of Building Research, for laboratory and technical support.
Conflicts of Interest
The authors declare no conflict of interest.
References
- Miller, D.K. Lessons learned from the Northridge earthquake. Eng. Struct. 1998, 20, 249–260. [Google Scholar] [CrossRef]
- Nakashima, M.; Inoue, K.; Tada, M. Classification of Damage to Steel Building Observed in the 1995 Hyogoken-Nanbu Earthquake. Eng. Struct. 1998, 20, 271–281. [Google Scholar] [CrossRef]
- Suita, K.; Tamura, T.; Morita, S.; Nakashima, M.; Engelhardt, M.D. Plastic rotation capacity of steel beam-to-column connections using a reduced beam section and no weld access hole design. J. Struct. Constr. Eng. 1999, 526, 177–184. [Google Scholar] [CrossRef]
- Sang, H.O.; Young, J.K.; Tae, S.M. Cyclic performance of existing moment connections in steel retrofitted with a reduced beam section and bottom flange reinforcements. Can. J. Civ. Eng. 2007, 34, 199–209. [Google Scholar]
- Yu, Y.S.; Wang, Y. Experimental study on mechanical properties of steel frame beam flange weakened joints. Eng. Mech. 2009, 26, 168–175. [Google Scholar]
- Engelhardt, M.D.; Sabot, T.A. Seismic-resistant steel moment connections: Developments since the 1994 Northridge earthquake. Prog. Struct. Eng. Mater. 1997, 1, 68–77. [Google Scholar] [CrossRef]
- Chen, J.; Su, M.Z.; Shen, L. Experimental study on the hysteretic behavior of steel structure welded flange plate strengthened beam column rigid connection. J. Archit. Struct. 2007, 28, 1–7. [Google Scholar]
- Shi, Y.J.; Li, Z.F.; Chen, H. Experimental study on seismic behavior of new type beam column joints of high-rise steel frame. J. Build. Struct. 2002, 23, 2–7. [Google Scholar]
- Yao, Y.; Chu, Y.P. Analysis on the Mechanical Properties of Connections on Cold-Formed Square Steel Column and Beam. Adv. Mater. Res. 2011, 163, 676–680. [Google Scholar] [CrossRef]
- Jia, L.G. Experimental study of the behavior of beam-column connections of cellular steel frames under low-cyclic reversed loading. China Civ. Eng. J. 2012, 45, 61–68. [Google Scholar]
- Su, C.S.; Wook, D.K. Structural Performance of Composite Joints using Bent Studs. Int. J. Steel Struct. 2010, 10, 1–13. [Google Scholar]
- Popov, E.P.; Takhirov, S.M. Bolted large seismic steel beam-to-column connections Part 1: Experimental study. Eng. Struct. 2002, 24, 1523–1534. [Google Scholar] [CrossRef]
- Takhirov, S.M.; Popov, E.P. Bolted large seismic steel beam-to-column connections Part 2: Numerical nonlinear analysis. Eng. Struct. 2002, 24, 1535–1545. [Google Scholar] [CrossRef]
- Young, J.K.; Sang, H.O. Effect of the moment transfer efficiency of a beam web on deformation capacity at box column-to-beam connections. Eng. Struct. 2007, 63, 24–36. [Google Scholar]
- Li, W.L.; Hao, J.P.; Wang, L.Q.; Chen, H.Y. Experimental and analytical study on stiffness of beam-to-column minor axis top- and-seat angle connection in steel frames. J. Build. Struct. 2008, 29, 125–131. [Google Scholar]
- Benavent, C.A. Influence of hysteretic dampers on the seismic response of reinforced concrete wide beam–column connections. Eng. Struct. 2006, 28, 580–592. [Google Scholar] [CrossRef]
- Koetaka, Y.; Chusilp, P.; Zhang, Z. Mechanical property of beam-to-column moment connections with hysteretic dampers for column weak axis. Eng. Struct. 2005, 27, 109–117. [Google Scholar] [CrossRef]
- Sang, H.O.; Young, J.K.; Hong, S.R. Seismic performance of steel structures with slit dampers. Eng. Struct. 2009, 31, 1997–2008. [Google Scholar]
- Latour, M.; Rizzano, G. Experimental behavior and mechanical modeling of dissipative T-stub connections. J. Struct. Eng. 2012, 138, 170–181. [Google Scholar] [CrossRef]
- Yang, J.G.; Lee, H.D. Method for increasing the energy dissipation capacity of T-stubn connections. Int. J. Steel Struct. 2015, 15, 595–603. [Google Scholar] [CrossRef]
- Latour, M.; Piluso, V.; Rizzano, G. Free from damage beam-to-column joints: Testing and design of DST connections with friction pads. Eng. Struct. 2015, 85, 219–233. [Google Scholar] [CrossRef]
- Latour, M.; Piluso, V.; Rizzano, G. Experimental analysis of beam-to-column joints equipped with sprayed aluminum friction dampers. J. Constr. Steel Res. 2018, 146, 33–48. [Google Scholar] [CrossRef]
- Latour, M.; D’Aniello, M.; Zimbru, M.; Rizzano, G.; Piluso, V.; Landolfo, R. Removable friction dampers for low-damage steel beam-to-column joints. Soil Dyn. Earthq. Eng. 2018, 115, 66–81. [Google Scholar] [CrossRef]
- Wu, Z.Q.; Jiang, S.F.; Yan, H.; Su, J.Q. New steel beam-top-column connection structure. Util. Model. Pat. 2010, 201020181041.2. [Google Scholar]
- Faella, C.; Piluso, V.; Rizzano, G. Experimental analysis of bolted connections: Snug versus preloaded bolts. J. Struct. Eng. 1998, 124, 765–774. [Google Scholar] [CrossRef]
- Faella, C.; Piluso, V.; Rizzano, G. Structural Steel Semi-Rigid Connections: Theory, Design and Software; CRC Press: Boca Raton, FL, USA, 2000; pp. 206–317. [Google Scholar]
- Bernuzzi, C.; Cordova, B. Structural Steel Design to Eurocode 3 and AISC Specifications. Costr. Met. 2016, 68, 110–121. [Google Scholar]
- Eurocode C E N 3. Design of Steel Structures Part 1–8, Design of Joints; BS EN 1993-1-8; European Committee for Standardization (CEN): Brussels, Belgium, 2005. [Google Scholar]
- National Standards of the People’s Republic of China. Standard for Design of Steel Structures; GB 50017-2017; Ministry of Housing and Urban-rural Development (MOHURD): Beijing, China, 2017.
- National Standards of the People’s Republic of China. High Strength Bolts with Large Hexagon Head for Steel Structures; GB-T 1228-2006; Standardization Administration: Beijing, China, 2006. [Google Scholar]
- National Standards of the People’s Republic of China. Steel and Steel Products—Location and Preparation of Samples and Test Pieces for Mechanical Testing; GB-T 2975-2018; Standardization Administration: Beijing, China, 2018. [Google Scholar]
- National Standards of the People’s Republic of China. Metallic Materials—Tensile Testing at Ambient Temperature; GB-T 228-2002; Standardization Administration: Beijing, China, 2002. [Google Scholar]
- D’Aniello, M.; Cassiano, D.; Landolfo, R. Monotonic and cyclic inelastic tensile response of European preloadable gr10.9 bolt assemblies. J. Constr. Steel Res. 2016, 124, 77–90. [Google Scholar] [CrossRef]
- National Standards of the People’s Republic of China. Specification for Seismic Test of Buildings; JGJ/T 101-2015; Ministry of Housing and Urban-Rural Development (MOHURD): Beijing, China, 2015.
- Wang, Q.F.; Zheng, J.K.; Zhou, B. Study on seismic behavior of HRBF500 RC column based on hysteretic energy. Civ. Eng. J. 2013, 46, 22–28. [Google Scholar]
- Liu, Y.; Liu, W.; Yang, Q. Study and application of elasto-plastic energy spectrum model for long-period structure. J. Build. Struct. 2014, 35, 15–22. [Google Scholar]
- Augusto, H.; Castro, J.M.; Rebelo, C.; da Silva, L.S. Ductility-equivalent viscous damping relationships for beam-to-column partial-strength steel joints. J. Earthq. Eng. 2017, 9, 810–836. [Google Scholar] [CrossRef]
- Zhang, D.F.; Zhao, J.H.; He, S.H. Cyclic testing of concrete-filled double-skin steel tubular column to steel beam joint with RC Slab. Adv. Civ. Eng. 2018, 7126393, 1–15. [Google Scholar] [CrossRef]
- Raul, Z. Equivalent Viscous Damping Models in Displacement Based Seismic Design. Bull. Polytech. Inst. Jassy Constr. Archit. Sect. 2006, 2, 51–60. [Google Scholar]
Figure 1.
Configuration of new T-stub connections with inserted plates.

Figure 2.
Failure mechanisms of T-stub connections with inserted plates under compression, which can be categorized as: (a) Type 1 failure mode; (b) Type 2 failure mode.
Figure 2.
Failure mechanisms of T-stub connections with inserted plates under compression, which can be categorized as: (a) Type 1 failure mode; (b) Type 2 failure mode.

Figure 3.
Elevation view and cross-section of the T-stub connection with inserted plates.

Figure 4.
Failure modes of three specimens from different groups under tensile loads: (a) TC-P-50-42-T, (b) WA-P-50-46-T and (c) WB-P-75-46-T.
Figure 4.
Failure modes of three specimens from different groups under tensile loads: (a) TC-P-50-42-T, (b) WA-P-50-46-T and (c) WB-P-75-46-T.

Figure 5.
Relation curves between axial force and displacement measured in a monotonic tensile test, representing specimens in groups (a) TC, (b) WA (c) and WB.
Figure 5.
Relation curves between axial force and displacement measured in a monotonic tensile test, representing specimens in groups (a) TC, (b) WA (c) and WB.

Figure 6.
Failure modes of three specimens from different groups under compressive loads: (a) TC-P-50-40-C, (b) WA-P-50-40-C and (c) WB-P-75-40-C. (d) Bolts of WB-P-75-40-C after loading.
Figure 6.
Failure modes of three specimens from different groups under compressive loads: (a) TC-P-50-40-C, (b) WA-P-50-40-C and (c) WB-P-75-40-C. (d) Bolts of WB-P-75-40-C after loading.

Figure 7.
Relation curves between axial force and displacement measured in a monotonic compressive test, representing specimens in groups (a) TC, (b) WA and (c) WB.
Figure 7.
Relation curves between axial force and displacement measured in a monotonic compressive test, representing specimens in groups (a) TC, (b) WA and (c) WB.


Figure 8.
Definition of characteristic points.

Figure 9.
Failure modes of four representative specimens of three different groups under cyclic loads: (a) TC-P-50-0-H, (b) TC-P-50-40-H, (c) WA-P-50-40-H and (d) WB-P-75-40-H.
Figure 9.
Failure modes of four representative specimens of three different groups under cyclic loads: (a) TC-P-50-0-H, (b) TC-P-50-40-H, (c) WA-P-50-40-H and (d) WB-P-75-40-H.

Figure 10.
Relation curves between cyclic force and displacement of four representing specimens, they are (a) TC-P-50-0-H; (b) TC-P-50-40-H; (c) WA-P-50-40-H; (d) WB-P-75-40-H, coming from three groups respectively.
Figure 10.
Relation curves between cyclic force and displacement of four representing specimens, they are (a) TC-P-50-0-H; (b) TC-P-50-40-H; (c) WA-P-50-40-H; (d) WB-P-75-40-H, coming from three groups respectively.

Figure 11.
Energy dissipated by specimens at each cycle represent specimens from groups (a) TC, (b) WA and (c) WB.
Figure 11.
Energy dissipated by specimens at each cycle represent specimens from groups (a) TC, (b) WA and (c) WB.

Figure 12.
Relation curves between equivalent viscous damping (EVD) ratio and displacement for specimens in groups (a) TC, (b) WA and (c) WB.
Figure 12.
Relation curves between equivalent viscous damping (EVD) ratio and displacement for specimens in groups (a) TC, (b) WA and (c) WB.


Table 1.
Target controlling parameters in different specimens of the test.
| Specimen | No. | W | Lp | t | t0 | t1 | e1 | e2 | m | m1 | n1 | Bolt | Making | |
|---|---|---|---|---|---|---|---|---|---|---|---|---|---|---|
| /mm | Class | Method | FT | |||||||||||
| TC-N-50-0 | 2 | 50 | — | 9 | 6.5 | 11.2 | 25 | 25 | 33.95 | — | — | 10.9s | Cutting | T+H |
| TC-P-50-38 | 2 | 50 | 38 | 9 | 6.5 | 11.2 | 25 | 25 | 33.95 | 22.55 | 13 | 10.9s | Cutting | C+H |
| TC-P-50-40 | 3 | 50 | 40 | 9 | 6.5 | 11.2 | 25 | 25 | 33.95 | 20.55 | 15 | 10.9s | Cutting | T+C+H |
| TC-P-50-42 | 2 | 50 | 42 | 9 | 6.5 | 11.2 | 25 | 25 | 33.95 | 18.55 | 17 | 10.9s | Cutting | C+H |
| TC-P-60-40 | 3 | 60 | 40 | 9 | 6.5 | 11.2 | 25 | 30 | 33.95 | 20.55 | 15 | 10.9s | Cutting | T+C+H |
| WA-P-50-40 | 3 | 50 | 40 | 9 | 6.5 | 8.48 | 27 | 25 | 40.2 | 23.27 | 13 | 10.9s | Welding | T+C+H |
| WA-P-50-46 | 3 | 50 | 46 | 9 | 6.5 | 8.48 | 27 | 25 | 40.2 | 17.27 | 19 | 10.9s | Welding | T+C+H |
| WA-P-50-52 | 3 | 50 | 52 | 9 | 6.5 | 8.48 | 27 | 25 | 40.2 | 11.27 | 25 | 10.9s | Welding | T+C+H |
| WB-P-75-40 | 3 | 75 | 40 | 13 | 13 | 14.14 | 27 | 37.5 | 33.5 | 14.36 | 13 | 8.8s | Welding | T+C+H |
| WB-P-75-46 | 3 | 75 | 46 | 13 | 13 | 14.14 | 27 | 37.5 | 33.5 | 8.36 | 19 | 8.8s | Welding | T+C+H |
| WB-P-75-52 | 3 | 75 | 52 | 13 | 13 | 14.14 | 27 | 37.5 | 33.5 | 2.36 | 25 | 8.8s | Welding | T+C+H |
Table 2.
Comparison of compressive bearing capacity.
| Specimen | Py Test Results/kN | Fc,Rd Theoretical Results/kN | Difference |
|---|---|---|---|
| TC-P-50-38-C | 29.91 | 28.14 | 5.93% |
| TC-P-50-40-C | 34.12 | 32.58 | 4.50% |
| TC-P-50-42-C | 36.19 | 34.20 | 5.49% |
| TC-P-60-40-C | 38.86 | 37.05 | 4.65% |
| WA-P-50-40-C | 33.83 | 31.91 | 5.67% |
| WA-P-50-46-C | 43.84 | 43.00 | 1.91% |
| WA-P-50-52-C | 68.56 | 65.91 | 3.87% |
| WB-P-75-40-C | 202.4 | 185.02 | 8.59% |
| WB-P-75-46-C | 346.6 | 326.77 | 5.72% |
| WB-P-75-52-C | 714.62 | 766.19 | −7.22% |
© 2020 by the authors. Licensee MDPI, Basel, Switzerland. This article is an open access article distributed under the terms and conditions of the Creative Commons Attribution (CC BY) license (http://creativecommons.org/licenses/by/4.0/).
Share and Cite
MDPI and ACS Style
Zhu, X.; Wu, Z. Study on New Bolted T-Stub Connection with Inserted Plates under Axial and Cyclic Loads. Appl. Sci. 2020, 10, 2631. https://doi.org/10.3390/app10072631
AMA Style
Zhu X, Wu Z. Study on New Bolted T-Stub Connection with Inserted Plates under Axial and Cyclic Loads. Applied Sciences. 2020; 10(7):2631. https://doi.org/10.3390/app10072631
Chicago/Turabian StyleZhu, Xiaoming, and Zhaoqi Wu. 2020. "Study on New Bolted T-Stub Connection with Inserted Plates under Axial and Cyclic Loads" Applied Sciences 10, no. 7: 2631. https://doi.org/10.3390/app10072631
Note that from the first issue of 2016, this journal uses article numbers instead of page numbers. See further details here.