Article

Nannochloropsis oceanica Cultivation in Pilot-Scale Raceway Ponds—From Design to Cultivation

1
Allmicroalgae Natural Products S.A., R&D Department, Rua 25 de Abril 19, 2445-287 Pataias, Portugal
2
LEPABE—Laboratory for Process Engineering, Environment, Biotechnology and Energy, Faculty of Engineering, University of Porto, Rua Dr. Roberto Frias, 4200-465 Porto, Portugal
3
CCMAR—Centre of Marine Sciences, University of Algarve, Gambelas, 8005-139 Faro, Portugal
*
Author to whom correspondence should be addressed.
Appl. Sci. 2020, 10(5), 1725; https://doi.org/10.3390/app10051725
Submission received: 31 January 2020 / Revised: 19 February 2020 / Accepted: 20 February 2020 / Published: 3 March 2020
(This article belongs to the Special Issue Physiology and Biotechnology of Microalgae)

Abstract

:
Raceways ponds are the microalgal production systems most commonly used at industrial scale. In this work, two different raceway configurations were tested under the same processing conditions to compare their performance on the production of Nannochloropsis oceanica. Biomass productivity, biochemical composition of the produced biomass, and power requirements to operate those reactors were evaluated. Water depths of 0.20 and 0.13 m, and culture circulation velocities of 0.30 and 0.15 m s−1 were tested. A standard configuration, which had a full channel width paddlewheel, proved to be the most energy efficient, consuming less than half of the energy required by a modified configuration (had a half channel width paddlewheel). The later showed to have slightly higher productivity, not enough to offset the large difference in energetic consumption. Higher flow velocity (0.30 m s−1) led to a 1.7 g m−2 d−1 improvement of biomass productivity of the system, but it increased the energy consumption twice as compared to the 0.15 m s−1 flow velocity. The latter velocity showed to be the most productive in lipids. A water depth of 0.20 m was the most suitable option tested to cultivate microalgae, since it allowed a 54% energy saving. Therefore, a standard raceway pond using a flow velocity of 0.3 m s−1 with a 0.20 m water depth was the most efficient system for microalgal cultivation. Conversely, a flow velocity of 0.15 m s−1 was the most suitable to produce lipids.

1. Introduction

Microalgae are a diverse group of microorganisms that combine properties of higher plants with those of some prokaryotes [1,2]. They are ubiquitous, living either in aquatic (fresh and seawater) and terrestrial environments [3]. Microalgae occur as unicellular or simple colonial organisms, usually displaying rapid growth rates [4] and photosynthetic efficiencies between 9–10%, in general significantly higher than those of terrestrial plants [5,6,7]. They are key members of the biosphere, as they play an important role in the global carbon and nitrogen cycles. By using light energy to produce organic matter, algal photosynthesis contributes to around 50% of the total planetary primary production [8,9]. Cyanobacteria, previously called “blue-green algae”, are even able to fix atmospheric nitrogen (N2) into organic nitrogen and are the major contributors to global biological nitrogen fixation [10,11].
Being a biodiverse resource, microalgae can produce a wide range of value-added molecules such as proteins, lipids, carbohydrates, pigments and other compounds for various product applications [12,13]. Of these, carotenoids, phycobiliproteins, and polyunsaturated fatty acids (PUFA) such as eicosapentaenoic (EPA) and docosahexaenoic (DHA) acids are the most widely explored. Microalgae can be applied to food, feed, biofertilizer, and cosmetic industries [14]. They can also play a major role in the pharmaceutical industry as sources of novel biochemicals for the development of new drug leads to overcome the growing problem of antibiotic resistance in many bacterial pathogens [15], since some microalgae produce bioactive compounds with antibacterial activity [16]. Besides antimicrobial compounds, microalgae produce also antiprotozoal agents and anti-inflammatory, antioxidant and anticancer compounds [17]. The biomass of oleaginous microalgae is a sustainable, renewable and eco-friendly feedstock which can be a source for the production of biofuels and bioenergy [14,18]. Microalgae can even be used in wastewater treatment and its photosynthetic cultivation is one of the most promising carbon dioxide (CO2) mitigation technologies [19].
The focus on research into the genus Nannochloropsis has increased over the years [20]. These microalgae are considered to be oleaginous models because of their high lipid productivity and photosynthetic efficiency, having also a well-established genetic toolbox [21,22,23]. Several species of the genus Nannochloropsis have been successfully cultivated autotrophically at large scale due to the relatively mature technology for outdoor large-scale cultivation of these eustigmatophytes [22].
Despite their biodiversity, microalgae are still an underexploited biological resource. There are only a few long-standing companies that have been able to scale up their production of microalgal biomass in industrial facilities [12,23,24]. The economics of large scale facilities are often not favorable to short-term investment, because operational and capital costs are high and the payback is usually longer than expected [25].
Microalgae can be cultivated either in open or closed systems. Despite having several drawbacks, open systems are the most widely applied bioreactors in industrial microalgal processes, since they require lower capital and operational costs than closed systems [26]. Microalgal open production systems include circular and raceways ponds as well as cascade systems [27]. Among them, raceway ponds are the most commonly used open photobioreactor for commercial microalgal production [28]. These are shallow, hairpin-shaped, closed-loop flow channels, usually 0.15–0.30 m deep, internally lined with cement, polyvinyl chloride (PVC) or clay, with mixing and aeration provided through circulation by a rotating paddlewheel [29,30,31,32]. A straight channel velocity of at least 0.2 m s−1 is needed to ensure a velocity of 0.1 m s−1, the minimum required to prevent sedimentation of microalgal biomass in the whole raceway [33]. A 0.3 m s−1 flow velocity is the most commonly used flow velocity for biomass production [33]. The surface-to-volume ratio in raceways is always 1/pond depth. A lower depth increases the surface-to-volume ratio, improving light penetration [34]. Thus, for autotrophic growth, shallower ponds are more productive than deeper ponds [34]. However, at water depths lower than 0.15 m, a severe decrease in flow and turbulence occurs in large-scale raceways [35]. This long light path results in large areal volumes (150 L m−2) and cell concentrations of less than 0.6 g L−1, which promote the occurrence of contaminants (i.e., grazers and competing microalgae) [35]. Another problem of open systems is the low productivities obtained, due to temperature fluctuations, inefficient mixing and CO2 dispersion, light limitations and evaporation losses [29]. Typically, well-managed raceway ponds may achieve 20–25 g m−2 d−1 for short periods, while long-term productivity in large commercial raceways rarely exceeds 12-13 g m−2 d−1 [35]. López et al. [36] point out that 20 g m−2 d−1 is the threshold for the average annual productivity, which is rarely exceeded in large-scale outdoor production.
Several studies have been carried out in order to study the design of the raceway pond, with the aim of reducing the energy costs and increasing the growing efficiency of microalgae. Most of the energy losses occur at the hairpin bends. Liffman et al. [37] used computational fluid dynamics (CFD) to model different bend configurations. These authors showed that, when compared with the traditional constant-width/constant-depth bend configuration, some of the new bend configurations not only minimize the energy consumption, but also improve the mixing of the raceway ponds by depletion of low speed and stagnant regions [37]. Another CFD-based approach demonstrated that a raceway configuration with a minimum of three semicircular deflector baffles and an “island” at the end of the central divider, apart from being more energy-efficient than the standard configuration, can completely prevent the development of dead zones [32].
New design studies rely mostly on modeling and very few in actual experiments. Despite the evolution of the models and the associated technology, errors are always encountered when compared to experimental data [38,39]. In this context, this work aimed to compare the performance of two raceway ponds with different configurations based on three criteria: areal productivity, energy consumption, and the biochemical composition of biomass produced using Nannochloropsis oceanica as model microalga.

2. Materials and Methods

All experiments were performed between February 4th and July 28th of 2019 at Allmicroalgae’s facilities at Pataias, Portugal. The microalga strain, N. oceanica CCAP 849/10, was obtained ‘from Culture Collection of Algae and Protozoa and is kept at Allmicroalgae’s culture collection.

2.1. Raceways Design, Commissioning and Construction

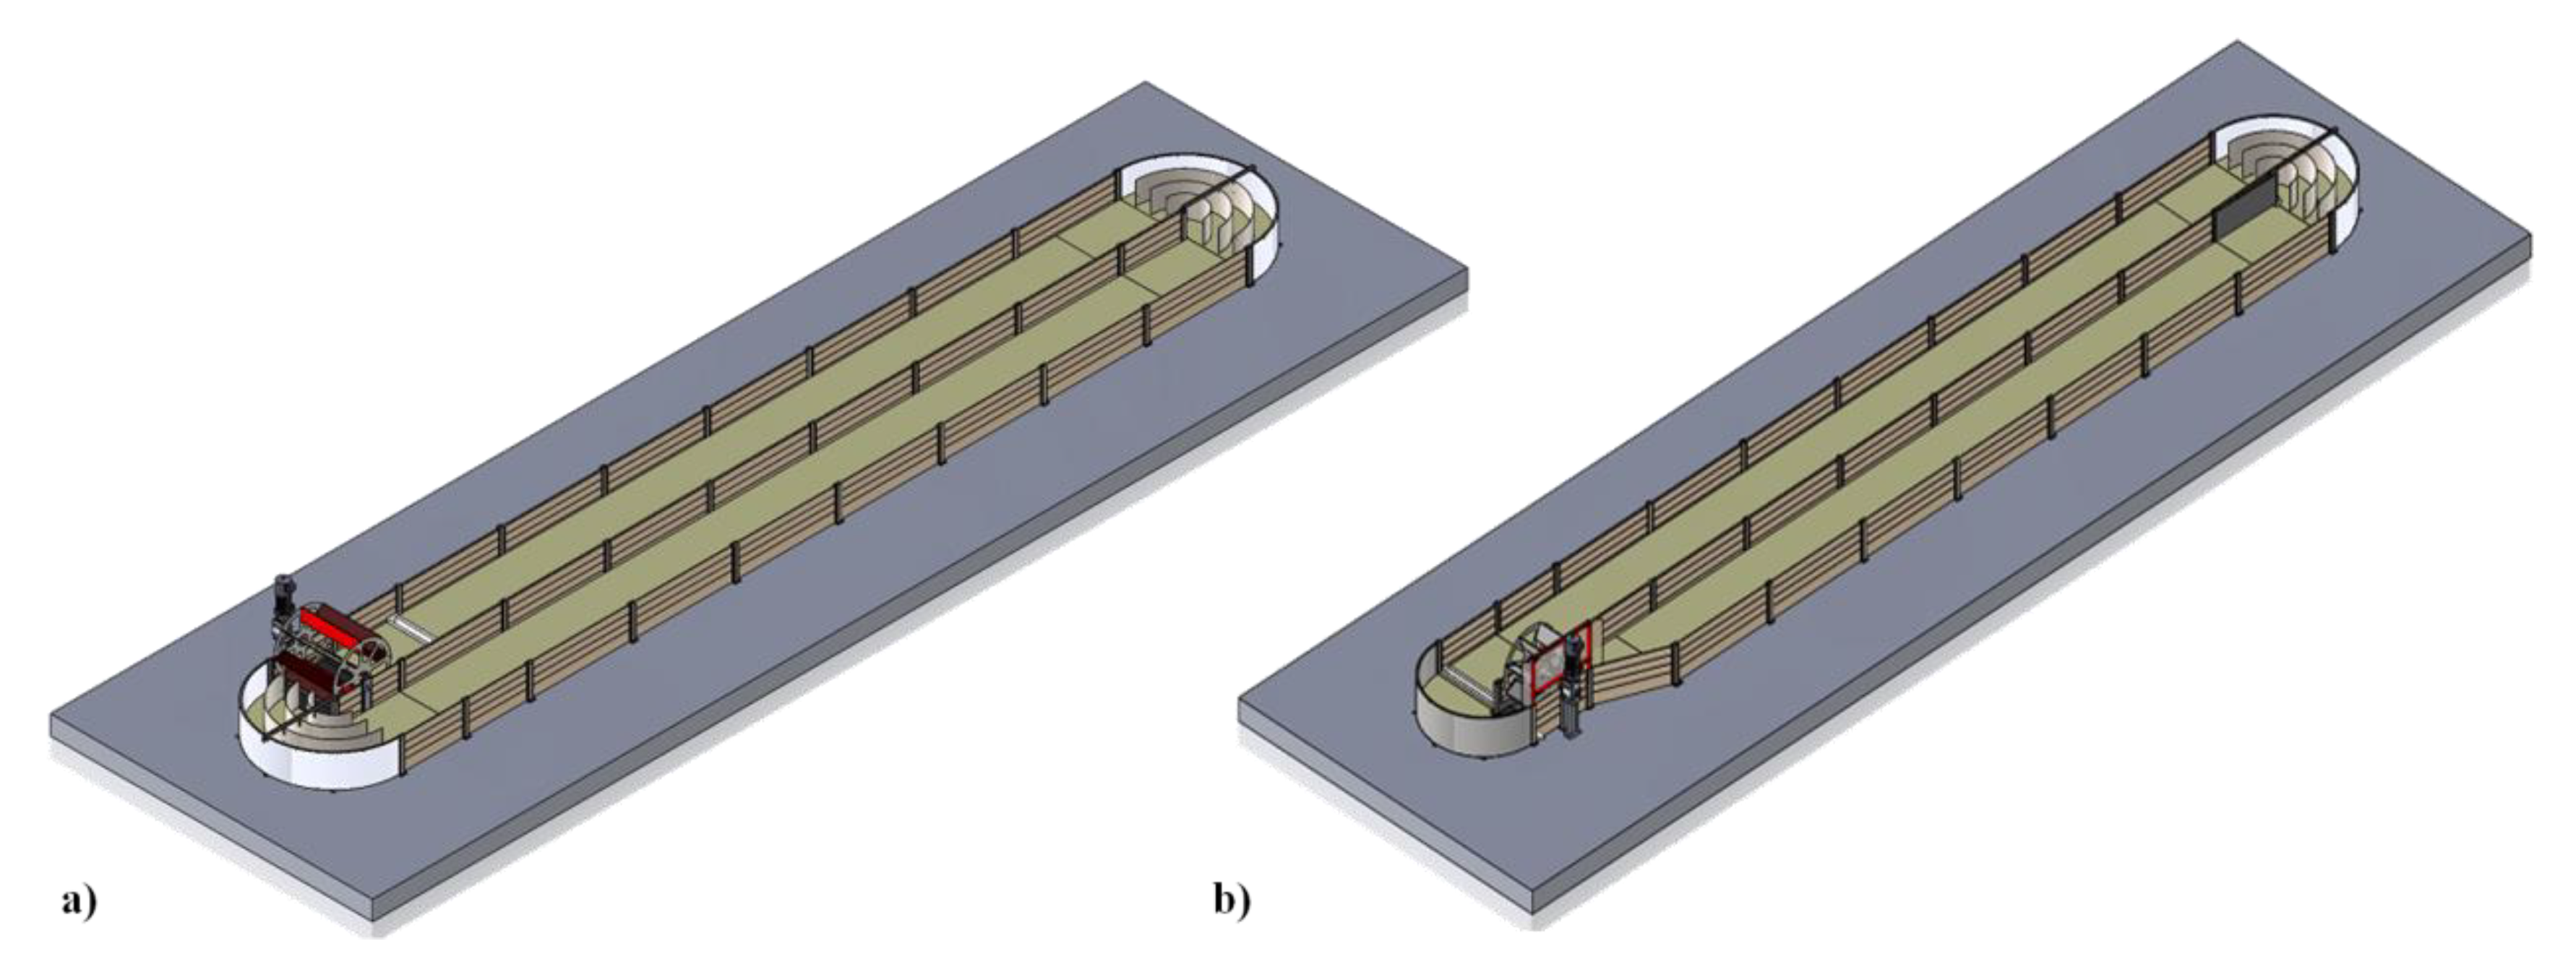
Based on the literature review and Allmicroalgae industrial experience in the growth of microalgae, two raceway pond prototypes were designed, as shown in Figure 1: one standard and one with a modified configuration. The standard raceway included the most common dimensions, configuration and construction materials reported, while the modified version considered several aspects previously reviewed from the literature and indicated as having a positive influence in the production of microalgal biomass.
The starting point was a typical raceway with two bends, as ponds with more than two bends have higher energy consumption [32]. To avoid the formation of dead zones as much as possible, three baffles were included in the circular endings of the ponds. Raceway ponds with around 28 m2 were developed. They were 15 m long, 2 m wide and 1 m channel width. The depth was fixed at 0.375 m and other structural dimensions are listed in Table 1. The mixer consisted of a single eight-flat-bladed paddlewheel installed right after one of the semicircular ends at the beginning of one of the channels.
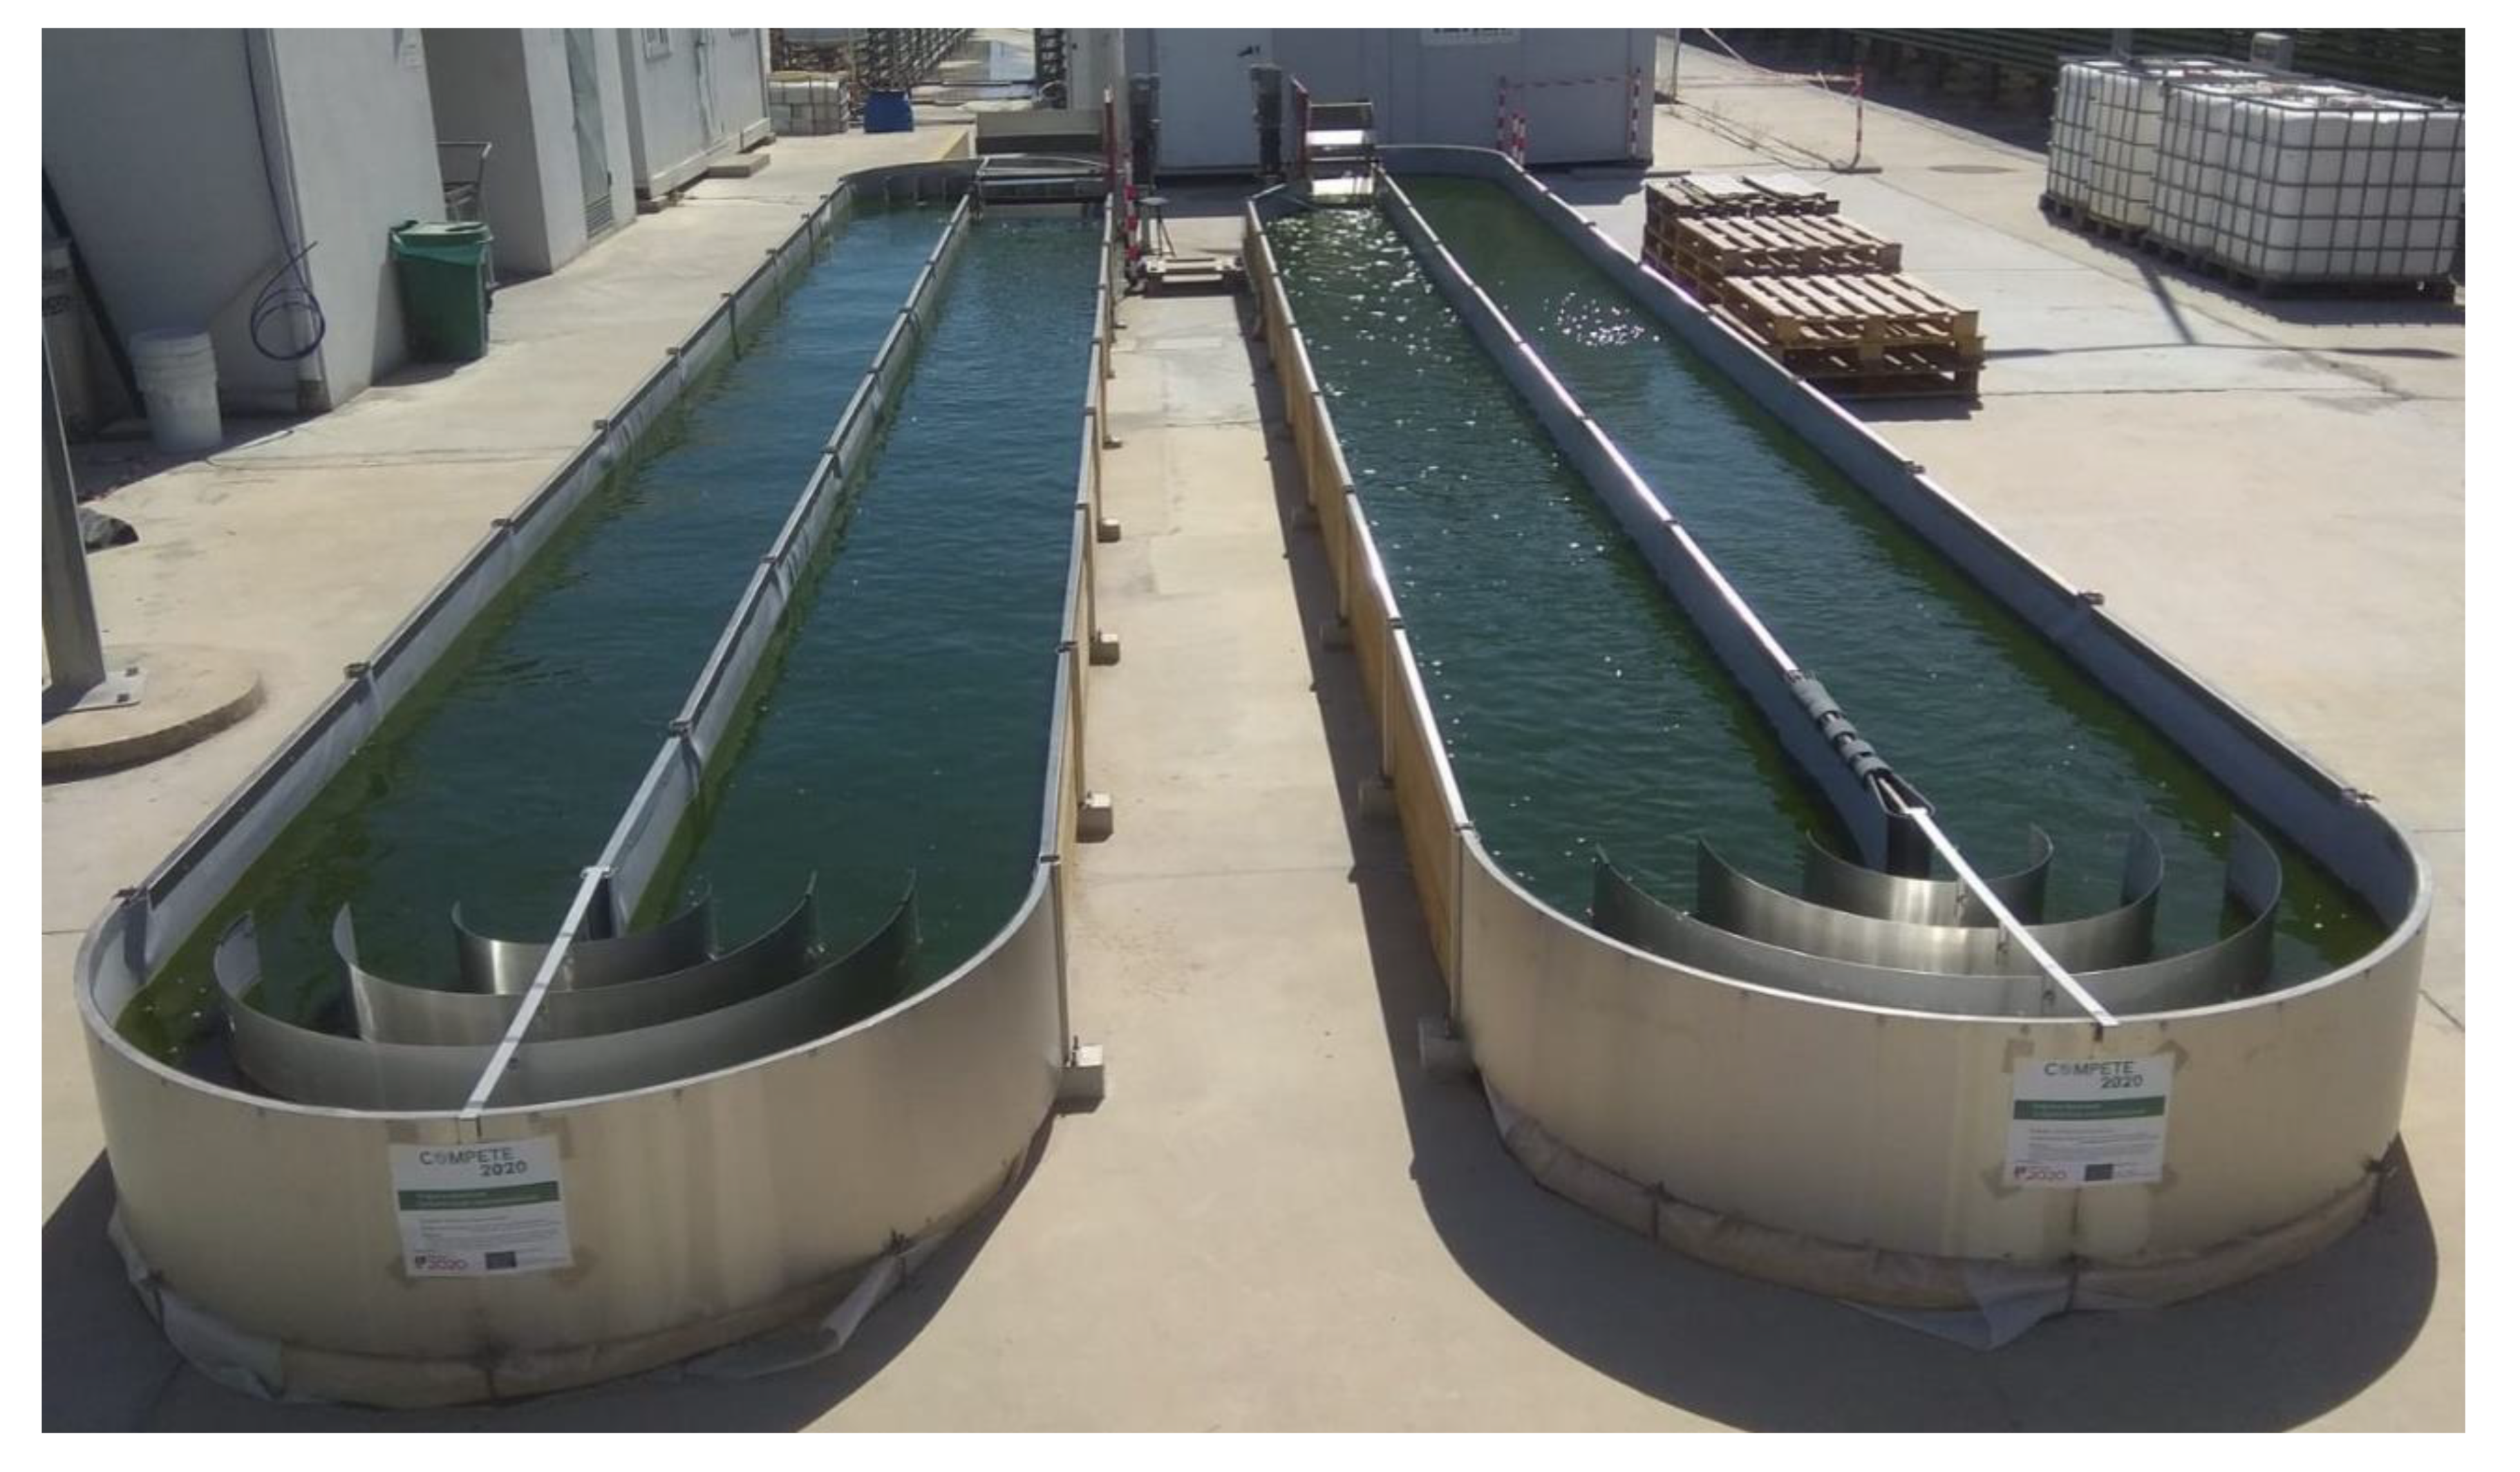
The modified raceway model included a loop-shaped end of the central divider opposite to the paddlewheel. The ‘loop’ was intended to prevent the development of dead zones in the vicinity of this end of the divider. Besides, the paddlewheel hypothesized for the modified model had a width of 0.475 m, as compared to the standard model paddlewheel which measured 0.870 m. A picture of the raceways can be seen in Figure 2. 
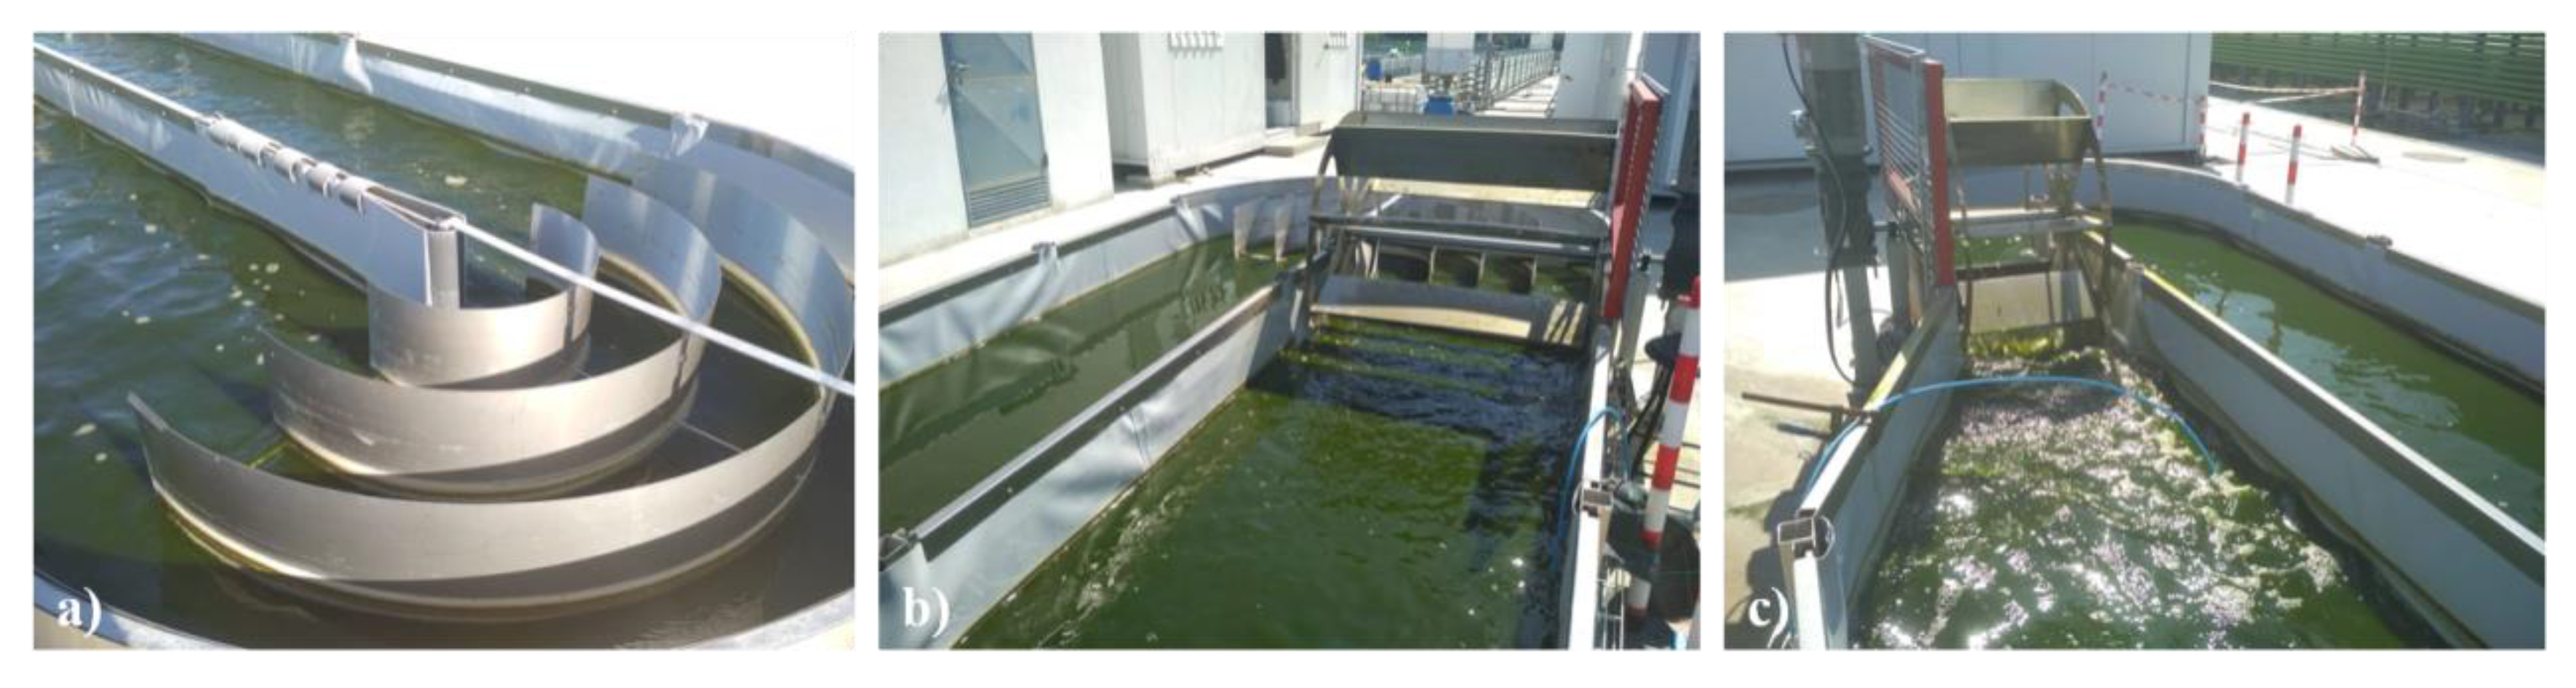
Figure 3 shows a detailed view of the modified raceway.
The raw materials used for the construction of both raceways were the same. Polyethylene film and PVC waterproofing geomembrane were used in the base of the raceways to waterproof them. The structure was supported by stone powder and stainless steel and external walls were made of treated wood.

2.2. Trials

Each trial lasted 13 days and was performed simultaneously in both raceways. N. oceanica was inoculated at a 0.3 g L−1 concentration in Allmicroalgae’s base medium, based on Guillard’s F/2 medium [40], with 30 g L−1 NaCl and 0.31 g L−1 NO3. In all experiments, a fresh inoculum sequentially scaled up, was used. Initially, the cultures were grown in 5 L flasks during 7 to 15 days. When the culture reached 1.2 g L-1, 20 × 5 L flasks of culture (100 L) were used to inoculate a single flat panel (FP), which was later divided into the other three FPs. These were used to inoculate the two raceway ponds. Throughout the assay, the culture was closely monitored. The pH was kept between 8.0–8.2, through the injection of pure CO2 to the culture. The NO3 concentration was always kept above 0.12 g L−1 and water refilled whenever it was necessary. Regular microscopic observations were performed to monitor contaminations. At the end of the assay the culture was harvested and centrifuged at 4000× g for 30 min, and the resulting biomass and supernatant were biochemically analyzed. All the assays were made in duplicate.

2.2.1. Water Depth

Two different water depths were tested, 0.20 and 0.13 m, with a flow velocity of 0.30 m s−1.

2.2.2. Flow Velocity

The flow velocity optimization trial was performed using the standard raceway. A velocity of 0.15 m s−1 was used with a 0.13 m water column.

2.3. Growth Assessment

Samples (50 mL) were taken on a daily basis and microscopic observation was performed in order to monitor contaminations, which were never above 2% of cell counts.
Optical density (OD) and dry weight (DW) were measured to follow microalgal growth. OD was performed at 540 nm using a spectrophotometer (4251/50, Zuzi, Spain). DW was determined using a 0.7 µm glass fiber filter (VWR, Portugal) in a moisture analyzer (MA 50.R, RADWAG, Poland). In order to neutralize the salt weight, the culture was washed with an equivalent volume of ammonium formate solution at 35 g L−1.
Areal biomass productivity, P (g L−1 d−1), was determined by Equation (1):
P ( g m 2 d 1 ) = ( X 2 X 1 ) V ( t 2 t 1 ) A
where X2 (g L−1) and X1 (g L−1) represented the DW times t1 (s) and t2 (s), respectively, V (m3) was the raceway volume and A (m2) the ground area occupied by the bioreactor.
Specific growth rate, µ (d−1), was expressed as a ratio between the difference final and initial logarithmic biomass concentrations (X2 and X1, respectively) and the associated time range (t2 and t1, respectively), as seen in Equation (2).
µ = l n ( X 2 ) l n ( X 1 ) t 2 t 1
Global productivity and growth rate refer to the whole assay (13 days). Maximum productivity and growth rate were calculated based on the highest values obtained daily.
The lipid production/energy consumption ratio (L/kW) was calculated through the following equation:
L / k W   =   P   ×   L   ×   A   ×   13 p
where L (%) was the lipid content, 13 days the total extension of the assay, and p the power consumption.
The photosynthetic efficiency (PE) was determined by equation 4, as previously described by Quelhas et al. (2019) [41].
P E = ( X 2 X 1 ) × V × H H V t 1 t 2 r a d × A × t
where rad (kW m−2) was the radiation that reaches the reactor, t (s) was the time between solar radiation measurement and HHV was the higher heating value, calculated based on elemental (CHN) analysis by Equation (5), as described by Callejón-Ferre et al. [42]:
H H V ( k J g 1 ) = 3.393 + 0.507 C 0.341 H + 0.067 N
A spectrophotometric analysis (Genesys 10S UV-VIS spectrophotometer (Thermo Scientific, Massachusetts, USA)) was used to measure the nitrate concentration of the medium. Samples were centrifuged for 10 min at 2000 g (MiniStar Silverline, VWR, Portugal). The OD of the sample was calculated from the difference at 220 nm and twice the value at 275 nm and compared with a calibration curve with sodium nitrate [43]. The blank solution was made with 0.1 mol L−1 of HCl.

2.4. Proximate Composition

The ash content was determined in a furnace (J. P. Selecta, Sel horn R9-L) at 550 °C for 8 h.
Total lipids were determined through a gravimetric analysis, using a previously modified method of Bligh and Dyer (1959) [44], and reported by Pereira et al. [45]. A biomass weight ranging 5–10 mg was solubilized in 0.8 mL of distilled water. A mixture of methanol (2 mL), chloroform (2 mL) and distilled water (1 mL) was used to extract the lipid fraction from the biomass [44]. After centrifugation for 10 min at 2500 g, 0.7 mL of the chloroform fraction was transferred to a pre-weighed tube. A heat treatment at 60 °C (QBD2, Grant Instruments, UK) to evaporate all the chloroform was performed and after 3 h in the desiccator, the final weight of the tube was measured in the precision balance (M5P, Sartorius, Germany).
CHN analysis was performed using a Vario el III (Vario EL, Elementar Analyser system, Germany), according to Quelhas et al. [41]. Total proteins were calculated by multiplying the nitrogen content by the standard conversion factor 6.25 [46] after CHN analysis. Carbohydrates were considered the remaining mass.

2.5. Fatty Acid Profile

Fatty acids were determined by means of its conversion to fatty acid methyl esters (FAME), according to a modified method of Lepage and Roy [47] described by Pereira et al. [48]. FAME were analyzed in a gas chromatography-mass spectrometer (GC-MS) (Bruker SCION 456/GC, SCION TQ MS). The gas chromatograph was equipped with a 30 m length column with an internal diameter of 0.25 mm and a film thickness of 0.25 µm (ZB-5MS, Phenomenex, Torrance, California, US). Helium was the carrier gas. The temperature program was 60 °C (1 min), 30 °C min−1 to 120 °C, 5 °C min−1 to 250 °C, and 20 °C min−1 to 300 °C (2 min). The total running time was 31.5 min. Injection temperature was 300 °C. Supelco® 37 Component FAME Mix (Sigma-Aldrich, Sintra, Portugal) were used as standards. After identified and quantified, the FAME profile was expressed as a relative percentage of the total fatty acids content present in the biomass.

3. Results and Discussion

3.1. Comparison of Two Different Raceway Configurations

N. oceanica growth experiments were performed under three different sets of process conditions (Table 2) in order to determine which of the two raceway configurations were the most promising in terms of productivity, product quality, and energy consumption. Growth kinetics were evaluated separately for each set of process conditions (growth curves are plotted in Supplementary information, Figure 2 and Figure 3).
The global areal productivities obtained (Table 3) were higher in the modified raceway for process conditions 1 and 2. Global specific growth rates (Table 3) were similar in both raceways for both the process conditions tested. The range of productivities achieved was half of the value achieved in a demo-scale 530 m2 raceway ponds using N. oceanica F&M-M24 strain (14 g m−2 d−1) [49]. de Vree et al. reported average areal productivity of 9.7 g m−2 d−1 for Nannochloropsis sp. CCAP 211/78 growth in a raceway pond similar to the one used during the present experiments (25.4 m2 surface area) with 0.20 m culture depth [50]. In the same study, productivity ranged from 6.2 to 14 g m−2 d−1. However, López et al. [36] reported a productivity of 6.0 ± 2.5 g m−2 d−1 for irradiation levels identical to the ones occurred during the present trials, for Nannochloropsis gaditana cultivated in raceways of 23.5 m long and 1.5 m wide channels, with a culture depth of 0.08 to 0.12 m (depending on the season) and 0.30 m s−1 circulation velocity. The same author reported considerably higher productivity (24.71 g m−2 d−1) for trials performed under higher average irradiation. In a similar experiment operating in continuous mode, 22.4 g m−2 d−1 were obtained for Nannochloropsis gaditana when grown in 7.2 m2 raceway ponds (5.0 m long and 0.6 m wide channels) with a culture depth of 0.11 m and a circulation velocity of 0.30 m s−1 [51]. Besides, 20.37 g m−2 d−1 was the average areal productivity achieved in a culture of Nannochloropsis sp. cultivated in 25,000 L (dimension of 35 m by 3.5 m) outdoor raceway ponds situated in the Qatari desert [52]. The global productivities achieved are comparable with the average annual productivity of 20 g m−2 d−1 rarely exceeded in large-scale production in outdoor raceways, since the systems are affected by factors that cannot be controlled, e.g., weather conditions [36].
The specific growth rates obtained are lower than the range of previously reported data (0.11–0.21 d−1) [53]. Nevertheless, the values reported by Baohua et al. [54] for three different N. oceanica strains grown in 8000 L raceway ponds are identical to the ones obtained in this work (0.047 ± 0.001 d−1, 0.066 ± 0.005 d−1, and 0.051 ± 0.003 d−1).
Photosynthetic efficiency (PE) (Table 4) was higher in the modified raceway for process conditions 1 and 2. The higher rotation frequency needed in the modified raceway to attain a given average flow velocity caused a higher turbulence level, enhancing the vertical mixing and the PE of the whole culture. This represents a possible cause for the higher productivities reached in the modified raceway. PE values obtained are comprised in the 0.5–1.5% range of PE reported by de Vree et al. [50] for a Nannochloropsis sp. CCAP 211/78 grown in a 4730 L raceway pond (25.4 m2 ground area) with a culture depth of 0.20 m and a circulation velocity of 0.25 m s−1.
There were minor differences in the proximate composition (Table 5) and fatty acid profile (Table 6) of the biomass produced in both raceways. The lipid content was lower than the values reported by Das et al. [52] (26.0% ± 1.1%) and Baohua et al. [54] (21.40% ± 1.53%–28.00% ± 1.00%), for Nannochloropsis sp. cultivated in outdoor raceway ponds and three different N. oceanica strains cultivated in indoor raceway ponds, respectively. On the other hand, the values reported by López et al. [36] (12.80% ± 3.54%–15.15% ± 4.16%) are in the range of the ones achieved in these trials. However, despite the lipid accumulation in Nannochloropsis sp. being strain and species-dependent, it is also conditioned by the culture conditions, varying both with nutritional and environmental factors such as irradiance, nitrogen concentration and salinity [20].
Regarding the fatty acid profile, C16 and C20 FAME were the most prevalent. Ma et al. [20] reported that C16, C18, and C20 FAME were the major fatty acids found in Nannochloropsis strains, contrary to the present study on which C18 were detected in very small amounts. EPA content ranged from 26.17% ± 3.32% to 29.45% ± 0.41% of total FAME, which was lower than the values reported by Baohua et al. [54] for three different N. oceanica strains cultivated in indoor raceways (35.58% ± 0.63%, 38.78% ± 2.49%, 40.13% ± 0.28%). The higher relative content of PUFA and omega-3 PUFA (ω-3) in comparison with saturated fatty acids (SFA) and omega-6 PUFA (ω-6), respectively, are interesting indicators of the quality of biomass produced by the N. oceanica strain used.
Concerning energy consumption, the modified raceway consumed, at least, twice the energy consumed by standard configuration (Table 7). The non-uniform velocity pattern generated with a half channel width paddlewheel mixing was responsible for the discrepancy. The typical plug flow of raceways [34] was altered in the modified and zones wherein an inversion of flow direction occurred. Thus, a higher rotation frequency was needed to attain a given circulation velocity.
Despite having much higher operational costs, the modified configuration presented slightly higher biomass productivity. Given the negligible difference in the productivity obtained, the standard configuration was found to be the best alternative of design.

3.2. Water Depth Optimization

Optimization of culture depth was based on the comparison of trials performed under process conditions 1 and 2. An increase of 0.8 g m−2 d−1 in the global biomass productivity with the 0.13 m water depth compared with the 0.20 m water depth was observed. These results are in agreement with those obtained by San Pedro et al. [51] and de Vree et al. [50], who reported that large pond depths lead to light-limited cells and the creation of large dark zones wherein microalgae do not photosynthesize, reducing the net productivity of the culture. Dark respiration can comprise as much as 30% of the strain’s maximum specific growth rate [55] and can explain the small decrease obtained in the global specific growth rate with the increase of the water depth.
The quality of biomass produced in both process conditions remained the same in terms of quantity of lipids and EPA. PUFA/SFA and ω-6/ω-3 ratios were also identical for both process conditions. On the other hand, we verified a 54% increase in energy consumption with process condition 2, as a result of higher paddlewheel rotation speed. A power consumption increase between 0.20 m and 0.10 m water depth trials was reported by Mendoza et al. [56]. These authors showed that a 0.20 m water column is the optimum value for minimizing power consumption. Chiaramonti et al. described an increase in total head losses caused by a reduction in culture depths [57].
Thus, a decrease in water depth induced a small improvement of global biomass productivity, however, the power consumption was the differentiator factor. The lower energy required with a pond depth of 0.20 m made it the best option for microalgal cultivation.

3.3. Flow Velocity Optimization

Optimization of flow velocity was based on the comparison of trials performed under process conditions 2 and 3. An increase in global biomass productivity and specific growth rate was associated with an increase in the flow velocity. Accordingly, Moazami et al. reported that an increase in the paddlewheel rotation speed from 1.4 to 2.1 rad s−1 resulted in a biomass productivity increase [58]. However, Weissman et al. reported that different mixing velocities had no apparent effect on biomass productivity [59].
Despite the EPA content and, ω-6/ω-3 and PUFA/SFA ratios being similar, the same was not seen for the lipid content. This parameter was about 33% higher for a culture velocity of 0.30 m s−1. According to Ma et al. (2016), lipid accumulation is favored under stressed conditions. Thus, 0.30 m s−1 may induce mechanical stress on the cells. Nevertheless, as previously mentioned, this is the most commonly used flow velocity for biomass production [20].
Specific power consumption was two-fold higher with a 0.30 m s−1 circulation velocity. This was due to the two-fold higher paddlewheel rotation speed needed to double the flow velocity. Mendoza et al. [56] and Weissman et al. [59] also reported an increase in the specific power consumption with liquid velocity. The former authors refer to an exponential relationship between these two parameters due to the exponential relationship between the liquid velocity and its kinetic energy [59].
In order to determine which was the most suitable flow velocity to cultivate N. oceanica microalgae, the ratio of lipid production/energy consumption was calculated. The lower velocity (0.15 m s−1) displayed a higher ratio, 17.1 kg kW−1, when compared to 0.30 m s−1 flow velocity, 16.9 kg kW−1. Therefore, 0.15 m s−1 was considered to be the best option tested to induce lipid production.

4. Conclusions

A comparison of two different pilot-scale raceway pond configurations and an optimization of the water depth and flow velocity were performed. These were evaluated in terms of the growth dynamics, biochemical composition of the used microalga, and power consumption requirements. The results obtained suggest that the improvement in the biomass productivity achieved in the modified when compared to the standard raceway was not significant to compensate for the much higher energy consumption needed. For the same reason, it was concluded that a 0.20 m was the best water depth tested for N. oceanica cultivation. The highest lipid production/energy consumption was obtained when using 0.15 m s−1, being this velocity the most suitable for lipid production.

Supplementary Materials

The following are available online at https://www.mdpi.com/2076-3417/10/5/1725/s1, Figure S1: Calibration curve of optical density at 540 nm as a function of N. oceanica biomass dry weight, Figure S2: Growth curves of N. oceanica cultivated under process conditions 1. Values represent an average of two biological replicates, Figure S3: Growth curves of N. oceanica cultivated under process conditions 2. Values represent an average of two biological replicates, Figure S4: Growth curve of N. oceanica cultivated under process conditions 3. Values represent an average of two biological replicates, Figure S5: Temperature and instant radiation registered on site during first growth trial under process conditions 1, Figure S6: Temperature and instant radiation registered on site during second growth trial under process conditions 1, Figure S7: Temperature and instant radiation registered on site during first growth trial under process conditions 2, Figure S8: Temperature and instant radiation registered on site during second growth trial under process conditions 2, Figure S9: Temperature and instant radiation registered on site during first growth trial under process conditions 3, Figure S10: Temperature and instant radiation registered on site during second growth trial under process conditions 3, Figure S11: Microscopic picture (40×) of N. oceanica grown in Allmicroalgae’s pilot-scale raceway ponds.

Author Contributions

N.F. designed the raceways. H.P., M.S., J.V. and J.S. designed the experiments. P.C. performed the experiments. J.T.S. supervised the raceway assays. P.C., J.P. and M.C. wrote the manuscript. All authors have read and agreed to the published version of the manuscript.

Funding

This work has received funding under the project AlgaValor, from the Portugal 2020 program (grant agreement nº POCI-01-0247-FEDER-035234; LISBOA-01-0247-FEDER-035234; ALG-01-0247-FEDER-035234).

Acknowledgments

We greatly thank Allmicroalgae’s staff for all the support given throughout this work.

Conflicts of Interest

The authors declare no conflict of interest.

References

  1. Del Campo, J.A.; García-González, M.; Guerrero, M.G. Outdoor cultivation of microalgae for carotenoid production: Current state and perspectives. Appl. Microbiol. Biotechnol. 2007, 74, 1163–1174. [Google Scholar] [CrossRef] [PubMed]
  2. Guedes, A.C.; Amaro, H.M.; Malcata, F.X. Microalgae as sources of carotenoids. Mar. Drugs 2011, 9, 625–644. [Google Scholar] [CrossRef]
  3. Singh, J.; Saxena, R.C. An Introduction to Microalgae: Diversity and Significance. In Handbook of Marine Microalgae; Kim, S.-K., Pukyong, N.U., Eds.; Academic Press: Cambridge, MA, USA, 2015; pp. 11–24. [Google Scholar]
  4. Mata, T.M.; Martins, A.A.; Caetano, N.S. Microalgae for biodiesel production and other applications: A review. Renew. Sustain. Energy Rev. 2010, 14, 217–232. [Google Scholar] [CrossRef] [Green Version]
  5. Singh, B.; Sharma, Y.C. Synthesis of biodiesel/bio-oil from microalgae. In Biotechnological Applications of Microalgae; Bux, F., Ed.; CRC Press: Boca Raton, FL, USA, 2013; pp. 99–112. [Google Scholar]
  6. Formighieri, C.; Franck, F.; Bassi, R. Regulation of the pigment optical density of an algal cell: Filling the gap between photosynthetic productivity in the laboratory and in mass culture. J. Biotechnol. 2012, 162, 115–123. [Google Scholar] [CrossRef]
  7. Melis, A. Solar energy conversion efficiencies in photosynthesis: Minimizing the chlorophyll antennae to maximize efficiency. Plant Sci. 2009, 177, 272–280. [Google Scholar] [CrossRef]
  8. Behrenfeld, M.J.; Randerson, J.T.; McClain, C.R.; Feldman, G.C.; Los, S.O.; Tucker, C.J.; Falkowski, P.G.; Field, C.B.; Frouin, R.; Esaias, W.E.; et al. Biospheric Primary Production During an ENSO Transition. Science 2001, 291, 2594–2597. [Google Scholar] [CrossRef] [Green Version]
  9. Falkowski, P.G.; Raven, J.A. Aquatic Photosynthesis, 2nd ed.; Princeton University Press: Princeton, NJ, USA, 2007. [Google Scholar]
  10. Berman-Frank, I.; Lundgren, P.; Falkowski, P. Nitrogen fixation and photosynthetic oxygen evolution in cyanobacteria. Res. Microbiol. 2003, 154, 157–164. [Google Scholar] [CrossRef]
  11. Bergman, B.; Sandh, G.; Lin, S.; Larsson, J.; Carpenter, E.J. Trichodesmium—A widespread marine cyanobacterium with unusual nitrogen fixation properties. FEMS Microbiol. Rev. 2013, 37, 286–302. [Google Scholar] [CrossRef] [PubMed] [Green Version]
  12. Naidoo, T.; Zulu, N.; Maharajh, D.; Lalloo, R. Value-Added Products from Microalgae. In Biotechnological Applications of Microalgae; CRC Press: Boca Raton, FL, USA, 2013; pp. 137–160. [Google Scholar]
  13. Misra, R.; Guldhe, A.; Singh, P.; Rawat, I.; Bux, F. Electrochemical harvesting process for microalgae by using nonsacrificial carbon electrode: A sustainable approach for biodiesel production. Chem. Eng. J. 2014, 255, 327–333. [Google Scholar] [CrossRef]
  14. Borowitzka, M.A. Algal Biotechnology. The Algae World; Sahoo, D., Seckbach, J., Eds.; Springer: Dordrecht, The Netherlands, 2015; pp. 319–338. [Google Scholar]
  15. Hill, R.T.; Fenical, W. Pharmaceuticals from marine natural products: Surge or ebb? Curr. Opin. Biotechnol. 2010, 21, 777–779. [Google Scholar] [CrossRef] [PubMed]
  16. Herrero, M.; Castro-Puyana, M.; Mendiola, J.A.; Ibañez, E. Compressed fluids for the extraction of bioactive compounds. Trends Anal. Chem. 2013, 43, 67–83. [Google Scholar] [CrossRef]
  17. Bule, M.H.; Ahmed, I.; Maqbool, F.; Bilal, M.; Iqbal, H.M.N. Microalgae as a source of high-value bioactive compounds. Front. Biosci. (Schol. Ed.) 2018, 10, 197–216. [Google Scholar]
  18. Khan, M.I.; Shin, J.H.; Kim, J.D. The promising future of microalgae: Current status, challenges, and optimization of a sustainable and renewable industry for biofuels, feed, and other products. Microb. Cell Fact. 2018, 17, 36. [Google Scholar] [CrossRef] [PubMed]
  19. Jacob-Lopes, E.; Scoparo, C.H.G.; Lacerda, L.M.C.F.; Franco, T.T. Effect of light cycles (night/day) on CO2 fixation and biomass production by microalgae in photobioreactors. Chem. Eng. Process. Process Intensif. 2009, 48, 306–310. [Google Scholar] [CrossRef]
  20. Ma, X.-N.; Chen, T.-P.; Yang, B.; Liu, J.; Chen, F. Lipid Production from Nannochloropsis. Mar. Drugs 2016, 14, 61. [Google Scholar] [CrossRef] [PubMed] [Green Version]
  21. Rodolfi, L.; Chini Zittelli, G.; Bassi, N.; Padovani, G.; Biondi, N.; Bonini, G.; Tredici, M.R. Microalgae for oil: Strain selection, induction of lipid synthesis and outdoor mass cultivation in a low-cost photobioreactor. Biotechnol. Bioeng. 2009, 102, 100–112. [Google Scholar] [CrossRef]
  22. Radakovits, R.; Jinkerson, R.E.; Fuerstenberg, S.I.; Tae, H.; Settlage, R.E.; Boore, J.L.; Posewitz, M.C. Draft genome sequence and genetic transformation of the oleaginous alga Nannochloropsis Gaditana. Nat. Commun. 2012, 3, 686. [Google Scholar] [CrossRef] [Green Version]
  23. Milledge, J.J. Commercial application of microalgae other than as biofuels: A brief review. Rev. Environ. Sci. Bio/Technol. 2011, 10, 31–41. [Google Scholar] [CrossRef]
  24. Spolaore, P.; Joannis-Cassan, C.; Duran, E.; Isambert, A. Commercial applications of microalgae. J. Biosci. Bioeng. 2006, 101, 87–96. [Google Scholar] [CrossRef] [Green Version]
  25. Özçimen, D.; İnan, B.; Koçer, A.T.; Vehapi, M. Bioeconomic Assessment of Microalgal Production. In Microalgal Biotechnology; InTech: London, UK, 2018. [Google Scholar]
  26. Carvalho, A.P.; Meireles, L.A.; Malcata, F.X. Microalgal Reactors: A Review of Enclosed System Designs and Performances. Biotechnol. Prog. 2006, 22, 1490–1506. [Google Scholar] [CrossRef]
  27. Griffiths, M. Microalgal Cultivation Reactor Systems. In Biotechnological Applications of Microalgae; Bux, F., Ed.; CRC Press: Boca Raton, FL, USA, 2013; pp. 51–76. [Google Scholar]
  28. Packer, M.A.; Harris, G.C.; Adams, S.L. Food and Feed Applications of Algae. In Algae Biotechnology Products and Processes; Bux, F., Chisti, Y., Eds.; Springer: Cham, Switzerland, 2016; pp. 217–247. [Google Scholar]
  29. Brennan, L.; Owende, P. Biofuels from microalgae—A review of technologies for production, processing, and extractions of biofuels and co-products. Renew. Sustain. Energy Rev. 2010, 14, 557–577. [Google Scholar] [CrossRef]
  30. Pulz, O. Photobioreactors: production systems for phototrophic microorganisms. Appl. Microbiol. Biotechnol. 2001, 57, 287–293. [Google Scholar] [PubMed]
  31. Handler, R.M.; Canter, C.E.; Kalnes, T.N.; Lupton, F.S.; Kholiqov, O.; Shonnard, D.R.; Blowers, P. Evaluation of environmental impacts from microalgae cultivation in open-air raceway ponds: Analysis of the prior literature and investigation of wide variance in predicted impacts. Algal Res. 2012, 1, 83–92. [Google Scholar] [CrossRef]
  32. Sompech, K.; Chisti, Y.; Srinophakun, T. Design of raceway ponds for producing microalgae. Biofuels 2012, 3, 387–397. [Google Scholar] [CrossRef]
  33. Becker, E.W. Microalgae Biotechnology and Microbiology; Cambridge University Press: Cambridge, UK, 1994. [Google Scholar]
  34. Chisti, Y. Large-Scale Production of Algal Biomass: Raceway Ponds. In Algae Biotechnology Products and Processes; Bux, F., Chisti, Y., Eds.; Springer: Cham, Switzerland, 2016; pp. 21–40. [Google Scholar]
  35. Tredici, M.R. Mass Production of Microalgae: Photobioreactors. In Handbook of Microalgal Culture; Blackwell Publishing Ltd.: Oxford, UK, 2007; pp. 178–214. [Google Scholar]
  36. López, A.R.; Rodríguez, S.B.; Vallejo, R.A.; García, P.G.; Macías-Sánchez, M.D.; Díaz, M.G.; Librán, R.G.; Acero, F.J.F. Sustainable cultivation of Nannochloropsis gaditana microalgae in outdoor raceways using flue gases for a complete 2-year cycle: A Circular Economy challenge. J. Appl. Phycol. 2019, 31, 1515–1523. [Google Scholar] [CrossRef]
  37. Liffman, K.; Paterson, D.A.; Liovic, P.; Bandopadhayay, P. Comparing the energy efficiency of different high rate algal raceway pond designs using computational fluid dynamics. Chem. Eng. Res. Des. 2013, 91, 221–226. [Google Scholar] [CrossRef]
  38. Prussi, M.; Buffi, M.; Casini, D.; Chiaramonti, D.; Martelli, F.; Carnevale, M.; Tredici, M.R.; Rodolfi, L. Experimental and numerical investigations of mixing in raceway ponds for algae cultivation. Biomass Bioenergy 2014, 67, 390–400. [Google Scholar] [CrossRef]
  39. Ranganathan, P.; Amal, J.C.; Savithri, S.; Haridas, A. Experimental and modelling of Arthrospira platensis cultivation in open raceway ponds. Bioresour. Technol. 2017, 242, 197–205. [Google Scholar] [CrossRef]
  40. Guillard, R.R.L. Culture of Phytoplankton for Feeding Marine Invertebrates. In Culture of Marine Invertebrate Animals; Springer: Boston, MA, USA, 1975; pp. 29–60. [Google Scholar]
  41. Quelhas, P.M.; Trovão, M.; Silva, J.T.; Machado, A.; Santos, T.; Pereira, H.; Varela, J.; Simões, M.; Silva, J.L. Industrial production of Phaeodactylum tricornutum for CO2 mitigation: Biomass productivity and photosynthetic efficiency using photobioreactors of different volumes. J. Appl. Phycol. 2019, 31, 2187–2196. [Google Scholar] [CrossRef]
  42. Callejón-Ferre, A.J.; Velázquez-Martí, B.; López-Martínez, J.A.; Manzano-Agugliaro, F. Greenhouse crop residues: Energy potential and models for the prediction of their higher heating value. Renew. Sustain. Energy Rev. 2011, 15, 948–955. [Google Scholar] [CrossRef]
  43. Armstrong, F.A.J. Determination of Nitrate in Water Ultraviolet Spectrophotometry. Anal. Chem. 1963, 35, 1292–1294. [Google Scholar] [CrossRef]
  44. Bligh, E.G.; Dyer, W.J. A rapid method of total lipid extraction and purification. Can. J. Biochem. Physiol. 1959, 37, 911–917. [Google Scholar] [CrossRef] [PubMed] [Green Version]
  45. Pereira, H.; Barreira, L.; Mozes, A.; Florindo, C.; Polo, C.; Duarte, C.V.; Custádio, L.; Varela, J. Microplate-based high throughput screening procedure for the isolation of lipid-rich marine microalgae. Biotechnol. Biofuels 2011, 4, 61. [Google Scholar] [CrossRef] [PubMed] [Green Version]
  46. Lourenço, S.O.; Barbarino, E.; Lavín, P.L.; Lanfer Marquez, U.M.; Aidar, E. Distribution of intracellular nitrogen in marine microalgae: Calculation of new nitrogen-to-protein conversion factors. Eur. J. Phycol. 2004, 39, 17–32. [Google Scholar] [CrossRef]
  47. Lepage, G.; Roy, C.C. Improved recovery of fatty acid through direct transesterification without prior extraction or purification. J. Lipid Res. 1984, 25, 1391–1396. [Google Scholar]
  48. Pereira, H.; Barreira, L.; Figueiredo, F.; Custódio, L.; Vizetto-Duarte, C.; Polo, C.; Rešek, E.; Engelen, A.; Varela, J. Polyunsaturated Fatty Acids of Marine Macroalgae: Potential for Nutritional and Pharmaceutical Applications. Mar. Drugs 2012, 10, 1920–1935. [Google Scholar] [CrossRef] [Green Version]
  49. Natascia, B.; Fonseca, D.; Sampietro, G.; Santos, E.; Costa, L.; Verdelho, V.; Piana, A.; Carlini, D.; Mangini, S.; Bassi, N.; et al. Cultivation of Nannochloropsis oceanica and Tetraselmis suecica in the Two 0.5-Ha BIOFAT Pilot Plants for Biofuel Production. In Proceedings of the AlgaEurope, Lisbon, Portugal, 13–15 December 2016. [Google Scholar]
  50. de Vree, J.H.; Bosma, R.; Janssen, M.; Barbosa, M.J.; Wijffels, R.H. Comparison of four outdoor pilot-scale photobioreactors. Biotechnol. Biofuels 2015, 8, 215. [Google Scholar] [CrossRef] [Green Version]
  51. San Pedro, A.; González-López, C.V.; Acién, F.G.; Molina-Grima, E. Outdoor pilot production of Nannochloropsis gaditana: Influence of culture parameters and lipid production rates in raceway ponds. Algal Res. 2015, 8, 205–213. [Google Scholar] [CrossRef]
  52. Das, P.; Thaher, M.I.; Hakim, M.A.Q.M.A.; Al-Jabri, H.M.S.J. Sustainable production of toxin free marine microalgae biomass as fish feed in large scale open system in the Qatari desert. Bioresour. Technol. 2015, 192, 97–104. [Google Scholar] [CrossRef]
  53. Ma, Y.; Wang, Z.; Yu, C.; Yin, Y.; Zhou, G. Evaluation of the potential of 9 Nannochloropsis strains for biodiesel production. Bioresour. Technol. 2014, 167, 503–509. [Google Scholar] [CrossRef]
  54. Baohua, Z.; Faqiang, Z.; Yang, M.; Lu, L.; Yang, G.; Pan, K. Large-scale biodiesel production using flue gas from coal-fired power plants with Nannochloropsis microalgal biomass in open raceway ponds. Bioresour. Technol. 2014, 174, 53–59. [Google Scholar]
  55. Geider, R.; Osborne, B.A. Respiration and microalgal growth: A review of the quantitative relationship between dark respiration and growth. New Phytol. 1989, 112, 327–341. [Google Scholar] [CrossRef]
  56. Mendoza, J.L.; Granados, M.R.; de Godos, I.; Acién, F.G.; Molina, E.; Banks, C.; Heaven, S. Fluid-dynamic characterization of real-scale raceway reactors for microalgae production. Biomass Bioenergy 2013, 54, 267–275. [Google Scholar] [CrossRef]
  57. Chiaramonti, D.; Prussi, M.; Casini, D.; Tredici, M.R.; Rodolfi, L.; Bassi, N.; Zittelli, G.C.; Bondioli, P. Review of energy balance in raceway ponds for microalgae cultivation: Re-thinking a traditional system is possible. Appl. Energy 2013, 102, 101–111. [Google Scholar] [CrossRef]
  58. Moazami, N.; Ashori, A.; Ranjbar, R.; Tangestani, M.; Eghtesadi, R.; Nejad, A.S. Large-scale biodiesel production using microalgae biomass of Nannochloropsis. Biomass Bioenergy 2012, 39, 449–453. [Google Scholar] [CrossRef]
  59. Weissman, J.C.; Goebel, R.P.; Benemann, J.R. Photobioreactor design: Mixing, carbon utilization, and oxygen accumulation. Biotechnol. Bioeng. 1988, 31, 336–344. [Google Scholar] [CrossRef]
Figure 1. 3D prototype models of the two built raceways. (a) Standard raceway model with three baffles, an eight-bladed paddlewheel and 87 cm width; (b) Modified raceway model, with three deflectors, an eight blades paddlewheel and 47 cm width.
Applsci 10 01725 g001
Figure 2. Pilot-scale raceway ponds used. Modified raceway at right and standard raceway at left.
Applsci 10 01725 g002
Figure 3. Structural details of the pilot raceways installed in Allmicroalgae facilities. (a) Three baffles in the circular endings of the ponds were installed in both standard and modified raceways. Single eight-flat-bladed paddlewheel was installed right after one of the semicircular ends of one of the channels; (b) standard raceway paddlewheel with 0.870 m width and (c) modified raceway with 0.475 m.
Applsci 10 01725 g003
Table 1. General characteristics of the two built raceways: dimensions, operational specifications, and raw materials.
Standard RacewayModified Raceway
DimensionsTotal area28.88 m227.62 m2
R (Width: Length)1:7.51:7.5
Total Width2 m2 m
Total Length15 m15 m
Chanel length1 m1 m
Channel width surrounding paddlewheel0.950 m0.545 m
Paddlewheel width0.870 m0.475 m
Depth0.375 m0.375 m
Volume[2.89–8.66] m3[2.76–8.28] m3
Operational specificationsWater depth[0.1–0.3] m[0.1–0.3] m
Speed[5–60] rpm [0.1–0.3] m/s[5–60] rpm [0.1–0.3] m/s
Paddlewheel8 blades, no slope8 blades, no slope
CarbonationBox after paddlewheelBox after paddlewheel
Number of bafflesSixThree
Raw materialsBase of the racewayPolyethylene film, stone powder, PVC waterproofing geomembrane.Polyethylene film, stone powder, PVC waterproofing geomembrane.
External wallsTreated woodTreated wood
StructureStainless steelStainless steel
Table 2. Set of process conditions used. Each set of conditions was run in duplicate.
Process ConditionWater Depth (m)Flow Velocity (m s−1)
10.200.30
20.130.30
30.130.15
Table 3. Biomass productivities and specific growth rates obtained in the two raceways used. Productivity values are presented considering the dry weight. Values represent an average of two biological replicates.
Raceway Configuration/Process ConditionProductivity (g m−2 d−1)Specific Growth Rate (d−1)
GlobalMaximumGlobalMaximum
Modified/16.61015.2820.0480.141
Modified/27.69116.3640.0690.175
Standard/16.27719.0070.0470.172
Standard/27.08918.1020.0650.166
Standard/35.37511.1310.0570.130
Table 4. Photosynthetic efficiency of N. oceanica cultures obtained when growing in the two raceways tested. Values represent an average of two biological replicates.
Photosynthetic Efficiency (%)
Process Condition/Raceway Configuration123
Modified0.5690.747-
Standard0.5320.6740.618
Table 5. Biomass proximate composition. Values are presented relative to dry weight. Values represent an average of two biological replicates.
Raceway Configuration/Process ConditionProteins (%)Lipids (%)Carbohydrates (%)Ashes (%)
Modified/138.913.230.517.4
Modified/244.217.428.79.7
Standard/140.414.527.118.0
Standard/241.719.025.114.2
Standard/339.112.736.212.0
Table 6. Fatty acid profile of the biomass produced (n.d., not detected). Values represent an average of two biological replicates.
Raceway ConfigurationModifiedStandard
Process Condition12123
C14:01.281.972.132.713.19
C16:020.5324.0219.9321.6223.46
C16:140.1436.0642.0634.0435.60
C18:2n-6n.d.0.441.963.371.45
C20:4n-68.619.618.208.9810.13
C20:5n-329.4527.9027.8529.2926.17
SFA21.9025.9919.9324.3326.65
MFA40.0636.0642.0634.0435.60
PUFA38.0437.9538.0141.6337.75
ω-329.4227.9027.8529.2926.17
ω-68.6310.0510.1612.3511.58
PUFA/SFA1.741.481.911.771.47
ω-6/ω-30.290.360.360.420.44
Table 7. Paddlewheel rotation speed and associated energy consumption.
Energy Consumption (W m−3)Mixing Speed (Rad s−1)
Process Condition/Raceway Configuration123123
Modified10.920.9-1.291.68-
Standard5.28.04.00.670.670.31

