A Methodology of Interactive Motion Facades Design through Parametric Strategies


School of Architecture, Kyungpook National University, Sangyeok-dong, Buk-gu, 41566 Daegu
*
Author to whom correspondence should be addressed.
Appl. Sci. 2020, 10(4), 1218; https://doi.org/10.3390/app10041218
Submission received: 13 December 2019
/
Revised: 7 February 2020
/
Accepted: 9 February 2020
/
Published: 11 February 2020
(This article belongs to the Section Computing and Artificial Intelligence)
Abstract
:Interactive facades are dynamic in the translation of space in architecture, especially in the aspects of aesthetics, sustainability, adaptation to the environment, and data relay through the medium of light, motion, and embedded technology. The design of interactive facades is complicated and it requires time and effort in the comprehension of the internal functions of the facade from the conceptual stage to occupancy. The existing process of modeling the experimental level of interactive facades through mock-up and prototype models demonstrate a fragmentary outline on which the final development of the interactive façade system is based on. This research aims to analyze the motion aspect of interactive facades design and simplify the conceptual and performance design process through parametric strategies using a multi-hybrid of parametric and simulation tools, such as Rhino Grasshopper, Ladybug, and Daysim, to create interactive facade designs that can verified in a virtual reality environment while generating performance outcomes that can be optimized in a holistic and improved efficient process.
1. Introduction
Facades are an important part of the building that sets the tone for the rest of the building. Façade translates the continuous interaction between the functional activities of the indoor and outdoor architecture. Interactive facades dynamically enhance the translation of activities of the outdoor and indoor space for sustainability, daylighting, aesthetics, information, and data relay through the medium of systematic motion, visual effects, or embedded technology.
The evolution of interactive facade design is diverse in conceptualization and implementation.
Interactive facades, such as kinetic facades, have evolved over the years in terms of adaption to the environment, the comfort of building occupants, and the level of technological integration in the façade. [1] Interactive facades that adapt to the environment are configured to optimize the conditions of the building concerning a constantly changing environment. In comparison, static facades’ designs are intended to achieve optimized results that are based on fixed prerequisites.
The decision-making process of interactive facade design involves the consideration of dynamic factors that are involved in the process, such as design generation, materialization, technology, rationalism, and mechanism. The factors of interactive facade design are required to be collectively considered as the successful execution of the design intent is contingent on designing the facade to satisfy all criteria from conceptualization to installation [2].
The design process of interactive facades combines three-dimensional modeling digital tools with physical models for examination and experimentation. Concurrent iterations to both physical and digital models are required to achieve optimized results, as errors at any stage of the design are potentially exponential in the later stages of construction and maintenance. The complexities of modeling the entire interactive facade through physical modeling are robust and arduous, depending on the scale and type of design, which leads to practitioners modeling a unit of the entire facade as a reference for the digital model iteration.
The goal of this research is to analyze the existing process of interactive facade design and propose an improved process that combines parametric design strategies and virtual reality to improve the convenience in the workflow of interactive facade design, establish a holistic virtual analysis of the interactive façade, especially the mechanics based on the environment, and generate performance results that can be verified and optimized.
2. Background
2.1. Parametric Design
Parametric design in architecture affects the dimensions of geometry that are related to the factors that influence geometry, like location, orientation, form, and solar radiation, among others. The mathematical process is enhanced by computing and has led to the development of algorithmic modeling tools for designers, such as Grasshopper for Rhino and Dynamo.
Parametric architecture focuses on the idea of the relationship between various design elements in a system to perform a task. There are two types of parametric modeling systems: propagation systems and constraint-based systems. Propagation systems compute from known to unknowns with a dataflow model, whereas constraint-based systems solve sets of continuous and discrete constraints [3]. We apply the constraint-based parametric design system in this research. The constraint-based system is defined by the constraint, which is the relationship between geometric components. Geometric constraints are applied to make sure the geometry changes correctly if any design variables are modified. Additionally, constraints of design define geometry based on principles that define design that can be imposed on by factors, such as nature, culture, convention, and the marketplace. The constraints within the design process have been evolving in enhancement through many computer platforms by simplifying the complex factors that compose the constraints into mathematical values and equations [4].
Parametric design solutions are rapid and effective for addressing design problems in a simplified and rational technique that will require a more considerable degree of effort and time through conventional methods. [5] Parametric design as compared to the conventional methods of design apply mathematical variables to efficiently solve complex geometrical problems and create advanced design models in an automated process. The automation of parametric tools is based on accurate real-world data and algorithms to simplify the design process by reducing the amount of iteration that is required to gain optimized results [6].
Conventionally, changes to the architectural model based on user decision and contextual design information can be time and effort consuming, as models frequently require a complete redesign or key components edited constantly, whereas parametric design allows for rapid iteration by a change of the parametric values that relate to aspects of the geometrical model. Hence, parametric design is a more effective modeling process when compared to the conventional process. The idea of parametric design is establishing the relationship by connecting design elements and builds the design by modifying the relationships and observing the results rather than creating the solution in a conventional design tool [7].
Parametric design tools are flexible, adaptive, and accurate to the solution of complex problems in architecture as well as facade issues. Various parametric tools exist in the architecture industry and they perform various functions. The connection between various parametric tools is timely through plug-ins and most tools are multi-hybrid platforms that can perform various tasks, such as modeling, simulation, and evaluation.
The appropriate tool or collection of tools is required for achieving the design goal. Parametric systems are changing to adapt to scripting languages and techniques [8], topological schema, associative geometries and re-editing processes [6,7], and computational process models of digital design [9]. Table 1 illustrates survey parametric tools and their respective functions in the architecture industry.
Grasshopper plug-in for Rhinoceros is the most typical software, along with Ladybug. Grasshopper is based on several scripts that implement the design process within a parametric modeler. Grasshopper is a pertinent tool that sets up the parametric models as networks of interdependent elements. The network of relations is constructed and graphically visualized, so that the designer can maintain track of and intervene in the relational network he is designing [10].
Various simulation tools improve the speed of design, the efficiency of the system, and the comparison of a range of design variants that lead to optimal design solutions. There is not a one size fit all in terms of design performance simulation tools. However, rather a selection of tools that can perform the required task to conveniently achieve the design result [11].
The techniques for designing and improving the functions and aesthetics of interactive facades have developed, but are lacking in terms of feasibility to iterate and interact with the output of the computerized generated design. Some architect has been trying looking for suitable design solutions to satisfy new variable conditions of facades design due to rapid technological growth in building constructions. The challenge is shifting the design objective towards producing the whole system instead of a single object [2]. This makes parametric design a potential solution for the production of an entire system that satisfies variable design conditions.
2.2. Interactive Design
The design of interactive facades that are mechanical is a potential dynamic solution to environmental and building occupancy concerns. Interactive facades, such as kinetic facades, have evolved from simplified motion to complex responsive systems that respond to the environment; such types of kinetic facades are known as adaptive or responsive facades [12].
Interactive facade design involves more than geometric design solutions, but also a consideration of the constantly changing factors of climate, such as daylight, sky conditions, weather changes, energy saving, and time.
Interactive and adaptive facades are part of a field of architecture that focus on the creation of spaces, buildings, or building components that can perform actions that are based on people or the environment through movement, sound, light, wind, humidity, and so forth. While there are various types of functions involved in interactive facades, we have limited this study to the mechanical motion that is involved in interactive facade systems.
On a macro level excluding the deformability, flexibility, and elasticity, motions in rigid structures are classified as rotation, translation or a combination of both [13,14], as seen in Table 2. In the case of linear movement, the translation motion can be defined as the change of position of an object in a parallel space in relation to the coordinated axis, while in the case of rotation, the object changes orientation in space by rotation about the coordinate axis [14].
The case study of buildings in Table 2 shows that the types of motion in rigid structures have been successfully applied to large scale building projects. The rotation motion has been applied to many dynamic skin facades for various functions, including the Keifer Technic Showroom, which used rotation motion for the goal of dynamic solar shading, and One Ocean Thematic Pavilion, for the goal of natural ventilation among many examples. Rotation is a complex motion and the base for other advance types of motion in interactive facades. The scope of the interactive design in this paper focuses on rotation in the interactive facade in the design stage.
The comprehension and successful application of motion to facades are conducted through modeling, simulation, and making rapid design iterations in the design phase of the façade. Façade design that involves motion requires being designed differently from conventional building systems, as the façade behaves like a mechanical product. Hence, the modeling process of facades that involve motion requires digital and physical models are complementary to presenting the motion in the façade efficiently. Designers are required to focus on the design activities to enhance productivity due to the complexities in modeling physical and digital models concurrently [15].
2.3. Virtual Reality in Architecture
The key to comprehension in architecture is the visualization that is enhanced by the tools that accompany the design process, such as models, realistic renderings, and sketches, among others. Virtual reality is an advanced visualization tool that facilitates design through immersion, navigation, real-world scale, interaction, and customization [16].
There are various types of virtual reality (VR) tools implemented in the architecture industry, which range widely based on their applications to the design and construction process. In terms of experimental flexibility and convenient connection to other architecture design platforms, game engine VR tools are suitable for advanced functions that are not available in conventional modeling tools, but require a substantial degree of knowledge [17]. Architecture tools that support animation, such as Lumion, Maya, and Cinema 4D, are different from game engines due to the programmable nature of game engines that do not exist in conventional animated supported tools. Animation in other tools is aesthetic and preset with little capability for functional customization.
The reason why virtual reality is used to visualize the interactive facade in this research stems from the capabilities of immersion, navigation, customization, and scale, as well as an animation system that is unavailable in other conventional tools. The analysis of mechanical motion in an interactive facade requires an experiential design capability, which can be dynamically done in a game engine through the customization of animation. The elements of the interactive facade system can be embedded with individual animation properties through computer language programming to display dynamic motion and can be constantly iterated based on design or user decision for the goal of improving the design.
Furthermore, functions in game engines, such as photo-realistic real-time rendering, IES lighting, HDRI backgrounds, particle effects, collision, and geographical climate rendering, facilitate the visualization of not only the animation of motion elements of the dynamic interactive systems but also their relation to environmental conditions. Thereby, making virtual motion models a tool for rapid prototyping, environmental analysis, and user experience.
3. Methodology
3.1. Parametric Design Strategy
The existing method of interactive façade design involves creating various physical models to generate an optimized model that is time-consuming by increasing the time of iteration to reach an optimized model. The conceptual design is generated and simulated through performance tools to measure the efficiency of the entire system and several physical prototypes the façade are modeled as mock-ups for model testing of the interactive, as seen in process of design in Figure 1.
This process can be often tedious and repetitive for solving design problems that become evident during model testing that were not recognized in the design and simulation stages. The method of model testing with mock-ups is not flexible and tangible for designs that require a high level of iteration and reaction to various factors.
Furthermore, modeling the entire building can be challenging and requires a lot of time and effort and, in some cases, the scale of the model does not allow for experiential accurate analysis of the interactive facade system concerning the environment. Therefore, models that are analyzed by practitioners are a unit of the entire system and the final facade design is based on the expected mechanical behavior of previously analyzed mock-up models that is a section of the entire system.
Through virtual reality modeling that supports dynamic object-based animation and customization while using computer language programming functions that are connected to performance simulation platforms, the iteration and optimization process can be more holistic and reduce the time of design iteration through an immersive experiential analysis of the virtual interactive façade system. This process limits the tedious process of creating and iterating physical models, leading to an optimized model at a rapid and efficient rate that can be referenced for schematic design, as seen in Figure 2.
3.2. Parametric Modeling
The tools reflected in this study are efficient and advanced for modeling and simulation in the architecture industry and they have been utilized for the design of many buildings. The parametric modeling tools are developing at a rapid pace, but maintain the same core principles. Three-dimensional (3D) modeling tools are driven by mathematical methods to generate data that accurately affect user decisions. The visualization is reflected in the geometric model, while the mathematical algorithm combines analytical solutions and equations to express complex real-world situations. This is a process of modeling and analyzing design numerically through calculations that are based on requirements to achieve the intended design [18].
In this research, the workflow involves an output model in Rhinoceros that is linked to the parametric design and simulation tools, as seen in Figure 3. The parametric Grasshopper algorithms control the output model by changing the values of parameters through floating sliders and functional components that are linked to the model. Ladybug utilizes weather data as weather files that can be imported into the Grasshopper scripting environment to create sun paths that are linked to the output geometry. The output geometry is then analyzed through a combination of climate-based simulation tools, in this case, Diva Daysim and Energy simulation tools, such as Honeybee.
Parametric design in this research is implemented on the building and the façade in relation to the environment. As the building is a prototype for analysis, the design variables are controlled through the mathematical sliders that change the properties of the model geometry, such as height, width, and the number of floors automatically by altering the value of the corresponding design element, as seen in Figure 4. This process allows for the designer to iterate the model based on the intention of the space by a simple change in the value of any sliders.
In this research, the algorithm was used to generate the test building model, which is a seven-floor building with a width and length of 16.54 by 6.33 m, which are in centimeters in the Rhino modeling platform. Figure 5 presents the generated model is a perspective view.
The generated building Facade is selected and vertical louvers are modeled as part of the closed-looped algorithm. We design vertical louvers that rotate in angles that respond to movements of the sun. Conventional methods will require mathematical equations to correspond the rotation to sun position. The modeling process generates not only the rotation, but also configurations, such as louver count, louvers depth ratio, and spaces between louvers.
In the parametric building algorithm, the face of the building mass is selected from an index list, which becomes the facade surface that is divided by a grid system equally across the face of the façade and vertical louvers are added to across the grid to fit the existing window openings. The grid can be adjusted to reduce the number of louvers or spacing and vice versa. This creates the louvers of the interactive movable façade that be adjusted scale and distance from each façade element, as seen in Figure 6.
Rotation motion in facades at the basic level is left to right horizontally or vertically at angles that range from −90 to 90 degrees, as we have studied in the model of this research. The rotation beyond the range of the angles stated above will collide with the building geometry. The rotation angles require a mathematical equation that will have to be substituted after each rotation, which can be long and time-consuming. The parametric algorithm simplifies this process through components that rotate based on changing values that are controlled by sliders.
The movable elements of the façade are connected to a vector rotator algorithm that rotates the movable elements based on the movement of a selected point through the attractor algorithm and set to an axis rotation and anchored to the model to prevent a change in the scale and form of the elements during rotation, as seen in Figure 7. Floating sliders control the rotation of the facade elements selected.
Through parametric modeling, conditions that affect the building based daylight are simplified and simulated through algorithms that consider the variables that influence daylight, such as the sun position, longitude, latitude, sun path, equinox, sky type, solar radiation, among others. The sun-path scripts generated by Ladybug provide accurate sun position at various times of the day, month, and year, which is the basis for other simulations concerning the environment and building.
Ladybug is an open-source environmental analysis plugin, which permits users to import standard weather files (.epw) into Grasshopper [19]. This plugin will analyze weather conditions for a models’ location and provide weather metrics in 3D graphics. In this research, a combination of modeling tools is presented.
Rhino with DIVA and various Grasshopper plugins creates a simulation method of movable elements in a dynamic system possible based on the location of the sun on selected days, months, and hours to analyze the light quality of the entire built area and make alterations to reach optimized performance levels. Figure 8 shows the workflow of modeling and simulating through ladybug and the various functions that are available through the ladybug plugin.
The Ladybug plugin generates the weather data from weather files based on real-world locations and also models the sun path around the geometric model. The sun path script is based on real-world locations and data. Floating sliders to adjust climate and weather-related data based on time, day, and month also control the sun path. The sun position is then connected to the rotation node to allow for the movable facade to rotate according to changes in the sun position. The ladybug sun path plugin that outputs the sun vectors can be used for sunlight hours analysis or shading design with the other Ladybug components. Figure 9 illustrates the connection sun path to the building model. The rotation of both the movable louver facade elements and sun path are then controlled by the Ladybug date and time sliders.
3.3. Performance Simulation
The intensity with which a surface is illuminated and part of the SI system of measurement. One lux is equal to one lumen per square meter. Figure 10 illustrates the algorithm script to measure the lux area in Rhino Grasshopper for analysis of areas that are below a 1000-lux threshold and indoor comfort of occupants throughout the year. To simulate the lux area, the model can be converted to a mesh and connected to a selected floor of the Rhino model through the Grasshopper script.
The indoor comfort of occupants’ deals with metrics of temperature concerning daylighting and the activities of the building occupants also consider factors, such as metabolic rate. The script for indoor comfort uses a micro-climate simulation and the energy model is built with Honeybee components as the results of EnergyPlus being incorporated into the script as a Honeybee component. Honeybee can perform many simulation tasks that are offered by EnergyPlus, Radiance, and Daysim. The central premise of Honeybee is to facilitate data entry, simulation execution, and visualization of results all in one place. Simulations of the geometric model in this research utilize honeybee’s algorithm for comfort analysis through a combination of microclimate maps shade benefits for the indoor comfort of the occupants, as seen in Figure 11.
4. Analysis
Interworking between the model and simulation provides the designer with another hybrid medium for understanding the connection between the digital design process and its expected physical actualization. The simulation process that was conducted in this research can be considered as an evaluation methodology of daylighting performance for dynamic louvers. The dynamic louvers in this research affect the building in two major ways: the conditions in the building and the daylight penetration into the building. These factors are analyzed through thermal indoor comfort analysis and lux area calculation.
4.1. Thermal Indoor Comfort Analysis
The motion of a building’s facade in relation to the simulation performance of daylight has to do with how it behaves in relation to its environment [20], and one of the most important aspects of this environment is the sun, which affects a lot of factors in the building; for this paper, we analyzed the performance of building in terms the thermal indoor comfort of the users.
Thermal comfort is important, as it describes the degree of satisfaction of the human in a thermal environment [21]. Designs of the interior environment should be conducive to assuring the health of the occupants, as people spend the most time in the buildings in urban areas. In practice, designers are meant to consider the metabolism rate determined by activity and the clothing in buildings that combine to create the heat balance of the human body and satisfaction with the environment while using a predictive mean vote (PMV) [22].
The recommended thermal limit on the seven-point scale of PMV is between −0.5 and 0.5 to comply with ASHRAE 55. ISO 7730 expands on this limit, giving different indoor environments ranges. ISO defines the hard limit as ranging between −2 and +2, for existing buildings between −0.7 and +0.7, and new buildings ranging between −0.5 and +0.5.
In this paper, we compute the average comfort of a floor for an entire year the results can be read as uncomfortable periods varying in the range of PMV below −0.5 (too cold) or above 0.5 (to warm), where the uncomfortable zones are located within the space. In this simulation result, in Figure 12, we can see that the comfort level is even though out the floor, with exceptions of a few hot zones, which can be attributed to the sunlight intensity and are acceptable.
4.2. Lux Area Calculation
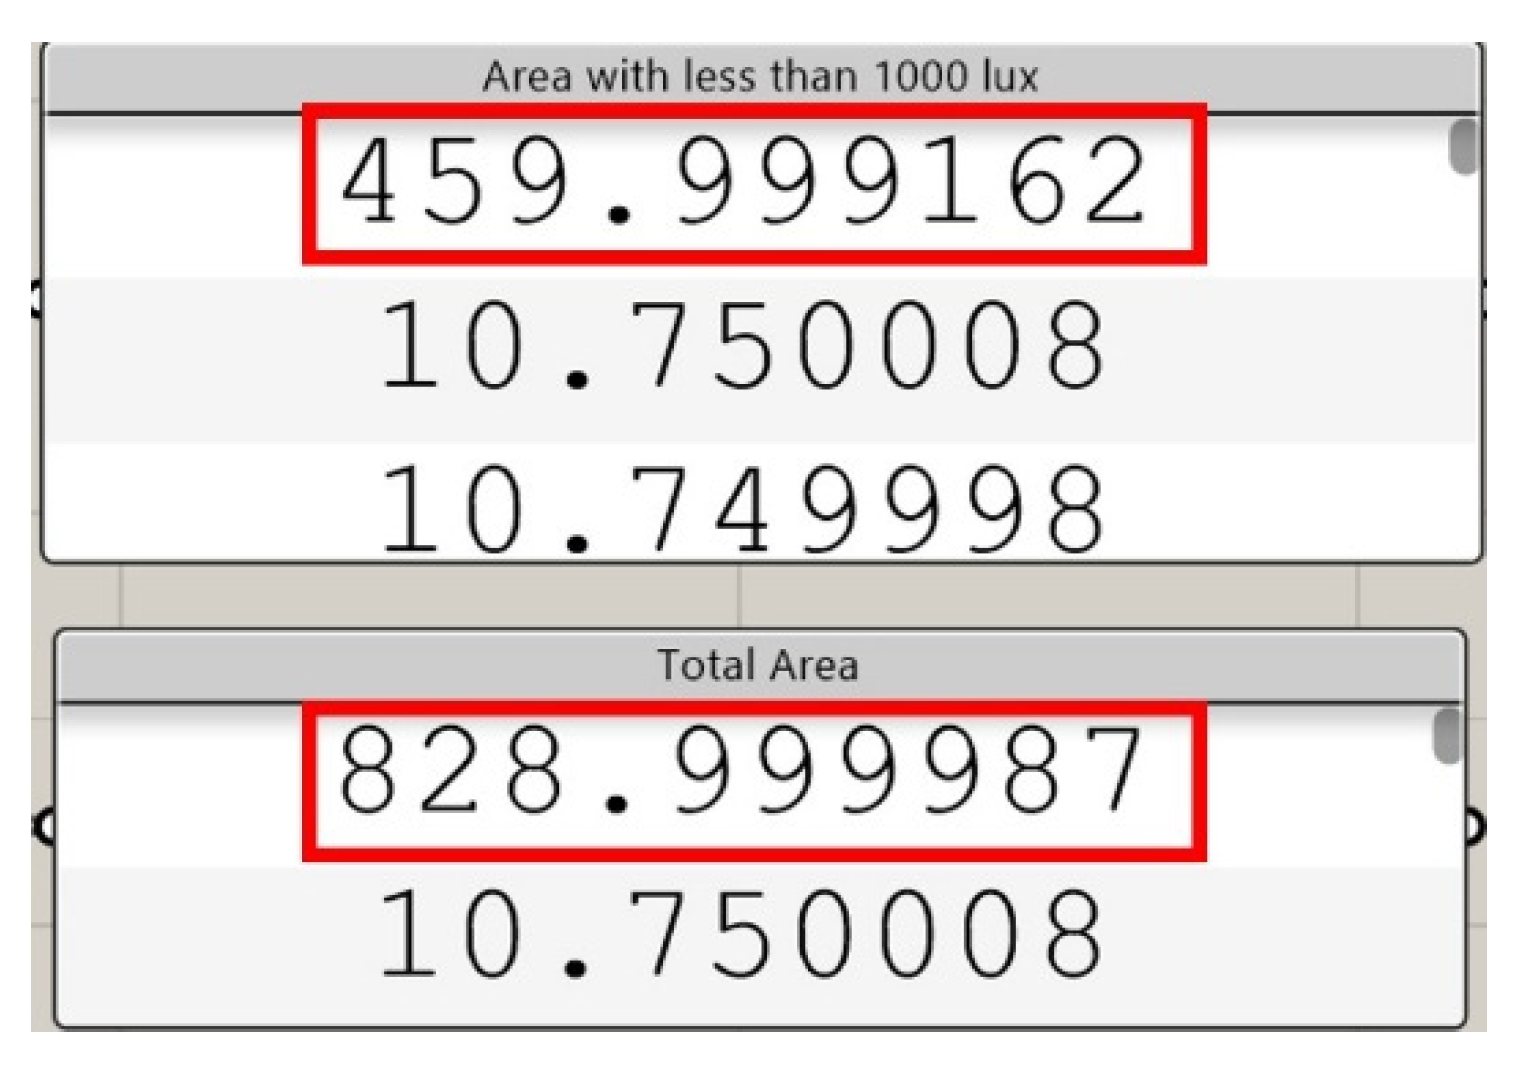
The outdoor light level is approximately 10,000 lux on a clear day. In the building, in the area closest to windows, the light level might be reduced to approximately 1000 lux [23]. In the middle area, it might be as low as 25–50 lux. Additional lighting is often necessary to compensate for the low levels. In this paper, we simulated the lighting of the building against 1000 lux as recommendations of the recent light level based on indoor activities are more common in the range 500–1000 lux, depending on activity. The simulation results show the areas with less than 1000 lux at approximately 50% percent of the total area of 829 m, as seen in Figure 13. Other areas will maintain Lux levels lower than 1000 lux, where additional artificial lighting might be needed. The model maintaining a steady rate of 50% is due to the interactive facade placed on one side of the building, rather than the entire building.
5. Verification
5.1. Virtual Reality Interactive Motion Visualization
Virtual reality is an advanced technology that enhances the visualization of architecture models with a high rendering quality. The photo-realistic rendering is beneficial for light studies, texture mapping, and environment visualization. Advanced functions, such as programmable animation, which have been used in the development of games, can be applied to architecture models to create scenarios that are as close to real-world situations as possible. The workflow from Modeling and simulation platforms, such as Rhino, to unreal game engine VR tools, as seen in Figure 14, is semi-automatic and through a Fbx. (Motion Builder formats) that can be readable in the virtual environment [17].
The current stage of exchange of geometric models from modeling tools to game engines is not in real-time and certain model elements, such as the simulation conducted in this research, need to re-create in the game engine. The game engine recreates the simulation process based on similar mathematical algorithms with a higher level of rendering.
Virtual reality game engine tools function based on assets that are imported from other modeling architectural platforms, assets imported into game engines for VR can be embedded with attributes that are not available in the conventional modeling tools. A key element of the interactive facade is the motion that is embedded in the facades through visual computational languages that are mathematical and based on real-world time, as seen being applied to the case study in this paper.
The motion animation of the louver facade elements in the virtual environment is controlled by blueprint visual language programming. The entire model from Rhino and Grasshopper is imported into a virtual editor. All of the elements of the model are set to a static motion setting, except for movable facade elements that are set to a movable setting. Additionally, aspects of the virtual environment that will require change over time, such as sun position and sky sphere, are set to movable.
In the blueprint, the make rotator and add local rotation scripts are connected to sun position, sky sphere and the selected movable facade elements with directions of rotation, namely X(roll), Y(pitch), and Z(Yaw), as in Figure 15. The direction and type of motion can be controlled by linking the movable facade elements to the X, Y, Z-axis or a combination of any of the three-axis. This creates the rotation of movable facade elements based on the virtual sun and sky conditions, as in the previous performance simulation and as well as real-world conditions.
The results of the performance are the bases for the animation system in the virtual environment. The simulation presented that a 24 h simulation of the entire system is irrelevant, as the lit hours in the simulation where from 7 am to 6 pm, which changed the value of the animation sliders, as well as the simulation where from 7 am to 6 pm, which changed the value of the animation sliders as well as the rotation speed in the virtual world.
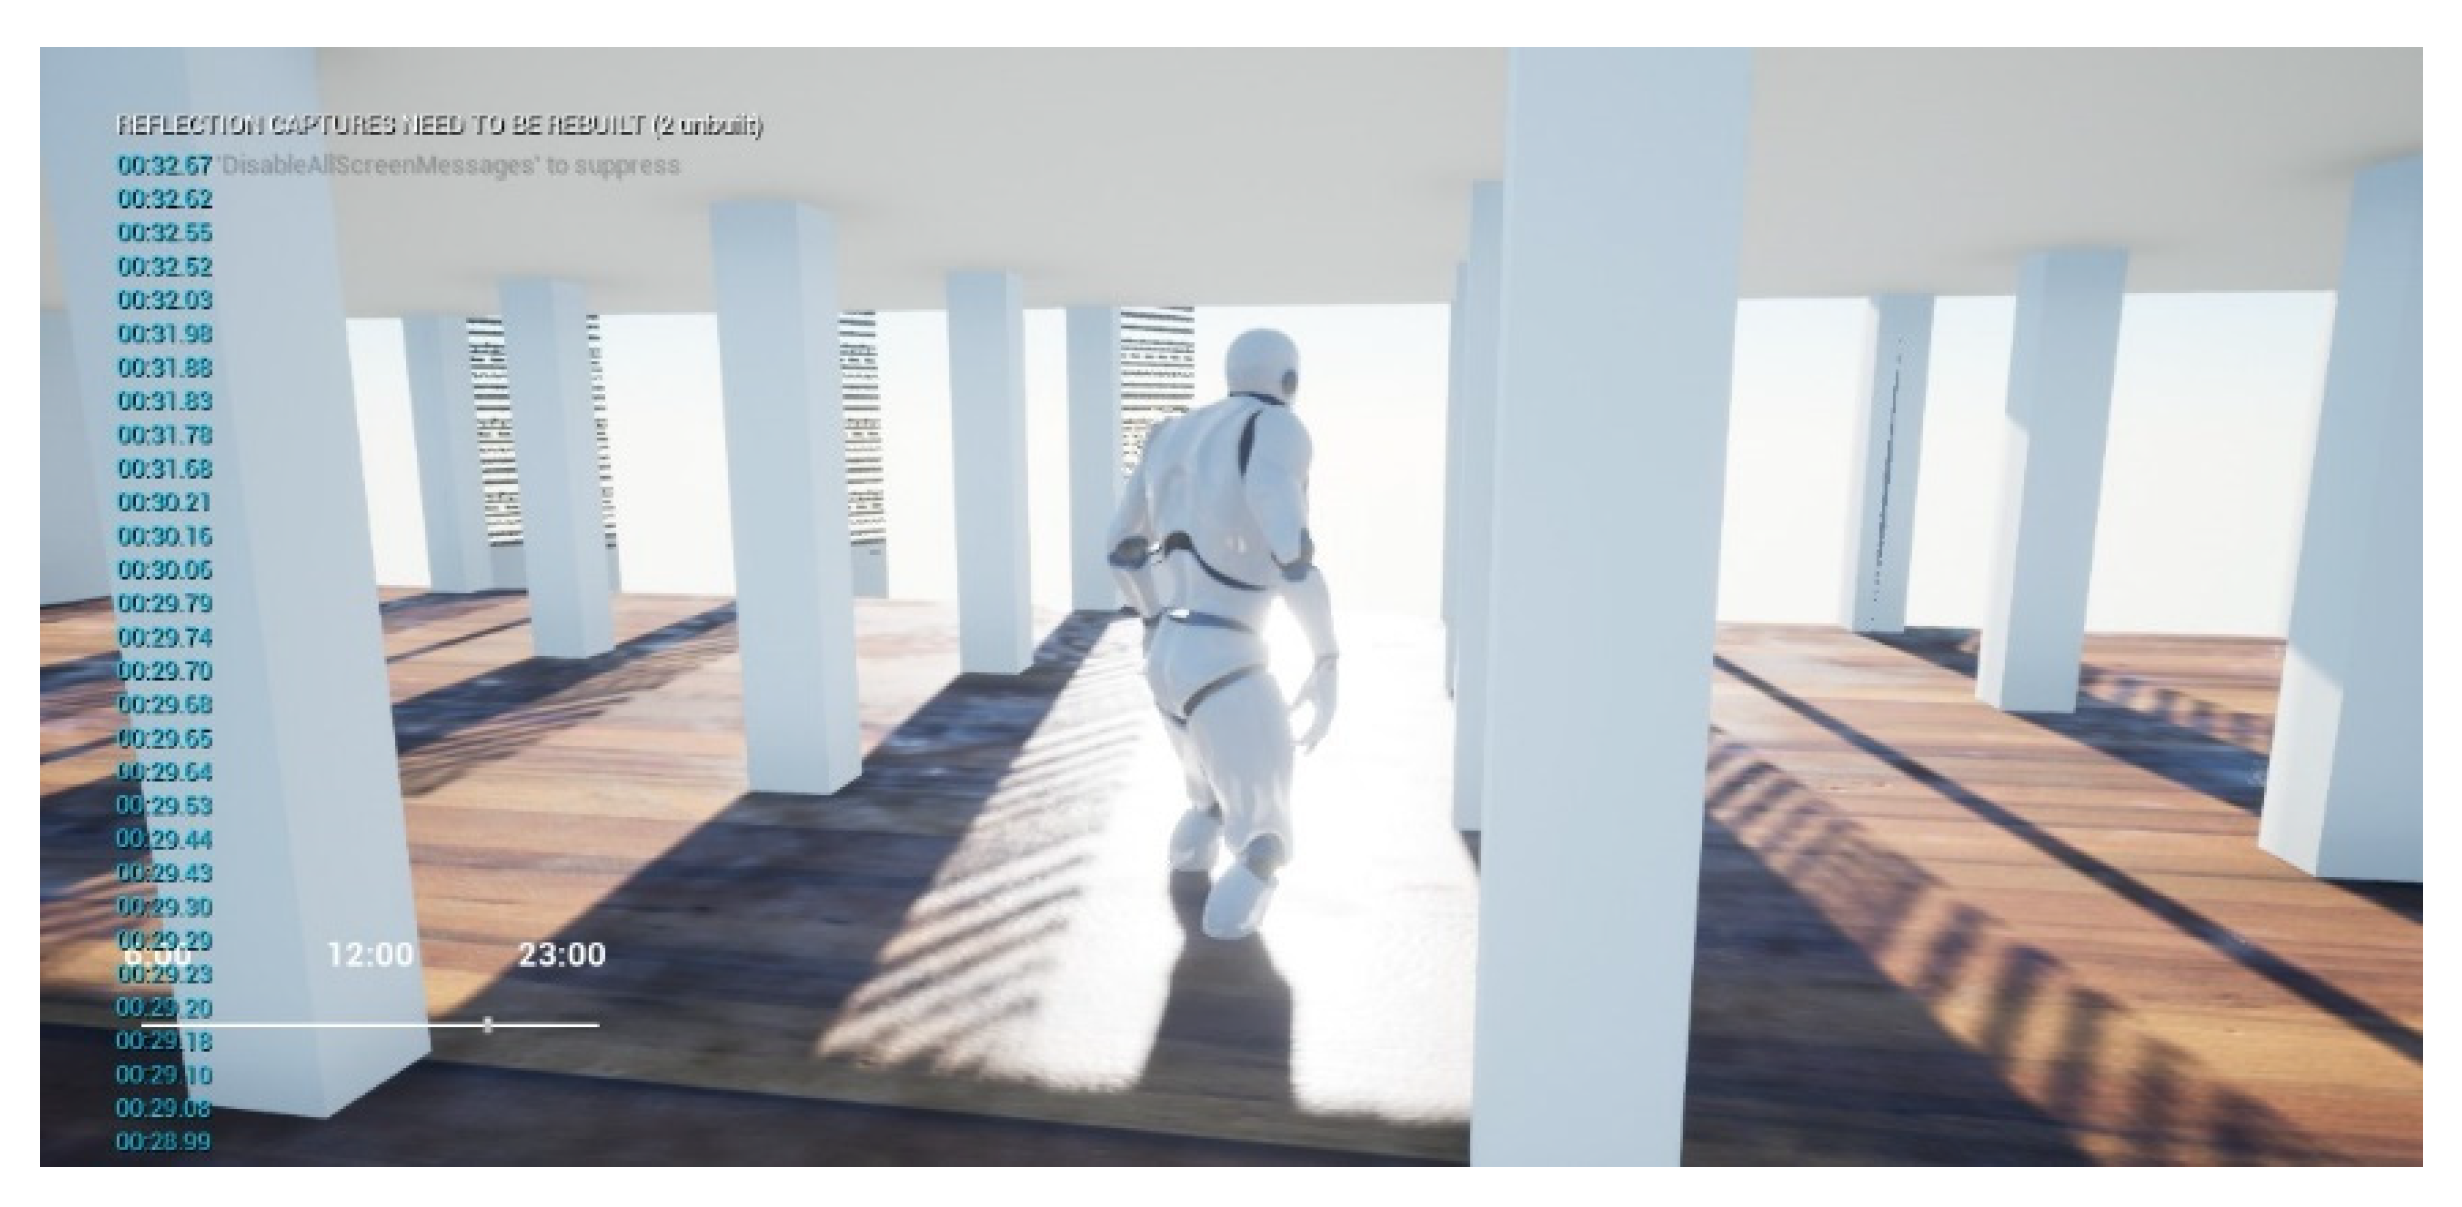
This animation blueprint can serve as a template for similar models that require motion animation with a replacement of the animations scripts and elements in the virtual environment and changes to the speed, angle, and direction of rotation, as desired by the user. The virtual reality model interface reflects the motion of the parametric design in a photo-realistic platform with the required environment for testing, which could only be realized in the model testing phase of existing process. The virtual reality model reflects the configuration of the building at various times of the day and iterations can be made to the generated parametric model based on the virtual analysis. The virtual model can be analyzed at different times of the day, as seen in Figure 16, with changes to the daylight in the virtual environment.
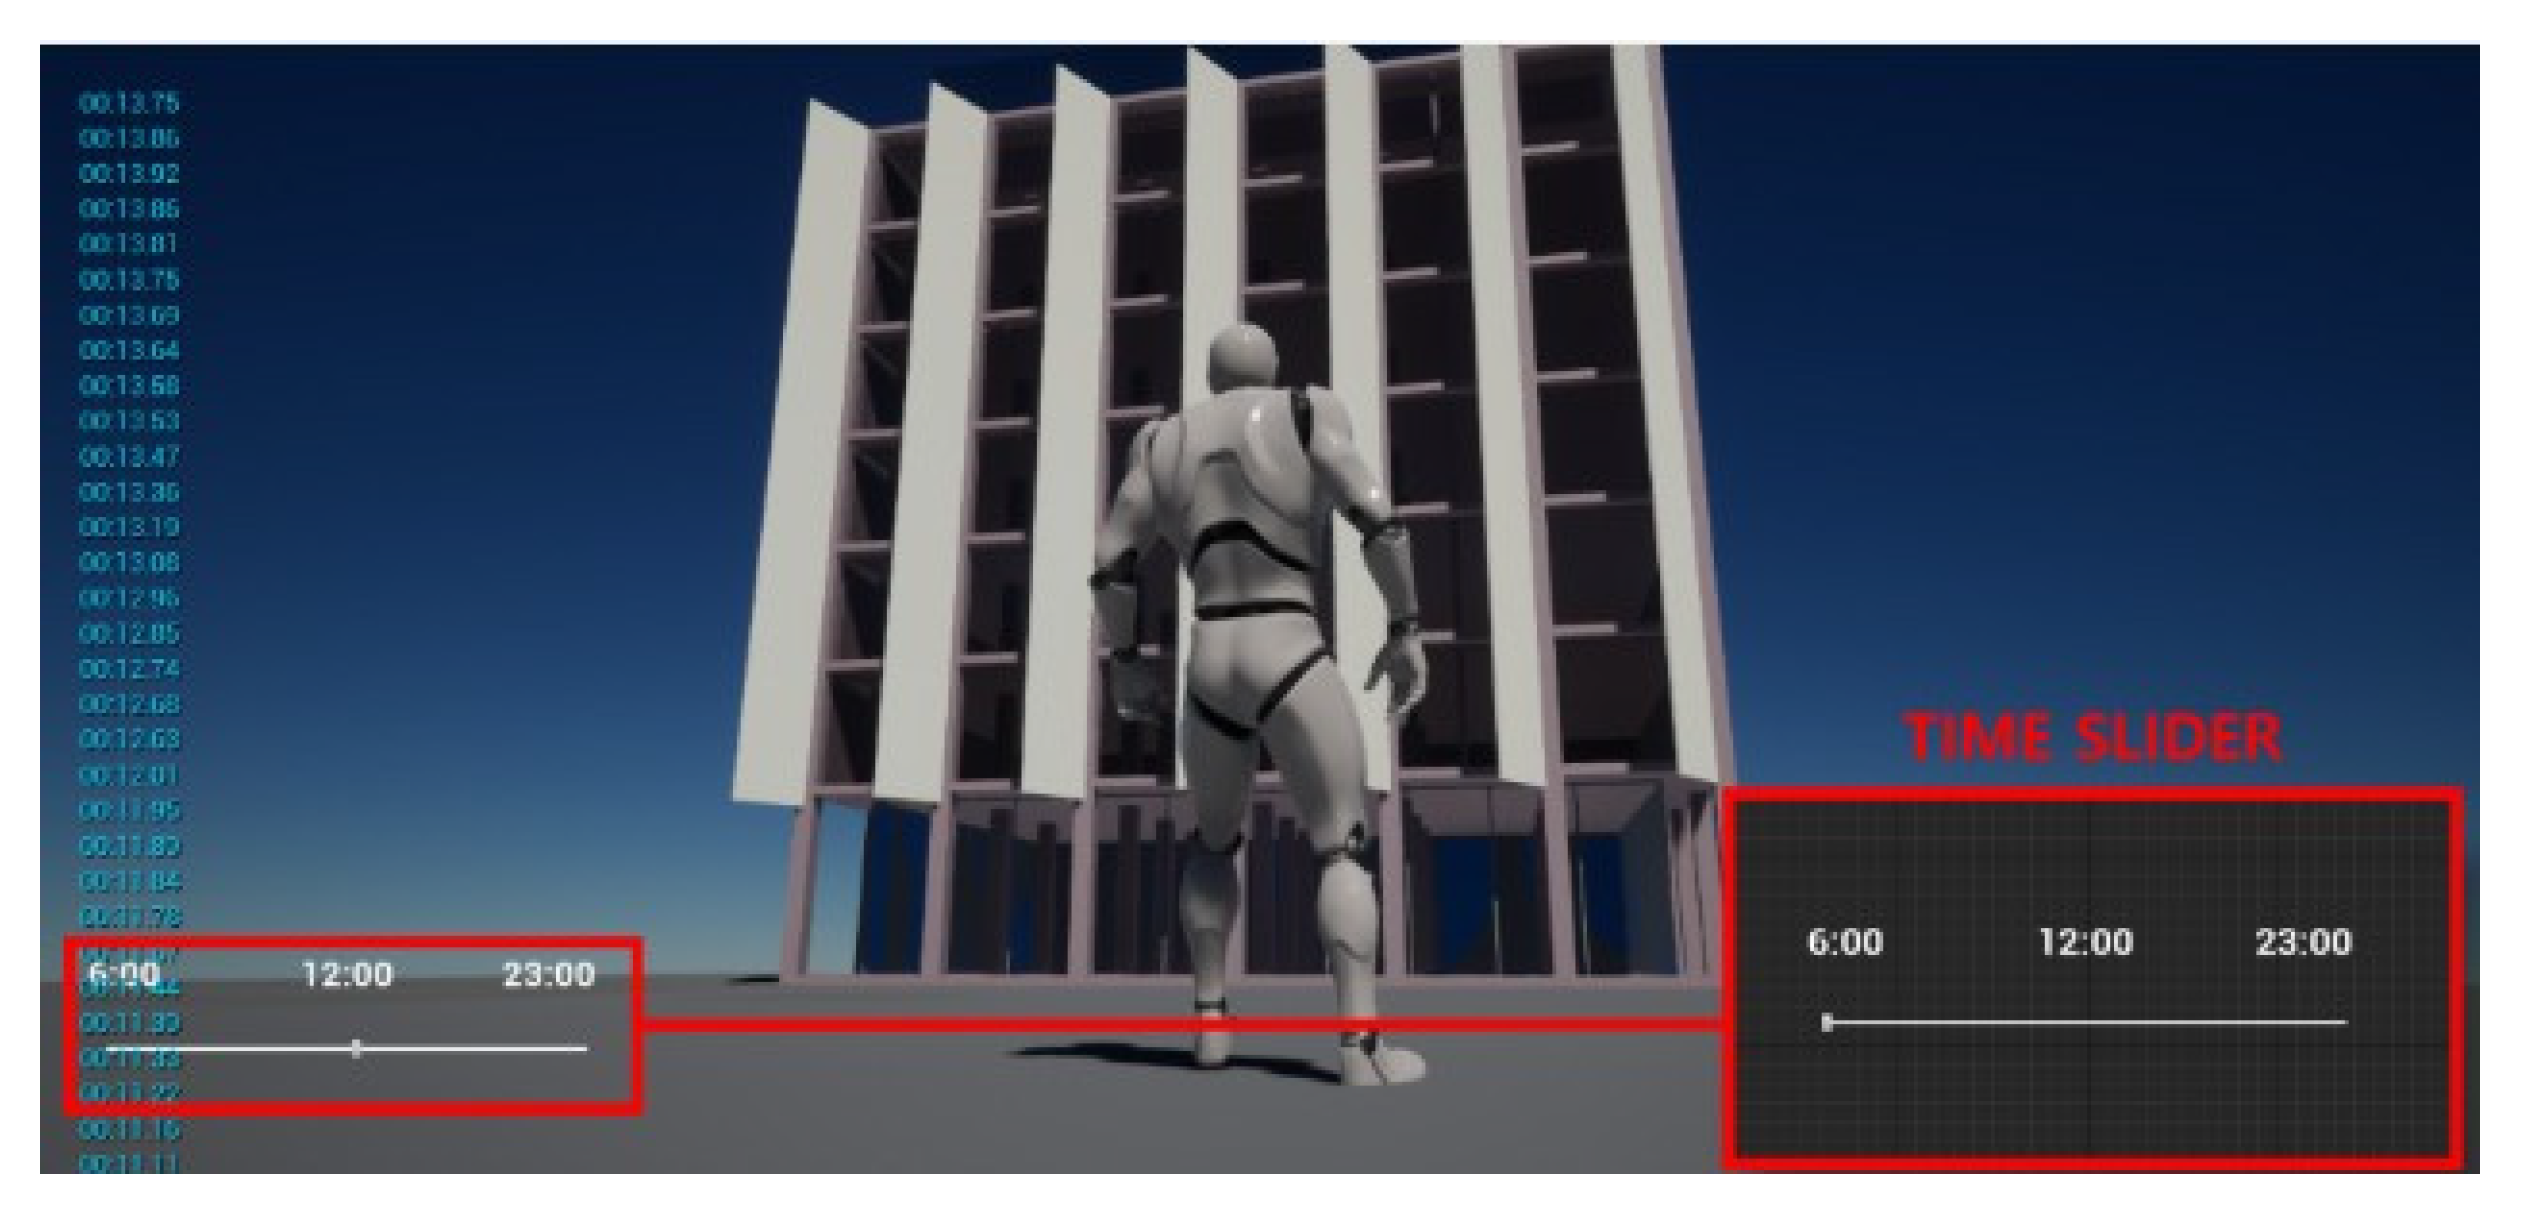
The geographical sun position and connection to an interactive facade system are controlled through a widget interface based on time of the day. Furthermore, the customization of the motion in terms of direction, type of mechanical motion, and speed and virtual environment are controlled through an interactive User Interface (UI). The widget UI binds to the animation blueprint and in this case, we utilized a time slider UI to control the entire virtual environment. The time slider controls the rotation of movable elements concerning sun position that reflects the time, as seen in Figure 17. Additionally, through a print screen script, the accurate time in hours, minutes, and seconds are printed on the screen.
Additionally, in the virtual model, various textures are applied to the model. Wood texture is applied to the floor and perforated metal to the shading louver that can be further analyzed at various times of the day in an immersive virtual environment, as seen in Figure 18.
5.2. Performance Verification through Certification
Daylighting design is a key aspect of building rating systems, such as Leadership in Energy and Environmental Design system (LEED). It uses metrics, such as Daylight Autonomy (DA), which is the percentage of annual work hours during which all or part of a building’s lighting needs can be met through daylighting alone [24].
A survey of various Certification organizations in relation to daylight autonomy state values that need to be attained for accreditation, as seen in Table 3. As regards daylight, one to three points are given for office buildings. Three different options can be selected for the assessment. The first option offers 2–3 points and it involves the assessment of the spatial daylight autonomy, as well as the annual sunlight exposure. More specifically, it should be demonstrated that a certain area should have daylight autonomy (i.e., the illuminance levels exceed 300 lx for more than 50% of the working hours per year), while at the same time the annual sunlight exposure (i.e., the percentage of floor area that receives more than 1000 lx for more than 250 occupied hours per year) does not exceed 10% [25].
There are five score levels defined on the range of the daylight factor’s ranges: Level 3, which indicates the average, is defined for values of daylight factor between 1.5% and 2%. The upper level, level 5, is defined for values of daylight factor exceeding 2.5%. The existence of daylight devices, i.e., fixtures that are used to harvest or guide daylight deep into the building, such as light shelves, light ducts, etc. are independently evaluated, given that they contribute to the improvement of daylight conditions, but cannot be quantitatively expressed through the daylight factor calculation [25].
In the case of BREEAM, daylighting is assessed on both a quantitative and a qualitative basis. The adequacy of daylighting is addressed via the use of daylight factor and illuminance levels on the working plane, while the quality of daylight is interrelated mostly with its uniform distribution across the indoor area. More specifically, an office building can get up to one credit for daylighting if one of two alternatives is satisfied. For the first alternative, the adequacy of the average value of 2% is required for more than 80% of the floor area [25].
The evaluation of this design process is according to the daylight credit of the LEED v4 Indoor Environmental Quality (IEQ) category provides the prospects for compliance to achieve optimal daylight in a building. While using simulation, the compliance criteria for this research are option 1 of compliance options of LEED, as seen in Table 4.
Two metrics in LEED v4 are codified for evaluating daylight autonomy design, which allow for a day lit space to be evaluated for a one-year period while using two different evaluation metrics (IES, 2012). Spatial Daylight Autonomy (sDA) and Annual Sun Exposure (ASE) are these two metrics, which form a clear picture of daylight performance that can help architects to make good design decisions.
The simulation conducted while using Diva Daysim plugins in Rhino Grasshopper simulation of the interactive facade presented in this study maintained the same sDA autonomy value of 61.6 while considering the rotation of the motion facade elements, as seen in Figure 19. The result shows that there is a need for the optimization of the model to attain the 75% that is required for LEED v6 approval.
sDA describes how much of space receives sufficient daylight, which should achieve (sDA 300 lux/50% of the annual occupied hours) for at least 55% of the floor area. sDA has no upper limit on luminance levels; therefore, ASE is used to describe how much of space receives too much direct sunlight, which can cause visual discomfort (glare) or increase the cooling loads. LEED v4 ASE measures the percentage of floor area that receives at least 1000 lux for at least 250 occupied hours per year, which must not exceed 10% of floor area (USGBC, 2013). The model meets the required standard of sDA 300 lux/50% of the annual occupied hours by a value of 61.6%.
6. Conclusion
In this research, we utilized a constraint-based parametric process to design facade elements that rotate according to the position of the sun and conducted further simulation in relation to climate and building conditions through the exploration of parametric design through algorithms.
The simulation results validate the building attaining the design performance benchmark at this stage of the design. The simulation results were the bases for the virtual reality visualization and the user interfaces operation in the virtual environment at various times of the day with corresponding changes in the virtual environment. Furthermore, the parametric algorithms utilizing automation increased the convenience of design, iteration, and simulation.
This research proposes a system of interworking between the virtual and digital models that reflects the behavior of the digital model in a performance-oriented interactive virtual façade design. The virtual environment served as a holistic view of the parametric model and further enhanced the comprehension of the facade through motion animation, lighting, and materials.
The parametric modeling and simulation are convenient through sliders that present different results that are based on adjustments of the metric by the user, which is a similar concept applied in the virtual user interface to adjust the motion of elements through sliders, thereby performing the modeling simulation and visualization process holistic, convenient, and improved iteration than previous processes that would have required more study models. The results of modeling and simulating the mechanics of the facade elements based on the sun position are the bases for the virtual motion as well as the reference.
The changes in mechanics speed and duration based on daylight were adjusted because of simulation results changes in the sun path simulation. Similar to the parametric modeling process, the virtual reality customized animation is based on a systematic and mathematical system in this paper using computational visual languages which is the method for visualizing the virtual reality motion in this research.
The blueprint in the virtual editor makes mechanics of rotation and translation or both possible based on the sun position, sky sphere at any directions in X(roll), Y(pitch), and Z(Yaw) Axis. This makes the programmable virtual mechanics visualization of any interactive facade mechanics possible in the virtual environment. The performance results show that, with integration of motion in the façade system in the building, the comfort of the building occupants was in the accepted range −0.5 to 0.5 and the areas of building with less than 1000 lux, which is the maximum for recommended daylight in buildings was approximately 50%, since the interactive facade was applied to one face of the building.
Furthermore, simulation according to LEEDv4 standards presents that the proposed building in this research maintains an sDA value of 61.6 at various times of the day and it will require iteration to the design to achieve the required 75% for approval. We acknowledge that this research is basic and simplified in the demonstration of the convergence of the performance-based models and virtual models. Further research intends to address more complicated geometry, structures, mechanics, and materialism through the convergence of other design tools and methods.
Author Contributions
D.S.P. conceived and designed the experiments and wrote the paper; T.K. performed the experiments and analyzed the data; S.C. supervised the research. All authors have read and agreed to the published version of the manuscript.
Funding
This research was supported by the National Research Foundation of Korea (NRF) grant funded by the Korea government (MSIT) (NRF-2019R1A2C2006983)
Conflicts of Interest
The authors declare no conflict of interest
References
- Bacha, C.B.; Bourbia, F.; Université Constantine. Effect of kinetic façades on energy efficiency in office buildings—Hot dry climates. In Proceedings of the 11th Conference on Advanced Building Skins, Bern, Switzerland, 10–11 October 2016. [Google Scholar]
- Sharaidin, K.; Salim, F.; RMIT University Australia. Design Considerations for Adopting Kinetic Facades in Building Practice. In Proceedings of the 30th eCAADe Conference, Prague, Czech Republic, 12–14 September 2012; Volume 2, pp. 629–637. [Google Scholar]
- Beesley, P.; Williamson, S.; Woodbury, R. Parametric Modelling as a Design Representation in Architecture: A Process Account. In Proceedings of the Canadian Design Engineering Network Conference, Toronto, Canada, 24–26 July 2006. [Google Scholar]
- Zarei, Y. The Challenges of Parametric Design in Architecture Today: Mapping the Design Practice. Master’s Thesis, The University of Manchester, Manchester, UK, 2012. [Google Scholar]
- Hernandez, C. Thinking parametric design: Introducing parametric Gaudi. Des. Stud. 2006, 27, 309–324. [Google Scholar] [CrossRef]
- Eltaweel, A.; Su, Y. Parametric design and daylighting: A literature review. Renew. Sustain. Energy Rev. 2017, 73, 1086–1103. [Google Scholar] [CrossRef]
- Woodbury, R. Elements of Parametric Design. In Elements of Parametric Design, 1st ed.; Routledge: London, UK, 3 July 2010. [Google Scholar]
- Burry, M. Scripting Cultures: Architectural Design and Programming, 1st ed.; Wiley: New York, NY, USA, 15 August 2011. [Google Scholar]
- Oxman, R. Theory and design in the first digital age. Des. Stud. 2006, 27, 229–265. [Google Scholar] [CrossRef]
- Schumacher, P. The Routledge Companion for Architecture Design and Practice. In Design Parameters to Parametric Design; Routledge & Taylor and Francis: New York, NY, USA, 2016. [Google Scholar]
- Zwikael, O.; Shtub, A.; Chih, Y.Y. Simulation-Based Training for Project Management Education: Mind the Gap, As One Size Does Not Fit All. J. Manag. Eng. 2015, 31, 04014035. [Google Scholar] [CrossRef]
- Nashaat, B.; Waseef, A. Kinetic Architecture: Concepts, History and Applications. IJSR 2018, 7, 750–758. [Google Scholar]
- Elkhayat, Y. Interactive Movement in Kinetic Architecture. J. Eng. Sci. Fac. Eng. Assiut Univ. 2014, 42, 816. [Google Scholar]
- Schumacher, M. MOVE—Bewegliche Bauteile und Komponenten in der Architektur: Architecture in Motion—Dynamic Components and Elements; Birkhäuser Verlag: Basel, Switzerland, 2010. [Google Scholar]
- Jang, S.Y.; Lee, S.; Kim, S.A. Collaborative Responsive Façade Design Using Sensor and Actuator Network. In Cooperative Design, Visualization, and Engineering; CDVE 2013; Springer: Berlin/Heidelberg, Germany, 2013; Volume 8091. [Google Scholar]
- García, A.S.; Fernando, T.; Roberts, D.J.; Bar, C.; Cencetti, M.; Engelke, W.; Gerndt, A. Collaborative virtual reality platform for visualizing space data and mission planning. In Multimedia Tools and Applications; Springer Verlag: Berlin, Germany, 2019. [Google Scholar] [CrossRef] [Green Version]
- Sweeney, T.; Games, E. Unreal Engine. Available online: unrealengine.com (accessed on 20 December 2019).
- Law, A.; Kelton, D. Simulation Modeling and Analysis; McGraw-Hill Higher Education: New York, NY, USA, 2000. [Google Scholar]
- Roudsari, M.S.; Pak, M. Ladybug: A parametric environmental plugin for grasshopper to help designers create an environmentally-conscious design. In Proceedings of the BS 2013: 13th Conference of the International Building Performance Simulation Association, Chambéry, France, 25–28 August 2013; pp. 3128–3135. [Google Scholar]
- Jahanara, A.; Fioravanti, A. Kinetic Shading System as A Means for Optimizing Energy Load; Sapienza University of Rome: Rome, Italy, 2017. [Google Scholar]
- Shaw, E.W. Thermal Comfort: Analysis and Applications in Environmental Engineering; Danish Technical Press: Copenhagen, Denmark, 1970. [Google Scholar]
- Guenther, S. What is PMV? What is PPD? The Basics of Thermal Comfort. Available online: simscaleblog.com (accessed on 20 December 2019).
- Toolbox, T.E. Recommended Light Levels (Illuminance) for Outdoor and Indoor Venues. Available online: engineeringtooblox.com (accessed on 20 December 2019).
- Reinhart, C.; Mardaljevic, J.; Rogers, Z. Dynamic Daylight Performance Metrics for Sustaina-ble Building. Leukos J. Illum. Eng. Soc. North Am. 2013, 3. [Google Scholar] [CrossRef] [Green Version]
- Giarma, C.; Tsikaloudaki, K.; Aravantinos, D. Daylighting and Visual Comfort in Buildings’ Environmental Performance Assessment Tools: A Critical Review. Procedia Environ. Sci. 2017, 38, 522–529. [Google Scholar] [CrossRef]
Figure 1.
Existing Method of Interactive Facade Design.

Figure 2.
Proposed Design Process.

Figure 3.
Parametric Design and Simulation Analysis Workflow in this Research.

Figure 4.
Grasshopper Algorithm for Parametric Modeling with Customized Sliders.

Figure 5.
Generated Model with Dimensional Information.

Figure 6.
Model with Motion Embedded Facade Louver Panels.

Figure 7.
Louver Rotation Algorithm.

Figure 8.
Ladybug Workflow and Functions.

Figure 9.
Application of the Sun path Algorithm to the Model.

Figure 10.
Area with Less than a 1000 Lux Algorithm.

Figure 11.
Honeybee Workflow and functions.

Figure 12.
Graph of Daylight Comfort Simulation.

Figure 13.
Calculation of Area with Less than 1000 Lux.

Figure 14.
Modeling and Virtual Reality Workflow.

Figure 15.
Virtual Reality Motion Animation Blueprint Visual Script System.

Figure 16.
Virtual Reality Model Reflecting Changes in Motion in Relation to Daylight at Different Times of the Day.
Figure 16.
Virtual Reality Model Reflecting Changes in Motion in Relation to Daylight at Different Times of the Day.

Figure 17.
Interactive Motion and Time Slider in the Virtual Environment.

Figure 18.
Immersive View of the Interactive Facade with Light and Textures.

Figure 19.
sDA Value for Proposed Model at 61.6%.


Table 1.
A Survey Parametric Tools in the Architecture Industry and their Function.
| Geometry and Data Modeling | Energy and Thermal Simulation, Climate Analysis | Daylighting Simulation | Computational Fluid Dynamic Simulation | |
|---|---|---|---|---|
| Main Scope | Create geometrical and data model that support simulation | Predict the impact of architectural design in energy consumption and emissions | Anticipate natural light quality and visual comfort as a function of a space’s geometry and material surfaces | Model airflows inside and outside the buildings, predict comfort |
| Concept Design | Rhino, Sketchup, Vasari | Ecotect Sun Tool, Ecotect, Vasari(Beta), Climate Consultant, EcoDesigner, ComFen | Ecotect, Velux Daylighting Visualizer, Radiance, DIVA | Vasari Wind Tunnel(Beta), Design Builder CFD |
| Design Development | Revit, Archicad | OpenStudio, EnergyPlus, DesignBuilder, IES-VE, eQuest, TRNSYS | 3Ds Max, Radiance, Daysim, DIVA | Fluent, Virtual Wind |
| Parametric Design | Grasshopper, Dynamo | JePlus, JePlus EA | Grasshopper and various plug-ins |
Table 2.
Typology of Motion in Facades and Case Studies.
| Rotation | Translation | Rotation and Translation | |
|---|---|---|---|
| Mechanical Concept |  |  |  |
| Architectural Type |  |  |  |
| Direction | Horizontal/Vertical | Horizontal/Vertical | Horizontal/Vertical |
| Sample of Movement |  |  |  |
| Case Study |  |  |  |
Table 3.
Comparison of Certification Organizations Daylight Credit Standards.
| Certifications Organization | Daylight Autonomy Methods | Value % | Credits/ Level |
|---|---|---|---|
| LEED | Percentage floor area that achieved sDA 300/ 50% | 55% ≤ 75% | 2 and 3 |
| BREEAM | Percentage of the floor area that achieved modified average | 60% ≤ 80% | 1 and 2 |
| CASBEE | Average Daylight Factor | 1% ≤ 2.5% | 1–4 |
Table 4.
Compliance Options for the Leadership in Energy and Environmental Design system (LEED) v4 in Relation to Indoor Environmental Quality (IEQ).
Table 4.
Compliance Options for the Leadership in Energy and Environmental Design system (LEED) v4 in Relation to Indoor Environmental Quality (IEQ).
| Daylight Simulation | Option 1 | Use simulation to demonstrate that the spatial daylight autonomy (sDA) is achieved for at least 55% of the space |
| Option 2 | Use simulation to demonstrate that the illuminance between 300–3000 lux are achieved for the 9 am to 3 am at equinox for at least 75% of the space | |
| Actual Measurements | Option 3 | Use the measurement to demonstrate that the levels of 75% of the space is between 300–3000 lux |
© 2020 by the authors. Licensee MDPI, Basel, Switzerland. This article is an open access article distributed under the terms and conditions of the Creative Commons Attribution (CC BY) license (http://creativecommons.org/licenses/by/4.0/).
Share and Cite
MDPI and ACS Style
Panya, D.S.; Kim, T.; Choo, S. A Methodology of Interactive Motion Facades Design through Parametric Strategies. Appl. Sci. 2020, 10, 1218. https://doi.org/10.3390/app10041218
AMA Style
Panya DS, Kim T, Choo S. A Methodology of Interactive Motion Facades Design through Parametric Strategies. Applied Sciences. 2020; 10(4):1218. https://doi.org/10.3390/app10041218
Chicago/Turabian StylePanya, David Stephen, Taehoon Kim, and Seungyeon Choo. 2020. "A Methodology of Interactive Motion Facades Design through Parametric Strategies" Applied Sciences 10, no. 4: 1218. https://doi.org/10.3390/app10041218
Note that from the first issue of 2016, this journal uses article numbers instead of page numbers. See further details here.