Portable Sensor System for Registration, Processing and Mathematical Analysis of PPG Signals


Institute of Robotics, Bulgarian Academy of Sciences, 1113 Sofia, Bulgaria
*
Author to whom correspondence should be addressed.
Appl. Sci. 2020, 10(3), 1051; https://doi.org/10.3390/app10031051
Submission received: 31 December 2019
/
Revised: 1 February 2020
/
Accepted: 2 February 2020
/
Published: 5 February 2020
(This article belongs to the Section Electrical, Electronics and Communications Engineering)
Abstract
:This article introduces an integrated photoplethysmographic (PPG) based cardiovascular monitoring system that consists of an individually portable PPG device for recording photoplethysmographic signals and a software system with a serverless architecture for processing, storing, and analyzing the obtained signals. The portable device uses the optical plethysmography technique for measuring blood volume in blood vessels. The device was tested and validated by a comparative analysis of three photoplethysmographic signals and one Electrocardiographic signal registered simultaneously in the target subject. The comparative analysis of these signals shows insignificant deviations in the obtained results, with the mean squared error between the studied signals being less than 21 ms. This deviation cannot affect the results that were obtained from the analysis of the interval series tested. Based on this result, we assume that the detected signals with the proposed device are realistic. The designed software system processes the registered data, performs preprocessing, determines the pulse rate variability, and performs mathematical analysis of PP intervals. Two groups of subjects were studied: 42 patients with arrhythmia and 40 healthy controls. Mathematical methods for data analysis in time and frequency domain and nonlinear methods (Poincaré plots, Rescaled Range Plot, Detrended Fluctuation Analysis, and MultiFractal Detrended Fluctuation Analysis) are applied. The obtained results are presented in tabular form and some of them in graphical form. The parameters studied in the time and frequency domain, as well as with the nonlinear methods, have statistical significance (p < 0.05) and they can distinguish between the two studied groups. Visual analysis of PP intervals, based on Poincare’s nonlinear method, provides important information on the physiological status of patients, allowing for one to see at a glance the entire PP interval series and quickly detect cardiovascular disorders, if any. The photoplethysmographic data of healthy individuals and patients diagnosed with arrhythmia were recorded, processed, and examined through the system under the guidance of a cardiologist. The results were analyzed and it was concluded that this system could serve to monitor patients with cardiovascular diseases and, when the condition worsens, a signal could be generated and sent to the hospital for undertaking immediate measures to stabilize patient’s health.
1. Introduction
The prevention of cardiovascular diseases and their early detection is one of the main areas of modern cardiology [1,2]. Usually, studies in hospitals and clinics are done after the disease has already occurred. One way to prevent and reduce the risk of cardiovascular disease is to use portable devices designed to detect changes in blood volume in the blood vessels based on the photoplethysmographic method. The non-invasive photoplethysmographic (PPG) method is an effective way to study heart rate and cardiovascular disease, monitor respiratory rate, blood oxygen saturation, autonomic functions, and tissue perfusion [3]. Through the PPG method, assessments can be made of the aging processes of the vascular system, the monitoring of hypertension, atherosclerosis, early screening, and assessment of arterial stiffness and elasticity [4].
Portable PPG devices must work reliably under the conditions of free movement activity and allow them to be used for a long time. The amount and quality of diagnostic information obtained with these devices must be sufficient to form a conclusion regarding the condition of the cardiovascular system and its modification. PPG-based medical systems should be cheap and easy to use, enable reliable processing of retrieved biomedical signals, and the rapid transfer of processed data and the results of mathematical analysis.
The portable PPG devices used in the diagnosis of cardiovascular disease are among the most sought after medical devices. These devices are an alternative to electrocardiographic (ECG) devices and they are used in several applications, such as modern, non-invasive, convenient, and inexpensive equipment.
The assessment of the physiological parameters of the human body based on photoplethysmographic signals that were recorded by portable PPG devices is an up-to-date scientific task. Applying innovations in this area will lead to the widespread use of these types of devices to reduce cardiovascular mortality. According to a study [5,6], the use of the parameters that were determined in the mathematical analysis of PPG data for the diagnosis and prevention of cardiovascular disease is an unresolved problem.
As is well known, PPG and electrocardiographic (ECG) signals today are regarded as nonlinear and non-stationary processes that have periodic and chaotic components. At the end of the 20th century, based on the ideas of the Nobel laureate Ilia Prigozhin, M. Shaldach suggested that the heart be considered as an open, non-linear, and nonequilibrium system [7]. He identifies it as the first major task facing scientists, physiologists, and physicians, the pooling of their efforts, and knowledge in the search for new ways to solve a number of clinical problems, thus to help a large number of patients with cardiovascular diseases. The existing nonlinearities in the heart’s regulating systems determine the chaotic nature of the heart rhythm, with each PP (RR) interval (PP and RR are the intervals between successive heartbeats) different from the rest, as they are unique [8]. The reason for the appearance of randomness in the photoplethysmograms (electrocardiograms) is related to the randomness of the processes that takes place in the heart. Therefore, it is appropriate to use nonlinear dynamics methods, such as fractal and multifractal methods for evaluating the information characteristics of the internal organization of PPG signals [9]. Processes with fractal characteristics have the following properties: fractal dimension and self-similarity. The fractal dimension (D) is determined by the following formula: D = 2 − H, where H is a Hurst exponent [10]. The formula shows that the Hurst exponent is one of the key indicators characterizing fractal signals. In the physical sense, this parameter characterizes the degree of self-similarity, as well as the complexity of the dynamics and the correlation function of the investigated signal. The signal is self-similar if it can be decomposed into smaller parts, each of which is similar to the main signal. For example, when heart rate is recorded at different time intervals (minutes, hours, days), rapid signal fluctuations appear to be the same as slow fluctuations. The Hurst exponent accepts values that are in the range from 0 to 1. If H > 0.5, then the investigated signal has the property of long-range dependence, ie. the autocorrelation function tends to zero slowly with the increase of the time parameter [11]. If H < 0.5, then the signal has the property of short-range dependence, that is, the autocorrelation function decreases exponentially with increasing time. In the boundary case, when H = 1/2, then D = 3/2, and the signal studied is a Brownian motion. Among the methods for nonlinear analysis of PPG signals, methods of obtaining estimates of their large-scale invariance are of particular interest. The monofractal signal is homogeneous in the sense that it has the same scale properties that can be characterized both locally and globally by a single scale indicator, for example, the Hurst exponent, fractal dimension. In contrast to the monofractal signal, the multifractal signal consisted from a large number of homogeneous fractal subsets, whose features can be characterized by a spectrum of local Hurst exponents or fractal dimensions. The fractal and the multifractal approach allows for new estimates to be obtained that give an idea of the intrinsic, nonlinear, dynamic processes in the studied signals as compared to the classic Time- and Frequency-Domain analysis methods [12]. The decrease in the fractal dimension, respectively, the increase in the Hearst exponent, indicates an increase of the chaotic components of the cardio intervals. Non-linear methods for analyzing PPG signals can determine the presence or absence of a disease and they can be used both for rapid diagnosis and as an integral part of a more complex diagnostic system. The introduction of additional nonlinear methods, such as Poincaré plot, Approximate entropy, and Sample entropy for characterizing PRVs, allow for an additional assessment of the qualitative and quantitative properties of PPG signals, which extend the scope for clinical interpretation [13].
1.1. Research Background
Different types of PPG devices have been developed according to the type of sensors used, according to the location of the device, according to the method of transmission of the recorded data [6].
The use of PPG data for cardiac activity analysis can be very useful in cases where the ECG cannot be taken or when the obtained ECG has large electrical artifacts [14].
The location of the sensor is one of the main factors for recording correct and quality cardiac signals. It has been found that, when a finger sensor is used [6,15], high amplitude signals are obtained as compared to the amplitude of signals received from other locations of the human body. Sufficiently good quality of the registered PPG signals can be obtained by locating the sensors on the palms, ears, and face [16] of the subject under study. The improvement of PPG technology enables the entry of cardiac recording devices that can be located on the wrist of the hand [17], the ear mussel [18], the forehead [19], the esophagus [20].
The authors of [21] present a PPG device for measuring the patient’s blood-oxygen saturation level (SpO2) and pulse rate. The device uses a sensor that is positioned on the patient’s finger. The software has been created to process and investigate the received signals in a LabView environment.
Different types of sensors and software implementation of linear and nonlinear methods for analyzing PPG signals are presented in the work [22].
A wearable photoplethysmography sensor based device with a microcontroller that is built into the device and its application for assessing mental distress presents the study’s authors [23]. The conducted studies are based on an analysis of the pulse rate variability of the obtained PPG data (taken with a sampling rate of 60 Hz and a 22-bit resolution). The algorithms created are built into the microcontroller and can work in real time.
In their work, [24] present an experimental model of a PPG based portable device that is designed for the individual observation of patients with cardiovascular disease. The device includes an infrared optical sensor, an analog filter, an operational amplifier, a user interaction module, a power management module, a flash memory, and a microcontroller that performs the analog-to-digital conversion and data transmission. The created device can transmit the received data to the server through a mobile phone to which it is connected.
The authors of [25] investigate the use of PPG data for Pulse Rate Variability (PRV) analysis as an alternative to Heart rate variability (HRV [26] for ECG data) under non-stationary conditions. A software system for PPG and HRV analysis has been created in the time domain and frequency domain. Statistical, HRV indices and PRV indices, spectral capacities in LF and HF domain, TF coherence, etc. were determined, analyzed, and compared. The authors present results that are close to each other and only differences in the HF domain are observed.
In the study [27], the authors analyze PPG data that were obtained from the right forefinger of healthy people and propose a method for improving the accuracy of blood pressure measurement.
The authors of article [28] create a multi-site measurement system for analyzing right-left simultaneous differences in PPG pulse waveforms from the three segmental levels at the ears, thumbs, and toes (a total of six signals registered simultaneously). The system is validated by determining the RMSE coefficient for these signals and showing a high degree of correlation of the studied input signals. The authors investigate the similarities in the timing of signals from the left and right half of the human body and find a high degree of similarity in healthy individuals. In diseased individuals (especially in the presence of pathologies), differences are found that are explained by the presence of the disease in one half of the body (eg in an organ). An established system can be very useful in making clinical evaluations.
In their study, the authors of [29] describe the created multi-site measurement system for the analysis of eight PPG signals and one ECG signal simultaneously registered. The investigated signals are recorded online and the data processed offline while using the Matlab development environment. The analyzes were performed on signals received from 16 volunteers. The system can be used for medical diagnostics.
Pulse Rate Variability analysis and Heart Rate Variability analysis applications for cardiological data can be grouped into two main groups: desktop applications and web-based applications. Desktop applications must be installed or developed for a particular operating system and they must have strict hardware requirements to ensure the proper functioning of the application. This hardware dependency might be a disadvantage for some users. The most popular desktop applications for Heart Rate Variability analysis are: Kubios HRV software [30], CODESNA [31], SinusCor [32], gHRV [33], and others.
Traditional web-based applications [34,35,36,37] offer a single database. The centralized architecture of these applications allows for you to store all of your data in one place. The installation, setup, and maintenance of the software is web based. All of the changes and modifications to the system are made on the server of the system without having to be reflected in different jobs. This makes their maintenance efficient, fast, and inexpensive.
In modern medicine, there is an acute problem that is associated with organizing the process of continuous monitoring of indicators that determine the physical condition of the human body (photoplethysmograms, electrocardiograms, blood pressure, pulse, breathing, temperature) of patients being treated in hospitals and clinics with minimal involvement of nursing staff and observed patients when they are at work or home. Body Sensor Networks (BSNs) have been created to solve this problem, which are a continuation of Wireless Sensor Networks. BSNs are fast-paced in healthcare, fitness, rehabilitation, emotion recognition, and many other applications of the Internet of Things, thus enabling 24/7 monitoring of at-risk patients. BSNs collect sensitive data from various sensors located on the human body and use computational technologies for signal processing and machine learning to retrieve information. Combining data from multiple heterogeneous, sensory sources becomes a basic but non-trivial task for BSN.
In a publication [38], the authors discuss the motives and advantages of multisensor data synthesis, focusing on identifying the physical activity of the subjects studied, identifying parameters that influence the choice of data design at different levels (data, function, and decision). A major issue in the development of BSN for blood pressure monitoring, which is essentially related to the development of portable sensor devices, being characterized by small size, optimal placement, and low power consumption, is discussed in [39]. BSNs are progressing towards multi-technology integration and intelligence. With the advent of cloud technologies, BSNs are evolving toward the long-term monitoring of several vital human health indicators, long-term storage, and engagement with application services. The future of BSN is fundamentally promising, which will profoundly change human-machine relationships and improve people’s quality of life [40].
On the basis of the conducted research for the existing photoplethysmographic systems, the following summary can be made: photoplethysmographic systems perform the following activities: registration of PPG signals, processing, mathematical analysis of the defined PP interval series, and evaluation of the obtained results. These systems record PPG signals of different duration: minutes, hours, 24 h, and perform assessments of various factors (cardiovascular disease, diseases of the autonomic-nervous system, physical and emotional stress, bad habits, etc.) that affect the human body. The created non-commercial systems use both linear and non-linear methods of analysis, and they have a primary scientific purpose because non-linear methods of analysis are not standardized. The software applications that are created on these systems are desktop or web-oriented.
1.2. The Purpose of This Article
The purpose of this article is to present a portable system for recording, processing, storing, and mathematically analyzing PPG signals to assist cardiologists in the diagnostic process and in taking preventive measures to protect the health of at-risk patients. The system combines the convenience of photoplethysmographic devices, the accuracy of the results of PPG analyzes performed with modern mathematical technologies, and the advantages of serverless architecture in web-based software implementation. The new photoplethysmographic system enables the expansion of hardware with additional sensors and other components, as needed (to solve new future tasks).
2. Portable Sensor System for Registration, Processing and Analysis of PPG Signals
The new portable sensor system for recording and analysing PPG signals that is presented in this article consists of a portable device for registering PPG signals and a serverless web application for preprocessing, mathematical analysis, and evaluation of PRV of time series obtained while using a photoplethysmographic device.
2.1. Portable Sensor Device for Registration of PPG Signals
The portable sensory device (Figure 1) is used to record changes in blood volume by a sensor placed on the patient’s finger and/or ear. PPG technology is an optical measurement technique, whereby, using an invisible infrared light source transmitted to human tissue and a photodetector, the intensity of the light transmitted or reflected by the tissues is recorded.
The created photoplethysmographic device is managed from a microcontroller, as for the specific conversion a microcontroller from the LPC546xx MCU family (manufactured by NXP Semiconductors), was used. The PPG device can work with discrete sensors that are external to the device (in the form of a pinch that is placed on the index finger of the hand or the ears).
The AFE4490 integrated circuit (manufactured by Texas Instruments) is used to process the signals that they receive, which is used to convert the signals and control the LEDs. This integrated circuit has two separate channels, which allows for the use of two external sensors (pinch) at the same time. Standard Nellcor-compliant PPG finger and ear sensors are used (Figure 2). In addition to the ability to work with external sensors, the device has a built-in integrated sensor (using the MAX30102 scheme, manufactured by Maxim Integrated), which allows for short-term measurements of heart rate and oxygen content in the blood.
Several types of memory are built into the PPG device, such as for RAM, the internal memory of the microcontroller is used. The device has a real-time clock (DS3231/manufactured by Maxim Integrated) powered by a separate battery, which can track and record the exact astronomical time of the study (recording of photoplethysmographic signals of the investigated individual). An expansion connector (if necessary to add new functionality), a Bluetooth module, and more module can be installed.
The device’s PCB is four-layer and it is designed with an open source KiCAD PCB design system [41].
Power is provided by a Li-ion rechargeable battery and a buck-boost SMPS converter (TPS63001, manufactured by Texas Instruments) and a charger circuit (BQ24075, manufactured by Texas Instruments) for battery management and charging, when the device is connected to a PC through a USB connector.
The device has two buttons. One for switching ON/OFF, while using a smart button on/off controller (STM6601/STMicroelectronics) and other that can be used by a software.
The created PPG based device can transmit the logged data over a period of time (from a few seconds to several hours) or continuously to the software web based system for processing and analyzing the received data.
PPG sensing technology uses the properties of the light to detect changes in the arterial blood volume in a closed area (tip of the finger, ear, nose, wrist, etc.). The principle of operation of PPG sensors is to record changes that occur in the light intensity upon reflection or transmission through the tissue. These differences reflect the changes in the blood perfusion of the human tissue. The PPG sensors can operate in two modes: transmission mode and reflection mode. In the reflection method, the light source and the photodetector are placed on the same side of the fabric, while two different sides of the fabric are placed in the transmission method.
The experimental device works in two modes: transmission mode, with integrated sensor, which is external to the device and in the form of a pinch; reflection mode via a discrete sensor that is integrated into the device.
For the discrete sensor, the red LED operates at a wavelength of 660 nm; the infrared LED operates at wavelength-880 nm. For the integrated sensor (max30102), the red LED operates at a wavelength of 660nm; the infrared LED operates at wavelength-880nm. Standard Nellcor compatible PPG sensors for finger and ear are used [42].
2.2. A Serverless Web Application for Processing and Analyzing Photoplethysmographic Signals
In this work, the preprocessing and mathematical analysis of registered PPG signals with the developed experimental portable device is performed while using a web-based application through the application of Amazon serverless technology. In the serverless model, Amazon Web Services (AWS) cloud provider provides fully managed end-user computing and storage services. The services use servers, regardless of the name, and the developer abstracts these servers. In this way, the configuration and management of the underlying architecture are done by the cloud provider, not by the web application developer. The web application runs on servers, with AWS taking full control of them. This eliminates the need for resource allocation, scale, and server support for running applications, databases, and storage systems. While using serverless architecture, developers can focus on creating the web application without having to manage the servers or take the time to maintain them when running in the cloud or locally [43,44,45,46].
Creating web applications while using a serverless architecture as compared to traditional web applications has the following main advantages [47,48,49]:
Scalability: Serverless architecture provides automatic scaling as the number of users while using the application increases or decreases. In a private or public cloud environment, it is possible to configure it, so that new computing instances are provisioned when there is an increase in demand. However, this usually takes some time to happen, which could potentially lead to users not being able to access the application and ultimately provide an unsatisfactory experience. Conversely, serverless applications can handle bursts of traffic by design, so no adjustments need to be made to handle intermittent traffic.
Cost-efficiency: One of the biggest benefits in implementing a serverless architecture is that the modal of paying for the computing power that is needed is taken to the next level. In a traditional cloud computing setup, server instances can be brought up or terminated based on the level of traffic to the application and costs are only accrued for running instances. In a serverless model, this is granularized further, so the costs are associated to the number of requests to the web application and the amount of stored data. This means that if there are no new requests are sent to it, the application is essentially running for free.
Development: A serverless implementation requires no time to be spent on managing the underlying architecture. The developers need to only focus on creating the logic required for the application, as they can just bundle it and its dependencies in serverless functions and invoke them when needed. In contrast, in a traditional web-application, the code would need to be deployed to a server that needs to be correctly provisioned and managed. Serverless is growing faster than any other cloud service with developing efficiency as one of the main reasons for its fast adoption rate.
2.3. Preprocessing and Mathematical Methods for PRV Analysis
Desktop and web applications are not new in the field of PRV analysis; in this article, the authors apply the use of a serverless web application in the creation of a PPG data processing, analysis, and storage software system. The web application created consists of the following three modules:
- module for preprocessing of registered photoplethysmographic signals using the portable device presented above;
- module for determining PP intervals between heart beats; and,
- module for mathematical analysis and evaluation of PRV.
2.3.1. Module for Preprocessing
PPG technology is a modern, non-invasive method for measuring the activity of the cardiovascular system, based on the examination of blood volume that is caused by cardiac pulsations by the detection and analysis of optical radiation passing through human skin. The input data are obtained while using an integrated sensor directly in digital form or by using a discrete sensor and subsequent analog-to-digital conversion.
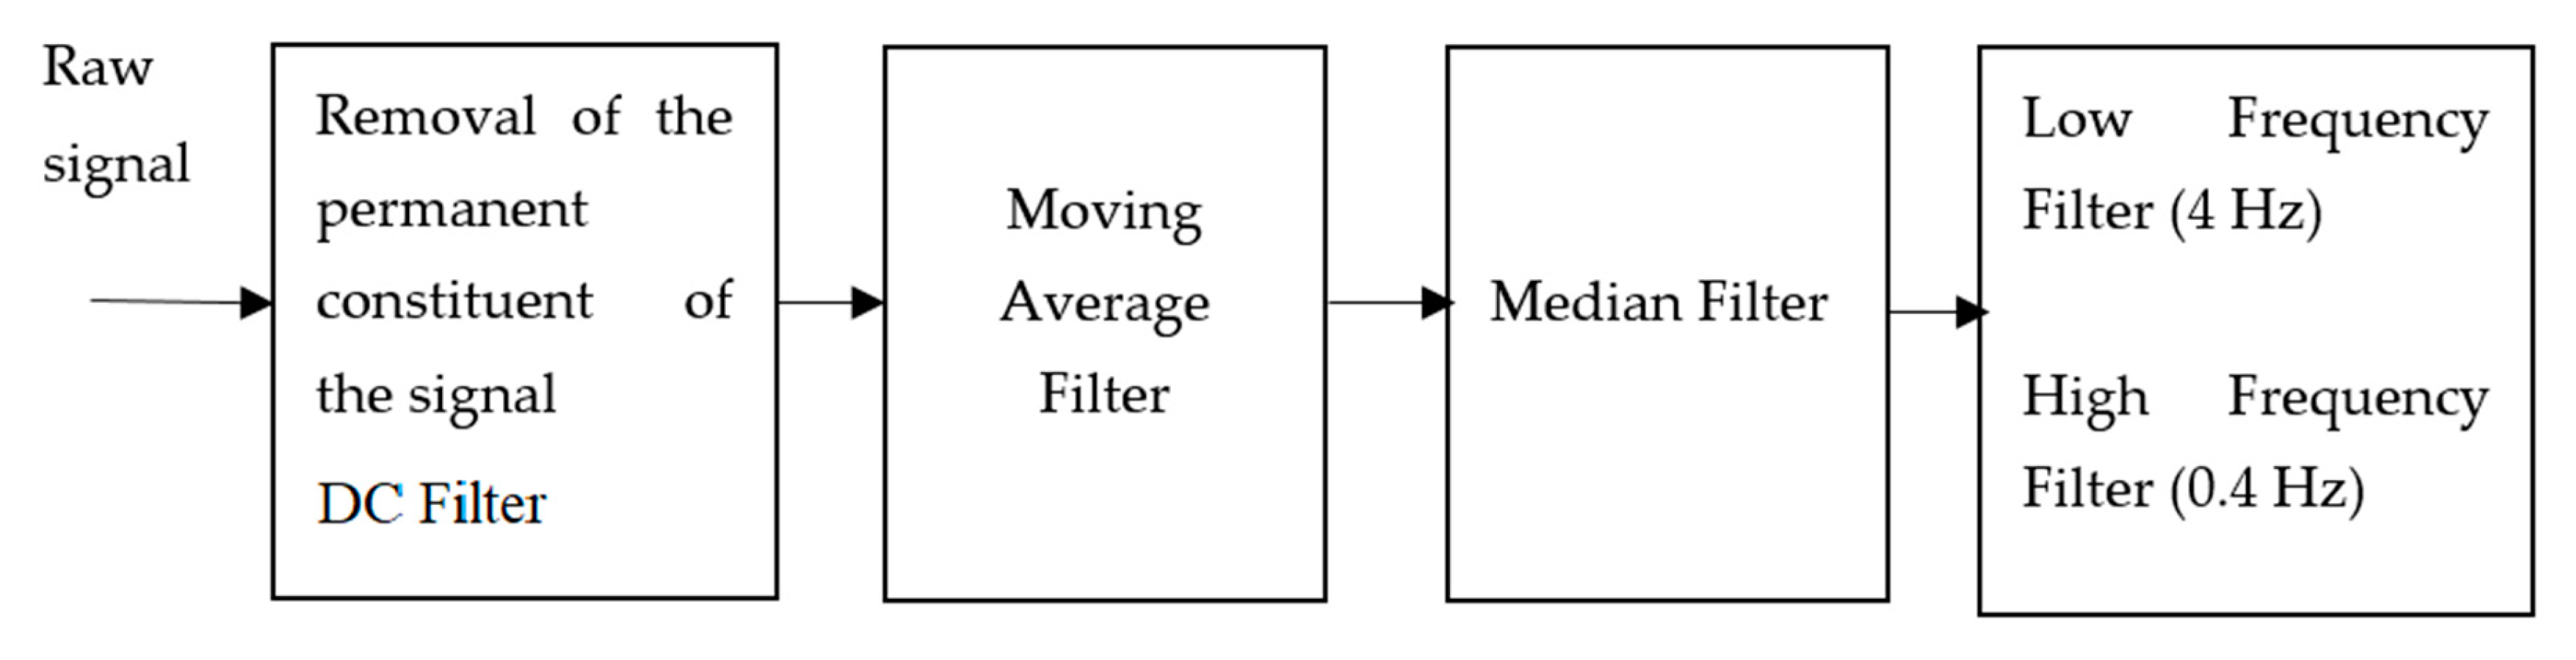
Cardiac function testing by determining the mathematical parameters while using the non-invasive integrated PPG-based method requires the use of pure biomedical signals. The extracted PPG data must undergo preprocessing (Figure 3) to remove the artifacts (such as Powerline Interference from the power frequency, artifacts caused by the recording system, the signal amplifiers used, etc.) in order to perform correct measurements and analyzes; interference with input data caused by poor contact with the sensor, involuntary movement of the body and others. To these external factors are added the location of the sensor, the presence of ambient lights and electrical sources. The individual characteristics of the subjects studied [23], such as the properties of the skin and the temperature of the human body, have significant influence.
The permanent constituent contained in the input data is removed by a software DC (Direct Current) filter (DC component is the constant voltage added to a pure AC waveform). Subsequent is the reduction of noise components while using averaging filter, elimination of single large deviations using a median filter (triggered by motion, for example), the removal of high frequency components with a low pass filter (4 Hz cutoff frequency), and low frequency artifacts with a high pass filter (0.4 cutoff frequency). These cut-off frequencies are chosen to correspond to the frequency range within which the physiological human heart rate is approximately located. The frequency is for the final data—if there is a frequency of individual peaks greater than 4 Hz or less than 0.4 Hz, then they are filtered. We assume a heart rate greater than 240 beats/min. (4Hz) and less than 24 beats/min. (0.4 Hz) is due to some error in the signals or data.
Studies have been conducted that have found that the excessively fast movement (such as running, sports involving running, or fast movement) can cause artifacts to investigate the occurrence of artifacts in PPG due to movement. In these cases, no analysis data are taken. In addition, the input signal processing program includes procedures that check the quality of the input signals and, if the signals are not of good quality, they are not analyzed.
2.3.2. Module for Determining PP Intervals
The detection of P peaks in the photoplethysmographic signal is performed while using a mathematical algorithm that is based on the first and second derivatives of the investigated signal [23] and performing additional checks to ensure that a signal peak is detected. The P peaks detection algorithm is programmatically implemented in the web based system, where the received input data for mathematical processing and analysis are sent.
After determining the consecutive P peaks in the test signal, the time series of consecutive PP intervals are formed—Pulse Rate Variability. A series of adjacent normal-to-normal cardiac cycles are formed (NN) after the successive PP intervals have been determined, which only contains the vertices that are caused by the operation of the sinus node of the heart. Mathematical analysis is performed by calculating the parameters in the time domain, in the frequency domain, and nonlinear PPG based analyzes are performed, based on this normal-to-normal sequence.
The received input signal is further interpolated while using a cubic splines interpolation procedure that increases the resolution of the samples up to 1 KHz.
2.3.3. Module for Mathematical Analysis of PRV
The mathematical analysis of PRV is performed by applying linear and nonlinear methods. The linear methods for analysis are Time-Domain and Frequency-Domain. In this article are used the following nonlinear methods for analysis: Poincaré plots, Rescaled Range Plot (R/S), DFA (Detrended Fluctuation Analysis), MFDFA (MultiFractal Detrended Fluctuation Analysis), Approximate Entropy, and Sample Entropy.
Time-Domain analysis is very commonly used in cardiology due to the boundaries of norm-pathology being known according to the standard introduced [50]. The following parameters are determined in the Time-Domain: the mean of normal-to-normal intervals (MeanNN), the mean of heart rate (MeanHR); the standard deviation of normal-to-normal intervals (SDNN), standard deviation of the averages normal-to-normal time intervals (SDANN), the ratio of pairs of successive normal-to-normal intervals differing more than 50 ms (pNN50), the square root of the mean of the sum of the squares of successive differences between normal-to-normal intervals (RMSSD), and the mean of the standard deviations of all normal-to-normal intervals (SDIndex).
Table 1 presents the formulas for the most commonly used parameters in the time domain.
In the Frequency-Domain, studies are conducted in three main ranges (Table 2): Very Low Frequency domain; Low Frequency domain; and, High Frequency domain. The Very Low Frequency domain refers to the mechanisms of the nervous system that are responsible for the long-term regulation of the human body; Low Frequency domain is related to the sympathetic nervous system, while also taking the influence of the parasympathetic nervous system into account; High Frequency domain corresponds to parasympathetic influences and it takes the influence of respiratory processes into account.
Sympathetic cardiac control of the nervous system operates at frequencies lower than 0.15 Hz (0.01–0.15 Hz, Low Frequency) domain, accelerates cardiac activity, narrows blood vessels, raises blood pressure, widens the airways in the lungs, widens the pupil of the the eye, reduces the activity of the digestive system, raises the temperature, and mobilizes the whole body. Parasympathetic modulation, including humoral factors, gender and age, is also affected here.
The parasympathetic heart control of the nervous system operates at frequencies up to 0.4 Hz (from 0.15 to 0.4 it is High Frequency domain) and it modulates the activity of the human body by slowing the heart activity, thus lowering blood pressure (generally its activity is the opposite of the sympathetic one).
A non-parametric Welch periodogram method [51], which is suitable for cardiac biomedical data, was used for determining the spectral components. In this method, the obtained individual periodograms for overlapping individual data blocks are averaged to produce the final periodogram. The power spectral density (PSD) of the PRV data series is determined while using the Welch Periodogram method.
The Frequency-Domain analysis is also standardized, with the limits of norm-pathology being known, thus making it a preferred method.
The introduction in recent years of the non-linear methods of PRV analysis has allowed for an additional assessment of the qualitative and quantitative characteristics of PRV and it has expanded the scope for clinical interpretation. These methods are not standardized, but they are in the process of active research and they provide additional information on the “chaotic” dynamics of PP interval series. When compared to linear analysis methods, nonlinear methods allow for new, additional estimates to be obtained that give an idea of the nonlinear, dynamic processes in the studied signals.
Poincaré plot [52,53] is a geometric method for representing the time series, such as PP intervals in a Cartesian plane [54]. This method allows for physicians to view the PP time intervals of the entire PPG signal at a glance and quickly detect cardiovascular disorders, if any [55].
Physiological signals, such as PPG and ECG, have been proven to have fractal behavior and have the following properties: self-similarity and fractal dimension [56]. The degree of self-similarity can be determined with the Hurst exponent. The R/S method is one of the most popular fractal analysis methods. The fractal analysis is intended to assess the degree of harmonization of the biorhythms of different organs and systems of the body, including the cardiovascular system, in order to identify the functional and pathological changes in the human body, as well as to predict changes in the health status of the patient. The value of the Hurst exponent is in the range of 0.5 to 1.0 if the signal is fractal [57].
The DFA method is suitable for the study of dynamic changes in PPG signals, which takes into account, not only the stationary, but also the non-stationary components of the temporal structure of the heart rhythm [53,58]. DFA quantifies the fractal, correlation properties of PP intervals. The correlations are short-term and long-term, being characterized by the parameters α1 and α2, respectively [59].
Fractal signals are two types: monofractal and multifractal [60]. The monofractal signal is homogeneous, because it has the same scale properties, both locally and globally. This signal can only be characterized by a one Hurst exponent value [60]. The multifractal signal consists of homogeneous, fractal subsets, whose singular properties can be characterized by a spectrum of Hurst exponent values [60]. The Genaralized Hurst exponent is an MFDFA tool that reflects the structural inhomogeneity of the PPG signal.
2.3.4. Data Collection
The data with which the study was conducted in this article were recorded while using the experimental photoplethysmographic device created. The investigated data are two types:
- data with which the device is tested; and,
- data to perform mathematical analysis of two groups of subjects: healthy controls and patients with arrhythmia.
The data that test the device are for a healthy subject (male, 51 years old). Four signals of 30 min. duration are recorded simultaneously: ECG signal; PPG signal obtained from a sensor placed on the left ear auricle; A PPG signal obtained from a sensor placed on the middle finger of the left hand and a PPG signal obtained by placing the left hand index finger on the Discrete HR/SPO2 sensor that is built into the device. After registration of the ECG and PPG signals, specialized software determines the RR time intervals of the ECG signal and PP intervals of the PPG signal. The mean squared error (MSE) is calculated while using the following formula to demonstrate the coincidence of the intervals between the two types of signals:
The variables x and y are denoted the PP and RR intervals, respectively; N is the number of intervals. When the MSE tends to zero, it indicates that the intervals of the two type investigated signals (ECG and PPG) are very close, ie they are identical.
The data are used to perform the mathematical analysis are following: 42 subjects with arrhythmia (volunteers diagnosed by a cardiologist) and 40 healthy individuals (volunteers who are not diagnosed with cardiac disease). Recordings are for a duration of 120 min. The studies were made while using an external sensor in the form of a pinch placed on the middle finger of the left hand of the test subject. The experiment involves a member of the technician team who checks the functioning of the created photoplethysmographic device and the reliable operation of the software program in the device.
The participating volunteers are familiarized with the instructions for recording the photoplethysmographic signals, after which each participant is made three consecutive registrations of PPG signals. The purpose of the three measurements is to verify the correctness of the data. Artifacts or other events are detected if the validation of the data is successful and no extraordinary noises, and they are then transmitted to the software module of the developed web application for preprocessing to obtain PP interval series, to which mathematical methods of analysis are applied. The signals registered with the developed device have a sampling rate of 60 Hz and a 22-bit resolution, thus avoiding the possibility of inaccuracies resulting from the distortion of the input signal.
2.3.5. Statistical Analysis
The obtained results are presented as mean ± standard deviation (mean ±SD). The values of the parameters of the study groups were tested by the T test. The values of the parameters at which is less than or equal 0.05 (5%) has been considered to be significant.
3. Results
3.1. Experimental Results Obtained with a Portable Cardiology Device
An experimental multisensory system for simultaneous real-time recording of ECG and PPG signals of a healthy individual with a 30-min. measurement time has been created in order to prove the validity of the created portable PPG signaling device. The experimental system consists of:
- ECG sensor for ECG signal recording;
- Three photoplethysmographic sensors for a recording of three photoplethysmographic signals received from different places of the body. The sensors are placed by pinching the middle finger of the left hand, the earring of the left ear, and the index finger of the left hand touches the sensor that is built into the device.
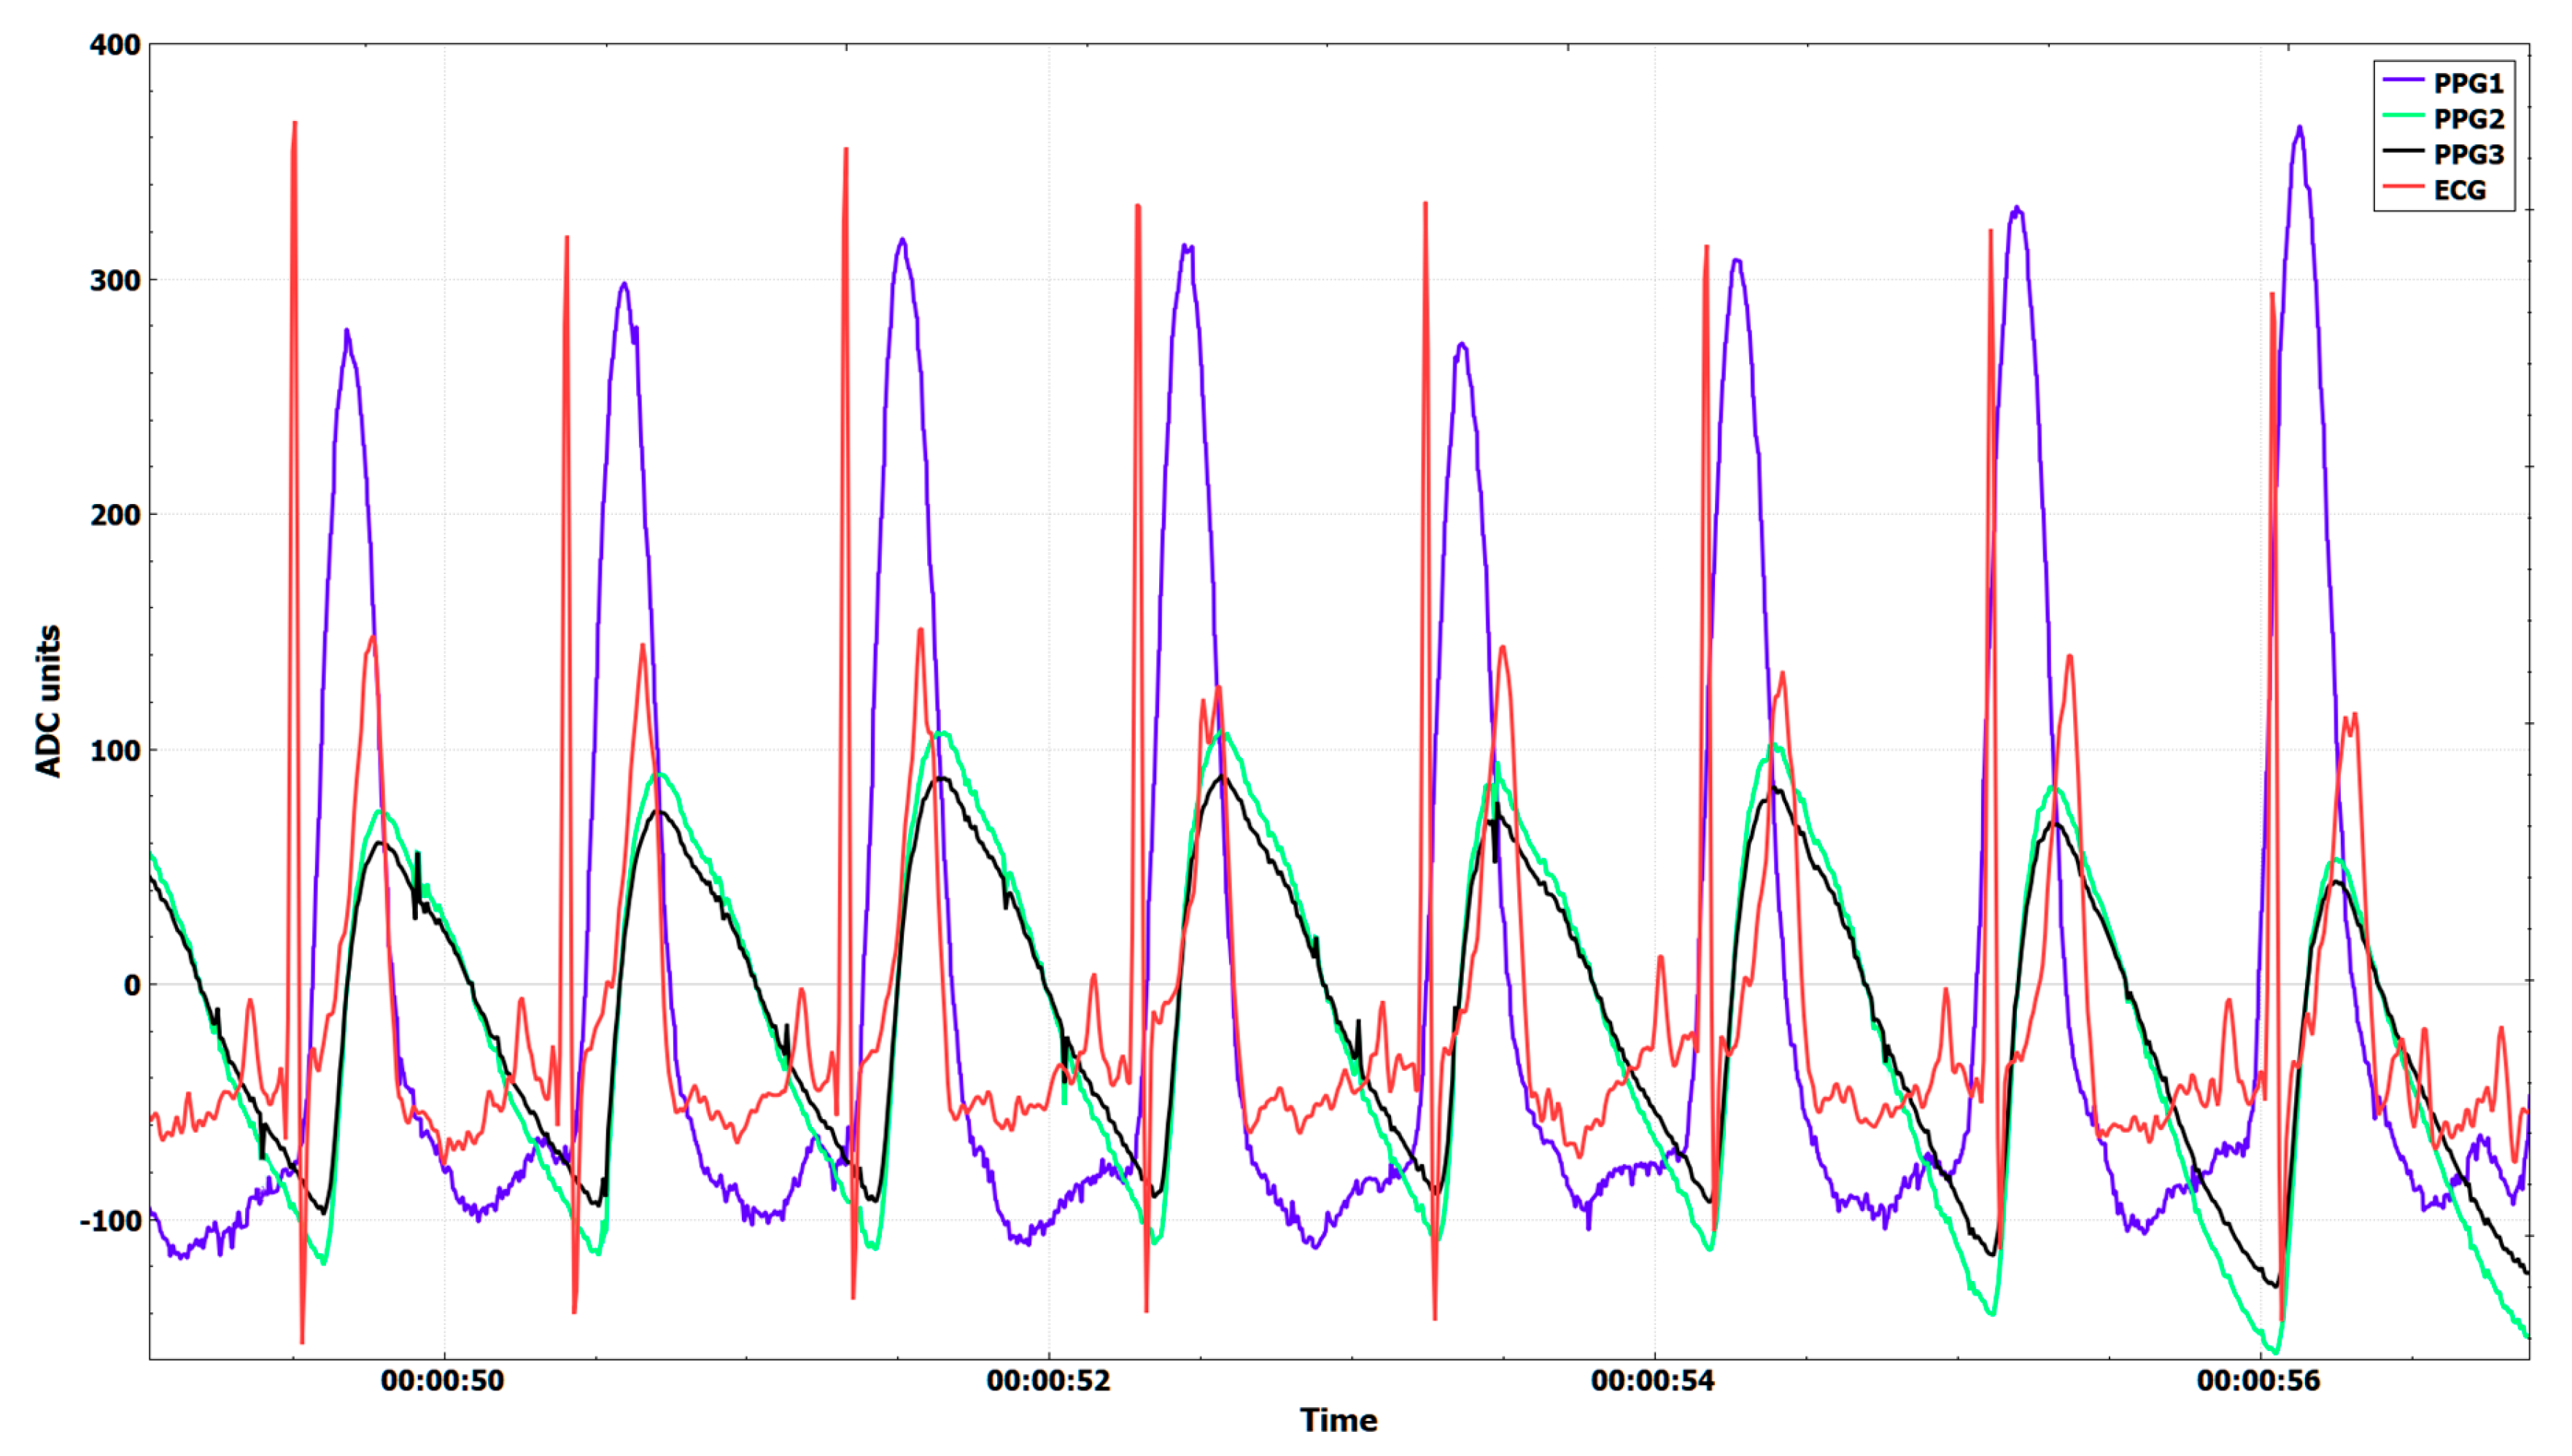
The simultaneous registration of both types of signals (ECG and PPG) enables comparative analysis by modeling RR and PP time intervals. Figure 4 shows diagrams of the signals registered with the device:
- ECG signal;
- PPG1 is the photoplethysmographic signal recorded by the sensor placed on the left ear;
- PPG2 is the photoplethysmographic signal recorded by the sensor placed on the middle finger of the left hand; and,
- PPG3 is the photoplethysmographic signal registered by touching the left hand index finger to the sensor integrated into the portable device.
The registrated signals were obtained at a sampling rate of 128 Hz. ECG records were obtained while using the MAX30001EVSYS system from Maxim Integrated Inc [64]. We use the original software of the system, adding the ability to synchronize with our developed system for the registration of PPG signals, ie. the reading of ECG and PPG data takes place at the same time.
Table 3 shows the results of the study of 30 min. recorded ECG and PPG signals, such as: number RR/PP intervals; average intervals; min. value; max. value; and, MSE.
3.2. Mathematical Analysis of PP Interval Series
Table 4 presents the demographic characteristics of investigated subjects. The parameter values are expressed as mean ± standard deviation (sd) or percentage (%). 42 patients that were diagnosed with arrhythmia (22 men and 20 women) aged 49 to 57 years and 40 healthy volunteers (21 men and 19 women) aged 52 to 64 were examined. No significant difference was found between gender and age group members.
3.2.1. Time-Domain Analysis
Table 5 presents the results that were obtained in the time domain (statistical and geometric parameters) of the Pulse Rate Variability analysis. The study covered two groups of individuals (82 people in total): Healthy subjects (40 people) and diagnosed with the disease arrhythmia individuals (42 people).
The values that were obtained for the investigated Time-Domain parameters indicate that the parameters SDNN (p value = 0.0088), SDANN (p value = 0.0385), RMSSD (p value = 0.0718), and pNN50 (p value = 0.0363) are statistically significant (p value < 0.05) and they can be used as factors in determining the degree of the disease under study (and perhaps an additional aid in the diagnosis and treatment of the disease). The parameters MeanNN, MeanHR, and SDIndex have no statistical significance (NS), because the values of p value are for these parameters > 0.05.
3.2.2. Frequency-Domain Analysis
The obtained results in Frequency-Domain that are presented in Table 6 show high values of the very low frequency spectrum in a healthy group against arrhythmia group (1823.33 versus 1048.44). The low frequency spectrum in a healthy control group (1659.48 ) is significantly lower in the group of patients that were diagnosed with arrhythmia (940.91 ). For high frequency, the highest values are in the group of healthy individuals (941.33 ), lower values were obtained in the arrhythmia patient group (683.11 ).
The calculated parameter LF/HF (known as index of sympathovagal balance [65]) in the control group has values (1.76 ± 0.39) that are within the normal values that are recommended by the heart rate variability standard of measurement, physiological interpretation, and clinical use [50]. The LF/HF of the patiens with arrhythmia (1.38 ± 0.27) have values that are outside the normal values recommended by the standard.
The power spectral density of PRV is presented in Figure 6; Figure 7. Power spectral density is obtained at Very Low Frequencies, Low Frequencies, and High Frequencies in Figure 6 (PPG data of healthy subject) shows high values for PSD in this frequency domain studied. This is an indicator of high values for Pulse Rate Variability, which shows the good overall health of the studied subjects.
The power spectral density of the patient with arrhythmia (Figure 7) has low values in the Low Frequency and High Frequency domain. The calculated Power spectral density in the Very Low Frequency domain is higher than Power spectral density in the Low Frequency and High Frequency domain. The low levels of Pulse Rate Variability in an investigated patient diagnosed with arrhythmia indicate the presence of cardiac disease.
3.2.3. Nonlinear Analysis
The introduction of the non-linear analysis of PRV provides additional information on the health status of the subjects studied. Figure 8 shows the graphs that were obtained through the Poincaré plot for healthy subject and patient with arrhythmia. This graphical method presents the correlation between consecutive PP intervals and constructs an ellipse with dimensions: width (SD1) and length (SD2).
Figure 9 shows the multifractal spectrum and behavior of the gensralized Hurst exponent of the studied groups while using the MFDFA method.
Table 7 shows the parameter values of the two study groups obtained by applying nonlinear PRV analysis methods.
4. Discussion
The created experimental device is suitable for continuous observation of the subjects studied, is easy to use, can be placed in different places on the human body, and allows for measuring different parameters, such as: pulse, blood pressure, oxygen saturation, etc. The device created is in line with the desire of the scientific community around the world to use modern technologies at the service of humanity [66].
From Figure 4, it is observed that the peak R in the ECG signal does not coincide with the onset of pulse wave propagation at the three recorded photoplethysmographic signals. This is because the peak R of the ECG signal corresponds to the electrical excitation of the heart muscle, after which it takes some time for the muscle to respond to this excitation, so that the aortic valve opens and the pulse wave begins to propagate through the arteries. The delay in the pulse wave of the PPG signal that was recorded by the sensor placed in the left ear is less than the delay in the PPG signals recorded by the other two sensors due to the greater proximity to the heart.
The graphs of the four studied signals (Figure 5) corresponding to the RR and PP interval series of a healthy individual while using the non-linear Poincaré mathematical method are identical and well expressed ellipses, which is evidence that the studied data correspond to a healthy individual. The shape of the graphs has the appearance of a comet, which is further proof that the data examined relates to a healthy individual. Similar results have been reported in the publications [67,68].
Based on the results that are shown in Table 3, it follows that the RR and PP intervals of the two signal types (ECG and PPG) are identical. PPG signals versus ECG signals have a very small mean square error (MSE). The MSE for the signal recorded by the sensor placed on the ear mussel is smaller than the MSE for the signals that are registered by the fingers (index finger and middle finger) of the test subject. The reason for this is due to the following physiological features:
- the muscle of the ear is smaller than the finger of the hand;
- on the ear mussel no cartilage tissue; and,
- the pulse wave reaches the ear sensor faster than the sensor placed on the fingers due to the greater proximity to the heart.
From the experimental studies that were performed on the operation of the experimental, portable PPG device by comparison with the second reference method—electrocardiogram, it follows that the device is applicable for recording PPG signals and that the mathematical data that were obtained from them correspond to RR intervals.
Studies that were conducted by the authors on PPG data from healthy people and patients with arrhythmia show a decrease in the value of PRV in the presence of disease. It could be suggested that a significant or sudden decrease in these values is a sign of a sudden worsening of the disease and the need for emergency measures to protect the health and life of the patient. For this reason, an organized system can be especially valuable when monitoring patients in conditions that are close to critical.
Arrhythmia is one of the serious diseases of the human cardiovascular system, leading to serious disorders of the heart rhythm. When there are major deviations from the heart rate, a pacemaker might need to be used to artificially regulate the heart’s activity. Every year, millions of people worldwide are hospitalized as a result of the disease. For these reasons, the authors believe that the early detection of this disease, its constant monitoring, and the maintenance of optimally effective treatment of patients is essential. Wearing an individual, inexpensive, the lightweight biomedical device that, in an almost imperceptible way, to measure at regular intervals (or continuously as needed) cardiac activity could be of great benefit to patients, can guarantee a low risk to their health, and improve overall health.
The linear methods, such as Time-Domain and Frequency-Domain, can be used to directly estimate PRV. These methods are standardized and they can provide objective information regarding the condition of the cardiovascular system of the subjects studied. Much of the values of the studied Time-Domain and Frequency-Domain parameters (Table 5 and Table 6) are statistically significant, since the p-value is less than 0.05. Therefore, these methods can distinguish the subjects of the two study groups.
The nonlinear analysis of the PP interval series allows obtaining additional information regarding the subjects studied. Based on the results of the nonlinear analysis of the subjects studied, the following conclusions can be drawn:
- Poincaré plot allows for visual analysis of the entire recording of PP intervals based on the following parameters: the pattern of PP intervals, the ellipse size, and the points symmetry with respect to the identity line. This type of analysis makes it possible to distinguish healthy individuals from patients with various diseases. Figure 8 shows that the PP intervals for a healthy subject is comet-shaped and, for the patient with arrhythmia, has a fan pattern. Similar results are shown in a publication [30]. The values of the parameters SD1, SD2 of the ellipse, as well as SD1/SD2, are smaller for the group of patients with arrhythmia when compared to the group of healthy subjects (Table 7). Healthy subjects have a well-defined ellipse, while, in patients with arrhythmia, the ellipse approaches the shape of a circle. The graphs corresponding to the healthy individual and the patient with arrhythmia shown in Figure 8 are symmetrical to the identity line, which suggested that they have no rhythmic disturbance. Poincaré plot analysis can distinguish between the two groups studied, because the p-value is less than 0.05.
- The DFA method determines the values of the following parameters: Alpha 1-short-range scaling exponent; Alpha 2-long-range scaling exponent. These values are in the range of 1.0 to 1.5 for the two study groups, which is evidence of the fractal behavior of the PP interval series.
- The MFDFA allows for new estimates to be obtained that give additional insight into the nonlinear, dynamic processes in the studied PPG signals. Figure 9 shows the multifractal spectrum and the behavior of the genaralized Hurst exponent of the two subjects studied: a healthy subject and a patient with arrhythmia. The healthy subject’s multifractal spectrum is 2.2 times broader than that of the arrhythmic patient. This is evidence that the PP interval series of the healthy subject have multifractal behavior and the patient with arrhythmia has monofractal behavior. The Genaralized Hurst exponent reflects the non-homogeneous structure of the investigated signal. For a healthy subject, the values of the Hurst exponents vary from 1.2 to 0.75 for different values of the q parameter. This is evidence that the healthy subject has multifractal behavior. In a patient with arrhythmia, the values of the Hurst exponents are almost constant, evidencing monofractal behavior. The values of the multifractal spectrum of the studied groups (Table 7) is statistically significant, therefore the two groups can be distinguished by the MFDFA.
- The R/S plot is one of the most popular nonlinear methods for time series analysis that is based on Hurst exponent calculation. The fractal behavior of the signals is characterized by Hurst exponent values in the range (0.5, 1.0). The Hurst exponent values of the arrhythmia patient group are about 0.55, while the subjects of the healthy group have higher values (Table 7). The higher Hurst exponent value is evidence of a higher PRV and better health.
- The AppEn and SampleEn values that are shown in Table 7 are statistically significant, therefore these two parameters can be used to distinguish healthy controls from patients with the disease. AppEn and SampleEn values are higher in healthy controls, which is evidence that their PP data have stochastic, fractal behavior.
5. Conclusions
This article introduces a portable information system, consisting of a PPG signals recording device and web-based application for processing and mathematical analysis of PRV while using serverless architecture.
The prospect of introducing PPG-based equipment is due to the following advantages: mobility (recording PPG signals is performed while the patient is working, traveling, sporting (except excessively fast movement, such as running; sports involving running or fast movement), resting, and in extreme situations); security (24-h patient monitoring is possible, and short messages (SMS) may be sent to the attending physician when a deviation is recorded in the patient’s results); prevention (identifying the disease at an early stage before it has become a serious health problem); diagnostics (long-term follow-up allows accurate diagnosis); and, others.
The preprocessing of the registered PPG signals involves the determination of the PP interval series to which linear and nonlinear methods for the data analysis are applied. The quantitative measurements of the studied parameters in the linear analysis have significant clinical application because the boundaries of norm-pathology are known. The nonlinear mathematical methods provide additional information on the formation of the parametric and the graphical assessment of patients’ health status.
The established information system can find application in modern clinical practice, offering an approach for long-term monitoring and investigation of changes in cardiac activity of the subjects studied.
Author Contributions
G.G.-T. and E.G. conceived this study. K.C. and M.G. worked to create the PPG device. K.C. measured photoplethysmographic signals and created PPG extraction and processing software. G.G.-T. and E.G. created a software system for mathematical analysis of photoplethysmographic and electrocardiographic data, performed the experiments and wrote the manuscript. Finally, M.G. reviewed the manuscript and contributed to the final version. All authors have read and agreed to the published version of the manuscript.
Funding
This research was funded by NATIONAL SCIENCE FUND OF BULGARIA (scientific project “Investigation of the application of new mathematical methods for the analysis of cardiac data”), Grant Number KP-06-N22/5, 07.12.2018.
Conflicts of Interest
The authors declare no conflict of interest.
References
- Laborde, S.; Mosley, E.; Thayer, J.F. Heart rate variability and cardiac vagal tone in psychophysiological research—recommendations for experiment planning, data analysis, and data reporting. Front. Psychol. 2017, 8, 213. [Google Scholar] [CrossRef] [PubMed] [Green Version]
- Kamath, M.V.; Watanabe, M.A.; Upton, A.R.M. Heart Rate Variability (HRV) Signal Analysis: Clinical Applications, 1st ed.; CRC Press Taylor&Francis Group: Boca Raton, FL, USA, 2016. [Google Scholar]
- Rundo, F.; Conoci, S.; Ortis, A.; Battiato, S. An advanced bio-inspired photoplethysmography (PPG) and ECG pattern recognition system for medical assessment. Sensors 2018, 18, 405. [Google Scholar] [CrossRef] [PubMed] [Green Version]
- Oreggia, D.; Guarino, S.; Parisi, A.; Pernice, R.; Adamo, G.; Mistretta, L.; Di Buono, P.; Fallica, G.; Cino, C.A.; Busacca, A.C. Physiological parameters measurements in a cardiac cycle via a combo PPG-ECG system. In Proceedings of the AEIT International Annual Conference, Naples, Italy, 14–16 October 2015; pp. 1–6. [Google Scholar] [CrossRef]
- Elgendi, M. On the analysis of fingertip photoplethysmogram signals. Curr. Cardiol. Rev. 2012, 8, 14–25. [Google Scholar] [CrossRef] [PubMed]
- Tamura, T.; Maeda, Y.; Sekine, M.; Sekine, M.; Yoshida, M. Wearable photoplethysmographic sensors—Past and present. Electronics 2014, 3, 282–302. [Google Scholar] [CrossRef]
- Schaldach, M. Physics of heart and circulation. Prog. Biomed. Res. 1999, 4, 475–480. Available online: http://www.msbt.nat.fau.de/PBMR/documents/199904050475.pdf (accessed on 20 December 2019).
- Ricardo, L.; Legnani, W.; Cymberknop, L. Fractal analysis of cardiovascular signals empowering the bioengineering knowledge. In Fractal Analysis—Applications in Health Sciences and Social Sciences; IntechOpen: London, UK, 2017; Available online: https://www.intechopen.com/books/fractal-analysis-applications-in-health-sciences-and-social-sciences/fractal-analysis-of-cardiovascular-signals-empowering-the-bioengineering-knowledge (accessed on 20 December 2019). [CrossRef] [Green Version]
- Saeed, M. Fractals analysis of cardiac arrhythmias. Sci. World J. 2005, 5, 691–701. [Google Scholar] [CrossRef] [Green Version]
- Krstacic, G.; Martinis, M.; Vargovic, E.; Knezevic, A.; Krstacic, A. Non-linear dynamics in patients with stable angina pectoris. arXiv 2001, arXiv:Physics/0110010 v1.2001. [Google Scholar]
- Sheluhin, O.I.; Smolskiy, S.M.; Osin, A.V. Self-Similar Processes in Telecommunicatios; John Wiley & Sons Ltd.: Chichester, UK, 2007. [Google Scholar]
- Bruce, J.W. Fractal physiology and medicine: Studies of nonlinear phenomena in life. In Science; Word Scientific Publishing Co. Pte. Ltd.: Singapore, 2000; Volume 1. [Google Scholar]
- Chua, K.C.; Chandran, V.; Acharya, U.R.; Min, L.C. Computer-based analysis of cardiac state using entropies, recurrence plots and Poincaré geometry. J. Med Eng. Technol. 2009, 32, 263–272. [Google Scholar] [CrossRef]
- Martin, W.A.; Camenzind, E.; Burkhard, P.R. ECG artifact due to deep brain stimulation. Lancet 2003, 361, 1431. [Google Scholar] [CrossRef]
- Zhao, T.; Liu, J.; Wang, Y.; Liu, H.; Chen, Y. PPG-based finger-level gesture recognition leveraging wearables. In Proceedings of the IEEE INFOCOM 2018-IEEE Conference on Computer Communications, Honolulu, HI, USA, 16–19 April 2018; Available online: https://ieeexplore.ieee.org/document/8486006 (accessed on 20 December 2019).
- Tur, E.; Tur, M.; Maibach, H.I.; Guy, R.H. Basal perfusion of the cutaneous microcirculation: Measurements as a function of anatomic position. J. Investig. Dermatol. 1983, 81, 442–446. [Google Scholar] [CrossRef] [Green Version]
- Lee, Y.; Shin, H.; Jo, J.; Lee, Y. Development of a wristwatch-type PPG array sensor module. In Proceedings of the IEEE International Conference on Consumer Electronics, Berlin, Germany, 6–8 September 2011; pp. 168–171. [Google Scholar] [CrossRef]
- Poh, M.-Z.; Swenson, N.C.; Picard, R.W. Motion-tolerant magnetic earring sensor and wireless earpiece for wearable photoplethysmography. IEEE Trans. Inform. Tech. Biomed. 2010, 14, 786–794. [Google Scholar] [CrossRef]
- Mendelson, Y.; Pujary, C. Measurement site and photodetector size considerations in optimizing power consumption of a wearable reflectance pulse oximeter. In Proceedings of the 25th Annual International Conference of the IEEE Engineering in Medicine and Biology Society (IEEE Cat. No. 03CH37439), Cancun, Mexico, 17–21 September 2003; Volume 4, pp. 3016–3019. [Google Scholar] [CrossRef]
- Kyriacou, P.A. Direct pulse oximetry within the esophagus, on the surface of abdominal viscera and on free flaps. Anesth. Analg. 2013, 117, 824–833. [Google Scholar] [CrossRef] [PubMed]
- Bagha, S.; Shaw, L. A real time analysis of PPG signal for measurement of SpO2 and pulse rate. Int. J. Comput. Appl. 2011, 36, 45–50. [Google Scholar] [CrossRef]
- Moraes, J.L.; Rocha, M.G.; Vasconcelos, G.; Filho, J.E.V.; de Albuquerque, V.H.C.; Alexandria, A.R. Advances in photopletysmography signal analysis for biomedical applications. Sensors 2018, 18, 1894. [Google Scholar] [CrossRef] [PubMed] [Green Version]
- Zangróniz, R.; Martínez-Rodrigo, A.; López, M.T.; Pastor, J.M.; Fernández-Caballero, A. Estimation of mental distress from photoplethysmography. Appl. Sci. 2018, 8, 69. [Google Scholar] [CrossRef] [Green Version]
- Botman, S.; Borchevkin, D.; Petrov, V.; Bogdanov, E.; Patrushev, M.; Shusharina, N. Photoplethysmography-based device designing for cardiovascular system diagnostics. Int. J. Biomed. Biol. Eng. 2015, 9, 689–693. [Google Scholar] [CrossRef]
- Gil, E.; Orini, M.; Bailón, R.; Vergara, J.M.; Mainardi, L.; Laguna, P. Photoplethysmography pulse rate variability as a surrogate measurement of heart rate variability during non-stationary conditions. Physiol. Meas. 2010, 31, 1271–1290. [Google Scholar] [CrossRef]
- Acharya, U.R.; Suri, J.S.; Spaan, J.A.E.; Krishnan, S.M. Advances in Cardiac Signal Processing; Springer: Berlin/Heiderbeg, Germany, 2007. [Google Scholar]
- Fujita, D.; Suzuki, A.; Ryu, K. PPG-based systolic blood pressure estimation method using pls and level-crossing feature. Appl. Sci. 2019, 9, 304. [Google Scholar] [CrossRef] [Green Version]
- Allen, J.; Murray, A. Similarity in bilateral photoplethysmographic peripheral pulse wave characteristics at the ears, thumbs and toes. Physiol. Meas. 2000, 21, 369–377. [Google Scholar] [CrossRef]
- Sondej, T.; Sieczkowski, K.; Olszewski, R.; Dobrowolski, A. Simultaneous multi-site measurement system for the assessment of pulse wave delays. Biocybern. Biomed. Eng. 2019, 39, 488–502. [Google Scholar] [CrossRef]
- Kubios (version 3.3), User’s Guide. Available online: https://www.kubios.com/downloads/Kubios_HRV_Users_Guide.pdf (accessed on 5 June 2019).
- Mourot, L. CODESNA_HRV, a new tool to assess the activity of the autonomic nevrous system from heart rate variability. Phys. Med. Rehabil. Res. 2018, 3, 2–6. [Google Scholar] [CrossRef] [Green Version]
- Bartels, R.; Neumamm, L.; Pecanha, T.; Carvalho, S. SinusCor: An advanced tool for heart rate variability analysis. BioMed. Eng. 2017, 16, 110–124. [Google Scholar] [CrossRef] [PubMed]
- Rodrίguez-Liñres, L.; Lado, M.J.; Vila, X.A.; Méndz, A.J.; Guesta, P. gHRV: Heart Rate Variability analysis made easy. Comput. Methods Programs Biomed. 2014, 116, 26–38. [Google Scholar] [CrossRef] [PubMed]
- Kalinichenko, A.; Motorina, S. Algorithms for ECG Analysis in Mobile Cardiac Monitoring Systems. In Proceedings of the 20th Conference of Open Innovations Association, Saint-Petersburg, Russia, 3–7 April 2017; pp. 112–117. [Google Scholar] [CrossRef]
- Barquero-Pérez, O.; Quintanilla, T.; Garía-Muñoz, J.; Soguero-Ruiz, C.; Wilby, M.R.; Rosa, M.; Cabañas, M.; Bravo, I.; García-Alberola, A.; Rojo-Álvarez, J.L. ELab: A web-based platform to perform heart rate variability and heart rate turbulence analysis and store cardiac signals. Comput. Cardiol. 2013, 40, 21–24. [Google Scholar]
- Mohammed, J.; Lung, C.H.; Ocneanu, A.; Thakral, A.; Jones, C.; Adler, A. Internet of things: Remote patient monitoring using web services and cloud computing. In Proceedings of the IEEE International Conference on Internet of Things (iThings), and IEEE Green Computing and Communications (GreenCom), and IEEE Cyber, Physical and Social Computing (CPSCom), iThings/GreenCom/CPSCom, Taipei, Taiwan, 1–3 September 2014; pp. 256–263. [Google Scholar] [CrossRef]
- Kirtana, R.N.; Lokeswari, Y.V. An IoT based remote HRV monitoring system for hypertensive patients. In Proceedings of the International Conference on Computer, Communication and Signal Processing (ICCCSP), Chennai, India, 10–11 January 2017; pp. 1–6. [Google Scholar] [CrossRef]
- Gravina, R.; Alinia, P.; Ghasemzadeh, H.; Fortino, G. Multi-Sensor Fusion in Body Sensor Networks: State-of-the-art and research challenges. Inf. Fusion. 2017, 35, 68–80. [Google Scholar] [CrossRef]
- Fortino, G.; Giampà, V. PPG-based methods for non invasive and continuous blood pressure measurement: An overview and development issues in body sensor networks. In Proceedings of the IEEE International Workshop on Medical Measurements and Applications, Ottawa, ON, Canada, 30 April–1 May 2010; pp. 10–13. [Google Scholar] [CrossRef]
- Lai, X.; Liu, Q.; Wei, X.; Wang, W.; Zhou, G.; Han, G. A survey of body sensor networks. Sensors 2013, 13, 5406–5447. [Google Scholar] [CrossRef] [Green Version]
- KiCad EDA. A Cross Platform and Open Source Electronics Design Automation Suite. Available online: http://www.kicad-pcb.org, (accessed on 25 August 2019).
- Medtronic. Healthcare Professionals. Products, Therapies, and Services—As Well as New Ways to Improve Hospital Efficiency. Let’s Take Patient Care Further, Together. Available online: https://www.medtronic.com/covidien/en-au/products/pulse-oximetry/nellcor-reusable-spo2-sensors.html#carousel-example-generic (accessed on 20 December 2019).
- Oakes, E.; Yang, L.; Zhou, D.; Houck, K.; Harter, T.; Arpaci-Dusseau, A.C.; Arpaci-Dusseau, R.H. SOCK: Rapid task provisioning with serverless-optimized containers. In Proceedings of the USENIX Annual Technical Conference, Boston, MA, USA, 11–13 July 2018; pp. 57–69. [Google Scholar]
- Resize Images on the Fly with AmazonS3, AWS Lambda, and Amazon API Gateway. Available online: https://aws.amazon.com/blogs/compute/resize-images-on-the-fly-with-amazon-s3-aws-lambda-and-amazon-api-gateway/ (accessed on 30 January 2017).
- Hendrickson, S.; Sturdevant, S.; Harter, T.; Venkataramani, V.; Arpaci-Dusseau, A.C.; Arpaci-Dusseau, R.H. Serverless computation with openlambda. In Proceedings of the 8th USENIX Workshop Hot Topics Cloud Computing (HotCloud), Denver, CO, USA, 20–21 June 2016; pp. 33–39. [Google Scholar]
- Eyk, E.; Iosup, A.; Seif, S.; Thömmes, M. The SPEC cloud group’s research vision onfaas and serverless architectures. In Proceedings of the 2nd International Workshop on Serverless Computing WoSC’17, Las Vegas, NV, USA, 11–15 December 2017. [Google Scholar] [CrossRef] [Green Version]
- Taylor, T. Top 8 Tools to Use When Working with Serverless Computing; TechGenix: Valletta, Malta, 2018; Available online: http://techgenix.com/serverless-computing-tools/ (accessed on 20 December 2019).
- Aditya, P.; Akkus, I.E.; Beck, A.; Chen, R.; Hilt, V.; Rimac, I.; Satzke, K.; Stein, M. Will serverless computing revolutionize NFV? Proc. IEEE 2019, 107, 667–678. [Google Scholar] [CrossRef]
- Poccia, D. AWS Lambda in Action; Manning Publicatios Co.: Shelter Island, NY, USA, 2017. [Google Scholar]
- Malik, M. Task Force of the european society of cardiology and the north american society of pacing and electrophysiology, heart rate variability—Standards of measurement, physiological interpretation, and clinical use. Circulation 1996, 93, 1043–1065. [Google Scholar] [CrossRef] [Green Version]
- Welch, P. The use of fast Fourier transform for the estimation of power spectra: A method based on time averaging over short, modified periodograms. IEEE Trans. Audio Electroacoust. 1967, 15, 70–73. [Google Scholar] [CrossRef] [Green Version]
- Tayel, M.B.; AlSaba, E.I. Poincaré plot for heart rate variability. Int. J. Biomed. Biol. Eng. 2015, 9, 708–711. [Google Scholar]
- Smith, R.L.; Wathen, E.R.; Abaci, P.C.; Bergen, N.H.V.; Law, I.H.; Dick, M.D., II; Connor, C.; Dove, E.L. Analyzing heart rate variability in infants using nonlinear poincaré techniques. In Proceedings of the 2009 36th Annual Computers in Cardiology Conference (CinC), Park City, UT, USA, 13–16 September 2009; Volume 36, pp. 673–676. [Google Scholar]
- Ernst, G. Heart Rate Variability; Springer: London, UK, 2014. [Google Scholar]
- Peng, C.-K.; Buldyrev, S.V.; Havlin, S.; Simons, M.; Stanley, H.E.; Goldberger, A.L. Mosaic organization of DNA nucleotides. Phys. Rev. E 1994, 49, 1685–1689. [Google Scholar] [CrossRef] [PubMed] [Green Version]
- Costa, N.; Silva, C.; Ferreira, P. Long-range behaviour and correlation in detrended fluctuation analysis and DCCA analysis of cryptocurrencies. Int. J. Financ. Stud. 2019, 7, 51. [Google Scholar] [CrossRef] [Green Version]
- Costa, M.D.; Davis, R.B.; Goldberger, A.L. Heart rate fragmentation: A new approach to the analysis or cardiac interbeat internal dynamics. Front. Psychol. 2017, 8, 255. [Google Scholar] [CrossRef] [PubMed] [Green Version]
- Martinis, M.; Knežević, A.; Krstačić, G.; Vargović, E. Changes in the Hurst exponent of heart beat intervals during physical activities. Phys. Rev. E 2004, 70, 012903. [Google Scholar] [CrossRef]
- Salat, H.; Murcio, R.; Arcaute, E. Multifractal methodology. Phys. A Stat. Mech. Its Appl. 2017, 473, 467–487. [Google Scholar] [CrossRef]
- Kantelhardt, J.W.; Zschiegner, S.A.; Koscielny-Bunde, E.; Havlin, S.; Bunde, A.; Stanley, H.E. Multifractal detrended fluctuation analysis of nonstationary time series. Phys. A Stat. Mech. Its Appl. 2002, 316, 87–114. [Google Scholar] [CrossRef] [Green Version]
- Li, X.; Yu, S.; Chen, H.; Lu, C.; Zhang, K.; Li, F. Cardiovascular autonomic function analysis using approximate entropy from 24-h heart rate variability and its frequency components in patients with type 2 diabetes. J. Diabetes Investig. 2015, 6, 227–235. [Google Scholar] [CrossRef] [Green Version]
- Al-Angari, H.M.; Sahakian, A.V. Use of sample entropy approach to study heart rate variability in obstructive sleep apnea syndrome. IEEE Trans. Biomed. Eng. 2007, 54, 1900–1904. [Google Scholar] [CrossRef]
- Shi, B.; Zhang, Y.; Yuan, C.; Wang, S.; Li, P. Entropy analysis of short-term heartbeat interval time series during regular walking. Entropy 2017, 19, 568. [Google Scholar] [CrossRef]
- Maxim Integrated. Sensor Signal Conditioners. Available online: https://www.maximintegrated.com/en/products/analog/data-converters/analog-front-end-ics/MAX30001EVSYS.html (accessed on 20 December 2019).
- Pozza, D.; Kleinmann, A.; Bechtold, S.; Kozlik-Feldmann, R.; Daebritz, S.; Netz, H. Calculating sympathovagal balance from heart rate variability: Are there alternatives in adolescents? Acta Cardiol. 2006, 61, 307–312. [Google Scholar] [CrossRef]
- Dimitrova, M.; Wagatsuma, H.; Tripathi, G.N.; Ai, G. Learner attitudes towards humanoid robot tutoring systems: Measuring of cognitive and social motivation influences. In Cyber-Physical Systems for Social Applications; Dimitrova, M., Wagatsuma, H., Eds.; IGI Global: Hershey, PA, USA, 2019; pp. 62–85. [Google Scholar] [CrossRef]
- Lu, G.; Yang, F.; Taylor, J.A.; Stein, J.F. A comparison of photoplethysmography and ECG recording to analyse heart rate variability in healthy subjects. J. Med. Eng. Technol. 2009, 33, 634–641. [Google Scholar] [CrossRef] [PubMed]
- Bolanos, M.; Nazeran, H.; Haltiwanger, E. Comparison of heart rate variability signal features derived from electrocardiography and photoplethysmography in healthy individuals. In Proceedings of the International Conference of the IEEE Engineering in Medicine and Biology Society, New York, NY, USA, 30 August–3 September 2006. [Google Scholar] [CrossRef]
Figure 1.
The photoplethysmographic data capture device.

Figure 2.
Photo of sensors used.

Figure 3.
Photoplethysmographic (PPG) preprocessing.

Figure 4.
Diagrams of registered electrocardiographic (ECG) and PPG signals.

Figure 5.
Poincaré plots for ECG and PPG signals.

Figure 6.
Power Spectral Density for healthy subject. (Five minutes of the studied series).

Figure 7.
Power Spectral Density for patient diagnosed with arrhythmia. (Five minutes of the studied series).
Figure 7.
Power Spectral Density for patient diagnosed with arrhythmia. (Five minutes of the studied series).

Figure 8.
Poincaré plot for healthy subject and patient with arrhythmia.

Figure 9.
MultiFractal Detrended Fluctuation Analysis (MFDFA) for healty subject and patient with arrhythmia.
Figure 9.
MultiFractal Detrended Fluctuation Analysis (MFDFA) for healty subject and patient with arrhythmia.


Table 1.
Commonly used Time-Domain parameters [50].
Table 1.
Commonly used Time-Domain parameters [50].
| Parameter | Formula |
|---|---|
| SDNN[ms] | |
| SDANN[ms] | |
| SDIndex[ms] | |
| RMSSD[ms] | |
| pNN50[%] |
Table 2.
Commonly used Frequency-Domain Parameters. (Five minutes of the studied series).
| Parameter | Description |
|---|---|
| TP | Total Power (0–0.4 Hz) |
| VLF | Very Low Frequency Power (0.003–0.04 Hz) |
| LF | Low Frequency Power (0.04–0.15 Hz) |
| HF | High Frequency Power (0.15–0.4 Hz) |
Table 3.
Overview of the study results for 30-min. ECG, and PPG signals.
| Parameter | ECG | PPG1-ear | PPG2-middle finger | PPG3-index finger |
|---|---|---|---|---|
| Number RR/PP intervals | 1952 | 1952 | 1952 | 1952 |
| Average intervals [ms] | 918.7 | 914.3 | 914.5 | 914.5 |
| Min.value [ms] | 798.3 | 800.4 | 746.0 | 746.0 |
| Max.value [ms] | 981.2 | 971.4 | 948.0 | 948.0 |
| MSE [s] | - | 1.881 × 10⁻⁴ | 2.070 × 10⁻⁴ | 2.070 × 10⁻⁴ |
Table 4.
Demographic Characteristics.
| Parameter | Group1 (Arrhythmia) N = 42 | Group2 (Healthy) N = 40 | p Value |
|---|---|---|---|
| Gender, Men% | 54.55 | 55.00 | NS |
| Age ± sd | 59.64 ± 12.32 | 58.65 ± 8.44 | NS |
Table 5.
Time-Domain Parameters.
| Parameter | Group1 (Arrhythmia) N = 42 | Group2 (Healthy) N = 40 | p Value |
|---|---|---|---|
| MeanNN [ms] | 867.91 ± 241.37 | 844.22 ± 146.18 | NS (0.7052) |
| MeanHR [bpm] | 69.83 ± 16.19 | 71.07 ± 12.46 | NS (0.7839) |
| SDNN [ms] | 141.97 ± 43.19 | 112.32 ± 22.16 | 0.0088 |
| SDANN [ms] | 137.04 ± 14.15 | 128.44 ± 11.62 | 0.0385 |
| SDIndex [ms] | 62.85 ± 24.73 | 62.33 ± 12.09 | NS (0.9326) |
| RMSSD [ms] | 32.57 ± 8.04 | 28.02 ± 7.88 | 0.0718 |
| pNN50 [%] | 22.86 ± 9.41 | 16.71 ± 8.94 | 0.0363 |
Table 6.
Frequency-Domain Parameters.
| Parameter | Group1 (Arrhythmia) N = 42 | Group2 (Healthy) N = 40 | p Value |
|---|---|---|---|
| VLF [] | 1048.44 ± 104.71 | 1823.22 ± 124.62 | <0.0001 |
| LF [] | 940.91 ± 73.92 | 1659.48 ± 63.88 | <0.0001 |
| HF [] | 683.11 ± 72.34 | 941.33 ± 87.06 | <0.0001 |
| LF [n.u.] | 57.49 ± 4.48 | 63.81 ± 2.46 | <0.0001 |
| HF [n.u.] | 42.60 ± 7.59 | 36.19 ± 3.33 | 0.0012 |
| LF/HF | 1.38 ± 0.27 | 1.76 ± 0.39 | 0.0006 |
Table 7.
Nonlinear methods Parameters.
| Parameter | Group1 (Arrhythmia) N = 42 | Group2 (Healthy) N = 40 | p Value |
|---|---|---|---|
| SD1 [ms]-Poincaré plot | 21 ± 6 | 32 ± 9.8 | 0.0005 |
| SD2 [ms]-Poincaré plot | 84 ± 16 | 101 ± 23 | 0.004 |
| SD1/SD2-Poincaré plot | 0.24 ± 0.11 | 0.31 ± 0.13 | 0.07 |
| Alpha 1- DFA | 1.43 ± 0.18 | 1.05 ± 0.23 | 0.0001 |
| Alpha 2- DFA | 1.02 ± 0.08 | 0.97 ± 0.08 | 0.07 |
| Multifractal spectrum-MFDFA | 0.2 ± 0.15 | 0.5 ± 0.22 | 0.0001 |
| Hurst exponent-R/S plot | 0.55 ± 0.03 | 0.81 ± 0.07 | 0.0001 |
| AppEn | 1.08 ± 0.3 | 1.62 ± 0.4 | 0.0001 |
| SampEn | 1.01 ± 0.25 | 1.6 ± 0.35 | 0.0001 |
© 2020 by the authors. Licensee MDPI, Basel, Switzerland. This article is an open access article distributed under the terms and conditions of the Creative Commons Attribution (CC BY) license (http://creativecommons.org/licenses/by/4.0/).
Share and Cite
MDPI and ACS Style
Georgieva-Tsaneva, G.; Gospodinova, E.; Gospodinov, M.; Cheshmedzhiev, K. Portable Sensor System for Registration, Processing and Mathematical Analysis of PPG Signals. Appl. Sci. 2020, 10, 1051. https://doi.org/10.3390/app10031051
AMA Style
Georgieva-Tsaneva G, Gospodinova E, Gospodinov M, Cheshmedzhiev K. Portable Sensor System for Registration, Processing and Mathematical Analysis of PPG Signals. Applied Sciences. 2020; 10(3):1051. https://doi.org/10.3390/app10031051
Chicago/Turabian StyleGeorgieva-Tsaneva, Galya, Evgeniya Gospodinova, Mitko Gospodinov, and Krasimir Cheshmedzhiev. 2020. "Portable Sensor System for Registration, Processing and Mathematical Analysis of PPG Signals" Applied Sciences 10, no. 3: 1051. https://doi.org/10.3390/app10031051
Note that from the first issue of 2016, this journal uses article numbers instead of page numbers. See further details here.