1. Introduction
The beneficial health effects of dietary (poly)phenols have been reported in several epidemiological and clinical trials [
1,
2,
3], although their biological activities are not all attributed to their native form. After ingestion, modification by phase I and II metabolic enzymes reduces the concentrations of native (poly)phenols in the systemic circulation [
4,
5]. More than 80% of dietary (poly)phenols are not absorbed in the small intestine and reach the colon, where they undergo conjugation and are metabolized by gut microbiota through a range of enzymatic reactions (deglycosylation, dehydroxylation, demethylation, deconjugation, epimerization, ring fission, hydrolysis, and chain-shortening) [
5,
6,
7]. The microbial phenolic metabolites (MPM) may be more bioactive than the parental (poly)phenol when they reach the target cells or tissues [
8,
9,
10,
11]. Fewer studies have reported MPM in young populations, such as adolescents.
High-resolution mass spectrometry (HRMS) using an Orbitrap mass analyzer is a well-established method for rapid targeted and untargeted identification of (poly)phenols in nutrimetabolomics studies [
12]. This equipment provides exact mass information, two-stage mass analysis (MS/MS), and multi-stage mass analysis (MS
n), which facilitates the structural elucidation of known and unknown compounds [
12,
13,
14,
15]. Therefore, HRMS constitutes a versatile and robust system for quantitative analysis [
16,
17,
18,
19]. However, to date, few methods are available to quantify MPM in human biological samples using high performance liquid chromatography (HPLC)/Orbitrap-HRMS.
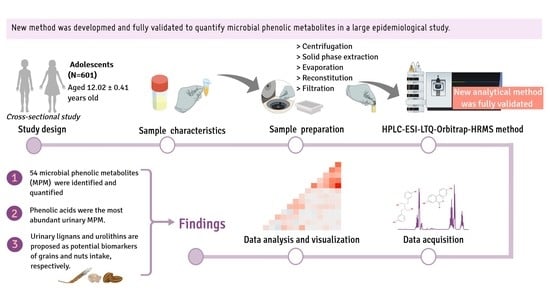
The aim of this study was to develop and validate a high-performance liquid chromatography/electrospray ionization-linear ion trap quadrupole-Orbitrap-high-resolution mass spectrometry (HPLC/ESI-LTQ-Orbitrap-HRMS) method to identify and quantify urinary MPM in adolescents, and to explore the relationship of MPM with dietary (poly)phenols.
2. Materials and Methods
2.1. Study Design and Sample Selection
This work was carried out as a cross-sectional analysis within the SI! (Salud Integral) Program for Secondary Schools trial in Spain, a cluster-randomized controlled intervention trial (NCT03504059) aiming to evaluate the impact of a lifestyle educational program on cardiometabolic health in adolescents. A total 1326 participants were recruited in the baseline of the trial. Details of the study design, recruitment procedures, and Commission on Ethics are available elsewhere [
20]. Informed consent was obtained for all the parents or caregivers.
For the current study, baseline data of 601 randomly chosen participants (53% girls) with available baseline urine samples were included, equivalent to 45% of the original cohort.
2.2. Chemicals and Urine Samples
The provenance of chemicals and standards is listed in the
Supplemental data. Urine samples were collected in 2017 and stored at −80 °C until analysis.
2.3. Sample Preparation and Extraction of (Poly)Phenols
All the spot urine samples were analyzed in a room with filtered light and kept on ice to avoid phenolic oxidation, following the procedure proposed by Martínez-Huelamo et. al., with some modifications [
21]. Firstly, 1 mL of urine was acidified with 2 µL of formic acid and centrifuged at 15,000×
g at 4 °C for 4 min. After centrifugation, the urine underwent a solid-phase extraction (SPE) and clean-up procedure using Waters Oasis HLB 96-well plates 30 µm (30 mg) (Waters Oasis, Milford, MA, USA). Plates were activated by consecutively adding 1 mL of methanol (MeOH) and 1 mL of 1.5 M formic acid. After loading 1 mL of sample, clean-up was performed with 0.5 mL of 1.5 M formic acid and 0.5% MeOH, and the elution with 1 mL MeOH acidified with 0.1% of formic acid.
The eluted fraction was evaporated to dryness under a stream of nitrogen gas in a sample concentrator (Techne, Duxford, Cambridge, UK) at room temperature, and reconstituted with 100 µL of 0.05% formic acid in water. The 96-well plate was then vortexed for 20 min and filtered through 0.22 µm polytetrafluoroethylene 96-well plate filters (Millipore, Burlington, MA, USA). To prepare calibration curves, synthetic urine was spiked with increasing concentrations of a mixture of 18 phenolic standards (3-hydroxybenzoic acid, 3-hydroxytyrosol, 3′-hydroxytyrosol-3′-glucuronide, protocatechuic acid, 4-hydroxybenzoic acid, vanillic acid, syringic acid, enterodiol, enterolactone, urolithin-B, gallic acid, dihydroresveratrol, urolithin-A, 3,4-dihydroxyphenylpropionic acid, 3′-hydroxyphenylacetic acid, o-coumaric acid, m-coumaric acid, and p-coumaric acid) before being processed and subjected to the same extraction procedure exactly as the samples. Abscisic acid d6 was used as an internal standard.
Synthetic urine was used as a blank, composed of calcium chloride (0.65 g/L), magnesium chloride (0.65 g/L), sodium chloride (4.6 g/L), sodium sulfate (2.3 g/L), sodium citrate (0.65 g/L), dihydrogen phosphate (2.8 g/L), potassium chloride (1.6 g/L), ammonium chloride (1.0 g/L), urea (25 g/L), and creatinine (1.1 g/L) [
22].
2.4. HPLC/ESI-LTQ-Orbitrap-HRMS Instrumentation
2.4.1. Chromatographic Conditions
Analysis was performed using an Accela chromatograph (Thermo Scientific, Hemel Hempstead, UK) equipped with a quaternary pump and a thermostated autosampler set at 4 °C, all operated by Chromeleon Xpress software. Chromatographic separation was accomplished with a reverse phase chromatographic column Kinetex F5 (50 × 4.6 mm i.d., 2.6 µm) (Phenomenex, Torrance, CA, USA) kept at 40 °C. Gradient elution was carried out with (A) water (0.05% formic acid) and (B) acetonitrile (0.05% formic acid) at a constant flow rate of 0.5 mL/min. The injection volume was 5 µL. A non-linear gradient was applied: 0 min, 2% B; 1 min, 2% B; 2.5 min, 8% B; 7 min, 20% B; 9 min, 30% B; 11 min, 50% B; 12 min, 70% B, 15 min, 100% B; 16 min, 100% B; 16.5 min, 2% B; 21.5 min, 2% B. The total run time was 21.5 min.
2.4.2. Mass Spectrometry Parameters
Accurate mass measurements were performed on an LTQ Orbitrap Velos mass spectrometer (Thermo Scientific, Hemel Hempstead, UK) equipped with an ESI source working in negative mode. Mass spectra were acquired in profile mode with a setting of 30,000 resolution at m/z 400, and the mass range was from m/z 100 to 2000. Operation parameters were as follows: source voltage, 5 kV; sheath gas, 50 units; auxiliary gas, 20 units; sweep gas, 2 units, and capillary temperature, 375 °C.
2.5. Validation of the HPLC/ESI-LTQ-Orbitrap-HRMS Method
The method was validated following the criteria of the Association of Official Agricultural Chemists (AOAC) International in terms of linearity, limit of detection (LOD), limit of quantification (LOQ), recovery, intra- and inter-day accuracy and precision, and postpreparative stability [
23]. All parameters were examined based on three concentrations (low, medium, and high) of each phenolic compound standard, as shown in
Table 1.
2.5.1. Linearity and Sensitivity
Calibration curves were prepared by spiking synthetic urine in triplicate using nine different concentrations of standard mixtures ranging from 1 to 1000 μg/L for 3-hydroxybenzoic acid, 3-hydroxytyrosol, 3′-hydroxytyrosol-3′-glucuronide, protocatechuic acid, 4-hydroxybenzoic acid, vanillic acid, syringic acid, m-coumaric acid, p-coumaric acid, o-coumaric acid, enterodiol, enterolactone, and urolithin-B; 2.5 to 2500 μg/L for gallic acid, dihydroresveratrol, and urolithin-A; 5 to 5000 μg/L for 3,4-dihydroxyphenylpropionic acid; and 10 to 10,000 μg/L for 3′-hydroxyphenylacetic acid, with the internal standard (IS) (+)cis, trans-abscisic acid d6 (500 μg/L). Calibration curves were created by quadratic regression analysis with residual plots lower than 15%. The adequacy of the model and linearity were assessed by coefficient of determination (R2).
LOD and LOQ were estimated for a signal-to-noise (S/N) ratio of 3 and 10, respectively.
2.5.2. Accuracy and Precision
Accuracy was determined by analyzing five replicates of spiked synthetic urine with three known concentrations (
Table 1) to evaluate the closeness of agreement between the calculated amount and the nominal amount of analyte. The results were expressed as the percentage of the ratio of the mean concentration observed and the known spiked concentration in the biological matrices. Precision was calculated using relative standard deviation (RSD) between the five spiked urine samples at three different levels on three different days. Intra- and inter-day precision was assessed using five determinations per three concentration levels (
Table 1) in a single analytical run or on three different days, respectively.
2.5.3. Recovery and Matrix Effect
Recovery and matrix effects (ME) were evaluated following the procedure described by Matuszewski et al., and Pereira-Caro et al. [
19,
24], analyzing three synthetic urines spiked at the three standard concentration levels (
Table 1). Recoveries were calculated as the ratio between the area responses of standard concentration levels dissolved in pre-extracted samples and the analyte area responses of post-extracted urine spiked at the same concentrations. The results were expressed as recovery rate.
MEs were determined with the same concentration levels by comparing area responses of the spiked pre-extracted samples with the analyte area responses with neat standards dissolved in the mobile phase. The results were expressed as percentages. ME values above 100% are considered to indicate ion enhancement, and below 100% ion suppression.
2.5.4. Stability
Postpreparative stability and freeze and thaw stability were assessed in this method. Postpreparative stability of the sample extraction process and during the time inside the autosampler at 4 °C were evaluated by injecting the post-extracted synthetic urine spiked with two standard concentrations (low and high) (
Table 1) into the HPLC-ESI-LTQ-Orbitrap-HRMS system at 0 and 24 h. Freeze and thaw stability were assessed by injecting the post-extracted synthetic urine spiked at the same concentration levels into the HPLC-ESI-LTQ-Orbitrap-HRMS system after three freeze (−80 °C) and thaw (room temperature) cycles.
2.5.5. Selectivity
The selectivity of the method was assessed by comparing chromatograms of blank human urine from three individuals and urine spiked with analytes at a known low concentration to discriminate between analytes and other endogenous components in urine.
2.6. Analysis of Urinary MPM by HPLC/ESI-LTQ-Orbitrap-HRMS in Adolescent Samples
2.6.1. Targeted Identification of MPM
MPM were identified by comparing retention times with those of available standards. A semi-targeted screening method was established to identify phase II metabolites (glucuronides and sulfates) when reference standards were not available. The molecular formula of each compound was generated with an accurate mass and error of 5 ppm using the Xcalibur software v2.0.7 (Thermo Fisher Scientific, San Jose, CA, USA). Data acquisition techniques, including Fourier transform mass spectrometry (FTMS) mode (scan range from
m/
z 100–1000) in combination with product ion scan experiments (MS2) (Orbitrap resolution from 15,000 to 30,000 FWHM), were performed to obtain information about the
m/
z of precursor and fragment ions, retention time, and isotope pattern. Finally, analytes were confirmed by comparing MS/MS spectra with fragments found in the literature and The Human Metabolome Database 4.0 [
25].
2.6.2. Quantification of MPM
Calibration curves were constructed with available standards in synthetic urine and subjected to the same procedure as described above. To quantify phase II metabolites (glucuronides and sulfates), calibration curves of the aglycon form were used. Samples with concentrations that exceeded the highest point of the calibration curve were diluted and reinjected into the HPLC-FTMS system. Quantitative data processing was performed using Trace Finder software (LC version 4.1, Thermo Fisher Scientific, San Jose, CA, USA).
MPM concentration was normalized by urinary creatinine concentrations, which were determined using the Jaffé alkaline picrate method adapted to microtiter 96-well plates [
26] and expressed as µg MPM/g creatinine.
2.7. Dietary (Poly)Phenols
Dietary intake was estimated using a semiquantitative food frequency questionnaire [
27]. Dietary (poly)phenol intake was assessed by matching data from the Phenol-Explorer database v.3.6. [
28]. Flavonoids, phenolic acids, stilbenes, lignans, phenolic acids, tyrosols, and other minor (poly)phenols, such as alkylphenols and alkylmethoxyphenols, were included in this analysis. Total (poly)phenol intake was estimated as the sum of individual (poly)phenol intakes and categorized into tertiles. Energy-adjusted (poly)phenol intake was calculated by the residual method established by Willet et al. [
29].
2.8. Data Analysis
General characteristics of the studied population are presented as means (standard deviation (SD)) or median (interquartile range (IQR)) for quantitative variables and percentages (number) for categorical variables. MPM concentrations are presented as the mean, standard error of the mean (SEM). Student’s t-test was used to compare mean values of general characteristics between girls and boys, but also to compare MPM and postpreparative stability.
For the statistical analysis, MPM levels below the LOQ were set to values corresponding to half the LOQ. Pearson correlation was used to assess the relationship between urinary MPM and dietary (poly)phenols, as well as polyphenol-rich food sources. The false discovery rate (FDR) method was applied to adjust p-values for multiple correlations [
30]. Data were normalized with the inverse normal distribution before the analysis.
The overall urinary MPM pattern and tertiles of total phenolic intake were assessed using principal component analysis (PCA) and presented as biplots in which eigenvectors were plotted as lines and the scores of individual samples as points. Beforehand, MPM data were standardized to unit variance.
Statistical analyses were conducted using the Stata statistical software package version 16.0 (StataCorp, College Station, TX, USA) and R v.4.1.1 (
https://www.r-project.org, accessed on 1 April 2022). Statistical tests were two-sided, and p-values below 0.05 were considered significant.
3. Results and Discussion
3.1. Optimization of the HPLC/ESI-LTQ-Orbitrap-HRMS Method
Several SPEs solutions, as well as two SPE cartridges (
Table S1 and Figure S1), were tested in order to obtain optimum recoveries. Two reverse-phase chromatographic columns were tested: Kinetex F5 (50 × 4.6 mm i.d., 2.6 µm) (Phenomenex, Torrance, CA, USA) and Atlantis T3 C18 (100 × 2.1 mm i.d., 3 µm) (Waters, Milford, MA, USA), obtaining better recoveries with Kinetex F5 and SPE 2 procedure (
Figure S1). Different percentages of formic acid (from 0.05% to 0.1%) in mobile phases were tested to achieve desirable peak shapes and compound separation. The best results were obtained with 0.05% formic acid (data not shown). Two injection volumes (5 and 10 μL) were also tested to ensure optimum separation and detection of the analytes, and 5 μL sample injection gave the best results (data not shown). Details of the analytical conditions tested are available in the
Supplemental Data.
3.2. Method Validation
3.2.1. Linearity, LOD, and LOQ
The HPLC/ESI-LTQ-Orbitrap-HRMS method provided quadratic responses with coefficients of determination (R
2) above 0.995 for all standards (
Table S2). Weighted factors (1/x statistical weight) were used to obtain the most reliable calibration curves.
The sensitivity of the method was evaluated by determining the LOD and LOQ of a synthetic urine sample spiked with standards. The LOD ranged from 0.02 to 3.29 µg/L, and LOQ from 0.06 to 10.96 µg/L.
3.2.2. Precision and Accuracy
Intra- and inter-day precision varied in the ranges of 0−15% and 1−16%, respectively, in accordance with the values proposed by the AOAC (RDS < 15%) [
23]. However, inter-day precision values for the lowest concentration of gallic acid, 3-hydroxytyrosol, and 3,4-dihydroxyphenylpropionic acid were 58, 31, and 26%, respectively (
Table S3), possibly due to early elution, which leads to a lower resolution peak when the concentration is low. Pereira et al. reported an intra-day precision of less than 15% (0% to 10%) for flavan-3-ols and their metabolites in a study using ultra high-performance liquid chromatography (UHPLC)-HRMS [
19].
The accuracy was within the accepted limits of the AOAC guidelines [
23] at all tested concentration levels for 89% of the metabolites analyzed, ranging from 80 to 120%. However, at the lowest concentrations the inter-day accuracy of gallic acid, 3,4-dihydroxyphenylpropionic acid,
m-coumaric acid, and urolithin-A fell outside this range (
Table S3).
3.2.3. Matrix Effect and Recovery
The average ME was 83%, with ranges from 53% to 126%, except those of urolithins-A and -B, which were below 35%. Minor ion suppression was also reported by Ordoñez et al. and Pereira-Caro et al. [
18,
19]. Ion enhancement was observed for 4-hydroxybenzoic acid and 3-hydroxyphenyacetic acid (
Table S3).
The average recovery of the three concentration levels was 89%, ranging between 70% and 99%. The lowest recovery was for gallic acid and 3-hydroxytyrosol, which was 70% at the lowest concentration (
Table S3). Similarly, Ordoñez et al. reported a mean recovery of 73% of urinary (poly)phenols extracted by an HLB cartridge and using an HPLC-HRMS method, obtaining a good recovery rate of 79% to 104% for free phenolic and glucuronide derivatives [
18]. Better recoveries were reported by Pereira-Caro et al., with values ranging from 95% to 102% for 34 flavan-3-ol and its metabolites in rat urine samples analyzed by UHPLC-HRMS [
19].
3.2.4. Stability
The postpreparative stability assay showed no significant variation of analyte concentration in the urine matrix 24 h post-extraction at both low and high concentrations, except for 3-hydroxyphenylacetic acid, which was the analyte with the highest reduction (13%) (
Figure S2). The freeze and thaw stability assay showed a signal decline of 14% for most analytes after the third freeze-thaw cycle. Likewise, Martínez-Huélamo et al., described a 12.9% reduction in signal for 3-hydroxyphenylacetic acid [
21].
3.2.5. Selectivity
Selectivity was confirmed by the absence of endogenous peaks in chromatograms at the same retention time as the analytes in three human urine samples. The method was, therefore, found to be selective for analytes at low concentrations and was able to discriminate between analytes and other components in urine.
3.3. Microbial Phenolic Metabolites Measured in Urine Samples
3.3.1. General Characteristics of the Study Population
Out of the 601 randomized participants selected in this cross-sectional analysis, 546 had available information of food intake. The general characteristics of participants are presented in
Table 2. The average age and body mass index (BMI) were 12.0 (0.4) years and 20.9 (4.2) kg/m
2, respectively. The mean energy-adjusted (poly)phenol intake was 683.5 (335.3) mg/day. No differences were observed between boys and girls in terms of BMI and total (poly)phenol intake (
Figure S3). Higher mean intakes of energy (
p-value = 0.002), carbohydrates (
p-value = 0.001), total fat (
p-value = 0.010), and proteins (
p-value < 0.001) were observed in boys (
Figure S3).
3.3.2. Identification and Quantification of Urinary MPM
Identification of MPM according to classes of (poly)phenols (lignans, hydroxybenzoic acids, hydroxycinnamic acids, hydroxyphenylacetic acids, hydroxyphenylpropanoic acids, stilbenes, hydroxycoumarins, and tyrosols) are presented in
Table S4. A total of 54 MPM were identified in urine. Enterolactone and urolithin diglucuronides were determined only in one sample.
Concentrations of MPM are summarized in
Table 3. Excretion of urinary MPM varied highly between participants, and the majority of MPM were detected in the form of glucuronides and sulfates. Consistent with our results, Ordónez et al. reported that an HPLC-HRMS method was suitable for the analysis of phase II metabolites [
18]. The most abundant MPM in the urine of all participants were phenolic acids, namely 3-hydroxyphenylacetic acid, hydroxyphenylacetic sulfate and glucuronide, protocatechuic acid sulfate-I, 3,4-dihydroxyphenylpropionic acid sulfate, hydroxybenzoic acid sulfate, and vanillic acid sulfate. These results are in agreement with Zamora-Ros et al., who detected phenolic acids as the most abundant urinary MPM in adult participants in the European Prospective Investigation into Cancer and Nutrition (EPIC) study [
31]. Similarly, Hurtado-Barroso et al. found phenylacetic acids to be among the most abundant urinary MPM in young adults [
32].
Urinary concentrations of stilbenes (dihydroresveratrol), tyrosols (3-hydroxytyrosol), and lignans (enterodiol) were low, with mean values below 10 µg/g of creatinine. Those reported by Zamora-Ros et al. in adults from the EPIC study were also low, being less than 5 µg/24 h [
31]. These levels could be explained by a low dietary intake of stilbenes, tyrosols, and lignans, as reported in the food frequency questionnaire.
A high percentage of participants had a urinary MPM concentration below the LOQ for hydroxybenzoic acid glucuronide-I (38%), gallic acid (37%), 3-hydroxybenzoic acid (34%), enterolactone (30%), coumaric acid glucuronide-II (27%), 3-hydroxytyrosol (24%), and enterodiol (23%).
Interindividual variations in MPM could be explained by the gut microbiota profile, which is affected by age, gender, hormonal status, dietary habits, and other lifestyle variables [
33]. In this study, the gut microbiota profile was not analyzed and thus the influence of the microbial family on MPM production was not determined.
Differences in urinary MPM between boys and girls are shown in
Figure 1. Boys had higher values of 3,4-dihydroxyphenylpropionic, dihydroxyphenylpropionic sulfate, gallic acid, gallic acid sulfate, p-coumaric acid, vanillic acid glucuronide and sulfate, hydroxybenzoic acid glucuronide-I and sulfate-I, protocatechuic acid sulfate, 3-hydroxyphenylacetic acid and hydroxyphenylacetic acid glucuronide and sulfate than girls. Our findings are in line with those of Zamora et al., who observed that the median urinary concentrations of tyrosol, vanillic acid, and 4-hydroxyphenylacetic acid were at least 1.4-fold higher in men than women [
31]. Similarly, Mumford et al., found higher values of enterodiol and enterolactone in females than males [
34]. As sex hormones may be responsible for these differences [
8,
35], a limitation of the current study is that the follicular phase of the menstrual cycle was not considered during the urine collection to minimize bias related to the hormonal status of the participants.
3.3.3. Urinary MPM and Dietary (Poly)Phenols
No differences were found between classes of urinary MPM and tertiles of total phenolic intake in the PCA (
Figure S4). However, positive correlations were observed between urinary hydroxycoumarins (urolithins) and flavonoid intake and TPI (
Figure 2). Additionally, positive correlations were observed between urinary lignans and intake of whole grains (R = 0.13, FDR-adjusted
p = 0.007) and green-leaf vegetables (R = 0.13, FDR-adjusted
p = 0.008). Urinary hydroxycinnamic acids also correlated with whole grains (R = 0.11, FDR-adjusted
p = 0.015), green-leaf vegetables (R = 0.15, FDR-adjusted p = 0.002), and tomato or tomato-based products (R = 0.12, FDR-adjusted
p = 0.011) (
Figure S5). Urolithins are produced by gut microbiota through the metabolism of ellagitannins [
11,
36], whose main food sources are red fruits, nuts, and seeds [
36], but in our study, urolithins were only positively correlated with nuts and seeds (R = 0.13, FDR-adjusted
p = 0.014).
4. Conclusions
In conclusion, an HPLC-ESI-LTQ-Orbitrap-HRMS method was developed and fully validated to quantify urinary MPM in terms of linearity, sensitivity, recovery, accuracy, and precision. To our knowledge, this is the first time that several MPM have been identified and quantified in urine samples of an adolescent population using an HPLC-ESI-LTQ-Orbitrap-HRMS method on a large scale. Variations in MPM were observed between participants, which were associated with variability in dietary (poly)phenol intake and sex. Finally, some MPM were found to be potential dietary biomarkers of specific food groups, namely lignans for whole grains and urolithins for nuts. Further investigations are needed to explore the relationship between MPM and dietary sources of (poly)phenols.
Supplementary Materials
The following supporting information can be downloaded at:
https://www.mdpi.com/article/10.3390/antiox11061167/s1. Standards and chemicals. Analytical condition testing before validation HPLC/ESI-LTQ-Orbitrap-HRMS method. Figure S1: Recovery obtained according to different solid phase extraction and reverse-phase chromatographic columns (Kinetex F5 (50 x 4.6 mm i.d., 2.6 µm) and Atlantis T3 C18 (100 x 2.1 mm i.d., 3 µm). Figure S2: Postpreparative stability. Mean concentrations (μg/L) of phenolic compounds recovered at the start (t = 0) and at 24 h with two standard concentrations prepared in synthetic urine. Figure S3: General characteristics of participants according to gender. Figure S4: Principal component (PC) biplot of subclass of microbial phenolic metabolites (MPM) according to tertiles of total polyphenol intake (
n = 546). Figure S5: Heatmap of the Pearson correlation between subclass of microbial phenolic metabolites and polyphenol-rich food intake in adolescents. Table S1: Recovery obtained in Oasis HLB and PRiMe HLB. Table S2: Validation data: Linearity ranges, coefficient of determination, and low limits of detection and quantification of microbial phenolic metabolite. Table S3: Intra- and inter-day precision and accuracy, matrix effect and recovery results for three concentration levels (high, medium, and low); RSD (%) was calculated for the recovery values for three replicates. Table S4: Identification of microbial phenolic metabolites in urine by HPLC/ESI-LTQ-Orbitrap-HRMS. Table S5: Pearson correlation coefficients between microbial phenolic metabolites and dietary polyphenols in adolescents. References [
37,
38] are cited in the Supplementary Materials.
Author Contributions
Conceptualization, A.V.-Q., M.M.-H., E.P.L.-S., M.M.-M., O.J. and R.M.L.-R.; methodology, A.V.-Q., M.M.-H., E.P.L.-S., M.M.-M. and O.J.; software, E.P.L.-S. and M.M.-M.; validation, E.P.L.-S., M.M.-M., A.V.-Q., M.M.-H. and R.M.L.-R.; formal analysis E.P.L.-S., M.M.-M. and A.V.-Q.; investigation, E.P.L.-S., M.M.-M., A.V.-Q. and R.M.L.-R.; sources, R.M.L.-R.; data curation, E.P.L.-S., M.M.-M., A.V.-Q., O.J. and E.M.; writing-original draft preparation, E.P.L.-S., M.M.-M., A.V.-Q., A.T.-R. and R.M.L.-R.; writing-review and editing, E.P.L.-S., M.M.-M., A.V.-Q., M.M.-H., C.A.-R., A.T.-R., R.M.L.-R., O.J., S.C.-B., A.M.R.-L., R.E., R.F.-J., J.M.F.-A., G.S.-B., M.d.M., P.B., A.d.C.-G. and J.M.-G.; visualization, E.P.L.-S., M.M.-M. and A.V.-Q.; supervision, A.V.-Q., M.M.-H. and R.M.L.-R. All authors have read and agreed to the published version of the manuscript.
Funding
This research was funded in part by CICYT (AGL2016-75329-R and PID2020-114022RB-I00]), the Instituto de Salud Carlos III—ISCIII (CIBEROBN CB12/03/30020) from the Ministry of Science, Innovation, and Universities (AEI/FEDER, UE) and Generalitat de Catalunya (GC) 2017 SGR 196. The SI! Program for Secondary School trial was funded by the Fundació la Marató de TV3 (369/C/2016), the SHE Foundation-‘la Caixa’ Foundation (LCF/PR/CE16/10700001), the Ministerio de Ciencia e Innovación (AGL2016-75329-R). E.P.L.-S. is supported by the FI-SDUR (EMC/3345/2020) fellowship from the Generalitat de Catalunya. M.M.-M. and S.C.-B. are supported by the Ministry of Science, Innovation, and Universities for the FPU17/00513 and FPU17/00785 fellowship. A.V.-Q. is supported the Ministry of Science, Innovation, and Universities for the Ramon y Cajal contract (RYC-2016-19355). A.T.-R. is supported by Serra Húnter Fellowship JM-G is a postgraduate fellow of the Ministerio de Ciencia e Innovación of Spain at the Residencia de Estudiantes (2020–ongoing). G.S.-B. is supported by a “la Caixa” Foundation fellowship (LCF/PR/MS19/12220001). R.F.-J. is a recipient of grant PI19/01704 funded by the Fondo de Investigación Sanitaria- Instituto de Salud Carlos III (ISCIII) and co-funded by the European Regional Development Fund/European Social Fund “A way to make Europe”/“Investing in your future”. The Centro Nacional de Investigaciones Cardiovasculares is supported by the ISCIII, the Ministerio de Ciencia e Innovación, and the Pro CNIC Foundation, and is a Severo Ochoa Center of Excellence (CEX2020-001041-S).
Institutional Review Board Statement
The study was conducted in accordance with the Declaration of Helsinki and approved by the Ethics Committee of Instituto de Salud Carlos III in Madrid (CEI PI 35_2016), the Fundació Unió Catalana d’Hospitals (CEI 16/41), and the University of Barcelona (IRB00003099).
Informed Consent Statement
Informed consent was obtained from all parents or caregivers of the participants involved in the SI! (Salud Integral) Program for Secondary Schools trial.
Data Availability Statement
Acknowledgments
The authors wish to thank all the volunteers and their families, teachers, and schools for their contribution to the SI! Program for Secondary Schools, and the Scientific and Technological Center of University of Barcelona (CCiT-UB) for the mass spectrometry equipment and all technician support.
Conflicts of Interest
R.M.L.-R. reports receiving lecture fees from Cerveceros de España and receiving lecture fees and travel support from Adventia and Idilia Foods SL. R.E. reports grants from Fundación Dieta Mediterránea, Spain and Cerveza y Salud, Spain. In addition, personal fees for given lectures from Brewers of Europe, Belgium, Fundación Cerveza y Salud, Spain, Pernaud-Ricard, Mexico, Instituto Cervantes, Alburquerque, USA; Instituto Cervantes, Milan, Italy, Instituto Cervantes, Tokyo, Japan, Lilly Laboratories, Spain, and Wine and Culinary International Forum, Spain, and non-financial support to organize a National Congress on Nutrition, as well as feeding trials with product from Grand Fountain and Uriach Laboratories, Spain. The funders had no role in the design of the study; in the collection, analyses, or interpretation of data; in the writing of the manuscript, or in the decision to publish the results. The other authors declare no conflict of interest.
Abbreviations
| AOAC | Association of Official Agricultural Chemists |
| BMI | body mass index |
| ESI | electrospray ionization |
| FDR | false discovery rate |
| FTMS | Fourier transform mass spectrometry |
| HPLC | high performance liquid chromatography |
| HRMS | high-resolution mass spectrometry |
| IQR | interquartile range |
| LOD | limit of detection |
| LOQ | limit of quantification |
| LTQ | linear ion trap quadrupole |
| MeOH | methanol |
| ME | matrix effect |
| MPM | microbial phenolic metabolites |
| MS/MS | two-stage mass analysis |
| MSn | multi-stage mass analysis |
| PCA | principal component analysis |
| R2 | coefficient of determination |
| RSD | relative standard deviation |
| SD | standard deviation |
| SEM | standard error of mean |
| S/N | signal-to-noise |
| SPE | solid-phase extraction |
| TPI | total (poly)phenol intake |
| UHPLC | ultra-high performance liquid chromatography |
References
- Tresserra-Rimbau, A.; Guasch-Ferré, M.; Salas-Salvadó, J.; Toledo, E.; Corella, D.; Castañer, O.; Guo, X.; Gómez-Gracia, E.; Lapetra, J.; Arós, F.; et al. Intake of Total Polyphenols and Some Classes of Polyphenols Is Inversely Associated with Diabetes in Elderly People at High Cardiovascular Disease Risk. J. Nutr. 2015, 146, 767–777. [Google Scholar] [CrossRef] [Green Version]
- Sun, Q.; Wedick, N.M.; Tworoger, S.S.; Pan, A.; Townsend, M.K.; Cassidy, A.; Franke, A.A.; Rimm, E.B.; Hu, F.B.; van Dam, R.M. Urinary Excretion of Select Dietary Polyphenol Metabolites Is Associated with a Lower Risk of Type 2 Diabetes in Proximate but Not Remote Follow-Up in a Prospective Investigation in 2 Cohorts of US Women. J. Nutr. 2015, 145, 1280–1288. [Google Scholar] [CrossRef]
- Estruch, R.; Ros, E.; Salas-Salvadó, J.; Covas, M.-I.; Corella, D.; Arós, F.; Gómez-Gracia, E.; Ruiz-Gutiérrez, V.; Fiol, M.; Lapetra, J.; et al. Primary Prevention of Cardiovascular Disease with a Mediterranean Diet Supplemented with Extra-Virgin Olive Oil or Nuts. N. Engl. J. Med. 2018, 378, e34. [Google Scholar] [CrossRef]
- Marhuenda-Muñoz, M.; Laveriano-Santos, E.P.; Tresserra-Rimbau, A.; Lamuela-Raventós, R.M.; Martínez-Huélamo, M.; Vallverdú-Queralt, A. Microbial Phenolic Metabolites: Which Molecules Actually Have an Effect on Human Health? Nutrients 2019, 11, 2725. [Google Scholar] [CrossRef] [Green Version]
- Manach, C.; Scalbert, A.; Morand, C.; Rémésy, C.; Jiménez, L. Polyphenols: Food Sources and Bioavailability. Am. J. Clin. Nutr. 2004, 79, 727–747. [Google Scholar] [CrossRef] [Green Version]
- Duarte, L.; Gasaly, N.; Poblete-Aro, C.; Uribe, D.; Echeverria, F.; Gotteland, M.; Garcia-Diaz, D.F. Polyphenols and Their Anti-Obesity Role Mediated by the Gut Microbiota: A Comprehensive Review. Rev. Endocr. Metab. Disord. 2021, 22, 367–388. [Google Scholar] [CrossRef]
- Bohn, T. Dietary Factors Affecting Polyphenol Bioavailability. Nutr. Rev. 2014, 72, 429–452. [Google Scholar] [CrossRef]
- Fan, Y.; Qian, H.; Wu, Z.; Li, Z.; Li, X.; Zhang, Y.; Xu, Q.; Lu, C.; Wang, X. Exploratory Analysis of the Associations between Urinary Phytoestrogens and Thyroid Hormones among Adolescents and Adults in the United States: National Health and Nutrition Examination Survey 2007–2010. Environ. Sci. Pollut. Res. 2022, 29, 2974–2984. [Google Scholar] [CrossRef]
- Gaya, P.; Medina, M.; Sánchez-Jiménez, A.; Landete, J. Phytoestrogen Metabolism by Adult Human Gut Microbiota. Molecules 2016, 21, 1034. [Google Scholar] [CrossRef] [Green Version]
- Perez-Cornago, A.; Appleby, P.N.; Boeing, H.; Gil, L.; Kyrø, C.; Ricceri, F.; Murphy, N.; Trichopoulou, A.; Tsilidis, K.K.; Khaw, K.-T.; et al. Circulating Isoflavone and Lignan Concentrations and Prostate Cancer Risk: A Meta-Analysis of Individual Participant Data from Seven Prospective Studies Including 2,828 Cases and 5,593 Controls. Int. J. Cancer 2018, 143, 2677–2686. [Google Scholar] [CrossRef]
- Selma, M.V.; González-Sarrías, A.; Salas-Salvadó, J.; Andrés-Lacueva, C.; Alasalvar, C.; Örem, A.; Tomás-Barberán, F.A.; Espín, J.C. The Gut Microbiota Metabolism of Pomegranate or Walnut Ellagitannins Yields Two Urolithin-Metabotypes That Correlate with Cardiometabolic Risk Biomarkers: Comparison between Normoweight, Overweight-Obesity and Metabolic Syndrome. Clin. Nutr. 2018, 37, 897–905. [Google Scholar] [CrossRef]
- López-Yerena, A.; Domínguez-López, I.; Vallverdú-Queralt, A.; Pérez, M.; Jáuregui, O.; Escribano-Ferrer, E.; Lamuela-Raventós, R.M. Metabolomics Technologies for the Identification and Quantification of Dietary Phenolic Compound Metabolites: An Overview. Antioxidants 2021, 10, 846. [Google Scholar] [CrossRef]
- Eliuk, S.; Makarov, A. Evolution of Orbitrap Mass Spectrometry Instrumentation. Annu. Rev. Anal. Chem. 2015, 8, 61–80. [Google Scholar] [CrossRef]
- Vallverdú-Queralt, A.; Jáuregui, O.; Medina-Remón, A.; Andrés-Lacueva, C.; Lamuela-Raventós, R.M. Improved Characterization of Tomato Polyphenols Using Liquid Chromatography/Electrospray Ionization Linear Ion Trap Quadrupole Orbitrap Mass Spectrometry and Liquid Chromatography/Electrospray Ionization Tandem Mass Spectrometry. Rapid Commun. Mass Spectrom. 2010, 24, 2986–2992. [Google Scholar] [CrossRef]
- Sasot, G.; Martínez-Huélamo, M.; Vallverdú-Queralt, A.; Mercader-Martí, M.; Estruch, R.; Lamuela-Raventós, R.M. Identification of Phenolic Metabolites in Human Urine after the Intake of a Functional Food Made from Grape Extract by a High Resolution LTQ-Orbitrap-MS Approach. Food Res. Int. 2017, 100, 435–444. [Google Scholar] [CrossRef]
- Grund, B.; Marvin, L.; Rochat, B. Quantitative Performance of a Quadrupole-Orbitrap-MS in Targeted LC–MS Determinations of Small Molecules. J. Pharm. Biomed. Anal. 2016, 124, 48–56. [Google Scholar] [CrossRef]
- Henry, H.; Sobhi, H.R.; Scheibner, O.; Bromirski, M.; Nimkar, S.B.; Rochat, B. Comparison between a High-Resolution Single-Stage Orbitrap and a Triple Quadrupole Mass Spectrometer for Quantitative Analyses of Drugs. Rapid Commun. Mass Spectrom. 2012, 26, 499–509. [Google Scholar] [CrossRef]
- Ordóñez, J.L.; Pereira-Caro, G.; Ludwig, I.; Muñoz-Redondo, J.M.; Ruiz-Moreno, M.J.; Crozier, A.; Moreno-Rojas, J.M. A Critical Evaluation of the Use of Gas Chromatography- and High Performance Liquid Chromatography-Mass Spectrometry Techniques for the Analysis of Microbial Metabolites in Human Urine after Consumption of Orange Juice. J. Chromatogr. A 2018, 1575, 100–112. [Google Scholar] [CrossRef]
- Pereira-Caro, G.; Ordóñez, J.L.; Ludwig, I.; Gaillet, S.; Mena, P.; del Rio, D.; Rouanet, J.-M.; Bindon, K.A.; Moreno-Rojas, J.M.; Crozier, A. Development and Validation of an UHPLC-HRMS Protocol for the Analysis of Flavan-3-Ol Metabolites and Catabolites in Urine, Plasma and Feces of Rats Fed a Red Wine Proanthocyanidin Extract. Food Chem. 2018, 252, 49–60. [Google Scholar] [CrossRef]
- Fernandez-Jimenez, R.; Santos-Beneit, G.; Tresserra-Rimbau, A.; Bodega, P.; de Miguel, M.; de Cos-Gandoy, A.; Rodríguez, C.; Carral, V.; Orrit, X.; Haro, D.; et al. Rationale and Design of the School-Based SI! Program to Face Obesity and Promote Health among Spanish Adolescents: A Cluster-Randomized Controlled Trial. Am. Heart J. 2019, 215, 27–40. [Google Scholar] [CrossRef]
- Martínez-Huélamo, M.; Tulipani, S.; Jáuregui, O.; Valderas-Martinez, P.; Vallverdú-Queralt, A.; Estruch, R.; Torrado, X.; Lamuela-Raventós, R.M. Sensitive and Rapid UHPLC-MS/MS for the Analysis of Tomato Phenolics in Human Biological Samples. Molecules 2015, 20, 20409–20425. [Google Scholar] [CrossRef] [Green Version]
- Roura, E.; Andrés-Lacueva, C.; Estruch, R.; Lamuela-Raventós, R.M. Total Polyphenol Intake Estimated by a Modified Folin–Ciocalteu Assay of Urine. Clin. Chem. 2006, 52, 749–752. [Google Scholar] [CrossRef] [Green Version]
- Lynch, J.; Horwitz, W.; Latimer, G.W. Appendix E: Laboratory Quality Assurance; Official Methods of Analysis of AOAC International: Washington, DC, USA, 2005; Available online: http://www.eoma.aoac.org/app_e.pdf (accessed on 1 January 2018).
- Matuszewski, B.K.; Constanzer, M.L.; Chavez-Eng, C.M. Strategies for the Assessment of Matrix Effect in Quantitative Bioanalytical Methods Based on HPLC−MS/MS. Anal. Chem. 2003, 75, 3019–3030. [Google Scholar] [CrossRef]
- Wishart, D.S.; Feunang, Y.D.; Marcu, A.; Guo, A.C.; Liang, K.; Vázquez-Fresno, R.; Sajed, T.; Johnson, D.; Li, C.; Karu, N.; et al. HMDB 4.0: The Human Metabolome Database for 2018. Nucleic Acids Res. 2018, 46, D608–D617. [Google Scholar] [CrossRef]
- Medina-Remón, A.; Barrionuevo-González, A.; Zamora-Ros, R.; Andres-Lacueva, C.; Estruch, R.; Martínez-González, M.-Á.; Diez-Espino, J.; Lamuela-Raventos, R.M. Rapid Folin–Ciocalteu Method Using Microtiter 96-Well Plate Cartridges for Solid Phase Extraction to Assess Urinary Total Phenolic Compounds, as a Biomarker of Total Polyphenols Intake. Anal. Chim. Acta 2009, 634, 54–60. [Google Scholar] [CrossRef]
- Juton, C.; Castro-barquero, S.; Casas, R.; Freitas, T.; Ruiz-león, A.M.; Crovetto, F.; Domenech, M.; Crispi, F.; Vieta, E.; Gratacós, E.; et al. Reliability and Concurrent and Construct Validity of a Food Frequency Questionnaire for Pregnant Women at High Risk to Develop Fetal Growth Restriction. Nutrients 2021, 13, 1629. [Google Scholar] [CrossRef]
- Neveu, V.; Perez-Jiménez, J.; Vos, F.; Crespy, V.; du Chaffaut, L.; Mennen, L.; Knox, C.; Eisner, R.; Cruz, J.; Wishart, D.; et al. Phenol-Explorer: An Online Comprehensive Database on Polyphenol Contents in Foods. Database 2010, 2010, bap024. [Google Scholar] [CrossRef]
- Willett, W.C.; Howe, G.R.; Kushi, L.H. Adjustment for Total Energy Intake in Epidemiologic Studies. Am. J. Clin. Nutr. 1997, 65, 1220S–1228S; discussion 1229S–1231S. [Google Scholar] [CrossRef]
- Benjamini, Y.; Hochberg, Y. Controlling the False Discovery Rate: A Practical and Powerful Approach to Multiple Testing. J. R. Stat. Soc. Ser. B 1995, 57, 289–300. [Google Scholar] [CrossRef]
- Zamora-Ros, R.; Achaintre, D.; Rothwell, J.A.; Rinaldi, S.; Assi, N.; Ferrari, P.; Leitzmann, M.; Boutron-Ruault, M.-C.; Fagherazzi, G.; Auffret, A.; et al. Urinary Excretions of 34 Dietary Polyphenols and Their Associations with Lifestyle Factors in the EPIC Cohort Study. Sci. Rep. 2016, 6, 26905. [Google Scholar] [CrossRef] [Green Version]
- Hurtado-Barroso, S.; Quifer-Rada, P.; Marhuenda-Muñoz, M.; Rinaldi de Alvarenga, J.F.; Tresserra-Rimbau, A.; Lamuela-Raventós, R.M. Increase of 4-Hydroxybenzoic, a Bioactive Phenolic Compound, after an Organic Intervention Diet. Antioxidants 2019, 8, 340. [Google Scholar] [CrossRef] [Green Version]
- Liu, C.; Vervoort, J.; Beekmann, K.; Baccaro, M.; Kamelia, L.; Wesseling, S.; Rietjens, I.M.C.M. Interindividual Differences in Human Intestinal Microbial Conversion of (-)-Epicatechin to Bioactive Phenolic Compounds. J. Agric. Food Chem. 2020, 68, 14168–14181. [Google Scholar] [CrossRef]
- Mumford, S.L.; Sundaram, R.; Schisterman, E.F.; Sweeney, A.M.; Barr, D.B.; Rybak, M.E.; Maisog, J.M.; Parker, D.L.; Pfeiffer, C.M.; Buck Louis, G.M. Higher Urinary Lignan Concentrations in Women but Not Men Are Positively Associated with Shorter Time to Pregnancy. J. Nutr. 2014, 144, 352–358. [Google Scholar] [CrossRef] [Green Version]
- Campesi, I.; Marino, M.; Cipolletti, M.; Romani, A.; Franconi, F. Put “Gender Glasses” on the Effects of Phenolic Compounds on Cardiovascular Function and Diseases. Eur. J. Nutr. 2018, 57, 2677–2691. [Google Scholar] [CrossRef]
- Espín, J.C.; Larrosa, M.; García-Conesa, M.T.; Tomás-Barberán, F. Biological Significance of Urolithins, the Gut Microbial Ellagic Acid-Derived Metabolites: The Evidence So Far. Evid.-Based Complement. Altern. Med. 2013, 2013, 270418. [Google Scholar] [CrossRef] [Green Version]
- Martínez-Huélamo, M.; Tulipani, S.; Torrado, X.; Estruch, R.; Lamuela-Raventós, R.M. Validation of a New LC-MS/MS Method for the Detection and Quantification of Phenolic Metabolites from Tomato Sauce in Biological Samples. J. Agric. Food Chem. 2012, 60, 4542–4549. [Google Scholar] [CrossRef]
- Quifer-Rada, P.; Martínez-Huélamo, M.; Jáuregui, O.; Chiva-Blanch, G.; Estruch, R.; Lamuela-Raventós, R.M. Analytical Condition Setting a Crucial Step in the Quantification of Unstable Polyphenols in Acidic Conditions: Analyzing Prenylflavanoids in Biological Samples by Liquid Chromatography-Electrospray Ionization Triple Quadruple Mass Spectrometry. Anal. Chem. 2013, 85, 5547–5554. [Google Scholar] [CrossRef]
| Publisher’s Note: MDPI stays neutral with regard to jurisdictional claims in published maps and institutional affiliations. |
© 2022 by the authors. Licensee MDPI, Basel, Switzerland. This article is an open access article distributed under the terms and conditions of the Creative Commons Attribution (CC BY) license (https://creativecommons.org/licenses/by/4.0/).


 ,
, 


