Article

Heme-Oxygenase-1 Attenuates Oxidative Functions of Antigen Presenting Cells and Promotes Regulatory T Cell Differentiation during Fasciola hepatica Infection

Laboratorio de Inmunomodulación y Desarrollo de Vacunas, Departamento de Inmunobiología, Facultad de Medicina, Universidad de La República, Montevideo 11800, Uruguay
*
Author to whom correspondence should be addressed.
Antioxidants 2021, 10(12), 1938; https://doi.org/10.3390/antiox10121938
Submission received: 2 October 2021 / Revised: 3 November 2021 / Accepted: 10 November 2021 / Published: 3 December 2021
(This article belongs to the Special Issue Heme Oxygenase (HO)-1 as an Immunoregulator in Health and Disease)

Abstract

:
Fasciola hepatica is a fluke that infects livestock and humans causing fasciolosis, a zoonotic disease of increasing importance due to its worldwide distribution and high economic losses. The parasite regulates the host immune system by inducing a strong Th2 and regulatory T (Treg) cell immune response through mechanisms that might involve the expression or activity of heme-oxygenase-1 (HO-1), the rate-limiting enzyme in the catabolism of free heme that also has immunoregulatory and antioxidant properties. In this paper, we show that F. hepatica-infected mice upregulate HO-1 on peritoneal antigen-presenting cells (APC), which produce decreased levels of both reactive oxygen and nitrogen species (ROS/RNS). The presence of these cells was associated with increased levels of regulatory T cells (Tregs). Blocking the IL-10 receptor (IL-10R) during parasite infection demonstrated that the presence of splenic Tregs and peritoneal APC expressing HO-1 were both dependent on IL-10 activity. Furthermore, IL-10R neutralization as well as pharmacological treatment with the HO-1 inhibitor SnPP protected mice from parasite infection and allowed peritoneal APC to produce significantly higher ROS/RNS levels than those detected in cells from infected control mice. Finally, parasite infection carried out in gp91phox knockout mice with inactive NADPH oxidase was associated with decreased levels of peritoneal HO-1+ cells and splenic Tregs, and partially protected mice from the hepatic damage induced by the parasite, revealing the complexity of the molecular mechanisms involving ROS production that participate in the complex pathology induced by this helminth. Altogether, these results contribute to the elucidation of the immunoregulatory and antioxidant role of HO-1 induced by F. hepatica in the host, providing alternative checkpoints that might control fasciolosis.

1. Introduction

Fasciolosis is a major parasitic disease of livestock caused by the trematode Fasciola spp. [1]. Nowadays, the number of infected people around the world is increasing, which makes fasciolosis an emerging zoonosis [1]. The World Health Organization (WHO) estimates that approximately 180 million are at risk of infection and 17 million people are infected, with a high prevalence in humans in Africa and South America [2]. Moreover, the economic losses caused by fasciolosis are estimated at around 3 billion US dollars per year due to livestock infection [1].
During infection, Fasciola hepatica modulates the host immune response characterized by the presence of regulatory dendritic cells (DC) [2,3,4,5], alternative activated macrophages [6], and an adaptive immune response characterized by Th2 and regulatory T cell (Treg)-associated cytokines [7,8,9,10]. Macrophages and DC comprise a highly heterogeneous myeloid cell population specialized in antigen presentation. DC play a crucial role in orchestrating the adaptive immune response by activating naïve T cells and inducing their differentiation into different effector T cells depending on the pathogen [11,12]. Furthermore, both macrophages and DC can promote inflammation by secreting pro-inflammatory cytokines and reactive oxygen or nitrogen species (ROS/RNS), although they can also inhibit inflammation through anti-inflammatory cytokine production [13,14,15]. Thus, they exhibit functional plasticity that enables them to adapt to various local conditions in order to restore homeostasis after inflammation [11,12,16].
Heme-oxygenase-1 (HO-1) is the inducible rate-limiting enzyme involved in the catabolism of free heme. It participates in several processes, by providing cytoprotection, protecting from heme-induced toxicity, and regulating the host inflammatory response [14,17]. In fact, HO-1 acts as a stress-responsive enzyme induced by the nuclear factor NF-E2-related factor 2 (NRF2), to provide defense against oxidative-induced injury during inflammatory processes [14]. HO-1 also limits the secretion of pro-inflammatory cytokines [18,19] and promotes anti-inflammatory cytokines [20,21], in a process triggered, at least in part, by ROS in macrophages, although its effects depend on the model of study [14]. In the same line, expression of HO-1 inhibits DC-maturation and the production of ROS [22]. In addition, HO-1 expression by DC induces the production of IL-10, an anti-inflammatory cytokine, that inhibits T-cell proliferation [23]. Additionally, IL-10-producing anti-inflammatory M2c macrophages express HO-1 [24], especially on those that express CD163, a hemoglobin scavenger receptor, that in fact mediates IL-10 production and HO-1 synthesis [25]. Therefore, HO-1 acts as a key mediator of anti-inflammatory pathways in both macrophages and DC.
Several reports demonstrate that HO-1 can have both beneficial and detrimental effects for the host immunity against different pathogens [26]. Furthermore, the antioxidant role of HO-1 in infectious diseases is still unclear, especially in helminth parasites. Interestingly, bilirubin, one of the enzymatic byproducts of HO-1, suppresses the killing of bacteria by reducing the neutrophil burst via its antioxidant activity [27]. In addition, HO-1 promotes bacteria survival inside macrophages by decreasing ROS production, as demonstrated for Salmonella typhimurium [28] and Mycobacterium abscessus [29] via its ROS-diminishing properties. Recently, we showed that the anti-inflammatory effects of HO-1 induction are detrimental in F. hepatica infection, which is dominated by a Th2/Treg differentiation profile [17]. However, the antioxidant mechanisms induced by HO-1 during F. hepatica infection have not been approached so far.
Thus, in this work, we investigated the role of ROS/RNS production by myeloid HO-1+ cells during F. hepatica experimental infection in mice, and characterized the adaptive cell immune response. Our results indicate that HO-1 expression by myeloid cells during F. hepatica infection negatively correlates with the production of ROS or RNS and the increase of antioxidant molecules. Furthermore, the pharmacological inhibition of HO-1 by a well-characterized inhibitor of HO-1 enzymatic activity, tin protoporphyrin IX (SnPP), in F. hepatica-infected mice was associated with lower levels of Tregs, in a process that was mediated by IL-10 biological activity. However, the gene expression of the NADPH oxidase subunit gp91phox was decreased when SnPP was administrated to infected mice. Moreover, parasite infection carried out in gp91phox knockout mice with inactive NADPH oxidase showed decreased levels of peritoneal HO-1+ cells, splenic Tregs, and partially protected mice from the hepatic damage induced by the parasite, revealing that a more complex molecular mechanism involving ROS production participates in the intricate pathology induced by this helminth. Altogether, these results contribute to the elucidation of the immunoregulatory and antioxidant role of HO-1 during F. hepatica infection, providing interesting molecular checkpoints that might control fasciolosis.

2. Materials and Methods

2.1. Mice

Female BALB/c mice (six- to eight-week-old) were purchased from DILAVE Laboratories (Uruguay). Gp91phox- knockout (B6.129S-Cybbtm1Din/J) mice were purchased from Jackson Laboratory (USA) and maintained at UATE, Institut Pasteur Montevideo. Six to eight BALB/c, gp91phox-, and C57BL/6 littermates (controls for gp91phox- mice) were used per experiment. Animals were kept in the animal house (URBE, School of Medicine, UdelaR, Uruguay), with water and food supplied ad libitum. Mouse handling, care, and experiments were carried out in compliance with institutional guidelines and regulations from the National Committee on Animal Research (Comisión Nacional de Experimentación Animal, CNEA, https://www.cnea.gub.uy/, accessed on 12 November 2021, National Law 18.611, Uruguay). Procedures involving animals were approved by the Universidad de la República’s Committee on Animal Research (Comisión Honoraria de Experimentación Animal, CHEA Protocol Number 07153-000817-18).

2.2. Parasite Protein Extract (FhTE)

FhTE was prepared from live adult flukes obtained from infected bovines. Flukes were washed for 1 h at 37 °C with phosphate buffered saline (PBS), pH 7.4, sonicated, and then centrifugated at 40,000× g for 60 min [4,30]. Finally, protein lysates were dialyzed against PBS. FhTE protein concentration was measured using the bicinchoninic acid assay (Sigma, St. Louis, MO, USA). In order to remove endotoxin contamination, FhTE was applied to a column containing endotoxin-removing gel (detoxi-gel, Pierce Biotechnology, Waltham, MA, USA), and endotoxin levels were quantified using the Limulus Amebocyte Lysate kit Pyrochrome (Associates of Cape Cod, East Falmouth, MA, USA) and found to be lower than 0.05 EU/mL. Furthermore, at the used concentrations, FhTE did not induce the production of pro-inflammatory cytokines such as IL-12 or IL-6 [4,30]. The concentration of F. hepatica extracts used in the in vitro experiments did not modify cell viability, as evaluated by the MTT (2-[4,5-dimethyl-2-thiazolyl]-3,5-diphenyl-2H-tetrazolium bromide) assay [4,17,30].

2.3. F. hepatica Infections

2.3.1. Parasite Infections, Animal Treatments, and Sample Obtention

The infection was achieved by orally administrating 10 F. hepatica metacercariae (Montevideo, Uruguay) per mouse. Mice were bled and peritoneal exudate cells (PECs), spleens, and livers were removed after 1, 8, 15, and 21 days post-infection (dpi), while non-infected animals were used as controls. Each experimental group contained at least four mice. PECs and hepatic leukocytes were obtained as already described [31]. Red cells were lysed with ammonium chloride potassium buffer.
HO-1 activity was inhibited using SnPP (40 mg/kg), and vehicle (PBS, 200 μL) was used as a control. The SnPP dose was within a range of doses used in previous works [32,33]. Mice received intraperitoneal injections of SnPP 1 day before infection, 1 day after infection, and every 4 days until the end of the experimental protocol (between 19 and 21 dpi). When gp91phox- and non-infected littermates were used (n = 6–8/group), infections were performed in the same conditions as previously described. In order to neutralize IL-10 receptor (IL-10R), BALB/c mice (n = 6–8/group) were intraperitoneally injected with 15 μg of monoclonal rat IgG2a anti-IL-10R (clone 1B1.3A from BioXcell, Lebanon, NH, USA) or an isotype-matched control antibody (clone HRPN from BioXcell, Lebanon, NH, USA), the day before and after infection with F. hepatica and every 3 days until animal sacrifice at 20 dpi. Blood samples were obtained, and PECs, spleens, and livers were removed. The infection severity was assessed with a defined clinical score according to the following parameters: presence or absence of peritoneal hemorrhage, presence of macroscopic liver damage and splenomegaly, and the amount of cell content in the peritoneal cavity [17], where the minimum score was 0 and the maximum was 10. The alanine aminotransferase (ALT) activity in sera was used to quantify liver damage, determined with a commercial kit (Spinreact, Girona, Spain) according to the manufacturer’s instructions.

2.3.2. Proliferation Assay and Cell Culture

Splenocytes (0.5 × 10⁶/well) from infected mice or uninfected naïve mice (control group) were cultured for 5 days at 37 °C and 5% CO2, in RPMI-1640 with 400 µg/mL of glutamine (Capricorn, Ebsdorfergrund, Germany) complete medium containing 10% heat-inactivated fetal bovine serum (FBS, Capricorn Scientific, Ebsdorfergrund, Germany), 50 mM of 2-mercaptoethanol, 100 U/mL of penicillin, and 0.1 mg/mL of streptomycin (Merk, Sigma-Aldrich, St. Louis, MO, USA) in the presence or absence of FhTE (75 µg/mL), as previously described [30]. An IFNγ-specific sandwich ELISA assay (Biolegend, San Diego, CA, USA) was used to quantify IFNγ levels in culture supernatants.
RAW264.7 macrophages were cultured at 0.5 × 10⁶/mL in complete RPMI medium in the presence or absence of the HO-1 inductor (CoPP) and inhibitor (SnPP) (50 and 100 µM, respectively) or FhTE (75 µg/mL) overnight at 37 °C. Afterwards, the ROS/RNS production was determined as described in the following section.

2.4. Flow Cytometry

Cell suspensions from PECs, livers, and spleens were washed twice with PBS containing 2% FBS and 0.1% sodium azide (FACS buffer), stained with specific antibodies for 30 min at 4 °C as previously published [31]. The following antibodies were used: anti-Sirp⍺ (P-84), -CD11c (N418), -CD86 (GL1), CD8 (53-6.7), -Siglec-F (E50-2440), -F4/80 (BM8), -CD11b (M1/70), -CD40 (HM40-3), -CD80 (16-10A1), and I-A/I-E (M5/114.15.2). Expression of FoxP3, HO-1, and IL-10 was analyzed by intracellular staining. Cells in which IL-10 was analyzed were incubated with Brefeldin-A for 6 h at 37 °C and phorbol myristate acetate (PMA, 200 nM) (Merk, Sigma-Aldrich, USA). After two washes with FACS buffer, cells were incubated with the following antibodies: anti-CD3 (17A2), -CD4 (RM4-5), -CD8 (53-6.7), or -F4/80 (BM8). After permeabilization with Cytofix and Perm wash buffers (Biolegend, USA), cells were incubated with IL-10 (JES5-1E3), FoxP3 (MF14), and HO-1 (clone ab13248 from Abcam, Waltham, MA, USA) specific antibodies. ROS/RNS produced by F4/80+ cells were determined with 2′,7′-dichlorofluorescein diacetate (DCFDA, Merk, Kenilworth, NJ, USA) probe, a fluorogenic dye that is oxidized into the fluorescent 2′,7′-dichlorofluorescein. Briefly, cells were incubated in PBS for 30 min at 37 °C with DCFDA, washed with FACS buffer, and fluorescence was measured in a flow cytometer. Analyses were performed using a BD Accuri C6 Plus cytometer and software (BD-Biosciences). Antibodies were obtained from Biolegend (USA). Analyses were performed with Accuri C6 Plus software.

2.5. Determination of Oxidative and Antioxidative Genes by qRT-PCR

Nrf2, catalase, glutathione peroxidase (gpx) 1 and 2, superoxide dismutase (sod) 1 and 2, and NADPH-oxidase subunits p47phox and gp91phox mRNA levels were detected using the Eco real-time PCR System (Illumina, San Diego, CA, USA) and Fast SYBR® Green Master Mix (Applied Biosystems, Waltham, MA, USA). ARN purification was performed with Tri-Reagent (Merk, Kenilworth, NJ, USA) of PECs obtained from BALB/c mice at 20 dpi, SnPP-treated or untreated, as previously described [17]. Standard amplification conditions were 10 min at 95 °C, 40 thermal cycles of 15 s at 95 °C, 30 s at 60 °C, and 30 s at 72 °C, with a final extension of 10 min at 72 °C. The following primers were used: nrf2-F: 5′-CAGCATGTTACGTGATGAGG-3′, nrf2-R: 5′-GCTCAGAAAAGGCTCCATCC-3′, gpx1-F: 5′- GGGACTACACCGAGATGAACGA-3′, gpx1-R: 5′-ACCATTCACTTCGCACTTCTCA-3′, gpx2-F: 5′-GAGGAACAACTACCCGGGACTA-3′, gpx2-R: 5′-ACCCCCAGGTCGGACATACT-3′, sod1-F: 5′-TGGGTTCCACGTCCATCAGTA-3′, sod1-R: 5′-ACCGTCCTT TCCAGCAGTCA-3′, sod2-F: 5′-ATTAACGCGCAGATCATGCA-3′, sod2-R: 5′-TGTCCCCCACCATTGAACTT-3′, catalase-F: 5′-GCGTCCAGTGCGCTGTAGA-3′, catalase-R: 5′-TCAGGGTGGACGTCAGTGAA-3′, p47phox-F: 5′-GAGGCGGAGGATCCGG-3′, p47phox-R: 5′-TCTTCAACAGCAGCGTACGC-3′, gp91phox-F: 5′-CCAGTGAAGATGTGTTCAGCT-3′, gp91phox-R: 5′-GCACAGCCAGTAGAAGTAGA-3′, gapdh-F: 5′-ATGACATCAAGAAGGTGGTGAAG-3′, gapdh-R: 5′-TCCTTGGAGGCCATGTAGG-3′. Results were expressed as the ratio between each gene under study and GAPDH expression. Relative gene expression levels were calculated using the 2−ΔΔCT method and normalized to GAPDH. All reactions were performed with at least five biological replicates.

2.6. Statistical Analysis

Results of the experiments were expressed as mean ± SEM. GraphPad Prism version 6.04 for Windows (GraphPad Software, San Diego, CA, USA) was used to perform statistical analyses. Results were analyzed using one-way ANOVA followed by Tukey’s test, or the two-tailed Student’s t-test, depending on the experiment. Significant differences shown by an asterisk were considered when p < 0.05.

3. Results

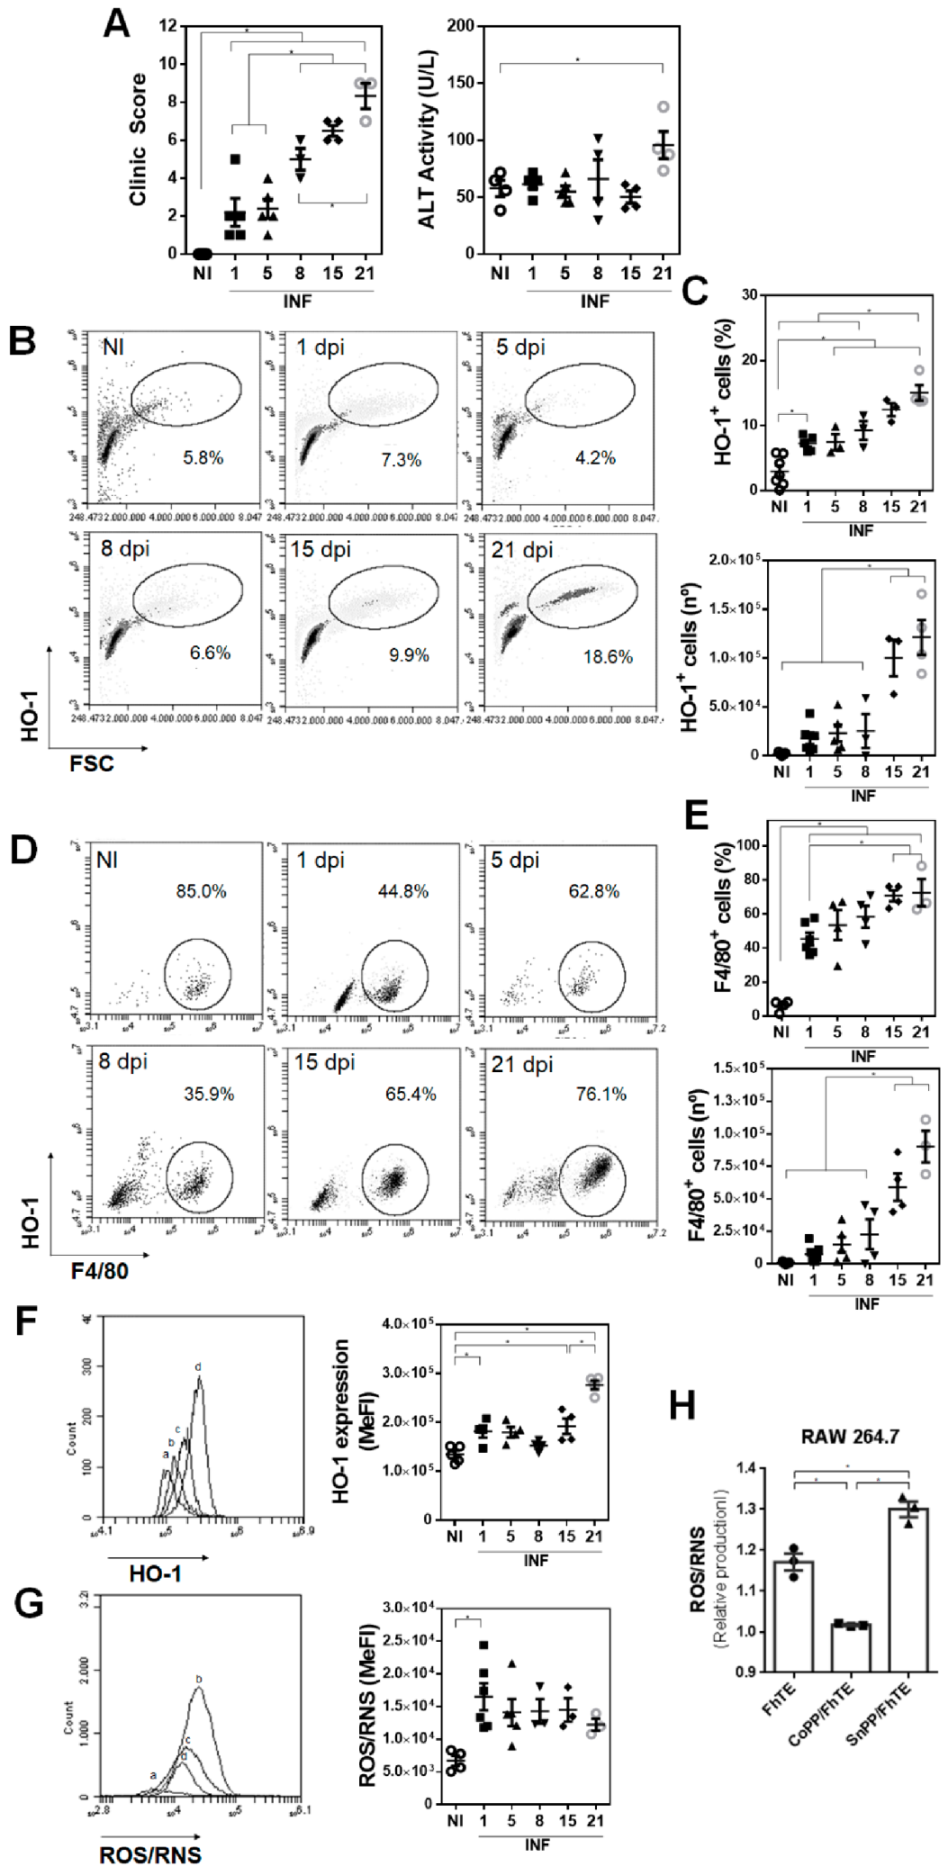
3.1. HO-1 Expression in F4/80+ Peritoneal Cells Inversely Correlate with ROS/RNS Production

In order to confirm the recruitment of PECs expressing HO-1 to the peritoneum of F. hepatica-infected mice, we identified HO-1+ cells by flow cytometry at different time points of the infection. As seen in Figure 1A, the clinical score increased upon infection, although ALT in serum significantly increased only after 21 dpi, demonstrating liver dysfunction. In addition, HO-1+ cells significantly increased in the peritoneal cavity during the infection (Figure 1B,C and Supplementary Figure S1). These cells were mainly composed by F4/80+ cells (Figure 1D,E and Supplementary Figure S1), and their increase also correlated with the advanced stages of the infection (after 15 dpi). The expression of HO-1 in F4/80+ cells slightly increased after 1 dpi, while it considerably increased during the infection (Figure 1F). On the other hand, the production of ROS/RNS was significantly increased only at 1 dpi, and decreased during infection (Figure 1G), suggesting that the expression of HO-1 in peritoneal F4/80+ cells inversely correlated with the production of ROS/RNS. In order to provide more evidence in this regard, we incubated RAW 264.7 macrophages with parasite components (FhTE) in the presence of CoPP or SnPP, and analyzed the production of ROS/RNS by these cells. FhTE slightly increased the production of ROS/RNS, while CoPP and SnPP significantly decreased and increased the production of ROS/RNS by FhTE-treated macrophages, respectively (Figure 1H). Of note, FhTE per se induced ROS/RNS expression, which could be the result of an active respiratory burst, such as that seen in F4/80+ cells from PECs of infected mice at 1 dpi (Figure 1G). Altogether, these results might indicate that F. hepatica induces the expression of HO-1 in F4/80+ cells recruited to the peritoneum, inhibiting ROS/RNS production during the course of the infection.

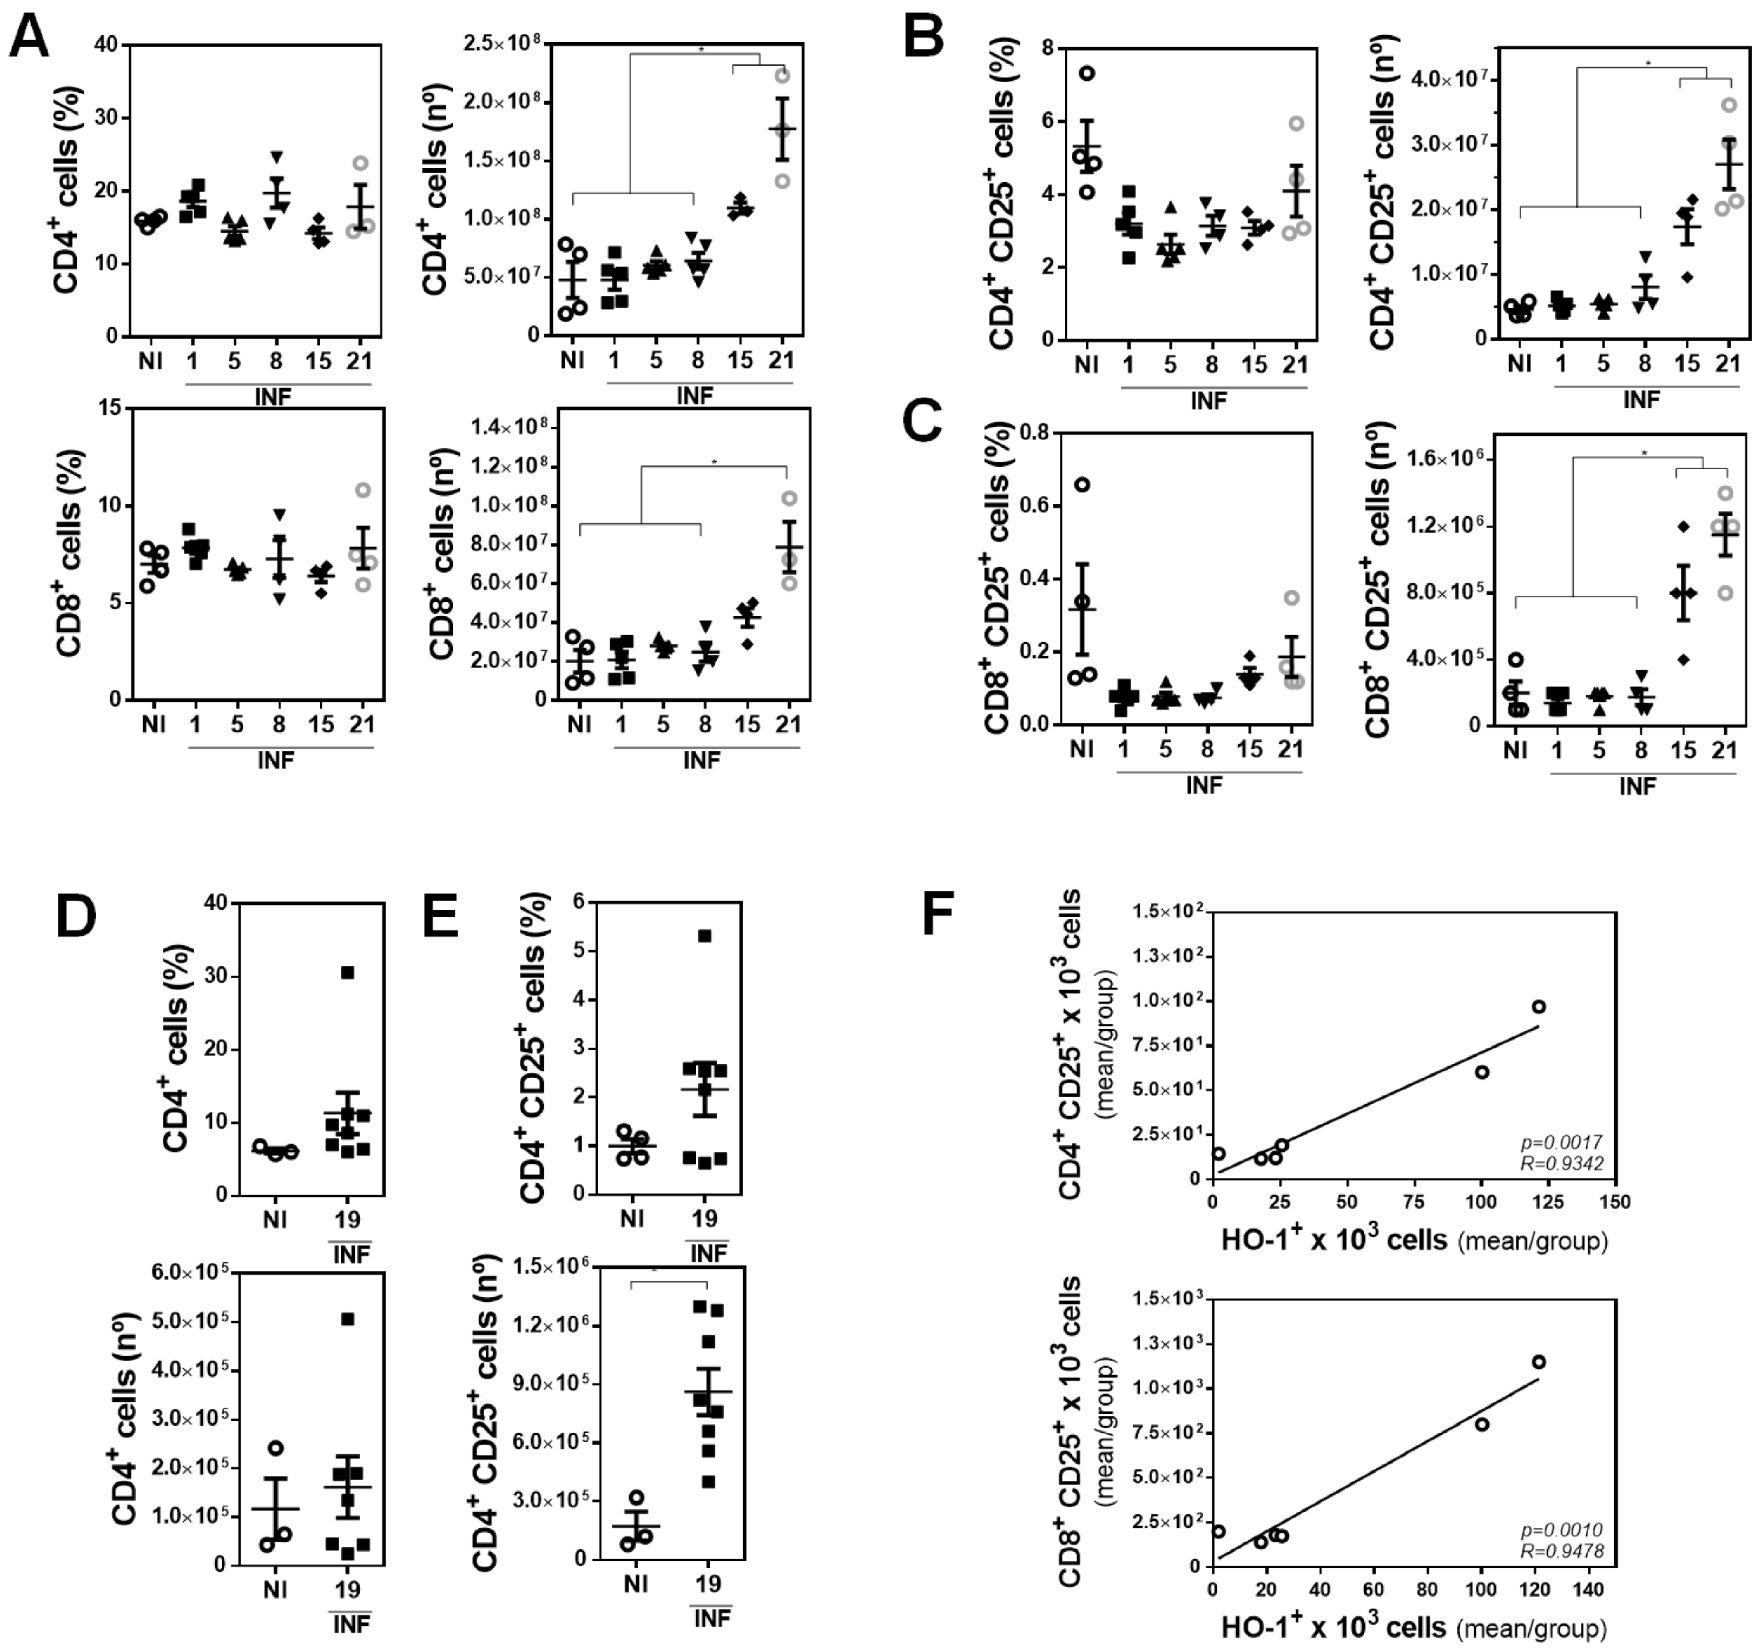
3.2. The Presence of Peritoneal HO-1+ Cells Associates with Increased Splenic CD4+ CD25+ and CD8+ CD25+ Cells during Infection

Considering that HO-1 can induce regulatory T cells [34,35,36,37], we analyzed the presence of both CD4+ and CD8+ cells in spleens of infected mice. Although we could not find any significant differences between the percentage of CD4+ and CD8+ cells during the infection, we did observe that they significantly increased in number after 15 dpi (Figure 2A and Supplementary Figure S2). We also analyzed the presence of splenic CD25+ CD4+ (Figure 2B and Supplementary Figure S2) or CD8+ (Figure 2C and Supplementary Figure S2) T cells. Again, no significant differences were found in the percentage of these cells during the infection, while their number significantly increased after 15 dpi. Finally, we analyzed the presence of CD4+ T cells in livers from infected animals and did not find any difference in their percentage nor their number (Figure 2D and Supplementary Figure S3). However, the number, but not the frequency, of hepatic CD25+ CD4+ T cells was increased in advanced infected mice (Figure 2E and Supplementary Figure S3). Further analyses demonstrated that the number of splenic CD25+ CD4+ and CD25+ CD8+cells positively correlated with the number of peritoneal HO1+ cells (Figure 2F).

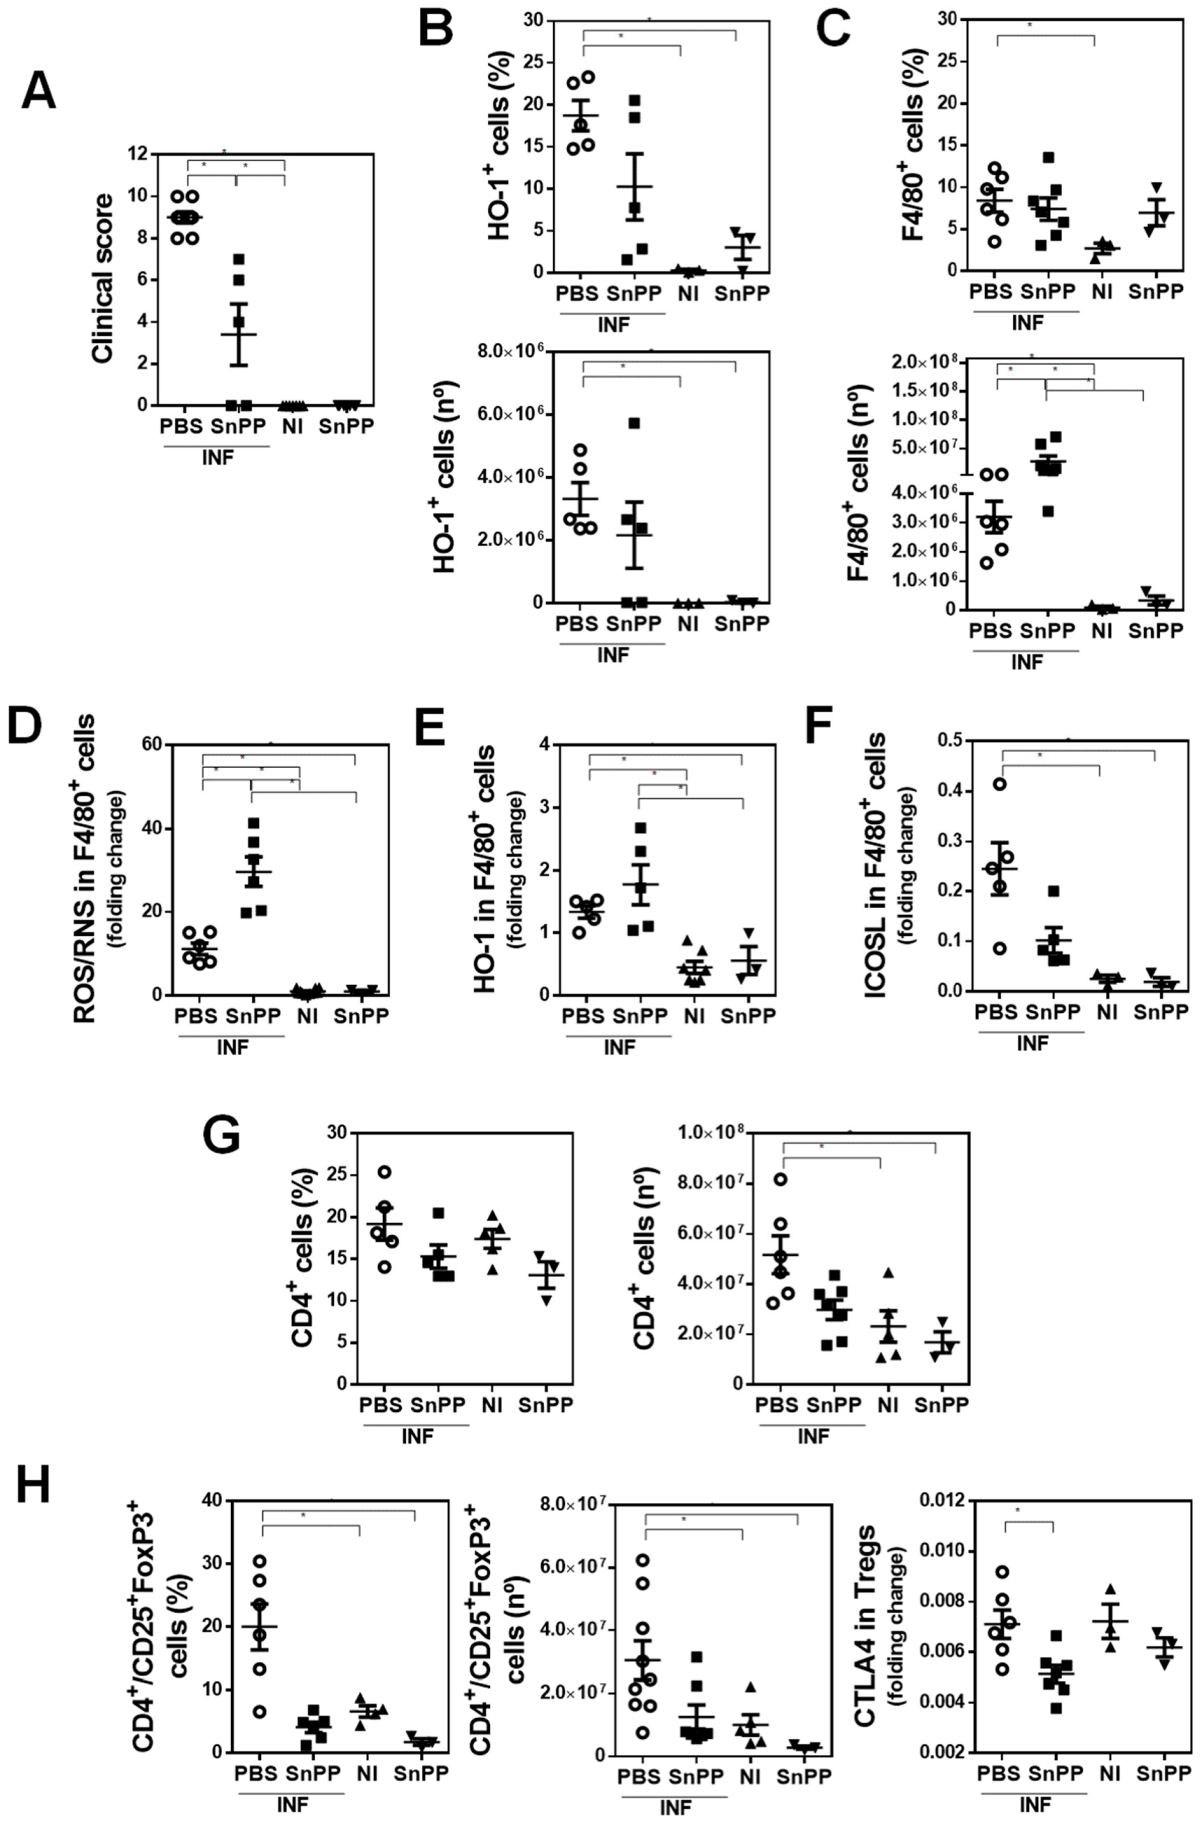
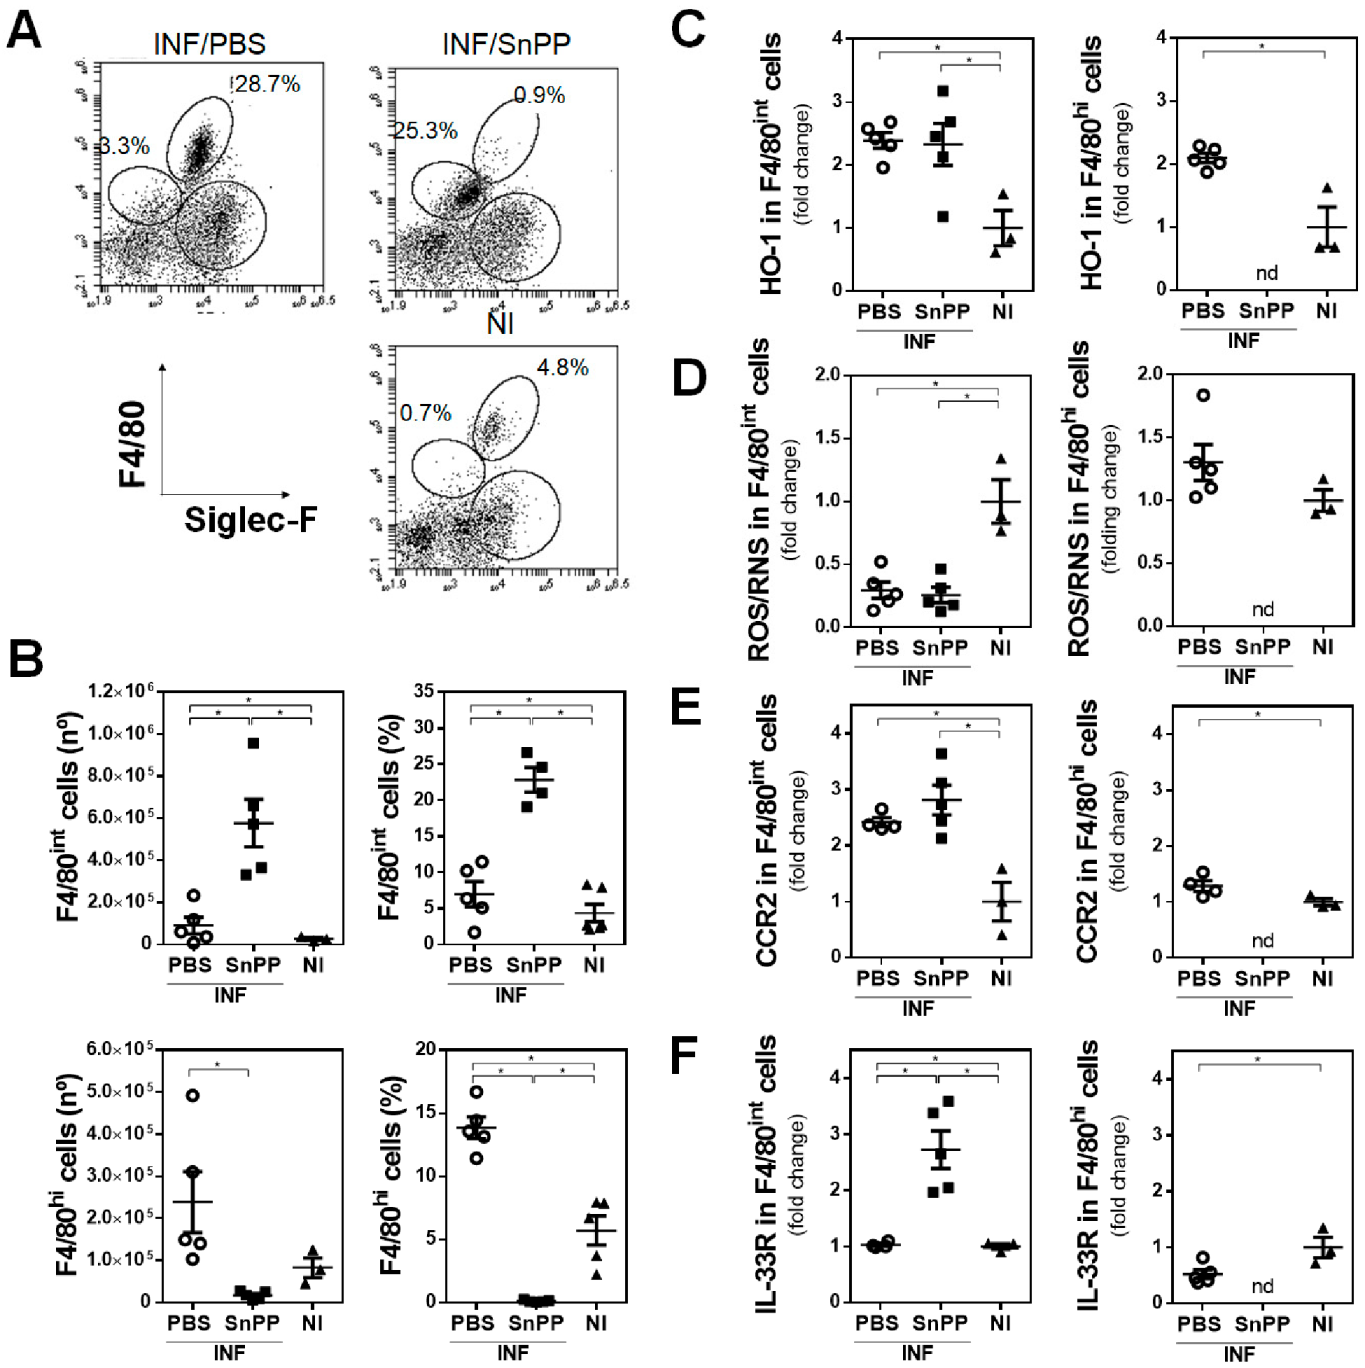
3.3. HO-1 Activity Decreases the Production of ROS/RNS by F4/80+ Cells and Correlates with an Increase of Splenic Regulatory CD4+ T Cells Induced by F. hepatica Infection

In order to evaluate whether HO-1 interferes with the production of ROS/RNS, we treated F. hepatica-infected mice with the HO-1 inhibitor SnPP. SnPP treatment was associated with a decrease in the clinical signs of infected mice (Figure 3A). In addition, SnPP treatment of infected mice abrogated the increase of HO-1+ cells, both in frequency and number, induced by the infection, since no significant difference was found in infected mice with respect to the control group with SnPP treatment (Figure 3B and Supplementary Figure S4). Surprisingly, a significant increase in F4/80+ cell number, but not frequency, was found in both SnPP-treated and non-treated infected mice (Figure 3C and Supplementary Figure S4). Indeed, the F4/80+ cell number was higher in SnPP-treated infected mice. Nevertheless, F4/80+ cells of SnPP-treated infected mice produced higher levels of ROS/RNS than control infected mice (Figure 3D), although they expressed similar levels of HO-1 (Figure 3E). Of note, the expression of ICOSL in peritoneal F4/80+ cells of infected mice was significantly reduced with SnPP treatment (Figure 3F). Lastly, SnPP treatment during F. hepatica infection did not induce an increase in the number of splenic CD4+ T cells (Figure 3G) or CD4+/CD25+ T cells (Figure 3H), although these cells expressed higher levels of CTLA4 in the absence of SnPP treatment (Figure 3H). Altogether, these results suggest that HO-1 activity inhibited by SnPP decreases the production of ROS/RNS during fasciolosis and correlates with an increase of splenic regulatory CD4+ T cells in a process that might involve ICOSL in antigen-presenting cells or CTLA4 expression in Tregs.
To complement these results, we evaluated whether the inhibition of HO-1 by SnPP treatment affected the recruitment or the phenotypical characteristics of peritoneal F4/80+ cells at the early stages of F. hepatica infection. To this end, we analyzed F4/80+ cells in the peritoneal cavity of SnPP-treated mice at 1 dpi and compared them with both non-treated infected and control mice. We observed the presence of two different cell populations according to F4/80 expression (Figure 4A and Supplementary Figure S1). SnPP treatment increased both the frequency and number of F4/80int cells, while it reduced F4/80hi cells in the peritoneal cavity of infected mice at 1 dpi (Figure 4B). Nevertheless, F4/80int cells expressed similar levels of HO-1 (Figure 4C) and ROS/RNS (Figure 4D) in F4/80int cells regardless of SnPP treatment. Interestingly, peritoneal F4/80int cells expressed higher levels of CCR2 (Figure 4E), while only those from SnPP-treated infected mice expressed significantly increased levels of IL-33R (Figure 4F), which could be related to the initiation of an early immune response against the parasite. Thus, these results suggest that the presence of F4/80int IL-33R+ cells in the peritoneum is induced by SnPP treatment, which in turn protects mice from infection.

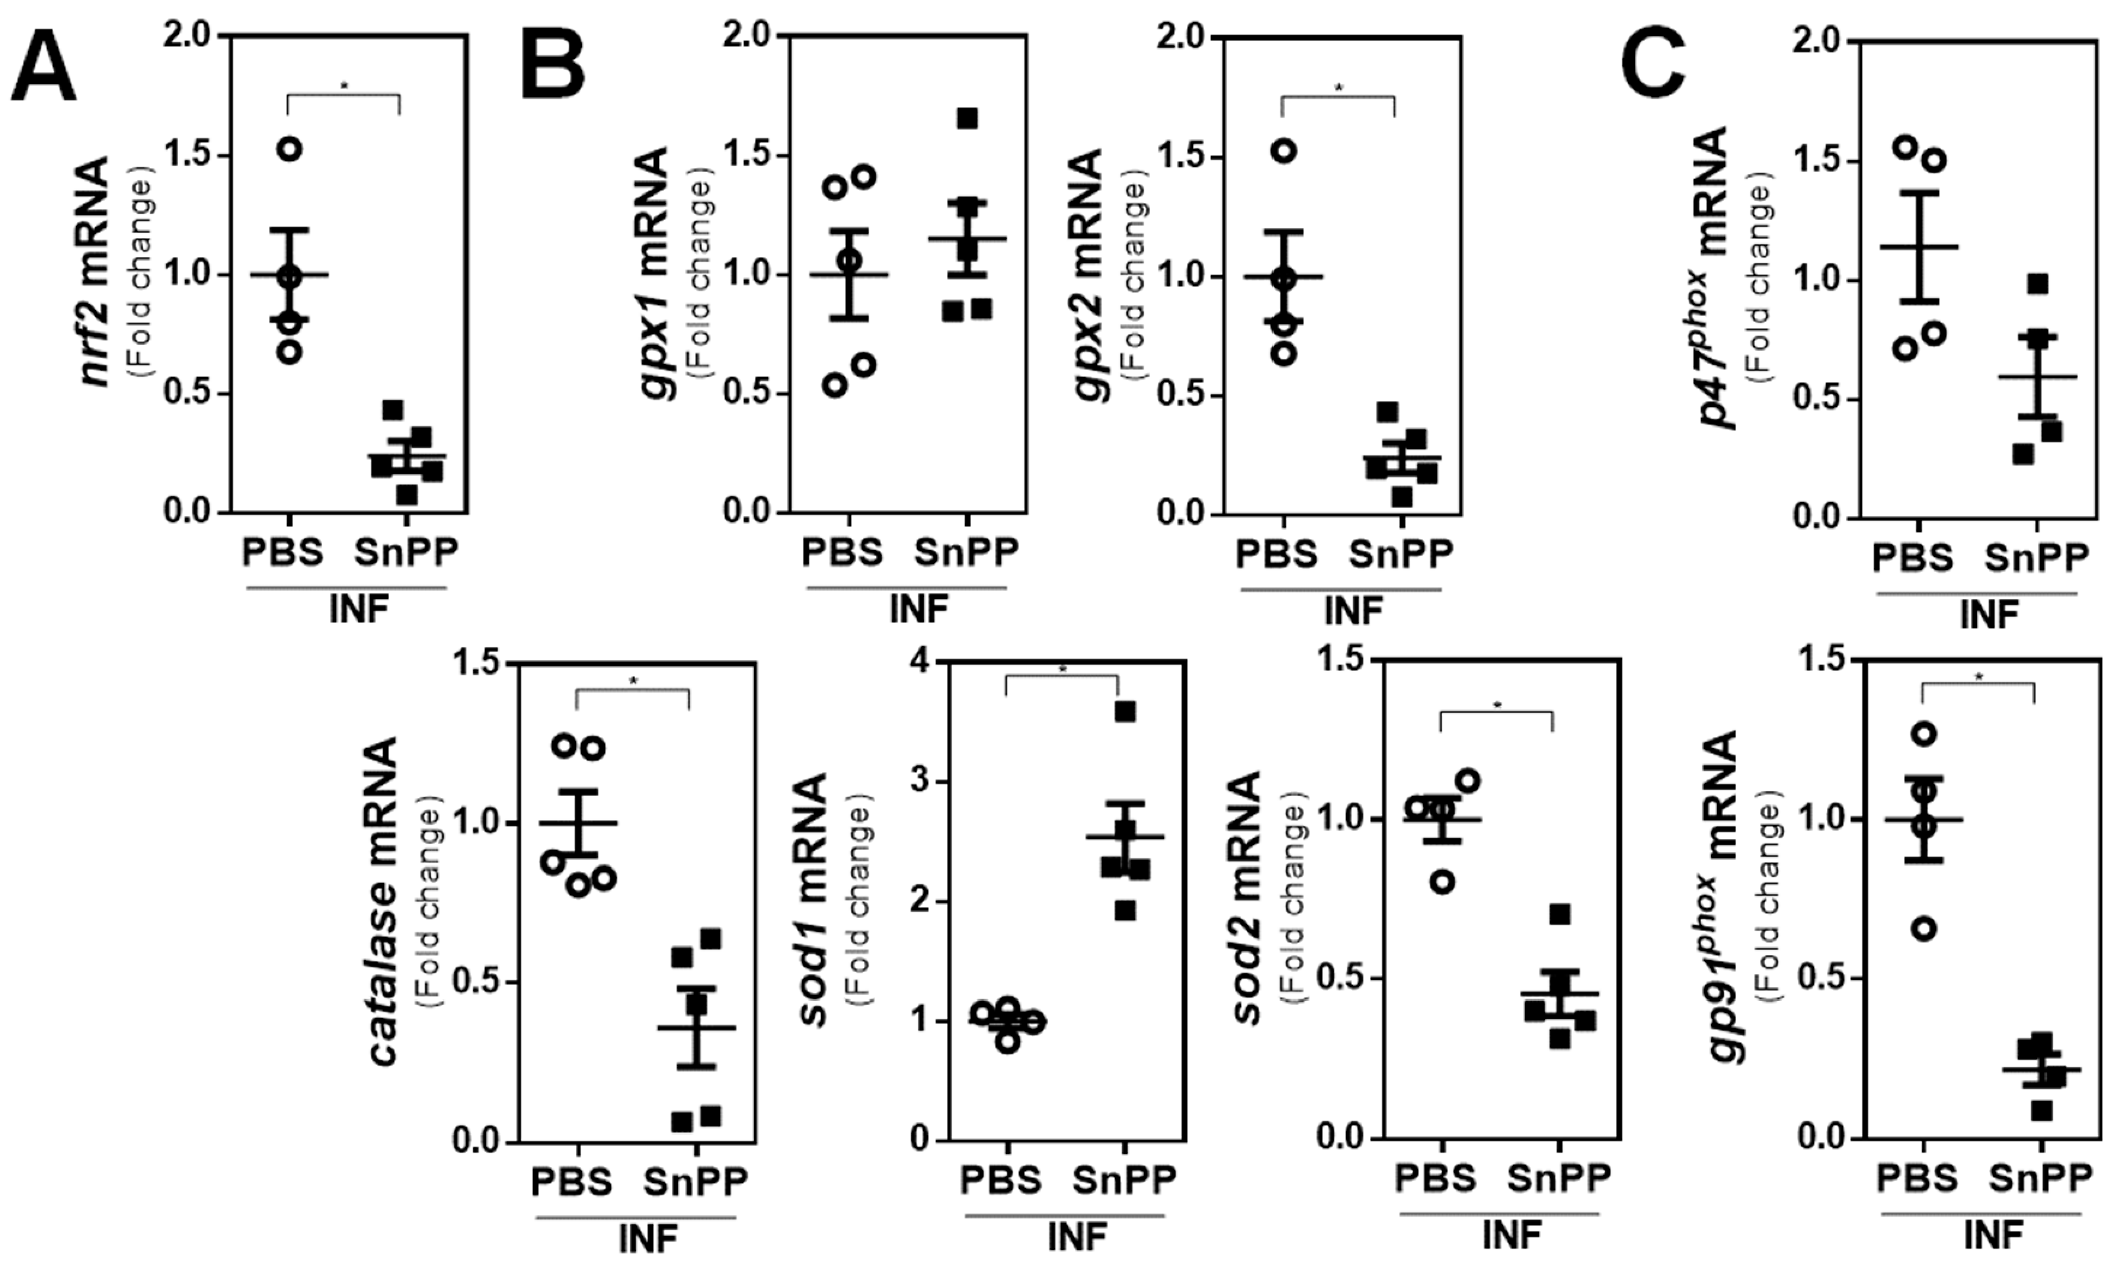
3.4. The Inhibition of HO-1 Activity by SnPP Controls the Gene Expression of Antioxidant Molecules

To deeply analyze the relationship between HO-1 expression in peritoneal cells induced by F. hepatica infection with the production of ROS/RNS, the gene expression of different molecules involved in the oxidative and antioxidative responses was evaluated. PECs of SnPP-treated infected mice were characterized by a significant decrease in the mRNA levels of the transcription factor nrf2 (Figure 5A). Moreover, the SnPP-induced decrease in nrf2 gene expression levels was associated with decreased mRNA levels in the antioxidant enzymes catalase, glutathione peroxidase 2 (gpx2), and superoxide dismutase 2 (sod2) (Figure 5B). However, no differences were found in the gene expression of gpx1, while an increase in sod1 expression was observed (Figure 5B). Finally, an unexpected decrease in the mRNA levels of the NADPH oxidase subunits gp91phox and p47phox was observed with SnPP treatment of infected mice (Figure 5C).

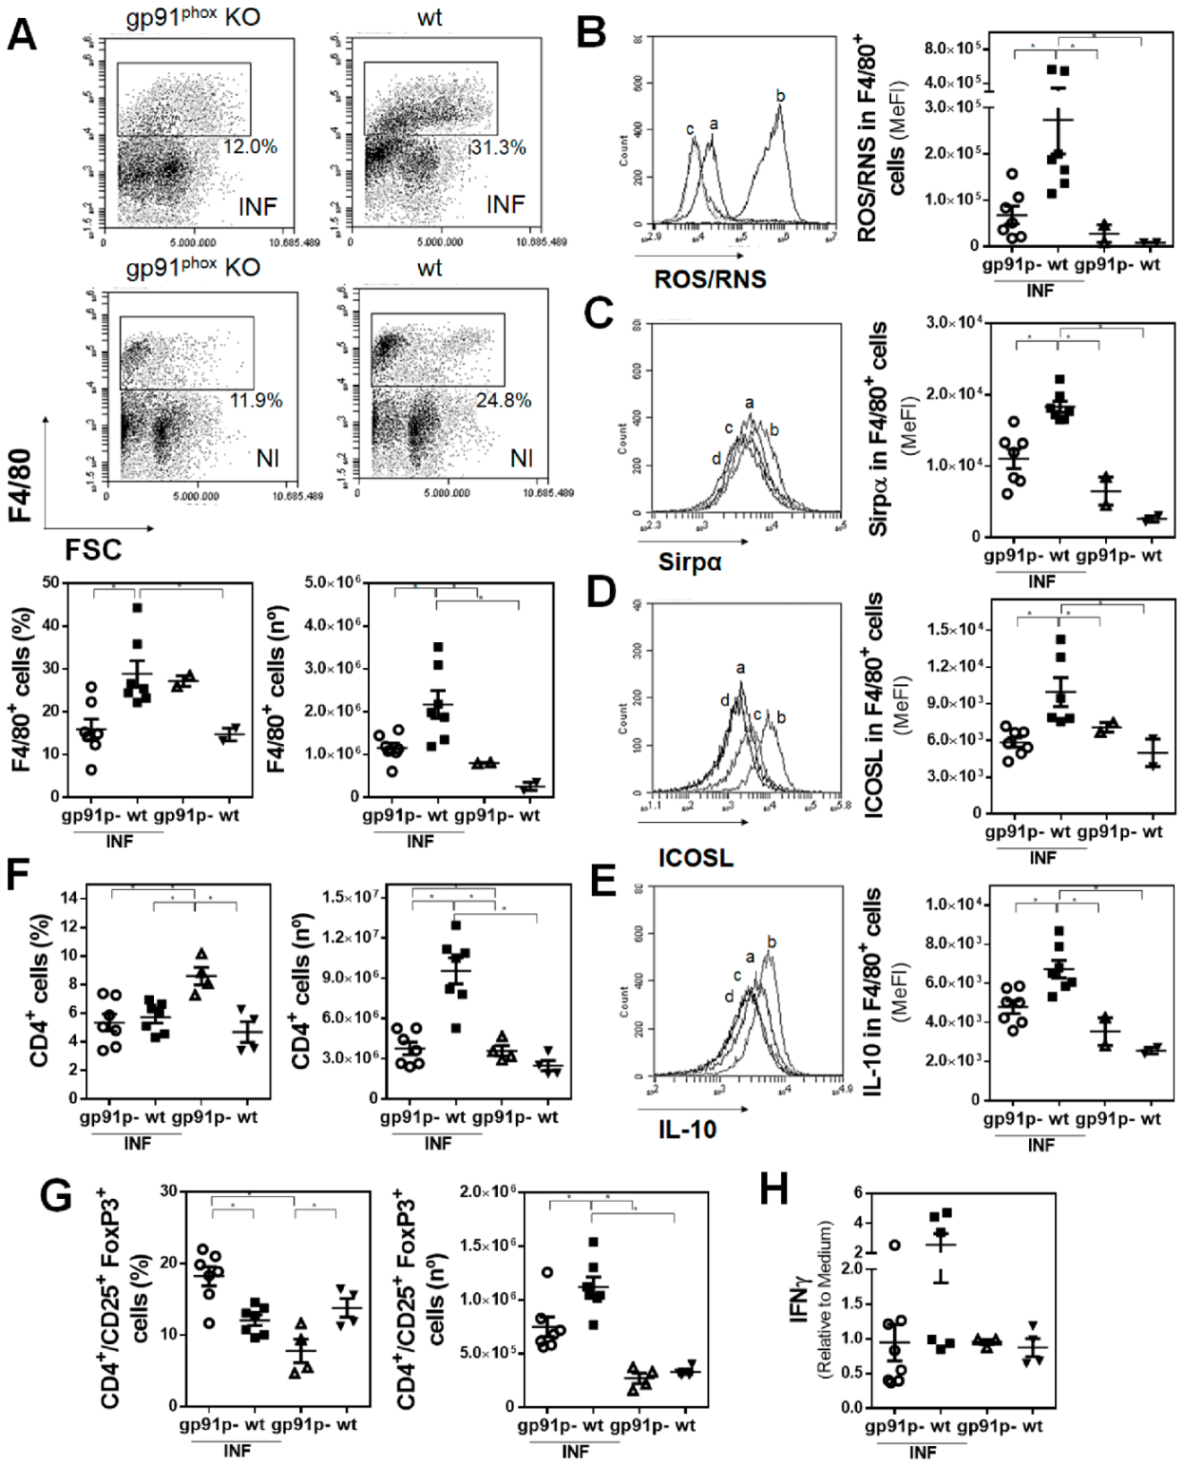
3.5. Deficiency of Functional NADPH Oxidase Partially Protects Mice from Liver Damage Induced by F. hepatica and Limits the Production of IL-10

Considering the fact that SnPP treatment protected mice from parasite infection and that reduced levels of gp91phox mRNA were found in PECs from infected mice, we analyzed the infection in gp91phox knockout mice. gp91phox deficiency reduced the clinical signs and liver damage induced by F. hepatica infection (Figure 6A and Supplementary Figure S5). This partial protection was associated with a lower increase of HO-1+ peritoneal cells, both in frequency and number (Figure 6B). Moreover, HO-1+ cells from gp91phox knockout infected mice expressed lower levels of MHCII (Figure 6C) and CD40 (Figure 6D), but not CD80 (Figure 6E), than those from wildtype mice, indicating that NADPH oxidase may play a role both in the immune response and the pathogenesis induced by F. hepatica infection. Further characterization of the peritoneal cells from these mice indicated that the increase of F4/80+ cells was abrogated in the absence of gp91phox (Figure 7A), and as expected, very low levels of ROS/RNS produced by these cells (Figure 7B). Additionally, these cells expressed lower levels of Sirpα (Figure 7C), ICOSL (Figure 7D), and IL-10 (Figure 7E). Finally, lower numbers of CD4+ (Figure 7F and Supplementary Figure S6) and CD4+/CD25+FoxP3+ Tregs (Figure 7G and Supplementary Figure S6) were found in gp91phox knockout infected mice with respect to wildtype mice. However, no significant differences in the production of IFNγ by splenocytes stimulated with parasite components (FhTE) between gp91phox knockout and wildtype infected mice were detected (Figure 7H).

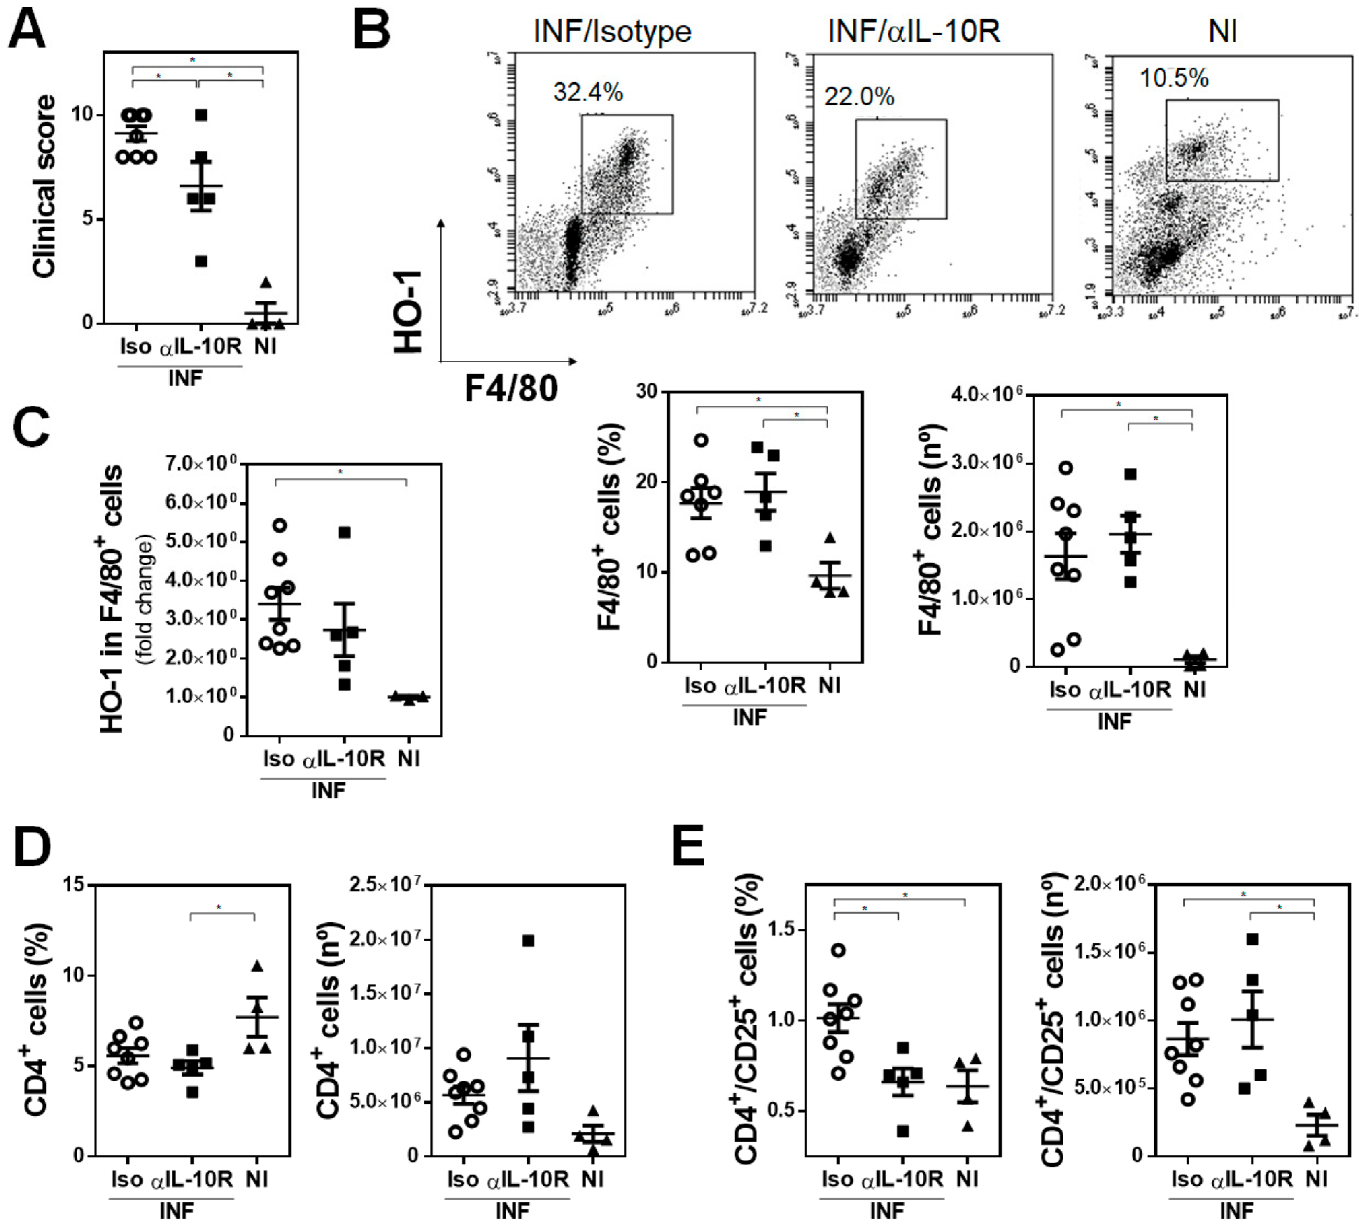
3.6. IL-10 Signaling Is Crucial for HO-1 Expression in F. hepatica-Infected Mice

Considering the fact that IL-10 induces HO-1 expression that can favor the production of IL-10, and that IL-10 is crucial for Treg differentiation [36], we analyzed whether there was a relationship between IL-10 signaling and HO-1 expression during F. hepatica infection. To this end, we treated infected mice with a neutralizing antibody of IL-10 receptor (IL-10R). The results demonstrate that IL-10R blocking reduced the clinical signs associated with parasite infection (Figure 8A). Although the recruitment of F4/80+ cells in the peritoneum of infected mice was not affected by IL-10R neutralization (Figure 8B), it abrogated the elevated expression of HO-1 induced by F. hepatica infection (Figure 8C). Interestingly, IL-10R neutralization reduced the frequency, but not the number, of CD4+ (Figure 8D and Supplementary Figure S7) and CD4+CD25+ (Figure 8E and Supplementary Figure S7) T cells in the spleens of infected animals. Altogether, these results indicate that IL-10 signaling is essential for HO-1 expression of F4/80+ cells during F. hepatica infection, likely affecting the differentiation of regulatory T cells.

4. Discussion

In this work, we have examined the cellular and molecular mechanisms that govern the expansion or differentiation of Tregs induced by HO-1+ cells in F. hepatica infection. We presented evidence showing that HO-1 activity results in decreased ROS/RNS production by F4/80+ antigen-presenting cells, thereby enhancing the pathological effects caused by F. hepatica and promoting parasite infection. Furthermore, apart from its antioxidant capacity, HO-1 has other functions, such as its immunoregulatory properties and controlling gene expression as a transcription factor [14,21,26,32,38]. Indeed, HO-1 inhibition promotes IFNγ- and NOS2-mediated control of M. tuberculosis infection in mice [39]. Furthermore, it has been previously reported that HO-1 has a role in suppressing pro-inflammatory Th1 immune responses in experimental colitis, and sickle cell alloimmunization has been reported, and it protects from atherosclerosis [40,41]. Finally, HO-1 can impair the immunity against other pathogens, such as Plasmodium yoelii [42].
Indeed, we demonstrated that during F. hepatica experimental infection in mice, there is an increase in the expression of HO-1 in F4/80+ cells in the peritoneal cavity and it inversely correlates with ROS/RNS production. Furthermore, we demonstrated an association between the expression of HO-1 and the presence of putative Tregs in the spleens of infected animals (Figure 9A). These results were also confirmed when using the HO-1 inhibitor SnPP, which inhibits its enzymatic activity. At first sight, the inhibition of HO-1 activity by SnPP would suggest that its effects are caused by the heme-catabolizing activity rather than by its expression and function as a transcription factor. Indeed, F4/80+ peritoneal cells from SnPP-treated mice did not show a decrease in HO-1 expression, although a significant increase in ROS/RNS production was detected. SnPP is a metalloporphyrin that acts as a competitive inhibitor of HO-1 both in vitro and in vivo. Its efficiency can be explained by its higher binding affinity to HO-1/2 than to heme [43,44]. However, enzymatically inactive HO-1 can still mediate protection against hydrogen peroxide-induced toxicity, probably by promoting the gene expression of antioxidant proteins [14,45], although the mechanisms underlying these effects are still unclear. Thus, the possibility that HO-1 would act as transcription factor cannot be discarded, since the nuclear localization of HO-1 in F4/80+ cells derived from F. hepatica-infected mice with or without SnPP treatment was not investigated. Furthermore, it is unlikely that the protective outcome of SnPP treatment represents a direct effect on F. hepatica, since the degree of infection and pathological effects induced by the parasite were also related to an increase in Tregs, evidencing that HO-1 activity influences the host adaptive immunity in vivo. Indeed, our results indicate that the increase of the mRNA levels of nrf2, a transcription factor responsible for the regulation of cellular redox balance and protecting antioxidant responses [46,47], is accompanied by an increase in some antioxidant enzyme genes, demonstrating that the infection, HO-1, Tregs, and the Nrf2 master regulator comprise a complex axis of antioxidant and immunoregulatory properties in F. hepatica infection. However, the function of these enzymes should be determined in order to confirm their antioxidant role during F. hepatica infection. On the other hand, heme-activated murine macrophages have functional anti-inflammatory features that are dependent on the enzymatic activity of HO-1 [38]. Thus, the immunoregulatory and immunosuppressive properties of HO-1 together with its antioxidant properties demonstrate that its function during F. hepatica infection goes far beyond heme degradation itself.
The role of ROS/RNS in helminth parasite killing is still controversial. Some reports showed that the infection by Strongyloides papillosus induced an oxidative/nitrosative stress in sheep [48], although its effect on the parasite itself has not been demonstrated. On the other hand, Schistosome infection relates to an immense oxidative stress by the host that is not sufficient to control infection [49]. Further data demonstrated that excretory/secretory factors from Mesocestoides corti inhibit ROS-induced neutrophil extracellular traps, showing that the parasite could use this mechanism to attenuate the effects induced by ROS [50]. It should be highlighted, however, that although oxidative mechanisms are induced by helminth parasite infections, their detrimental role in the parasite itself as well as in the host surroundings is not well-established yet [51,52,53]. A recent report has demonstrated a high oxidative status in serum and liver in rabbits infected with F. gigantica, together with a decline in the SOD and catalase gene expression and enzyme activity in sera from infected animals [54], which is not in agreement with data from our work in F. hepatica experimentally infected mice. However, the authors came to the conclusion that the disruption of antioxidant and detoxification cascades by F. gigantica likely leads to the pathogenic response from the host [54].
It is worth noting that in our work, we used a DCFDA fluorescent probe that does not distinguish between ROS and RNS. Therefore, these studies should be complemented with others using ROS-specific probes such as DHE or specific inhibitors of nitric oxide production (such as L-Name). In order to analyze the ROS produced by NADPH-oxidase, we used, instead, gp91phox knockout mice. Interestingly, the fact that mice that are deficient in NADPH oxidase function, with a considerable decrease in ROS production, were partially protected against F. hepatica infection, suggests that the moment when ROS is produced by NADPH oxidase might be crucial to limit F. hepatica-induced damage (Figure 9B). Indeed, an exacerbated ROS production induced by a pro-inflammatory immune response can be detrimental to leukocyte cell function or viability and induced damage to the immune system [54]. Thus, a prolonged and not regulated production of ROS by F4/80+ cells could benefit the parasite, and not the host. Of note, these cells expressed higher levels of ICOSL and IL-10 than those from gp91phox knockout mice, which could be associated with the differentiation or expansion of a higher number of splenic Tregs, which in turn express higher levels of CTLA4. Indeed, both ICOSL [55,56] and CTLA4 [57] are key mediators of Treg differentiation. In the same line, macrophages can suppress T cell responses and favor the expansion of Tregs [58]. Furthermore, ROS levels on T cell activation seem to be important, since small quantities of ROS result in antigen hypo-responsiveness, while high doses lead to oxidative stress-induced apoptosis [59]. Further analysis of the role of IL-10 produced by antigen-presenting cells in the differentiation or expansion of Tregs showed that IL-10 signaling is essential to increase HO-1 expression in peritoneal F4/80+ cells and likely the production of Tregs. Interestingly, it would seem that the parasite exploits the host defense mechanisms, on the one hand by recruiting HO-1+ cells with less antioxidative functions that produce IL-10, and on the other hand by in turn inducing the differentiation to Tregs. Nevertheless, the production of IL-10 by the host would also protect host cells in the acute pro-inflammatory immune response, caused either by damage induced by the parasite in the early state of the infection or by liver damage, at least in this experimental model. However, more experiments are needed in order to confirm these results, and to determine the role of ROS in the induction of Tregs and its relationship with IL-10.
One hypothesis that can explain these results might be the fact that ROS/RNS production is (partially) effective only during early stages of F. hepatica infection (Figure 9B). After ingestion of metacercariae by the mammalian host, juvenile flukes penetrate the host intestine wall and reach the liver through the peritoneal cavity between 4 and 6 days in livestock, although it is thought that it takes around 24 h in mice [3]. To further understand the early events that take place during F. hepatica infection in mice, we analyzed HO-1 expression and F4/80+ cell recruitment at 1 dpi, finding that two different populations expressing different levels of F4/80 are present in the peritoneum, and those elicited in SnPP-treated mice expressed higher levels of IL33R (Figure 9B). IL33 is an alarmin that participates in the type 2 innate immune response, promoting innate lymphoid cells type 2. However, during Schisotosoma infection, IL-33 seems to contribute to the development of pathology via the induction of type 2 innate lymphoid cells and alternative activation of macrophages, thus favoring the infection [60,61,62]. Therefore, the functions of IL-33 during F. hepatica infection in mice, and in particular the overexpression of its receptor in antigen-presenting cells at the early events of the infection, remain to be elucidated.
In conclusion, our work showed that HO-1 is a key molecule that favors F. hepatica infection, by which HO-1 could control ROS/RNS production and Treg differentiation and how the parasite elicits/triggers these mechanisms. Altogether, these results contribute to the elucidation of the immunoregulatory and antioxidant roles of HO-1 induced by F. hepatica in the host, providing interesting checkpoints that might control fasciolosis.

Supplementary Materials

The following are available online at https://www.mdpi.com/article/10.3390/antiox10121938/s1, Figure S1: Gates used for flow cytometry analyses of PECs from infected and control mice corresponding to Figure 1B,D and Figure 4A; Figure S2: Gates used for flow cytometry analyses of splenocytes from infected and control mice corresponding to Figure 2A–C, Figure 3G,H; Figure S3: Gates used for flow cytometry analyses of hepatic leukocytes from infected and control mice corresponding to Figure 2D,E; Figure S4: Gates used for flow cytometry analyses of splenocytes from infected and control mice corresponding to Figure 3B,C; Figure S5: Representative images of livers from gp91phox KO and C57BL/6 liitermates infected and control mice; Figure S6: Gates used for flow cytometry analyses of splenocytes from infected and control mice corresponding to Figure 7F,G; Figure S7: Gates used for flow cytometry analyses of splenocytes from IL 10R or isotype treated infected and control mice corresponding to Figure 8D,E.

Author Contributions

M.C. performed all the experiments, with the exception of the anti-IL-10R experiment, and wrote the original draft of the manuscript; V.d.C. and S.F. performed biological sample collection and flow cytometry analyses, and reviewing the manuscript; M.F.F., M.L., S.A.R.-Z. and P.L. helped with cell cultures, and performed flow cytometry analyses and interpretation; M.F.F. critically reviewed the manuscript; P.C. performed the IL-10R experiment, conceptualization, and reviewed the manuscript; T.F. performed conceptualization, experiment design and supervision, analyses of data, and writing, review, and editing of the manuscript. All authors have read and agreed to the published version of the manuscript.

Funding

This research was funded by Programa de Desarrollo de Ciencias Básicas (PEDECIBA), Agencia Nacional de Investigación e Innovación (SNI-ANII, FCE_1_2017_1_136094 and FCE_1_2019_1_156295) to Teresa Freire.

Institutional Review Board Statement

Animal experimentation was carried out according to the International Guiding Principles for Biomedical Research Involving Animals, as issued by the Council for the International Organizations of Medical Sciences. Procedures involving animals were approved by the Universidad de la República’s Committee on Animal Research (Comisión Honoraria de Experimentación Animal, CHEA Protocol Number 07153-000817-18).

Informed Consent Statement

Not applicable.

Data Availability Statement

Data is contained within the article and supplementary materials.

Acknowledgments

We are grateful to Unidad de Reactivos Biológicos de experimentación at Facultad de Medicina, UdelaR, for animal housing and care and to Ignacio Anegón for his help.

Conflicts of Interest

The authors declare no conflict of interest.

References

  1. Mas-Coma, S.; Valero, M.A.; Bargues, M.D. Fascioliasis. Adv. Exp. Med. Biol. 2019, 1154, 71–103. [Google Scholar]
  2. Cwiklinski, K.; O’Neill, S.M.; Donnelly, S.; Dalton, J.P. A prospective view of animal and human Fasciolosis. Parasite Immunol. 2016, 38, 558–568. [Google Scholar] [CrossRef] [Green Version]
  3. Moazeni, M.; Ahmadi, A. Controversial aspects of the life cycle of Fasciola hepatica. Exp. Parasitol. 2016, 169, 81–89. [Google Scholar] [CrossRef] [PubMed]
  4. Rodríguez, E.; Carasi, P.; Frigerio, S.; Da Costa, V.; van Vliet, S.; Noya, V.; Brossard, N.; Van Kooyk, Y.; García-Vallejo, J.J.; Freire, T. Fasciola hepatica Immune Regulates CD11c+ Cells by Interacting with the Macrophage Gal/GalNAc Lectin. Front. Immunol. 2017, 8, 264. [Google Scholar] [CrossRef] [PubMed] [Green Version]
  5. Dowling, D.J.; Hamilton, C.M.; Donnelly, S.; La Course, J.; Brophy, P.M.; Dalton, J.; O’Neill, S.M. Major Secretory Antigens of the Helminth Fasciola hepatica Activate a Suppressive Dendritic Cell Phenotype That Attenuates Th17 Cells but Fails to Activate Th2 Immune Responses. Infect. Immun. 2010, 78, 793–801. [Google Scholar] [CrossRef] [Green Version]
  6. Adams, P.N.; Aldridge, A.; Vukman, K.V.; Donnelly, S.; O’Neill, S.M. Fasciola hepatica tegumental antigens indirectly induce an M2 macrophage-like phenotype in vivo. Parasite Immunol. 2014, 36, 531–539. [Google Scholar] [CrossRef]
  7. Walsh, K.P.; Brady, M.T.; Finlay, C.M.; Boon, L.; Mills, K.H. Infection with a helminth parasite attenuates autoimmunity through TGF-beta-mediated suppression of Th17 and Th1 responses. J. Immunol. 2009, 183, 1577–1586. [Google Scholar] [CrossRef] [PubMed]
  8. Donnelly, S.; Stack, C.M.; O’Neill, S.M.; Sayed, A.A.; Williams, D.L.; Dalton, J.P. Helminth 2-Cys peroxiredoxin drives Th2 responses through a mechanism involving alternatively activated macrophages. FASEB J. 2008, 22, 4022–4032. [Google Scholar] [CrossRef] [Green Version]
  9. Flynn, R.J.; Mannion, C.; Golden, O.; Hacariz, O.; Mulcahy, G. Experimental Fasciola hepatica Infection Alters Responses to Tests Used for Diagnosis of Bovine Tuberculosis. Infect. Immun. 2007, 75, 1373–1381. [Google Scholar] [CrossRef] [Green Version]
  10. O’Neill, S.M.; Brady, M.T.; Callanan, J.; Mulcahy, G.; Joyce, P.; Mills, K.; Dalton, J.P. Fasciola hepatica infection downregulates Th1 responses in mice. Parasite Immunol. 2000, 22, 147–155. [Google Scholar] [CrossRef]
  11. Joardar, N.; Mondal, C.; Babu, S.P.S. A review on the interactions between dendritic cells, filarial parasite and parasite-derived molecules in regulating the host immune responses. Scand J. Immunol. 2021, 93, e13001. [Google Scholar] [CrossRef] [PubMed]
  12. Zanna, M.; Yasmin, A.; Omar, A.; Arshad, S.; Mariatulqabtiah, A.; Nur-Fazila, S.; Mahiza, I.N. Review of Dendritic Cells, Their Role in Clinical Immunology, and Distribution in Various Animal Species. Int. J. Mol. Sci. 2021, 22, 8044. [Google Scholar] [CrossRef]
  13. Gordon, S.; Plüddemann, A. Tissue macrophages: Heterogeneity and functions. BMC Biol. 2017, 15, 1–18. [Google Scholar] [CrossRef] [PubMed]
  14. Vijayan, V.; Wagener, F.A.; Immenschuh, S. The macrophage heme-heme oxygenase-1 system and its role in inflammation. Biochem. Pharmacol. 2018, 153, 159–167. [Google Scholar] [CrossRef] [PubMed]
  15. Davies, L.C.; Jenkins, S.J.; Allen, J.E.; Taylor, P.R. Tissue-resident macrophages. Nat. Immunol. 2013, 14, 986–995. [Google Scholar] [CrossRef]
  16. Jenkins, S.J.; Allen, J.E. The expanding world of tissue-resident macrophages. Eur. J. Immunol. 2021, 51, 1882–1896. [Google Scholar] [CrossRef]
  17. Carasi, P.; Rodríguez, E.; Da Costa, V.; Frigerio, S.; Brossard, N.; Noya, V.; Robello, C.; Anegón, I.; Freire, T. Heme-Oxygenase-1 Expression Contributes to the Immunoregulation Induced by Fasciola hepatica and Promotes Infection. Front. Immunol. 2017, 8, 883. [Google Scholar] [CrossRef] [Green Version]
  18. Greil, J.; Verga-Falzacappa, M.V.; Echner, N.E.; Behnisch, W.; Bandapalli, O.R.; Pechanska, P.; Immenschuh, S.; Vijayan, V.; Balla, J.; Tsukahara, H.; et al. Mutating heme oxygenase-1 into a peroxidase causes a defect in bilirubin synthesis associated with microcytic anemia and severe hyperinflammation. Haematologica 2016, 101, e436–e439. [Google Scholar] [CrossRef] [Green Version]
  19. Tzima, S.; Victoratos, P.; Kranidioti, K.; Alexiou, M.; Kollias, G. Myeloid heme oxygenase–1 regulates innate immunity and autoimmunity by modulating IFN-β production. J. Exp. Med. 2009, 206, 1167–1179. [Google Scholar] [CrossRef]
  20. Hull, T.; Agarwal, A.; George, J.F. The Mononuclear Phagocyte System in Homeostasis and Disease: A Role for Heme Oxygenase-1. Antioxid. Redox Signal 2014, 20, 1770–1788. [Google Scholar] [CrossRef] [Green Version]
  21. Lee, T.-S.; Chau, L.-Y. Heme oxygenase-1 mediates the anti-inflammatory effect of interleukin-10 in mice. Nat. Med. 2002, 8, 240–246. [Google Scholar] [CrossRef]
  22. Kutty, R.K.; Maines, M.D. Purification and characterization of biliverdin reductase from rat liver. J. Biol. Chem. 1981, 256, 3956–3962. [Google Scholar] [CrossRef]
  23. Chauveau, C.; Rémy, S.; Royer, P.J.; Hill, M.; Tanguy-Royer, S.; Hubert, F.-X.; Tesson, L.; Brion, R.; Beriou, G.; Grégoire, M.; et al. Heme oxygenase-1 expression inhibits dendritic cell maturation and proinflammatory function but conserves IL-10 expression. Blood 2005, 106, 1694–1702. [Google Scholar] [CrossRef] [Green Version]
  24. Sierra-Filardi, E.; Vega, M.A.; Sánchez-Mateos, P.; Corbí, A.L.; Puig-Kröger, A. Heme Oxygenase-1 expression in M-CSF-polarized M2 macrophages contributes to LPS-induced IL-10 release. Immunobiology 2010, 215, 788–795. [Google Scholar] [CrossRef]
  25. Philippidis, P.; Mason, J.C.; Evans, B.J.; Nadra, I.; Taylor, K.M.; Haskard, D.O.; Landis, R.C. Hemoglobin scavenger receptor CD163 mediates interleukin-10 release and heme oxygenase-1 synthesis: Antiinflammatory monocyte-macrophage responses in vitro, in resolving skin blisters in vivo, and after cardiopulmonary bypass surgery. Circ. Res. 2004, 94, 119–126. [Google Scholar] [CrossRef] [Green Version]
  26. Chung, S.W.; Hall, S.R.; Perrella, M.A. Role of haem oxygenase-1 in microbial host defence. Cell. Microbiol. 2009, 11, 199–207. [Google Scholar] [CrossRef] [Green Version]
  27. Arai, T.; Yoshikai, Y.; Kamiya, J.; Nagino, M.; Uesaka, K.; Yuasa, N.; Oda, K.; Sano, T.; Nimura, Y. Bilirubin Impairs Bactericidal Activity of Neutrophils through an Antioxidant Mechanism in Vitro. J. Surg. Res. 2001, 96, 107–113. [Google Scholar] [CrossRef] [PubMed]
  28. Mitterstiller, A.-M.; Haschka, D.; Dichtl, S.; Nairz, M.; Demetz, E.; Talasz, H.; Soares, M.; Einwallner, E.; Esterbauer, H.; Fang, F.C.; et al. Heme oxygenase 1 controls early innate immune response of macrophages toSalmonellaTyphimurium infection. Cell. Microbiol. 2016, 18, 1374–1389. [Google Scholar] [CrossRef] [PubMed] [Green Version]
  29. Abdalla, M.Y.; Ahmad, I.; Switzer, B.; Britigan, B.E. Induction of heme oxygenase-1 contributes to survival of Mycobacterium abscessus in human macrophages-like THP-1 cells. Redox Biol. 2015, 4, 328–339. [Google Scholar] [CrossRef] [PubMed] [Green Version]
  30. Rodriguez, E.; Noya, V.; Cervi, L.; Chiribao, M.L.; Brossard, N.; Chiale, C.; Carmona, C.; Giacomini, C.; Freire, T. Glycans from Fasciola hepatica Modulate the Host Immune Response and TLR-Induced Maturation of Dendritic Cells. PLOS Negl. Trop. Dis. 2015, 9, e0004234. [Google Scholar] [CrossRef]
  31. Frigerio, S.; Da Costa, V.; Costa, M.; Festari, M.F.; Landeira, M.; Rodríguez-Zraquia, S.A.; Härtel, S.; Toledo, J.; Freire, T. Eosinophils Control Liver Damage by Modulating Immune Responses Against Fasciola hepatica. Front. Immunol. 2020, 11, 2276. [Google Scholar] [CrossRef]
  32. Paul, G.; Bataille, F.; Obermeier, F.; Bock, J.; Klebl, F.; Strauch, U.; Lochbaum, D.; Rummele, P.; Farkas, S.; Scholmerich, J.; et al. Analysis of intestinal haem-oxygenase-1 (HO-1) in clinical and experimental colitis. Clin. Exp. Immunol. 2005, 140, 547–555. [Google Scholar] [CrossRef]
  33. Sardana, M.K.; Kappas, A. Dual control mechanism for heme oxygenase: Tin(IV)-protoporphyrin potently inhibits enzyme activity while markedly increasing content of enzyme protein in liver. Proc. Natl. Acad. Sci. USA 1987, 84, 2464–2468. [Google Scholar] [CrossRef] [Green Version]
  34. Van Nguyen, T.; Piao, C.H.; Fan, Y.J.; Shin, D.U.; Kim, S.Y.; Song, H.J.; Song, C.H.; Shin, H.S.; Chai, O.H. Anti-allergic rhinitis activity of alpha-lipoic acid via balancing Th17/Treg expression and enhancing Nrf2/HO-1 pathway signaling. Sci. Rep. 2020, 10, 12528. [Google Scholar] [CrossRef]
  35. Yan, S.C.; Wang, Y.J.; Li, Y.J.; Cai, W.Y.; Weng, X.G.; Li, Q.; Chen, Y.; Yang, Q.; Zhu, X.X. Dihydroartemisinin Regulates the Th/Treg Balance by Inducing Activated CD4+ T cell Apoptosis via Heme Oxygenase-1 Induction in Mouse Models of Inflammatory Bowel Disease. Molecules 2019, 24, 2475. [Google Scholar] [CrossRef] [PubMed] [Green Version]
  36. Zhang, Q.; Cui, T.; Chang, Y.; Zhang, W.; Li, S.; He, Y.; Li, B.; Liu, L.; Wang, G.; Gao, T.; et al. HO-1 regulates the function of Treg: Association with the immune intolerance in vitiligo. J. Cell. Mol. Med. 2018, 22, 4335–4343. [Google Scholar] [CrossRef] [PubMed]
  37. Yoon, S.-J.; Kim, S.-J.; Lee, S.-M. Overexpression of HO-1 Contributes to Sepsis-Induced Immunosuppression by Modulating the Th1/Th2 Balance and Regulatory T-Cell Function. J. Infect. Dis. 2017, 215, 1608–1618. [Google Scholar] [CrossRef]
  38. Hualin, C.; Wenli, X.; Dapeng, L.; Xijing, L.; Xiuhua, P.; Qingfeng, P. The Anti-inflammatory Mechanism of Heme Oxygenase-1 Induced by Hemin in Primary Rat Alveolar Macrophages. Inflammation 2011, 35, 1087–1093. [Google Scholar] [CrossRef] [PubMed]
  39. Costa, D.L.; Amaral, E.P.; Namasivayam, S.; Mittereder, L.R.; Fisher, L.; Bonfim, C.C.; Sardinha-Silva, A.; Thompson, R.W.; Hieny, S.E.; Andrade, B.B.; et al. Heme oxygenase-1 inhibition promotes IFNγ-and NOS2-mediated control of Mycobacterium tuberculosis infection. Mucosal Immunol. 2021, 14, 253–266. [Google Scholar] [CrossRef]
  40. Takagi, T.; Naito, Y.; Mizushima, K.; Hirai, Y.; Harusato, A.; Okayama, T.; Katada, K.; Kamada, K.; Uchiyama, K.; Handa, O.; et al. Heme oxygenase-1 prevents murine intestinal inflammation. J. Clin. Biochem. Nutr. 2018, 63, 169–174. [Google Scholar] [CrossRef] [Green Version]
  41. Zhong, H.; Bao, W.; Friedman, D.; Yazdanbakhsh, K. Hemin Controls T Cell Polarization in Sickle Cell Alloimmunization. J. Immunol. 2014, 193, 102–110. [Google Scholar] [CrossRef]
  42. Harding, C.L.; Villarino, N.F.; Valente, E.; Schwarzer, E.; Schmidt, N.W. Plasmodium Impairs Antibacterial Innate Immunity to Systemic Infections in Part Through Hemozoin-Bound Bioactive Molecules. Front. Cell. Infect. Microbiol. 2020, 10, 328. [Google Scholar] [CrossRef] [PubMed]
  43. Schulz, S.; Wong, R.J.; Vreman, H.J.; Stevenson, D.K. Metalloporphyrins—An update. Front Pharmacol. 2012, 3, 68. [Google Scholar] [CrossRef] [PubMed] [Green Version]
  44. Fernández-Fierro, A.; Funes, S.C.; Rios, M.; Covián, C.; González, J.; Kalergis, A.M. Immune Modulation by Inhibitors of the HO System. Int. J. Mol. Sci. 2020, 22, 294. [Google Scholar] [CrossRef]
  45. Hori, R.; Kashiba, M.; Toma, T.; Yachie, A.; Goda, N.; Makino, N.; Soejima, A.; Nagasawa, T.; Nakabayashi, K.; Suematsu, M. Gene Transfection of H25A Mutant Heme Oxygenase-1 Protects Cells against Hydroperoxide-induced Cytotoxicity. J. Biol. Chem. 2002, 277, 10712–10718. [Google Scholar] [CrossRef] [PubMed] [Green Version]
  46. Loboda, A.; Damulewicz, M.; Pyza, E.; Jozkowicz, A.; Dulak, J. Role of Nrf2/HO-1 system in development, oxidative stress response and diseases: An evolutionarily conserved mechanism. Cell. Mol. Life Sci. 2016, 73, 3221–3247. [Google Scholar] [CrossRef] [PubMed] [Green Version]
  47. Pibiri, M.; Leoni, V.P.; Atzori, L. Heme oxygenase-1 inhibitor tin-protoporphyrin improves liver regeneration after partial hepatectomy. Life Sci. 2018, 204, 9–14. [Google Scholar] [CrossRef]
  48. Dimitrijević, B.; Borozan, S.; Katić-Radivojević, S.; Stojanovic, S. Effects of infection intensity with Strongyloides papillosus and albendazole treatment on development of oxidative/nitrosative stress in sheep. Veter. Parasitol. 2012, 186, 364–375. [Google Scholar] [CrossRef]
  49. Masamba, P.; Kappo, A. Immunological and Biochemical Interplay between Cytokines, Oxidative Stress and Schistosomiasis. Int. J. Mol. Sci. 2021, 22, 7216. [Google Scholar] [CrossRef]
  50. Chauhan, A.; Sharma, A.; Tripathi, J.K.; Sun, Y.; Sukumran, P.; Singh, B.B.; Mishra, B.B.; Sharma, J. Helminth derived factors inhibit neutrophil extracellular trap formation and inflammation in bacterial peritonitis. Sci. Rep. 2021, 11, 1–9. [Google Scholar] [CrossRef]
  51. de Oliveira, R.B.; Senger, M.R.; Vasques, L.M.; Gasparotto, J.; dos Santos, J.P.A.; Pasquali, M.A.; Moreira, J.C.; Silva, F.P., Jr.; Gelain, D.P. Schistosoma mansoni infection causes oxidative stress and alters receptor for advanced glycation endproduct (RAGE) and tau levels in multiple organs in mice. Int. J. Parasitol. 2013, 43, 371–379. [Google Scholar] [CrossRef]
  52. Derda, M.; Wandurska-Nowak, E.; Hadaś, E. Changes in the level of antioxidants in the blood from mice infected with Trichinella spiralis. Parasitol. Res. 2004, 93, 207–210. [Google Scholar] [CrossRef]
  53. Sánchez-Campos, S.; Tuñón, M.J.; González, P.; González-Gallego, J. Oxidative stress and changes in liver antioxidant enzymes induced by experimental dicroceliosis in hamsters. Parasitol. Res. 1999, 85, 468–474. [Google Scholar] [CrossRef] [PubMed]
  54. Rehman, A.; Rehman, L.; Ullah, R.; Beg, M.A.; Khan, M.H.; Abidi, S. Oxidative status and changes in the adenosine deaminase activity in experimental host infected with tropical liver fluke, Fasciola gigantica. Acta Trop. 2020, 213, 105753. [Google Scholar] [CrossRef]
  55. Li, D.-Y.; Xiong, X.-Z. ICOS+ Tregs: A Functional Subset of Tregs in Immune Diseases. Front. Immunol. 2020, 11, 2104. [Google Scholar] [CrossRef] [PubMed]
  56. Li, D.-Y.; Xiong, X.-Z. Corrigendum: ICOS+ Tregs: A Functional Subset of Tregs in Immune Diseases. Front. Immunol. 2021, 12, 701515. [Google Scholar] [CrossRef]
  57. Sobhani, N.; Tardiel-Cyril, D.; Davtyan, A.; Generali, D.; Roudi, R.; Li, Y. CTLA-4 in Regulatory T Cells for Cancer Immunotherapy. Cancers 2021, 13, 1440. [Google Scholar] [CrossRef] [PubMed]
  58. Kraaij, M.D.; van der Kooij, S.W.; Reinders, M.; Koekkoek, K.; Rabelink, T.; van Kooten, C.; Gelderman, K.A. Dexamethasone increases ROS production and T cell suppressive capacity by anti-inflammatory macrophages. Mol. Immunol. 2011, 49, 549–557. [Google Scholar] [CrossRef] [PubMed]
  59. Devadas, S.; Zaritskaya, L.; Rhee, S.G.; Oberley, L.; Williams, M.S. Discrete generation of superoxide and hydrogen peroxide by T cell receptor stimulation: Selective regulation of mitogen-activated protein kinase activation and fas ligand expression. J. Exp. Med. 2002, 195, 59–70. [Google Scholar] [CrossRef] [Green Version]
  60. Yu, Y.; Deng, W.; Lei, J. Interleukin-33 promotes Th2 immune responses in infected mice with Schistosoma japonicum. Parasitol. Res. 2015, 114, 2911–2918. [Google Scholar] [CrossRef]
  61. Peng, H.; Zhang, Q.; Li, X.; Liu, Z.; Shen, J.; Sun, R.; Wei, J.; Zhao, J.; Wu, X.; Feng, F.; et al. IL-33 Contributes to Schistosoma japonicum-induced Hepatic Pathology through Induction of M2 Macrophages. Sci. Rep. 2016, 6, 29844. [Google Scholar] [CrossRef] [PubMed]
  62. Mchedlidze, T.; Waldner, M.; Zopf, S.; Walker, J.; Rankin, A.L.; Schuchmann, M.; Voehringer, D.; McKenzie, A.N.; Neurath, M.F.; Pflanz, S.; et al. Interleukin-33-Dependent Innate Lymphoid Cells Mediate Hepatic Fibrosis. Immunity 2013, 39, 357–371. [Google Scholar] [CrossRef] [PubMed] [Green Version]
Figure 1. HO-1 expression in F4/80+ peritoneal cells inversely correlates with ROS/RNS production. Mice (n = 4–6) were infected with 10 metacercariae and sacrificed at 1, 8, 15, and 21 dpi. Non-infected mice were used as control (NI). (A) Clinical signs including hemorrhage, splenomegaly, and macroscopic liver damage were assessed to evaluate the severity of the disease [17]. ALT activity in sera was used as a marker of liver damage. (B) Analysis by flow cytometry of HO-1+ cells in PEC from infected and control (NI) mice. (C) Frequency and cell number of HO-1+ cells in the peritoneal cavity of infected and control (NI) animals by flow cytometry. (D) Analysis by flow cytometry of F4/80+ HO-1+ cells in PEC from infected and control (NI) mice. (E) Frequency and cell number of F4/80+ in the peritoneal cavity of infected and control (NI) animals by flow cytometry. (F) HO-1 expression in F4/80+ in the peritoneal cavity of infected and control (NI) mice. Letters on histograms correspond as follows: a: NI, b: 1 dpi, c: 15 dpi, d: 21 dpi. Median fluorescence intensity is shown (MeFI) in the plot. (G) ROS/RNS quantification in F4/80+ in the peritoneal cavity of infected and control (NI) mice using the DCFDA probe by flow cytometry. Letters on histograms correspond as follows: a: NI, b: 1 dpi, c: 15 dpi, d: 21 dpi. Median fluorescence intensity is shown (MeFI) in the plot. (H) Murine RAW264.7 macrophages were cultured in the presence of 75 µg/mL of FhTE or CoPP (100 µM/mL) and SnPP (50 µM/mL) overnight at 37 °C. Then, cells were collected and incubated for 30 min at 37 °C in PBS with the DCFDA probe and analyzed by flow cytometry. The RNS/ROS levels are shown as the ratio between FhTE/medium (FhTE), CoPP + FhTE/CoPP (CoPP/FhTE), and SnPP + FhTE/SnPP (SnPP/FhTE). Representative experiments are shown. Asterisks indicate significant differences with p < 0.05, performed by one-way ANOVA followed by Tukey’s test with multiple comparisons.
Antioxidants 10 01938 g001
Figure 2. Peritoneal HO-1+ cells correlate with increased splenic CD4+ CD25+ and CD8+ CD25+ cells during F. hepatica infection. Mice (n = 4–8/group) were infected with 10 metacercariae and sacrificed at 1, 8, 15, and 21 dpi. Non-infected mice were used as control (NI). (A) Frequency and cell number of splenic CD4+ or CD8+ cells from infected and control (NI) mice. (B,C) Frequency and cell number of splenic CD4+ CD25+ (B) or CD8+ CD25+ (C) cells from infected and control (NI) mice. (D) Frequency and cell number of hepatic CD3+ CD4+ cells from infected and control (NI) mice. (E) Frequency and cell number of hepatic CD4+ CD25+ cells from infected and control (NI) mice (right). (F) Splenic CD4+ CD25+ or CD8+ CD25+ cell number in function of the number of peritoneal HO-1+ cells in NI and infected mice. The mean of CD4+ CD25+ (in Figure 2B), CD8 CD25+ (in Figure 2C), and HO-1+ cells (in Figure 1C) was plotted. Gate analyses by flow cytometry are shown in Supplementary Figures S2 and S3. The results shown represent one experiment. Asterisks indicate significant differences with p < 0.05, performed by one-way ANOVA followed by Tukey’s test with multiple comparisons.
Antioxidants 10 01938 g002
Figure 3. The HO-1 pharmacological inhibitor SnPP decreases the production of ROS/RNS by peritoneal F4/80+ cells and correlates with an increase of splenic FoxP3+CD25+/CD4+ T cells induced by F. hepatica infection. Mice were injected with SnPP (40 mg/kg) or vehicle (PBS) one day before infection and every 4 days until the end of the experimental protocol. Mice (n = 5/group) were infected with 10 metacercariae (day 0) and sacrificed at 20 dpi. Non-infected (NI) mice (n = 3/group) both treated and untreated with SnPP were used as control. (A) Clinical signs of infected mice were analyzed to assess disease severity [17]. (B) Frequency and cell number of HO-1+ cells in the peritoneal cavity of SnPP-treated or untreated infected and control (NI) animals by flow cytometry. (C) Frequency and cell number of F4/80+ cells in the peritoneal cavity of SnPP-treated or untreated infected and control (NI) animals by flow cytometry. (D) ROS/RNS quantification in F4/80+ cells of the peritoneal cavity of SnPP-treated or untreated infected and control (NI) mice using the DCFDA probe by flow cytometry. HO-1 (E) and ICOSL (F) expression in F4/80+ cells in the peritoneal cavity of SnPP-treated or untreated infected and control (NI) mice. (G) Splenic CD4+ T cell frequency and number from SnPP-treated or untreated infected and control (NI) mice. (H) Splenic CD4+/CD25+FoxpP3+ cell frequency and number from SnPP-treated or untreated infected and control (NI) mice (left). CTLA4 expression in splenic CD4+/CD25+FoxpP3+ cells from SnPP-treated or untreated infected and control (NI) mice. Gate analyses by flow cytometry are shown in Supplementary Figures S2 and S4. Results obtained for one representative experiment are shown. Asterisks indicate significant differences with p < 0.05, performed by one-way ANOVA followed by Tukey’s test with multiple comparisons.
Antioxidants 10 01938 g003
Figure 4. Analyses of peritoneal F4/80+ cells at the early events of F. hepatica infection. Mice (n = 5/group) were injected with SnPP (40 mg/kg) or vehicle (PBS) one day before infection, infected with 10 metacercariae (day 0), and sacrificed at 1 dpi. Non-infected (NI) mice (n = 3/group) both treated and untreated with SnPP were used as a control. (A) Analysis of F4/80int and F4/80hi cells in PEC from SnPP-treated or untreated infected and control (NI) mice by flow cytometry. (B) Frequency and cell number of F4/80int (upper plots) or F4/80hi (lower plots) cells in the peritoneal cavity of SnPP-treated or untreated infected and control (NI) animals. HO-1 (C), ROS/RNS (D), CCR2 (E), and IL-33R (F) expression in peritoneal F4/80int and F4/80hi cells by flow cytometry. “nd” means none detected, since barely any F4/80hi cells in SnPP-treated infected mice were detected. Median fluorescence intensity is shown (MeFI) in the plot. Gate analyses by flow cytometry are shown in (A) and Supplementary Figure S1. Representative experiments are shown. Asterisks indicate significant differences with p < 0.05, performed by one-way ANOVA followed by Tukey’s test with multiple comparisons.
Antioxidants 10 01938 g004
Figure 5. mRNA levels of antioxidative and oxidative genes in the infection by F. hepatica. Mice (n = 5/group) were injected with SnPP (40 mg/kg) or PBS 1 day before infection, infected with 10 metacercariae (day 0), and sacrificed at 20 dpi. nrf2 (A), catalase, gpx1, gpx2, sod1, sod2 (B), and p47phox and gp91phox (C) gene expression in PECs from SnPP-treated and control infected mice evaluated by qRT-PCR. mRNA levels were analyzed by qRT-PCR with respect to gapdh expression in PECs from SnPP-treated and control infected mice (PBS). Results were compared to the infected (control) group of mice and represented as the ratio between gene expression in SnPP-treated and control mice. Asterisks indicate significant differences with p < 0.05, performed by the Student’s t-test.
Antioxidants 10 01938 g005
Figure 6. Gp91phox (gp91p-) knockout (n = 6–8/group) and littermate control (n = 2/group) mice were infected with 10 metacercariae and sacrificed at 20 dpi. Non-infected mice were used as a control. (A) Clinical signs analyzed to assess disease severity [17]. Quantification of liver damage by ALT activity in sera. (B) Flow cytometry analysis of HO-1+ in PECs from gp91phox knockout mice and littermate controls (upper panel). (C) Frequency and cell number of HO-1+ cells in the peritoneal cavity of infected and non-infected animals by flow cytometry (lower panel). MHCII (C), CD40 (D), and CD80 (E) expression in HO-1+ cells in the peritoneal cavity of infected and control mice. Letters on histograms correspond as follows: a: infected gp91phox, b: infected wildtype littermates. Median fluorescence intensity is shown (MeFI) in the plot. Asterisks indicate significant differences with p < 0.05, performed by one-way ANOVA followed by Tukey’s test with multiple comparisons.
Antioxidants 10 01938 g006
Figure 7. Peritoneal F4/80+ cells from wildtype infected mice present a regulatory-like phenotype. Gp91phox (gp91p-) knockout (n = 7–8/group) and littermate control (n = 2–4/group) mice were infected with 10 metacercariae and sacrificed at 20 dpi. Non-infected mice were used as a control. (A) Flow cytometry analysis of F4/80+ cells in PEC from gp91phox knockout mice and littermate controls (upper panel). Frequency and cell number of F4/80+ cells in the peritoneal cavity of infected and non-infected animals by flow cytometry (lower plots). ROS/RNS (B), Sirpα (C), ICOSL (D), and IL-10 (E) expression in F4/80+ cells in the peritoneal cavity of infected and uninfected mice. Letters on histograms correspond as follows: a: infected gp91phox, b: infected littermates, c: uninfected gp91phox, and d: uninfected littermates. Median fluorescence intensity is shown (MeFI) in the plot. (F) Frequency and cell number of splenic CD4+ cells from infected and non-infected mice. (G) Frequency and cell number of splenic CD4+/CD25+ Foxp3+ cells from infected and non-infected mice. Gate analyses by flow cytometry are shown in (A) and Supplementary Figure S1. (H) IFNγ levels in culture supernatants of splenocyte proliferation assay cultured with FhTE for 5 days at 37 °C. The results shown represent one experiment. Asterisks indicate significant differences with p < 0.05, performed by one-way ANOVA followed by Tukey’s test with multiple comparisons.
Antioxidants 10 01938 g007
Figure 8. IL-10 signaling is essential for HO-1 expression in F. hepatica-infected mice. Fifteen µg of monoclonal rat IgG2a anti-IL-10R antibody was administrated by intraperitoneal injection the day before and after infection with F. hepatica and every 3 days until sacrifice (n = 5–8/group). The control group (n = 4/group) received an isotype control antibody. At day 20 post-infection, animals were sacrificed and splenocytes were analyzed by flow cytometry. (A) Clinical signs were analyzed to assess disease severity [17]. (B) Analysis by flow cytometry of F4/80+ cells in PEC from infected and non-infected (NI) mice showing frequency and number of F4/80+ cells in PECs. (C) HO-1 expression in F4/80+ cells in the peritoneal cavity of infected and uninfected mice. (D) Frequency and cell number of CD4+ T cells in spleens from infected and non-infected (NI) mice. (E) Frequency and cell number of CD4+ CD25+ T cells in spleens from infected and non-infected (NI) mice. Gate analyses by flow cytometry are shown in (B) and Supplementary Figure S7. Representative results of one representative are shown. Asterisks indicate significant differences with p < 0.05, performed by one-way ANOVA followed by Tukey’s test with multiple comparisons.
Antioxidants 10 01938 g008
Figure 9. General hypothesis. (A) ICOSL+ F4/80+ APC express HO-1 induced by parasite infection that promotes IL-10 production and differentiation or expansion of CTLA4+ Tregs. (B) SnPP treatment inhibiting HO-1 activity in IL-33R+ F4/80+ APC allows ROS/RNS production, that induce parasite damage in early stages of the infection.
Antioxidants 10 01938 g009
Publisher’s Note: MDPI stays neutral with regard to jurisdictional claims in published maps and institutional affiliations.

