
Impact of Drying Processes on the Nutritional Composition, Volatile Profile, Phytochemical Content and Bioactivity of Salicornia ramosissima J. Woods

 , ,
, ,  , and
, and
Abstract
:1. Introduction
2. Materials and Methods
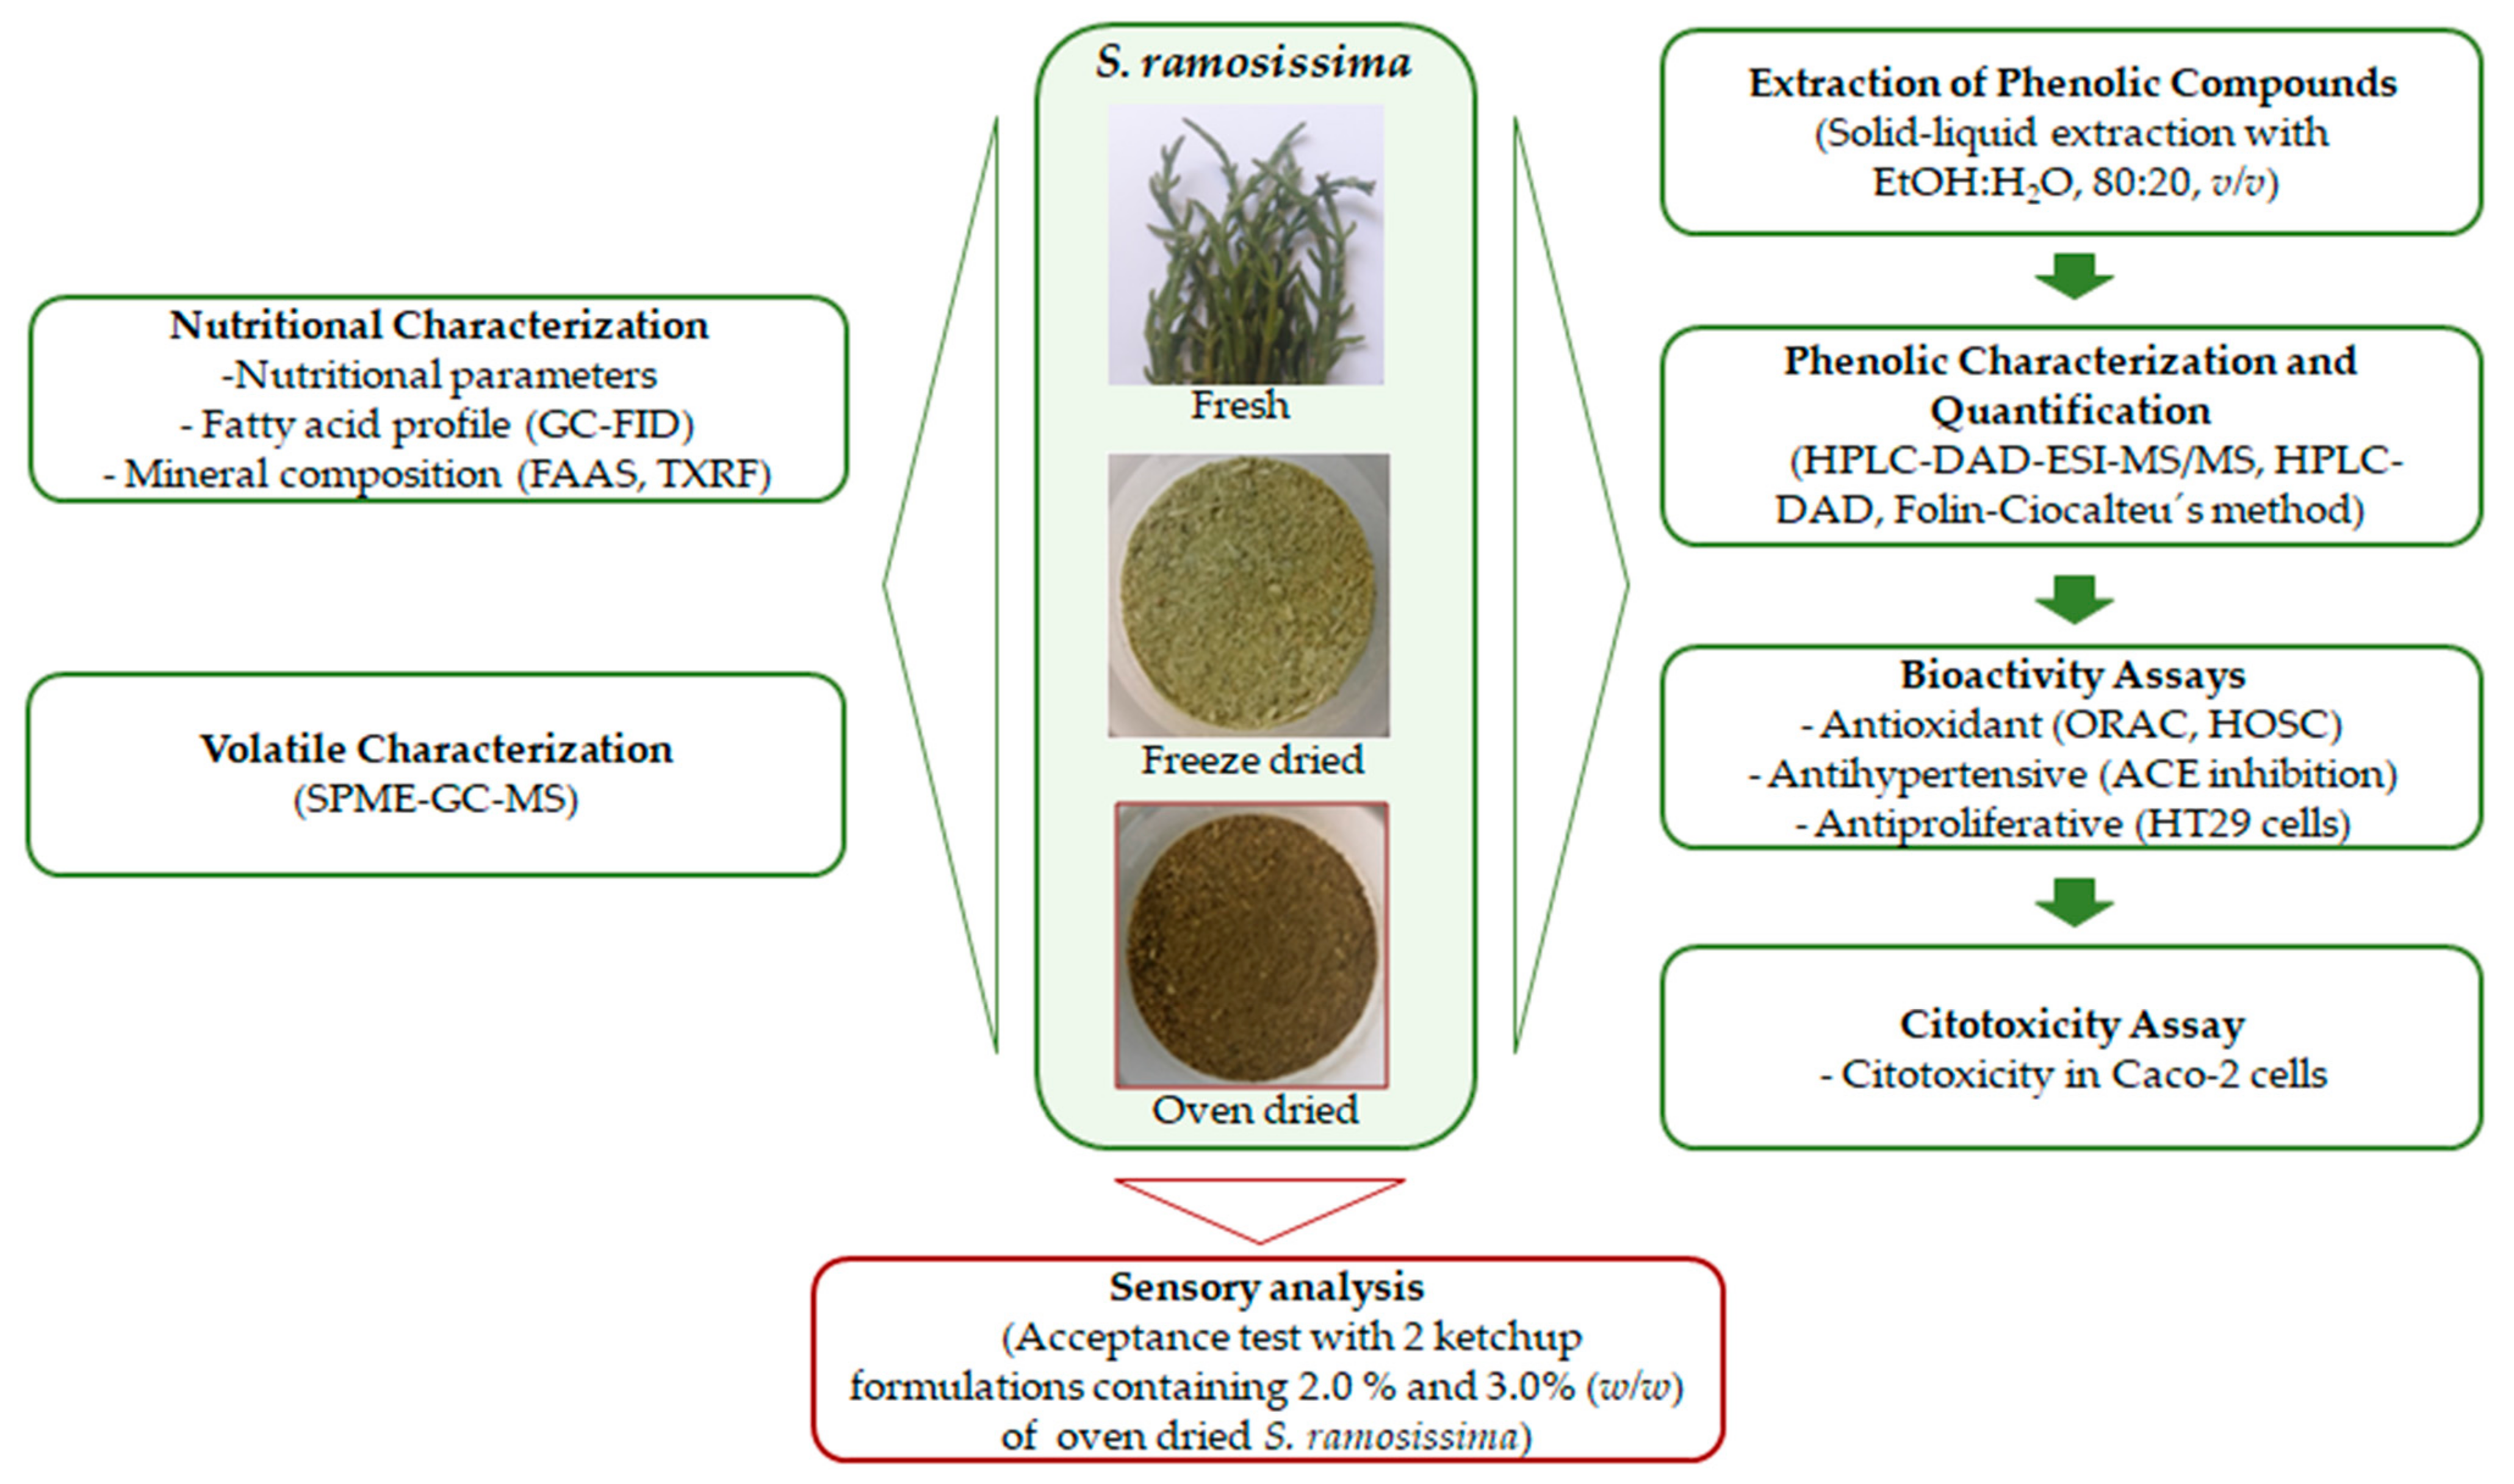
2.1. Halophyte Plant
2.2. Drying Process
2.3. Reagents
2.4. Nutritional Characterization
2.4.1. Nutritional Parameters
2.4.2. Mineral Composition
2.5. Volatile Composition by Gas Chromatography
2.6. Analysis of Phenolic Composition
2.6.1. Extraction of Phenolic Compounds
2.6.2. HPLC-DAD-ESI-MS/MS
2.6.3. HPLC-DAD
2.7. Total Phenolic Content
2.8. Antioxidant Activity
2.8.1. Oxygen Radical Absorbance Capacity (ORAC) Assay
2.8.2. Hydroxyl Radical Scavenging Capacity (HOSC) Assay
2.9. Antihypertensive Activity Assay
2.10. Cell-Based Assays
2.10.1. Cell Culture
2.10.2. Cytotoxicity Assay in Caco-2 Cells
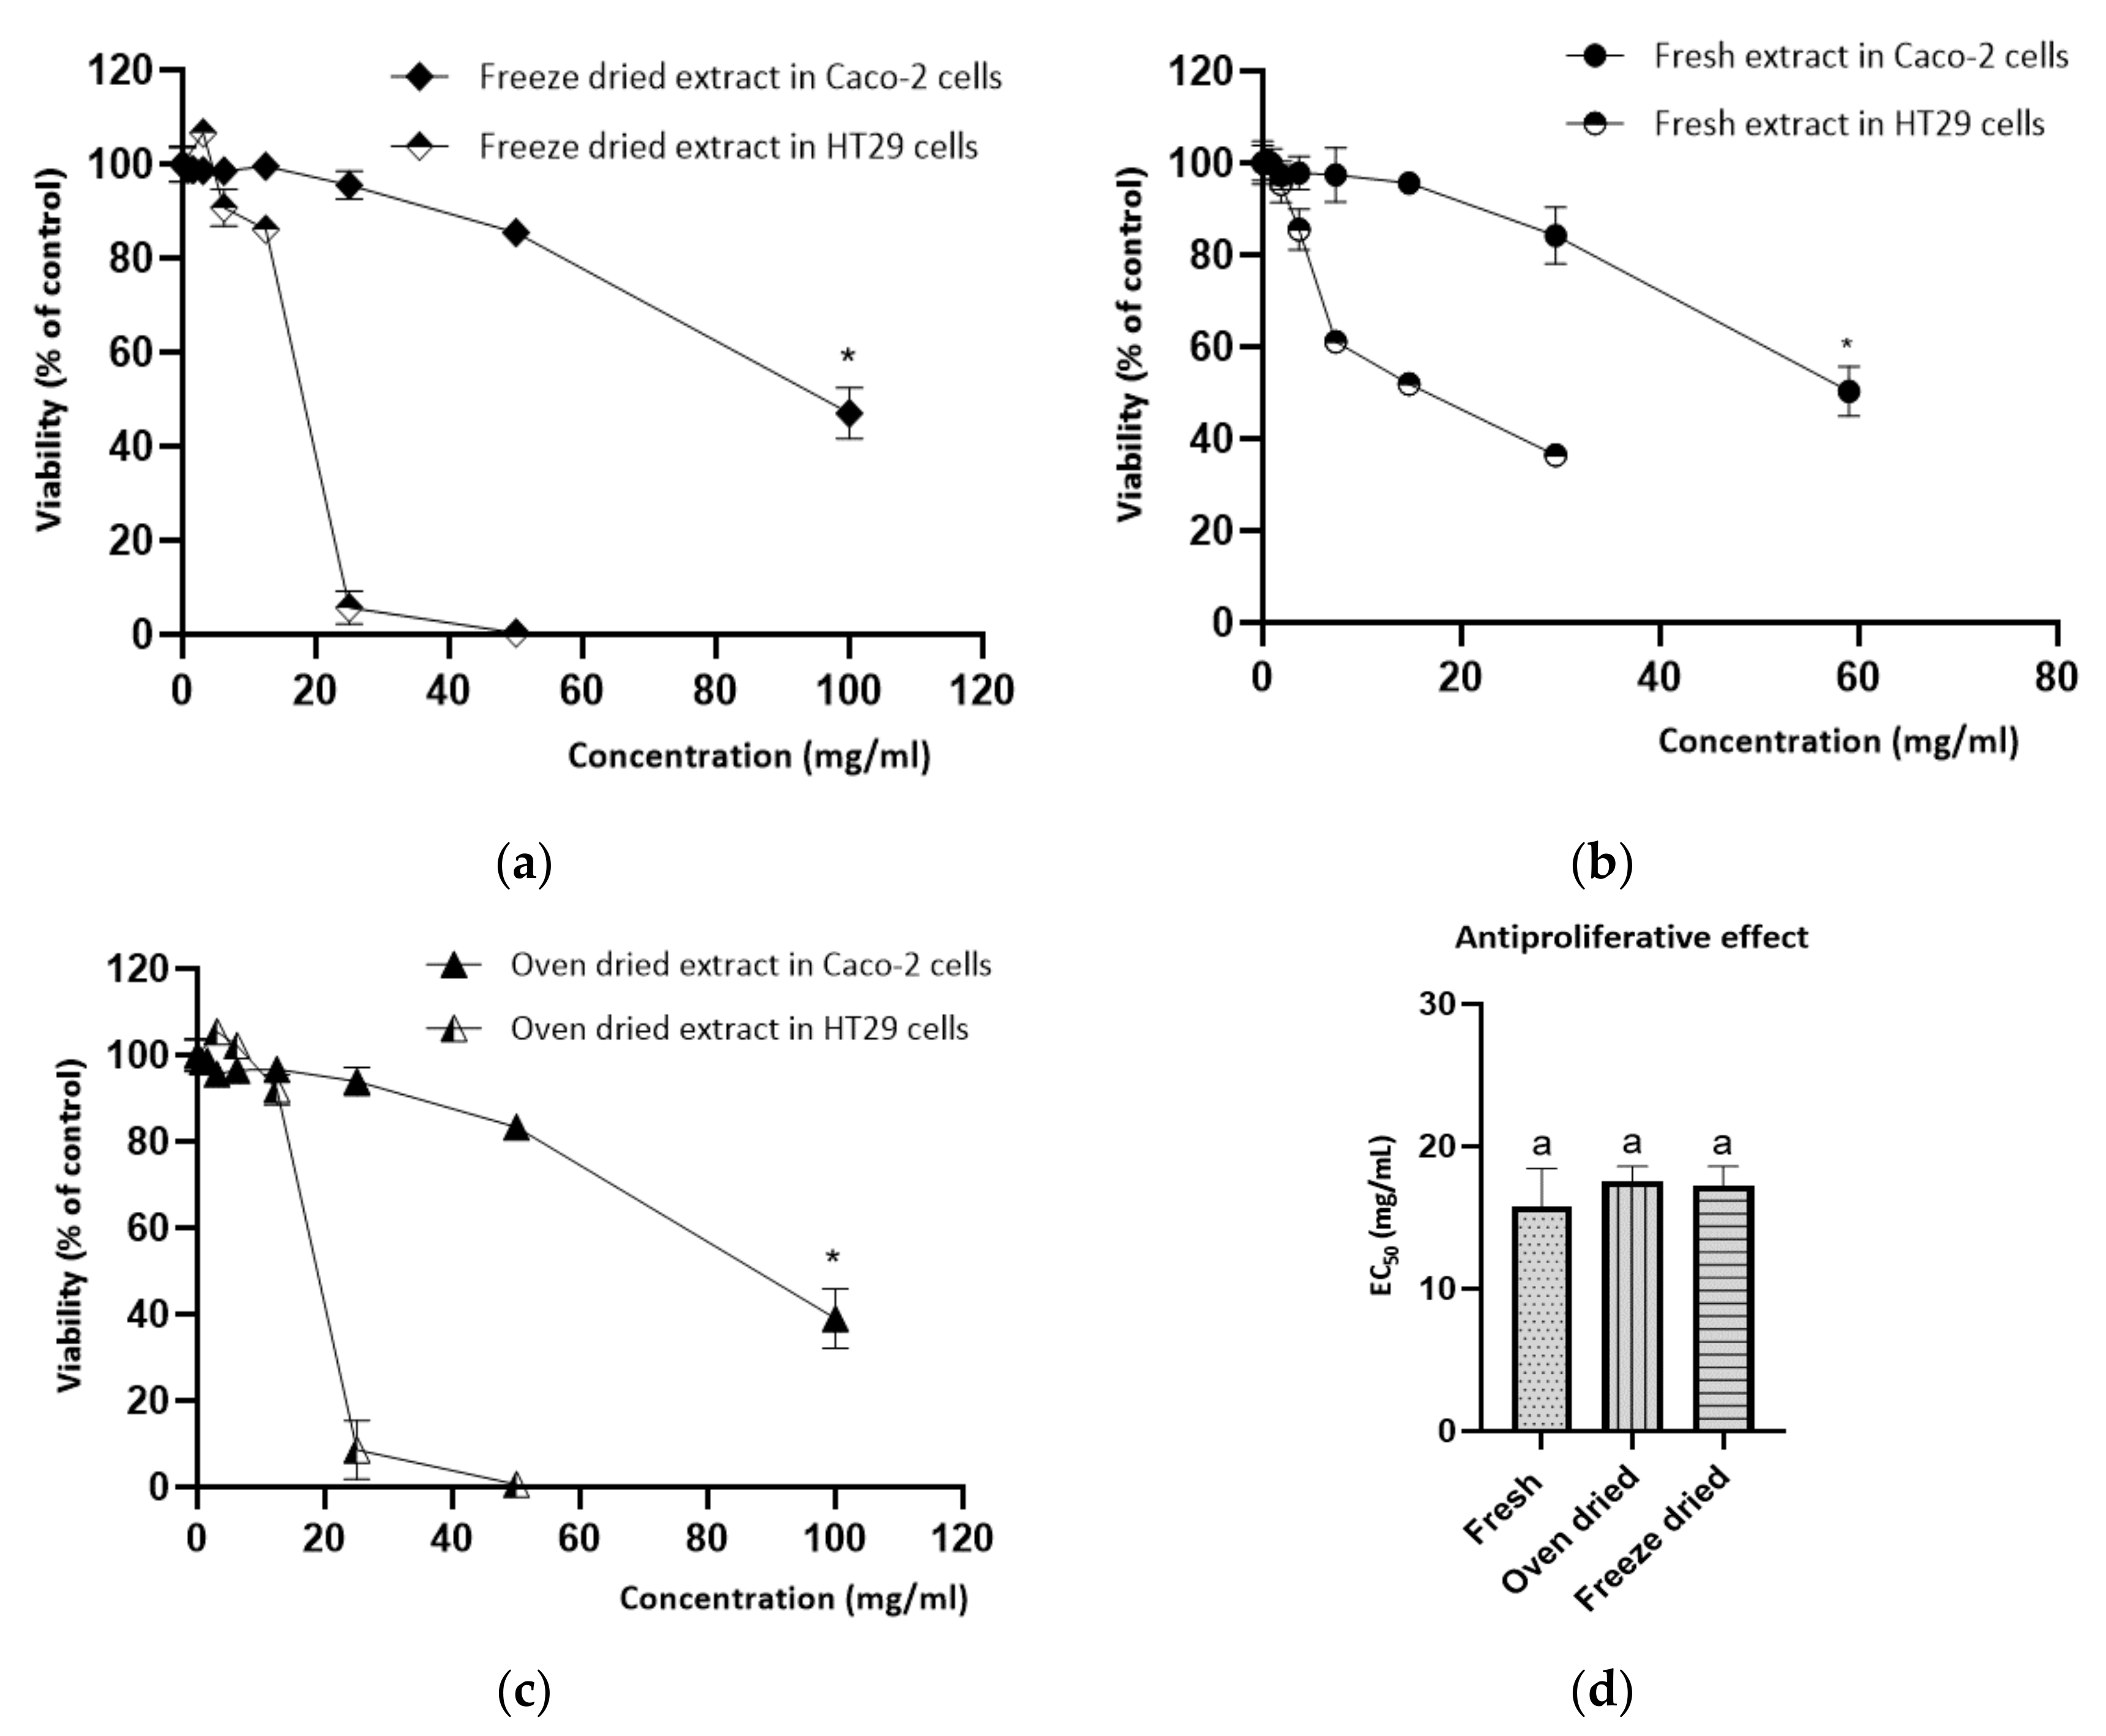
2.10.3. Antiproliferative Assay in HT29 Cells
2.11. Sensory Analysis
2.12. Statistical Analysis
3. Results and Discussion
3.1. Nutritional Characterization
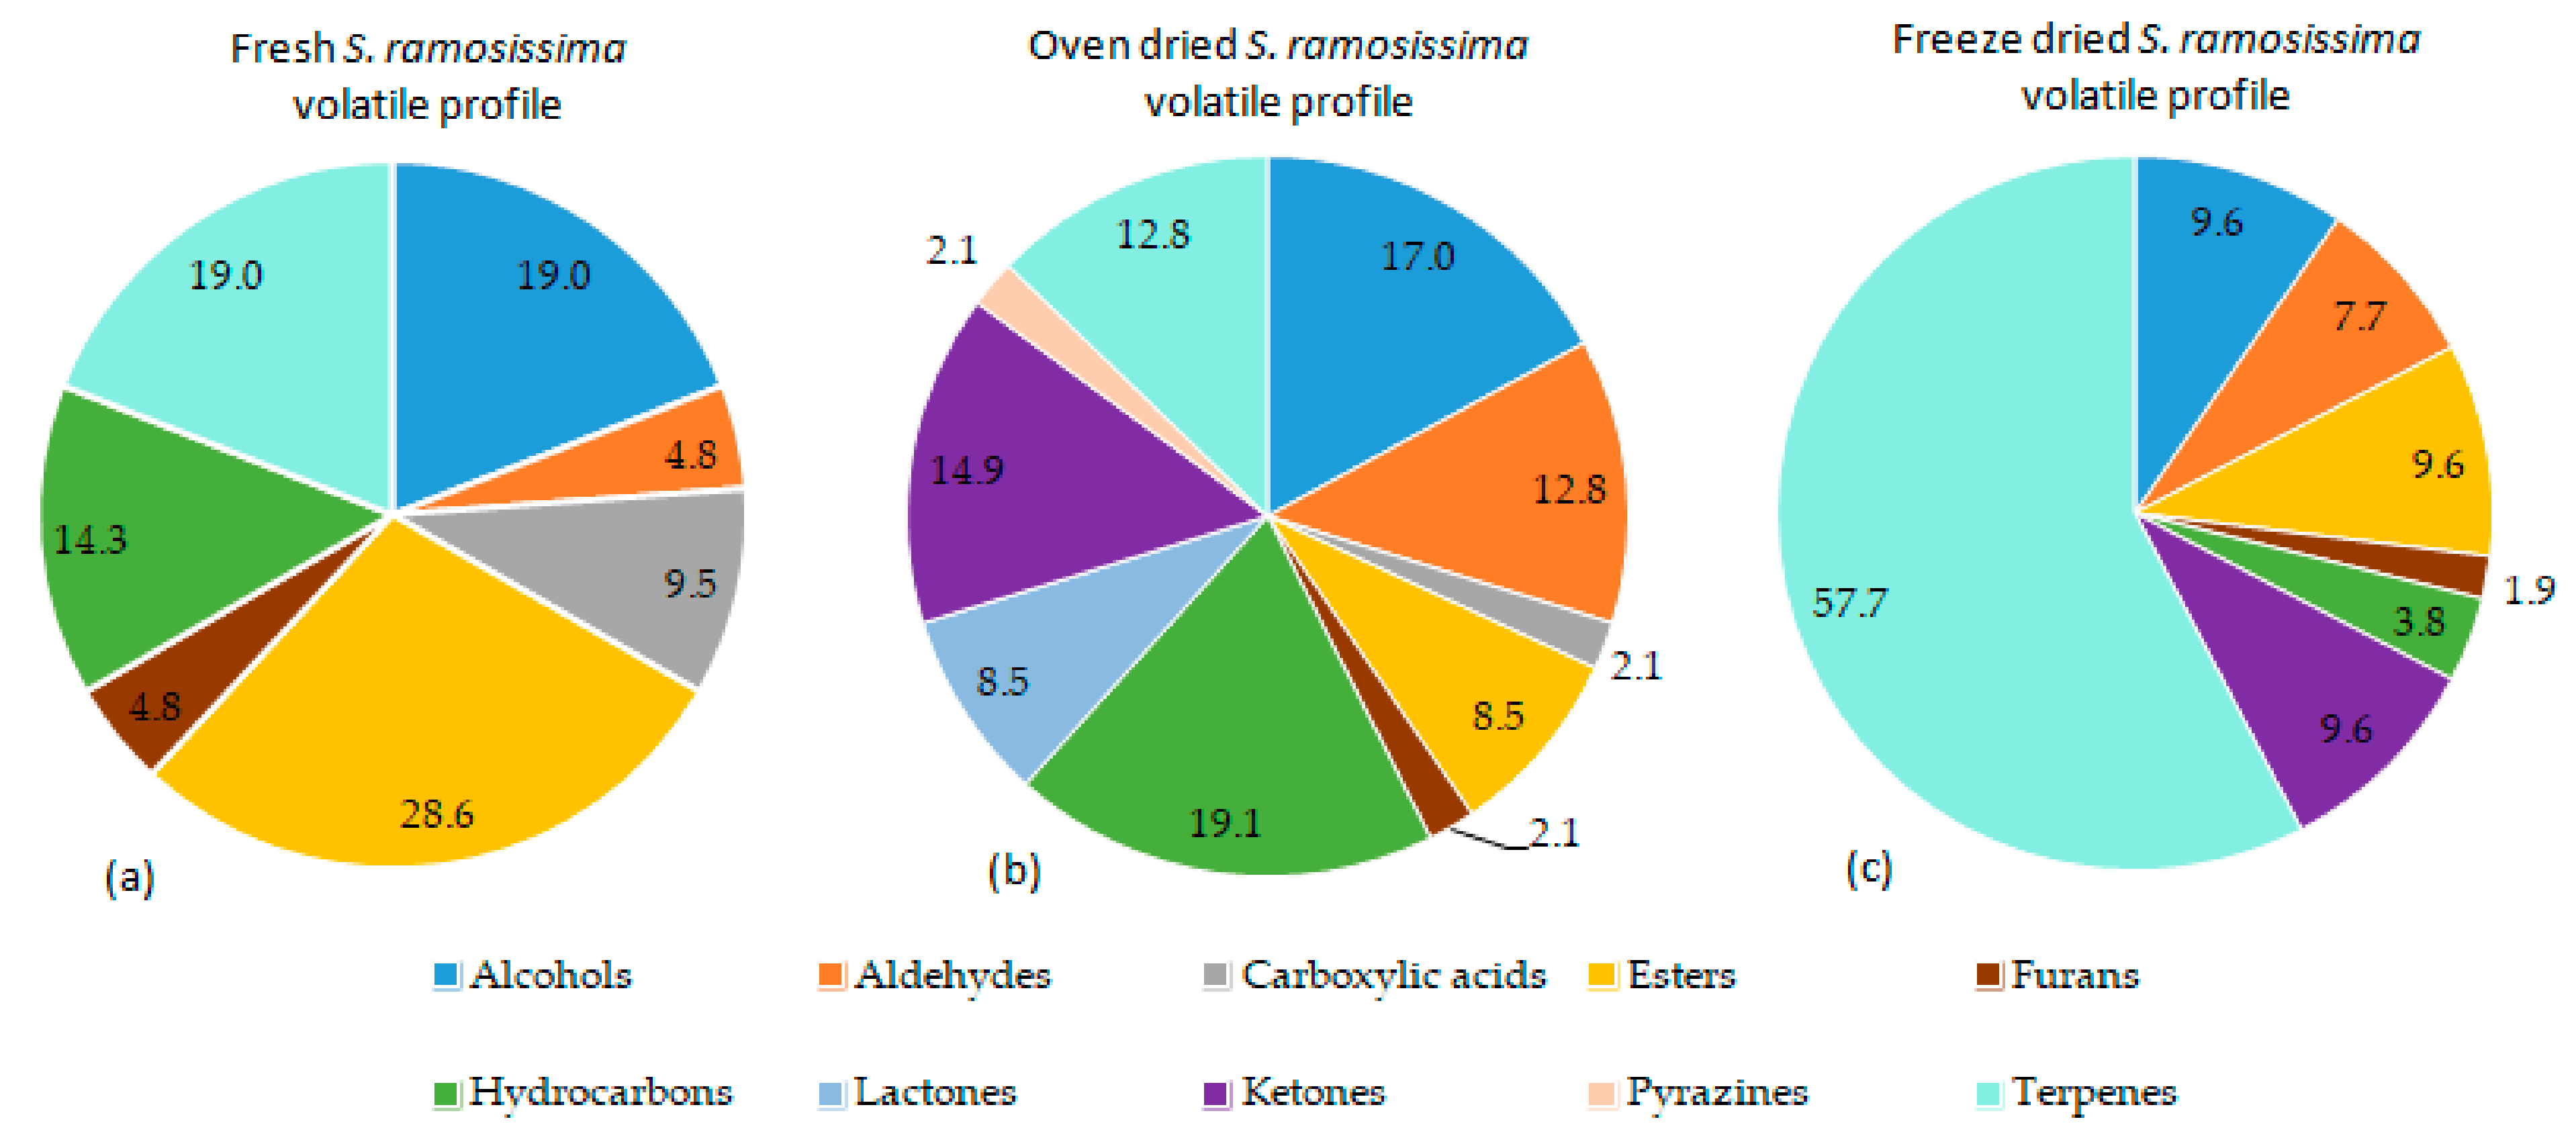
3.2. Volatile Compounds Profile
3.3. Phytochemical Characterization and Biological Activities
3.3.1. Identification and Quantification of Phenolic Compounds

| Peak | tr (min.) a | λmax (nm) | Precursor Ion [M-H]− m/z | Product Ion m/z | Tentative Identification | Extracts b | References |
|---|---|---|---|---|---|---|---|
| 1 | 7.14 | 301 | 215 | 191, 179 | quinic acid derivative | FH | [69,70] |
| 2 | 8.58 | 275 | 133 | 133, 115, 113, 71 | malic acid | OD | [70,71,87] |
| 3 | 9.36 | 260 | 191 | 111, 87, 85 | quinic acid | FH, OD, FD | [69,70] |
| 4 | 29.03 | 300,325 | 353 | 191, 179, 135 | neochlorogenic acid | FH, OD, FD | [71,72,88] |
| 5 | 32.77 | 280,317 | 285 | 153, 152, 108, 109 | protocatechuic-acid-arabinoside | FH | [69,89] |
| 6 | 33.83 | 275 | 305 | 305, 225, 97, 59 | gallocatechin | FH, FD | [90] |
| 7 | 34.85 | 284,318 | 355 | 137, 93 | salicylic acid derivative | FH, OD | [91] |
| 8 | 35.38 | 281,332 | 355 | 273, 253, 191, 173 | hydrocaffeoylquinic acid | FD | [15] |
| 9 | 35.63 | 274, 310 | 163 | 119 | p-coumaric acid | FH, FD | [78,92] |
| 10 | 36.58 | 300,327 | 353 | 191, 179 | chlorogenic acid * | FH, OD, FD | [71,72,88] |
| 11 | 38.63 | 267,345 | 193 | 134, 161, 178 | ferulic acid | FH, OD, FD | [69,88] |
| 12 | 40.26 | 269,332 | 355 | 193, 178, 161, 134 | ferulic acid-glucoside | FH, OD, FD | [69,87,88] |
| 13 | 40.69 | 268,337 | 303 | 303, 97 | dihydroquercetin (taxifolin) | FH, OD, FD | [93,94] |
| 14 | 42.40 | 312 | 337 | 191, 173, 163 | p-coumaroylquinic acid (isomer 1) | FH, OD, FD | [95,96] |
| 15 | 43.88 | - | 371 | 249, 121, 113 | saccharide | FH, OD, FD | [97] |
| 16 | 44.60 | 311 | 337 | 215, 191, 173, 163 | p-coumaroylquinic acid (isomer 2) | OD | [95,96] |
| 17 | 45.49 | 256,336 | 319 | 295, 294, 187, 97 | n.i. | FH, FD | |
| 18 | 46.34 | 270,354 | 609 | 301, 151 | quercetin-rhamnosyl-hexoside | FH, OD, FD | [98] |
| 19 | 46.50 | 300 | 449 | 253, 118 | p-coumaric acid benzyl ester derivative | OD | [99] |
| 20 | 47.10 | 274,335 | 519 | 315, 301, 300, 299 | quercetin-methyl-ether derivative (isomer 1) | FH, FD | [100] |
| 21 | 47.64 | 255,352 | 463 | 463, 301, 300 | quercetin 3-glucoside* | FH, OD, FD | [15,71,78] |
| 22 | 48.18 | 284,329 | 517 | 517, 355, 179, 135 | caffeic acid-glucuronide-glucoside (isomer 1) | FD | [88,101] |
| 23 | 48.62 | 251,358 | 549 | 505, 463, 301, 300 | quercetin-malonyglucoside | FH, OD, FD | [71,84,102] |
| 24 | 49.37 | 302,332 | 515 | 353, 325, 191, 179 | 3,5-dicaffeoylquinic acid | FH, OD, FD | [70,96] |
| 25 | 50.38 | 302,329 | 515 | 479, 353, 191, 179, 173 | 4,5-dicaffeoylquinic acid | FH, OD, FD | [70,78,96] |
| 26 | 50.94 | 266,331 | 517 | 355, 179, 135 | caffeoyl-hydrocaffeoylquinic acid | FH, OD, FD | [15] |
| 27 | 51.66 | 268,346 | 519 | 519, 350, 315, 300 | quercetin-methyl-ether derivative (isomer 2) | FH, OD, FD | [100] |
| 28 | 52.33 | 328 | 563 | 503, 473, 459, 443, 383, 353 | apigenin-6-arabinosyl-8-glucoside (isoschaftoside) | FH | [94,103] |
| 29 | 59.90 | 287 | 953 | 953, 767, 575, 285 | kaempferol derivative | FH, FD | [71,104] |
| Peak | Quantified Compounds ab | Fresh (µg/g fw) | Fresh (µg/g dw)c | Oven-Dried (µg/g dw) | Freeze-Dried (µg/g dw) |
|---|---|---|---|---|---|
| 3 | quinic acid *** | 9.33 ± 2.54 | 79.11 ± 21.52 B | 117.4 ± 1.28 aA | 58.67 ± 1.51 bB |
| 4 | neochlorogenic acid * | 18.03 ± 4.40 | 152.80 ± 37.27 A | 136.12 ± 2.51 aA | 106.81 ± 3.06 bA |
| 5 | protocatechuic-arabinoside acid * | 3.00 ± 0.10 | 25.43 ± 0.87 | - | - |
| 6 | gallocatechin ** | 5.25 ± 0.78 | 44.54 ± 6.58 a | - | 25.52 ± 0.44 b |
| 7 | salicylic acid derivative * | 2.54 ± 0.01 | 21.53 ± 0.08 a | 13.74 ± 0.30 b | - |
| 8 | hydrocaffeoylquinic acid * | - | - | - | 12.82 ± 0.04 |
| 9 | p-coumaric acid * | 2.75 ± 0.04 | 23.33 ± 0.37 a | - | 19.00 ± 0.26 a |
| 10 | chlorogenic acid * | 53.19 ± 13.59 | 450.76 ± 115.17 A | 318.74 ± 11.11 bA | 421.91 ± 13.08 aA |
| 11 | ferulic acid * | 4.21 ± 0.40 | 35.72 ± 3.38 A | 24.01 ± 0.13 bB | 26.58 ± 0.39 aB |
| 12 | ferulic-glucoside acid * | 5.98 ± 0.40 | 50.69 ± 3.36 A | 21.23 ± 9.35 aB | 46.92 ± 2.15 aA |
| 13 | dihydroquercetin ** | 2.86 ± 0.08 | 24.21 ± 0.65 A | 18.58 ± 1.62 aB | 14.52 ± 0.13 aB |
| 14 | p-coumaroylquinic acid (isomer 1) * | 2.72 ± 0.09 | 2.08 ± 0.74 A | 15.48 ± 0.06 aB | 13.77 ± 0.04 bB |
| 16 | p-coumaroylquinic acid (isomer 2) * | - | - | 24.63 ± 0.74 | - |
| 18 | quercetin-rhamnosyl-hexoside ** | 7.65 ± 1.13 | 64.81 ± 9.62 A | 52.90 ± 1.34 bA | 74.49 ± 2.31 aA |
| 19 | p-coumaric acid benzyl ester derivative * | - | - | 72.51 ± 2.22 | - |
| 20 | quercetin-methyl-ether derivative (isomer 1) ** | 13.60 ± 1.09 | 115.26 ± 9.20 a | - | 35.21 ± 22.13 b |
| 21 | quercetin 3-glucoside ** | 53.53 ± 8.11 | 453.66 ± 68.76 B | 688.38 ± 16.48 aA | 636.02 ± 19.47 aA |
| 22 | caffeic acid-glucuronide-glucoside (isomer 1) * | - | - | - | 53.40 ± 1.64 |
| 23 | quercetin-malonyglucoside ** | 309.39 ± 60.74 | 2621.99 ± 514.72 B | 1578.0 ± 30.0 bB | 4202.52 ± 48.09 aA |
| 24 | 3,5-dicaffeoylquinic acid * | 25.83 ± 0.05 | 218.87 ± 0.40 B | 223.38 ± 9.27 bB | 434.88 ± 13.95 aA |
| 25 | 4,5-dicaffeoylquinic acid * | 11.75 ± 0.533 | 99.58 ± 4.52 B | 223.22 ± 9.67 aA | 213.09 ± 5.97 aA |
| 26 | caffeoyl-hydrocaffeoylquinic acid * | 9.72 ± 3.13 | 82.40 ± 26.59 B | 138.67 ± 7.37 aAB | 163.14 ± 4.64 aA |
| 27 | quercetin-methyl-ether derivative (isomer 2) ** | 13.36 ± 2.70 | 113.23 ± 22.91 A | 56.11 ± 1.43 bB | 101.18 ± 2.26 aAB |
| 28 | apigenin-6-arabinosyl-8-glucoside (isoschaftoside) ** | 3.82 ± 0.11 | 32.38 ± 0.96 | - | - |
| 29 | kaempferol derivative ** | 10.90 ± 2.09 | 92.42 ± 17.71 a | - | 62.19 ± 1.75 b |
| Total Flavonoids | 420.36 | 3562.50 | 2393.97 | 5151.65 | |
| Total Hydroxycinnamic | 139.72 | 1163.19 | 1211.73 | 1512.32 |
3.3.2. Bioactivity: Antioxidant, Antihypertensive, and Antiproliferative Effects
3.4. Sensorial Analysis: Consumer Acceptance of Oven-Dried S. ramosissima
4. Conclusions
Supplementary Materials
Author Contributions
Funding
Institutional Review Board Statement
Informed Consent Statement
Data Availability Statement
Acknowledgments
Conflicts of Interest
Appendix A
| Peak | tr (min.) a | Area% Fresh | Area % oven Dried | Area % Freeze Dried | Compounds | Chemical Classes | Odor Description b | Calc. LRI c | Lit. LRI | References |
|---|---|---|---|---|---|---|---|---|---|---|
| 1 | 5.012 | 0.26 | 34.16 | 1.30 | hexanal | Aldehyde | herbal, grassy, green | 800 | 801 | [35,50,140,141] |
| 2 | 6.700 | 0.46 | - | - | 1-methoxy-3-hexene | Hydrocarbon | not found | 847 | 826 | [142] |
| 3 | 6.962 | - | - | 0.68 | 2-hexenal | Aldehyde | floral, herbal | 853 | 850 | [140,141] |
| 4 | 7.103 | 47.95 | 1.80 | - | 3-hexen-1-ol | Alcohol | green, marine, seaweed | 857 | 852 | [50,52,143] |
| 5 | 7.635 | - | - | 0.04 | 3-methyl-1-pentanol | Alcohol | fruity, floral | 871 | 852 | [144,145] |
| 6 | 7.653 | 47.82 | - | - | 1-hexanol | Alcohol | woody, sweet, green, fruity | 867 | 872 | [53,141,146] |
| 7 | 7.684 | - | 7.84 | - | 2-methylbutanoic acid ethyl ester | Ester | cheesy, sour | 872 | 876 | [55] |
| 8 | 8.722 | - | 5.14 | 0.10 | heptanal | Aldehyde | penetrating oily, harsh | 901 | 902 | [35,53,147] |
| 9 | 9.079 | - | 1.29 | - | butyrolactone | Lactone | cheesy, burnt sugar; buttery | 911 | 915 | [53,146,147,148] |
| 10 | 9.278 | - | 0.17 | - | 2-3-dimethylpyrazine | Pyrazine | nutty, cocoa-like | 916 | 918 | [53,149] |
| 11 | 9.569 | - | - | 0.05 | alpha-thujene | Terpene | herbal, green, weak earthy | 924 | 924 | [60,150,151] |
| 12 | 9.786 | - | - | 0.88 | alpha-pinene | Terpene | oily, green | 930 | 933 | [58,151] |
| 13 | 10.260 | 1.51 | - | - | ethyl tiglate | Ester | fruity | 943 | 939 | [152] |
| 14 | 10.274 | - | - | 1.09 | camphene | Terpene | sweet | 943 | 947 | [58,151,153] |
| 15 | 10.616 | - | 0.25 | - | γ-valerolactone | Lactone | sweet, herbaceous | 953 | 950 | [154,155] |
| 16 | 10.792 | - | 1.39 | - | benzaldehyde | Aldehyde | hazelnut, roasty | 958 | 962 | [156,157] |
| 17 | 11.288 | - | - | 1.37 | beta-pinene | Terpene | Woody, green, pine-like | 971 | 979 | [150,153,158] |
| 18 | 11.416 | - | 0.31 | - | 3,5,5-trimethyl-2-hexene | Hydrocarbon | not found | 975 | 977 | [159] |
| 19 | 11.637 | - | 3.00 | 0.01 | 1-octen-3-ol | Alcohol | mushroom | 981 | 980 | [50,56,150] |
| 20 | 11.848 | - | 3.92 | 0.05 | 6-methyl-5-hepten-2-one | Ketone | banana-like | 987 | 988 | [143,160] |
| 21 | 11.973 | 0.00 | 0.00 | 2.26 | beta-myrcene | Terpene | herbaceous, sweet | 990 | 991 | [58,150,151] |
| 22 | 12.004 | 0.07 | 1.14 | - | 2-pentylfuran | Furan | floral, fruit | 991 | 990 | [154,161] |
| 23 | 12.164 | 0.07 | 0.60 | - | hexanoic acid | Carboxylic acid | unpleasant, rancing, metallic | 995 | 993 | [162,163] |
| 24 | 12.321 | - | 0.99 | - | decane | Hydrocarbon | gasoline-like, fishy | 1000 | 1000 | [164,165] |
| 25 | 12.329 | - | - | 8.45 | alpha-phellandrene | Terpene | fresh, green | 1000 | 1005 | [59,146,153] |
| 26 | 12.372 | - | 0.16 | - | octanal | Aldehyde | fruity, green, citrus | 1001 | 1005 | [146,159,166] |
| 27 | 12.663 | 0.33 | - | - | 3-hexen-1-ol acetate | Ester | fruity, floral | 1010 | 1007 | [140,141] |
| 28 | 12.793 | - | - | 0.24 | alpha-terpinene | Terpene | resinous | 1014 | 1017 | [59,150] |
| 29 | 12.834 | - | 0.39 | - | 2-methylpentyl formate | Ester | not found | 1015 | - | |
| 30 | 12.917 | 0.11 | - | - | hexyl acetate | Ester | fruit, herb | 1017 | 1019 | [145,167] |
| 31 | 13.083 | 0.02 | 3.08 | 8.80 | p-cymene | Terpene | green, fruity, aromatic | 1022 | 1027 | [58,158,168] |
| 32 | 13.225 | 0.16 | 10.18 | - | limonene | Terpene | pine/chemical, floral/fresh | 1027 | 1029 | [56,156] |
| 33 | 13.306 | - | - | 38.73 | 1,8-cineole | Terpene | eucalyptus, spicy, pepper | 1029 | 1032 | [57,156,169] |
| 34 | 13.353 | 1.14 | - | 2-ethyl-1-hexanol | Alcohol | green, flowery, green cucumber | 1031 | 1029 | [141,163,170] | |
| 35 | 13.517 | 0.08 | - | - | 2-hexenoic acid | Carboxylic acid | not found | 1035 | - | |
| 36 | 13.643 | - | 0.29 | - | 3-octen-2-one | Ketone | rose | 1039 | 1040 | [161,171,172] |
| 37 | 13.719 | - | 0.16 | - | phenylacetaldehyde | Aldehyde | lilac, flora | 1041 | 1043 | [55,156] |
| 38 | 13.808 | 0.06 | - | - | benzyl alcohol | Alcohol | floral, fruity, rose | 1044 | 1045 | [173] |
| 39 | 14.225 | - | - | 0.29 | gamma-terpinene | Terpene | green, woody | 1057 | 1059 | [55,58,172] |
| 40 | 14.502 | - | - | 0.13 | trans-sabinene hydrate | Terpene | spicy, weak fruity | 1065 | 1060 | [60,150] |
| 41 | 14.731 | - | 1.19 | 0.04 | 3,5-octadien-2-one | Ketone | green, marine, grass, fatty | 1072 | 1098 | [50,56] |
| 42 | 15.194 | - | - | 0.37 | alpha-terpinolene | Terpene | woody, herbaceous | 1086 | 1086 | [55,59,107] |
| 43 | 15.503 | - | 0.30 | - | linalool oxide | Terpene | woody | 1095 | 1092 | [168,174] |
| 44 | 15.508 | 0.54 | - | - | methyl benzoate | Ester | eucalyptus, phenolic, wood | 1095 | 1094 | [175,176] |
| 45 | 15.633 | - | - | 0.48 | linalool | Terpene | pleasant scent, floral | 1099 | 1097 | [141,158] |
| 46 | 15.640 | - | 0.14 | - | 2,6,11-trimethyldodecane | Hydrocarbon | not found | 1099 | 1102 | [177] |
| 47 | 15.724 | - | - | 7.21 | beta-thujone | Terpene | camphoraceous-herbal | 1102 | 1119 | [60] |
| 48 | 15.789 | - | 7.31 | - | 3,4-dimethylcyclohexanol | Alcohol | not found | 1104 | 1103 | [178] |
| 49 | 16.069 | - | - | 2.31 | alpha-thujone | Terpene | warm-herbal, minty | 1113 | 1114 | [60,179] |
| 50 | 16.165 | - | 0.09 | - | 4-hexen-1-ol, 2-ethenyl-2,5-dimethyl- | Alcohol | not found | 1116 | - | |
| 51 | 16.233 | 0.11 | - | - | phenylethyl alcohol | Alcohol | sweet, perfume, floral, bee wax | 1118 | 1117 | [50,143] |
| 52 | 16.566 | - | - | 0.14 | 1,3,8-p-menthatriene | Terpene | green, cucumber, floral | 1129 | 1130 | [56,144] |
| 53 | 16.903 | - | - | 4.80 | camphor | Terpene | camphoraceous, fresh | 1140 | 1141 | [55,60] |
| 54 | 17.429 | - | - | 0.08 | trans-pinocamphone | Terpene | cedar, camphoreous, woody | 1157 | 1157 | [180,181] |
| 55 | 17.627 | - | - | 0.18 | borneol | Terpene | camphoraceous, earthy | 1163 | 1165 | [60,169] |
| 56 | 17.674 | - | - | 0.27 | (Z,Z)-3,6-nonadien-1-ol | Alcohol | green, marine, seaweed | 1165 | 1165 | [50,182] |
| 57 | 17.847 | - | - | 0.04 | cis-pinocamphone | Terpene | cedar, camphoreous, woody | 1171 | 1172 | [181] |
| 58 | 17.925 | 0.21 | - | - | ethyl benzoate | Ester | flowery | 1173 | 1172 | [156,183] |
| 59 | 17.983 | - | - | 0.21 | terpinen-4-ol | Terpene | green, fruity, citrus-like | 1175 | 1178 | [58] |
| 60 | 18.436 | - | 0.32 | 0.43 | alpha-terpineol | Terpene | minty, fresh vegetable, green | 1190 | 1189 | [163,184] |
| 61 | 18.566 | - | - | 0.11 | cis-dihydrocarvone | Terpene | cooling, fresh, minty | 1194 | 1193 | [185,186] |
| 62 | 18.659 | - | 1.16 | - | safranal | Terpene | saffron-like | 1197 | 1197 | [187,188] |
| 63 | 18.749 | 0.02 | 1.02 | - | dodecane | Hydrocarbon | alkane-like, chemical | 1201 | 1200 | [159,189] |
| 64 | 18.892 | - | 0.42 | - | decanal | Aldehyde | soapy, chemical | 1205 | 1205 | [156,190] |
| 65 | 18.910 | - | - | 0.25 | verbenone | Ketone | sweet, floral, camphor-like | 1206 | 1204 | [146,191] |
| 66 | 19.056 | - | - | 0.34 | 4,7-dimethyl-benzofuran | Furan | smoke, moss, spicy | 1211 | 1220 | [56,164] |
| 67 | 19.223 | - | - | 0.07 | cuminaldehyde | Aldehyde | sweet, fresh | 1217 | 1207 | [58,192] |
| 68 | 19.314 | 0.08 | 1.97 | - | beta-cyclocitral | Terpene | sweet-tobacco, grape | 1220 | 1220 | [156,193] |
| 69 | 19.697 | - | - | 0.93 | thymol methyl ether | Terpene | oregano-like, smoky-like, woody | 1233 | 1233 | [150,194] |
| 70 | 19.782 | - | - | 0.22 | octyl-acetate | Ester | fruity, herbal | 1236 | 1222 | [145,195] |
| 71 | 19.957 | - | - | 0.31 | isothymol methyl ether | Terpene | burnt, smoky-like, woody | 1242 | 1244 | [196] |
| 72 | 20.116 | - | - | 3.29 | 1,2-Dimethyl-4-isobutylbenzene | Hydrocarbon | not found | 1248 | 1240 | [197] |
| 73 | 20.150 | - | 0.39 | - | 1-(4-ethylphenyl)-ethanone | Ketone | not found | 1249 | 1231 | [198] |
| 74 | 21.037 | - | - | 0.30 | decanol | Alcohol | floral, spicy | 1280 | 1280 | [182,199] |
| 75 | 21.051 | 0.01 | 0.16 | - | 4,6-dimethyldodecane | Hydrocarbon | not found | 1281 | 1285 | [200] |
| 76 | 21.157 | - | - | 8.17 | isobornyl acetate | Ester | herb, woody, sweet, minty | 1284 | 1285 | [61,169] |
| 77 | 21.417 | - | - | 0.56 | thymol | Terpene | thyme-like, spicy | 1294 | 1293 | [60,194] |
| 78 | 21.620 | - | 0.97 | 0.10 | 2-undecanol | Alcohol | tallowy, soapy | 1301 | 1287 | [190,201] |
| 79 | 21.730 | - | 0.64 | - | 2,4-diethyl-1-heptanol | Alcohol | not found | 1305 | 1321 | [202] |
| 80 | 21.964 | - | 0.59 | - | 2-isopropyl-5-methyl-1-heptanol | Alcohol | not found | 1314 | 1300 | [203] |
| 81 | 22.149 | - | 0.46 | - | 2,2,4,4,6,8,8-heptamethylnonane | Hydrocarbon | not found | 1321 | 1321 | |
| 82 | 22.965 | - | 0.39 | - | 1-hydroxy-2,4,4-trimethyl-3-pentanyl 2-methylpropanoate | Ester | fruity | 1351 | - | [155] |
| 83 | 23.416 | - | - | 0.14 | (3-Isopropenyl-2-methylcyclopentyl)methyl acetate | Ester | not found | 1368 | - | |
| 84 | 23.628 | 0.06 | 0.19 | 0.27 | 3-hydroxy-2,4,4-trimethylpentyl 2-methylpropanoate | Ester | apple, fresh, cucumber | 1376 | 1376 | [204,205] |
| 85 | 24.238 | - | 0.75 | - | tetradecane | Hydrocarbon | alkane-like, chemical | 1399 | 1413 | [189,206] |
| 86 | 24.451 | - | - | 0.78 | ethyl decanoate | Ester | fruity | 1407 | 1407 | [55,207] |
| 87 | 24.730 | - | - | 0.11 | trans-caryophyllene | Terpene | fresh, fruity, citrus | 1418 | 1419 | [58,59,184] |
| 88 | 24.813 | - | - | 0.37 | thymohydroquinone dimethyl ether | Terpene | earthy, moldy | 1422 | 1426 | [208,209] |
| 89 | 25.048 | - | - | 0.24 | γ-Elemene | Terpene | green, citrus, floral | 1431 | 1434 | [58,210] |
| 90 | 25.228 | - | - | 0.05 | alloaromadendrene | Terpene | woody | 1438 | 1442 | [211,212] |
| 91 | 25.349 | - | - | 2.10 | geranyl acetone | Ketone | fresh, green | 1443 | 1449 | [149,168] |
| 92 | 25.603 | - | 0.24 | 0.15 | (E)-nerylacetone | Ketone | rose, fresh, green, magnolia | 1454 | 1452 | [213,214] |
| 93 | 25.810 | - | 0.24 | - | γ-decalactone | Lactone | candy, sweet | 1462 | 1467 | [55,141,149,168] |
| 94 | 26.350 | - | 0.52 | - | 4-(2,6,6-trimethylcyclohexa-1,3-dienyl)but-3-en-2-one | Ketone | not found | 1483 | 1483 | [215] |
| 95 | 26.412 | - | 1.49 | - | beta-ionone | Ketone | dry fruit, floral | 1486 | 1486 | [55,168] |
| 96 | 26.644 | - | 0.22 | - | pentadecane | Hydrocarbon | herbaceous | 1495 | 1500 | [58,168] |
| 97 | 26.692 | 0.06 | - | - | valencene | Terpene | fruity, flowery | 1496 | 1496 | [58,216,217] |
| 98 | 27.094 | - | 0.19 | - | 2,4-di-tert-butylphenol | Hydrocarbon | not found | 1513 | 1513 | [218,219] |
| 99 | 27.470 | - | 1.26 | - | dihydroactinidiolide | Lactone | coumarin-like, musky | 1529 | 1528 | [220,221] |
| 100 | 30.835 | - | - | 0.11 | 1-heptadecene | Hydrocarbon | earthy, moss | 1677 | 1673 | [157,222] |
References
- Flowers, T.J.; Colmer, T.D. Salinity tolerance in halophytes. New Phytol. 2008, 179, 945–963. [Google Scholar] [CrossRef]
- Panta, S.; Flowers, T.; Lane, P.; Doyle, R.; Haros, G.; Shabala, S. Halophyte agriculture: Success stories. Environ. Exp. Bot. 2014, 107, 71–83. [Google Scholar] [CrossRef]
- Duarte, B.; Santos, D.; Marques, J.C.; Caçador, I. Ecophysiological adaptations of two halophytes to salt stress: Photosynthesis, PS II photochemistry and anti-oxidant feedback—Implications for resilience in climate change. Plant Physiol. Biochem. 2013, 67, 178–188. [Google Scholar] [CrossRef] [PubMed]
- Duarte, B.; Caçador, I.; Matos, A.R. Lipid landscape remodelling in Sarcocornia fruticosa green and red physiotypes. Plant Physiol. Biochem. 2020, 157, 128–137. [Google Scholar] [CrossRef] [PubMed]
- Pedro, C.A.; Santos, M.S.S.; Ferreira, S.M.F.; Gonçalves, S.C. The influence of cadmium contamination and salinity on the survival, growth and phytoremediation capacity of the saltmarsh plant Salicornia ramosissima. Mar. Environ. Res. 2013, 92, 197–205. [Google Scholar] [CrossRef]
- Duarte, B.; Caçador, I. Iberian Halophytes as Agroecological Solutions for Degraded Lands and Biosaline Agriculture. Sustainability 2021, 13, 1005. [Google Scholar] [CrossRef]
- Barreira, L.; Resek, E.; Rodrigues, M.J.; Rocha, M.I.; Pereira, H.; Bandarra, N.; da Silva, M.M.; Varela, J.; Custódio, L. Halophytes: Gourmet food with nutritional health benefits? J. Food Compos. Anal. 2017, 59, 35–42. [Google Scholar] [CrossRef]
- Lopes, M.; Cavaleiro, C.; Ramos, F. Sodium Reduction in Bread: A Role for Glasswort (Salicornia ramosissima J. Woods). Compr. Rev. Food Sci. Food Saf. 2017, 16, 1056–1071. [Google Scholar] [CrossRef] [PubMed] [Green Version]
- Ventura, Y.; Sagi, M. Halophyte crop cultivation: The case for salicornia and sarcocornia. Environ. Exp. Bot. 2013, 92, 144–153. [Google Scholar] [CrossRef]
- Lima, A.R.; Castañeda-Loaiza, V.; Salazar, M.; Nunes, C.; Quintas, C.; Gama, F.; Pestana, M.; Correia, P.J.; Santos, T.; Varela, J.; et al. Influence of cultivation salinity in the nutritional composition, antioxidant capacity and microbial quality of Salicornia ramosissima commercially produced in soilless systems. Food Chem. 2020, 333, 127525. [Google Scholar] [CrossRef]
- Rocha, L.D.; Monteiro, M.C.; Teodoro, A.J. Anticancer Properties of Hydroxycinnamic Acids—A Review. Cancer Clin. Oncol. 2012, 1, 109–121. [Google Scholar] [CrossRef]
- Onakpoya, I.J.; Spencer, E.A.; Thompson, M.J.; Heneghan, C.J. The effect of chlorogenic acid on blood pressure: A systematic review and meta-analysis of randomized clinical trials. J. Hum. Hypertens. 2015, 29, 77–81. [Google Scholar] [CrossRef]
- Maaliki, D.; Shaito, A.A.; Pintus, G.; El-Yazbi, A.; Eid, A.H. Flavonoids in hypertension: A brief review of the underlying mechanisms. Curr. Opin. Pharmacol. 2019, 45, 57–65. [Google Scholar] [CrossRef] [PubMed]
- Pan, Y.; Zheng, Y.M.; Ho, W.S. Effect of quercetin glucosides from allium extracts on hepG2, PC-3 AND HT-29 cancer cell lines. Oncol. Lett. 2018, 15, 4657–4661. [Google Scholar] [CrossRef]
- Surget, G.; Stiger-Pouvreau, V.; Le Lann, K.; Kervarec, N.; Couteau, C.; Coiffard, L.J.M.; Gaillard, F.; Cahier, K.; Guérard, F.; Poupart, N. Structural elucidation, in vitro antioxidant and photoprotective capacities of a purified polyphenolic-enriched fraction from a saltmarsh plant. J. Photochem. Photobiol. B Biol. 2015, 143, 52–60. [Google Scholar] [CrossRef] [PubMed]
- Ferreira, D.; Isca, V.M.S.; Leal, P.; Seca, A.M.L.; Silva, H.; de Lourdes Pereira, M.; Silva, A.M.S.; Pinto, D.C.G.A. Salicornia ramosissima: Secondary metabolites and protective effect against acute testicular toxicity. Arab. J. Chem. 2018, 11, 70–80. [Google Scholar] [CrossRef] [Green Version]
- Petropoulos, S.A.; Karkanis, A.; Martins, N.; Ferreira, I.C.F.R. Edible halophytes of the Mediterranean basin: Potential candidates for novel food products. Trends Food Sci. Technol. 2018, 74, 69–84. [Google Scholar] [CrossRef] [Green Version]
- Toqeer, S.; Qasim, M.; Abideen, Z.; Gul, B.; Rasheed, M.; Khan, M.A. Chemical Composition and Antioxidant Activity of Seeds of Various Halophytic Grasses. JAOCS J. Am. Oil Chem. Soc. 2018, 95, 1285–1295. [Google Scholar] [CrossRef]
- Cho, H.D.; Lee, J.H.; Jeong, J.H.; Kim, J.Y.; Yee, S.T.; Park, S.K.; Lee, M.K.; Seo, K. Il Production of novel vinegar having antioxidant and anti-fatigue activities from Salicornia herbacea L. J. Sci. Food Agric. 2016, 96, 1085–1092. [Google Scholar] [CrossRef]
- Wang, L.; Zhang, M.; Mujumdar, A.S.; Wang, Y.; Zhu, C. Restructured crispy fish cubes containing Salicornia bigelovii Torr. developed with microwave vacuum drying. J. Aquat. Food Prod. Technol. 2013, 22, 226–240. [Google Scholar] [CrossRef]
- Barroca, M.J.; Guiné, R.P.F.; Amado, A.M.; Ressurreição, S.; da Silva, A.M.; Marques, M.P.M.; de Carvalho, L.A.E.B. The drying process of Sarcocornia perennis: Impact on nutritional and physico-chemical properties. J. Food Sci. Technol. 2020, 57, 4443–4458. [Google Scholar] [CrossRef] [PubMed]
- Castroviejo, S.; Botánico, R.J. Flora Ibérica, Plantas Vasculares de la Península Ibérica, e Islas Baleares, Volume II; Real Jardín Botánico, C.S.I.C.: Madrid, Spain, 1990. [Google Scholar]
- AOAC Association of Official Analytical Chemists. Official Methods of Analysis of AOAC International, 19th ed.; AOAC International: Washington, DC, USA, 2012. [Google Scholar]
- Cruz de Carvalho, R.; Feijão, E.; Kletschkus, E.; Marques, J.C.; Reis-Santos, P.; Fonseca, V.F.; Papenbrock, J.; Caçador, I.; Duarte, B. Halophyte bio-optical phenotyping: A multivariate photochemical pressure index (Multi-PPI) to classify salt marsh anthropogenic pressures levels. Ecol. Indic. 2020, 119, 106816. [Google Scholar] [CrossRef]
- Sghaier, D.B.; Pedro, S.; Diniz, M.S.; Duarte, B.; Caçador, I.; Sleimi, N. Tissue localization and distribution of as and al in the halophyte Tamarix gallica under controlled conditions. Front. Mar. Sci. 2016, 3, 274. [Google Scholar] [CrossRef] [Green Version]
- Towett, E.K.; Shepherd, K.D.; Cadisch, G. Quantification of total element concentrations in soils using total X-ray fluorescence spectroscopy (TXRF). Sci. Total Environ. 2013, 463–464, 374–388. [Google Scholar] [CrossRef] [PubMed] [Green Version]
- Castello, G. Retention index systems: Alternatives to the n-alkanes as calibration standards. J. Chromatogr. A 1999, 842, 51–64. [Google Scholar] [CrossRef]
- Van Den Dool, H.; Kratz, P.D. A Generalization of the Retention Index System including Linear Temperature Programmed Gas-Liquid Partition Chromatography. J. Chromatogr. 1963, 11, 463–471. [Google Scholar] [CrossRef]
- Swain, T.; Hillis, W.E. The phenolic constituents of Prunus domestica. I.—The quantitative analysis of phenolic constituents. J. Sci. Food Agric. 1959, 10, 63–68. [Google Scholar] [CrossRef]
- Singleton, V.L.; Rossi, J.A. Colorimetry of Total Phenolics with Phosphomolybdic-Phosphotungstic Acid Reagents. Am. J. Enol. Vitic. 1965, 16, 144–158. [Google Scholar]
- Huang, D.; Ou, B.; Hampsch-Woodill, M.; Flanagan, J.A.; Prior, R.L. High-throughput assay of oxygen radical absorbance capacity (ORAC) using a multichannel liquid handling system coupled with a microplate fluorescence reader in 96-well format. J. Agric. Food Chem. 2002, 50, 4437–4444. [Google Scholar] [CrossRef]
- Serra, A.T.; Duarte, R.O.; Bronze, M.R.; Duarte, C.M.M. Identification of bioactive response in traditional cherries from Portugal. Food Chem. 2011, 125, 318–325. [Google Scholar] [CrossRef]
- Moore, J.; Yin, J.J.; Yu, L. Novel fluorometric assay for hydroxyl radical scavenging capacity (HOSC) estimation. J. Agric. Food Chem. 2006, 54, 617–626. [Google Scholar] [CrossRef]
- Pereira, L.P.; Silva, P.; Duarte, M.; Rodrigues, L.; Duarte, C.M.M.; Albuquerque, C.; Serra, A.T. Targeting colorectal cancer proliferation, stemness and metastatic potential using Brassicaceae extracts enriched in isothiocyanates: A 3D cell model-based study. Nutrients 2017, 9, 368. [Google Scholar] [CrossRef]
- Oliveira-Alves, S.C.; Pereira, R.S.; Pereira, A.B.; Ferreira, A.; Mecha, E.; Silva, A.B.; Serra, A.T.; Bronze, M.R. Identification of functional compounds in baru (Dipteryx alata Vog.) nuts: Nutritional value, volatile and phenolic composition, antioxidant activity and antiproliferative effect. Food Res. Int. 2020, 131, 109026. [Google Scholar] [CrossRef]
- Castañeda-Loaiza, V.; Placines, C.; Rodrigues, M.J.; Pereira, C.; Zengin, G.; Uysal, A.; Jeko, J.; Cziáky, Z.; Reis, C.P.; Gaspar, M.M.; et al. If you cannot beat them, join them: Exploring the fruits of the invasive species Carpobrotus edulis (L.) N.E. Br as a source of bioactive products. Ind. Crops Prod. 2020, 144, 112005. [Google Scholar] [CrossRef]
- Garcia-Amezquita, L.E.; Tejada-Ortigoza, V.; Campanella, O.H.; Welti-Chanes, J. Influence of Drying Method on the Composition, Physicochemical Properties, and Prebiotic Potential of Dietary Fibre Concentrates from Fruit Peels. J. Food Qual. 2018, 2018, 9105237. [Google Scholar] [CrossRef] [Green Version]
- Nireesha, G.R.; Divya, L.; Sowmya, C.; Venkateshan, N.; Niranjan Babu, M.; Lavakumar, V. Lyophilization/Freeze Drying—An Review. Int. J. Novel Trends Pharm. Sci. 2013, 3, 87–98. [Google Scholar]
- Zhang, J.; Zhou, D.; Zhong, X.; Pei, Z.; Tian, Y.; Xiang, D.; Cao, J.; Shen, X.; Li, C. Quality and protein degradation of golden pompano (Trachinotus blochii) fillets during four drying methods. LWT 2020, 130, 109638. [Google Scholar] [CrossRef]
- Alakali, J.S.; Kucha, C.T.; Rabiu, I.A. Effect of drying temperature on the nutritional quality of Moringa oleifera leaves. Afr. J. Food Sci. 2015, 9, 395–399. [Google Scholar] [CrossRef] [Green Version]
- Siriwattananon, L.; Maneerate, J. Effect of drying methods on dietary fiber content in dried fruit and vegetable from non-toxic agricultural field. Int. J. GEOMATE 2016, 11, 2896–2900. [Google Scholar] [CrossRef]
- Tejada-Ortigoza, V.; García-Amezquita, L.E.; Serna-Saldívar, S.O.; Welti-Chanes, J. The dietary fiber profile of fruit peels and functionality modifications induced by high hydrostatic pressure treatments. Food Sci. Technol. Int. 2017, 23, 396–402. [Google Scholar] [CrossRef]
- Ventura, Y.; Wuddineh, W.A.; Myrzabayeva, M.; Alikulov, Z.; Khozin-Goldberg, I.; Shpigel, M.; Samocha, T.M.; Sagi, M. Effect of seawater concentration on the productivity and nutritional value of annual Salicornia and perennial Sarcocornia halophytes as leafy vegetable crops. Sci. Hortic. 2011, 128, 189–196. [Google Scholar] [CrossRef]
- Guil, J.L.; Torija, M.E.; Giménez, J.J.; Rodríguez, I. Identification of fatty acids in edible wild plants by gas chromatography. J. Chromatogr. A 1996, 719, 229–235. [Google Scholar] [CrossRef]
- Zárate, R.; Jaber-Vazdekis, N.; Tejera, N.; Pérez, J.A.; Rodríguez, C. Significance of long chain polyunsaturated fatty acids in human health. Clin. Transl. Med. 2017, 6, 25. [Google Scholar] [CrossRef] [Green Version]
- Isca, V.M.S.; Seca, A.M.L.; Pinto, D.C.G.A.; Silva, H.; Silva, A.M.S. Lipophilic profile of the edible halophyte Salicornia ramosissima. Food Chem. 2014, 165, 330–336. [Google Scholar] [CrossRef] [PubMed] [Green Version]
- Martínez-Yusta, A.; Goicoechea, E.; Guillén, M.D. A Review of Thermo-Oxidative Degradation of Food Lipids Studied by 1H NMR Spectroscopy: Influence of Degradative Conditions and Food Lipid Nature. Compr. Rev. Food Sci. Food Saf. 2014, 13, 838–859. [Google Scholar] [CrossRef]
- Rodríguez-Ramos, F.; Leiva-Portilla, D.; Rodríguez-Núñez, K.; Pacheco, P.; Briones-Labarca, V. Mathematical modeling and quality parameters of Salicornia fruticosa dried by convective drying. J. Food Sci. Technol. 2021, 58, 474–483. [Google Scholar] [CrossRef]
- Sharma, A.; Gontia, I.; Agarwal, P.K.; Jha, B. Accumulation of heavy metals and its biochemical responses in Salicornia brachiata, an extreme halophyte. Mar. Biol. Res. 2010, 6, 511–518. [Google Scholar] [CrossRef]
- Delort, E.; Jaquier, A.; Chapuis, C.; Rubin, M.; Starkenmann, C. Volatile composition of oyster leaf (Mertensia maritima (L.) Gray). J. Agric. Food Chem. 2012, 60, 11681–11690. [Google Scholar] [CrossRef]
- Sugisawa, H.; Nakamura, K.; Tamura, H. The aroma profile of the volatiles in marine green algae (ulva pertusa). Food Rev. Int. 1990, 6, 573–589. [Google Scholar] [CrossRef]
- Aparicio, R.; Morales, M.T. Characterization of Olive Ripeness by Green Aroma Compounds of Virgin Olive Oil. J. Agric. Food Chem. 1998, 46, 1116–1122. [Google Scholar] [CrossRef]
- Lykomitros, D.; Fogliano, V.; Capuano, E. Flavor of roasted peanuts (Arachis hypogaea)—Part II: Correlation of volatile compounds to sensory characteristics. Food Res. Int. 2016, 89, 870–881. [Google Scholar] [CrossRef]
- Sánchez-García, F.; Mirzayeva, A.; Roldán, A.; Castro, R.; Palacios, V.; García-Barroso, C.; Durán-Guerrero, E. Evolution of volatile compounds and sensory characteristics of edible green seaweed (Ulva rigida) during storage at different temperatures. J. Sci. Food Agric. 2019, 99, 5475–5482. [Google Scholar] [CrossRef]
- Wang, Y.; Finn, C.; Qian, M.C. Impact of growing environment on Chickasaw blackberry (Rubus L) aroma evaluated by gas chromatography olfactometry dilution analysis. J. Agric. Food Chem. 2005, 53, 3563–3571. [Google Scholar] [CrossRef] [PubMed]
- Varlet, V.; Knockaert, C.; Prost, C.; Serot, T. Comparison of odor-active volatile compounds of fresh and smoked salmon. J. Agric. Food Chem. 2006, 54, 3391–3401. [Google Scholar] [CrossRef] [PubMed]
- Aisala, H.; Sola, J.; Hopia, A.; Linderborg, K.M.; Sandell, M. Odor-contributing volatile compounds of wild edible Nordic mushrooms analyzed with HS–SPME–GC–MS and HS–SPME–GC–O/FID. Food Chem. 2019, 283, 566–578. [Google Scholar] [CrossRef]
- Choi, H.S. Characteristic odor components of kumquat (Fortunella japonica Swingle) peel oil. J. Agric. Food Chem. 2005, 53, 1642–1647. [Google Scholar] [CrossRef]
- Tu, N.T.M.; Onishi, Y.; Choi, H.S.; Kondo, Y.; Bassore, S.M.; Ukeda, H.; Sawamura, M. Characteristic odor components of Citrus sphaerocarpa Tanaka (Kabosu) cold-pressed peel oil. J. Agric. Food Chem. 2002, 50, 2908–2913. [Google Scholar] [CrossRef]
- Jirovetz, L.; Buchbauer, G.; Denkova, Z.; Slavchev, A.; Stoyanova, A.; Schmidt, E. Chemical composition, antimicrobial activities and odor descriptions of various Salvia sp. and Thuja sp. essential oils. Nutrition-Vienna 2006, 30, 152. [Google Scholar]
- Niu, Y.; Wang, P.; Xiao, Q.; Xiao, Z.; Mao, H.; Zhang, J. Characterization of odor-active volatiles and odor contribution based on binary interaction effects in mango and vodka cocktail. Molecules 2020, 25, 1083. [Google Scholar] [CrossRef] [Green Version]
- Keskin, M.; Özkök, A. Effects of drying techniques on chemical composition and volatile constituents of bee pollen. Czech J. Food Sci. 2020, 38, 203–208. [Google Scholar] [CrossRef]
- Alasalvar, C.; Shahidi, F.; Cadwallader, K.R. Comparison of natural and roasted Turkish Tombul hazelnut (Corylus avellana L.) volatiles and flavor by DHA/GC/MS and descriptive sensory analysis. J. Agric. Food Chem. 2003, 51, 5067–5072. [Google Scholar] [CrossRef]
- Poisson, L.; Blank, I.; Dunkel, A.; Hofmann, T. The Chemistry of Roasting—Decoding Flavor Formation. In The Craft and Science of Coffee; Academic Press: Cambridge, MA, USA, 2017; pp. 273–309. [Google Scholar] [CrossRef]
- de Torres, C.; Díaz-Maroto, M.C.; Hermosín-Gutiérrez, I.; Pérez-Coello, M.S. Effect of freeze-drying and oven-drying on volatiles and phenolics composition of grape skin. Anal. Chim. Acta 2010, 660, 177–182. [Google Scholar] [CrossRef] [PubMed]
- Özkan-Karabacak, A.; Özcan-Sinir, G.; Utku Çopur, Ö. Effects of Drying Methods on the Composition of Volatile Compounds in Fruits and Vegetables; Verlag der Technischen Universität Graz: Graz, Austria, 2018. [Google Scholar] [CrossRef]
- Renna, M.; Gonnella, M. The use of the sea fennel as a new spice-colorant in culinary preparations. Int. J. Gastron. Food Sci. 2012, 1, 111–115. [Google Scholar] [CrossRef] [Green Version]
- Giungato, P.; Renna, M.; Rana, R.; Licen, S.; Barbieri, P. Characterization of dried and freeze-dried sea fennel (Crithmum maritimum L.) samples with headspace gas-chromatography/mass spectrometry and evaluation of an electronic nose discrimination potential. Food Res. Int. 2019, 115, 65–72. [Google Scholar] [CrossRef]
- Oliveira-Alves, S.C.; Vendramini-Costa, D.B.; Betim Cazarin, C.B.; Maróstica Júnior, M.R.; Borges Ferreira, J.P.; Silva, A.B.; Prado, M.A.; Bronze, M.R. Characterization of phenolic compounds in chia (Salvia hispanica L.) seeds, fiber flour and oil. Food Chem. 2017, 232, 295–305. [Google Scholar] [CrossRef]
- Spínola, V.; Pinto, J.; Castilho, P.C. Identification and quantification of phenolic compounds of selected fruits from Madeira Island by HPLC-DAD-ESI-MSn and screening for their antioxidant activity. Food Chem. 2015, 173, 14–30. [Google Scholar] [CrossRef] [PubMed]
- Sánchez-Salcedo, E.M.; Tassotti, M.; Del Rio, D.; Hernández, F.; Martínez, J.J.; Mena, P. (Poly)phenolic fingerprint and chemometric analysis of white (Morus alba L.) and black (Morus nigra L.) mulberry leaves by using a non-targeted UHPLC-MS approach. Food Chem. 2016, 212, 250–255. [Google Scholar] [CrossRef]
- Kelebek, H.; Sevindik, O.; Selli, S. LC-DAD-ESI-MS/MS-based phenolic profiling of St John’s Wort Teas and their antioxidant activity: Eliciting infusion induced changes. J. Liq. Chromatogr. Relat. Technol. 2019, 42, 9–15. [Google Scholar] [CrossRef]
- Zwyrzykowska, A.; Kupczyński, R.; Jarosz, B.; Szumny, A.; Kucharska, A.Z. Qualitative and quantitative analysis of polyphenolic compounds in Ilex Sp. Open Chem. 2015, 13, 1303–1312. [Google Scholar] [CrossRef] [Green Version]
- Gonthier, M.P.; Verny, M.A.; Besson, C.; Rémésy, C.; Scalbert, A. Chlorogenic acid bioavailability largely depends on its metabolism by the gut microflora in rats. J. Nutr. 2003, 133, 1853–1859. [Google Scholar] [CrossRef] [Green Version]
- David, M.; Antos, S.; Lmeida, C.A.; Opes, N.P.L.; Emília, G.; Ouza, P.D.S. Evaluation of the Anti-inflammatory, Analgesic and Antipyretic Activities of the Natural Polyphenol Chlorogenic Acid. Biol. Pharm. Bull. 2006, 29, 2236–2240. [Google Scholar]
- Naveed, M.; Hejazi, V.; Abbas, M.; Kamboh, A.A.; Khan, G.J.; Shumzaid, M.; Ahmad, F.; Babazadeh, D.; FangFang, X.; Modarresi-Ghazani, F.; et al. Chlorogenic acid (CGA): A pharmacological review and call for further research. Biomed. Pharmacother. 2018, 97, 67–74. [Google Scholar] [CrossRef] [PubMed]
- Lu, H.; Tian, Z.; Cui, Y.; Liu, Z.; Ma, X. Chlorogenic acid: A comprehensive review of the dietary sources, processing effects, bioavailability, beneficial properties, mechanisms of action, and future directions. Compr. Rev. Food Sci. Food Saf. 2020, 19, 3130–3158. [Google Scholar] [CrossRef]
- Alves-Silva, J.M.; Guerra, I.; Gonçalves, M.J.; Cavaleiro, C.; Cruz, M.T.; Figueirinha, A.; Salgueiro, L. Chemical composition of Crithmum maritimum L. essential oil and hydrodistillation residual water by GC-MS and HPLC-DAD-MS/MS, and their biological activities. Ind. Crops Prod. 2020, 149, 112329. [Google Scholar] [CrossRef]
- Mishima, S.; Yoshida, C.; Akino, S.; Sakamoto, T. Antihypertensive effects of Brazilian propolis: Identification of caffeoylquinic acids as constituents involved in the hypotension in spontaneously hypertensive rats. Biol. Pharm. Bull. 2005, 28, 1909–1914. [Google Scholar] [CrossRef] [PubMed] [Green Version]
- Simeonova, R.; Vitcheva, V.; Zheleva-Dimitrova, D.; Balabanova, V.; Savov, I.; Yagi, S.; Dimitrova, B.; Voynikov, Y.; Gevrenova, R. Trans-3,5-dicaffeoylquinic acid from Geigeria alata Benth. & Hook.f. ex Oliv. & Hiern with beneficial effects on experimental diabetes in animal model of essential hypertension. Food Chem. Toxicol. 2019, 132, 110678. [Google Scholar] [CrossRef]
- Yin, X.L.; Xu, B.Q.; Zhang, Y.Q. Gynura divaricata rich in 3, 5-/4, 5-dicaffeoylquinic acid and chlorogenic acid reduces islet cell apoptosis and improves pancreatic function in type 2 diabetic mice. Nutr. Metab. 2018, 15, 73. [Google Scholar] [CrossRef]
- Ayouaz, S.; Oliveira-Alves, S.C.; Lefsih, K.; Serra, A.T.; Bento Da Silva, A.; Samah, M.; Karczewski, J.; Madani, K.; Bronze, M.R. Phenolic compounds from Nerium oleander leaves: Microwave assisted extraction, characterization, antiproliferative and cytotoxic activities. Food Funct. 2020, 11, 6319–6331. [Google Scholar] [CrossRef]
- Lin, L.Z.; Harnly, J.M. A screening method for the identification of glycosylated flavonoids and other phenolic compounds using a standard analytical approach for all plant materials. J. Agric. Food Chem. 2007, 55, 1084–1096. [Google Scholar] [CrossRef] [Green Version]
- Njenga, P.K.; Mugo, S.M.; Zhou, T. Characterization of Polyphenols, Flavonoids and Their Anti-microbial Activity in the Fruits of Vangueria madagascariensis J. F. Gmel. Eur. J. Med. Plants 2020, 31, 24–37. [Google Scholar] [CrossRef]
- Iacopini, P.; Baldi, M.; Storchi, P.; Sebastiani, L. Catechin, epicatechin, quercetin, rutin and resveratrol in red grape: Content, in vitro antioxidant activity and interactions. J. Food Compos. Anal. 2008, 21, 589–598. [Google Scholar] [CrossRef]
- Wang, W.; Sun, C.; Mao, L.; Ma, P.; Liu, F.; Yang, J.; Gao, Y. The biological activities, chemical stability, metabolism and delivery systems of quercetin: A review. Trends Food Sci. Technol. 2016, 56, 21–38. [Google Scholar] [CrossRef]
- Mata, A.; Ferreira, J.P.; Semedo, C.; Serra, T.; Duarte, C.M.M.; Bronze, M.R. Contribution to the characterization of Opuntia spp. juices by LC-DAD-ESI-MS/MS. Food Chem. 2016, 210, 558–565. [Google Scholar] [CrossRef]
- Vallverdú-Queralt, A.; Jáuregui, O.; Medina-Remón, A.; Andrés-Lacueva, C.; Lamuela-Raventós, R.M. Improved characterization of tomato polyphenols using liquid chromatography/electrospray ionization linear ion trap quadrupole Orbitrap mass spectrometry and liquid chromatography/electrospray ionization tandem mass spectrometry. Rapid Commun. Mass Spectrom. 2010, 24, 2986–2992. [Google Scholar] [CrossRef] [PubMed]
- Hossain, M.B.; Rai, D.K.; Brunton, N.P.; Martin-Diana, A.B.; Barry-Ryan, A.C. Characterization of phenolic composition in lamiaceae spices by LC-ESI-MS/MS. J. Agric. Food Chem. 2010, 58, 10576–10581. [Google Scholar] [CrossRef]
- Nabet, N.; Gilbert-López, B.; Madani, K.; Herrero, M.; Ibáñez, E.; Mendiola, J.A. Optimization of microwave-assisted extraction recovery of bioactive compounds from Origanum glandulosum and Thymus fontanesii. Ind. Crops Prod. 2019, 129, 395–404. [Google Scholar] [CrossRef]
- Wilbert, S.M.; Ericsson, L.H.; Gordon, M.P. Quantification of jasmonic acid, methyl jasmonate, and salicylic acid in plants by capillary liquid chromatography electrospray tandem mass spectrometry. Anal. Biochem. 1998, 257, 186–194. [Google Scholar] [CrossRef]
- Fang, N.; Yu, S.; Prior, R.L. LC/MS/MS characterization of phenolic constituents in dried plums. J. Agric. Food Chem. 2002, 50, 3579–3585. [Google Scholar] [CrossRef]
- Ye, M.; Yang, W.Z.; Liu, K.D.; Qiao, X.; Li, B.J.; Cheng, J.; Feng, J.; Guo, D.A.; Zhao, Y.Y. Characterization of flavonoids in Millettia nitida var. hirsutissima by HPLC/DAD/ESI-MSn. J. Pharm. Anal. 2012, 2, 35–42. [Google Scholar] [CrossRef] [PubMed] [Green Version]
- Chandrasekara, A.; Shahidi, F. Determination of antioxidant activity in free and hydrolyzed fractions of millet grains and characterization of their phenolic profiles by HPLC-DAD-ESI-MSn. J. Funct. Foods 2011, 3, 144–158. [Google Scholar] [CrossRef]
- Barros, L.; Dueñas, M.; Carvalho, A.M.; Ferreira, I.C.F.R.; Santos-Buelga, C. Characterization of phenolic compounds in flowers of wild medicinal plants from Northeastern Portugal. Food Chem. Toxicol. 2012, 50, 1576–1582. [Google Scholar] [CrossRef] [Green Version]
- Nabet, N.; Boudries, H.; Chougui, N.; Loupassaki, S.; Souagui, S.; Burló, F.; Hernández, F.; Carbonell-Barrachina, Á.A.; Madani, K.; Larbat, R. Biological activities and secondary compound composition from Crithmum maritimum aerial parts. Int. J. Food Prop. 2017, 20, 1843–1855. [Google Scholar] [CrossRef] [Green Version]
- Kang, J.; Price, W.E.; Ashton, J.; Tapsell, L.C.; Johnson, S. Identification and characterization of phenolic compounds in hydromethanolic extracts of sorghum wholegrains by LC-ESI-MSn. Food Chem. 2016, 211, 215–226. [Google Scholar] [CrossRef] [PubMed] [Green Version]
- Engels, C.; Gräter, D.; Esquivel, P.; Jiménez, V.M.; Gänzle, M.G.; Schieber, A. Characterization of phenolic compounds in jocote (Spondias purpurea L.) peels by ultra high-performance liquid chromatography/electrospray ionization mass spectrometry. Food Res. Int. 2012, 46, 557–562. [Google Scholar] [CrossRef]
- Pellati, F.; Orlandini, G.; Pinetti, D.; Benvenuti, S. HPLC-DAD and HPLC-ESI-MS/MS methods for metabolite profiling of propolis extracts. J. Pharm. Biomed. Anal. 2011, 55, 934–948. [Google Scholar] [CrossRef] [PubMed]
- Xu, X.; Pu, R.; Li, Y.; Wu, Z.; Li, C.; Miao, X.; Yang, W. Chemical Compositions of Propolis from China and the United States and their Antimicrobial Activities Against Penicillium notatum. Molecules 2019, 24, 3576. [Google Scholar] [CrossRef] [PubMed] [Green Version]
- Falcão, S.I.; Vilas-Boas, M.; Estevinho, L.M.; Barros, C.; Domingues, M.R.M.; Cardoso, S.M. Phenolic characterization of Northeast Portuguese propolis: Usual and unusual compounds. Anal. Bioanal. Chem. 2010, 396, 887–897. [Google Scholar] [CrossRef] [Green Version]
- Ziani, B.E.C.; Barros, L.; Boumehira, A.Z.; Bachari, K.; Heleno, S.A.; Alves, M.J.; Ferreira, I.C.F.R. Profiling polyphenol composition by HPLC-DAD-ESI/MSn and the antibacterial activity of infusion preparations obtained from four medicinal plants. Food Funct. 2018, 9, 149–159. [Google Scholar] [CrossRef] [Green Version]
- Simirgiotis, M.; Schmeda-Hirschmann, G.; Bórquez, J.; Kennelly, E. The Passiflora tripartita (Banana Passion) Fruit: A Source of Bioactive Flavonoid C-Glycosides Isolated by HSCCC and Characterized by HPLC–DAD–ESI/MS/MS. Molecules 2013, 18, 1672–1692. [Google Scholar] [CrossRef]
- Llorach, R.; Gil-Izquierdo, A.; Ferreres, F.; Tomás-Barberán, F.A. HPLC-DAD-MS/MS ESI characterization of unusual highly glycosylated acylated flavonoids from cauliflower (Brassica oleracea L. var. botrytis) agroindustrial byproducts. J. Agric. Food Chem. 2003, 51, 3895–3899. [Google Scholar] [CrossRef]
- Guerreiro, A.; Rassal, C.; Afonso, C.M.; Galego, L.; Serra, M.; Rodrigues, M.A. Healthy, Tasty and Sustainable Mediterranean Food. UMAMI Taste and Polyphenols of Twiggy Glasswort (Salicornia ramosissima). In INCREaSE; Springer International Publishing: Berlin/Heidelberg, Germany, 2018; pp. 191–198. [Google Scholar]
- Kim, J.Y.; Cho, J.Y.; Ma, Y.K.; Park, K.Y.; Lee, S.H.; Ham, K.S.; Lee, H.J.; Park, K.H.; Moon, J.H. Dicaffeoylquinic acid derivatives and flavonoid glucosides from glasswort (Salicornia herbacea L.) and their antioxidative activity. Food Chem. 2011, 125, 55–62. [Google Scholar] [CrossRef]
- Kim, K.S. Isolation and Identification of Antioxidant Flavonoids from Salicornia herbacea L. Appl. Biol. Chem. 2004, 47, 120–123. [Google Scholar]
- Joardder, M.U.H.; Karim, A.; Kumar, C.; Brown, R.J. Porosity—Stablishing the Relationship between Drying Parameters and Dried Food Quality; SpringerBriefs in Food, Health and Nutrition; Springer International Publishing: Cham, Switzerland, 2016; ISBN 978-3-319-23044-3. [Google Scholar]
- Çoklar, H.; Akbulut, M. Effect of Sun, Oven and Freeze-Drying on Anthocyanins, Phenolic Compounds and Antioxidant Activity of Black Grape (Ekşikara) (Vitis vinifera L.). S. Afr. J. Enol. Vitic. 2017, 38, 264–272. [Google Scholar] [CrossRef] [Green Version]
- Belščak-Cvitanović, A.; Durgo, K.; Huđek, A.; Bačun-Družina, V.; Komes, D. Overview of polyphenols and their properties. In Polyphenols: Properties, Recovery, and Applications; Woodhead Publishing: Cambridge, UK, 2018; pp. 3–44. [Google Scholar] [CrossRef]
- Chua, L.Y.W.; Chong, C.H.; Chua, B.L.; Figiel, A. Influence of Drying Methods on the Antibacterial, Antioxidant and Essential Oil Volatile Composition of Herbs: A Review. Food Bioprocess Technol. 2019, 12, 450–476. [Google Scholar] [CrossRef]
- Thamkaew, G.; Sjöholm, I.; Galindo, F.G. A review of drying methods for improving the quality of dried herbs. Crit. Rev. Food Sci. Nutr. 2021, 61, 1763–1786. [Google Scholar] [CrossRef]
- Madrau, M.A.; Piscopo, A.; Sanguinetti, A.M.; Del Caro, A.; Poiana, M.; Romeo, F.V.; Piga, A. Effect of drying temperature on polyphenolic content and antioxidant activity of apricots. Eur. Food Res. Technol. 2009, 228, 441–448. [Google Scholar] [CrossRef] [Green Version]
- Mogol, B.A.; Yildirim, A.; Gökmen, V. Inhibition of enzymatic browning in actual food systems by the Maillard reaction products. J. Sci. Food Agric. 2010, 90, 2556–2562. [Google Scholar] [CrossRef]
- McSweeney, M.; Seetharaman, K. State of Polyphenols in the Drying Process of Fruits and Vegetables. Crit. Rev. Food Sci. Nutr. 2015, 55, 660–669. [Google Scholar] [CrossRef] [PubMed]
- Piga, A.; Del Caro, A.; Corda, G. From plums to prunes: Influence of drying parameters on polyphenols and antioxidant activity. J. Agric. Food Chem. 2003, 51, 3675–3681. [Google Scholar] [CrossRef] [PubMed]
- Isabelle, M.; Lee, B.L.; Lim, M.T.; Koh, W.P.; Huang, D.; Ong, C.N. Antioxidant activity and profiles of common vegetables in Singapore. Food Chem. 2010, 120, 993–1003. [Google Scholar] [CrossRef]
- Rababah, T.M.; Ereifej, K.I.; Esoh, R.B.; Al-u’datt, M.H.; Alrababah, M.A.; Yang, W. Antioxidant activities, total phenolics and HPLC analyses of the phenolic compounds of extracts from common Mediterranean plants. Nat. Prod. Res. 2011, 25, 596–605. [Google Scholar] [CrossRef]
- Cristina, C.; Lucia, P.; Sara, S.; Francesco, S.; Nobile Matteo Alessandro, D.; Amalia, C. Study of the Efficacy of Two Extraction Techniques from Crithmum maritimum and Salicornia europaea. J. Food Nutr. Res. 2018, 6, 456–463. [Google Scholar] [CrossRef]
- Banjarnahor, S.D.S.; Artanti, N. Antioxidant properties of flavonoids. Med. J. Indones. 2014, 23, 239–244. [Google Scholar] [CrossRef] [Green Version]
- Rice-Evans, C.A.; Miller, N.J.; Paganga, G. Structure-antioxidant activity relationships of flavonoids and phenolic acids. Free Radic. Biol. Med. 1996, 20, 933–956. [Google Scholar] [CrossRef]
- Kyi, T.M.; Daud, W.R.W.; Mohammad, A.B.; Wahid Samsudin, M.; Kadhum, A.A.H.; Talib, M.Z.M. The kinetics of polyphenol degradation during the drying of Malaysian cocoa beans. Int. J. Food Sci. Technol. 2005, 40, 323–331. [Google Scholar] [CrossRef]
- Santos, M.C.; Toson, N.S.B.; Pimentel, M.C.B.; Bordignon, S.A.L.; Mendez, A.S.L.; Henriques, A.T. Polyphenols composition from leaves of Cuphea spp. and inhibitor potential, in vitro, of angiotensin I-converting enzyme (ACE). J. Ethnopharmacol. 2020, 255, 112781. [Google Scholar] [CrossRef]
- Ra, J.E.; Woo, S.Y.; Jin, H.; Lee, M.J.; Kim, H.Y.; Ham, H.; Chung, I.M.; Seo, W.D. Evaluation of antihypertensive polyphenols of barley (Hordeum vulgare L.) seedlings via their effects on angiotensin-converting enzyme (ACE) inhibition. Appl. Biol. Chem. 2020, 63, 38. [Google Scholar] [CrossRef]
- Nileeka Balasuriya, B.W.; Vasantha Rupasinghe, H.P. Plant flavonoids as angiotensin converting enzyme inhibitors in regulation of hypertension. Funct. Foods Health Dis. 2011, 1, 172–188. [Google Scholar] [CrossRef]
- Balasuriya, N.; Rupasinghe, H.P.V. Antihypertensive properties of flavonoid-rich apple peel extract. Food Chem. 2012, 135, 2320–2325. [Google Scholar] [CrossRef]
- Murakami, A.; Ashida, H.; Terao, J. Multitargeted cancer prevention by quercetin. Cancer Lett. 2008, 269, 315–325. [Google Scholar] [CrossRef]
- Murad, L.D.; Soares, N.D.C.P.; Brand, C.; Monteiro, M.C.; Teodoro, A.J. Effects of caffeic and 5-caffeoylquinic acids on cell viability and cellular uptake in human colon adenocarcinoma cells. Nutr. Cancer 2015, 67, 532–542. [Google Scholar] [CrossRef]
- Glei, M.; Kirmse, A.; Habermann, N.; Persin, C.; Pool-Zobel, B.L. Bread enriched with green coffee extract has chemoprotective and antigenotoxic activities in human cells. Nutr. Cancer 2006, 56, 182–192. [Google Scholar] [CrossRef]
- Bhullar, K.S.; Lassalle-Claux, G.; Touaibia, M.; Vasantha Rupasinghe, H.P. Antihypertensive effect of caffeic acid and its analogs through dual renin-angiotensin-aldosterone system inhibition. Eur. J. Pharmacol. 2014, 730, 125–132. [Google Scholar] [CrossRef] [PubMed]
- Wang, W.; Li, J.; Zhang, H.; Wang, X.; Fan, J.; Zhang, X. Phenolic compounds and bioactivity evaluation of aqueous and methanol extracts of Allium mongolicum Regel. Food Sci. Nutr. 2019, 7, 779–787. [Google Scholar] [CrossRef] [PubMed] [Green Version]
- Kang, S.; Kim, D.; Lee, B.H.; Kim, M.R.; Hong, J.; Chiang, M. Antioxidant properties and cytotoxic effects of fractions from glasswort (Salicornia herbacea) seed extracts on human intestinal cells. Food Sci. Biotechnol. 2011, 20, 115–122. [Google Scholar] [CrossRef]
- Jung, B.M.; Park, J.A.; Bae, S.J. Growth inhibitory and quinone reductase induction activities of Salicornia herbacea L. fractions on human cancer cell lines in vitro. J. Korean Soc. Food Sci. Nutr. 2008, 37, 148–153. [Google Scholar] [CrossRef]
- Mamadalieva, N.Z.; Herrmann, F.; El-Readi, M.Z.; Tahrani, A.; Hamoud, R.; Egamberdieva, D.R.; Azimova, S.S.; Wink, M. Flavonoids in Scutellaria immaculata and S. ramosissima (Lamiaceae) and their biological activity. J. Pharm. Pharmacol. 2011, 63, 1346–1357. [Google Scholar] [CrossRef] [PubMed]
- Sharifi, A.M.; Darabi, R.; Akbarloo, N. Study of antihypertensive mechanism of Tribulus terrestris in 2K1C hypertensive rats: Role of tissue ACE activity. Life Sci. 2003, 73, 2963–2971. [Google Scholar] [CrossRef] [PubMed]
- Bankar, G.R.; Nayak, P.G.; Bansal, P.; Paul, P.; Pai, K.S.R.; Singla, R.K.; Bhat, V.G. Vasorelaxant and antihypertensive effect of Cocos nucifera Linn. endocarp on isolated rat thoracic aorta and DOCA salt-induced hypertensive rats. J. Ethnopharmacol. 2011, 134, 50–54. [Google Scholar] [CrossRef] [PubMed]
- Cho, J.Y.; Park, K.H.; Hwang, D.Y.; Chanmuang, S.; Jaiswal, L.; Park, Y.K.; Park, S.Y.; Kim, S.Y.; Kim, H.R.; Moon, J.H.; et al. Antihypertensive effects of Artemisia scoparia waldst in spontaneously hypertensive rats and identification of angiotensin I converting enzyme inhibitors. Molecules 2015, 20, 19789–19804. [Google Scholar] [CrossRef] [Green Version]
- Ksouri, R.; Ksouri, W.M.; Jallali, I.; Debez, A.; Magné, C.; Hiroko, I.; Abdelly, C. Medicinal halophytes: Potent source of health promoting biomolecules with medical, nutraceutical and food applications. Crit. Rev. Biotechnol. 2012, 32, 289–326. [Google Scholar] [CrossRef]
- Phillips, O.A.; Mathew, K.T.; Oriowo, M.A. Antihypertensive and vasodilator effects of methanolic and aqueous extracts of Tribulus terrestris in rats. J. Ethnopharmacol. 2006, 104, 351–355. [Google Scholar] [CrossRef] [PubMed]
- Jordán, M.J.; Tandon, K.; Shaw, P.E.; Goodner, K.L. Aromatic profile of aqueous banana essence and banana fruit by gas chromatography-mass spectrometry (GC-MS) and gas chromatography-olfactometry (GC-O). J. Agric. Food Chem. 2001, 49, 4813–4817. [Google Scholar] [CrossRef] [PubMed]
- Sampaio, T.S.; Nogueira, P.C.L. Volatile components of mangaba fruit (Hancornia speciosa Gomes) at three stages of maturity. Food Chem. 2006, 95, 606–610. [Google Scholar] [CrossRef]
- Tret’yakov, K.V. Retention Data; NIST Mass Spectrometry Data Center. Available online: https://chemdata.nist.gov/ (accessed on 17 July 2021).
- Baccouri, B.; Temime, S.B.; Campeol, E.; Cioni, P.L.; Daoud, D.; Zarrouk, M. Application of solid-phase microextraction to the analysis of volatile compounds in virgin olive oils from five new cultivars. Food Chem. 2007, 102, 850–856. [Google Scholar] [CrossRef]
- Garruti, D.S.; Franco, M.R.B.; Da Silva, M.A.A.P.; Janzantti, N.S.; Alves, G.L. Assessment of aroma impact compounds in a cashew apple-based alcoholic beverage by GC-MS and GC-olfactometry. LWT Food Sci. Technol. 2006, 39, 373–378. [Google Scholar] [CrossRef]
- Gürbüz, O.; Rouseff, J.M.; Rouseff, R.L. Comparison of aroma volatiles in commercial merlot and Cabernet Sauvignon wines using gas chromatography-olfactometry and gas chromatography-mass spectrometry. J. Agric. Food Chem. 2006, 54, 3990–3996. [Google Scholar] [CrossRef] [PubMed]
- Quijano, C.E.; Linares, D.; Pino, J.A. Changes in volatile compounds of fermented cereza agria [Phyllanthus acidus (L.) Skeels] fruit. Flavour Fragr. J. 2007, 22, 392–394. [Google Scholar] [CrossRef]
- García-Aguilar, L.; Rojas-Molina, A.; Ibarra-Alvarado, C.; Rojas-Molina, J.; Vázquez-Landaverde, P.; Luna-Vázquez, F.; Zavala-Sánchez, M. Nutritional Value and Volatile Compounds of Black Cherry (Prunus serotina) Seeds. Molecules 2015, 20, 3479–3495. [Google Scholar] [CrossRef] [Green Version]
- Selli, S.; Canbas, A.; Varlet, V.; Kelebek, H.; Prost, C.; Serot, T. Characterization of the most odor-active volatiles of orange wine made from a Turkish cv. Kozan (Citrus sinensis L. Osbeck). J. Agric. Food Chem. 2008, 56, 227–234. [Google Scholar] [CrossRef]
- Boulanger, R.; Crouzet, J. Free and bound flavour components of Amazonian fruits: 2. cupuacu volatile compounds. Flavour Fragr. J. 2000, 15, 251–257. [Google Scholar] [CrossRef]
- Aligiannis, N.; Kalpoutzakis, E.; Mitaku, S.; Chinou, I.B. Composition and antimicrobial activity of the essential oils of two Origanum species. J. Agric. Food Chem. 2001, 49, 4168–4170. [Google Scholar] [CrossRef]
- Stashenko, E.E.; Martínez, J.R.; Ruíz, C.A.; Arias, G.; Durán, C.; Salgar, W.; Cala, M. Lippia origanoides chemotype differentiation based on essential oil GC-MS and principal component analysis. J. Sep. Sci. 2010, 33, 93–103. [Google Scholar] [CrossRef] [PubMed]
- Grondin, E.; Shum Cheong Sing, A.; Caro, Y.; de Billerbeck, G.M.; François, J.M.; Petit, T. Physiological and biochemical characteristics of the ethyl tiglate production pathway in the yeast Saprochaete suaveolens. Yeast 2015, 32, 57–66. [Google Scholar] [CrossRef]
- Telci, I.; Demirtas, I.; Sahin, A. Variation in plant properties and essential oil composition of sweet fennel (Foeniculum vulgare Mill.) fruits during stages of maturity. Ind. Crops Prod. 2009, 30, 126–130. [Google Scholar] [CrossRef]
- Javidnia, K.; Miri, R.; Kamalinejad, M.; Sarkarzadeh, H.; Jamalian, A. Chemical composition of the essential oils of Anthemis altissima L. grown in Iran. Flavour Fragr. J. 2004, 19, 213–216. [Google Scholar] [CrossRef]
- Liu, S.; Fan, G.; Yang, L.; Li, F. Highly efficient transformation of Γ-valerolactone to valerate esters over structure-controlled copper/zirconia catalysts prepared via a reduction-oxidation route. Appl. Catal. A Gen. 2017, 543, 180–188. [Google Scholar] [CrossRef]
- Beaulieu, J.C.; Grimm, C.C. Identification of volatile compounds in cantaloupe at various developmental stages using solid phase microextraction. J. Agric. Food Chem. 2001, 49, 1345–1352. [Google Scholar] [CrossRef]
- Selli, S.; Rannou, C.; Prost, C.; Robin, J.; Serot, T. Characterization of aroma-active compounds in rainbow trout (Oncorhynchus mykiss) eliciting an off-odor. J. Agric. Food Chem. 2006, 54, 9496–9502. [Google Scholar] [CrossRef]
- Yi, L.; Dong, N.; Liu, S.; Yi, Z.; Zhang, Y. Chemical features of Pericarpium Citri Reticulatae and Pericarpium Citri Reticulatae Viride revealed by GC-MS metabolomics analysis. Food Chem. 2015, 186, 192–199. [Google Scholar] [CrossRef]
- Ma, R.; Liu, X.; Tian, H.; Han, B.; Li, Y.; Tang, C.; Zhu, K.; Li, C.; Meng, Y. Odor-active volatile compounds profile of triploid rainbow trout with different marketable sizes. Aquac. Rep. 2020, 17, 100312. [Google Scholar] [CrossRef]
- Bryant, R.J.; McClung, A.M. Volatile profiles of aromatic and non-aromatic rice cultivars using SPME/GC-MS. Food Chem. 2011, 124, 501–513. [Google Scholar] [CrossRef]
- Dong, S.Y.; Shewfelt, R.L.; Lee, K.S.; Kays, S.J. Comparison of odor-active compounds from six distinctly different rice flavor types. J. Agric. Food Chem. 2008, 56, 2780–2787. [Google Scholar] [CrossRef]
- Pino, J.; Marbot, R.; Vázquez, C. Volatile Components of the fruits of vangueria madagascariensis J.F.gmel.from Cuba. J. Essent. Oil Res. 2004, 16, 302–304. [Google Scholar] [CrossRef]
- Komes, D.; Ulrich, D.; Lovric, T. Characterization of odor-active compounds in Croatian Rhine Riesling wine, subregion Zagorje. Eur. Food Res. Technol. 2006, 222, 1–7. [Google Scholar] [CrossRef]
- Zeng, Y.X.; Zhao, C.X.; Liang, Y.Z.; Yang, H.; Fang, H.Z.; Yi, L.Z.; Zeng, Z. Da Comparative analysis of volatile components from Clematis species growing in China. Anal. Chim. Acta 2007, 595, 328–339. [Google Scholar] [CrossRef] [PubMed]
- Takagi, S.; Sato, Y.; Kokubun, A.; Inomata, E.; Agatsuma, Y. Odor-active compounds from the gonads of Mesocentrotus nudus sea urchins fed Saccharina japonica kelp. PLoS ONE 2020, 15, e0231673. [Google Scholar] [CrossRef] [PubMed] [Green Version]
- Oliver-Simancas, R.; Muñoz, R.; Díaz-Maroto, M.C.; Pérez-Coello, M.S.; Alañón, M.E. Mango by-products as a natural source of valuable odor-active compounds. J. Sci. Food Agric. 2020, 100, 4688–4695. [Google Scholar] [CrossRef] [PubMed]
- Cardeal, Z.L.; Gomes da Silva, M.D.R.; Marriott, P.J. Comprehensive two-dimensional gas chromatography/mass spectrometric analysis of pepper volatiles. Rapid Commun. Mass Spectrom. 2006, 20, 2823–2836. [Google Scholar] [CrossRef]
- Pino, J.A.; Quijano, C.E. Estudo de compostos voláteis de ameixa (prunus domestica L. cv. horvin) e estimativa da sua contribuição ao aroma. Cienc. Tecnol. Aliment. 2012, 32, 76–83. [Google Scholar] [CrossRef] [Green Version]
- Nezhadali, A.; Shirvan, B.Z. Separation, Identification and Determination of Volatile Compounds of Ziziphora persica Bunge Using HS-SPME/GC-MS. Int. J. Environ. Sci. Dev. 2010, 1, 115–118. [Google Scholar] [CrossRef]
- In, H.C.; Soh, M.L.; Se, Y.K.; Choi, H.K.; Kim, K.O.; Kim, Y.S. Differentiation of aroma characteristics of pine-mushrooms (Tricholoma matsutake Sing.) of different grades using gas chromatography-olfactometry and sensory analysis. J. Agric. Food Chem. 2007, 55, 2323–2328. [Google Scholar] [CrossRef]
- Engel, E.; Baty, C.; Le Corre, D.; Souchon, I.; Martin, N. Flavor-active compounds potentially implicated in cooked cauliflower acceptance. J. Agric. Food Chem. 2002, 50, 6459–6467. [Google Scholar] [CrossRef]
- Purcaro, G.; Tranchida, P.Q.; Jacques, R.A.; Caramão, E.B.; Moret, S.; Conte, L.; Dugo, P.; Dugo, G.; Mondello, L. Characterization of the yerba mate (Ilex paraguariensis) volatile fraction using solid-phase microextraction-comprehensive 2-D GC-MS. J. Sep. Sci. 2009, 32, 3755–3763. [Google Scholar] [CrossRef] [PubMed]
- Klesk, K.; Qian, M. Aroma extract dilution analysis of Cv. Marion (Rubus spp. hyb) and Cv. Evergreen (R. laciniatus L.) blackberries. J. Agric. Food Chem. 2003, 51, 3436–3441. [Google Scholar] [CrossRef] [PubMed]
- Su, M.S.; Chien, P.J. Aroma impact components of rabbiteye blueberry (Vaccinium ashei) vinegars. Food Chem. 2010, 119, 923–928. [Google Scholar] [CrossRef]
- Mardarowicz, M.; Sawicki, R.; Dawidowicz, A.; Wianowska, D. The influence of sample treatment on SPME extracts from conifers. I. Comparison of terpene composition in Engelmann Spruce (Picea engelmanii) using hydrodistillation, SPME and PLE. Ann. Univ. Mariae Curie Sklodowska Sectio AA Chemia 2004, 59, 25–42. [Google Scholar]
- Aznar, M.; López, R.; Cacho, J.F.; Ferreira, V. Identification and quantification of impact odorants of aged red wines from Rioja, GC-olfactometry, quantitative GC-MS, and odor evaluation of HPLC fractions. J. Agric. Food Chem. 2001, 49, 2924–2929. [Google Scholar] [CrossRef]
- Cu, J.Q.; Perineau, F.; Gaset, A. Volatile components of violet leaves. Phytochemistry 1992, 31, 571–573. [Google Scholar] [CrossRef]
- Sheibani, E.; Duncan, S.E.; Kuhn, D.D.; Dietrich, A.M.; Newkirk, J.J.; O’Keefe, S.F. Changes in flavor volatile composition of oolong tea after panning during tea processing. Food Sci. Nutr. 2016, 4, 456–468. [Google Scholar] [CrossRef]
- Reale, S.; Pace, L.; D’Archivio, A.A.; De Angelis, F.; Marcozzi, G. Volatiles fingerprint of Artemisia umbelliformis subsp. eriantha by headspace-solid phase microextraction GC-MS. Nat. Prod. Res. 2014, 28, 61–66. [Google Scholar] [CrossRef] [PubMed]
- Verzera, A.; Trozzi, A.; Cotroneo, A.; Lorenzo, D.; Dellacassa, E. Uruguayan essential oil. 12. Composition of Nova and Satsuma mandarin oils. J. Agric. Food Chem. 2000, 48, 2903–2909. [Google Scholar] [CrossRef]
- Salido, S.; Altarejos, J.; Nogueras, M.; Saánchez, A.; Luque, P. Chemical composition and seasonal variations of rosemary oil from southern Spain. J. Essent. Oil Res. 2011, 15, 10–14. [Google Scholar] [CrossRef]
- Shalit, M.; Katzir, N.; Tadmor, Y.; Larkov, O.; Burger, Y.; Shalekhet, F.; Lastochkin, E.; Ravid, U.; Amar, O.; Edelstein, M.; et al. Acetyl-CoA: Alcohol acetyltransferase activity and aroma formation in ripening melon fruits. J. Agric. Food Chem. 2001, 49, 794–799. [Google Scholar] [CrossRef] [PubMed]
- Pino, J.A.; Queris, O. Characterization of odor-active compounds in guava wine. J. Agric. Food Chem. 2011, 59, 4885–4890. [Google Scholar] [CrossRef] [PubMed]
- Benzo, M.; Gilardoni, G.; Gandini, C.; Caccialanza, G.; Finzi, P.V.; Vidari, G.; Abdo, S.; Layedra, P. Determination of the threshold odor concentration of main odorants in essential oils using gas chromatography-olfactometry incremental dilution technique. J. Chromatogr. A 2007, 1150, 131–135. [Google Scholar] [CrossRef]
- Pino, J.A.; Rosado, A.; Goire, I.; Roncal, E. Evaluation of Flavor Characteristic Compounds in Dill Herb Essential Oil by Sensory Analysis and Gas Chromatography. J. Agric. Food Chem. 1995, 43, 1307–1309. [Google Scholar] [CrossRef]
- Džamić, A.M.; Soković, M.D.; Ristić, M.S.; Novaković, M.; Grujić-Jovanović, S.; Tešević, V.; Marin, P.D. Antifungal and antioxidant activity of Mentha longifolia (L.) Hudson (Lamiaceae) essential oil. Bot. Serbica 2010, 34, 57–61. [Google Scholar]
- Saroglou, V.; Dorizas, N.; Kypriotakis, Z.; Skaltsa, H.D. Analysis of the essential oil composition of eight Anthemis species from Greece. J. Chromatogr. A 2006, 1104, 313–322. [Google Scholar] [CrossRef]
- Loskutov, A.V.; Beninger, C.W.; Hosfield, G.L.; Sink, K.C. Development of an improved procedure for extraction and quantitation of safranal in stigmas of Crocus sativus L. using high performance liquid chromatography. Food Chem. 2000, 69, 87–95. [Google Scholar] [CrossRef]
- Guo, X.; Ho, C.T.; Wan, X.; Zhu, H.; Liu, Q.; Wen, Z. Changes of volatile compounds and odor profiles in Wuyi rock tea during processing. Food Chem. 2021, 341, 128230. [Google Scholar] [CrossRef]
- Denk, P.; Ortner, E.; Buettner, A. Characterization of odorants in waxes for hot melt adhesives using sensory and instrumental analyses. Int. J. Adhes. Adhes. 2019, 95, 102406. [Google Scholar] [CrossRef]
- Kaneko, S.; Chen, J.; Wu, J.; Suzuki, Y.; Ma, L.; Kumazawa, K. Potent Odorants of Characteristic Floral/Sweet Odor in Chinese Chrysanthemum Flower Tea Infusion. J. Agric. Food Chem. 2017, 65, 10058–10063. [Google Scholar] [CrossRef] [PubMed]
- Murakami, S.; Li, W.; Matsuura, M.; Satou, T.; Hayashi, S.; Koike, K. Composition and seasonal variation of essential oil in Alpinia zerumbet from Okinawa Island. J. Nat. Med. 2009, 63, 204–208. [Google Scholar] [CrossRef] [PubMed]
- Zhang, K.; Lin, T.F.; Zhang, T.; Li, C.; Gao, N. Characterization of typical taste and odor compounds formed by Microcystis aeruginosa. J. Environ. Sci. 2013, 25, 1539–1548. [Google Scholar] [CrossRef]
- Mockute, D.; Bernotiene, G. The main citral-geraniol and carvacrol chemotypes of the essential oil of Thymus pulegioides L. growing wild in Vilnius district (Lithuania). J. Agric. Food Chem. 1999, 47, 3787–3790. [Google Scholar] [CrossRef]
- Bylaite, E.; Meyer, A.S. Characterisation of volatile aroma compounds of orange juices by three dynamic and static headspace gas chromatography techniques. Eur. Food Res. Technol. 2006, 222, 176–184. [Google Scholar] [CrossRef]
- Petrović, G.M.; Stamenković, J.G.; Stojanović, G.S.; Mitić, V.D.; Zlatković, B.K. Chemical Profile of Essential Oils and Headspace Volatiles of Chaerophyllum hirsutum from Serbia. Nat. Prod. Commun. 2017, 12, 1934578X1701200. [Google Scholar] [CrossRef] [Green Version]
- Isidorov, V.A.; Krajewska, U.; Dubis, E.N.; Jdanova, M.A. Partition coefficients of alkyl aromatic hydrocarbons and esters in a hexane-acetonitrile system. J. Chromatogr. A 2001, 923, 127–136. [Google Scholar] [CrossRef]
- Jiang, Y.; Zhao, L.; Yuan, M.; Fu, A. Identification and changes of different volatile compounds in meat of crucian carp under short-term starvation by GC-MS coupled with HS-SPME. J. Food Biochem. 2017, 41, e12375. [Google Scholar] [CrossRef]
- Wu, S.; Zorn, H.; Krings, U.; Berger, R.G. Volatiles from submerged and surface-cultured beefsteak fungus, Fistulina hepatica. Flavour Fragr. J. 2007, 22, 53–60. [Google Scholar] [CrossRef]
- Ishola, F.T.; Aboaba, S.A.; Choudhary, M.I.; Ekundayo, O. Chemical and Biological Assessments of the Essential Oils of Chrysophyllum albidum G. Don. J. Agric. Sci. Technol. A 2017, 7, 234–245. [Google Scholar] [CrossRef] [Green Version]
- Eri, S.; Khoo, B.K.; Lech, J.; Hartman, T.G. Direct thermal desorption-gas chromatography and gas chromatography-mass spectrometry profiling of hop (Humulus lupulus L.) Essential oils in support of varietal characterization. J. Agric. Food Chem. 2000, 48, 1140–1149. [Google Scholar] [CrossRef]
- Zhang, X.-X.; Sun, J.-Y.; Niu, L.-X.; Zhang, Y.-L. Chemical Compositions and Antioxidant Activities of Essential Oils Extracted from the Petals of Three Wild Tree Peony Species and Eleven Cultivars. Chem. Biodivers. 2017, 14, e1700282. [Google Scholar] [CrossRef]
- Baek, Y.S.; Park, P.H.; Kim, S.Y.; An, H.R.; Park, P.M.; Chio, O.; Kwon, O.K.; Son, I.C. Analysis of Floral Scent in Cymbidium Cultivar ‘Sunny Bell’ by Electronic Nose and Gas Chromatography-Mass Spectrometry. 2014. Available online: https://ashs.confex.com/ashs/2016/webprogram/Paper23542.html (accessed on 17 July 2021).
- Sartin, J.H.; Halsall, C.J.; Davison, B.; Owen, S.; Hewitt, C.N. Determination of biogenic volatile organic compounds (C8-C16) in the coastal atmosphere at Mace Head, Ireland. Anal. Chim. Acta 2001, 428, 61–72. [Google Scholar] [CrossRef]
- da Silva Oliveira, M.; Monsalve, J.O.; Nerin, C.; Padula, M.; Godoy, H.T. Characterization of odorants from baby bottles by headspace solid phase microextraction coupled to gas chromatography-olfactometry-mass spectrometry. Talanta 2020, 207, 120301. [Google Scholar] [CrossRef]
- Idris, O.; Wintola, O.; Afolayan, A. Comparison of the Proximate Composition, Vitamins (Ascorbic Acid, α-Tocopherol and Retinol), Anti-Nutrients (Phytate and Oxalate) and the GC-MS Analysis of the Essential Oil of the Root and Leaf of Rumex crispus L. Plants 2019, 8, 51. [Google Scholar] [CrossRef] [Green Version]
- Park, H.-J.; Lee, S.; Song, S.; Kim, Y.-S. Characterization of Volatile Components in Makgeolli, a Traditional Korean Rice Wine, with or without Pasteurization, During Storage. Molecules 2013, 18, 5317–5325. [Google Scholar] [CrossRef] [PubMed]
- Joshi, R.K. Chemical constituents and antibacterial property of the essential oil of the roots of Cyathocline purpurea. J. Ethnopharmacol. 2013, 145, 621–625. [Google Scholar] [CrossRef] [PubMed]
- Schreiner, L.; Bauer, J.; Ortner, E.; Buettner, A. Structure-Odor Activity Studies on Derivatives of Aromatic and Oxygenated Monoterpenoids Synthesized by Modifying p-Cymene. J. Nat. Prod. 2020, 83, 834–842. [Google Scholar] [CrossRef] [PubMed]
- Zafeiropoulou, V.; Tomou, E.M.; Douros, A.; Skaltsa, H. The Effect of Successive Harvesting on The Volatile Constituents of Two Essential Oils of Cultivated Populations of Sea Fennel (Crithmum maritimum L.) in Greece. J. Essent. Oil-Bear. Plants 2021, 24, 1–11. [Google Scholar] [CrossRef]
- Youssef, F.S.; Mamatkhanova, M.A.; Mamadalieva, N.Z.; Zengin, G.; Aripova, S.F.; Alshammari, E.; Ashour, M.L. Chemical Profiling and Discrimination of Essential Oils from Six Ferula Species Using GC Analyses Coupled with Chemometrics and Evaluation of Their Antioxidant and Enzyme Inhibitory Potential. Antibiotics 2020, 9, 518. [Google Scholar] [CrossRef] [PubMed]
- Faizal, A.; Azar, A.W.P.; Turjaman, M.; Esyanti, R.R. Fusarium solani induces the formation of agarwood in Gyrinops versteegii (Gilg.) Domke branches. Symbiosis 2020, 81, 15–23. [Google Scholar] [CrossRef]
- Passos, X.S.; Castro, A.C.M.; Pires, J.S.; Garcia, A.C.F.; Campos, F.C.; Fernandes, O.F.L.; Paula, J.R.; Ferreira, H.D.; Santos, S.C.; Ferri, P.H.; et al. Composition and antifungal activity of the essential oils of Caryocar brasiliensis. Pharm. Biol. 2003, 41, 319–324. [Google Scholar] [CrossRef]
- Saftner, R.; Luo, Y.; McEvoy, J.; Abbott, J.A.; Vinyard, B. Quality characteristics of fresh-cut watermelon slices from non-treated and 1-methylcyclopropene- and/or ethylene-treated whole fruit. Postharvest Biol. Technol. 2007, 44, 71–79. [Google Scholar] [CrossRef]
- Li, Q.; Li, Y.; Luo, Y.; Xiao, L.; Wang, K.; Huang, J.; Liu, Z. Characterization of the key aroma compounds and microorganisms during the manufacturing process of Fu brick tea. LWT 2020, 127, 109355. [Google Scholar] [CrossRef]
- Sharma, R.K.; Kaur, H.; Singh, M.; Kumar, M.; Sharma, R.; Shah, G.C.; Sharma, P. Chemical Composition and Antimicrobial Properties of Essential Oil Anaphalis triplinervis from Western Himalaya. Chem. Nat. Compd. 2019, 55, 751–753. [Google Scholar] [CrossRef]
- Zhai, X.; Granvogl, M. Key Odor-Active Compounds in Raw Green and Red Toona sinensis (A. Juss.) Roem. And Their Changes during Blanching. J. Agric. Food Chem. 2020, 68, 7169–7183. [Google Scholar] [CrossRef] [PubMed]
- Zhao, J.; Guo, Y.; Suo, X.; Yuan, J. Effect of dietary zinc level on serum carotenoid levels, body and shank pigmentation of chickens after experimental infection with coccidia. Arch. Anim. Nutr. 2006, 60, 218–228. [Google Scholar] [CrossRef]
- Zanan, R.; Khandagale, K.; Hinge, V.; Elangovan, M.; Henry, R.J.; Nadaf, A. Characterization of fragrance in sorghum (Sorghum bicolor (L.) Moench) grain and development of a gene-based marker for selection in breeding. Mol. Breed. 2016, 36, 146. [Google Scholar] [CrossRef]
- Lv, S.D.; Wu, Y.S.; Song, Y.Z.; Zhou, J.S.; Lian, M.; Wang, C.; Liu, L.; Meng, Q.X. Multivariate Analysis Based on GC-MS Fingerprint and Volatile Composition for the Quality Evaluation of Pu-Erh Green Tea. Food Anal. Methods 2015, 8, 321–333. [Google Scholar] [CrossRef]
- Zhang, W.-J.; Liu, C.; Yang, R.-J.; Zheng, T.-T.; Zhao, M.-M.; Ma, L.; Yan, L. Comparison of volatile profiles and bioactive components of sun-dried Pu-erh tea leaves from ancient tea plants on Bulang Mountain measured by GC-MS and HPLC. J. Zhejiang Univ. Sci. B 2019, 20, 563–575. [Google Scholar] [CrossRef] [PubMed]
- Flamini, G.; Tebano, M.; Cioni, P.L. Volatiles emission patterns of different plant organs and pollen of Citrus limon. Anal. Chim. Acta 2007, 589, 120–124. [Google Scholar] [CrossRef] [PubMed]


| Sample | Fresh | Oven-Dried | Freeze-Dried | |
|---|---|---|---|---|
| (g/100 g fw) | (g/100 g dw) d | (g/100 g dw) | (g/100 g dw) | |
| Nutritional parameters ab | ||||
| Moisture | 88.20 ± 0.88 | - | 7.66 ± 0.08 a | 3.20 ± 0.03 b |
| Ashes | 5.91 ± 0.24 | 50.08 ± 0.34 A | 41.00 ± 1.64 aB | 44.20 ± 1.77 aB |
| Protein | 1.59 ± 0.06 | 13.47 ± 0.51 A | 8.48 ± 0.34 bC | 11.00 ± 0.44 aB |
| Total fat | 0.40 ± 0.01 | 3.39 ± 0.03 A | 1.20 ± 0.01 aC | 1.80 ± 0.02 aB |
| Carbohydrates | 2.90 ± 0.12 | 24.58 ± 1.02 A | 12.70 ± 0.51 aC | 12.90 ± 0.52 aB |
| Total dietary fiber | 1.00 ± 0.03 | 8.47 ± 0.26 C | 29.00 ± 0.87 aA | 26.90 ± 0.81 bB |
| Energy value (kcal/100 g) | 23.60 ± 0.94 | 200.01± 8.00 A | 153.50 ± 6.1 aC | 165.6 ± 6.6 aB |
| Salt | 5.62 ± 0.73 | 47.63 ± 6.20 A | 36.8 ± 4.8 aAB | 28.5 ± 3.7 aB |
| Fatty acids profile abc | ||||
| Palmitic acid (C16:0) | 24.00 ± 0.01 | 24.00 ± 0.01 B | 26.80 ± 0.01 aA | 19.80 ± 0.01 bC |
| Stearic acid (C18:0) | 2.00 ± 0.01 | 2.00 ± 0.01 A | 1.90 ± 0.01 aB | 1.30 ± 0.01 bC |
| Oleic acid (C18:1) | 5.00 ± 0.01 | 5.00 ± 0.01 A | 3.50 ± 0.01 aB | 1.60 ± 0.01 bC |
| Linoleic acid (C18:2) | 24.10 ± 0.01 | 24.10 ± 0.01 B | 23.80 ± 0.01 bC | 28.10 ± 0.01 aA |
| Linolenic acid (C18:3) | 33.50 ± 0.01 | 33.50 ± 0.01 B | 27.90 ± 0.01 bC | 40.40 ± 0.01 aA |
| Arachidic acid (C20:0) | 0.90 ± 0.01 | 0.90 ± 0.01 B | 1.20 ± 0.01 aA | 0.80 ± 0.01 bC |
| Eicosenoic acid (C20:1) | <0.05 * | <0.05 * | 0.10 ± 0.01 a | 0.10 ± 0.01 a |
| Behenic acid (C22:0) | 1.40 ± 0.01 | 1.40 ± 0.01 C | 4.20 ± 0.01 aA | 2.10 ± 0.01 bB |
| Lignoceric acid (C24:0) | 1.70 ± 0.01 | 1.70 ± 0.01 C | 2.90 ± 0.01 aA | 2.50 ± 0.01 bB |
| SFA | 34.30 ± 0.01 | 34.30 ± 0.01 B | 42.50 ± 0.01 aA | 28.10 ± 0.01 bC |
| MUFA | 7.30 ± 0.01 | 7.30 ± 0.01 A | 4.80 ± 0.01 aB | 3.10 ± 0.01 bC |
| PUFA | 58.40 ± 0.01 | 58.40 ± 0.01 B | 52.70 ± 0.01 bC | 68.80 ± 0.01 aA |
| PUFA n-6/PUFA n-3 | 0.72 ± 0.01 | 0.72 ± 0.01 A | 1.03 ± 0.01 bB | 0.70 ± 0.01 aA |
| PUFA/SFA | 1.70 ± 0.01 | 1.70 ± 0.01 B | 1.24 ± 0.01 bC | 2.45 ± 0.01 aA |
| Sample | Fresh (fw) | Oven-Dried (dw) | Freeze-Dried (dw) |
|---|---|---|---|
| Macro-elements (mg/g) ab | |||
| Sodium (Na) | 22.50 ± 2.90 | 147.01 ± 14.85 a | 114.02 ± 19.11 a |
| Calcium (Ca) | 0.32 ± 0.03 | 0.237 ± 0.003 b | 0.312 ± 0.002 a |
| Potassium (K) | 1.05 ± 0.22 | 0.409 ± 0.003 a | 0.411 ± 0.002 a |
| Micro-elements (µg/g) ab | |||
| Iron (Fe) | 37.00 ± 0.5 | 45.025 ± 0.347 b | 73.145 ± 0.442 a |
| Manganese (Mn) | 2.30 ± 0.32 | 4.581 ± 0.104 a | 2.830 ± 0.056 b |
| Zinc (Zn) | 6.20 ± 0.90 | 14.249 ± 0.143 a | 13.727 ± 0.094 a |
| Copper (Cu) | 1.20 ± 0.10 | 2.507 ± 0.045 a | 2.270 ± 0.037 a |
| Selenium (Se) | <0.02 * | <0.02 * | <0.02 * |
| Iodine (I) | <0.13 * | <0.03 * | <0.03 * |
| Heavy metals (µg/g) ab | |||
| Arsenic (As) | 0.15 ± 0.04 | 0.264 ± 0.015 a | 0.273 ± 0.019 a |
| Cadmium (Cd) | 0.010± 0.001 | <0.10 * | <0.10 * |
| Mercury (Hg) | <0.03 * | <0.03 * | <0.03 * |
| Lead (Pb) | 0.18 ± 0.02 | 1.525 ± 0.028 a | 1.508 ± 0.037 a |
| Processing Plant | Fresh (fw) a | Fresh (dw) abc | Oven-Dried (dw) ab | Freeze-Dried (dw) ab |
|---|---|---|---|---|
| TPC (mg GAE/g) | 1.02 ± 0.04 | 8.64 ± 0.34A | 7.41 ± 0.29 bB | 9.74 ± 0.88 aA |
| Antioxidant activity | ||||
| ORAC (µmol TEAC/g) | 23.85 ± 3.04 | 202.10 ± 25.81 B | 291.10 ± 17.95 bB | 418.81 ± 54.01 aA |
| HOSC (µmol TEAC/g) | 26.06 ± 2.29 | 220.21 ± 15.51 A | 147.21 ± 12.44 bB | 237.20 ± 12.02 aA |
| Antihypertensive activity | ||||
| ACE inhibition (IC50 = mg/mL) | 95.61 ± 14.13 | 12.60 ± 1.73 A | 24.56 ± 1.74 aB | 18.96 ± 0.62 aB |
Publisher’s Note: MDPI stays neutral with regard to jurisdictional claims in published maps and institutional affiliations. |
© 2021 by the authors. Licensee MDPI, Basel, Switzerland. This article is an open access article distributed under the terms and conditions of the Creative Commons Attribution (CC BY) license (https://creativecommons.org/licenses/by/4.0/).
Share and Cite
Oliveira-Alves, S.C.; Andrade, F.; Prazeres, I.; Silva, A.B.; Capelo, J.; Duarte, B.; Caçador, I.; Coelho, J.; Serra, A.T.; Bronze, M.R. Impact of Drying Processes on the Nutritional Composition, Volatile Profile, Phytochemical Content and Bioactivity of Salicornia ramosissima J. Woods. Antioxidants 2021, 10, 1312. https://doi.org/10.3390/antiox10081312
Oliveira-Alves SC, Andrade F, Prazeres I, Silva AB, Capelo J, Duarte B, Caçador I, Coelho J, Serra AT, Bronze MR. Impact of Drying Processes on the Nutritional Composition, Volatile Profile, Phytochemical Content and Bioactivity of Salicornia ramosissima J. Woods. Antioxidants. 2021; 10(8):1312. https://doi.org/10.3390/antiox10081312
Chicago/Turabian StyleOliveira-Alves, Sheila C., Fábio Andrade, Inês Prazeres, Andreia B. Silva, Jorge Capelo, Bernardo Duarte, Isabel Caçador, Júlio Coelho, Ana Teresa Serra, and Maria R. Bronze. 2021. "Impact of Drying Processes on the Nutritional Composition, Volatile Profile, Phytochemical Content and Bioactivity of Salicornia ramosissima J. Woods" Antioxidants 10, no. 8: 1312. https://doi.org/10.3390/antiox10081312