
The Effect of Substrate on Water Quality in Ornamental Fish Tanks
 ,
,  , , , and
Abstract
:Simple Summary
Abstract
1. Introduction
2. Materials and Methods
2.1. Water Sample Collection and Analysis
2.2. Statistical Analyses
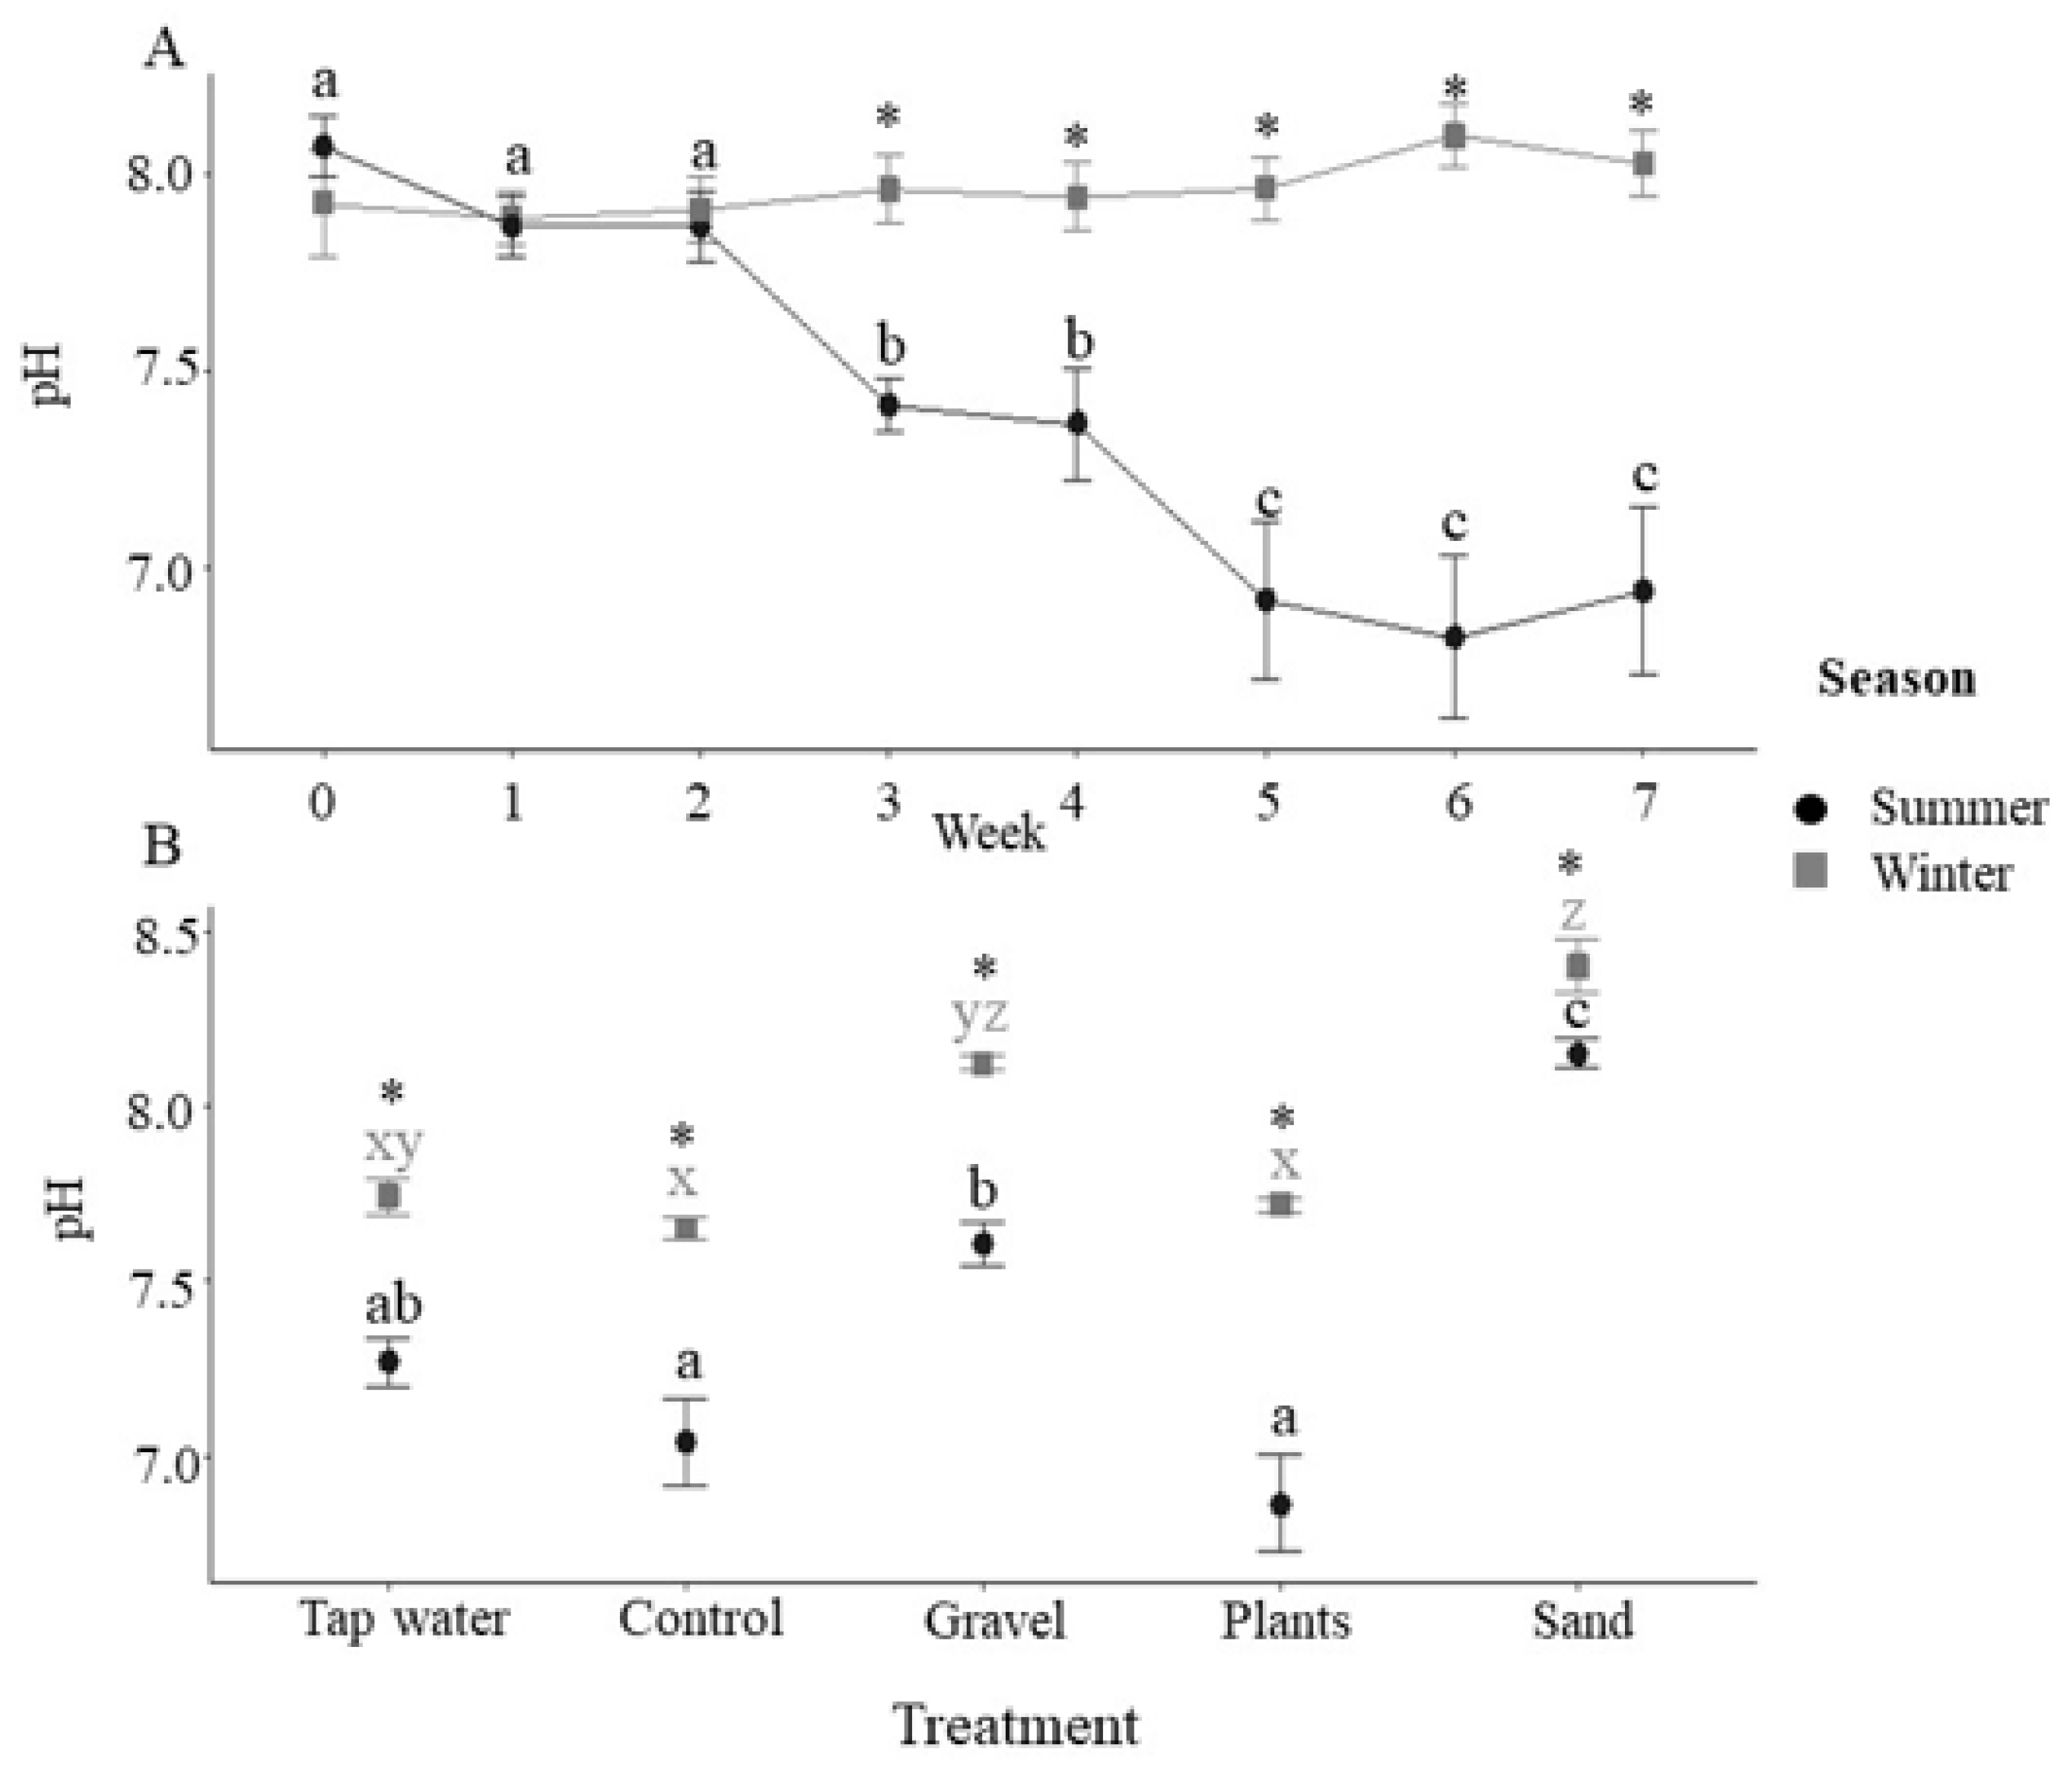
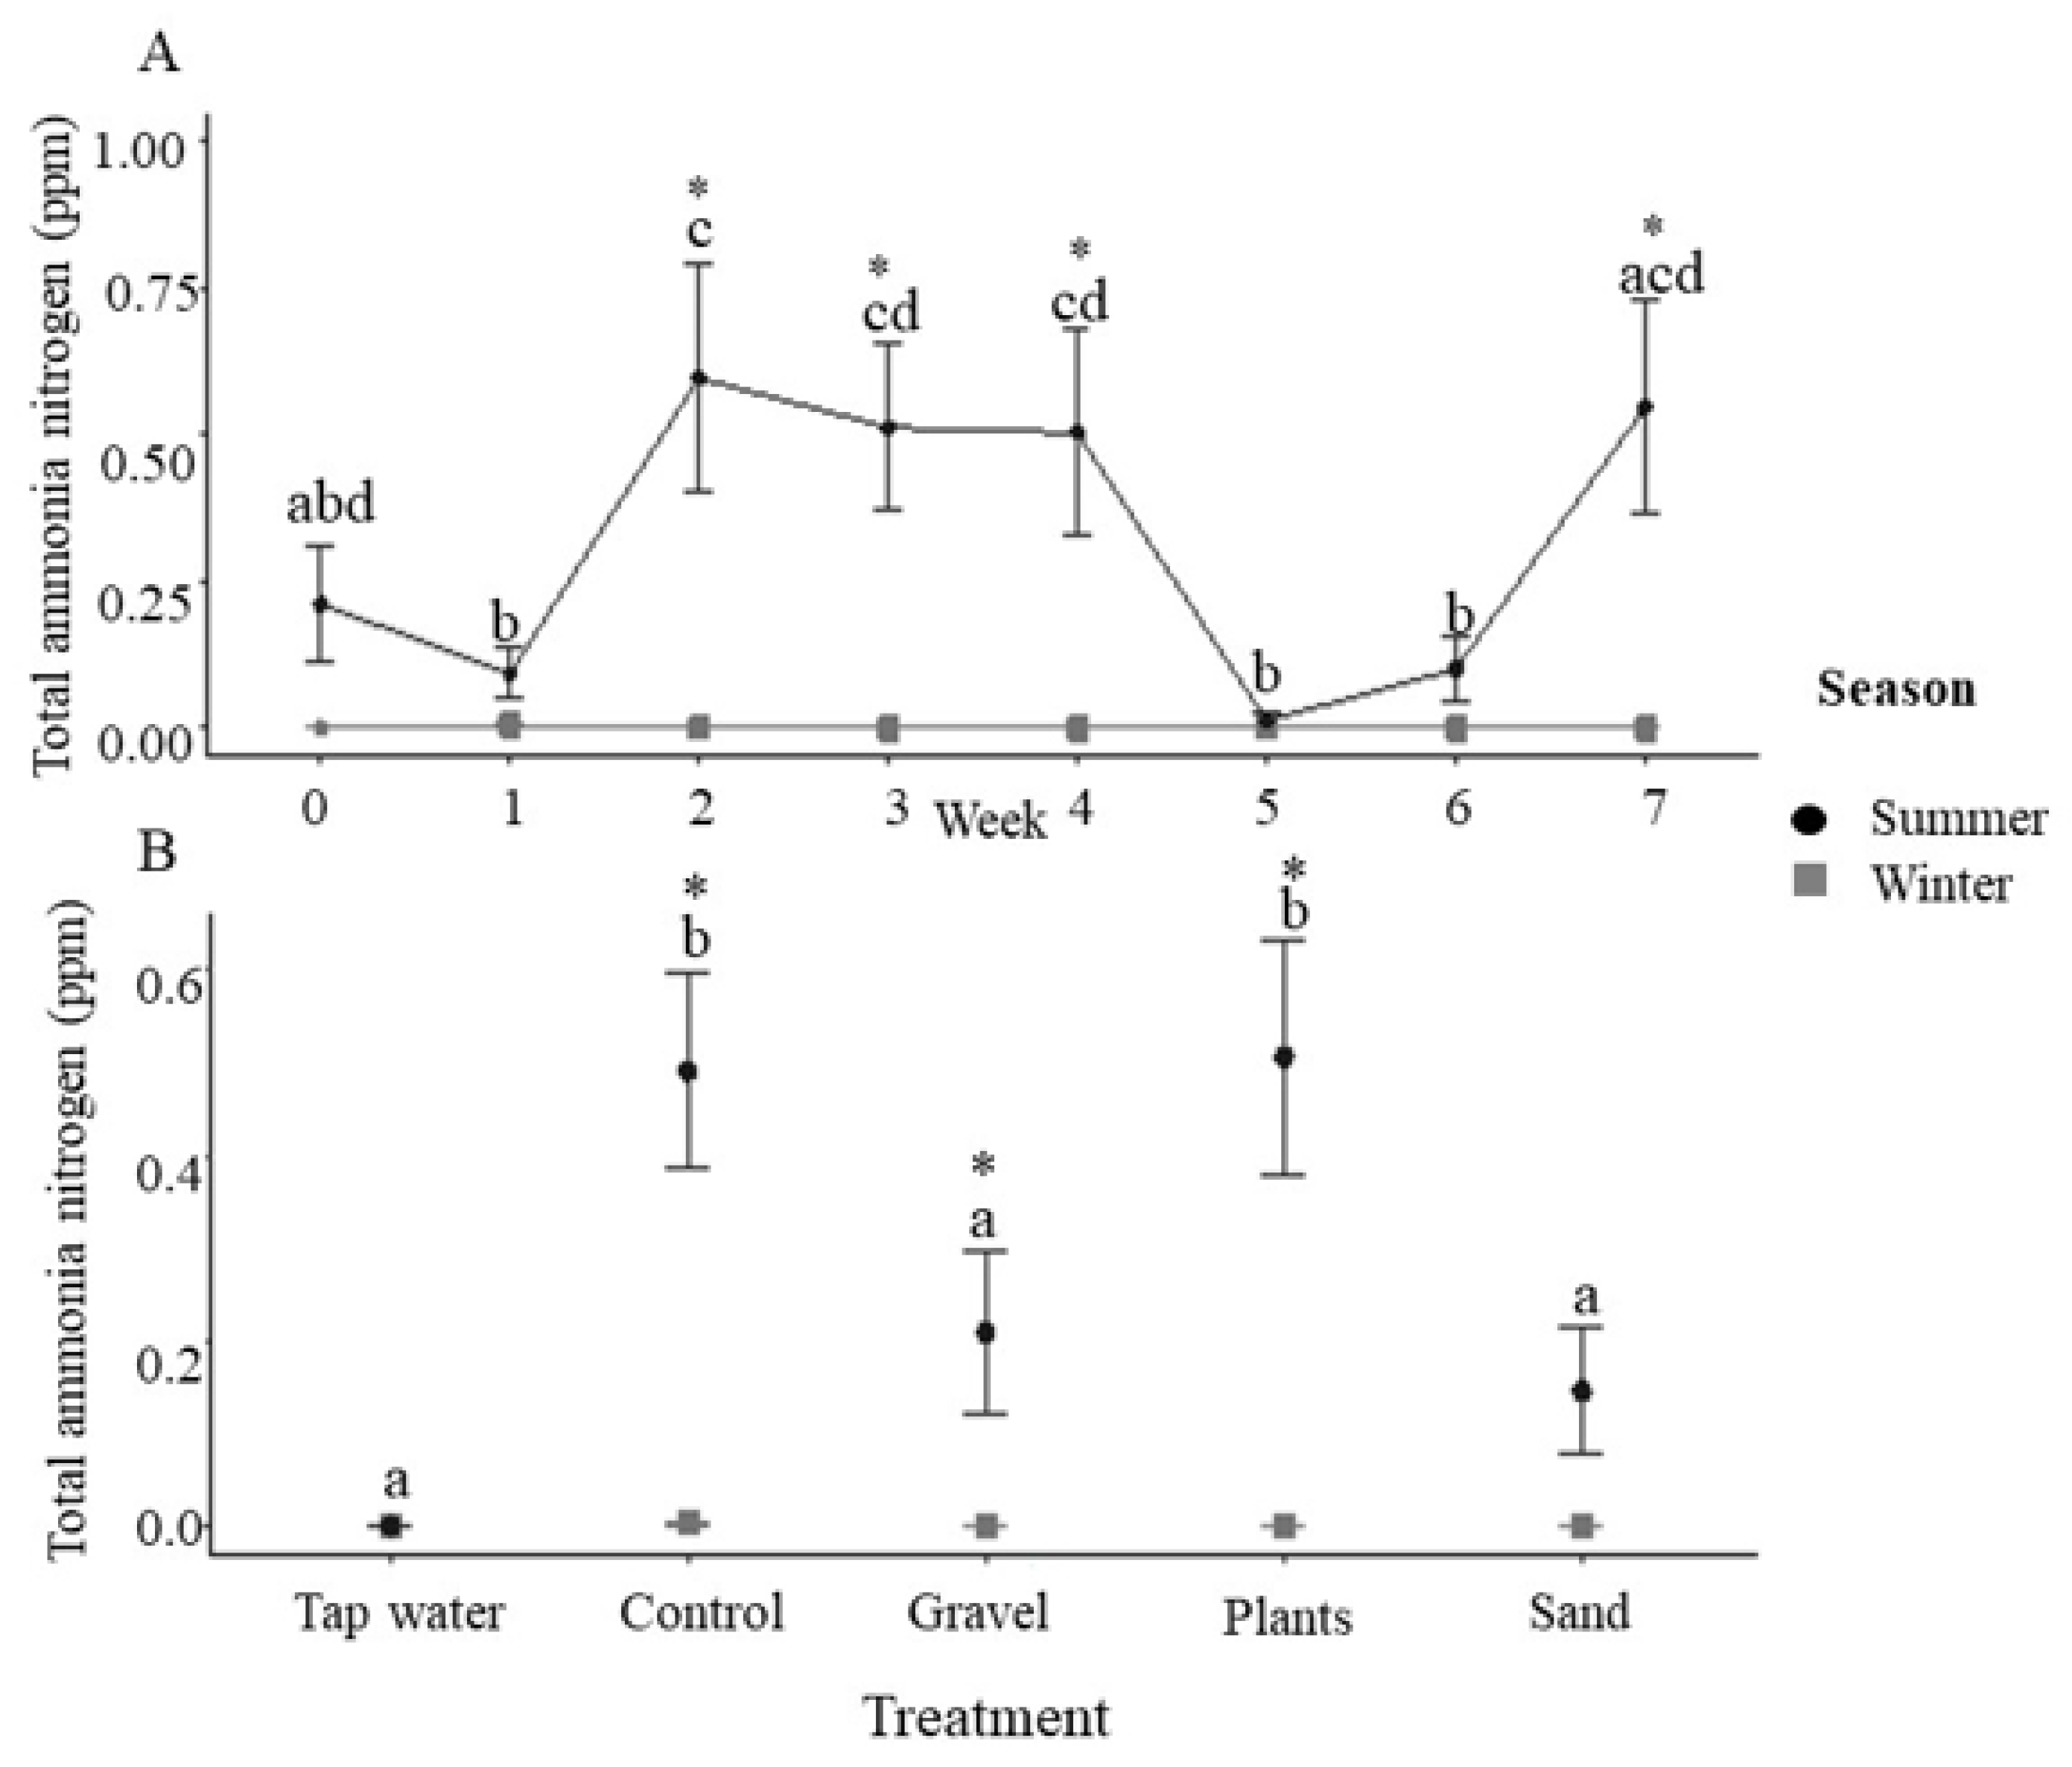
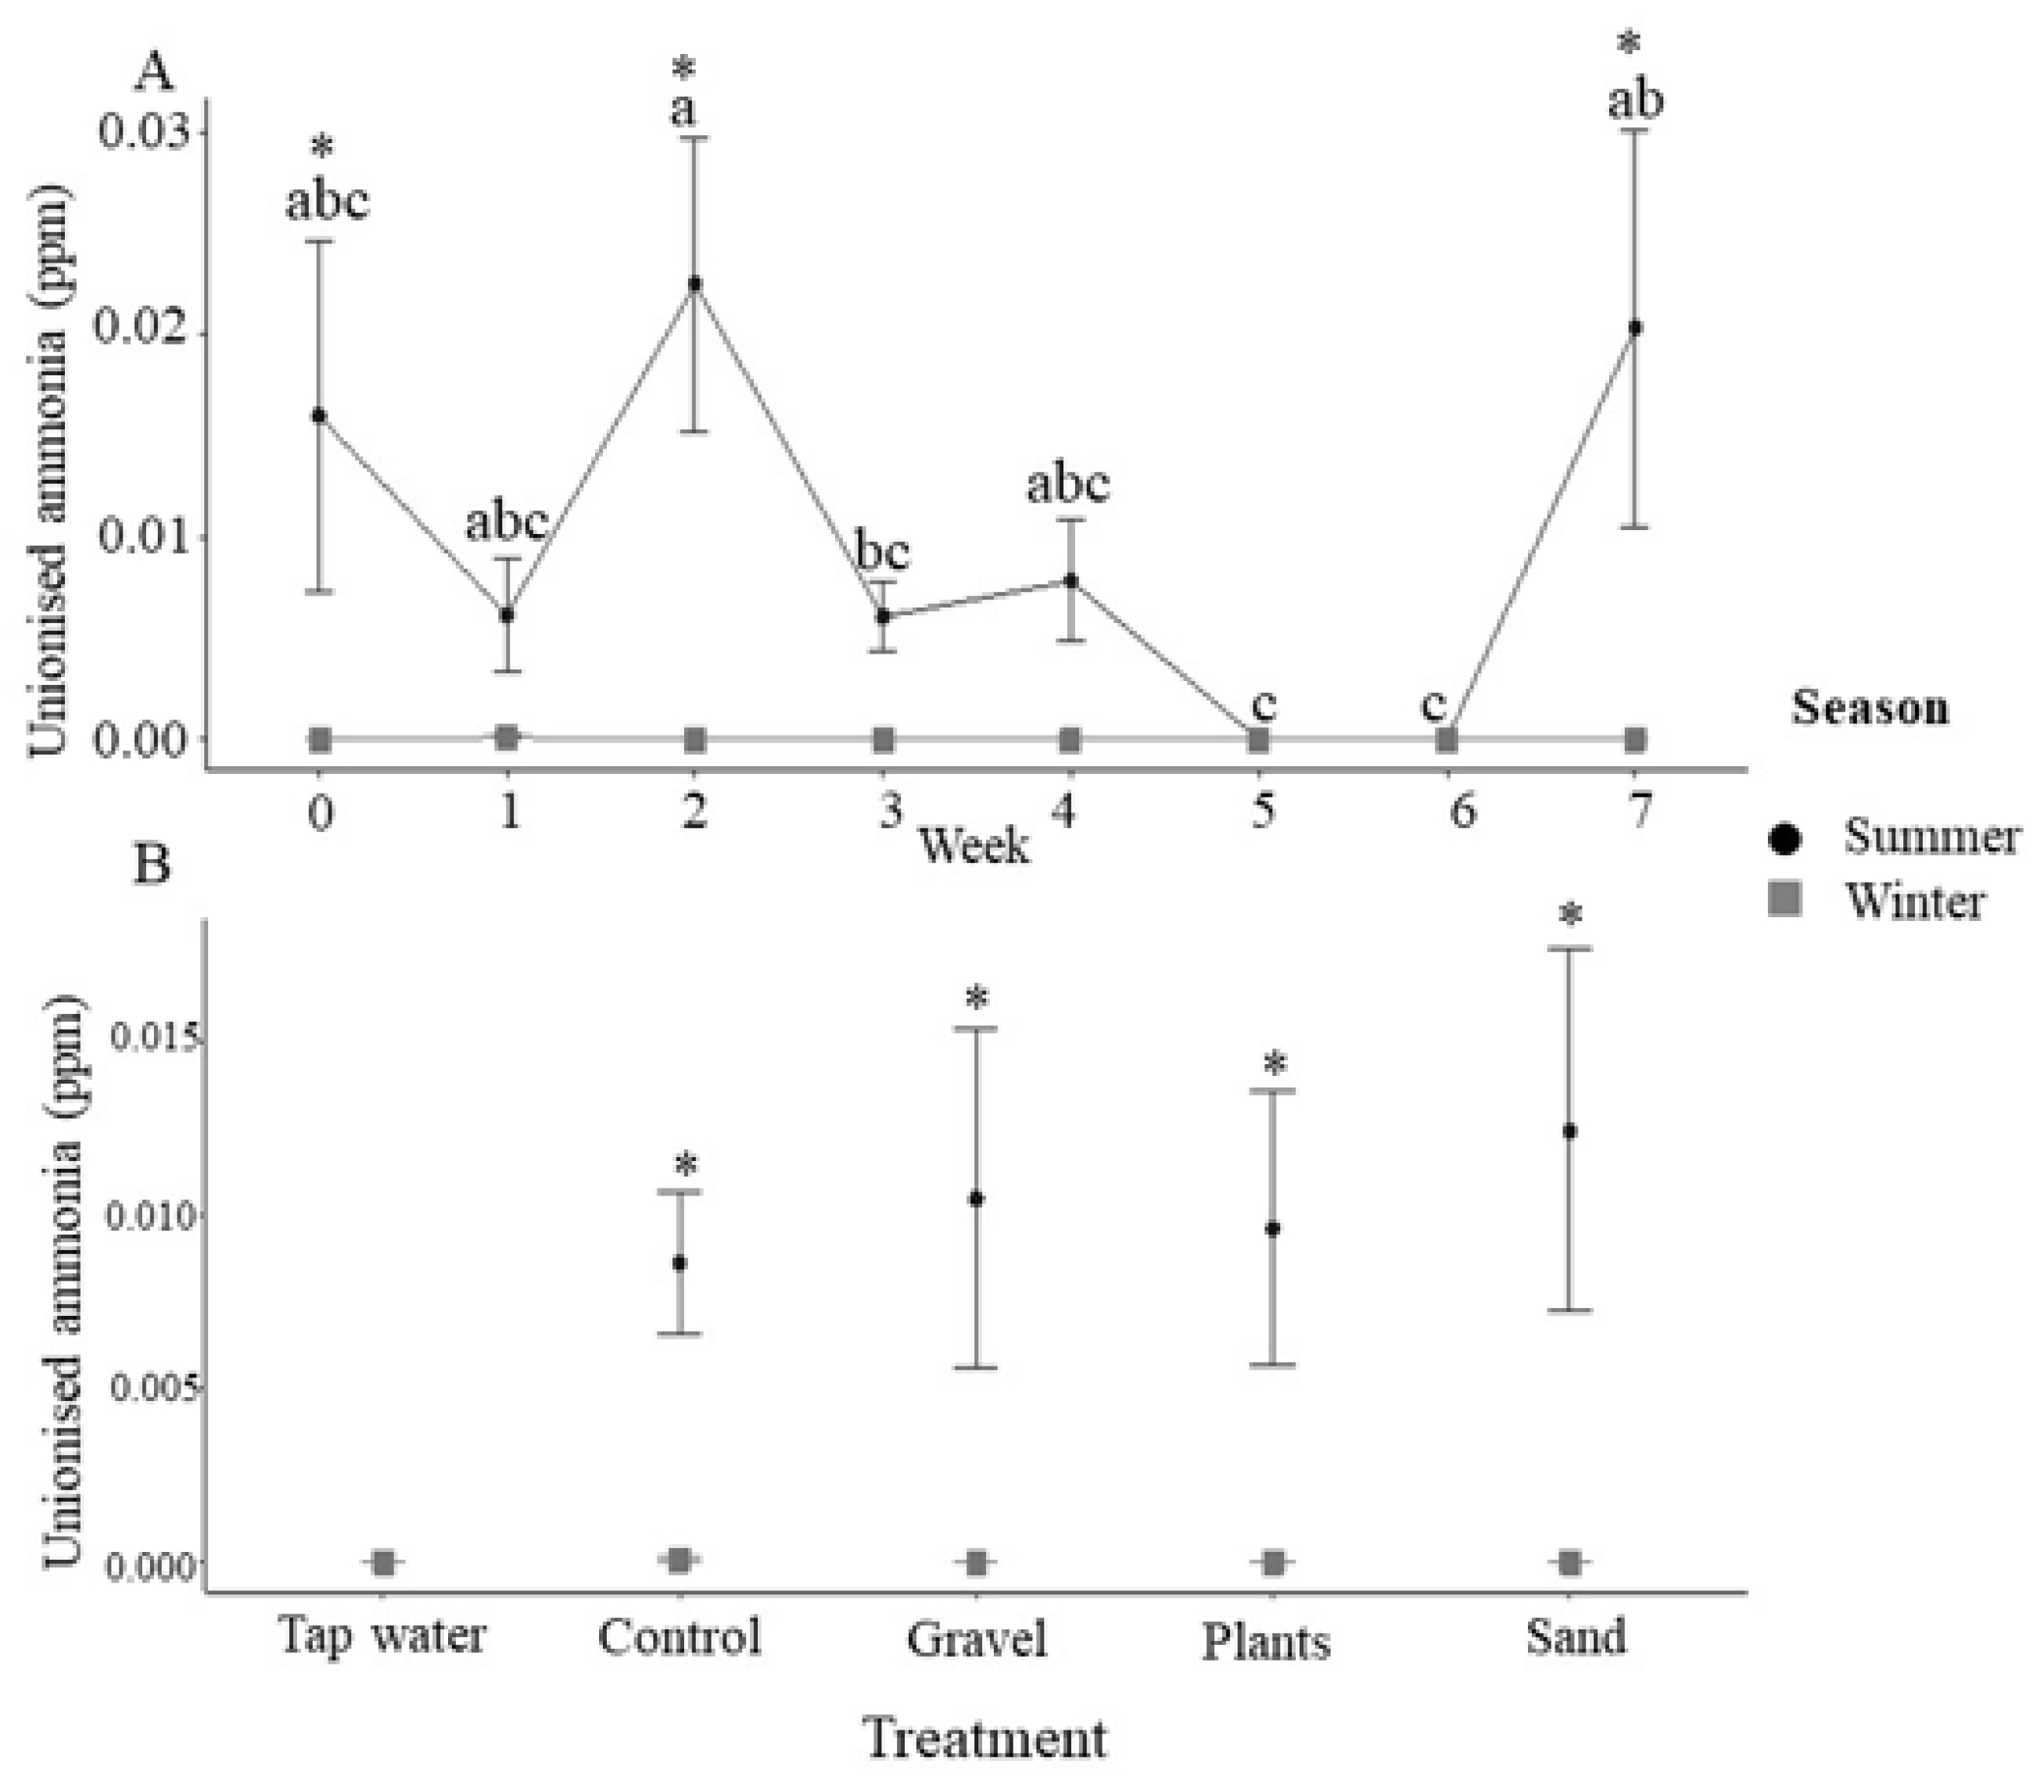
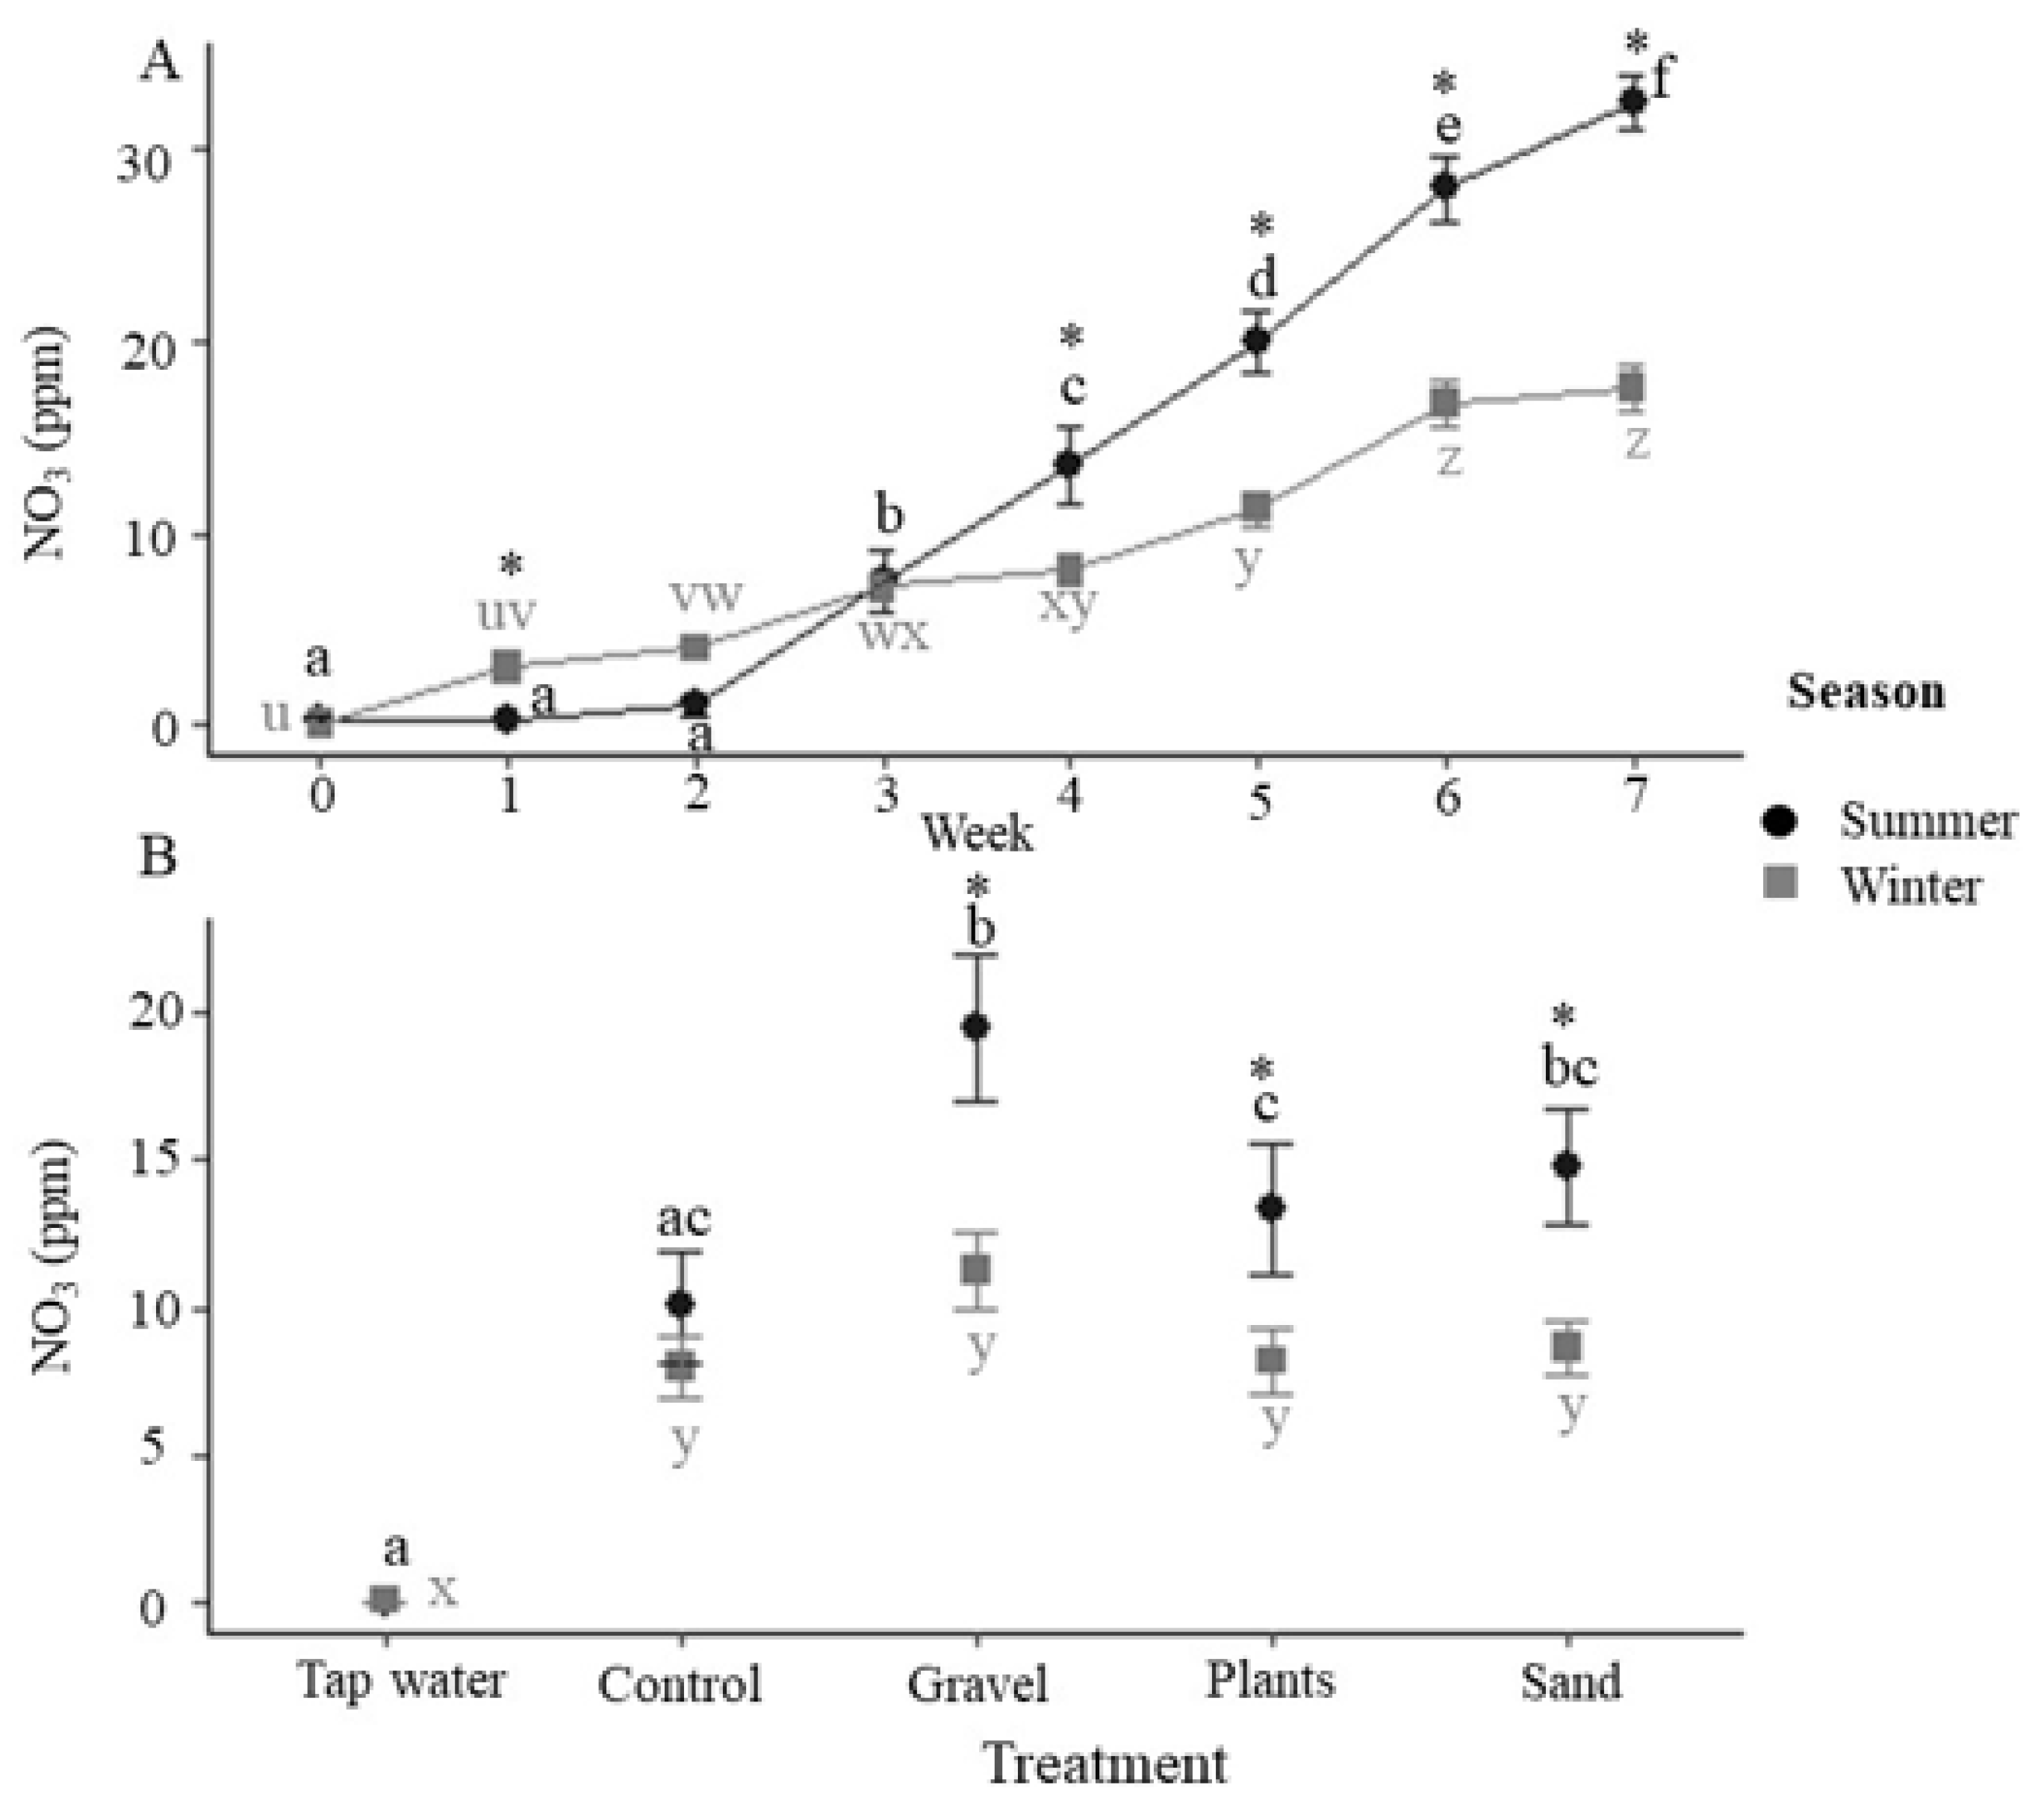
3. Results
4. Discussion
5. Conclusions
Supplementary Materials
Author Contributions
Funding
Institutional Review Board Statement
Data Availability Statement
Acknowledgments
Conflicts of Interest
References
- Näslund, J.; Johnson, J.I. Environmental enrichment for fish in captive environments: Effects of physical structures and substrates. Fish Fish. 2014, 17, 1–30. [Google Scholar] [CrossRef]
- Sloman, K.A.; Bouyoucos, I.A.; Brooks, E.J.; Sneddon, L.U. Ethical considerations in fish research. J. Fish Biol. 2019, 94, 556–577. [Google Scholar] [CrossRef] [Green Version]
- Jones, N.A.R.; Webster, M.; Salvanes, A.G.V. Physical enrichment research for captive fish: Time to focus on the DETAILS. J. Fish Biol. 2021, 99, 704–725. [Google Scholar] [CrossRef]
- Zhang, Z.; Gao, L.; Zhang, X. Environmental enrichment increases aquatic animal welfare: A systematic review and meta-analysis. Rev. Aquacult. 2021, 14, 1120–1135. [Google Scholar] [CrossRef]
- Arechavala-Lopez, P.; Maia, C.M.; Saraiva, J.L. Environmental enrichment in fish aquaculture: A review of fundamental and practical aspects. Rev. Aquacult. 2021, 14, 704–728. [Google Scholar] [CrossRef]
- Thoré, E.S.J.; Brendonck, L.; Pinceel, T. Conspecific density and environmental complexity impact behaviour of turquoise killifish (Nothobranchius furzeri). J. Fish. Biol. 2020, 97, 1448–1461. [Google Scholar] [CrossRef]
- Kihslinger, R.L.; Nevitt, G.A. Early rearing environment impacts cellular growth in juvenile salmon. J. Exp. Biol. 2006, 209, 504–509. [Google Scholar] [CrossRef] [Green Version]
- von Krogh, K.; Sørensen, C.; Nilsson, G.E.; Øverli, Ø. Forebrain cell proliferation, behaviour, and physiology of zebrafish, Danio rerio, kept in enriched or barren environments. Physiol. Behav. 2010, 101, 32–39. [Google Scholar] [CrossRef]
- Carbia, P.S.; Brown, C. Environmental enrichment influences spatial learning ability in captive-reared intertidal gobies (Bathygobius cocosensis). Anim. Cognit. 2019, 22, 89–98. [Google Scholar] [CrossRef]
- Pounder, K.C.; Mitchell, J.L.; Thomson, J.; Pottinger, T.; Buckley, J.; Sneddon, L.U. Does environmental enrichment promote recovery from stress in rainbow trout? Appl. Anim. Behav. Sci. 2016, 176, 136–142. [Google Scholar] [CrossRef]
- Smith, A.; Gray, H. Goldfish in a tank: The effect of substrate on foraging behaviour in aquarium fish. Anim. Welf. 2011, 20, 311–319. [Google Scholar]
- Batzina, A.; Karakatsouli, N. The presence of substrate as a means of environmental enrichment in intensively reared gilthead seabream Sparus aurata: Growth and behavioral effects. Aquaculture 2012, 370, 54–60. [Google Scholar] [CrossRef]
- McVicar, A.H. Black patch necrosis of the skin of Solea solea (L.): The role of sand in prophylaxis and treatment. J. Fish Dis. 1987, 10, 59–63. [Google Scholar] [CrossRef]
- Ellis, T.; Howell, B.R.; Hughes, R.N. The cryptic responses of hatchery-reared sole to a natural sand substratum. J. Fish Biol. 1997, 51, 389–401. [Google Scholar] [CrossRef]
- Ottesen, O.H.; Noga, E.J.; Sandaa, W. Effect of substrate on progression and healing of skin erosions and epidermal papillomas of Atlantic halibut, Hippoglossus hippoglossus (L.). J. Fish Dis. 2007, 30, 43–53. [Google Scholar] [CrossRef]
- Lidster, K.; Readman, G.D.; Prescott, M.J.; Owen, S.F. International survey on the use and welfare of zebrafish Danio rerio in research. J. Fish Biol. 2017, 90, 1891–1905. [Google Scholar] [CrossRef] [Green Version]
- Tuckey, L.M.; Smith, T.I.J. Effects of photoperiod and substrate on larval development and substrate preference of juvenile southern flounder, Paralichthys lethostigma. J. Appl. Aquacult. 2001, 11, 1–20. [Google Scholar] [CrossRef]
- Williams, T.D.; Readman, G.D.; Owen, S.F. Key issues concerning environmental enrichment for laboratory-held fish species. Lab. Anim. 2009, 43, 107–120. [Google Scholar] [CrossRef]
- Van Bonn, W.; LaPointe, A.; Gibbons, S.M.; Frazier, A.; Hampton-Marcell, J.; Gilbert, J. Aquarium microbiome response to ninety-percent system water change: Clues to microbiome management. Zoo Biol. 2015, 34, 360–367. [Google Scholar] [CrossRef]
- Fletcher, M.; Loeb, G.I. Influence of substratum characteristics on the attachment of a marine pseudomonad to solid-surfaces. Appl. Environ. Microbiol. 1979, 37, 67–72. [Google Scholar] [CrossRef] [Green Version]
- Lewis, S.; Chinabut, S. Mycobacteriosis and nocardiosis. In Fish Diseases and Disorders: Viral, Bacterial and Fungal Infections, 2nd ed.; Woo, P.T.K., Bruno, D.W., Eds.; CABI: Wallingford, UK, 2011; Volume 3, pp. 397–423. [Google Scholar] [CrossRef]
- Smith, K.F.; Schmidt, V.; Rosen, G.E.; Amaral-Zettler, L. Microbial diversity and potential pathogens in ornamental fish aquarium water. PLoS ONE 2012, 7, e39971. [Google Scholar] [CrossRef] [Green Version]
- Rose, S.; Hill, R.; Bermudez, L.E.; Miller-Morgan, T. Imported ornamental fish are colonized with antibiotic-resistant bacteria. J. Fish Dis. 2013, 36, 533–542. [Google Scholar] [CrossRef]
- Shotts, E.B., Jr.; Kleckner, A.L.; Gratzek, J.B.; Blue, J.L. Bacterial flora of aquarium fishes and their shipping waters imported from southeast Asia. J. Fish. Res. Board Can. 1976, 33, 732–735. [Google Scholar] [CrossRef]
- Lescenko, P.; Matlova, L.; Dvorska, L.; Bartos, M.; Vavra, O.; Navratil, S.; Novotny, L.; Pavlik, I. Mycobacterial infection in aquarium fish. Vet. Med. 2003, 48, 71–78. [Google Scholar] [CrossRef] [Green Version]
- Webb, S.R.; Garman, G.C.; McIninch, S.P.; Brown, B.L. Amoebae associated with ulcerative lesions of fish from tidal freshwater of the James River, Virginia. J. Aquat. Anim. Health 2002, 14, 68–76. [Google Scholar] [CrossRef]
- Walker, A. Health and environment–drinking water–doubts about quality. Br. Med. J. 2002, 304, 175–178. [Google Scholar] [CrossRef] [PubMed] [Green Version]
- Critchley, M.M.; Cromar, N.J.; McClure, N.; Fallowfield, H.J. Biofilms and microbially influenced cuprosolvency in domestic copper plumbing systems. J. Appl. Microbiol. 2001, 91, 646–651. [Google Scholar] [CrossRef] [PubMed]
- Critchley, M.M.; Fallowfield, H.J.; Iwa, I.W.A. The effect of distribution system bacterial biofilms on copper concentrations in drinking water. Water Sci. Technol. Water Supply 2001, 1, 247–252. [Google Scholar] [CrossRef]
- Whitehead, P.G.; Wilby, R.L.; Battarbee, R.W.; Kernan, M.; Wade, A.J. A review of the potential impacts of climate change on surface water quality. Hydrol. Sci. J. 2009, 54, 101–123. [Google Scholar] [CrossRef] [Green Version]
- Bower, C.E.; Holm-Hansen, T. A salicylate–hypochlorite method for determining ammonia in seawater. Can. J. Fish. Aquat. Sci. 1980, 37, 794–798. [Google Scholar] [CrossRef]
- Bolker, B.M.; Brooks, M.E.; Clark, C.J.; Geange, S.W.; Poulsen, J.R.; Stevens, M.H.H.; White, J.S.S. Generalized linear mixed models: A practical guide for ecology and evolution. Trend. Ecol. Evol. 2009, 24, 127–135. [Google Scholar] [CrossRef]
- R Core Team. R: A Language and Environment for Statistical Computing. 2018. Available online: https://www.r-project.org/ (accessed on 19 March 2021).
- Pinheiro, J.; Bates, D.; DebRoy, S.; Sarkar, D.; R Core Team. nlme: Linear and Nonlinear Mixed Effects Models. 2018. Available online: https://cran.r-project.org/web/packages/nlme/nlme.pdf (accessed on 19 March 2021).
- Venables, W.N.; Ripley, B.D. Modern Applied Statistics with S, 4th ed.; Springer: New York, NY, USA, 2002. [Google Scholar]
- Fox, J.; Weisberg, S. An R Companion to Applied Regression, 2nd ed.; Sage Publications: Thousand Oaks, CA, USA, 2011. [Google Scholar]
- Lenth, R.; Singmann, H.; Love, J.; Buerkner, P.; Herve, M. Emmeans: Estimated Marginal Means, Aka Least-Squares Means. R Package. 2019. Available online: https://cran.r-project.org/web/packages/emmeans/index.html (accessed on 19 March 2021).
- Wickham, H. ggplot2: Elegant Graphics for Data Analysis, 2nd ed.; Springer: New York, NY, USA, 2016. [Google Scholar] [CrossRef]
- Huang, C.; Luo, Y.; Zeng, G.; Zhang, P.; Peng, R.; Jiang, X.; Jiang, M. Effect of adding microalgae to whiteleg shrimp culture on water quality, shrimp development and yield. Aquacult. Rep. 2022, 22, 100916. [Google Scholar] [CrossRef]
- Soulsby, C.; Malcolm, R.; Gibbins, C.; Dilks, C. Seasonality, water quality trends and biological responses in four streams in the Cairngorm Mountains, Scotland. Hydrol. Earth Syst. Sci. 2001, 5, 433–450. [Google Scholar] [CrossRef]
- Soulsby, C.; Gibbins, C.; Wade, A.J.; Smart, R.; Helliwell, R. Water quality in the Scottish uplands: A hydrological perspective on catchment hydrochemistry. Sci. Total Environ. 2002, 294, 73–94. [Google Scholar] [CrossRef]
- Harley, R.A.; Glover, C.N. The impacts of stress on sodium metabolism and copper accumulation in a freshwater fish. Aquat. Toxicol. 2014, 147, 41–47. [Google Scholar] [CrossRef]
- Bartelme, R.P.; McLellan, S.L.; Newton, R.J. Freshwater recirculating aquaculture system operations drive biofilter bacterial community shifts around a stable nitrifying consortium of ammonia-oxidising Archaea and Comammox Nitrospira. Front. Microbiol. 2017, 8, 101. [Google Scholar] [CrossRef] [PubMed] [Green Version]
- Hovanec, T.A.; DeLong, E.F. Comparative analysis of nitrifying bacteria associated with freshwater and marine aquaria. Appl. Environ. Microbiol. 1996, 62, 2888–2896. [Google Scholar] [CrossRef] [Green Version]
- Blancheton, J.P.; Attramadal, K.J.K.; Michaudd, L.; Roque d’Orbcastel, E.; Vadstein, O. Insight into bacterial population in aquaculture systems and its implication. Aquacult. Engin. 2013, 53, 30–39. [Google Scholar] [CrossRef]
- Wright, P.A.; Wood, C.M. Seven things fish know about ammonia and we don’t. Resp. Physiol. Neurobiol. 2012, 184, 231–240. [Google Scholar] [CrossRef]
- Randall, D.J.; Tsui, T.K.N. Ammonia toxicity in fish. Mar. Poll. Bull. 2002, 45, 17–23. [Google Scholar] [CrossRef]
- Emerson, K.; Russo, R.C.; Lund, R.E.; Thurston, R.V. Aqueous ammonia equilibrium calculations: Effects of pH and temperature. J. Fish. Res. Bd Can. 1975, 32, 2379–2383. [Google Scholar] [CrossRef]
- Roberts, H.; Palmeiro, B.S. Toxicology of aquarium fish. Vet. Clin. N. Am. Exotic Anim. Pract. 2008, 11, 359–374. [Google Scholar] [CrossRef]
- Herson, D.S.; McGonigle, B.; Payer, M.A.; Baker, K.H. Attachment as a factor in the protection of Enterobacter cloacae from chlorination. Appl. Environ. Microbiol. 1987, 53, 1178–1180. [Google Scholar] [CrossRef] [Green Version]
- Ekundayo, T.C.; Igwaran, A.; Oluwafemi, Y.D.; Okoh, A.I. Global bibliometric meta-analytic assessment of research trends on microbial chlorine resistance in drinking water/water treatment systems. J. Environ. Manag. 2021, 278, 11641. [Google Scholar] [CrossRef]
- Trautmann, M.; Lepper, P.M.; Haller, M. Ecology of Pseudomonas aeruginosa in the intensive care unit and the evolving role of water outlets as a reservoir of the organism. Am. J. Infect. Cont. 2005, 33, S41–S49. [Google Scholar] [CrossRef] [PubMed]
- Gavriel, A.A.; Landre, J.P.B.; Lamb, A.J. Incidence of mesophilic Aeromonas within a public drinking water supply in north-east Scotland. J. Appl. Microbiol. 1998, 84, 383–392. [Google Scholar] [CrossRef]
- Tripathy, S.; Kumar, N.; Mohanty, S.; Samanta, M.; Mandal, R.N.; Maiti, N.K. Characterisation of Pseudomonas aeruginosa isolated from freshwater culture systems. Microbiol. Res. 2007, 162, 391–396. [Google Scholar] [CrossRef]
- Castignetti, D.; Hollocher, T.C. Heterotrophic nitrification among denitrifiers. Appl. Environ. Microbiol. 1984, 47, 620–623. [Google Scholar] [CrossRef] [Green Version]
- Liu, Y.; Rzeszutek, E.; van der Voort, M.; Wu, C.-H.; Thoen, E.; Skaar, I.; Bulone, V.; Dorrestein, P.C.; Raaijmakers, J.M.; de Bruijn, I. Diversity of aquatic Pseudomonas species and their activity against the fish pathogenic oomycete Saprolegnia. PLoS ONE 2015, 10, e0136241. [Google Scholar] [CrossRef]
- Evans, B.B.; Lester, R.J.G. Parasites of ornamental fish imported into Australia. Bull. Eur. Assoc. Fish Pathol. 2001, 21, 51–55. [Google Scholar]
- Lewbart, G.A. Bacteria and ornamental fish. Sem. Avian Exotic Pet Med. 2001, 10, 48–56. [Google Scholar] [CrossRef]


| Parameter | Treatment | Season | Week | Treatment × Season | Season × Week |
|---|---|---|---|---|---|
| Oxygen | F3,16 = 0.5; p = 0.6663 | F1,285 = 2.6; p = 0.107 | F7,285 = 25.8; p < 0.0001 | F3,282 = 2.0; p = 0.119 | F7,285 = 32.1; p < 0.0001 |
| Temperature | F3,16 = 0.03; p = 0.994 | F1,281 = 114.7; p < 0.0001 | F7,281 = 2.9; p = 0.0050 | F3,281 = 6.9; p = 0.0003 | F7,281 = 7.4; p < 0.0001 |
| pH | F4,16 = 75.1; p < 0.0001 | F1,295 = 176.3; p < 0.0001 | F7,295 = 14.3; p < 0.0001 | F4,295 = 8.8; p < 0.0001 | F7,295 = 22.3; p < 0.0001 |
| TAN 1 | F4,16 = 5.1; p = 0.0076 | F1,293 = 70.6; p < 0.0001 | F7,293 = 4.1; p = 0.0003 | F7,293 = 5.0; p = 0.0006 | F4,293 = 4.2; p = 0.0002 |
| Unionised ammonia | F4,16 = 0; p = 0.7896 | F1,297 = 27; p < 0.0001 | F7,297 = 3; p = 0.0137 | F4,293 = 0.0; p = 0.82 | F7,297 = 3.0; p = 0.012 |
| Nitrate | F4,16 = 14.9; p < 0.0001 | F1,278 = 134.7; p < 0.0001 | F7,278 = 219.4; p < 0.0001 | F4,278 = 5.1; p < 0.0001 | F7,278 = 25.7; p < 0.0001 |
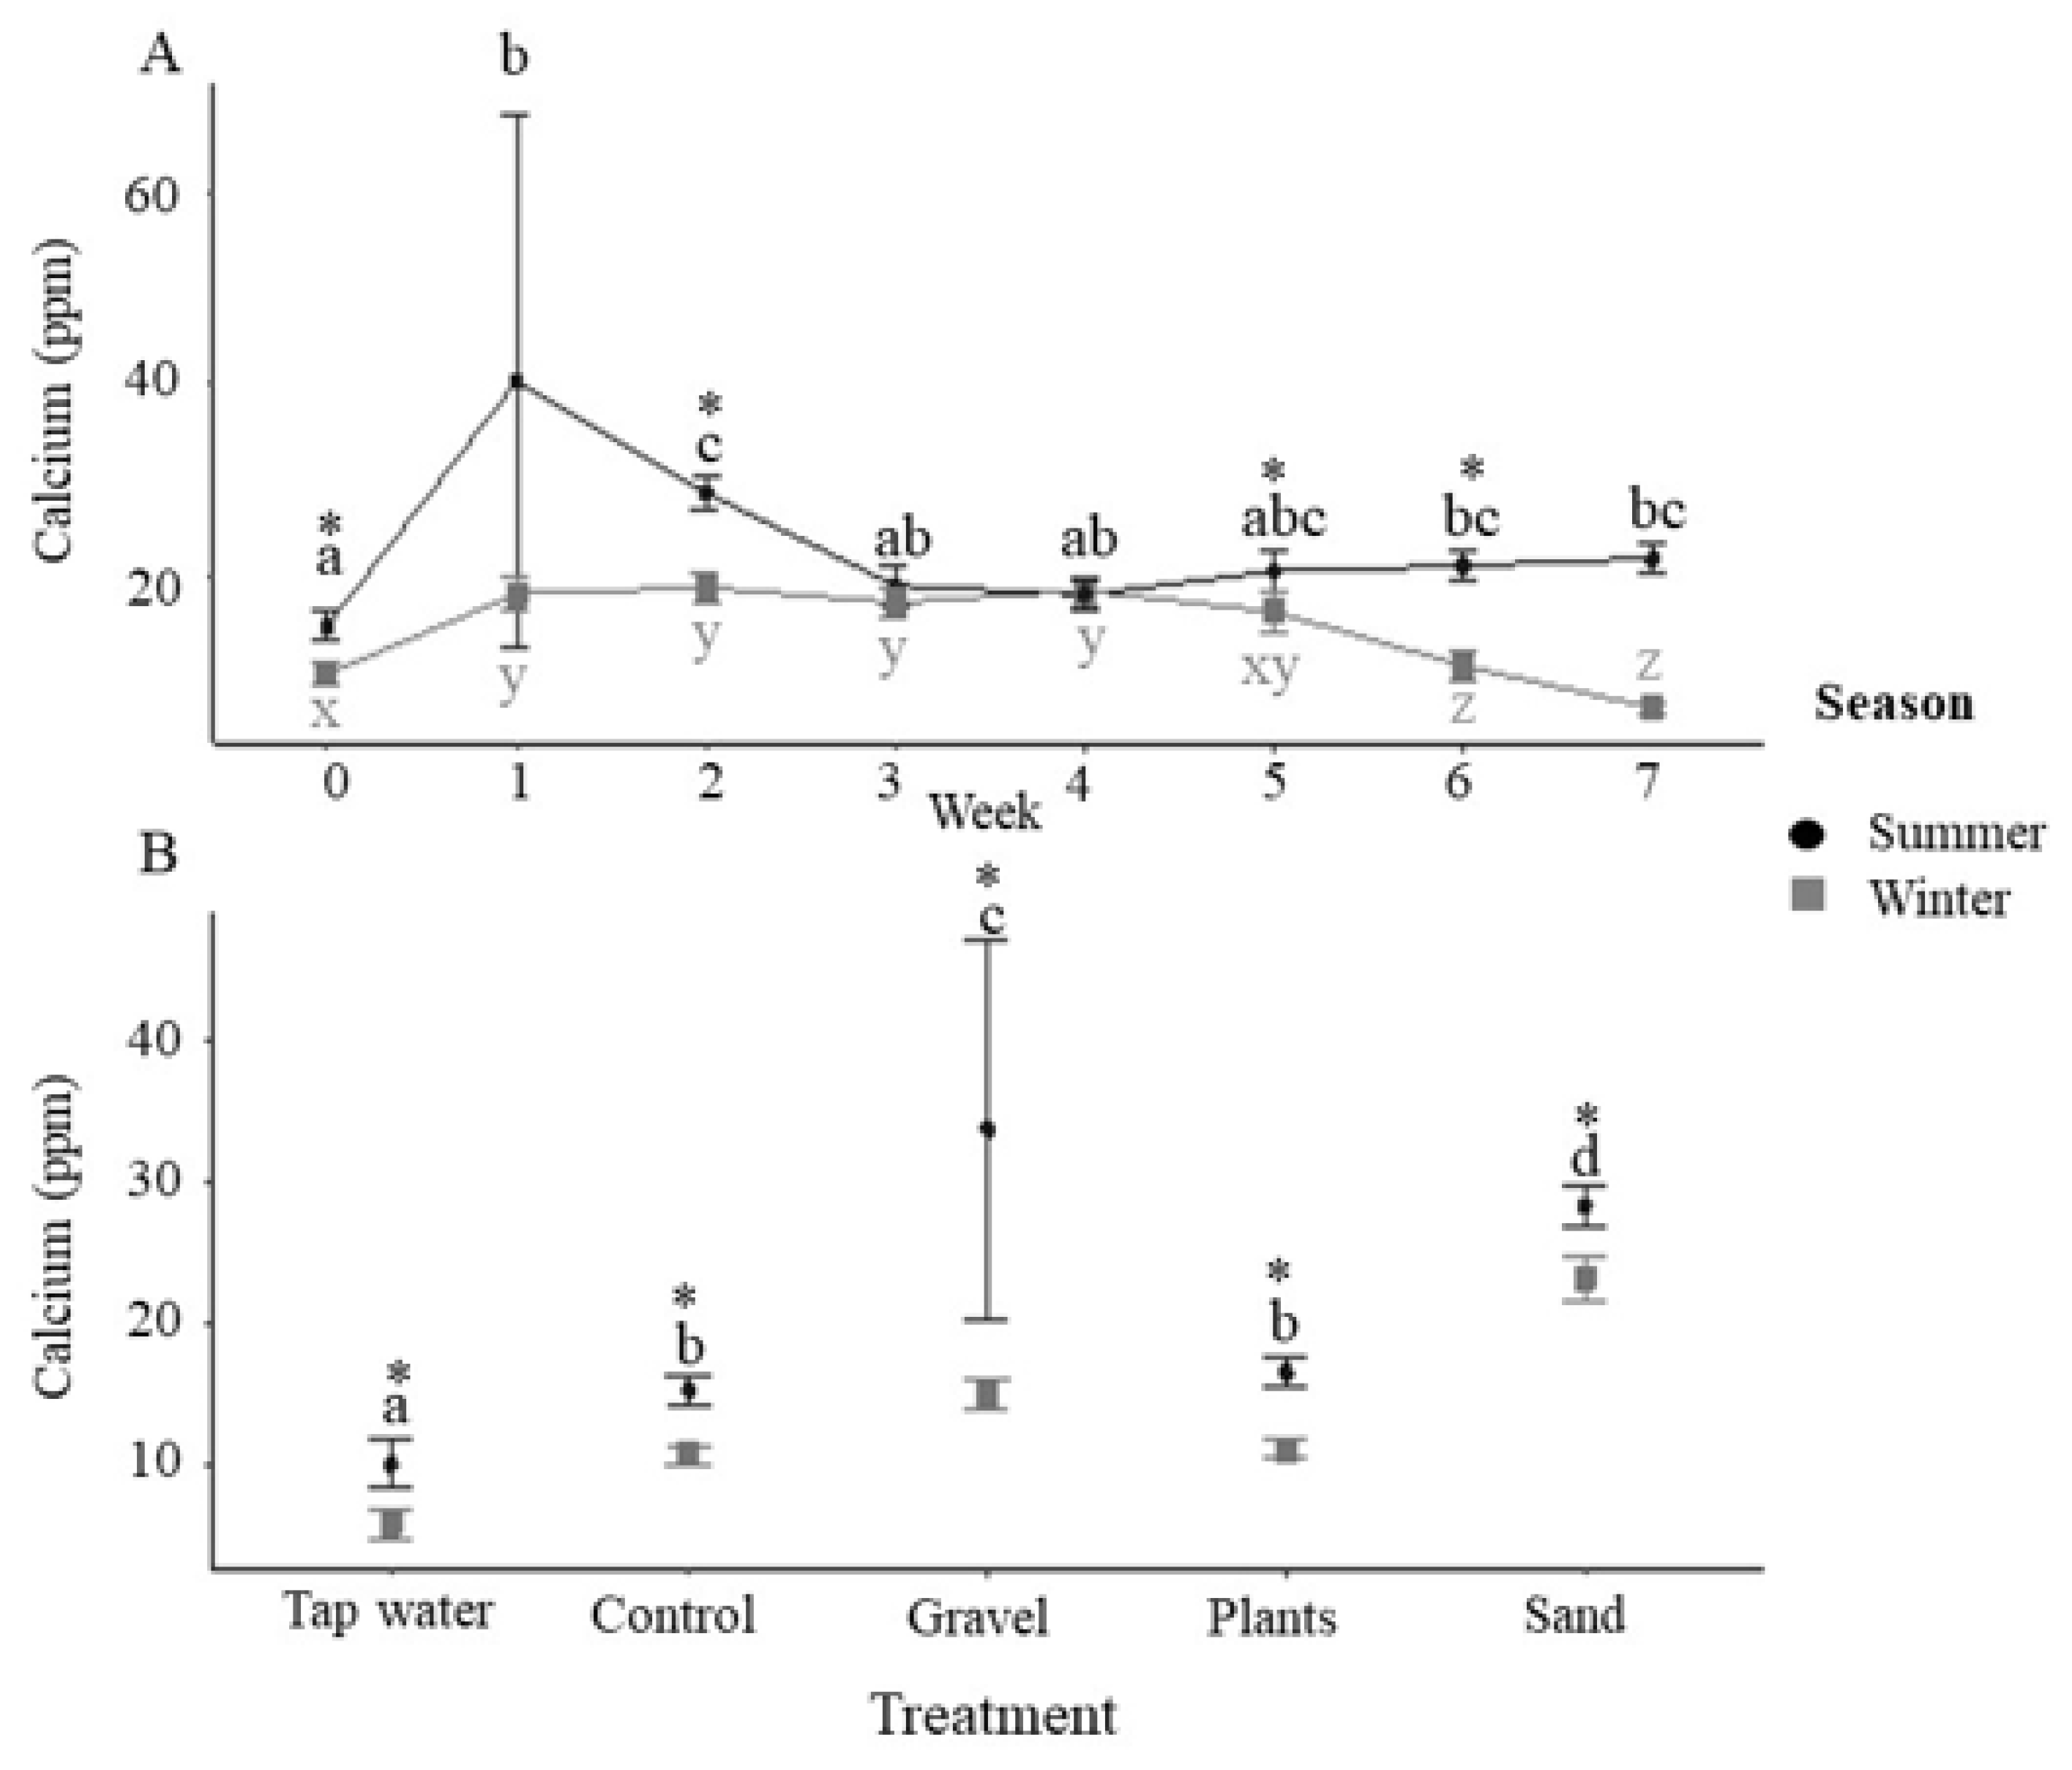
| Calcium | F4,16 = 40.6; p < 0.0001 | F1,296 = 57.5; p < 0.0001 | F7,296 = 12.3; p < 0.0001 | F4,292 = 0.6; p = 0.6498 | F7,296 = 10.5; p < 0.0001 |
| Potassium | F4,16 = 4.945; p = 0.0087 | F1,292 = 248.9; p < 0.0001 | F7,292 = 110.3; p < 0.0001 | F4,292 = 5.5; p = 0.0003 | F7,292 = 32.1; p < 0.0001 |
| Magnesium | F4,16 = 62.3; p < 0.0001 | F1,292 = 307.6; p < 0.0001 | F7,292 = 18.4; p < 0.0001 | F4,292 = 10.1; p < 0.0001 | F7,292 = 15.3; p < 0.0001 |
| Sodium | F4,16 = 8.5; p = 0.0007 | F1,292 = 1144.5; p < 0.0001 | F7,292 = 73.6; p < 0.0001 | F4,292 = 7.5; p < 0.0001 | F7,292 = 35.8; p < 0.0001 |
Publisher’s Note: MDPI stays neutral with regard to jurisdictional claims in published maps and institutional affiliations. |
© 2022 by the authors. Licensee MDPI, Basel, Switzerland. This article is an open access article distributed under the terms and conditions of the Creative Commons Attribution (CC BY) license (https://creativecommons.org/licenses/by/4.0/).
Share and Cite
Vanderzwalmen, M.; Sánchez Lacalle, D.; Tamilselvan, P.; McNeill, J.; Delieuvin, D.; Behlouli, K.; Hursthouse, A.; McLellan, I.; Alexander, M.E.; Henriquez, F.L.; et al. The Effect of Substrate on Water Quality in Ornamental Fish Tanks. Animals 2022, 12, 2679. https://doi.org/10.3390/ani12192679
Vanderzwalmen M, Sánchez Lacalle D, Tamilselvan P, McNeill J, Delieuvin D, Behlouli K, Hursthouse A, McLellan I, Alexander ME, Henriquez FL, et al. The Effect of Substrate on Water Quality in Ornamental Fish Tanks. Animals. 2022; 12(19):2679. https://doi.org/10.3390/ani12192679
Chicago/Turabian StyleVanderzwalmen, Myriam, Daniel Sánchez Lacalle, Priyadarshini Tamilselvan, Jason McNeill, Dorine Delieuvin, Khadidja Behlouli, Andrew Hursthouse, Iain McLellan, Mhairi E. Alexander, Fiona L. Henriquez, and et al. 2022. "The Effect of Substrate on Water Quality in Ornamental Fish Tanks" Animals 12, no. 19: 2679. https://doi.org/10.3390/ani12192679