Functional Analysis of Haplotypes in Bovine PSAP Gene and Their Relationship with Beef Cattle Production Traits
by
Haidong Zhao
1, 
Mingli Wu
1,
Xiaohua Yi
1,
Xiaoqin Tang
1,
Pingbo Chen
1,
Shuhui Wang
1 and
Xiuzhu Sun
2,* 1
College of Animal Science and Technology, Northwest A&F University, Yangling 712100, Shaanxi, China
2
College of Grassland Agriculture, Northwest A&F University, Yangling 712100, Shaanxi, China
*
Author to whom correspondence should be addressed.
Animals 2021, 11(1), 49; https://doi.org/10.3390/ani11010049
Submission received: 8 November 2020
/
Revised: 24 December 2020
/
Accepted: 25 December 2020
/
Published: 29 December 2020
(This article belongs to the Section Animal Genetics and Genomics)
Abstract
:Simple Summary
With the rapid development of information technology and molecular biotechnology, animal molecular breeding technology is playing an increasingly important role in beef cattle breeding. Prosaposin (PSAP) is involved in regulating the growth and development of animals, and it is reported that PSAP is an important marker-assisted selection (MAS) in cattle herd. The purpose of this study was to explore the novel variants in 3’ UTR of cattle PSAP and evaluate their effects on the morphological traits of four Chinese cattle breeds. In this study, 13 variants were identified in the PSAP 3’ UTR from 501 individuals belonging to four cattle breeds. In Nanyang cattle, the distribution of haplotypes was different from the other three breeds. Two groups of haplotypes had association with morphological traits by changing the secondary structures of PSAP 3’ UTR rather than the miR-184 target sites. This study not only expands the genetic variation spectrum of cattle PSAP but also contributes to MAS genetics and breeding of Chinese cattle breeds.
Abstract
The purpose of this study was to explore functional variants in the prosaposin (PSAP) three prime untranslated region (3’ UTR) and clarify the relationship between the variants and morphological traits. Through Sanger sequencing, 13 variations were identified in bovine PSAP in four Chinese cattle breeds, with six of them being loci in 3’ UTR. In particular, Nanyang (NY) cattle had a special genotype and haplotype distribution compared to the other three breeds. NY cattle with ACATG and GCGTG haplotypes had higher morphological traits than GTACA and GTACG haplotypes. The results of dual-luciferase reporter assay showed that ACATG and GCGTG haplotypes affected the morphological traits of NY cattle by altering the secondary structure of PSAP 3’ UTR rather than the miR-184 target sites. The findings of this study could be an evidence of a complex and varying mechanism between variants and animal morphological traits and could be used to complement candidate genes for molecular breeding.
1. Introduction
With continuous economic development and growth of formalized cultivation, beef cattle breeding is in urgent need of strengthening. Traditional breeding methods are slow to produce results, making it difficult to meet demand. Fortunately, over the last decade, bioinformatics has revolutionized livestock breeding. Compared with traditional breeding, molecular breeding has a number of advantages, such as saving time and shortening the generation interval [1,2]. For example, genome-wide association studies (GWAS) have mapped thousands of genetic variants associated with animal development, which is an unprecedented high-resolution genetic characterization of animal breeding [3,4,5,6]. However, growing evidence suggests that successful livestock breeding requires deep understanding of the regulatory mechanism between the genotype and phenotype relationship [7,8,9,10]. The location of these variants can result in phenotype differences, including the level of DNA methylation, transcription factor binding sites, alternative splicing, and protein translation and modification [11,12,13]. China is rich in cattle genetic resources, including Qinchuan (QC), Nanyang (NY), Jiaxian red (JX), and Luxi (LX) cattle. The four breeds originated from the farming plain and have some excellent traits, such as well-developed muscles.
The prosaposin (PSAP) sequence is conserved in mammals and widely expressed in different tissues. Bovine PSAP is located in chromosome 10, including 15 exons. The alternative splicing of PSAP is reported to skip exon 8 (Gln-Asp-Gln) in several mammals, and our previous studies found that the alternative splicing of bovine PSAP was consistent with this (findings not published). PSAP code two types of proteins with completely different functions. The first is hydrolyzed into four sphingolipid activator proteins: saposins A, B, C, and D [14]. They are indispensable cofactors for the intralysosomal degradation of a number of sphingolipids within the lysosome. The second is secreted in semen, cerebrospinal fluid, milk, and other body fluids. They are involved in the nervous system, collective oxidative stress, sperm fertilization, and other biological processes [15]. PSAP is reported to be the target gene of androgen receptor (AR), and a potential molecular marker was identified in AR in our previous studies [16]. At the same time, PSAP regulates caspase, mitogen-activated protein kinase (MAPK), phosphatidylinositol 3’-kinase/AKT serine/threonine kinase 1 (PI3K/Akt), and transforming growth factor-β (TGF-β) pathways and has an important relationship with animal growth and development [17]. PSAP has been reported as a potential target gene in cattle breeding with functional single-nucleotide polymorphism (SNP) and insertion/deletion (InDels) loci associated with cattle morphological traits [18,19]. Considering their location, we speculate that the cattle PSAP gene also has other functional variations.
Therefore, the aim of this study was to explore the novel variants in bovine PSAP 3’ UTR and evaluate their effects on morphological traits in four cattle breeds. This study will not only extend the spectrum of genetic variations of cattle PSAP but also contribute to marker-assisted selection (MAS) in genetics and breeding in Chinese cattle breeds.
2. Materials and Methods
All experimental procedures were performed in accordance with the Regulations for the Administration of Affairs Concerning Experimental Animals approved by the State Council of People’s Republic of China. The study was approved by The Institutional Animal Care and Use Committee of Northwest A&F University (Permit Number: NWAFAC1019).
2.1. Samples and Data Collection
In order to explore variations in bovine PSAP 3’ UTR, 501 cattle samples from four breeds (LX, n = 104, female; QC, n = 123, female; NY, n = 137, female; JX, n = 137, female) were collected (Table 1). All animals within a breed were managed in the same condition, and sufficient feed was provided by total metabolic rate (TMR). Their morphological traits were measured, including body weight (BW), body height (BH), body length (BL), chest circumference (ChC), chest depth (ChD), chest width (ChW), hucklebone width (HuW), and hip width (HW). Genome DNA was extracted from the leukocytes of venous blood by the phenol chloroform method [16,20]. All DNA samples underwent quality assurance and were uniformly diluted to 50 ng/μL and stored at −80 °C [16].
2.2. Primer Design and Variation Genotyping
According to the cattle reference genome (ARS-UCD1.2) from the NCBI database (http://www.ncbi.nlm.nih.gov/), a pair of specific primers was designed by NCBI primer blast for PCR amplification of cattle PSAP 3’ UTR (Table 2). The forward primer was located in the 14th intron, and the reverse primer was located in the downstream region of PSAP. PCR amplification was performed in 20 μL final volume containing 10 μL 2 × PCR mix, 0.5 μM forward and reverse primers, 50 ng genomic DNA, and ddH2O up to 20 μL. The PCR protocol was touchdown PCR as follows: 5 min predegeneration, followed by 10 cycles at 95 °C for 30 s, 60 °C for 30 s (starting at 60 °C and decreasing by 1 °C per cycle), 72 °C for 30 s, 25 cycles at 95 °C for 30 s, annealing temperature for 30 s, 72 °C for 30 s, and finally extending for 10 min. The PCR products of all individuals were sequenced by Sanger sequencing (Sangon, Shanghai, China) to determine the variation types.
2.3. Dual-Luciferase Reporter Assay
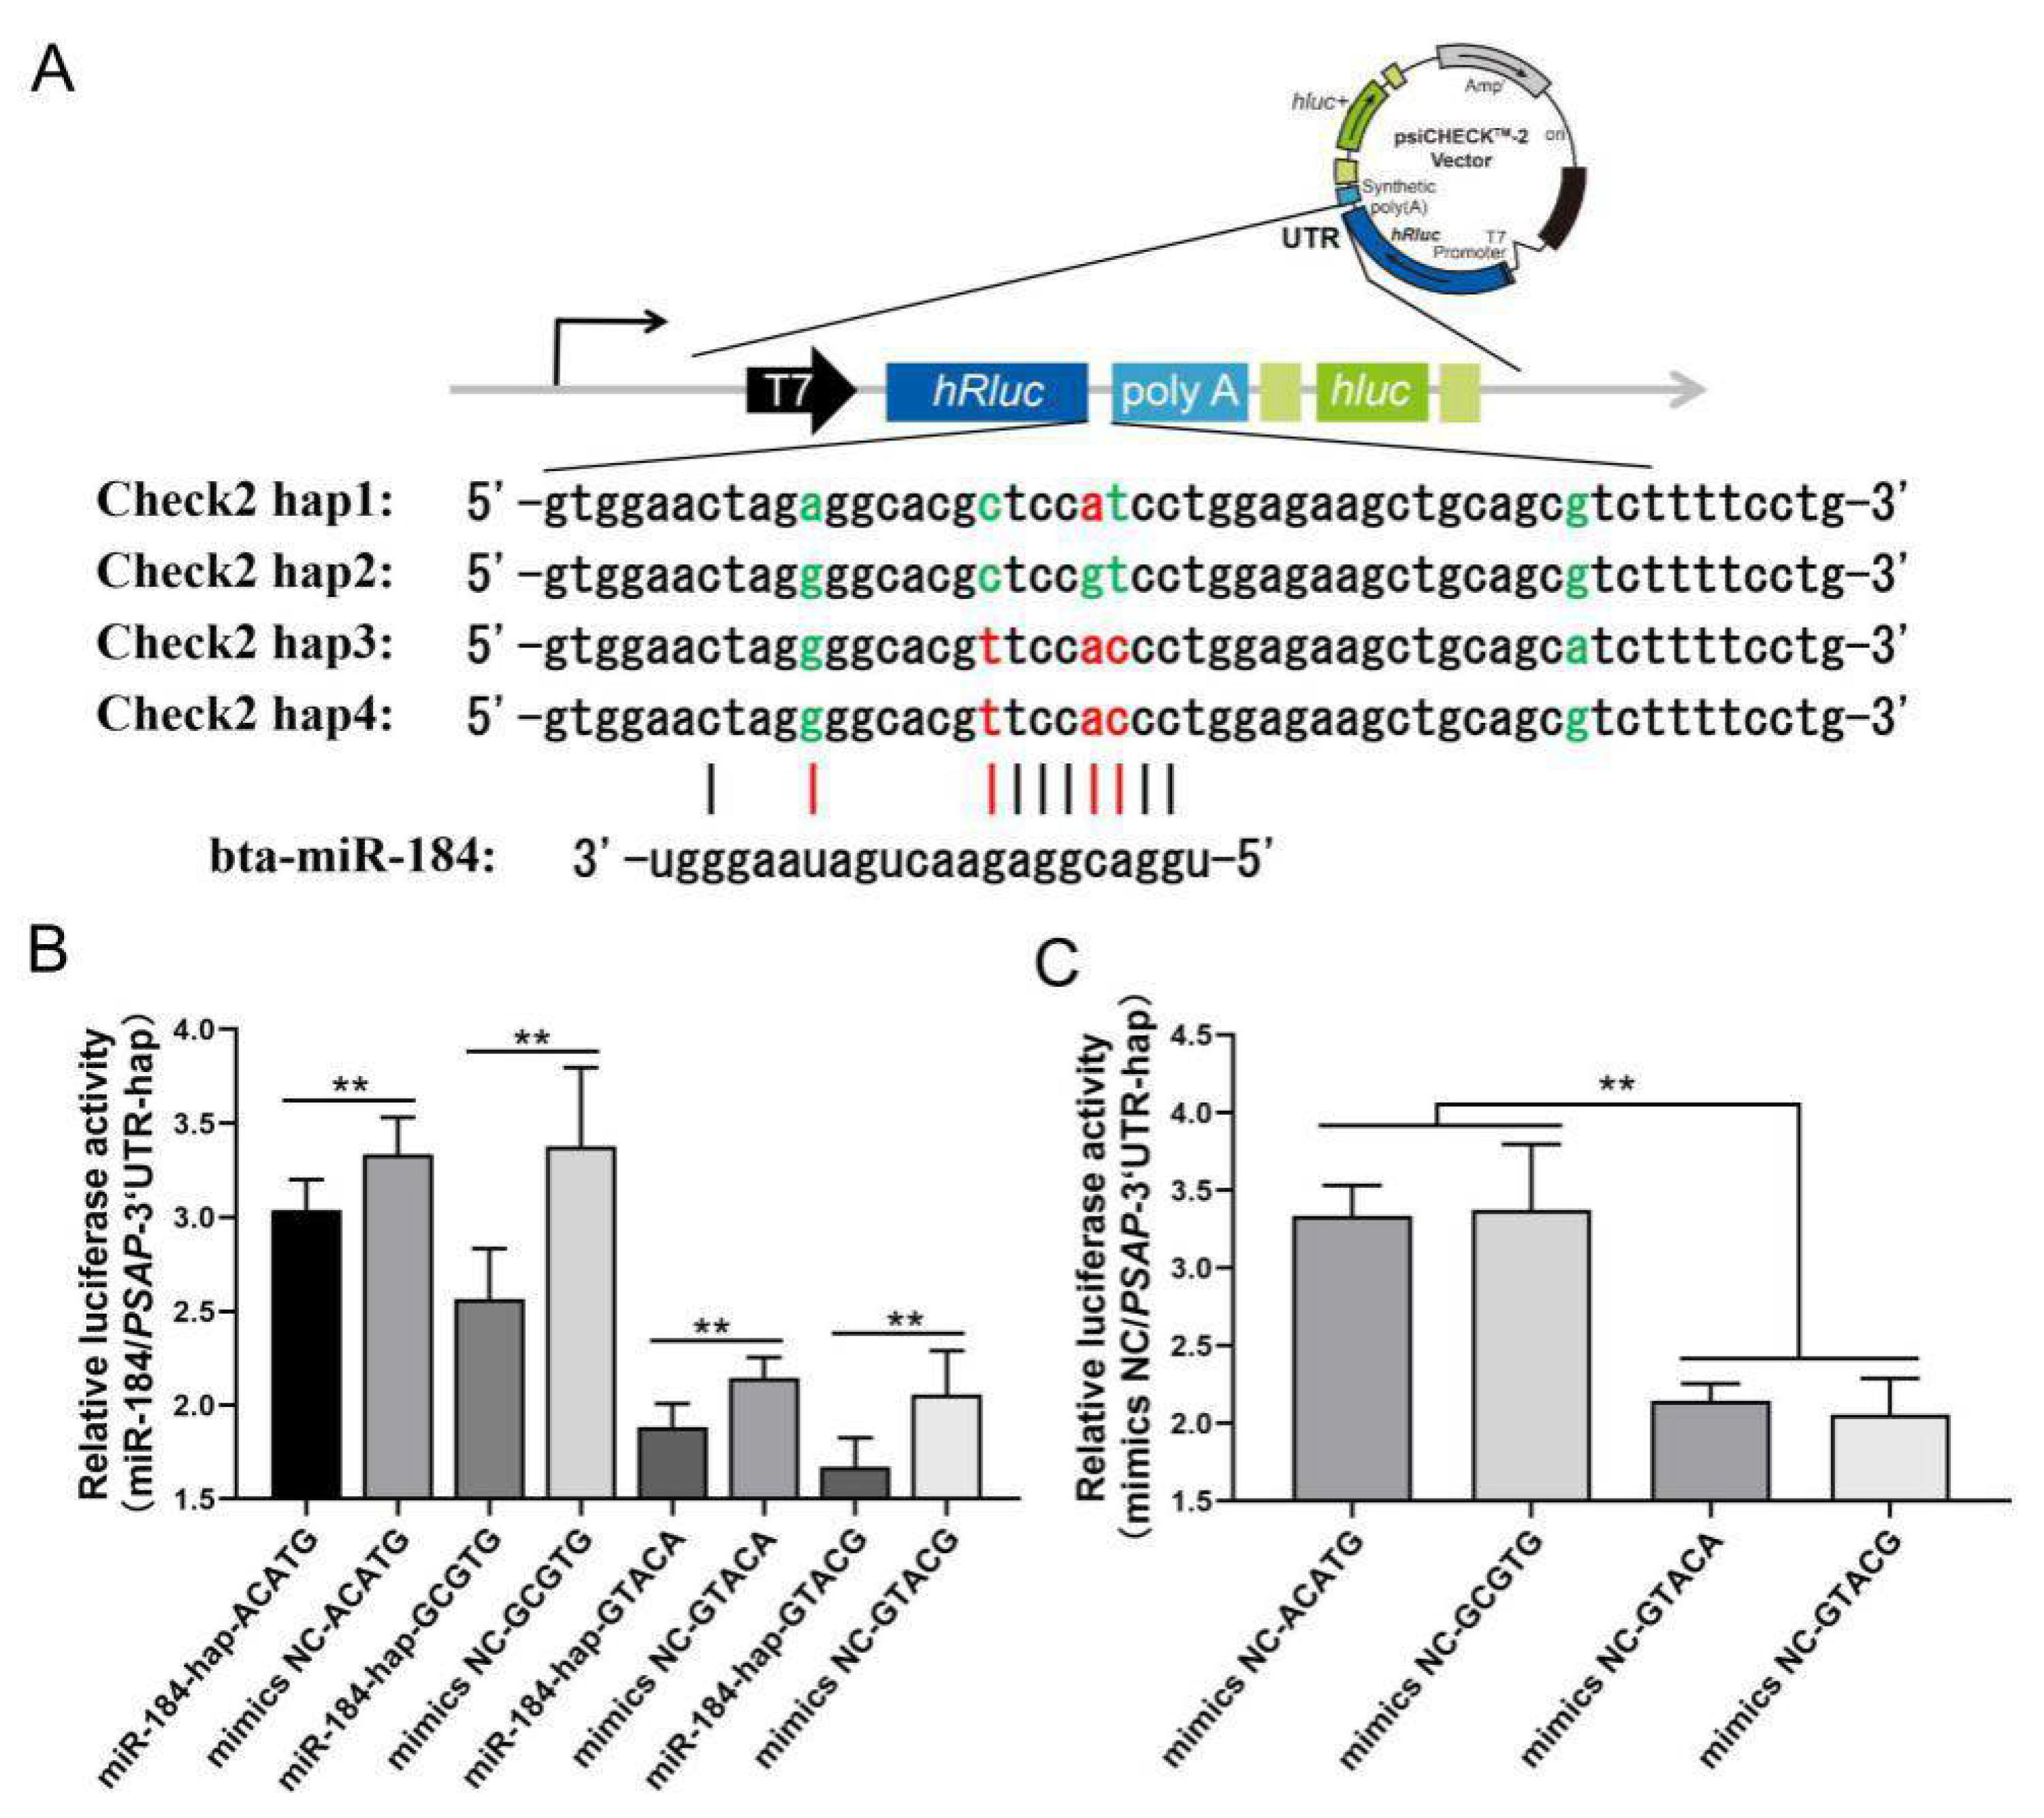
Human embryonic kidney cell line (HEK293T) was cultured in Dulbecco’s modified Eagle medium (DMEM; Hyclone, Logan, UT, USA) supplemented with 10% fetal bovine serum (BI, Kibbutz Beit Haemek, Israel), 500 U/mL penicillin, and 100 μg/mL streptomycin (Hyclone, Logan, UT, USA). The cell incubator was controlled at 37 °C and 5% of the CO2 volume. Four PSAP 3’ UTR haplotypes were cloned into psiCHECK2 plasmid by complementary double-stranded annealing, vector double enzyme restriction, and adapter ligation (Table 1). The cells were cotransfected with a mixture of 500 ng recombined reporter vectors and 3 μL miR-184 mimics. After 48 h, the luciferase activity was measured with a dual-luciferase reporter assay system (Promega, Madison, WI, USA). In the luciferase assay, the mimic NC was the negative control. The fold change of luciferase was calculated by comparing each miRNA to NC according to the manufacturer’s instructions. Primers (Table 2) were synthesized by Sangon Biotech (Shanghai, China) Co., Ltd.
2.4. Statistical Analysis
Sequences were contrasted and analyzed by Snapgene (GSL Biotech, Chicago, IL, USA). All the population genetic data were calculated and analyzed using the website www.Msrcall.com, including the Hardy–Weinberg equilibrium (HWE), homozygosity (Ho), heterozygosity (He), effective allele number (Ne), and polymorphism information content (PIC). Every cattle breed was collected in the same farm and were of the same gender (female), had a similar age (2–6 years old), had the same feeding management, and had no genetic relationship within a population. The records of morphological traits were analyzed in each cattle breed independently. Mixed linear model analysis was used to establish the influence of different parameters on morphological traits, not including the effects of farm, sex, or age of dam and sire, which had no significant effects on the variation of traits in the four cattle populations in this study. The least squares mean was utilized for morphological traits among the different genotypes and haplotypes: Yi = μ + Gi + ei, where Yi is the phenotypic value of morphological traits; μ is the overall population mean; Gj is the genotype; and ei is the random error. The chi-square test and ANOVA were used with SPSS software 18.0 (IBM, San Francisco, CA, USA) to test the genotype distribution and the association with morphological traits in different cattle breeds. The least significant difference (LSD) was used for multiple comparison. Statistical significance was measured at p < 0.05 and p < 0.01. Haplotype and linkage disequilibrium (LD) analyses were done using the website http://analysis.bio-x.cn/myAnalysis.php, and LD heatmap (R) and mRNA secondary structure were predicted using the online software RNAfold.
3. Results
3.1. Thirteen Variations Were Identified in Bovine PSAP
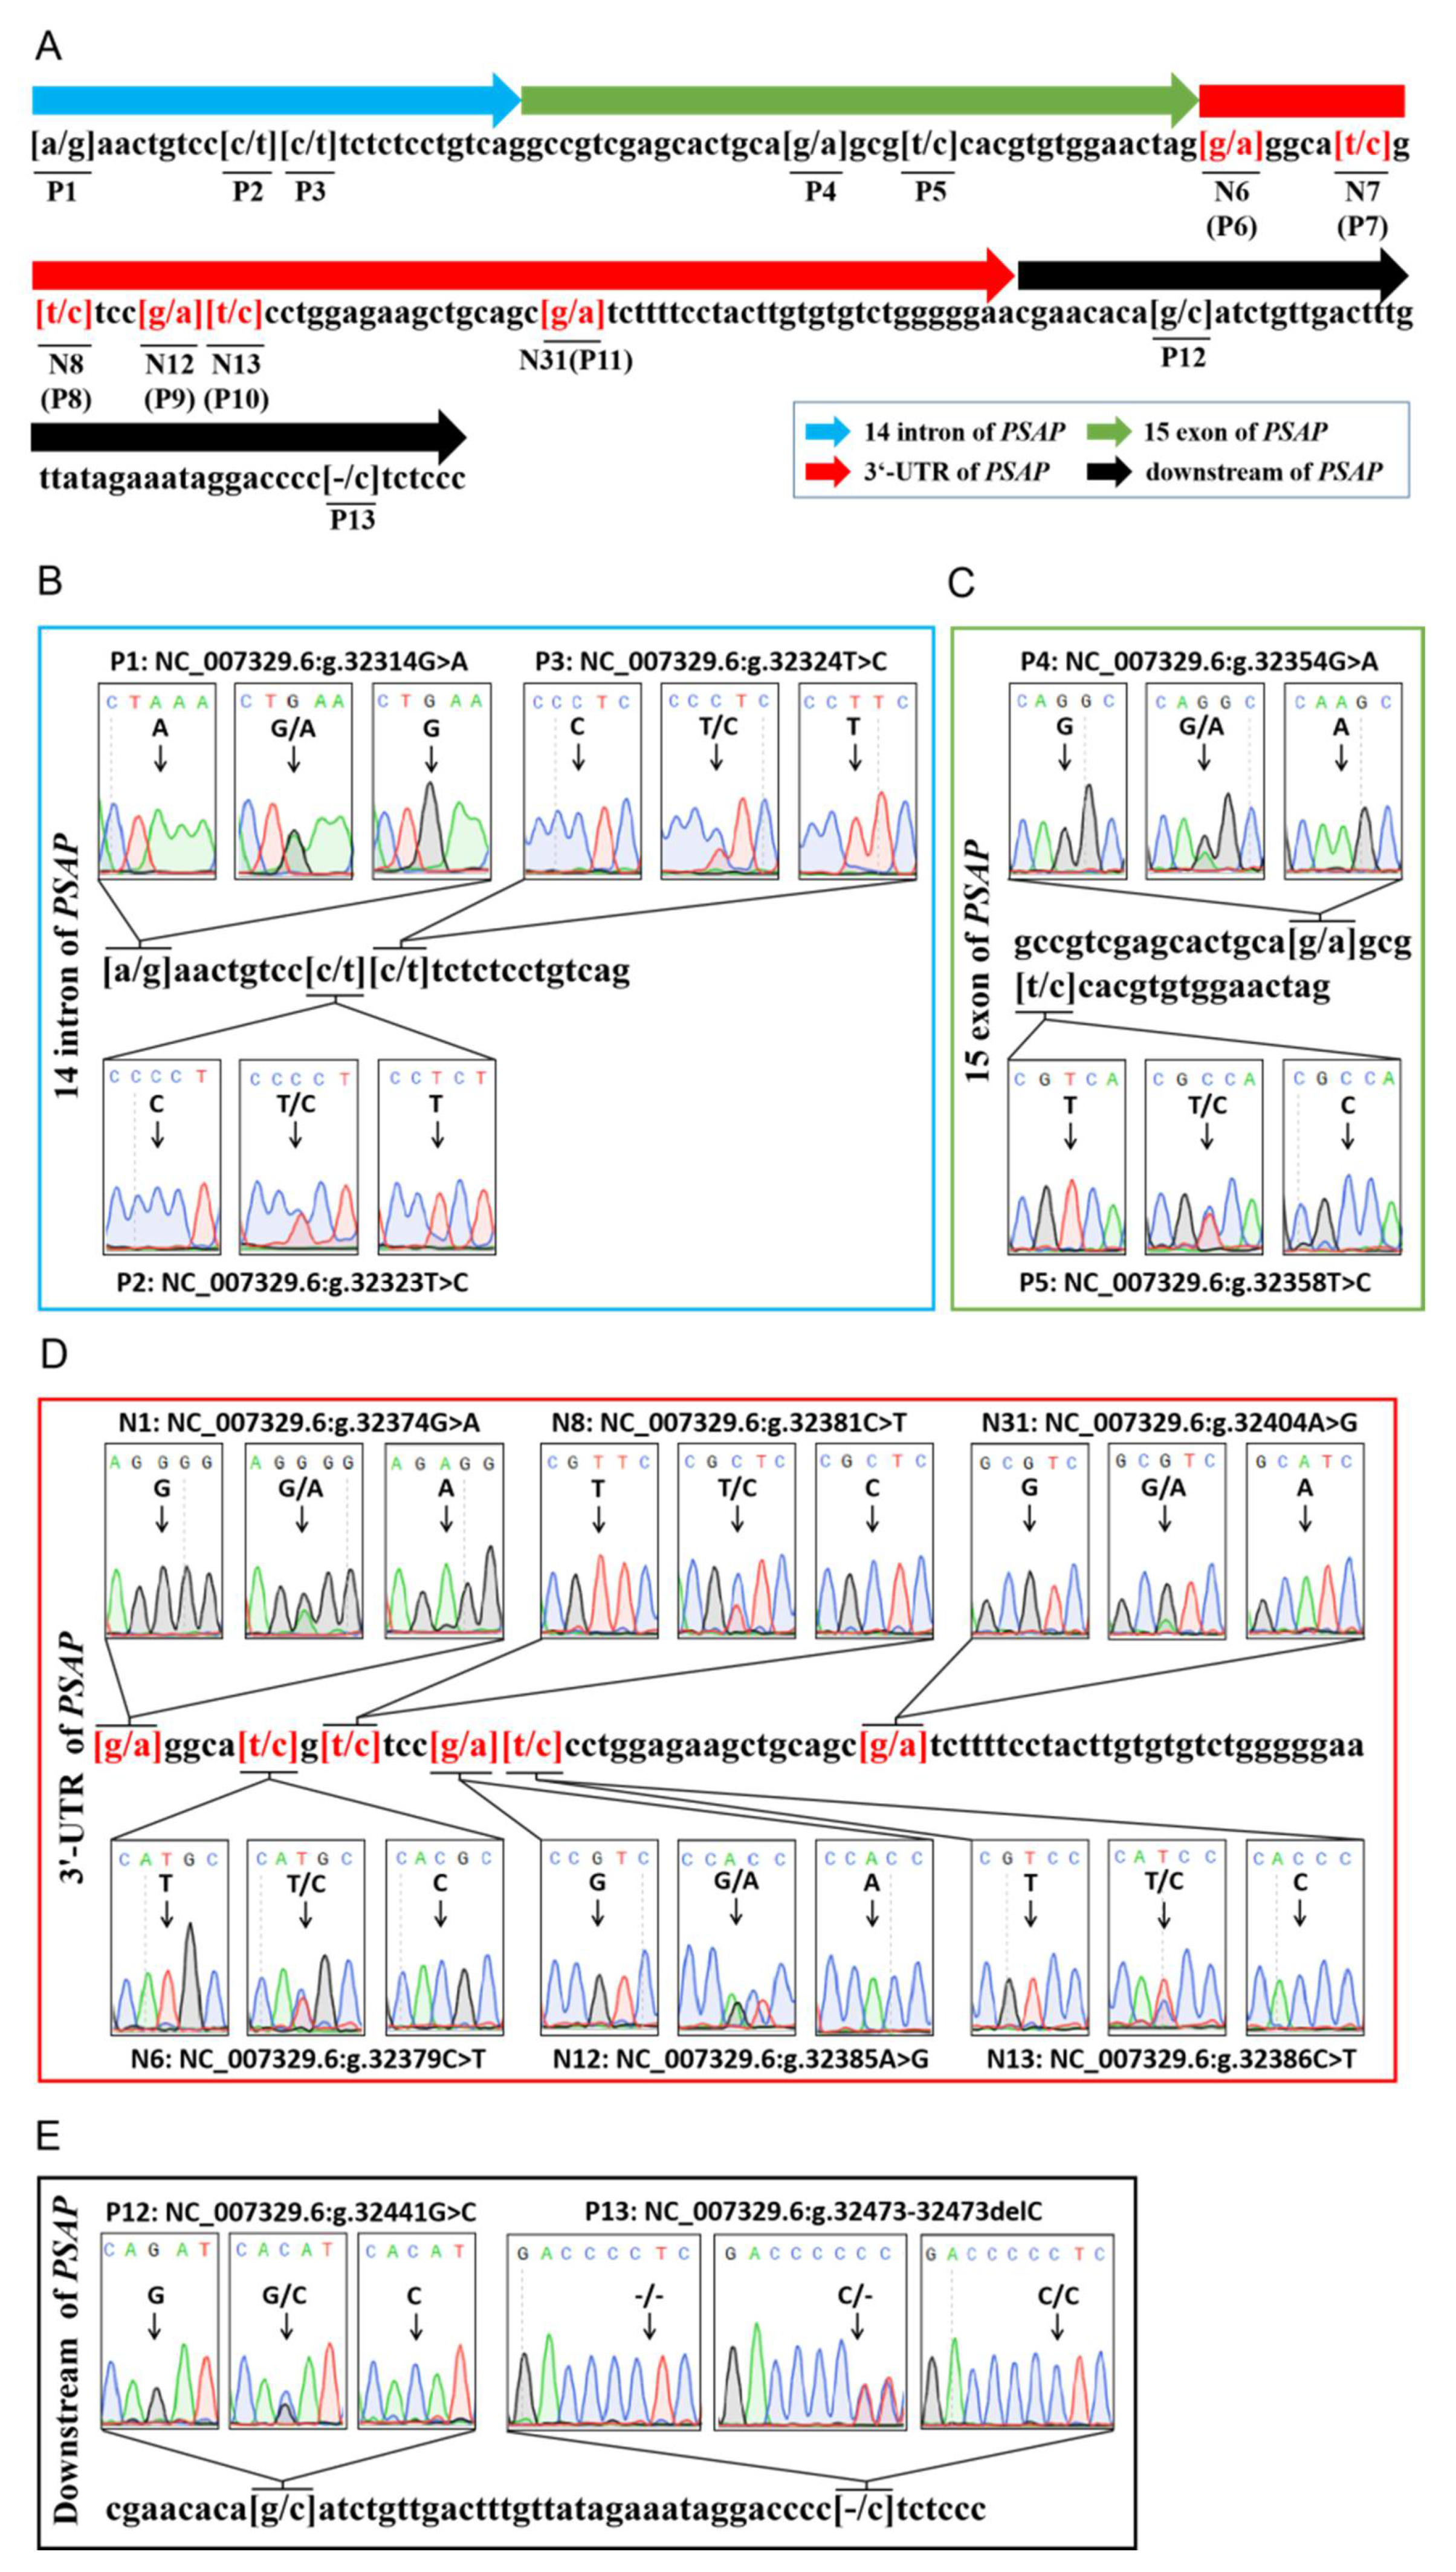
Through DNA sequencing, 13 variations were found in a 167 bp DNA fragment in bovine PSAP 3’ UTR, including 12 SNP loci and one deletion locus. Six of the SNPs were located in PSAP 3’ UTR. P1 (NC_007329.6g 23314G > A), P2 (NC_007329.6g 23323T > C), and P3 (NC_007329.6g 23324T > C) were located in the 14th intron of PSAP. P4 (NC_007329.6g 23354G > A) and P5 (NC_007329.6g 23355T > C) were located in the 15th exon of PSAP. The P4 locus was a missense mutation of Arg (AGG) to Lys (AAG), and the P5 locus was a synonymous mutation of Arg (CGT > CGC). P6 (NC_007329.6g 23374G > A), P7 (NC_007379.6g 23314C > T), P8 (NC_007381.6g 23314C > T), P9 (NC_007329.6g 23385A > G), P10 (NC_007329.6g 23386C > T), and P11 (NC_007329.6g 23404A > G) were located in PSAP 3’ UTR. P12 (NC_007329.6g 23441G > A) and P13 (NC_007329.6g 23473 del “T”) were located in the downstream region of PSAP (Figure 1). P6–11 were named N1, N6, N8, N12, N13, and N31, respectively, to indicate the location of the mutation in 3’ UTR.
3.2. Population Parameters of 13 Variations in Four Cattle Breeds
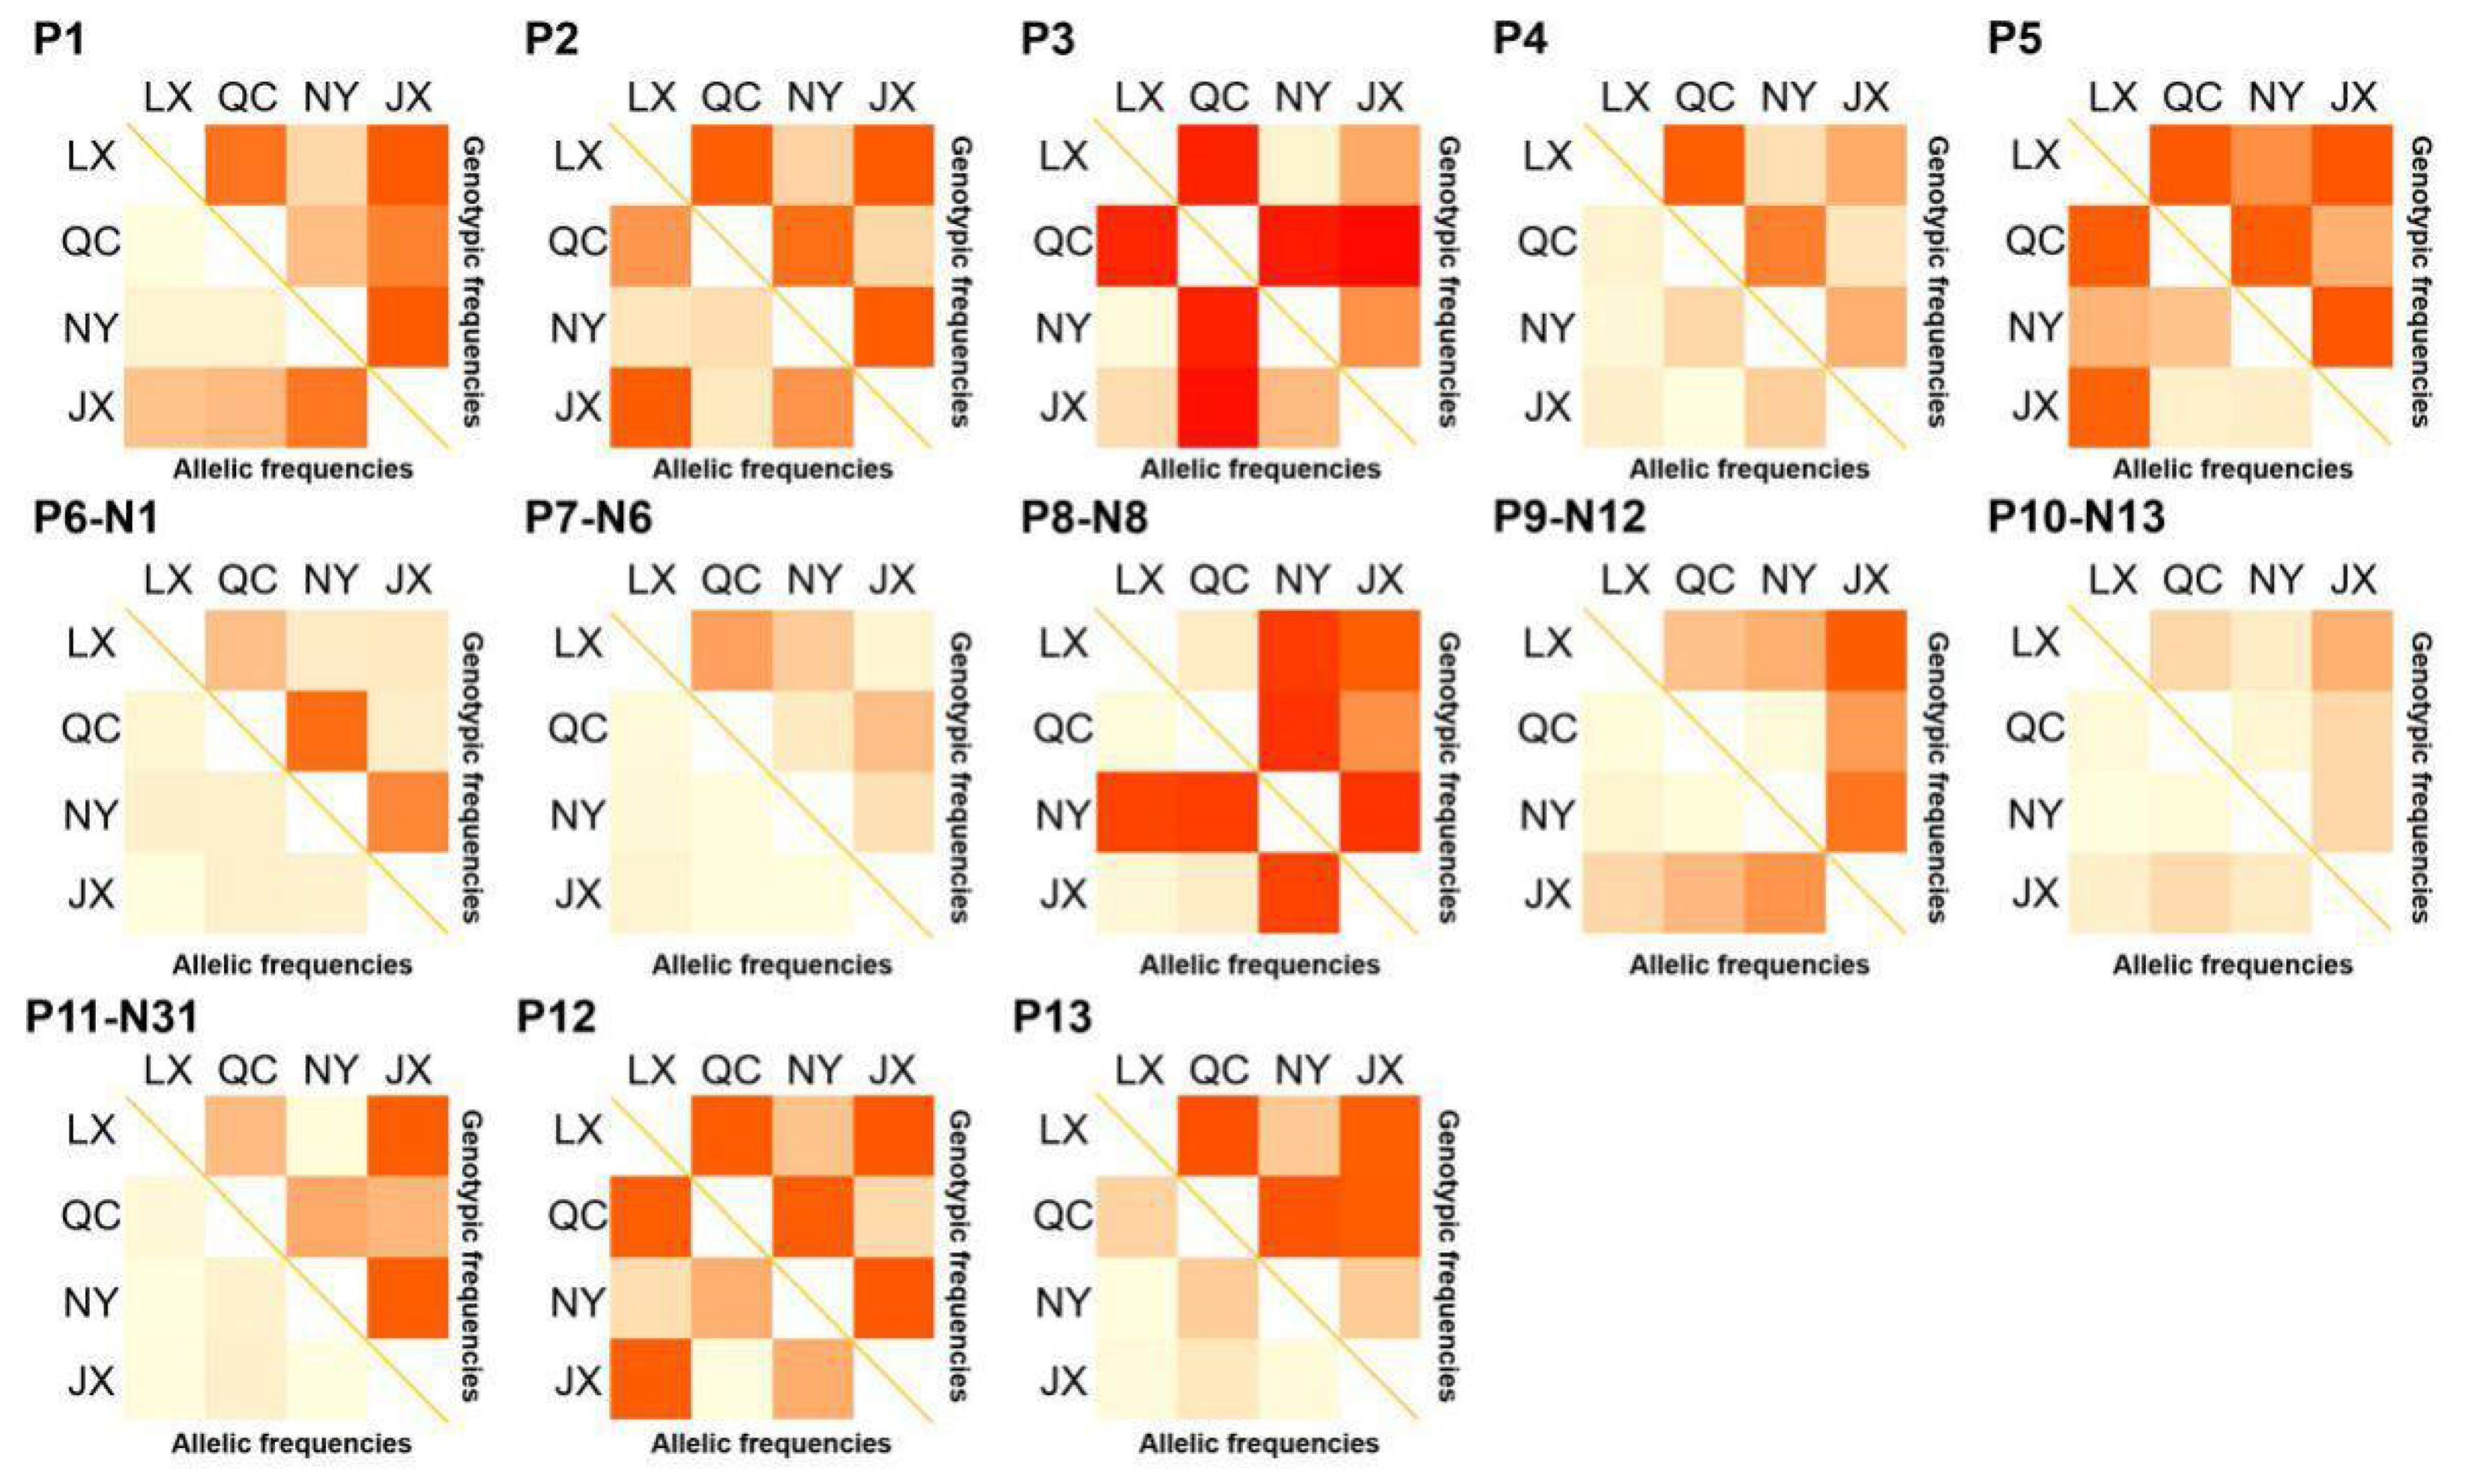
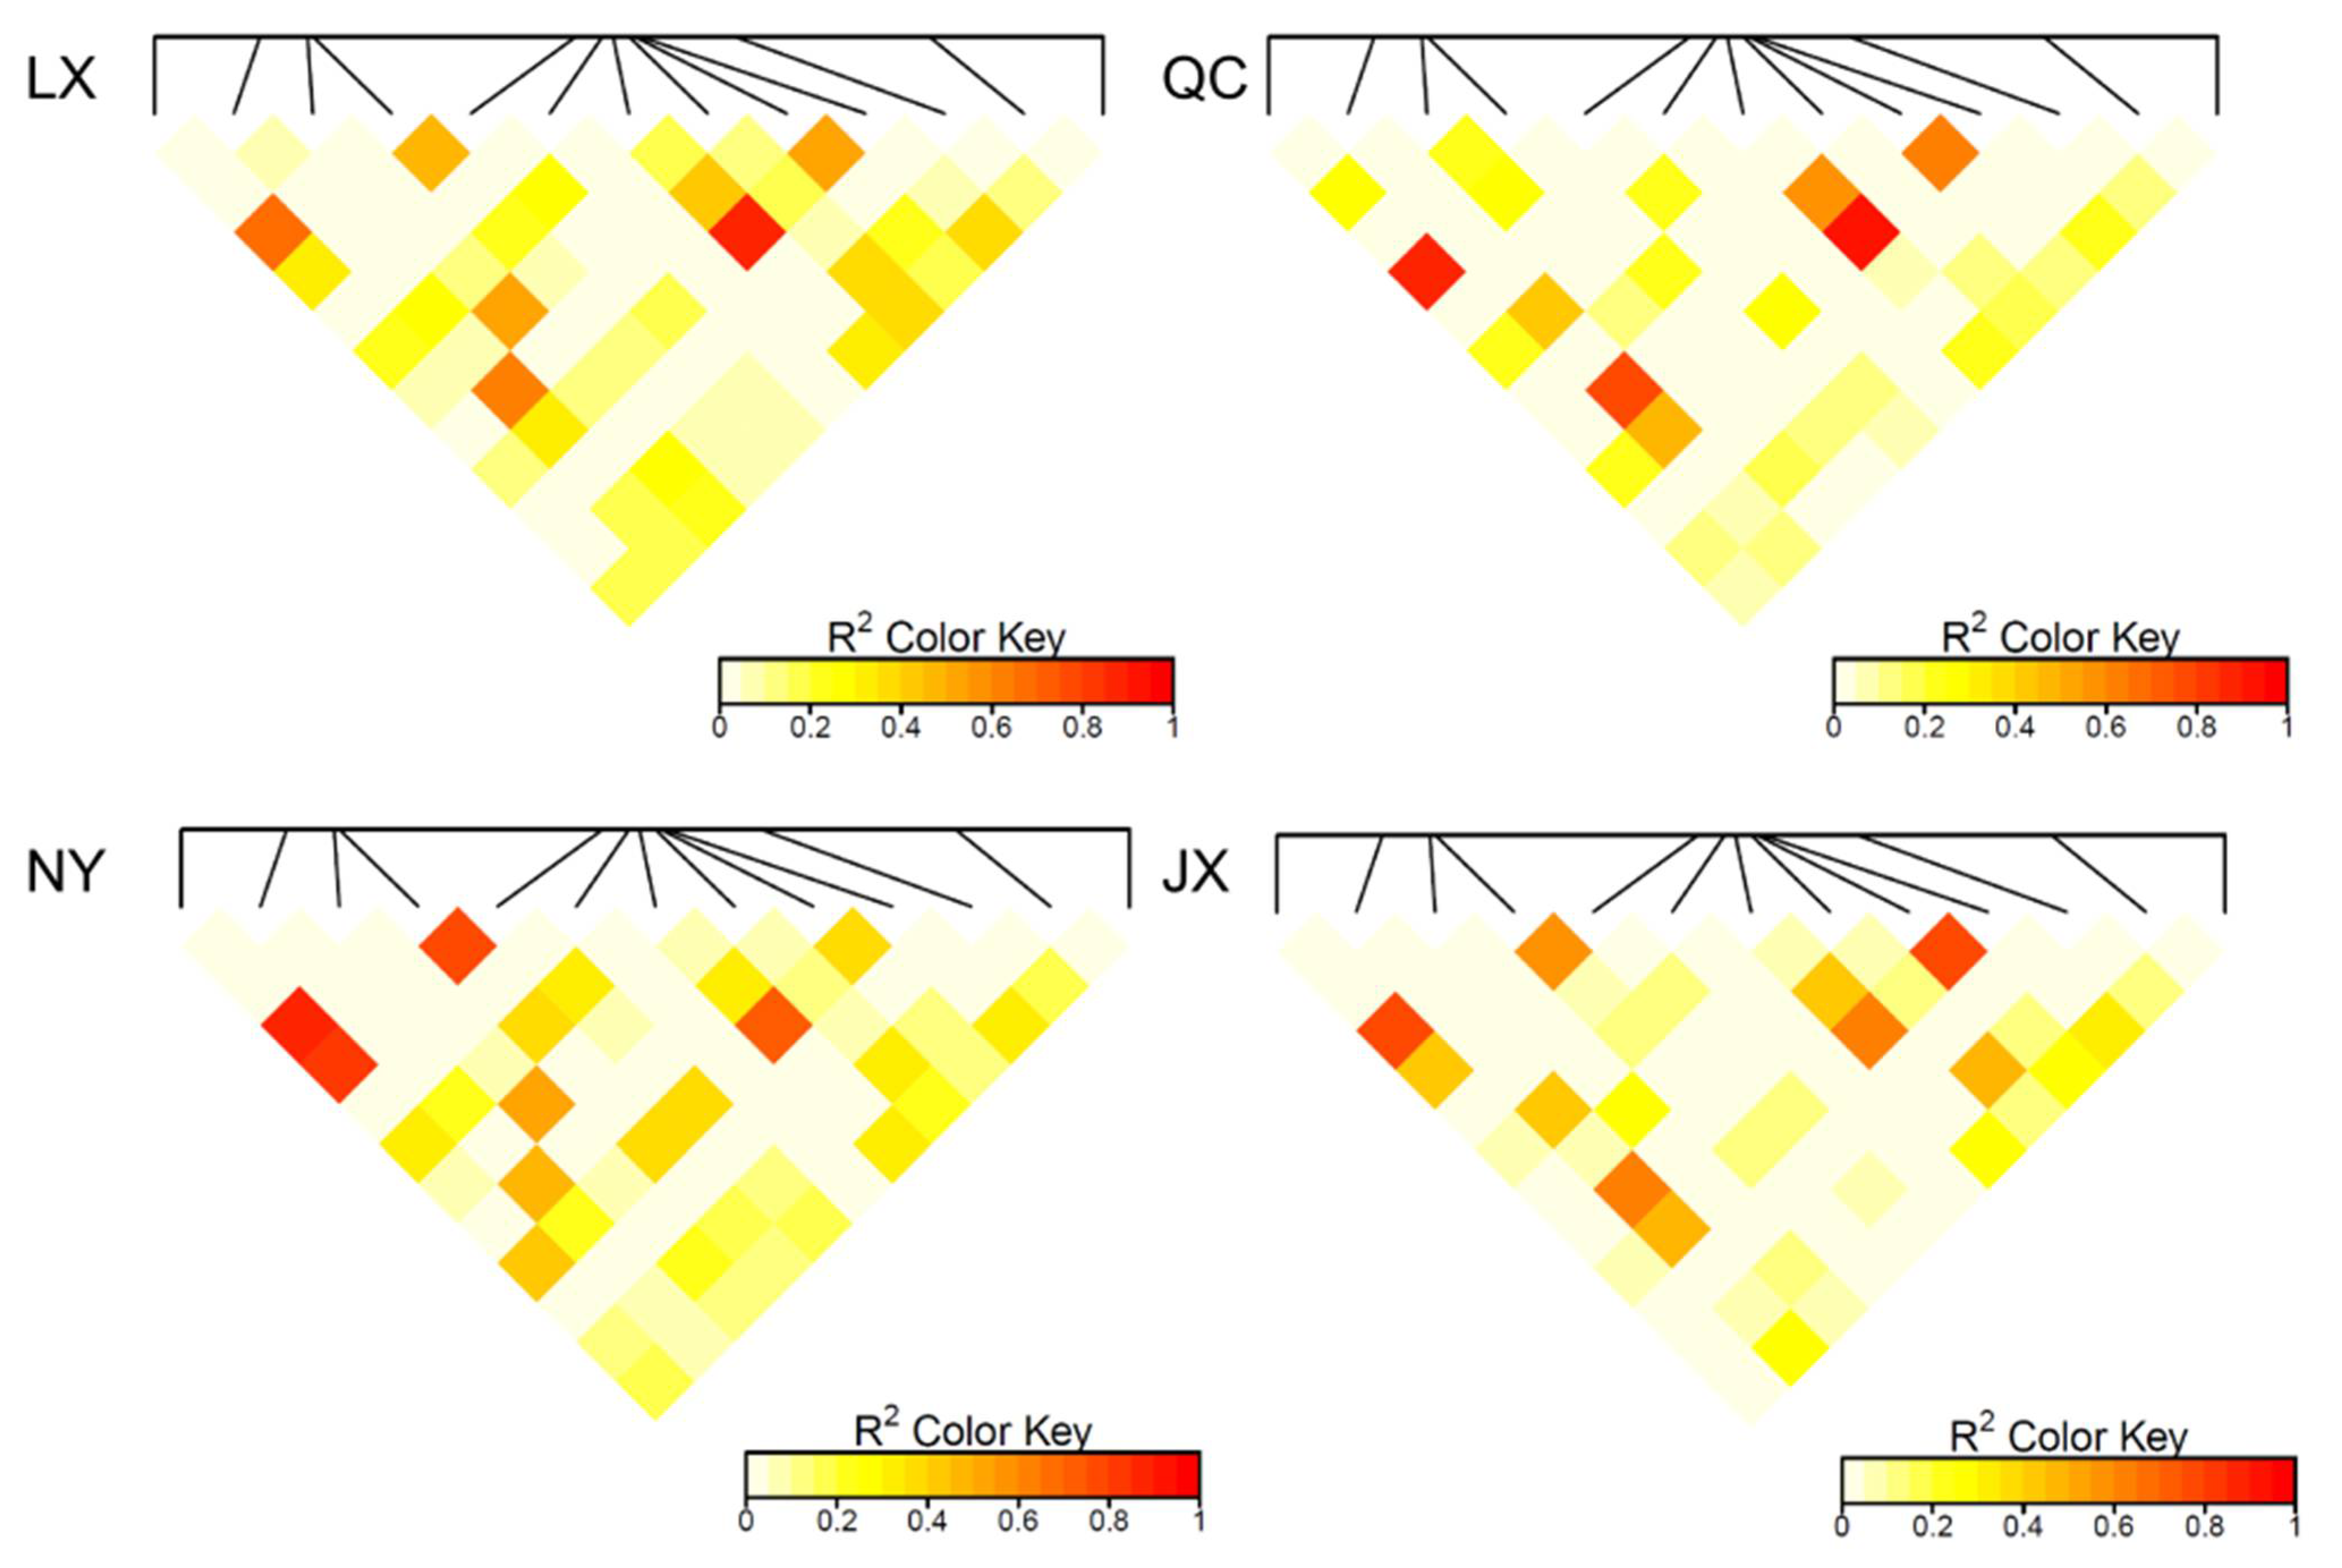
The population parameters of four cattle breeds were calculated, including genotype frequency, allele frequency, HWE, Ho, He, Ne, and PIC (Table 3 and Table 4). For the P3 locus, CC was the dominant genotype in LX, NY, and JX cattle, but TT was the dominant genotype in QC cattle (Table 3). Chi-square test (Figure 2) showed the difference in allele and genotype frequency between QC cattle and the other three breeds more clearly. In the P8 locus, TT was the dominant genotype in NY, while CC was the dominant genotype in the other three groups (Table 4). Figure 2 more clearly shows the difference in genotype and allele frequency between NY and the other three breeds at locus P8. Incidentally, for the N6 (P7) locus, the quantity of TT and TC genotypes were not enough for statistical calculation in the present study (Table 4). The rest of the genotype distribution of the 11 loci were the same in the four cattle breeds (Table 3 and Table 4). Linkage disequilibrium analysis showed that the linkage of 13 loci in QC, LX, and JX cattle was different from the NY cattle (Figure 3).
3.3. Association between 13 Variations and Morphological Traits
The associations between the 13 novel variants and cattle morphological traits were investigated. Seven of them were associated with morphological traits: P1, P3, P4, N1, N12, N31, and P12. For the P1 locus, JX cattle with AA genotype had higher waist width and hucklebone width than GG genotype, but NY cattle with GG genotype had higher body length than AA genotype (p < 0.05). For the P3 locus, LX cattle with CC genotype had higher abdominal circumference than TT genotype, and the TC genotype was the best genotype (p < 0.05). For the P4 locus, NY cattle with AA genotype had higher waist width than GG genotype, but LX cattle with GG genotype had higher abdominal circumference than AA genotype, and the GA genotype was the best genotype (p < 0.05). For the N1 locus, NY cattle with GG and AA genotypes had higher abdominal circumference than GA genotype (p < 0.05). For the N12 locus, JX cattle with AA genotype had higher hucklebone width than GA genotype (p < 0.05). For the N31 locus, NY cattle with AA and GG genotypes had higher abdominal circumference than GA genotype, while JX cattle with AA and GG genotypes had higher body length, waist width, and hucklebone width than GA genotype (p < 0.05). For the P12 locus, NY cattle with GG genotype had higher abdominal circumference than CC genotype, and LX cattle with GG genotype had higher waist width and body weight than AA genotype (p < 0.05) (Table 5).
3.4. Association of Four Haplotypes of PSAP 3’ UTR and Morphological Traits in NY Cattle
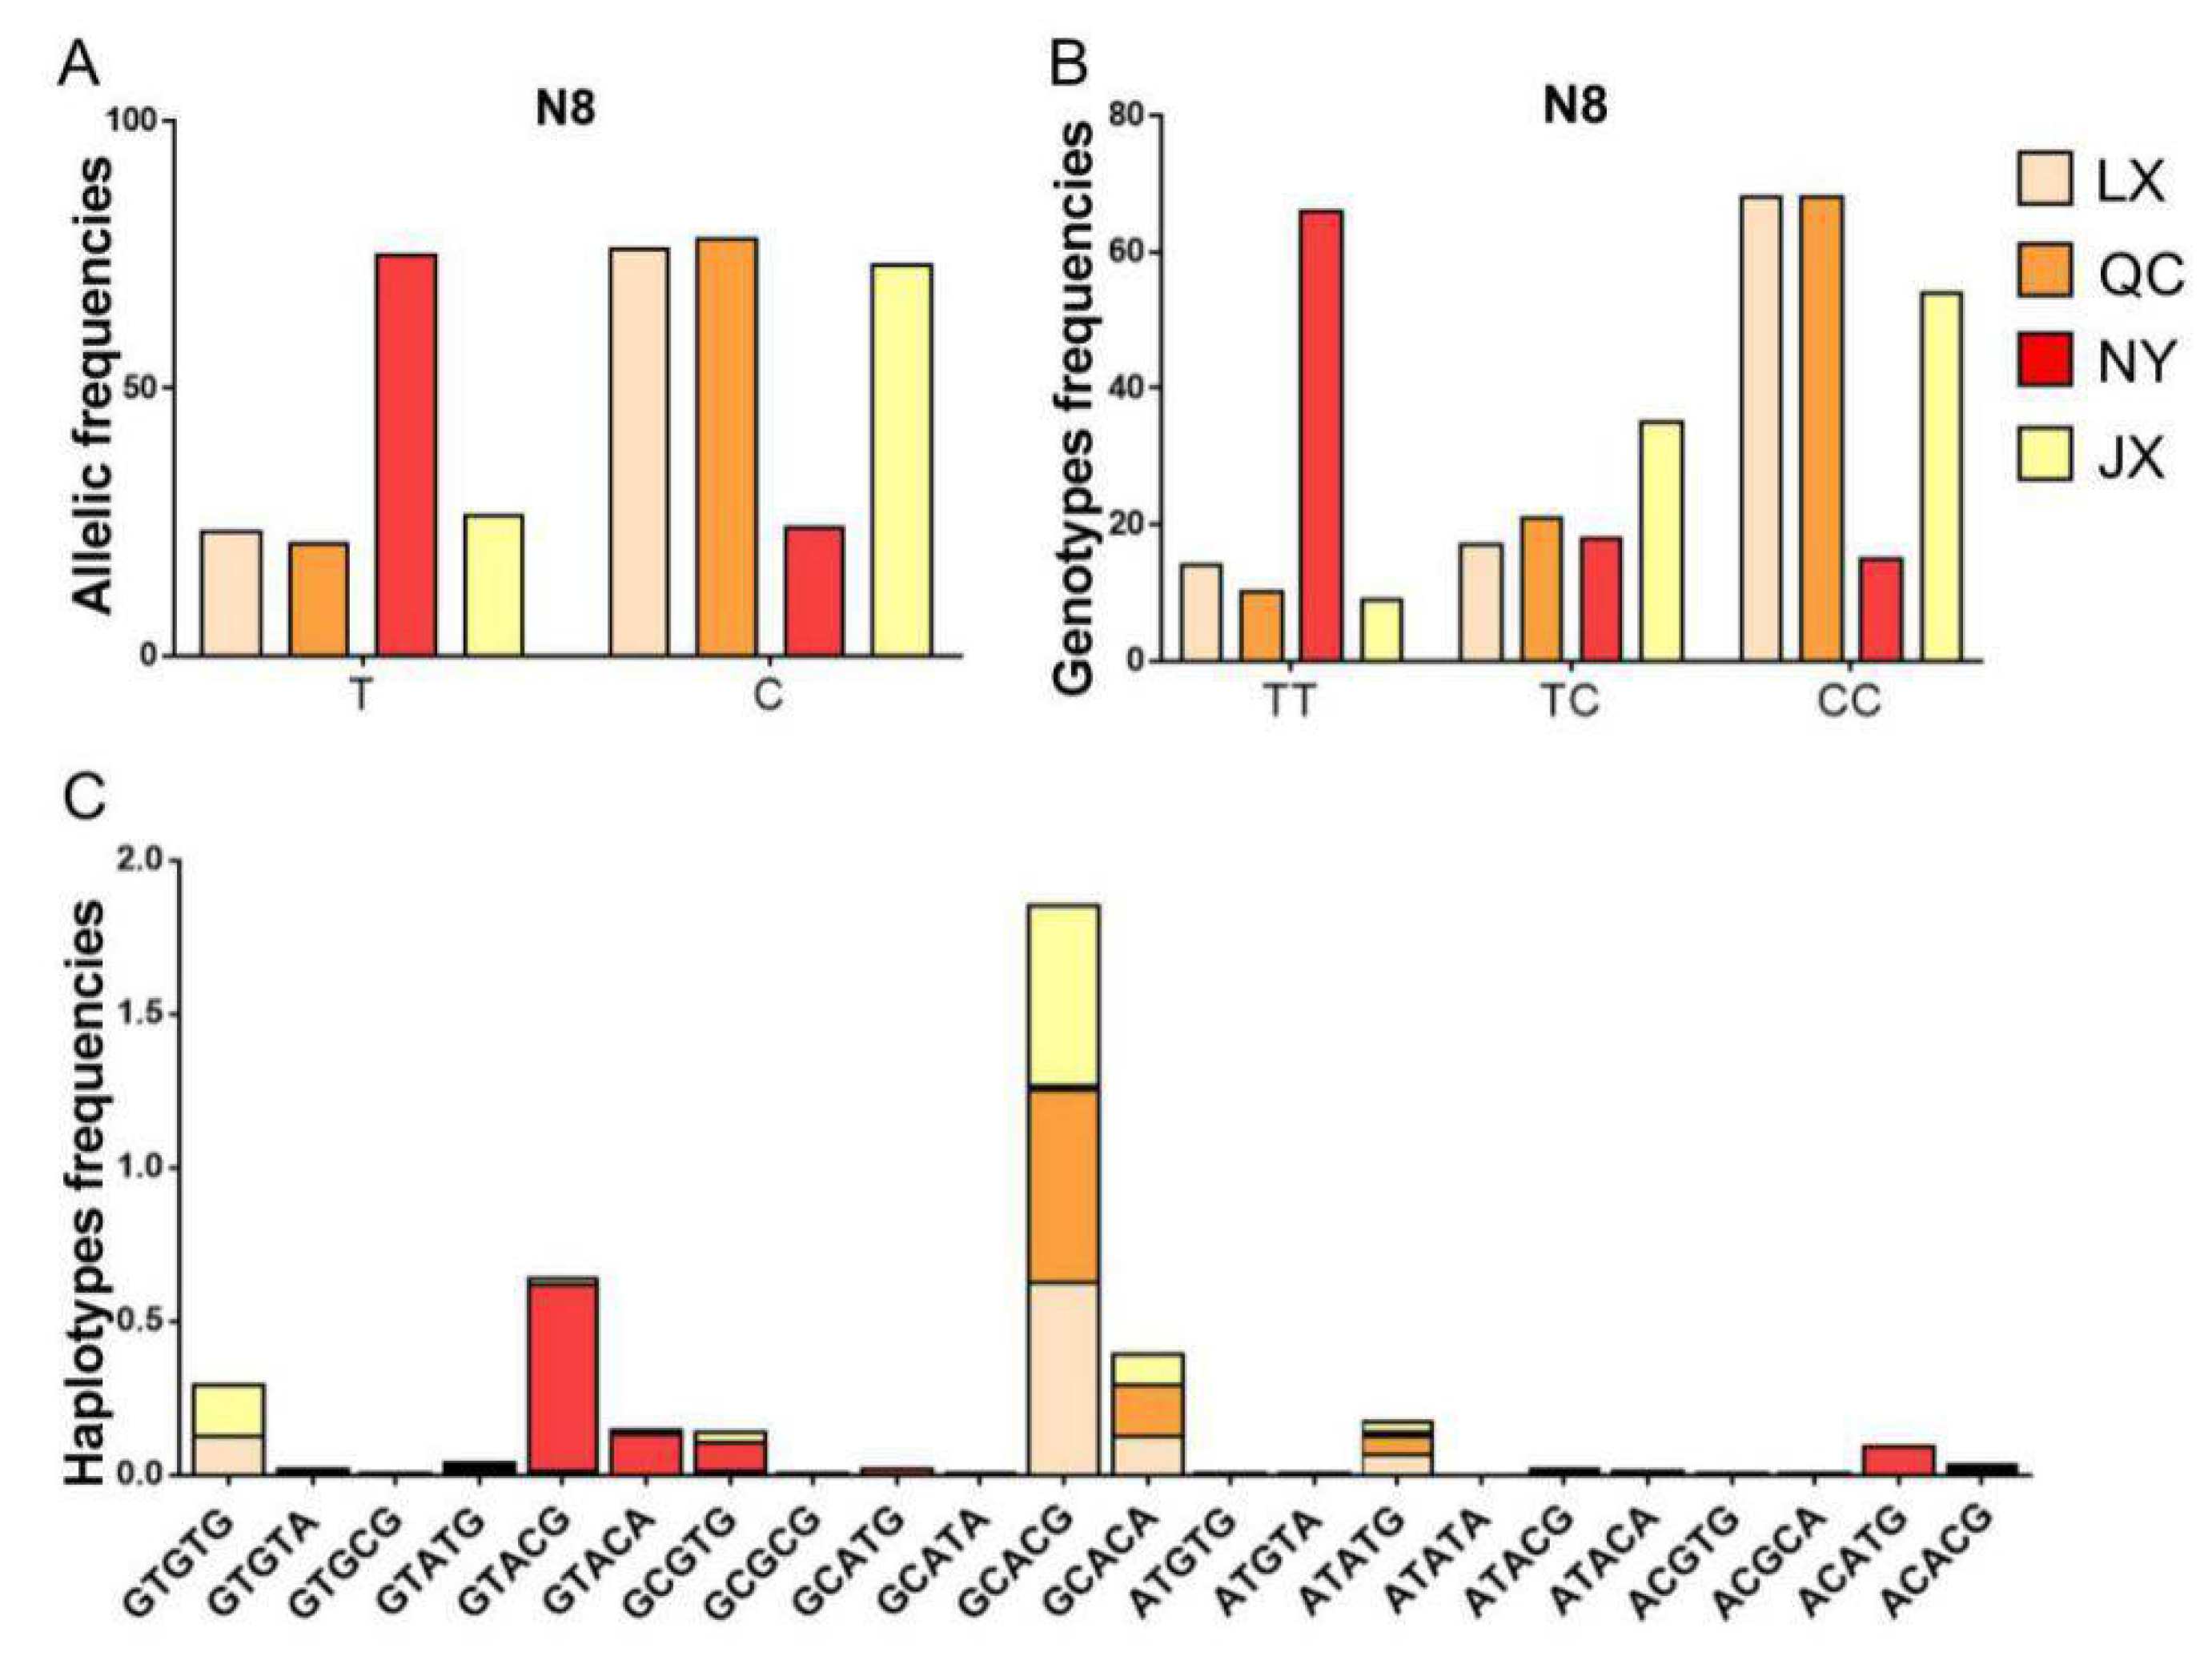
Considering the low frequency of the N6 locus, haplotypes of PSAP 3’ UTR in four cattle breeds were structured with five SNP loci (N1, N8, N12, N13, and N31). For the N8 locus, the number of allele T and genotype TT were different between NY cattle and the other cattle breeds. Based on the differences in genotype and allele, the haplotype distribution was different between NY cattle and the other cattle breeds. The dominant haplotypes of NY cattle were GTACG, GTACA, CCGTG, and ACATG, but the dominant haplotypes of JX, LX, and QC cattle were GCACG, GCACA, ATATG, and GTGTG (Figure 4).
The relationship between the haplotypes and morphological traits were analyzed in the four cattle breeds. Interestingly, the association between haplotypes and morphological traits only appeared in the NY cattle population. NY cattle with haplotypes ACATG and GCGTG had higher body height, body length, chest circumference, and body weight than those with haplotypes GTACA and GTACG (Table 6).
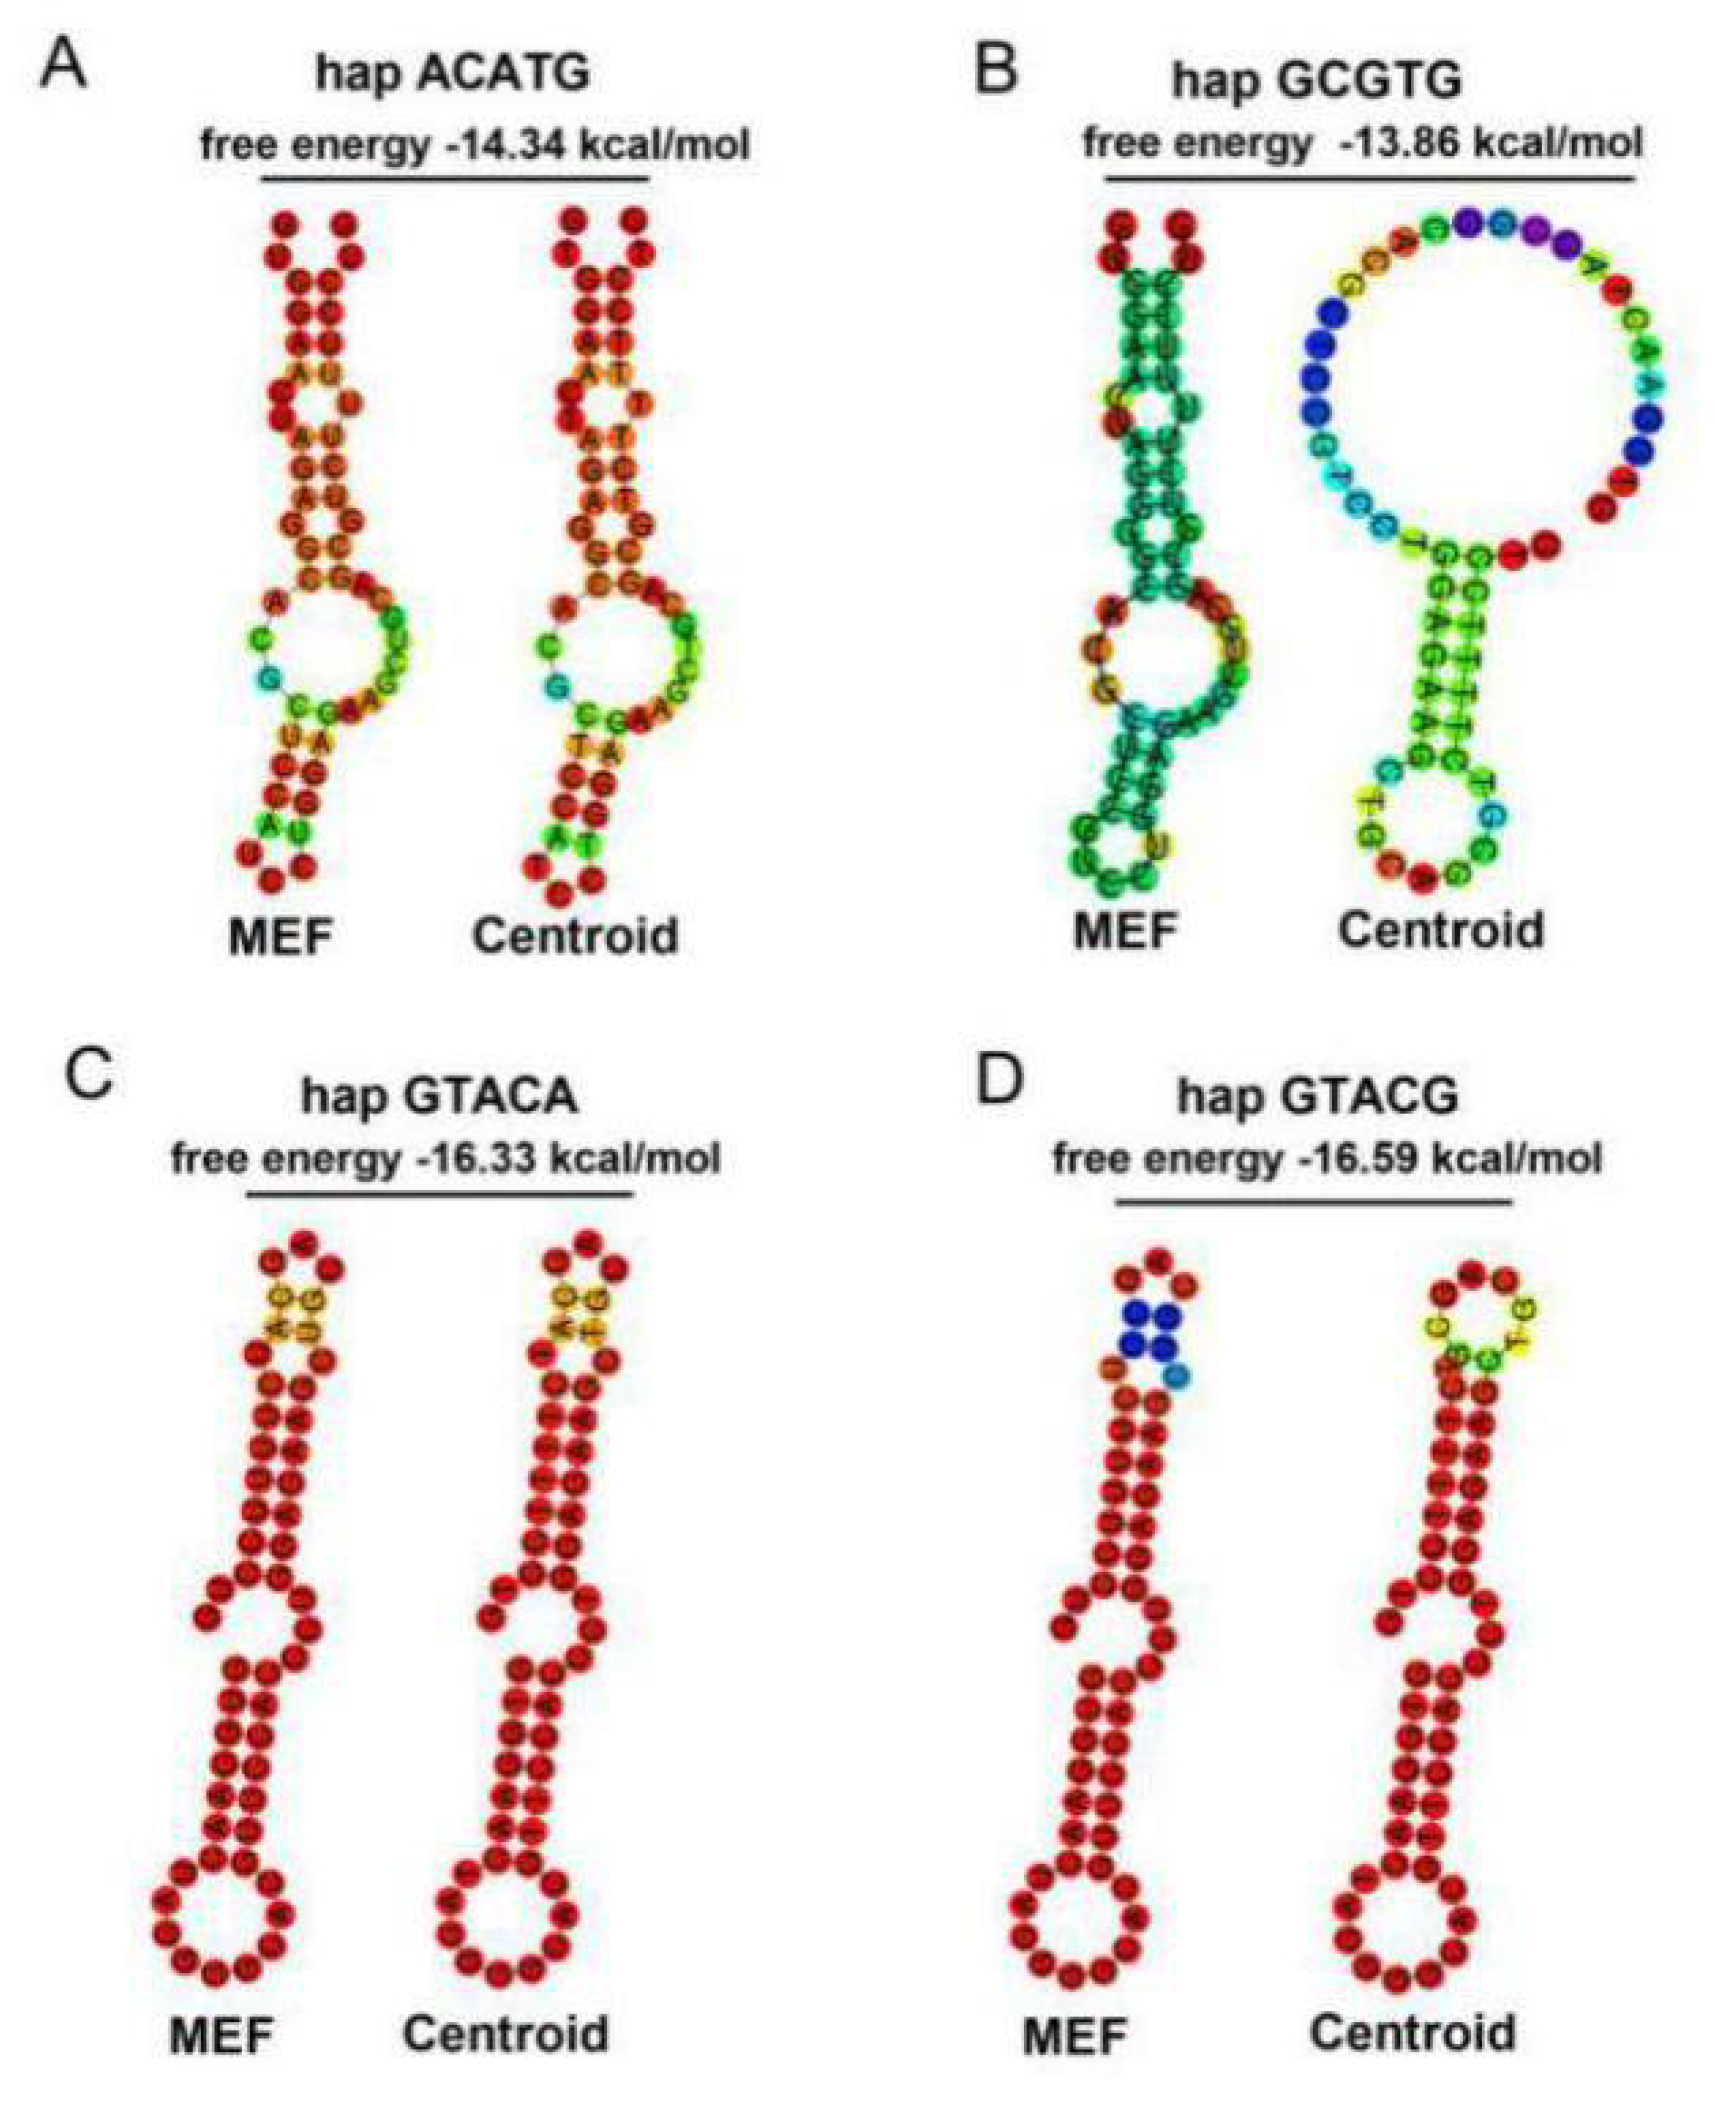
3’ UTR is an important regulatory region of mRNA stability, and miRNAs widely participate in the regulation process. Based on the miRBase database, bta-miR-184 was found to have different binding capacity with the four haplotypes in NY cattle. Four PSAP haplotypes were cloned into psiCHECK2 plasmid. miR-184 mimics, mimics NC, and four haplotypes were cotransfected in the HEK293-T cell line. In the luciferase assay, the relative luciferase of the mimics NC group was higher than the miR-184 mimics group, and the miR-184 did not affect the targeting of PSAP 3’ UTR. More interestingly, the relative luciferase between the two groups was different, with the relative luciferase of the ACATG and GCGTG group being higher than the GTACA and GTACG group (Figure 5). Based on the evidence that SNPs could affect the mRNA secondary structure and protein folding, we concluded that two groups of haplotypes in PSAP 3’ UTR could contribute to mRNA stability. Through a mRNA secondary structure prediction of four haplotypes by RNAfold, we found that the free energy of the ACATG and GCGTG group was higher than that of the GTACA and GTACG group (Figure 6). This could be the reason for the differences in relative luciferase between the two groups.
4. Discussion
It is more strategically important than ever to preserve as much livestock diversity as possible to ensure enough basic gene reserve for future breeding needs [21]. There is less use of beef cattle genetic resources in the beef industry, and most of them are protected by the government [22,23]. Irrespective of the size of the farm, the large majority of breeds are commercial breeds rather than indigenous breeds [24]. Based on the complexity of China’s geography, there is an extremely large amount of genetic resources that could be discovered and utilized from numerous cattle breeds. Molecular breeding is an appropriate choice, and analyzing inherent mechanism is necessary for their popularization and application [25].
PSAP has an important function in the Caspase, MAPK, PI3K/Akt, and TGF-β pathways, which have potential function in animal breeding [17]. For example, Guo found six SNPs in the 10th intron and 11th exon of PSAP that influenced carcass and meat quality traits [18]. In this study, 13 variations belonging to the 14th intron, 15th exon, 3’ UTR, and downstream region of PSAP were found in four cattle breeds. After association analysis, we consider that the P4 locus (missense mutation) and six SNPs in 3’ UTR could be seen as functional variants in beef breeding; however, there was not enough evidence to suggest this. The differences in genotype and allele distribution between NY cattle and the other three cattle breeds attracted our attention. The association between the haplotypes and body height, body length, chest circumference, and body weight were investigated, and we found the morphological traits with the ACATG and GCGTG group was higher than that with the GTACA and GTACG group. This could be regarded as an important basis for a potentially valuable quantitative trait locus (QTL).
The function of variants depends on their location. In the upstream, it can affect DNA methylation, the location of the CpG island, and transcription element recognition sites [26]. In the exon, it can affect protein translation and the spatial structure of proteins. In the intron, it can participate in the function of unknown coding genes, noncoding RNA, and gene alternative splicing. In the 3’ UTR, it can affect targeting with miRNA. miRNA is a kind of small RNA that can target the gene 3’ UTR and construct RNA-induced silencing complex (RISC) [27]. Many studies have demonstrated it as an important mechanism of variants. SNP–miRNA–mRNA interaction networks have an important role in human health and animal production [28,29]. Besides, all the variants in mRNA can affect stability due to the mRNA secondary structure and free energy [30,31]. However, the functional mechanisms underlying the associations are largely unknown [32,33,34]. To more clearly and comprehensively reveal the complex connections between the four haplotypes and miR-184, luciferase assay was performed to investigate the influence of the functional SNP loci. It is a pity that targeting miR-184 was not a mechanism of the functional SNPs in NY cattle PSAP 3’ UTR. Compared with the expression of miRNA in muscle and adipose, its expression was not sufficient to mediate such a large effect on the morphological traits in NY cattle [34,35]. However, we found an unexpected phenomenon that the luciferase activity of the ACATG and GCGTG group was higher than the GTACA and GTACG group. To our surprise, the free energy of the ACATG and GCGTG group was lower than the GTACA and GTACG group. We hypothesize that the free energy of the haplotypes in the two groups is the reason for the differences in morphological traits in NY cattle.
More and more novel functional variants are being confirmed by the development of bioinformatics, but most of them lack underlying molecular mechanisms [36,37]. It is an important but difficult work to identify their potential value in animal breeding. Briefly, we identified 13 variations of loci in bovine PSAP, including six SNP loci in 3’ UTR. The distribution of haplotypes in NY cattle was different from the other three breeds. Two groups of haplotypes had association with morphological traits by changing the secondary structures of PSAP 3’ UTR rather than the miR-184 target sites. Our findings could be evidence of a complex and varying mechanism between variants and animal morphological traits and might be a useful MAS for beef cattle breeds.
5. Conclusions
In this study, 13 variants were identified in PSAP 3′ UTR from 501 individuals of four Chinese cattle breeds, including three loci in the 14th intron, two loci in the 14th exon, six loci in the 3’ UTR, and two loci in the downstream region of PSAP. NY cattle had a particular haplotype distribution compared to the other three cattle breeds. The results of the association analysis showed that NY cattle with haplotypes ACATG and GCGTG had better production traits than those with haplotypes GTACA and GTACG by changing the secondary structures of PSAP 3’ UTR rather than the miR-184 target sites.
Author Contributions
Conceptualization, X.S.; methodology, H.Z. and M.W.; software, H.Z.; validation, X.Y.; formal analysis, X.T.; investigation, H.Z.; resources, X.S.; data curation, P.C. and S.W.; writing—original draft preparation, H.Z. and M.W.; writing—review and editing, X.Y. and X.T.; visualization, X.Y.; supervision, X.S.; project administration, X.S.; funding acquisition, X.S. All authors have read and agreed to the published version of the manuscript.
Funding
This research was funded by the Collaborative Innovation Major Projects of Research and Production Practical Application for Yangling Demonstration Zone (2016CXY-15), the Integrated Demonstration Project of Key Technologies for Cattle and Sheep Breeding and Farming in Farming Pastoral Ecotone of the Ministry of Agriculture and Rural Affairs (No. 16190050), and the China Agriculture Research System (CARS-34).
Institutional Review Board Statement
All experimental procedures were performed in accordance with the Regulations for the Administration of Affairs Concerning Experimental Animals approved by the State Council of People’s Republic of China. The study was approved by The Institutional Animal Care and Use Committee of Northwest A&F University (Permit Number: NWAFAC1019).
Informed Consent Statement
Not applicable.
Data Availability Statement
Data sharing not applicable. No new data were created or analyzed in this study. Data sharing is not applicable to this article.
Acknowledgments
We are grateful to Ma Yun of Ningxia University for kindly gifting the samples.
Conflicts of Interest
The authors declare no conflict of interest.
References
- He, J.; Guo, Y.; Xu, J.; Li, H.; Fuller, A.; Tait, R.G., Jr.; Wu, X.L.; Bauck, S. Comparing SNP panels and statistical methods for estimating genomic breed composition of individual animals in ten cattle breeds. BMC Genom. 2018, 19, 56. [Google Scholar] [CrossRef] [PubMed]
- Lee, J.; Kim, Y.; Cho, E.; Cho, K.; Sa, S.; Kim, Y.; Choi, J.; Kim, J.; Hong, J.; Choi, T. Genomic Analysis Using Bayesian Methods under Different Genotyping Platforms in Korean Duroc Pigs. Animals 2020, 10, 752. [Google Scholar] [CrossRef] [PubMed]
- Akanno, E.C.; Abo-Ismail, M.K.; Chen, L.; Crowley, J.J.; Wang, Z.; Li, C.; Basarab, J.A.; MacNeil, M.D.; Plastow, G.S. Modeling heterotic effects in beef cattle using genome-wide SNP-marker genotypes. J. Anim. Sci. 2018, 96, 830–845. [Google Scholar] [CrossRef] [PubMed]
- Steri, M.; Idda, M.L.; Whalen, M.B.; Orrù, V. Genetic variants in mRNA untranslated regions. Wires RNA 2018, 9, e1474. [Google Scholar] [CrossRef] [PubMed]
- Liu, M.; Li, S.; Du, M.; Chu, H.; Wang, M.; Zhang, Z. Novel CpG-SNPs in the gastric acid secretion pathway GNAI3 and susceptibility to gastric cancer. Gene 2020, 736, 144447. [Google Scholar] [CrossRef] [PubMed]
- Pegolo, S.; Cecchinato, A.; Savoia, S.; Di Stasio, L.; Pauciullo, A.; Brugiapaglia, A.; Bittante, G.; Albera, A. Genome-wide association and pathway analysis of carcass and meat quality traits in Piemontese young bulls. Animal 2020, 14, 243–252. [Google Scholar] [CrossRef]
- Kononoff, P.J.; Defoor, P.J.; Engler, M.J.; Swingle, R.S.; Gleghorn, J.F.; James, S.T.; Marquess, F.L. Impacts of a leptin SNP on growth performance and carcass characters in finishing steers studied over time. J. Anim. Sci. 2017, 95, 194–200. [Google Scholar] [CrossRef]
- Xu, Y.; Jiang, Y.; Shi, T.; Cai, H.; Lan, X.; Zhao, X.; Plath, M.; Chen, H. Whole-genome sequencing reveals mutational landscape underlying phenotypic differences between two widespread Chinese cattle breeds. PLoS ONE 2017, 12, e0183921. [Google Scholar] [CrossRef] [Green Version]
- Han, B.; Yuan, Y.; Shi, L.; Li, Y.; Liu, L.; Sun, D. Identification of single nucleotide polymorphisms of PIK3R1 and DUSP1 genes and their genetic associations with milk production traits in dairy cows. J. Anim. Sci. Biotechnol. 2019, 10, 81. [Google Scholar] [CrossRef]
- Smith, J.L.; Wilson, M.L.; Nilson, S.M.; Rowan, T.N.; Oldeschulte, D.L.; Schnabel, R.D.; Decker, J.E.; Seabury, C.M. Genome-wide association and genotype by environment interactions for growth traits in U.S. Gelbvieh cattle. BMC Genom. 2019, 20, 926. [Google Scholar] [CrossRef] [Green Version]
- Xu, Z.Q.; He, J.; Ji, C.L.; Zhang, Y.; Nie, Q.H.; Zhang, D.X.; Zhang, X.Q. Polymorphisms in the 5’-flanking regions of the GH, PRL, and Pit-1 genes with Muscovy duck egg production. J. Anim. Sci. 2015, 93, 28–34. [Google Scholar] [CrossRef] [PubMed] [Green Version]
- Si, Y.; He, F.; Wen, H.; Li, J.; Zhao, J.; Ren, Y.; Zhao, M.; Ji, L.; Huang, Z.; Zhang, M.; et al. Genetic polymorphisms and DNA methylation in exon 1 CpG-rich regions of PACAP gene and its effect on mRNA expression and growth traits in half smooth tongue sole (Cynoglossus semilaevis). Fish. Physiol. Biochem. 2016, 42, 407–421. [Google Scholar] [CrossRef]
- Cai, X.; Yang, Z.H.; Li, H.J.; Xiao, X.; Li, M.; Chang, H. A Human-Specific Schizophrenia Risk Tandem Repeat Affects Alternative Splicing of a Human-Unique Isoform AS3MTd2d3 and Mushroom Dendritic Spine Density. Schizophr. Bull 2020, sbaa098. [Google Scholar] [CrossRef] [PubMed]
- Kolnikova, M.; Jungova, P.; Skopkova, M.; Foltan, T.; Gasperikova, D.; Mattosova, S.; Chandoga, J. Late Infantile Metachromatic Leukodystrophy Due to Novel Pathogenic Variants in the PSAP Gene. J. Mol. Neurosci. 2019, 67, 559–563. [Google Scholar] [CrossRef] [PubMed]
- Islam, F.; Khan, M.; Nabeka, H.; Shimokawa, T.; Yamamiya, K.; Matsuda, S. Age- and sex-associated changes in prosaposin and its receptors in the lacrimal glands of rats. Histol. Histopathol. 2020, 35, 69–81. [Google Scholar] [CrossRef] [PubMed]
- Zhao, H.; Wu, M.; Wang, S.; Yu, X.; Sun, X. Identification of a novel 24 bp insertion–deletion (indel) of the androgen receptor gene and its association with growth traits in four indigenous cattle breeds. Arch. Anim. Breed. 2018, 61, 71–78. [Google Scholar] [CrossRef] [Green Version]
- Jiang, Y.; Zhou, J.; Hou, D.; Luo, P.; Gao, H.; Ma, Y.; Chen, Y.S.; Li, L.; Zou, D.; Zhang, H.; et al. Prosaposin is a biomarker of mesenchymal glioblastoma and regulates mesenchymal transition through the TGF-β1/Smad signaling pathway. J. Pathol. 2019, 249, 26–38. [Google Scholar] [CrossRef]
- Guo, P.; Zhao, Z.; Yan, S.; Li, J.; Yang, R. PSAP gene variants and haplotypes reveal significant effects on carcass and meat quality traits in chinese simmental-cross cattle. Arch. Anim. Breed. 2016, 59, 461–468. [Google Scholar] [CrossRef] [Green Version]
- Wang, S.; Zhao, H.; Wu, M.; Yi, X.; Chen, P.; Liu, S.; Pan, Y.; Li, Q.; Tang, X.; Sun, X. Exploring of InDel in bovine PSAP gene and their association with growth traits in different development stages. Anim. Biotechnol. 2020, 1–12. [Google Scholar] [CrossRef]
- Zhao, H.; He, S.; Zhu, Y.; Cao, X.; Luo, R.; Cai, Y.; Xu, H.; Sun, X. A novel 29 bp insertion/deletion (indel) variant of the lhx3 gene and its influence on growth traits in four sheep breeds of various fecundity. Arch. Anim. Breed. 2017, 60, 79–85. [Google Scholar] [CrossRef] [Green Version]
- Kukučková, V.; Moravčíková, N.; Curik, I.; Simčič, M.; Mészáros, G.; Kasarda, R. Genetic diversity of local cattle. Acta Biochim. Pol. 2018, 65, 421–424. [Google Scholar] [CrossRef] [PubMed]
- Chen, N.; Cai, Y.; Chen, Q.; Li, R.; Wang, K.; Huang, Y.; Hu, S.; Huang, S.; Zhang, H.; Zheng, Z.; et al. Whole-genome resequencing reveals world-wide ancestry and adaptive introgression events of domesticated cattle in East Asia. Nat. Commun. 2018, 9, 2337. [Google Scholar] [CrossRef] [PubMed]
- Zhang, W.; Gao, X.; Zhang, Y.; Zhao, Y.; Zhang, J.; Jia, Y.; Zhu, B.; Xu, L.; Zhang, L.; Gao, H.; et al. Genome-wide assessment of genetic diversity and population structure insights into admixture and introgression in Chinese indigenous cattle. BMC Genet. 2018, 19, 114. [Google Scholar] [CrossRef] [PubMed] [Green Version]
- Camara, Y.; Moula, N.; Sow, F.; Sissokho, M.M.; Antoine-Moussiaux, N. Analysing innovations among cattle smallholders to evaluate the adequacy of breeding programs. Animal 2019, 13, 417–426. [Google Scholar] [CrossRef]
- Tong, B.; Zhang, L.; Li, G.P. Progress in the molecular and genetic modification breeding of beef cattle in China. Hereditas 2017, 39, 984–1015. [Google Scholar] [CrossRef]
- Liu, Y.; Xu, L.; Wang, Z.; Xu, L.; Chen, Y.; Zhang, L.; Xu, L.; Gao, X.; Gao, H.; Zhu, B.; et al. Genomic Prediction and Association Analysis with Models Including Dominance Effects for Important Traits in Chinese Simmental Beef Cattle. Animals 2019, 9, 1055. [Google Scholar] [CrossRef] [Green Version]
- Pirooz, H.J.; Jafari, N.; Rastegari, M.; Fathi-Roudsari, M.; Tasharrofi, N.; Shokri, G.; Tamadon, M.; Sazegar, H.; Kouhkan, F. Functional SNP in microRNA-491-5p binding site of MMP9 3’-UTR affects cancer susceptibility. J. Cell Biochem. 2018, 119, 5126–5134. [Google Scholar] [CrossRef]
- Lin, X.; Xia, W.; Ji, W.; Xie, F.F.; He, P.; Zhu, X.W.; Zhang, Y.H.; Deng, F.Y.; Lei, S.F. Genome-wide integrative analysis identified SNP-miRNA-mRNA interaction networks in peripheral blood mononuclear cells. Epigenomics 2017, 9, 1287–1298. [Google Scholar] [CrossRef]
- Jiang, Q.; Zhao, H.; Li, R.; Zhang, Y.; Liu, Y.; Wang, J.; Wang, X.; Ju, Z.; Liu, W.; Hou, M.; et al. In silico genome-wide miRNA-QTL-SNPs analyses identify a functional SNP associated with mastitis in Holsteins. BMC Genet. 2019, 20, 46. [Google Scholar] [CrossRef]
- Ceolin, L.; Romitti, M.; Siqueira, D.R.; Vaz Ferreira, C.; Oliboni Scapineli, J.; Assis-Brazil, B.; Vieira Maximiano, R.; Dias Amarante, T.; de Souza Nunes, M.C.; Weber, G.; et al. Effect of 3’UTR RET Variants on RET mRNA Secondary Structure and Disease Presentation in Medullary Thyroid Carcinoma. PLoS ONE 2016, 11, e0147840. [Google Scholar] [CrossRef] [Green Version]
- Walsh, I.M.; Bowman, M.A.; Soto Santarriaga, I.F.; Rodriguez, A.; Clark, P.L. Synonymous codon substitutions perturb cotranslational protein folding in vivo and impair cell fitness. Proc. Natl. Acad. Sci. USA 2020, 117, 3528–3534. [Google Scholar] [CrossRef] [PubMed]
- Li, N.; Zhang, Y.; Li, H.P.; Han, L.; Yan, X.M.; Li, H.B.; Du, W.; Zhang, J.S.; Yu, Q.L. Differential expression of mRNA-miRNAs related to intramuscular fat content in the longissimus dorsi in Xinjiang brown cattle. PLoS ONE 2018, 13, e0206757. [Google Scholar] [CrossRef] [PubMed] [Green Version]
- Yang, F.; Zhang, M.; Rong, Y.; Liu, Z.; Yang, S.; Zhang, W.; Li, J.; Cai, Y. A Novel SNPs in Alpha-Lactalbumin Gene Effects on Lactation Traits in Chinese Holstein Dairy Cows. Animals 2019, 10, 60. [Google Scholar] [CrossRef] [PubMed] [Green Version]
- Zhang, Z.; Tang, J.; He, X.; Di, R.; Chu, M. Mutations in NLRP5 and NLRP9 are Associated with Litter Size in Small Tail Han Sheep. Animals 2020, 10, 689. [Google Scholar] [CrossRef] [Green Version]
- Martignani, E.; Miretti, S.; Vincenti, L.; Baratta, M. Correlation between estrogen plasma level and miRNAs in muscle of Piedmontese cattle. Domest. Anim. Endocrinol. 2019, 67, 37–41. [Google Scholar] [CrossRef]
- Abo-Ismail, M.K.; Lansink, N.; Akanno, E.; Karisa, B.K.; Crowley, J.J.; Moore, S.S.; Bork, E.; Stothard, P.; Basarab, J.A.; Plastow, G.S. Development and validation of a small SNP panel for feed efficiency in beef cattle. J. Anim. Sci. 2018, 96, 375–397. [Google Scholar] [CrossRef] [Green Version]
- Li, M.; Gao, Q.; Wang, M.; Liang, Y.; Sun, Y.; Chen, Z.; Zhang, H.; Karrow, N.A.; Yang, Z.; Mao, Y. Polymorphisms in Fatty Acid Desaturase 2 Gene are Associated with Milk Production Traits in Chinese Holstein Cows. Animals 2020, 10, 671. [Google Scholar] [CrossRef] [Green Version]
Figure 1.
Sequencing of variants in bovine PSAP. (A) The genetic mapping of bovine PSAP by sequencing; (B) three single-nucleotide polymorphisms (SNPs) in the 14th intron of bovine PSAP; (C) two SNPs in the 15th exon of bovine PSAP; (D) five SNPs in bovine PSAP 3’ UTR; (E) two variants in the downstream region of bovine PSAP. P: the number variants in the fragment of PSAP; N: the number of bases in PSAP 3’ UTR.

Figure 2.
χ2 test on genotypic and allele frequency distribution of variations in four Chinese cattle PSAP. QC: Qinchuan cattle; NY: Nanyang cattle; JX: Jiaxian red cattle; LX: Luxi cattle.
Figure 2.
χ2 test on genotypic and allele frequency distribution of variations in four Chinese cattle PSAP. QC: Qinchuan cattle; NY: Nanyang cattle; JX: Jiaxian red cattle; LX: Luxi cattle.

Figure 3.
Linkage disequilibrium analysis (R2) of 13 variants in four cattle breeds. QC: Qinchuan cattle; NY: Nanyang cattle; JX: Jiaxian red cattle; LX: Luxi cattle.
Figure 3.
Linkage disequilibrium analysis (R2) of 13 variants in four cattle breeds. QC: Qinchuan cattle; NY: Nanyang cattle; JX: Jiaxian red cattle; LX: Luxi cattle.

Figure 4.
Allele, genotype, and haplotype distribution in four cattle breeds. (A) The allele frequency of the N8 locus of bovine PSAP in four cattle breeds; (B) the genotype frequency of the N8 locus of bovine PSAP in four cattle breeds; (C) the haplotype frequency of five SNPs of bovine PSAP 3’ UTR in four cattle breeds. QC: Qinchuan cattle; NY: Nanyang cattle; JX: Jiaxian red cattle; LX: Luxi cattle.

Figure 5.
Targeting of bta-miR-184 and four haplotypes of bovine PSAP 3’ UTR. (A) Four haplotypes and their targeting of bta-miR184 (red represents mismatch and green represents match); (B) relative luciferase activity of four haplotypes and bta-miR-184; (C) relative luciferase activity of two haplotype groups. ** p < 0.01.

Figure 6.
mRNA secondary structure prediction of four haplotypes in PSAP 3’ UTR: (A) ACATG; (B) GCGTG; (C) GTACA; (D) GTACG.
Figure 6.
mRNA secondary structure prediction of four haplotypes in PSAP 3’ UTR: (A) ACATG; (B) GCGTG; (C) GTACA; (D) GTACG.


Table 1.
Information on samples used in this study.
| Breed | Sampling Location | Population |
|---|---|---|
| QC (Qinchuan cattle) | Yangling, Shaanxi | 123 |
| NY (Nanyang cattle) | Nanyang, Henan | 137 |
| JX (Jiaxian red cattle) | Nanyang, Henan | 137 |
| LX (Luxi cattle) | Jining, Shandong | 104 |
Table 2.
Primers used in the sequencing and vector construction.
| Primers | Sequence | Notes |
|---|---|---|
| PSAP-HAP1-F1 | TCGAGgtggaactagaggcacgctccatcctggagaagctgcagcgtcttttcctgGC | Vector construction |
| PSAP-HAP1-R1 | GGCCGCcaggaaaagacgctgcagcttctccaggatggagcgtgcctctagttccacC | |
| PSAP-HAP2-F2 | TCGAGgtggaactaggggcacgctccgtcctggagaagctgcagcgtcttttcctgGC | Vector construction |
| PSAP-HAP2-R2 | GGCCGCcaggaaaagacgctgcagcttctccaggacggagcgtgcccctagttccacC | |
| PSAP-HAP3-F3 | TCGAGgtggaactaggggcacgttccaccctggagaagctgcagcatcttttcctgGC | Vector construction |
| PSAP-HAP3-R3 | GGCCGCcaggaaaagatgctgcagcttctccagggtggaacgtgcccctagttccacC | |
| PSAP-HAP4-F4 | TCGAGgtggaactaggggcacgttccaccctggagaagctgcagcgtcttttcctgGC | Vector construction |
| PSAP-HAP4-R4 | GGCCGCcaggaaaagacgctgcagcttctccagggtggaacgtgcccctagttccacC | |
| PSAP-F | GGTGTCGGGTCCTCTTTCTG | Variations screening |
| PSAP-R | GCGTGTCGGCATCTGTCTAG |
PSAP: prosaposin; HAP: haplotype.
Table 3.
Genotypes, alleles, He, Ne, and PIC for variations of the 14th intron, 15th exon, and downstream region in cattle PSAP.
Table 3.
Genotypes, alleles, He, Ne, and PIC for variations of the 14th intron, 15th exon, and downstream region in cattle PSAP.
| Locus | Breed | Size | Genotype Frequency | Allele Frequency | HWE | Population Parameters | ||||||
|---|---|---|---|---|---|---|---|---|---|---|---|---|
| N | GG | GA | AA | G | A | pValue | Ho | He | Ne | PIC | ||
| P1 | LX | 104 | 11 | 6 | 87 | 0.135 | 0.865 | p < 0.05 | 0.767 | 0.233 | 1.304 | 0.206 |
| QC | 123 | 6 | 21 | 96 | 0.134 | 0.866 | p < 0.05 | 0.768 | 0.232 | 1.303 | 0.205 | |
| NY | 137 | 8 | 12 | 117 | 0.102 | 0.898 | p < 0.05 | 0.817 | 0.183 | 1.225 | 0.167 | |
| JX | 137 | 12 | 40 | 85 | 0.234 | 0.766 | p < 0.05 | 0.642 | 0.358 | 1.558 | 0.294 | |
| N | CC | TC | TT | C | T | pValue | Ho | He | Ne | PIC | ||
| P2 | LX | 104 | 65 | 19 | 20 | 0.716 | 0.284 | p < 0.05 | 0.594 | 0.406 | 1.685 | 0.324 |
| QC | 123 | 93 | 24 | 6 | 0.854 | 0.146 | p < 0.05 | 0.750 | 0.250 | 1.333 | 0.219 | |
| NY | 137 | 99 | 17 | 21 | 0.785 | 0.215 | p < 0.05 | 0.662 | 0.338 | 1.510 | 0.281 | |
| JX | 137 | 113 | 21 | 3 | 0.901 | 0.099 | p < 0.05 | 0.822 | 0.178 | 1.216 | 0.162 | |
| N | CC | TC | TT | C | T | pValue | Ho | He | Ne | PIC | ||
| P3 | LX | 104 | 88 | 7 | 9 | 0.880 | 0.120 | p < 0.05 | 0.789 | 0.211 | 1.268 | 0.189 |
| QC | 123 | 14 | 6 | 103 | 0.138 | 0.862 | p < 0.05 | 0.762 | 0.238 | 1.313 | 0.210 | |
| NY | 137 | 111 | 13 | 13 | 0.858 | 0.142 | p < 0.05 | 0.756 | 0.244 | 1.323 | 0.214 | |
| JX | 137 | 122 | 12 | 3 | 0.934 | 0.066 | p < 0.05 | 0.877 | 0.123 | 1.140 | 0.115 | |
| N | GG | GA | AA | G | A | pValue | Ho | He | Ne | PIC | ||
| P4 | LX | 104 | 91 | 5 | 8 | 0.899 | 0.101 | p < 0.05 | 0.818 | 0.182 | 1.222 | 0.165 |
| QC | 123 | 107 | 15 | 1 | 0.930 | 0.070 | p < 0.05 | 0.871 | 0.129 | 1.148 | 0.120 | |
| NY | 137 | 113 | 13 | 11 | 0.872 | 0.128 | p < 0.05 | 0.777 | 0.223 | 1.287 | 0.198 | |
| JX | 137 | 122 | 12 | 3 | 0.934 | 0.066 | p < 0.05 | 0.877 | 0.123 | 1.140 | 0.115 | |
| N | CC | TC | TT | C | T | pValue | Ho | He | Ne | PIC | ||
| P5 | LX | 104 | 33 | 21 | 50 | 0.418 | 0.582 | p < 0.05 | 0.513 | 0.487 | 1.948 | 0.368 |
| QC | 123 | 9 | 27 | 87 | 0.183 | 0.817 | p < 0.05 | 0.701 | 0.299 | 1.426 | 0.254 | |
| NY | 137 | 30 | 18 | 89 | 0.285 | 0.715 | p < 0.05 | 0.593 | 0.407 | 1.687 | 0.324 | |
| JX | 137 | 8 | 47 | 82 | 0.230 | 0.770 | p < 0.05 | 0.646 | 0.354 | 1.548 | 0.291 | |
| N | GG | GC | CC | G | C | pValue | Ho | He | Ne | PIC | ||
| P12 | LX | 104 | 48 | 28 | 28 | 0.596 | 0.404 | p < 0.05 | 0.518 | 0.482 | 1.929 | 0.366 |
| QC | 123 | 24 | 42 | 57 | 0.366 | 0.634 | p < 0.05 | 0.536 | 0.464 | 1.866 | 0.356 | |
| NY | 137 | 54 | 30 | 53 | 0.504 | 0.496 | p < 0.05 | 0.500 | 0.500 | 2.000 | 0.375 | |
| JX | 137 | 21 | 59 | 57 | 0.369 | 0.631 | p > 0.05 | 0.535 | 0.465 | 1.871 | 0.357 | |
| N | CC | C- | -- | C | - | pValue | Ho | He | Ne | PIC | ||
| P13 | LX | 104 | 32 | 14 | 58 | 0.375 | 0.625 | p < 0.05 | 0.531 | 0.496 | 1.882 | 0.359 |
| QC | 123 | 26 | 67 | 30 | 0.484 | 0.516 | p > 0.05 | 0.501 | 0.499 | 1.998 | 0.375 | |
| NY | 137 | 36 | 31 | 70 | 0.376 | 0.624 | p < 0.05 | 0.531 | 0.469 | 1.884 | 0.359 | |
| JX | 137 | 34 | 44 | 59 | 0.409 | 0.591 | p < 0.05 | 0.517 | 0.483 | 1.936 | 0.367 | |
QC: Qinchuan cattle; NY: Nanyang cattle; JX: Jiaxian red cattle; LX: Luxi cattle; HWE: Hardy–Weinberg equilibrium; Ho: homozygosity; He: heterozygosity; Ne: effective allele number; PIC: polymorphism information content.
Table 4.
Genotypes, alleles, He, Ne, and PIC for variations of the cattle PSAP 3’ UTR.
| Locus | Breed | Size | Genotype Frequency | Allele Frequency | HWE | Population Parameters | ||||||
|---|---|---|---|---|---|---|---|---|---|---|---|---|
| N | GG | GA | AA | G | A | pValue | Ho | He | Ne | PIC | ||
| P6 (N1) | LX | 104 | 91 | 8 | 5 | 0.913 | 0.087 | p < 0.05 | 0.842 | 0.158 | 1.188 | 0.146 |
| QC | 123 | 109 | 13 | 1 | 0.939 | 0.061 | p > 0.05 | 0.885 | 0.115 | 1.129 | 0.108 | |
| NY | 137 | 115 | 10 | 12 | 0.876 | 0.124 | p < 0.05 | 0.783 | 0.217 | 1.278 | 0.194 | |
| JX | 137 | 122 | 12 | 3 | 0.908 | 0.092 | p < 0.05 | 0.877 | 0.123 | 1.140 | 0.115 | |
| N | CC | TC | TT | C | T | pValue | Ho | He | Ne | PIC | ||
| P7 (N6) | LX | 104 | 101 | 1 | 2 | 0.976 | 0.024 | p < 0.05 | 0.953 | 0.046 | 1.049 | 0.046 |
| QC | 123 | 113 | 9 | 1 | 0.955 | 0.045 | p > 0.05 | 0.914 | 0.085 | 1.093 | 0.082 | |
| NY | 137 | 127 | 7 | 3 | 0.953 | 0.047 | p < 0.05 | 0.910 | 0.090 | 1.100 | 0.086 | |
| JX | 137 | 132 | 3 | 2 | 0.947 | 0.053 | p < 0.05 | 0.950 | 0.050 | 1.052 | 0.049 | |
| N | TT | TC | CC | T | C | pValue | Ho | He | Ne | PIC | ||
| P8 (N8) | LX | 104 | 15 | 18 | 71 | 0.231 | 0.769 | p < 0.05 | 0.645 | 0.355 | 1.550 | 0.292 |
| QC | 123 | 13 | 26 | 84 | 0.211 | 0.789 | p < 0.05 | 0.667 | 0.333 | 1.500 | 0.279 | |
| NY | 137 | 91 | 25 | 21 | 0.755 | 0.245 | p < 0.05 | 0.630 | 0.369 | 1.586 | 0.301 | |
| JX | 137 | 13 | 49 | 75 | 0.266 | 0.734 | p > 0.05 | 0.602 | 0.398 | 1.660 | 0.319 | |
| N | AA | GA | GG | A | G | pValue | Ho | He | Ne | PIC | ||
| P9 (N12) | LX | 104 | 85 | 7 | 12 | 0.851 | 0.149 | p < 0.05 | 0.746 | 0.254 | 1.340 | 0.221 |
| QC | 123 | 99 | 16 | 8 | 0.870 | 0.130 | p < 0.05 | 0.774 | 0.226 | 1.293 | 0.201 | |
| NY | 137 | 113 | 17 | 7 | 0.887 | 0.113 | p < 0.05 | 0.799 | 0.201 | 1.251 | 0.181 | |
| JX | 137 | 92 | 33 | 12 | 0.770 | 0.230 | p < 0.05 | 0.670 | 0.330 | 1.491 | 0.275 | |
| N | CC | TC | TT | C | T | pValue | Ho | He | Ne | PIC | ||
| P10 (N13) | LX | 104 | 72 | 17 | 15 | 0.774 | 0.226 | P < 0.05 | 0.650 | 0.350 | 1.538 | 0.289 |
| QC | 123 | 85 | 27 | 11 | 0.801 | 0.199 | p < 0.05 | 0.681 | 0.319 | 1.468 | 0.268 | |
| NY | 137 | 92 | 29 | 16 | 0.777 | 0.223 | p < 0.05 | 0.654 | 0.346 | 1.529 | 0.286 | |
| JX | 137 | 82 | 39 | 16 | 0.720 | 0.280 | p < 0.05 | 0.616 | 0.384 | 1.623 | 0.310 | |
| N | AA | GA | GG | A | G | pValue | Ho | He | Ne | PIC | ||
| P11 (N31) | LX | 104 | 11 | 7 | 86 | 0.139 | 0.861 | p < 0.05 | 0.760 | 0.240 | 1.316 | 0.211 |
| QC | 123 | 11 | 19 | 93 | 0.167 | 0.833 | p < 0.05 | 0.722 | 0.278 | 1.385 | 0.239 | |
| NY | 137 | 13 | 9 | 115 | 0.128 | 0.872 | p < 0.05 | 0.777 | 0.223 | 1.287 | 0.198 | |
| JX | 137 | 4 | 27 | 106 | 0.124 | 0.876 | p > 0.05 | 0.777 | 0.223 | 1.287 | 0.198 | |
P: the number variants in the fragment of PSAP; N: the number of bases in PSAP 3’ UTR; QC: Qinchuan cattle; NY: Nanyang cattle; JX: Jiaxian red cattle; LX: Luxi cattle; HWE: Hardy–Weinberg equilibrium; Ho: homozygosity; He: heterozygosity; Ne: effective allele number; PIC: polymorphism information content.
Table 5.
Relationship between variations of PSAP and morphological traits.
| Locus | Breed | Morphological Trait | Observed Genotypes (Mean a ± SE) | |||
|---|---|---|---|---|---|---|
| GG | GA | AA | p Value | |||
| P1 | JX | Waist width (cm) | 41.38 b ± 2.60 (n = 8) | 42.13 ab ± 1.43 (n = 24) | 45.58 a ± 0.61 (n = 69) | 0.015 |
| P1 | JX | Hucklebone width (cm) | 24.17 b ± 2.08 (n = 12) | 23.74 b ± 1.04 (n = 39) | 27.91 a ± 0.50 (n = 85) | 0.000 |
| P1 | NY | Body length (cm) | 146.38 a ± 5.63 (n = 8) | 145.08 a ± 5.41 (n = 12) | 138.13 b ± 1.00 (n =115) | 0.038 |
| TT | TC | CC | pValue | |||
| P3 | LX | Abdominal circumference (cm) | 183.78 c ± 5.89 (n = 9) | 214.71 a ± 12.81 (n = 7) | 198.06 b ± 1.69 (n = 88) | 0.003 |
| GG | GA | AA | pValue | |||
| P4 | NY | Waist width (cm) | 44.59 b ± 0.84 (n = 45) | 49.83 ab ± 0.17 (n = 3) | 51.83 a ± 5.09 (n = 3) | 0.045 |
| P4 | LX | Abdominal circumference (cm) | 197.79 b ± 1.68 (n = 89) | 216.14 a ± 12.43 (n = 7) | 183.75 c ± 6.62 (n = 8) | 0.002 |
| GG | GA | AA | pValue | |||
| N1 | NY | Abdominal circumference (cm) | 174.11 a ± 1.09 (n = 114) | 160.90 b ± 6.72 (n = 10) | 177.77 a ± 6.95 (n = 11) | 0.009 |
| GG | GA | AA | pValue | |||
| N12 | JX | Hucklebone width (cm) | 24.08 b ± 6.36 (n = 12) | 24.72 ab ± 6.61 (n = 32) | 27.27 a ± 5.18 (n = 92) | 0.033 |
| GG | GA | AA | pValue | |||
| N31 | NY | Abdominal circumference (cm) | 219.65 a ± 3.80 (n = 42) | 175.67 b ± 12.39 (n = 3) | 211.17 a ± 6.16 (n = 6) | 0.011 |
| N31 | JX | Body length (cm) | 145.83 a ± 0.89 (n = 106) | 139.27 b ± 1.76 (n = 26) | 142.00 ab ± 5.40 (n = 4) | 0.005 |
| N31 | JX | Waist width (cm) | 45.45 a ± 0.50 (n = 83) | 38.00 b ± 2.29 (n = 15) | 48.33 a ± 2.33 (n = 3) | 0.000 |
| N31 | JX | Hucklebone width (cm) | 27.28 a ± 0.49 (n = 106) | 22.65 b ± 1.38 (n = 26) | 27.00 ab ± 2.65 (n = 4) | 0.001 |
| CC | GC | GG | pValue | |||
| P12 | NY | Abdominal circumference (cm) | 228.03 a ± 3.51 (n = 18) | 217.00 ab ± 8.18 (n = 13) | 204.70 b ± 5.89 (n = 20) | 0.016 |
| P12 | LX | Waist width (cm) | 48.11 a ± 0.80 (n = 28) | 45.50 ab ± 1.14 (n = 28) | 44.23 b ± 0.78 (n = 48) | 0.011 |
| P12 | LX | Body weight (kg) | 426.57 a ± 12.39 (n = 28) | 409.04 ab ± 20.17 (n = 28) | 367.69 b ± 10.27 (n = 48) | 0.029 |
P: the number variants in the fragment of PSAP; N: the number of bases in PSAP 3’ UTR; QC: Qinchuan cattle; NY: Nanyang cattle; JX: Jiaxian red cattle; LX: Luxi cattle; a,b,c = p < 0.05.
Table 6.
Relationship between four haplotypes of PSAP 3’ UTR and morphological traits in NY cattle.
| Morphological Trait | Observed Genotypes (LSMa ± SE) | ||||
|---|---|---|---|---|---|
| AA-CC-AA-TT-GG | GG-CC-GG-TT-GG | GG-TT-AA-CC-AA | GG-TT-AA-CC-GG | p Value | |
| Body height (cm) | 134.28 ± 1.34 a (n = 7) | 137.00 ± 1.96 a (n = 4) | 129.58 ± 1.40 b (n = 12) | 128.02 ± 0.59 b (n = 66) | 0.001 |
| Body length (cm) | 146.00 ± 2.85 a (n = 7) | 152.00 ± 3.14 a (n = 4) | 140.42 ± 1.52 b (n = 12) | 139.11 ± 1.07 b (n = 66) | 0.007 |
| Chest circumference (cm) | 184.57 ± 2.72 a (n = 7) | 189.50 ± 2.60 a (n = 4) | 176.17 ± 2.62 b (n = 12) | 174.16 ± 1.07 b (n = 66) | 0.001 |
| Body weight (kg) | 440.86 ± 11.53 a (n = 7) | 440.25 ± 5.56 a (n = 4) | 398.42 ± 11.41 b (n = 12) | 395.06 ± 6.30 b (n = 66) | 0.040 |
LSM: least squares mean; SE: standard error; a,b = p < 0.05.
Publisher’s Note: MDPI stays neutral with regard to jurisdictional claims in published maps and institutional affiliations. |
© 2020 by the authors. Licensee MDPI, Basel, Switzerland. This article is an open access article distributed under the terms and conditions of the Creative Commons Attribution (CC BY) license (http://creativecommons.org/licenses/by/4.0/).
Share and Cite
MDPI and ACS Style
Zhao, H.; Wu, M.; Yi, X.; Tang, X.; Chen, P.; Wang, S.; Sun, X. Functional Analysis of Haplotypes in Bovine PSAP Gene and Their Relationship with Beef Cattle Production Traits. Animals 2021, 11, 49. https://doi.org/10.3390/ani11010049
AMA Style
Zhao H, Wu M, Yi X, Tang X, Chen P, Wang S, Sun X. Functional Analysis of Haplotypes in Bovine PSAP Gene and Their Relationship with Beef Cattle Production Traits. Animals. 2021; 11(1):49. https://doi.org/10.3390/ani11010049
Chicago/Turabian StyleZhao, Haidong, Mingli Wu, Xiaohua Yi, Xiaoqin Tang, Pingbo Chen, Shuhui Wang, and Xiuzhu Sun. 2021. "Functional Analysis of Haplotypes in Bovine PSAP Gene and Their Relationship with Beef Cattle Production Traits" Animals 11, no. 1: 49. https://doi.org/10.3390/ani11010049
Note that from the first issue of 2016, this journal uses article numbers instead of page numbers. See further details here.