Article

Harvest Maturity Stage and Cold Storage Length Influence on Flavour Development in Peach Fruit

1
Department of Agricultural Sciences, Alma Mater Studiorum—University of Bologna, viale Fanin 46, 40127 Bologna, Italy
2
Genomics and Biology of Fruit Crops, Research and Innovation Centre, Fondazione Edmund Mach, Via Edmund Mach, 1, 38010 San Michele All’Adige, Trento, Italy
3
Agriculture Research Division, Plant Production Sciences, Department of Economic Development, Jobs, Transport and Resources, AgriBio Building, 5 Ring Road, Bundoora, VIC 3083, Australia
*
Author to whom correspondence should be addressed.
These authors contributed equally to this work.
Agronomy 2019, 9(1), 10; https://doi.org/10.3390/agronomy9010010
Submission received: 26 November 2018 / Revised: 16 December 2018 / Accepted: 28 December 2018 / Published: 30 December 2018
(This article belongs to the Section Horticultural and Floricultural Crops)

Abstract

:
Peach market is facing a constant decrease due to the poor fruit quality perceived at consumption that might be greatly affected by fruit ripening stage at harvest and by the post-harvest management. The present work aimed at clarifying the influence of maturity at harvest on the evolution of peach aroma and quality during shelf-life after prolonged cold storage. “August Flame” peaches were harvested at three maturity stages, determined based on IAD (index of absorption difference) and ethylene emission. Fruit quality traits (firmness, soluble solids, titratable acidity), ethylene and volatile organic compound (VOC) emission were monitored during for four weeks of cold storage (0 °C). Every week of cold storage was followed by 6 days of shelf-life (18 °C). Ripening segregation at harvest based on IAD was successful since each maturity classes significantly differed based on all quality traits. Cold storage enhanced the aroma development of ‘August Flame’ peach, primarily by increasing the emission of esters and lactones associated with pleasant aroma. Moreover, cold storage also reduced the differences in aroma between the maturity classes. The role of ethylene, which was also influenced by cold storage, in regulating the VOCs emission is discussed.

1. Introduction

Peach (Prunus persica L. Batsch) is an economically important crop, with a worldwide production over 22 million tonnes [1] featuring high nutritional attributes and pleasant flavour [2]. However, peach consumption has been facing a constant drop due to the poor textural and flavour characteristics of some recently selected cultivars [3]. The market demand reduction has not paired a reduction in fruit supply [4] thus causing a substantial surplus in production and a consequent drop in the revenue for producers. Peaches are highly perishable fruit and the supply chain has primarily focused on prolonging their storability to allow long distance export. Consequently, new cultivars, such as the stony-hard varieties, have been selected mainly for their better storage characteristics, more than for their organoleptic attributes. Furthermore, the current cultivars are harvested before the physiological maturity, featuring high value of flesh firmness, low soluble solids concentration, strong acidity, and insufficient aroma, regardless of the fact that fruit maturity at harvest greatly affects aroma at consumption [5]. After harvest, fruit are usually stored at low temperature to be preserved for both local and export markets [6]. Long term cold storage may induce a substantial reduction in sensorial quality [7], often linked with a drastic deterioration of textural properties, such as mealiness, dryness, and woolliness [8]. The development of new post-harvest strategies enabling to preserve, or even increase, fruit quality may overcome these problems.
Aroma is considered by consumers a key component in determining peach quality [9]. Several classes of volatile organic compounds (VOCs), including esters, C6 aldehydes, terpenes, alcohols, and lactones contributes to peach aroma [9,10]. Among all these compounds, lactones are the major contributors of perceived peach aroma [11]. During the progression of maturity, C6 aldehydes, which are perceived as “green” odours, generally decrease, whilet lactones, esters and terpenes increase [11,12]. Finally, the progression towards senescence leads to the production of off-flavour alcohols (mainly ethanol and methanol) due to the insurgence of fermentative metabolism [13].
Ethylene represents a key hormone in regulating the synthesis of aroma-related volatiles, either modulating the activity of VOC producing enzymes, such as alcohol acyltransferase [14] or lipoxygenase [15], or determining the availability of the precursors involved in VOCs biosynthesis [14].
This research aimed at clarifying the relation between the harvest maturity and the evolution of fruit aroma and quality during storage. Previous studies aimed at identifying the effects of cold storage on peach aroma volatiles [6,15,16,17] but, to the best of our knowledge, the combined effect of harvest maturity stage and cold storage length on aroma development has not yet been fully investigated. In this study, maturity was determined as a relation between the index of absorption difference (IAD) measured non-destructively with the DA-Meter (TR-Turoni, Forlì, Italy) and the emission of ethylene [18,19], which is a key hormone modulating the ripening syndrome in climacteric fruit [14,15] such as peach.

2. Materials and Methods

2.1. Plant Material

Fruit from 3 years old ‘August Flame’ peach trees (Prunus persica L. Batsch) grafted on ‘Elberta’ rootstock were used. Plants were grown at the Stone Fruit Field Laboratory at the Agriculture Victoria Tatura experimental research station (36.44° S, 145.27° E; 114 m above sea level) located in the Goulburn Valley region of Victoria, Australia. Trees were managed following local standard agronomical practices for thinning, fertigation, pruning and pest and disease control.

2.2. Maturity Class Definition

Peach maturity classes were identified by the combination of the IAD, measured non-destructively with the DA-Meter (TR, Forlì, Italy) [19] and fruit ethylene emission. The IAD represents an indirect measure of skin and flesh chlorophyll content and ranges from 2.0 to 0.0 where the lower values corresponds to a lower content of chlorophyll and therefore a more advanced fruit maturity [19].
Ethylene was measured in five replicates of a single fruit per each decimal value of IAD from 1.7 to 0.0. Intact fruit were placed in a 1 L air-tight glass jar and maintained at room temperature for one hour. Thereafter, 1 mL of the headspace was sampled and injected in the gas chromatograph (Shimadzu GC-14B, column Packed Alumina SS 80/100 180 cm; Shimadzu, Kyoto, Japan).
The combination of IAD and ethylene measurement allowed to divide fruit at harvest into three maturity classes: pre-climacteric (immature, C-I: IAD 1.6–1.3); onset of climacteric (mature, C-M: IAD 1.2–0.8) and climacteric (ripen, C-R: IAD 0.7–0.0).

2.3. Experimental Design and Storage Conditions

At harvest, 1820 peaches were collected and sorted by IAD value into the previously described maturity classes (C-I, C-M and C-R). For each fruit, fresh weight was recorded before being placed in carton trays containing 20 fruit belonging to the same maturity class. Trays were stored at 0 °C for up to four weeks under normal atmosphere (95% relative humidity). Before storage (week 0) and at weekly intervals of cold storage, 120 fruit per each maturity collected and kept at 18 °C for 6 day to simulate shelf-life. The evolution of quality traits and VOCs emission was assessed immediately after cold storage (day 0) and after 3 and 6 day of shelf-life. For each assessment and maturity class, 5 fruit were individually sampled for VOCs emission and 35 were assessed for quality traits.

2.4. Fruit Quality Assessment

The standard fruit quality traits, such as flesh firmness (FF), soluble solids concentration (SSC) and titratable acidity (TA), were assessed by using standard methods [18]. Soluble solids concentration and titratable acidity were ratioed as SSC/TA to predict the fruit sweetness perception. FF was determined with a Food Texture Analyser (FTA Guss, Strand, South Africa), SSC with a digital refractometer (Atago, Tokyo, Japan) and TA was determined on 1 mL flesh juice (titration with 0.1 N NaOH to end point of pH 8.2) with a potentiometric titrator, Titrex Act2 with AS23 micro auto-sampler (Steroglass, Perugia, Italy).

2.5. Sample Preparation for VOCs Analysis

Five biological replicates per each maturity class, consisting of one individual fruit, were used for VOCs analysis. Peaches were peeled, sliced and immediately frozen in liquid nitrogen and ground with a commercial stainless-steel blender (Waring, Stamford, CT, USA). One gram of powdered frozen fruit was transferred into a 20-mL glass vial sealed with 18 mm PTFE/silicon septa (Agilent technologies, Santa Clara, CA, USA). To each vial, 1 mL of antioxidant solution (400 g L−1 of sodium chloride, 5 g L−1 of ascorbic acid, and 5 g L−1 of citric acid) was added to prevent tissue oxidation [20]. Samples were spiked with 20 µL of 2-octanol (0.23 mg L−1) used as internal standard, before placement in the autosampler.

2.6. Headspace SPME and GC-MS Setup

For VOCs analysis, a Varian 3800 gas chromatograph (GC) equipped with a CTC Combi-PAL autosampler (CTC Analytics AG, Zwingen, Switzerland) interfaced to a Varian 1200 L mass spectrometer (Varian Inc., Palo Alto, CA, USA) was used. VOCs extraction and analysis was performed according to Aprea et al. [20] with the following modifications.
Samples were incubated at 40 °C and agitated at 250 rpm for 10 min prior to the introduction into the headspace of the solid-phase microextraction (SPME) fiber (Supelco 57298-U, Sigma-Aldrich, Saint Louis, MO, Stati Uniti). The SPME was exposed for 30 min to absorb the volatiles and then desorbed in the injector held at 250 °C for 10 min. Analytes were separated on a 30 m × 0.25 mm ID 0.25 µm DB-Wax capillary column (Agilent Technologies, Santa Clara, CA, USA) operated with helium carrier gas at a constant flow of 1.2 mL min−1. The GC oven temperature was held at 40 °C for 3 min, then programmed to 220 °C at 4 °C min−1, then to 250 °C at 10 °C min−1 and held for 1 min. Electron impact ionisation mass spectra were collected from 40 to 500 amu with a 0.6 s scan time.
VOCs identification was performed by comparing each mass spectra and linear retention with the ones classified in NIST/EPA/NIH Mass Spectral Database (NIST 08, National Institute of Standards and Technology, Gaithersburg, MD, USA). VOCs quantification was performed by rationing the peak area of each analyte and the internal standard (2-Octanol, Sigma-Aldrich, Saint Louis, MO, USA).

2.7. Statistical Analysis

Data analysis was performed using Genstat 18.1 (VSNI, Hemel Hempstead, England) as ANOVA followed by Fisher’s Least Significant Difference (LSD) test. VOCs were further evaluated with R statistical software version 3.2.3 (https://www.r-project.org) using the external packages “MixOmics” for principal component analysis (PCA) and variable plots representation, “ggplot2” for line graphics and “FactoMineR” for multiple factor analysis (MFA).

3. Results

3.1. Maturity, Cold Storage and Shelf-Life Influence on Fruit Quality Traits

At harvest assessment, of the combination of IAD and ethylene emission allowed a successful subdivision of fruit in three uniform maturity classes characterized by different characteristic (Table 1 and Table 2). Differences in firmness were recorded in C-R, with significant lower values at harvest in comparison with fruit of C-M and C-I (Table 2). The content of soluble solids was also significantly higher in C-R in comparison with C-I. No differences in TA were found, at harvest, among the maturity classes (Table 2).
The most mature fruit, belonging to C-R class, presented the highest ethylene emission at harvest. Ethylene emission remained significantly higher than the one of C-I and C-M fruit also after cold storage, regardless form its duration (Table 1). However, cold storage length influenced ethylene emission during shelf-life. In all maturity classes, the fruit removed after two weeks of storage showed a notable increase in ethylene production, while fruit after four weeks of storage showed the lowest ethylene emission. Moreover, during shelf-life, fruit from C-R maturity class consistently had the highest ethylene emissions except for those stored for three weeks when fruit belonging to C-M maturity class showed the highest ethylene emission.
Soluble solids concentration and titratable acidity were ratioed as SSC/TA to predict the fruit sweetness perception [21]. At harvest, no significant differences in SSC/TA ratio between the maturity classes were observed.
The effect of cold storage on quality traits was determined by the comparison of the data recorded at the day of removal (day 0) from each period of cold storage. Cold storage induced constant decrease over time of IAD for C-I and C-M classes, while the C-R class maintained stable values of IAD after the second week of cold storage (Table 1). The exposure to cold temperature caused a decrease in FF over time especially for C-R fruit with a significant reduction within the first two weeks. Moreover, in comparison to C-I and C-M, fruit belonging to the C-R class had the lowest values of FF, regardless from the length of cold storage. Fruit in the C-I and C-M classes presented comparable level of FF during the first two weeks of storage, while, at week 3 and 4, C-M fruit showed significantly lower FF values than C-I fruit (Table 2).
The content in soluble solids (SS) did not significantly differ over time and between maturity classes (Table 2). Concerning TA, cold storage generally had a significant effect in immature fruit (C-I), while in more mature fruit (C-M and C-R), a significant reduction was observed only at four weeks of storage. At week 4, C-R fruit had also significantly lower values of TA in comparison to C-I ones.
Cold storage generally increases the SSC/TA ratio and, in C-M and C-R fruit, a significant increase was observed between fruit at harvest and at three and four weeks of storage. However no significant difference was found among maturity classes (Table 2).
The combined effect of cold storage and shelf-life length had the strongest effect in regulating the quality traits (Table 2). While significant differences were found in firmness between maturity classes at every evaluation immediately after cold storage, these differences were reduced during simulated shelf-life. Higher levels of firmness were detected after four weeks of storage for C-I and C-M at the third day of shelf-life. The trend of firmness reduction matched that of the IAD.
SSC did not change significantly during shelf-life and did not show any significant differences among maturity classes. Higher SSC values were detected in C-M and C-R at the last day of shelf-life following 4 weeks of cold storage.
SSC/TA was found to be significantly higher in C-R samples in comparison with C-I. during the last day of shelf-life period regardless from the cold storage length.
Chilling injury symptoms, with altered flesh texture properties, including the complete loss of juice in the flesh, affected 20% of the fruit after 3 weeks of storage. This percentage increase up to 70% after 4 weeks of cold storage. Indeed, it was not possible to collect data on SSC and TA for those fruit since they did not produce enough juice to perform the analysis (Table 2).

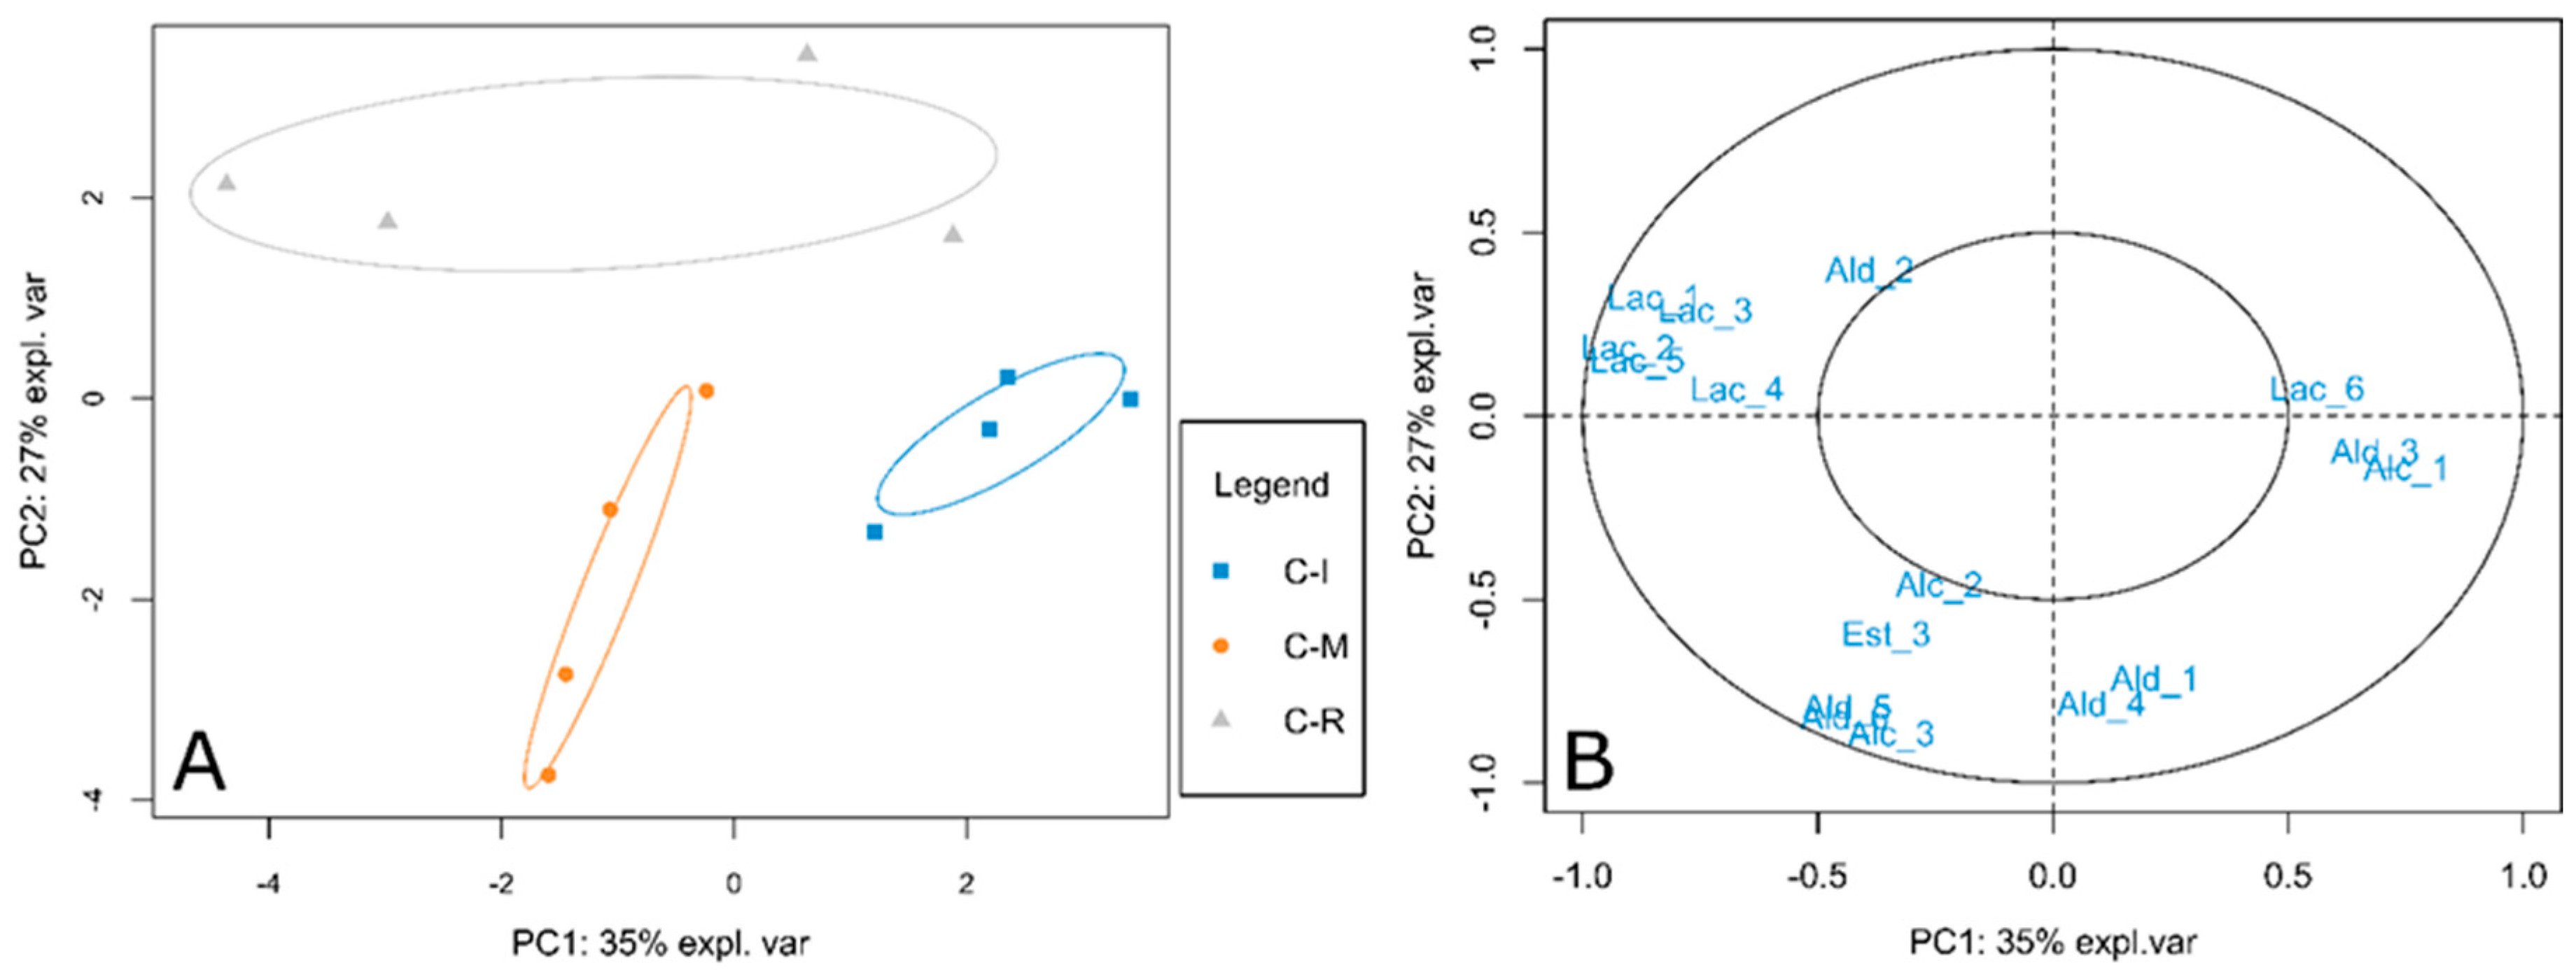
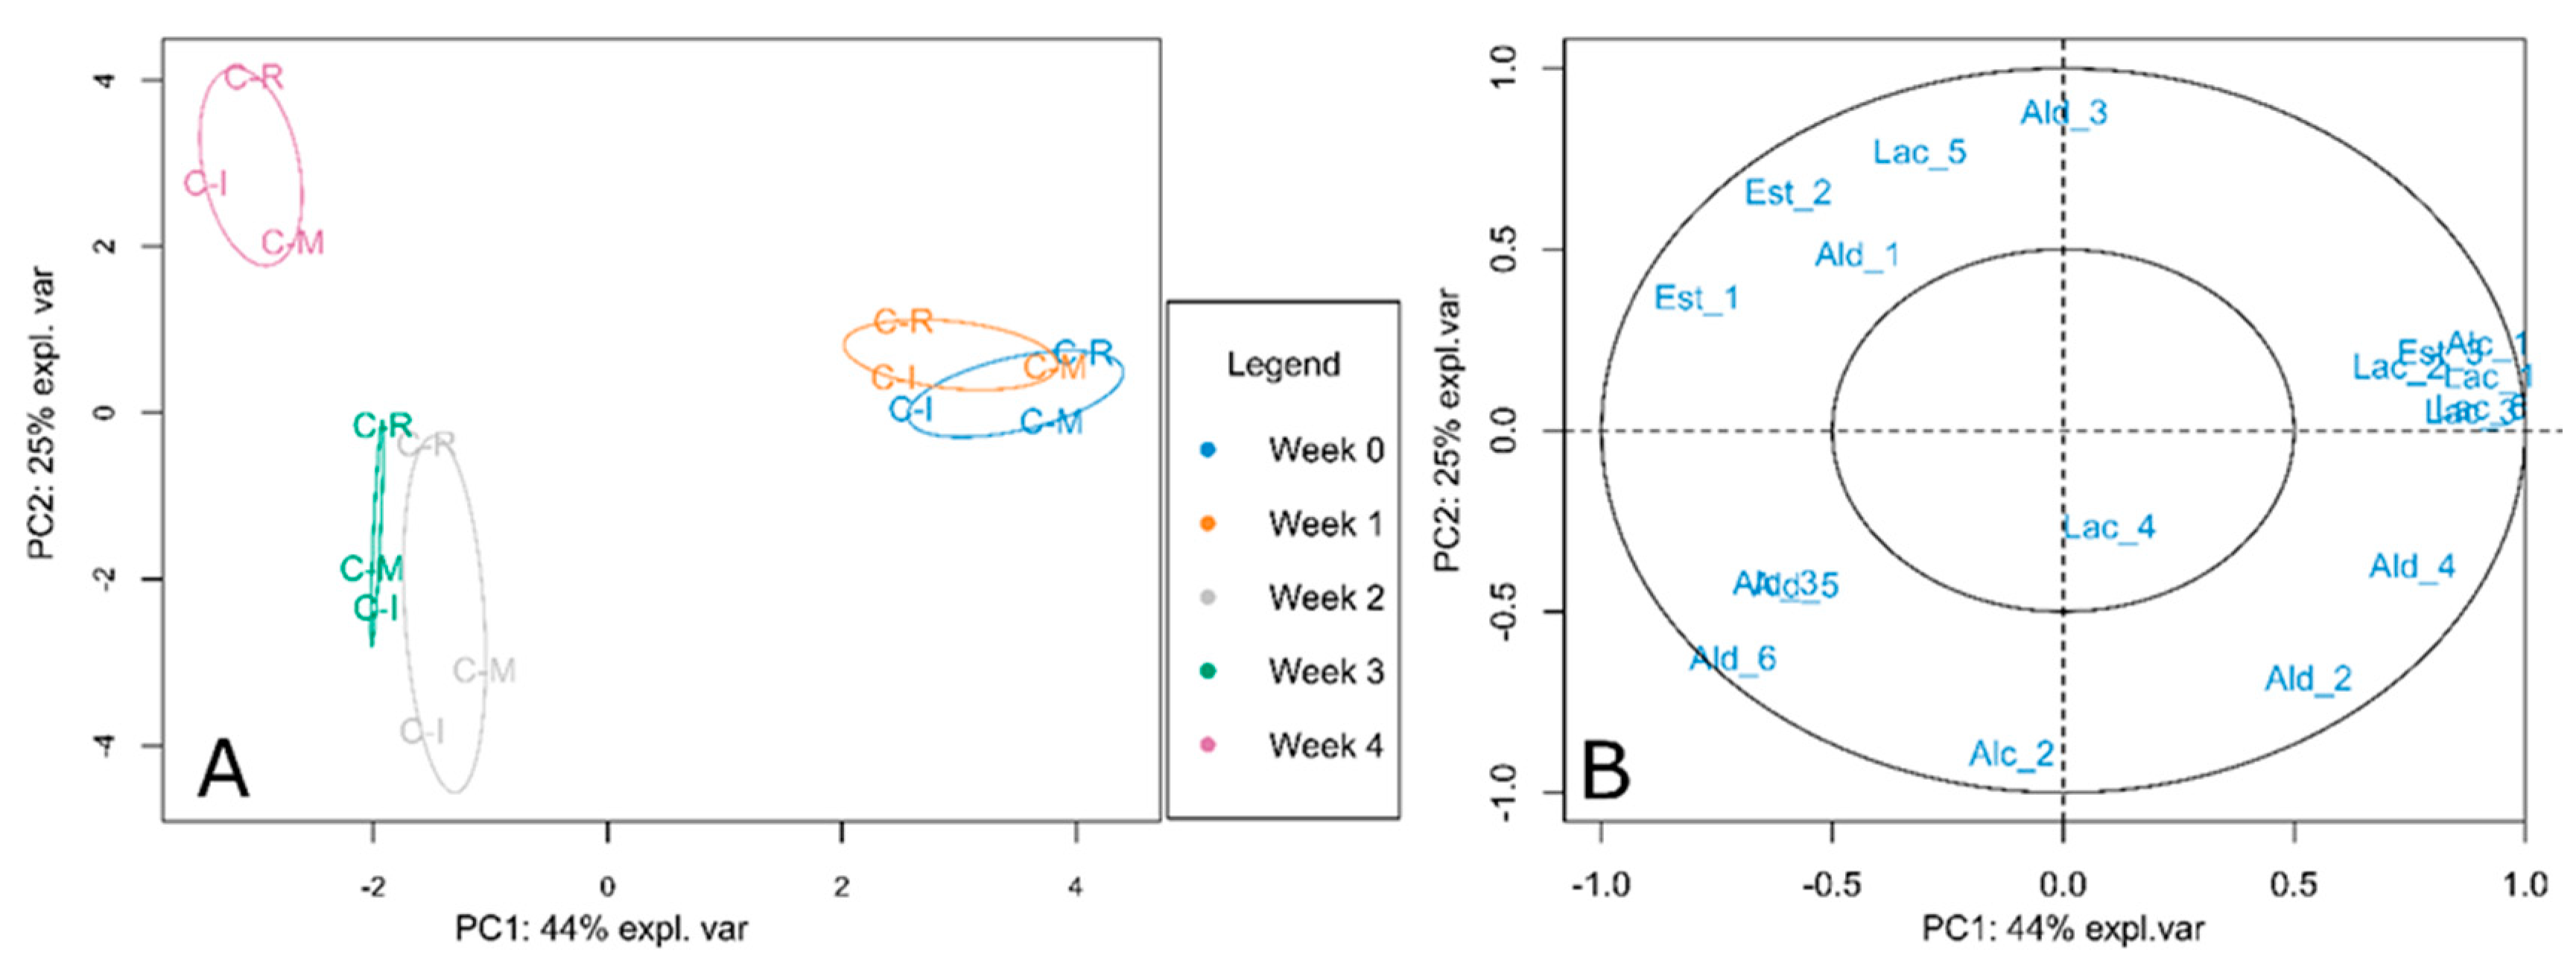
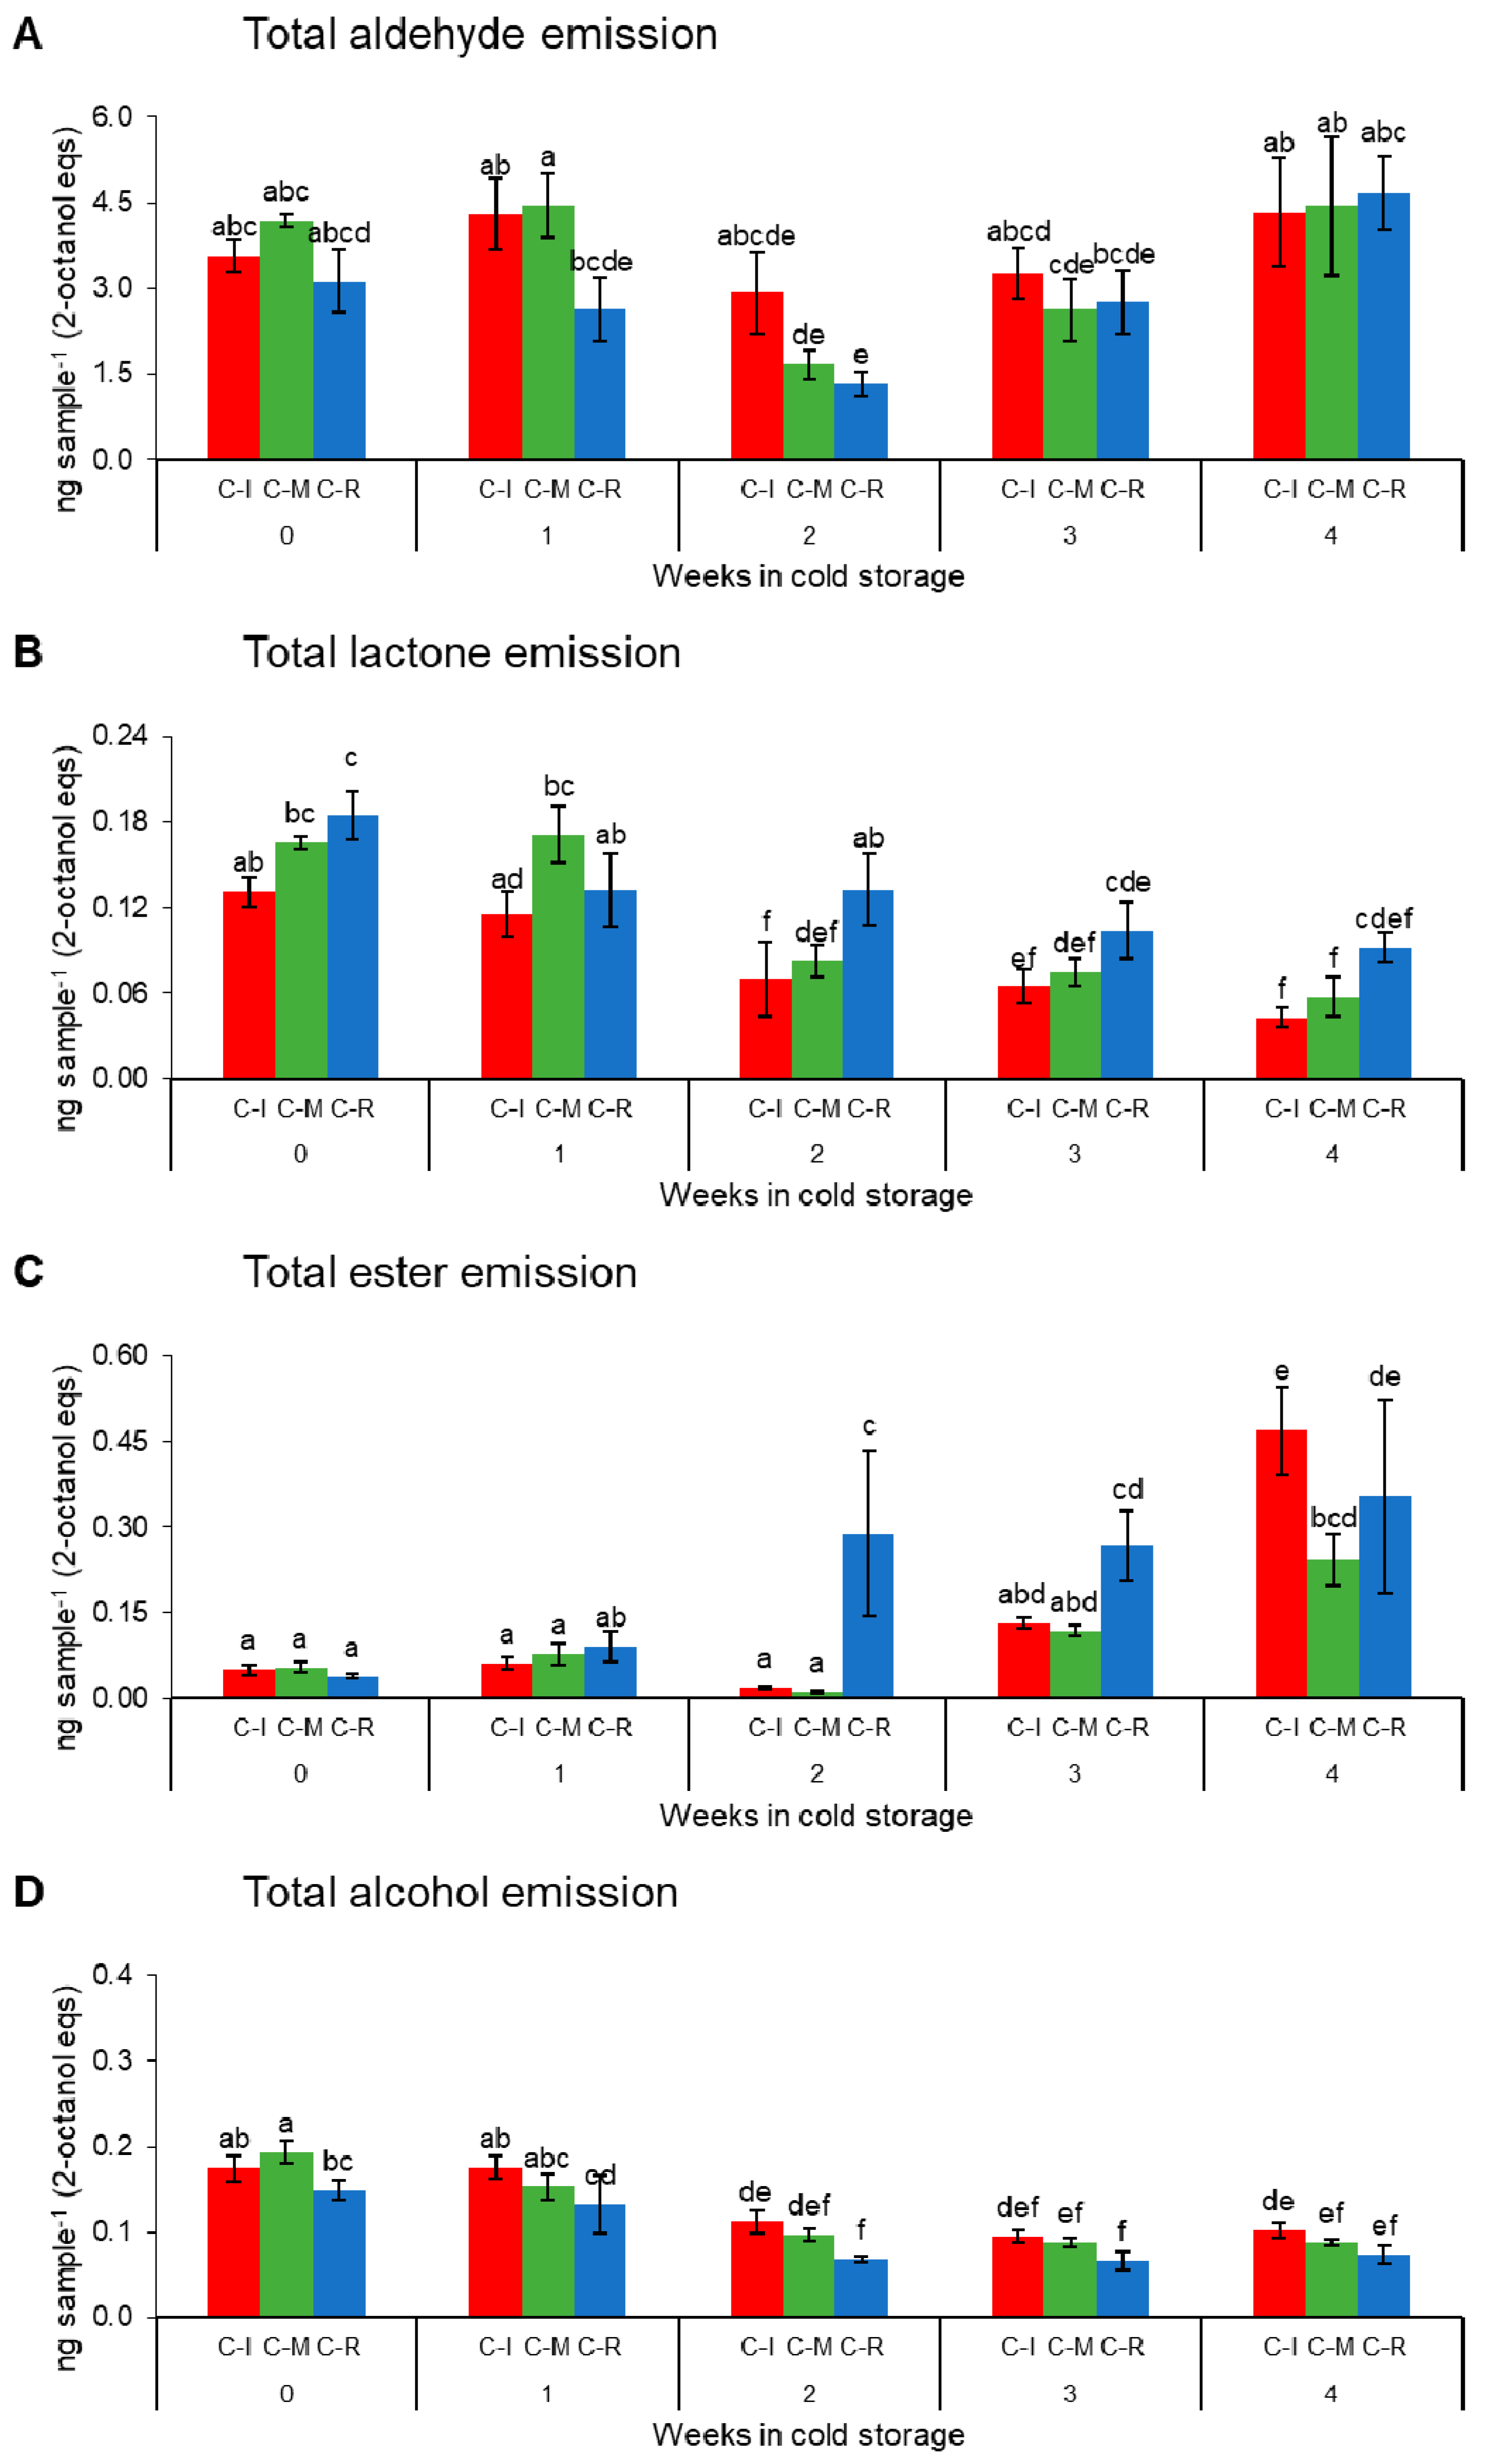
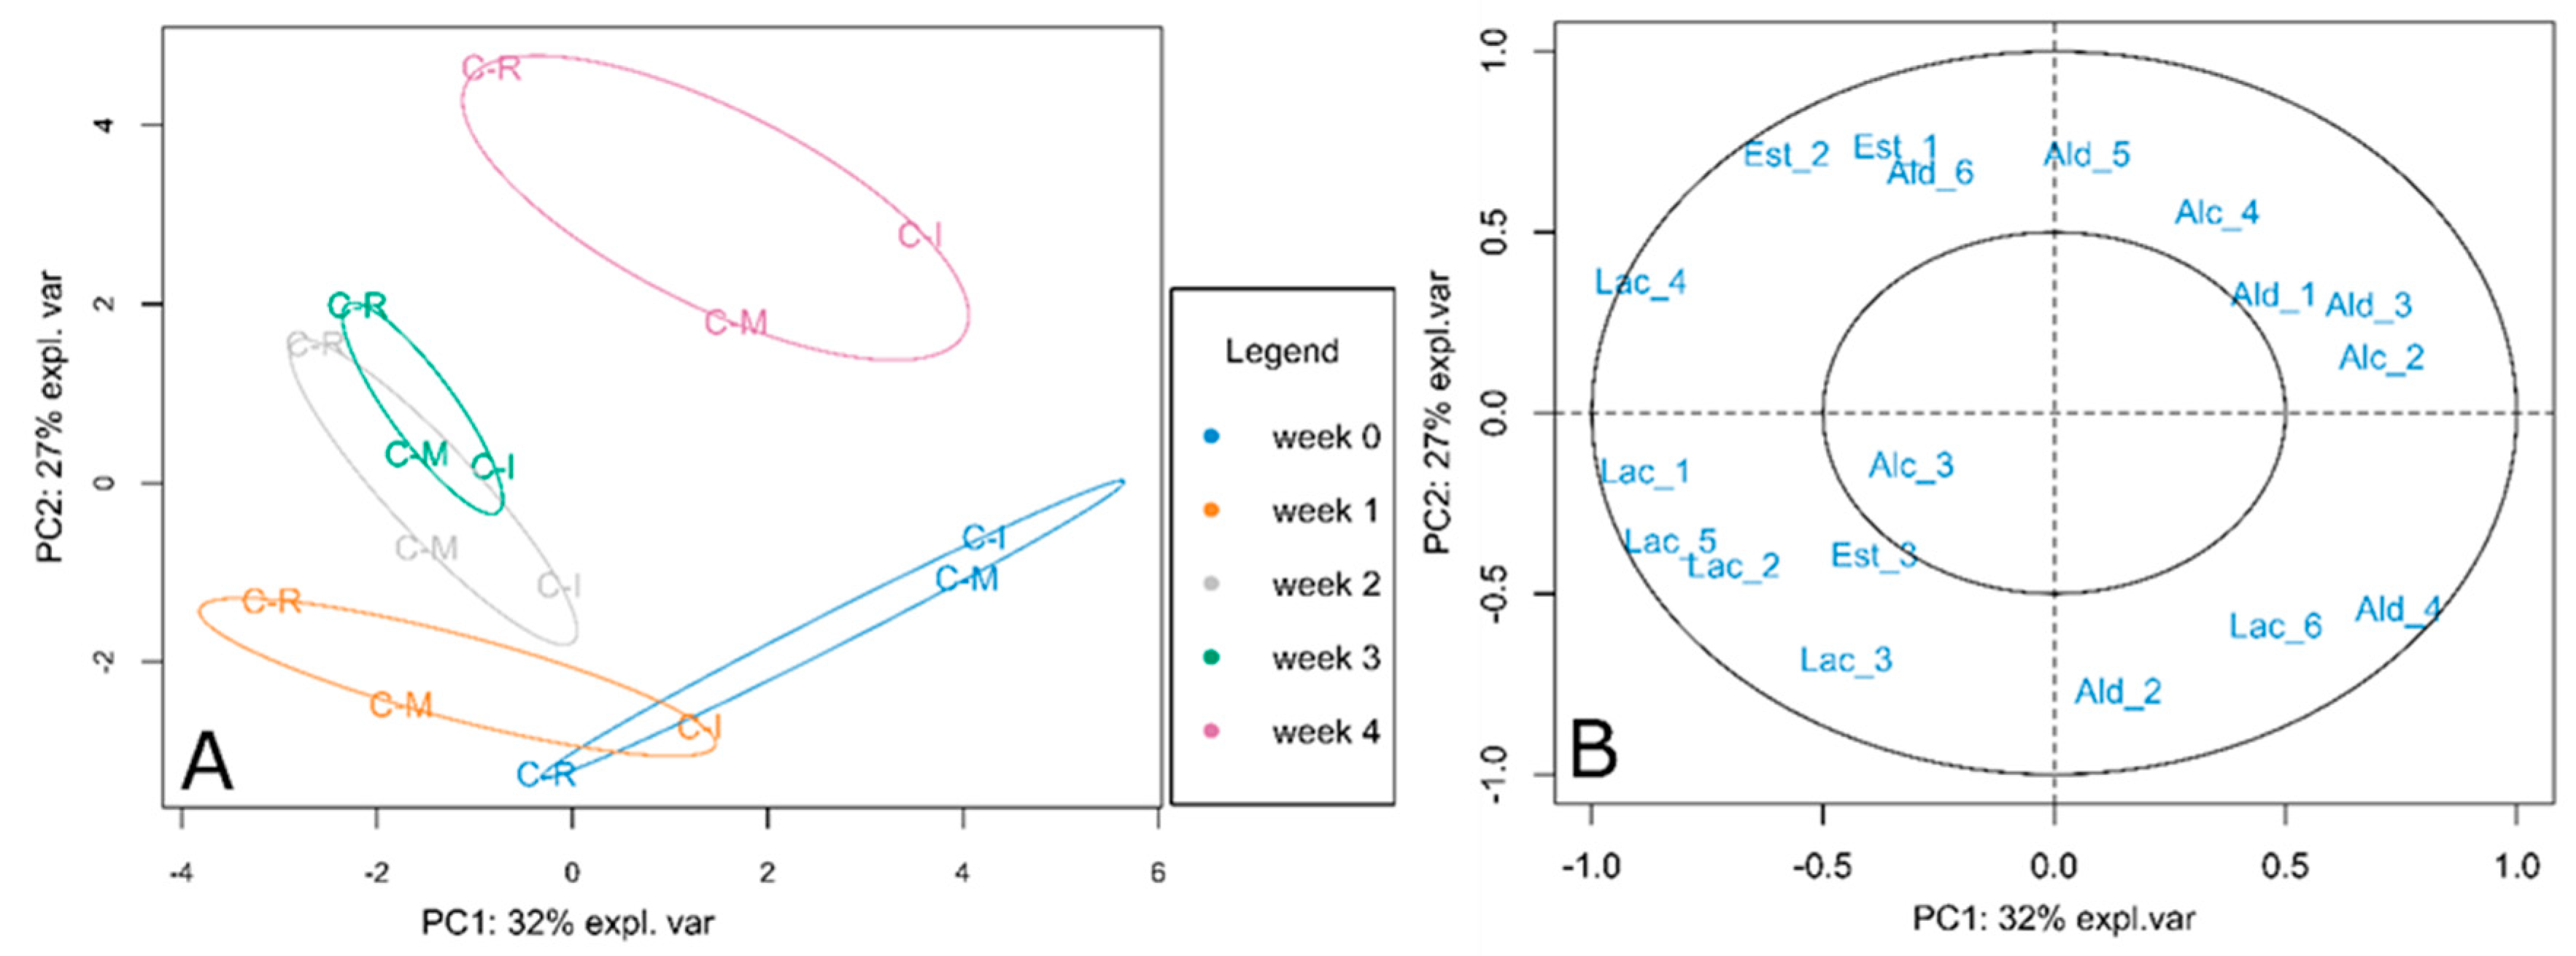
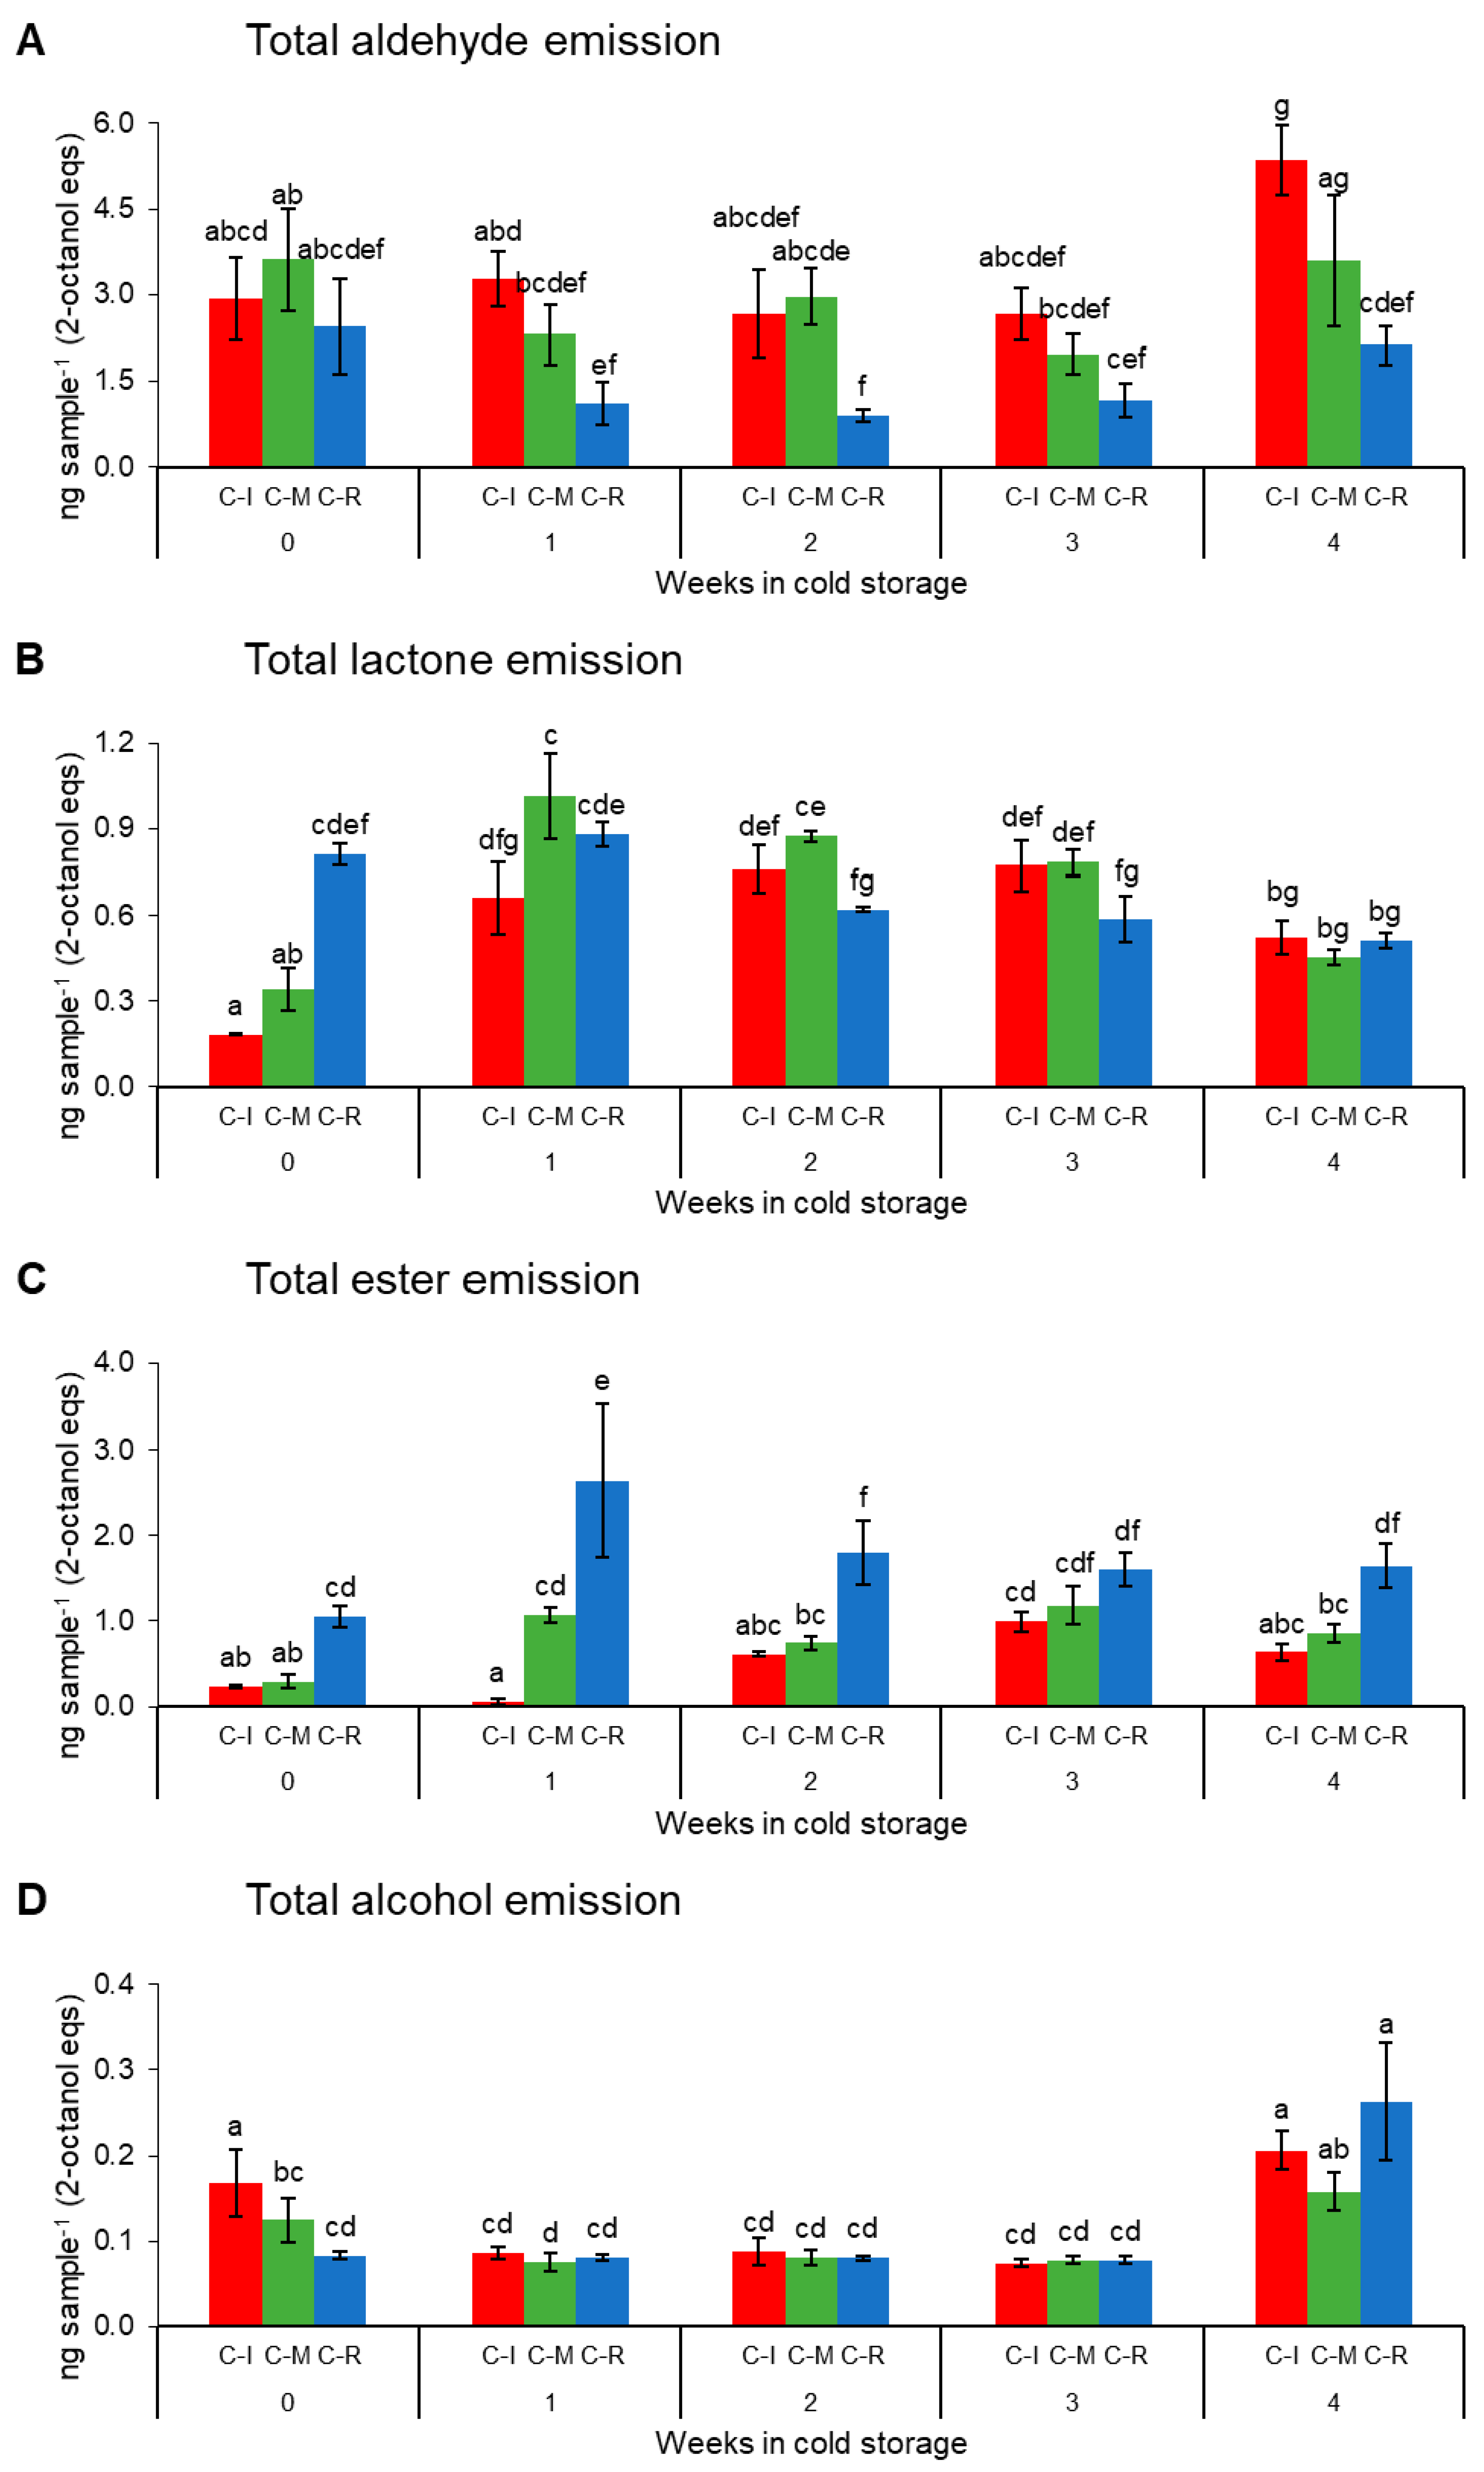
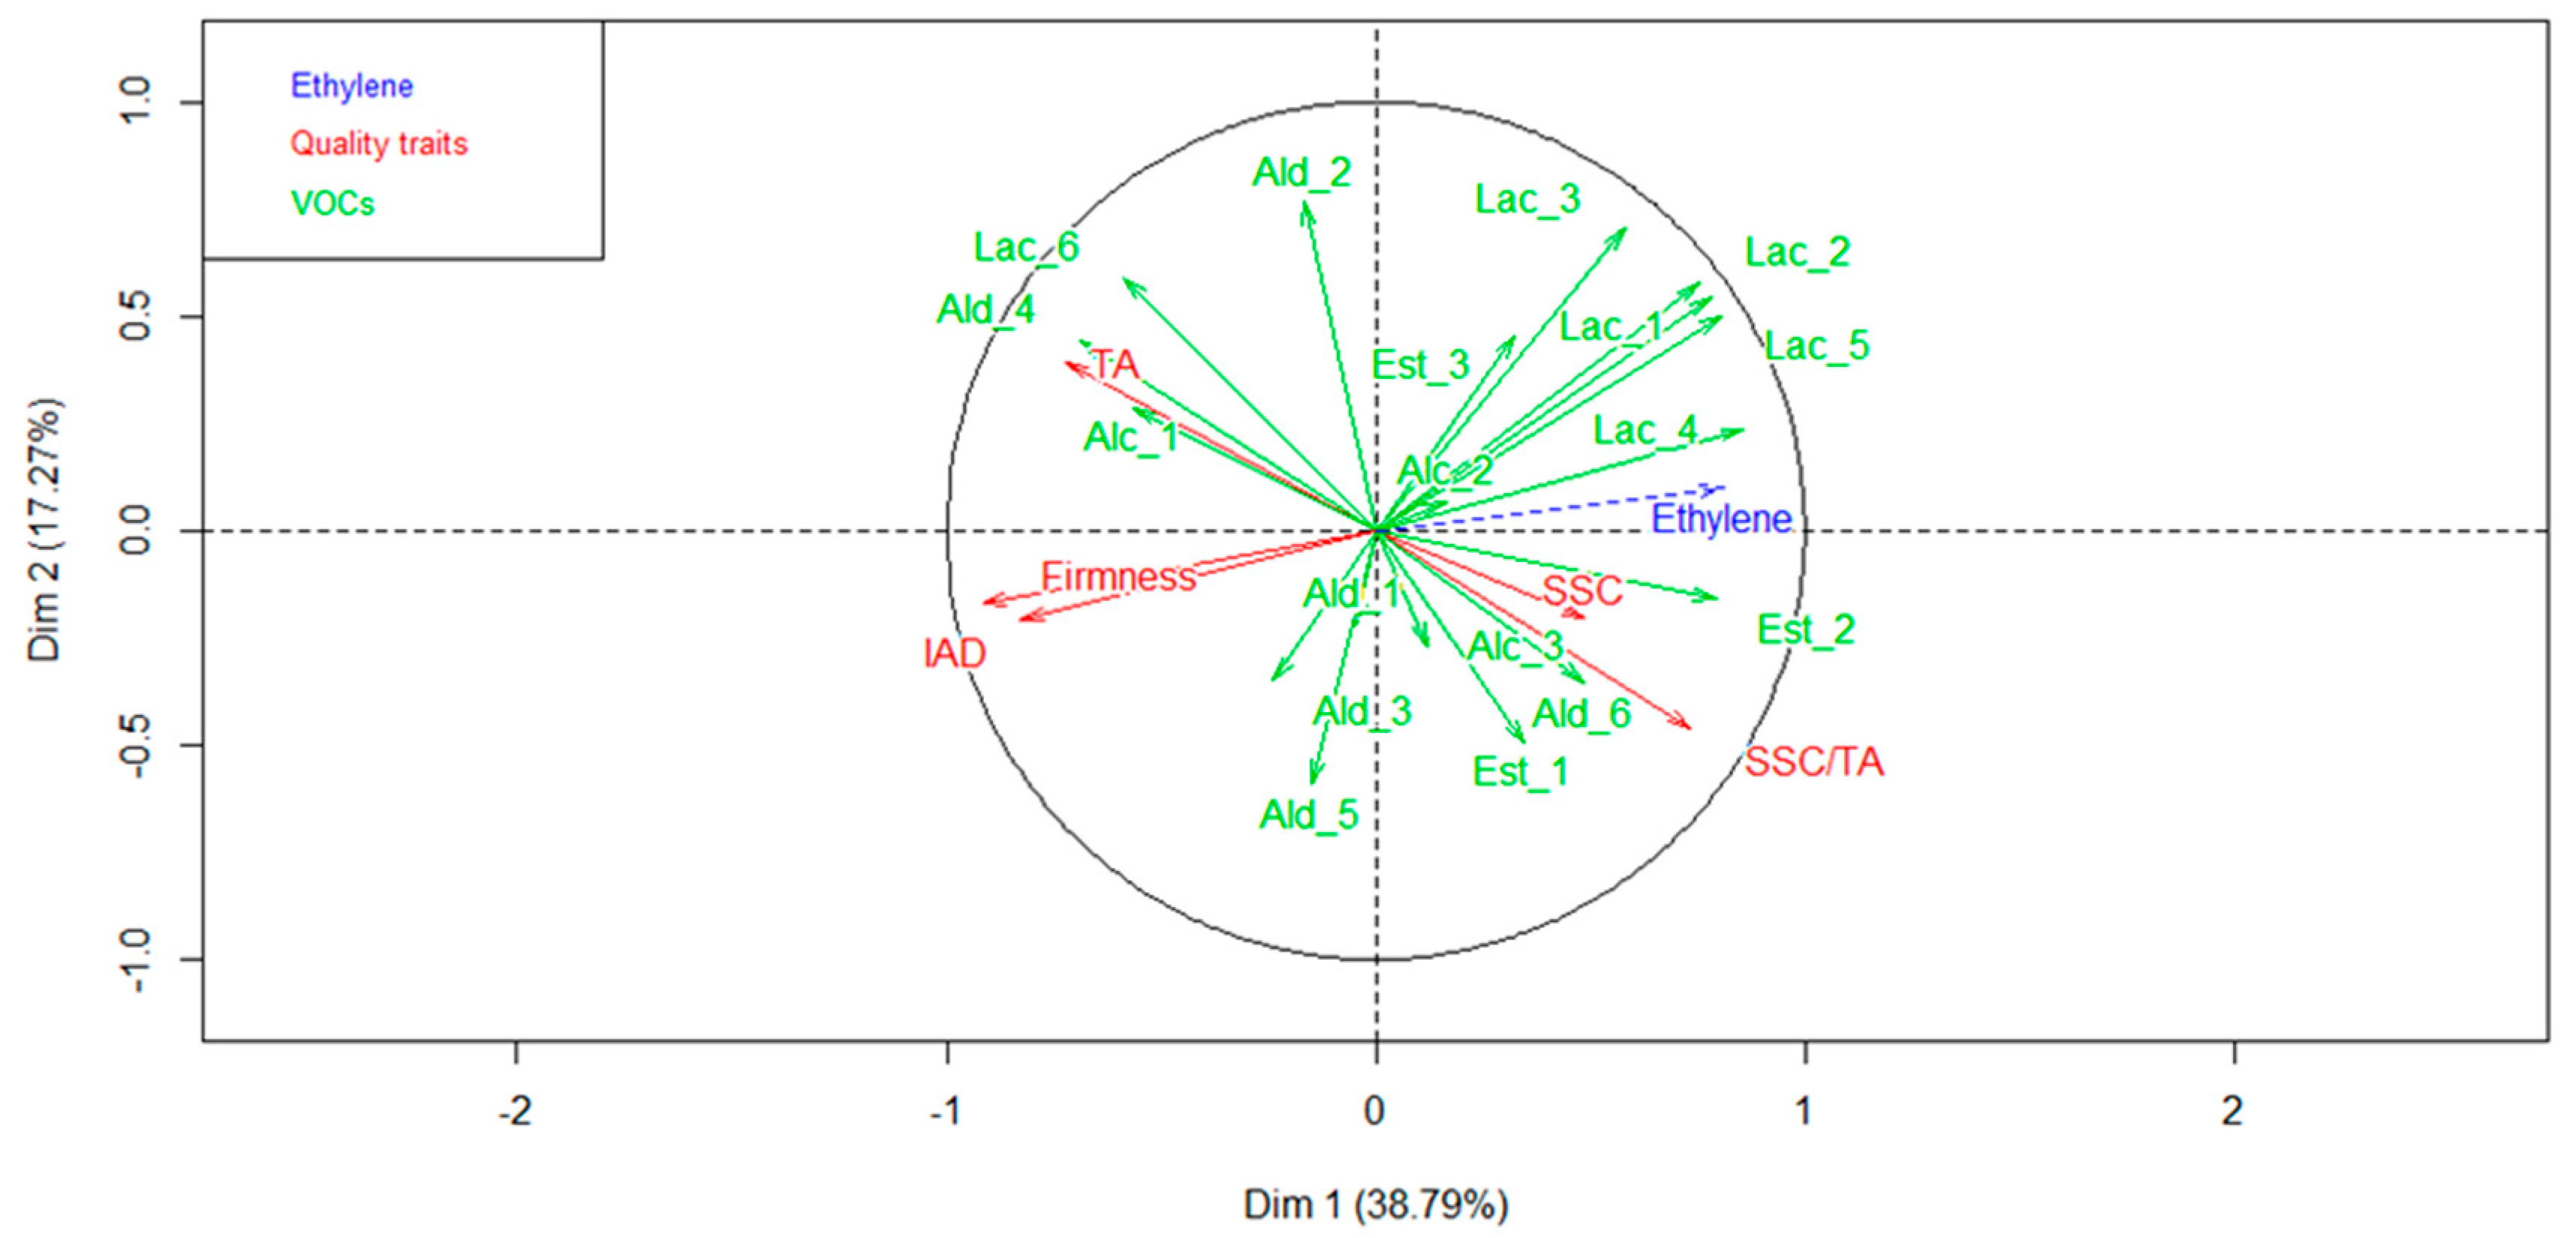
3.2. Maturity, Cold Storage and Shelf-Life Influence on VOC Emission

Eighteen VOCs were identified and quantified through SPME-GC-MS analysis, being lactones the most represented category (Table 3). The evolution of fruit aroma in shelf-life as a function of cold storage was analyzed by grouping the main VOCs in four chemical classes (i.e., lactones, esters, alcohols, aldehydes), sharing similar odor descriptors. Differences in fruit VOC profiles could be observed at the beginning of shelf-life (day 0), in relation to both ripening classes and duration of cold storage. At harvest, the three maturity classes showed a clear differentiation according to the type and abundance of the emitted VOCs (Figure 1A). The principal component analysis (PCA) allowed also to identify the different VOCs responsible for this differentiation (Figure 1B).
According to the variable plot, C-R fruit were characterized by a higher level of lactones (i.e., δ-Decalactone, γ-Decalactone, γ-Octalactone, γ-Hexalactone and 6-Amyl-α-Pyrone), while C-M by a higher level of aldehydes (i.e., (E)-2-Hexenal, Pentanal and Furfural), alcohols (i.e., 2-Ethylhexan-1-ol, 1-Pentanol) and the ester (Z)-3-Hexenyl acetate. Finally, C-I showed higher levels of the aldehyde (Z)-3-Hexenal and the derived alcohol (Z)-3-Hexen-1-ol (Figure 1B).
To analyze the combined influence of the harvest maturity stage and cold storage length, a second PCA analysis was performed using the VOCs emitted by C-I, C-R and C-M fruit at harvest and at 1, 2, 3 and 4 weeks of post-harvest (Figure 2A). VOCs emitted after 1 week of storage were comparable with those at harvest (week 0) being lactones (i.e., δ-Decalactone, γ-Decalactone, 6-Amyl-α-Pyrone and 5-Ethyl-(5H)-Furan-2-one), and the ester (Z)-3-Hexenyl acetate and the alcohol (Z)-3-Hexen-1-ol the most characteristic VOCs (Figure 2B).
After two and three weeks of storage, the main descriptor of fruit aroma were aldehydes, such as Pentanal and Furfural, and the alcohols 1-Pentanol and 2-Ethylhexan-1-ol. Finally, after four weeks, the predominant VOCs were the esters Ethyl Acetate and Methyl Acetate the aldehydes (Z)-3-Hexenal, (E)-2-Hexenal and the lactone γ-Octalactone (Figure 2B).
Exposure to cold storage led to a variation in VOC emission as shown by the emission of total aldehyde, lactones, esters and alcohols at harvest and after 1, 2, 3 and 4 (Figure 3).
The lowest aldehyde levels were found after two or three weeks in cold storage, but significant differences only emerged for C-M and C-R fruit (Figure 3A). Longer cold storage resulted in higher ester, lower lactone, and lower alcohol emissions for all the maturity classes (Figure 3B–D). Within these trends, the most mature fruit at harvest (C-R) generally achieved the highest lactone and ester, and the lowest alcohol levels.
To evaluate the combined effect of maturity at harvest, cold storage length and shelf-life on fruit aroma, VOC emission by fruit of the three maturity classes were analyzed at six days of shelf-life after each storage period and processed by PCA (Figure 4A). The first two principal components accounted for 59% of the total variance. Ripening during shelf-life determined a variation in fruit aroma that was primarily dependent on the length of cold storage. Indeed, after six days of shelf-life, fruit belonging to different maturity classes at harvest but exposed to the same cold storage treatment were all grouping in the same cluster (Figure 4A). Nonetheless, among maturity classes, C-R showed to maintain consistently higher levels of volatile lactones (i.e., δ-Decalactone, γ-Decalactone, γ-Octalactone, γ-Hexalactone and 6-Amyl-α-Pyrone) and esters (i.e., Ethyl and Methyl acetate), while C-I higher aldehydes (i.e., (Z)-3-Hexenal and Hexanal). C-M fruit always clustered in an intermediate position amongst C-R and C-I.
VOCs emitted after four weeks of cold storage differed substantially from the ones produced in other time points, showing a lower influence of lactones and a higher one of esters in determining the overall fruit volatile profile (Figure 4B).
After six days in shelf-life, differences in aldehyde emissions among maturity classes appeared after 1–4 weeks of cold storage (Figure 5A). The emission rates of esters and lactones had generally increased, except in C-I samples with 0–1 weeks cold storage times, while C-R fruit recorded the highest ester emissions for all the cold storage times (Figure 5B,C). Alcohols were constantly about 0.1 mg 2-octanol equivalents per sample, except for C-I samples not subjected to cold storage, and for all the samples after 4 weeks under refrigeration (Figure 5D).
VOCs and ET emission, fruit chemical (SSC, TA) and physical parameters (flesh firmness) and overall maturity (IAD) are the main descriptors of fruit organoleptic quality. The interaction of all these variables was evaluated by a multiple factor analysis (MFA) (Figure 6). The variable plot depicted an inverse correlation with ET emission and the IAD, fruit firmness and the emission of volatile aldehydes (i.e., (E)-2-Hexenal, (Z)-3-Hexenal and Pentanal). Conversely, the increase in ET emission directly correlated with that of volatile lactones (i.e., δ-Decalactone, γ-Decalactone, γ-Octalactone, γ-Hexalactone and 6-Amyl-α-Pyrone) and esters (i.e., Ethyl and Methyl acetates).

4. Discussion

4.1. Quality Parameters Are Affected by Maturity Class and Storage

In this trial, the loss of firmness was the most significant change affected by maturity class, cold storage and shelf-life temperature. Every period of cold storage, followed by 3 day of shelf-life was enough to even out any differences of FF among maturity classes.
The “ready to eat” phase, identified with values of flesh firmness ranging from 8.8 to 13.2 N [22] was reached firstly by fruit in C-R class during the shelf-life without cold storage. Fruit belonging to C-M and C-I classes reached the same value during shelf-life, but after 1 week of cold storage. Longer exposure to cold storage determined an excessive drop in firmness during shelf-life. Higher values of firmness were detected for C-I and C-M fruit at the third day of shelf-life after four weeks of cold storage. This could be explained by the insurgence of chilling injury which may have caused woolliness of the fruit flesh [6,23].
These chilling injury symptoms were unexpected in the last period of storage, as the cultivar employed in this work is considered not susceptible to chilling disorder and the storage was performed at 0 °C, which is the temperature generally recommended to maximize the peach storage potential [23]. In some cases, chilling injury also affected the SSC and TA results, since juice was difficult to obtain from some of those samples.
As common for peaches, the soluble solids content was not negatively affected either by cold storage or shelf-life, since soluble solids increased in shelf-life as a consequence of fruit water loss [6,7].
To better describe the perception of fruit sweetness, data were presented also as SSC/TA. During ripening this ratio generally increases as the fruit titratable acidity decreases [21], therefore, with the progression of ripening, the perception of sweetness increases. The higher values of SSC/TA in the ripen class during shelf-life may reflect a possible higher perception of sweetness of this fruit at consumption [24].

4.2. Evolution of VOCs Profiles in Shelf-Life

The analysis of VOCs confirmed the emission of some of the main compounds contributing to the peach aroma [6,9,16].
The higher quantity of lactones emitted by the ripen fruit (C-R) at harvest, reflected a more pleasant aroma in comparison with the other maturity classes (C-M and C-I). In fact, lactones are commonly described as the main VOC class determining the pleasant and fruity notes of peach aroma [15,25].
Fruit belonging to the immature class (C-I) were characterized, at harvest, by a higher abundance of (Z)-3-hexen-1-ol and (Z)-3-Hexenal, having respectively “grassy-green” [26] and “green” odor properties.
The influence of cold storage length on VOCs emission by fruits belonging to the different maturity classes was evaluated by measuring VOC emission at day 0 of shelf-life (Figure 3).
Cold storage induced a variation in the volatile profile of the three maturity classes especially by reducing the volatile lactones (i.e., δ-Decalactone, γ-Decalactone, 6-Amyl-α-Pyrone and 5-ethyl-(5H)-furan-2-one; Figure 3D). This observation may reflect a negative effect of prolonged cold storage on this group of volatiles. However, with the progression of shelf-life, the emission of volatile lactones from fruit of all the maturity classes was restored to levels comparable to C-R without cold storage. All maturity classes reached comparable emission rates of lactones during shelf-life after two weeks of cold storage, suggesting similar fruity odor characteristics.
The higher rate of ester emission by the more ripen fruit (C-R) may be associated with a more pleasant aroma than that of immature (C-I) and commercially mature (C-M) fruit. In fact, esters contribute to the fragrant, fruity and apple-like odors of fruit [10,26].
Among the alcohols detected, (Z)-3-Hexen-1-ol was the most abundant. This compound is characterized by a “strong green” odor, while 2-Ethylhexan-1-ol and 1-Pentanol with, “oily”, “sweet” and “mild” odors, respectively. (Z)-3-Hexen-1-ol emission decreased with the progression of shelf-life determining the overall decreasing trend of alcohols, since 2-Ethylhexan-1-ol and 1-Pentanol showed an increasing trend.
In our experimental conditions, the emission of (Z)-3-Hexen-1-ol and (Z)-3-Hexenal, which show similar effects on the perceived aroma, were associated (Figure 2 and Figure 4).
Aldehydes are known for their contribution to “green” notes of perceived fruit aromas [26]. These compounds were the predominant ones in the VOC profile of “August Flame” peaches. The progression of maturity led to a general decrease of the aldehydes.
The increasing trends of alcohols and aldehydes during shelf-life following 4 weeks of cold storage (Figure 5A,D) was possibly caused by the higher severity of chilling injury reveals also by the texture analysis.

4.3. Control of Fruit Ripening and Quality through Cold Storage

Results presented in this work may allow to tailor the length of cold storage on the fruit maturity at harvest to maximize quality development during shelf-life. Indeed, the duration of cold storage affects ethylene release, and, for each maturity class, the highest ethylene emission rates are associated with the maximum SSC/TA ratios. In addition, our results suggest that the rise in ethylene emission, induced by cold storage, may enhance the emission of volatile lactones by the fruit. Ethylene has shown to be directly associated with the emission of volatile lactones as displayed in the multiple factor analysis (Figure 6), suggesting its possible role in modulating the synthesis of lactones in a similar manner among the three maturity classes. These results are supported by the findings of Zhang et al. [15] who also reported a direct association between ethylene emission and fruity volatiles (esters and lactones) by peaches in shelf-life after cold storage.
Volatile esters (i.e., Methyl acetate and Ethyl acetate) were not detected at harvest and became detectable in increasing concentrations with the progression of shelf-life after cold storage. This could also be linked with higher emission of ethylene after cold storage. Defilippi et al. [14] reported low volatile esters emission in the ‘Greensleeves’ apples under ethylene suppression conditions and the consequent recovery after exposure to exogenous ethylene. Furthermore, Cano-Salazar et al. [6] reported that 20 day of cold storage improved esters emission of ‘Early Rich’ and ‘Elegant Lady’ during shelf-life.
In contrast, C6 aldehydes and alcohols are generally inversely proportional to ethylene emission. These compounds have often been linked to mechanical damage to plant tissues, as a part of the signaling network resulting in the activation of plant defenses [27]. Thus, an incipient cold stress, possibly impairing overall fruit quality, may be postulated upon their appearance.

5. Conclusions

This work showed the differential effects of cold storage on aroma development of fruit harvested at different maturity stages opening the possibility to manipulate peach flavour by tailoring the length of cold storage based on non-invasive measurement (IAD) of fruit maturity. Indeed cold storage tended to increase the fruity components of ‘August Flame’ peach aroma and reduced the differences flavor development between the maturity classes. Thus, cold storage may be improving peach flavor of those fruit harvested too immature (i.e., before physiological maturity). Nonetheless, the maturity at harvest remain the key component in determining the evolution of peach quality, as C-R fruit were characterized by better flavor properties even prior to cold storage.
Cold storage also enhanced the reduction in average flesh firmness value, which represent a limit to commercialization as fruit became overly soft after 3 days at room temperature. Soft fruit on the market shelf may also incur in damages on the skin and flesh caused by fruit handling. Finally, prolonged cold storage (4 weeks) induced severe chilling injury, which represent a conspicuous storage impediment, especially if the cultivar is exported to far-off destinations.
A quality-oriented storage strategy should account for peach ripening stage at harvest to influence the aroma bouquet by a timely cold storage-induced ethylene release.

Author Contributions

A.Cec., B.F., G.C., D.F. and F.S. conceived the study and planned the experimental design; A.Cec., C.F. and D.A. performed the fruit sampling and the analytical analysis; B.F., A.Cel. and I.D. performed the statistical analysis. The paper was drafted by A.Cec., B.F. and F.S. and fine-tuned by the rest of the authors.

Funding

The project was financed by Hort Innovation, Summerfruit fund and cofounded by Agriculture Victoria Research, division of the Department of Economic Development, Jobs, Transport and Resources with participation of the Australian Government.

Conflicts of Interest

The authors declare no conflict of interest.

References

  1. FAOSTAT. Available online: http://www.fao.org/faostat/en/#home (accessed on 31 August 2017).
  2. Wang, L.; Chen, S.; Kong, W.; Li, S.; Archbold, D.D. Salicylic acid pretreatment alleviates chilling injury and affects the antioxidant system and heat shock proteins of peaches during cold storage. Postharvest Biol. Technol. 2006, 41, 244–251. [Google Scholar] [CrossRef]
  3. Crisosto, C.H.; Crisosto, G.M.; Echeverria, G.; Puy, J. Segregation of peach and nectarine (Prunus persica (L.) Batsch) cultivars according to their organoleptic characteristics. Postharvest Biol. Technol. 2006, 39, 10–18. [Google Scholar] [CrossRef]
  4. Bianchi, T.; Weesepoel, Y.; Koot, A.; Iglesias, I.; Eduardo, I.; Gratacós-cubarsí, M.; Guerrero, L.; Hortós, M.; van Ruth, S. Investigation of the aroma of commercial peach (Prunus persica L. Batsch) types by Proton Transfer Reaction—Mass Spectrometry (PTR-MS) and sensory analysis. Food Res. Int. 2017, 99, 133–146. [Google Scholar] [CrossRef] [PubMed]
  5. Infante, R.; Aros, D.; Contador, L.; Rubio, P. Does the maturity at harvest affect quality and sensory attributes of peaches and nectarines? N. Z. J. Crop Hortic. Sci. 2012, 40, 103–113. [Google Scholar] [CrossRef] [Green Version]
  6. Cano-Salazar, J.; Echeverría, G.; Crisosto, C.H.; Lopez, L. Cold-storage potential of four yellow-fleshed peach cultivars defined by their volatile compounds emissions, standard quality parameters, and consumer acceptance. J. Agric. Food Chem. 2012, 60, 1266–1282. [Google Scholar] [CrossRef] [PubMed]
  7. Infante, R.; Farcuh, M.; Meneses, C. Monitoring the sensorial quality and aroma through an electronic nose in peaches during cold storage. J. Sci. Food Agric. 2008, 88, 2073–2078. [Google Scholar] [CrossRef]
  8. Giné-Bordonaba, J.; Cantín, C.M.; Echeverría, G.; Ubach, D.; Larrigaudière, C. The effect of chilling injury-inducing storage conditions on quality and consumer acceptance of different Prunus persica cultivars. Postharvest Biol. Technol. 2016, 115, 38–47. [Google Scholar] [CrossRef]
  9. Wang, Y.; Yang, C.; Li, S.; Yang, L.; Wang, Y.; Zhao, J.; Jiang, Q. Volatile characteristics of 50 peaches and nectarines evaluated by HP-SPME with GC-MS. Food Chem. 2009, 116, 356–364. [Google Scholar] [CrossRef]
  10. Eduardo, I.; Chietera, G.; Bassi, D.; Rossini, L.; Vecchietti, A. Identification of key odor volatile compounds in the essential oil of nine peach accessions. J. Sci. Food Agric. 2010, 90, 1146–1154. [Google Scholar] [CrossRef]
  11. Lavilla, T.; Recasens, I.; Lopez, M.L.; Puy, J. Multivariate analysis of maturity stages, including quality and aroma, in “Royal Glory” peaches and “Big Top” nectarines. J. Sci. Food Agric. 2002, 82, 1842–1849. [Google Scholar] [CrossRef]
  12. Aubert, C.; Günata, Z.; Ambid, C.; Baumes, R. Investigation of Bound Aroma Constituents of Yellow-Fleshed Nectarines (Prunus persica L. Cv. Springbright). Changes in Bound Aroma Profile during Maturation. J. Agric. Food Chem. 2003, 51, 6280–6286. [Google Scholar] [CrossRef] [PubMed]
  13. Pesis, E. The role of the anaerobic metabolites, acetaldehyde and ethanol, in fruit ripening, enhancement of fruit quality and fruit deterioration. Postharvest Biol. Technol. 2005, 37, 1–19. [Google Scholar] [CrossRef]
  14. Defilippi, B.G.; Dandekar, A.M.; Kader, A.A. Relationship of ethylene biosynthesis to volatile production, related enzymes, and precursor availability in apple peel and flesh tissues. J. Agric. Food Chem. 2005, 53, 3133–3141. [Google Scholar] [CrossRef] [PubMed]
  15. Zhang, B.; Xi, W.P.; Wei, W.W.; Shen, J.Y.; Ferguson, I.; Chen, K.S. Changes in aroma-related volatiles and gene expression during low temperature storage and subsequent shelf-life of peach fruit. Postharvest Biol. Technol. 2011, 60, 7–16. [Google Scholar] [CrossRef]
  16. Cano-Salazar, J.; López, M.L.; Crisosto, C.H.; Echverria, G. Cold storage of six nectarine cultivars: Consequences of volatile compounds emissions, physicochemical parameters, and consumer acceptance. Eur. Food Res. Technol. 2013, 76, 571–589. [Google Scholar] [CrossRef]
  17. Ortiz, A.; Echeverría, G.; Graell, J.; Lara, I. Overall quality of “Rich Lady” peach fruit after air- or CA storage. The importance of volatile emission. LWT Food Sci. Technol. 2009, 42, 1520–1529. [Google Scholar] [CrossRef]
  18. Bonora, E.; Noferini, M.; Stefanelli, D.; Costa, G. A new simple modeling approach for the early prediction of harvest date and yield in nectarines. Sci. Hortic. (Amst.) 2014, 172, 1–9. [Google Scholar] [CrossRef]
  19. Ziosi, V.; Noferini, M.; Fiori, G.; Tadiello, A.; Trainotti, L.; Casadoro, G.; Costa, G. A new index based on vis spectroscopy to characterize the progression of ripening in peach fruit. Postharvest Biol. Technol. 2008, 49, 319–329. [Google Scholar] [CrossRef]
  20. Aprea, E.; Gika, H.; Carlin, S.; Theodoridis, G.; Vrhovsek, U.; Mattivi, F. Metabolite profiling on apple volatile content based on solid phase microextraction and gas-chromatography time of flight mass spectrometry. J. Chromatogr. A 2011, 1218, 4517–4524. [Google Scholar] [CrossRef]
  21. Aubert, C.; Günata, Z.; Ambid, C.; Baumes, R. Changes in physicochemical characteristics and volatile constituents of yellow- and white-fleshed nectarines during maturation and artificial ripening. J. Agric. Food Chem. 2003, 51, 3083–3091. [Google Scholar] [CrossRef]
  22. Crisosto, C.H. How do we increase peach consumption? Acta Hortic. 2002, 592, 601–605. [Google Scholar] [CrossRef]
  23. Lurie, S.; Crisosto, C.H. Chilling injury in peach and nectarine. Postharvest Biol. Technol. 2005, 37, 195–208. [Google Scholar] [CrossRef]
  24. Crisosto, C.H.; Crisosto, G.M. Relationship between ripe soluble solids concentration (RSSC) and consumer acceptance of high and low acid melting flesh peach and nectarine (Prunus persica (L.) Batsch) cultivars. Postharvest Biol. Technol. 2005, 38, 239–246. [Google Scholar] [CrossRef]
  25. Rizzolo, A.; Zerbini, P.E.; Grassi, M.; Cambiaghi, P.; Bianchi, G. Effect of Methylcyclopropene on aroma compounds in Big Top nectarines after shelf-life. J. Food Qual. 2006, 29, 184–202. [Google Scholar] [CrossRef]
  26. Sánchez, G.; Besada, C.; Badenes, M.L.; Monforte, A.J.; Granell, A. A non-targeted approach unravels the volatile network in peach fruit. PLoS ONE 2012, 7, e38992. [Google Scholar] [CrossRef] [PubMed]
  27. Matsui, K. Green leaf volatiles: Hydroperoxide lyase pathway of oxylipin metabolism. Curr. Opin. Plant Biol. 2006, 9, 274–280. [Google Scholar] [CrossRef] [PubMed]
Figure 1. (A) Two-dimensional principal component analysis (PCA), elaborated using the VOCs quantified by the GC-MS at harvest for the three maturity classes (C-I: immature; C-M: mature; C-R: ripen. The ellipse confidence level is set at 0.5 (50% region). (B) Variable plot projecting the variables (VOCs) identified at harvest. VOCs ID is reported in Table 1. Two circumferences of radius 1 and 0.5 are plotted to report the correlation structure of the variables.
Agronomy 09 00010 g001
Figure 2. (A) Two-dimensional principal component analysis (PCA), elaborated using the VOCs quantified by the GC-MS at day 0 of simulated shelf-life for the three maturity classes (C-I: immature; C-M: mature; C-R: ripen. The ellipse confidence level is set at 0.5 (50% region). (B) Variable plot projecting the variables (VOCs) identified at day 0 of simulated shelf-life. VOCs ID is reported in Table 1. Two circumferences of radius 1 and 0.5 are plotted to report the correlation structure of the variables.
Agronomy 09 00010 g002
Figure 3. Emission of volatile compounds (grouped by chemical family and expressed as 2-octanol equivalents) from fruit samples collected at different maturity stages (C-I: immature; C-M: commercially mature; C-R: ripe), subjected to cold storage for 0–4 weeks, and measured at the beginning of shelf-life at room temperature. For each chemical family (A: aldehyde; B: lactone; C: ester; D: alcohol), bars marked with different letters are significantly (p < 0.05) different according to ANOVA followed by Fisher’s Least Significant Difference test.
Agronomy 09 00010 g003
Figure 4. (A) Two-dimensional principal component analysis (PCA), elaborated using the VOCs quantified by the GC-MS at day 6 of simulated shelf-life for the three maturity classes (C-I: immature; C-M: mature; C-R: ripen. The ellipse confidence level is set at 0.5 (50% region). (B) Variable plot projecting the variables (VOCs) identified at day 6 of simulated shelf-life. VOCs ID is reported in Table 1. Two circumferences of radius 1 and 0.5 are plotted to report the correlation structure of the variables.
Agronomy 09 00010 g004
Figure 5. Emission of volatile compounds (grouped by chemical family and expressed as 2-octanol equivalents) from fruit samples collected at different maturity stages (C-I: immature; C-M: commercially mature; C-R: ripe), subjected to cold storage for 0-4 weeks, and measured after a 6-day shelf-life at room temperature. For each chemical family (A: aldehyde; B: lactone; C: ester; D: alcohol), bars marked with different letters are significantly (p < 0.05) different according to ANOVA followed by Fisher’s Least Significant Difference test.
Agronomy 09 00010 g005
Figure 6. Multiple Factor Analysis. Variable plot projecting the different groups of variables (VOCs, quality traits, ethylene). VOCs ID is reported in Table 1.
Agronomy 09 00010 g006
Table 1. Non-destructive determination of fruit ripening evolution based on absorption difference index (IAD) and ethylene emission. ‘August Flame’ peaches were assessed at harvest (week 0) and after storage (0 °C) for up to 4 weeks and shelf-life (ambient, 18 °C) for up to 6 days for C-I (immature), C-M (mature) and C-R (ripen) fruit. LSD indicates significant differences.
Storage (weeks)Shelf-Life (days)IADEthylene (nL L−1 h−1 g−1 FW)
0 C-IC-MC-RC-IC-MC-R
01.280.950.390.100.392.76
30.80.530.171.031.702.80
60.340.230.060.852.3415.76
01.230.740.330.721.603.88
130.470.110.094.4317.6838.62
60.110.080.1233.1532.0865.93
01.040.680.258.848.7413.40
230.120.080.0813.5313.7657.80
60.060.060.0956.4879.4995.20
00.90.560.264.958.4110.27
330.120.070.0725.7354.9933.37
60.060.040.154.40113.6384.19
00.830.520.520.732.126.10
430.270.120.15.5511.6235.19
60.180.130.1118.1331.3156.26
LSD0.07 (p < 0.001) - Storage x shelf-life day (no IAD interaction): 20.36 (p < 0.001)
- Storage x IAD (no shelf-life interaction: 13.78 (p = 0.009)
- IAD (no other interations): 6.52 (p < 0.001)
Table 2. Fruit quality evolution based on Firmenss (N), SSC (°Brix), TA (g L−1 malic acid), and SSC/TA ratio assessment. ‘August Flame’ peaches were analysed at harvest (week 0) and after storage (0 °C) for up to 4 weeks and shelf- life (ambient, 18 °C) for up to 6 days for C-I (immature), C-M (mature) and C-R (ripen) fruit. LSD indicates significant differences for both maturity classes and days of assessment.
Storage (weeks)Shelf-Life (days)Firmness (N)SSC (°Brix)TA (g L−1 malic acid)SSC/TA Ratio
0 C-IC-MC-RC-IC-MC-RC-IC-MC-RC-IC-MC-R
068.464.654.315.21617.310.8119.91.38 1.41.53
356.141.130.915.816.316.21111.28.81.391.391.81
633.229.88.715.815.917.210.29.47.71.471.742.08
1057.254.639.415.31616.68.59.48.61.751.641.73
323.113.410.215.115.8167.88.47.61.871.811.78
68.675.316.216.316.79.27.56.71.681.962.23
2054.553.936.915.916.41710.59.38.81.51.71.87
38.78.47.81616.217.211.29.181.471.732.09
65.86.161616.817.97.97.46.11.972.222.58
3043.336.125.915.616.317.57.97.89.21.92.012.22
38.88.46.5161616.9NA6.14.9NA2.643.71
64.64.93.916.916.715.97.26.44.42.22.563.26
4044.835.621.81616.2177.75.74.52.132.762.56
328.812.57.815.716.117.8NANANANANANA
66.37.44.4NA19.620.8NANANANANANA
LSD6.4 (p < 0.001)2.0 (p = 0.014)3.0 (p = 0.096)0.51 (p = 0.150)
NA = samples could not be obtained due to chilling injury.
Table 3. Classes of volatile organic compounds (VOCs) most detected by SPME/GC-MS analysis of peaches at different maturity stages. For each compound the identification code (ID), the retention time (RT) and the average concentration (with standard deviation) assessed at harvest are reported.
CompoundsIDRTMean at Harvest *Standard Deviation
C-IC-MC-RC-IC-MC-R
Aldehydes
(E)-2-HexenalAld_110.340.851.210.740.120.510.40
(E,E)-2,4-hexadienalAld_216.390.010.010.010.010.010.01
(Z)-3-HexenalAld_38.050.901.020.820.430.340.23
HexanalAld_46.231.612.381.430.290.590.51
PentanalAld_53.870.130.140.070.100.080.05
FurfuralAld_618.430.020.020.010.010.010.01
Alcohols
(Z)-3-hexen-1-olAlc_1160.100.120.090.050.040.02
2-Ethylhexan-1-olAlc_219.52 0.040.040.030.010.010.01
1-PentanolAlc_311.990.020.020.010.010.010.01
Esters
Ethyl acetateEst_12.55NDNDNDNDNDND
Methyl acetateEst_22.06NDNDNDNDNDND
(Z)-3-hexenyl acetateEst_314.070.050.050.030.020.020.01
Lactones
6-Amyl-α-pyroneLac_137.310.010.010.020.010.010.01
γ-DecalactoneLac_236.480.050.060.070.010.010.02
δ-DecalactoneLac_337.410.020.030.040.010.010.01
γ-HexalactoneLac_425.240.010.020.020.010.010.01
γ-OctalactoneLac_530.860.010.010.010.010.010.01
5-ethyl-(5H)-furan-2-oneLac_622.34 0.030.030.020.010.010.01
* ng sample−1 (2-octanol eqs); ND = not detected at harvest.

