
Selection of Agronomic Parameters and Construction of Prediction Models for Oleic Acid Contents in Rapeseed Using Hyperspectral Data


1
College of Agronomy, Hunan Agricultural University, Changsha 410128, China
2
Orient Science & Technology College of Hunan Agricultural University, Changsha 410128, China
3
School of Geosciences and Info-Physics, Central South University, Changsha 410083, China
*
Author to whom correspondence should be addressed.
Agronomy 2023, 13(9), 2233; https://doi.org/10.3390/agronomy13092233
Submission received: 21 July 2023
/
Revised: 22 August 2023
/
Accepted: 24 August 2023
/
Published: 26 August 2023
(This article belongs to the Section Precision and Digital Agriculture)
Abstract
:High oleic acid oilseed rape is a hot research area in the development of functional oilseed rape. At present, the model of predicting the oleic acid content in rapeseed at the early growth stage based on hyperspectral technology lacks a mechanistic explanation. In this study, based on the data collected at the 5–6 leaf stage of oilseed rape, a one-dimensional linear regression prediction model of the oleic acid content in leaves (x) and the oleic acid content in rapeseed (y) was constructed with the regression equation y = 1.83x + 75.26, and the R2, RMSE, and RPD of the testing set were 0.96, 0.23%, and 4.86, respectively. Then, a support vector regression prediction model of the spectral standard normal transformed feature parameters and the oleic acid content in leaves was constructed, and the R2, RMSE, and RPD of the testing set were 0.74, 0.21%, and 2.01, respectively. Finally, the sensitive parameter transfer model for the prediction of “spectral standard normal transform feature—oleic acid content in leaves—oleic acid content in rapeseed” was validated, and the R2, RMSE, and RPD of the full sample test were 0.71, 0.54%, and 0.54, respectively. The results show that although the accuracy of the prediction model after the introduction of the agronomic parameters was reduced compared with the performance of direct prediction by using spectra, the oleic acid content in oilseed rape leaves, as an important intermediate variable, could better explain the relationship between the reflection spectrum of the leaf and the oleic acid content in rapeseed. This study provides a theoretical basis and technical support for hyperspectral remote sensing technology in the quality prediction of rapeseed.
1. Introduction
The difference in spectral characteristics of ground objects in different bands is the premise of the qualitative recognition and quantitative inversion of remote sensing. Due to the differences in crops in different nutrient conditions, growth environments, growth stages, and their own genotype, the pigment content, cell structure, and water content of their leaves will change, which will affect the absorption, reflection, and transmission of light, and will eventually lead to different spectral curve characteristics. Therefore, the spectral characteristics of crops can be used for crop-growth monitoring, yield estimation, and quality prediction.
Hyperspectral technology has been extensively used in crop quality detection due to its characteristics of multiple bands, strong continuity, and a large amount of information [1,2]. In recent years, many studies have been carried out on the application of spectral technology for the determination of fatty acid components in oil crops. Li et al. [3], Wu et al. [4], and Gao et al. [5] applied the near-infrared spectroscopic method (NIRS) to achieve the estimation of fatty acid fractions such as stearic, soft, oleic, linoleic, linolenic, and erucic acids in rapeseed. Velasco [6], Li et el. [7], Cantarelli et al. [8], and Jiang et al. [9] realized the rapid determination of oleic acid content in grains of oil crops such as rapeseeds, peanuts, sunflowers, and oil-tea camellia by NIRS. Wein-stock et al. [10] used near-infrared hyperspectral imaging technology to estimate the oleic acid content of single-grain corn, and the RMSE predicted by the PCA-PLSR model was 14%. Parsaeian [11] combined digital image technology with a multi-layer perceptual artificial neural network to estimate the fatty acid content of 125 sesame grains with different genotypes, in which the estimated R2 and RMSE of oleic acid were 0.98 and 0.62%. Jin et al. [12] used hyperspectral technology to predict oleic acid content in rapeseed with and without picking moss, and the R2 of the models were 0.773 and 0.590, respectively, which proved the feasibility of hyperspectral technology in predicting oleic acid content in rapeseed. In conclusion, a majority of studies have used the NIR spectrometer to determine the fatty acid composition of population grains or a single grain of oilseed crops, and the application of hyper spectroscopy to detect the oleic acid content of oilseed rape (Brassica napus L.) is less researched.
Direct prediction of crop quality on a large scale by remote sensing can be realized by establishing a link between crop spectral features and quality indicators. Although this method is simple, easy to operate, and has high prediction accuracy, the mechanism is poorly interpreted. In recent years, scholars have carried out a lot of research on how to enhance the mechanistic interpretation of the remote sensing prediction of crop seed quality [13,14,15,16]. However, at present, the main research objects are wheat, rice, and other grain crops, and the quality index is the most prominent grain protein content. There are few reports on the mechanism of the remote sensing prediction of the fatty acid quality of oil crops such as oilseed rape.
By introducing crop agronomic parameters in the key growth period as intermediate variables and then using data methods to establish the quantitative relationship between them and remote sensing information and quality indicators, there is a good basis for enhancing the interpretability of crop quality prediction by remote sensing. However, at present, the main research objects are wheat, rice, and other grain crops, and the quality index is the most prominent grain protein content. There are few reports on the mechanism of the remote sensing prediction of the fatty acid quality of oil crops such as oilseed rape. Therefore, this study focused on the correlation between the spectral reflectance of leaves, leaf agronomic parameters, and the oleic acid content in rapeseed at the 5~6 leaf stages. According to the idea of “spectral characteristic band—oleic acid content in leaves—oleic acid content in rapeseed”, sensitive agronomic parameters suitable for the spectral prediction of oleic acid content were identified to enhance the explanation of the agronomic mechanism of the model and to provide a theoretical basis and technical support for hyperspectral remote sensing technology in the quality prediction of rapeseed (Brassica napus L.).
2. Materials and Methods
2.1. Experimental Design
This study was conducted for two consecutive years at the Yunyuan Base of Hunan Agricultural University (28°11′ N, 113°4′ E) from September 2018 to May 2019 and from September 2020 to May 2021. The experimental field implemented a rice–rapeseed rotation system, with a humid subtropical monsoon climate. According to meteorological data, from September 2018 to May 2019, the cumulative rainfall was 746.4 mm, with an average temperature of 17.6 °C; from September 2020 to May 2021, the cumulative rainfall was 910.1 mm, with an average temperature of 17.4 °C. The experimental materials were stable inbred lines of Brassica napus with high oleic acid. The origin of these high oleic acid rapeseeds was in Changsha city, Hunan province. These materials were provided by the Hunan Branch of the National Oil Improvement Center. There were 28 and 42 experimental materials, respectively, and 70 materials were collected over two years.
2.2. Data Collection
2.2.1. Leaf Spectral Reflectance
On 24 November 2018 and 13 November 2020, from 10:00 AM to 11:00 AM, spectral reflectance of the leaves of oilseed rape was collected using the ASD FieldSpec 3 full-range spectral radiometer (ASD Inc., Boulder, CO, USA), while the oilseed rape was in the 5 to 6 leaf stage. This instrument includes a hand-held blade probe with an active light source that can be used to directly measure leaf spectral reflectance. The spectral wavelength runs from 350 nm to 2500 nm, with a sampling interval of 1.4 nm between 350 and 1050 nm and 2 nm between 1000 and 2500 nm. The software ViewSpec Pro 6.2 calculates the spectral reflectance for each wavelength using a differential algorithm. The wavelength resolution is 3 nm@700 nm and 10 nm@1400 nm/2100 nm. In each plot, five oilseed rape plants with uniform growth were chosen to capture spectral data from the major functioning leaves. Given the homogeneous distribution of point sites, each leaf had two points measured. The projected area of spectral measurement was approximately 114.52 mm2, with the specific places being two symmetrical points on the upper portion of the leaf, avoiding the leaf vein throughout the measurement. At the same time, the hand-held blade probe included a standard whiteboard for corrections before each plot measurement. Since the “trilateral” parameters in this study, which only require wavelengths from visible to near-infrared and exclude the high-noise range of 350 to 400 nm, only spectral reflectance in the 400 to 1000 nm band range was included in the ensuing leaf spectral feature analysis. A total of 601 wavelengths were included.
2.2.2. Agronomic Parameters
SPAD value (relative chlorophyll content): The relative chlorophyll content of the leaves was measured by an SPAD-502 chlorophyll analyser (Minolta Camera Co., Osaka, Japan) while the data of the leaf hyperspectral reflectance were collected. During the measurement, 5 points were uniformly measured on the functional blade where the spectrum of the blade was collected, the principle of symmetrical distribution of the middle and lower parts was followed, and the arithmetic average value was recorded, representing the SPAD value of the functional blade.
The fatty acid content in leaves: Among the functional leaves whose spectra and SPAD values were determined, 3 complete functional leaves (1 piece/plant) were cut from the leaf stalk with scissors, wrapped in tin foil, and promptly put into the prepared liquid nitrogen tank for fresh-keeping treatment. After field sampling of all the samples to be measured, the fatty acid composition of leaves was analysed by Agilent GC-MS 7980B gas chromatograph indoors. Fatty acid determination was performed according to the GB/T 17376-2008 standard. The determination indexes included oleic acid (OL), linoleic acid (LI), and linolenic acid (LO), and the oleic acid desaturation rate (ODR) was calculated by referring to the following formula:
Leaf physicochemical parameters: Fresh leaf samples from each of the above plots were mixed and stored at −80 °C for reserve. The soluble sugar content (SS), soluble protein content (SP), and chlorophyll content (Chl) of the samples from each high oleic acid rape breeding plot were determined with reference to the Experimental Guide to Plant Physiology.
Oleic acid content in rapeseed: The fatty acid composition of rapeseed was analysed by Agilent GC-MS 7980B gas chromatography (Agilent Technologies Co., Santa Clara, CA, USA). Fatty acid determination was performed according to the GB/T 17376-2008 standard.
2.3. Data Processing
2.3.1. Spectra Pretreatment
First, the arithmetic average of 10 spectral reflectance data points for each plot was calculated, and then splice correction was performed using ViewSpec Pro 6.2, the spectral data preprocessing software that comes with the Field Spec3 feature spectrometer, and then the wavelength range of 400~1000 nm was selected. S−G smoothing (SG), standard normal variate (SNV), multiple scattering correction (MSC), first-order derivative transform (FD), and wavelet transform (WT) were performed on the cropped reflectance to determine the best preprocessing strategy for improving the spectral data signal-to-noise ratio and spectral estimate accuracy.
2.3.2. Association Analysis
Two association analysis methods, grey correlation analysis (GRA) and Pearson correlation analysis, were used in this study. Among them, GRA, as a grey system analysis method, applies to the study of the strength relationship between dependent variables affected by other factors [17], that is, the degree of influence among various factors is determined by the correlation degree. It is mainly used to identify the optimal estimated agronomic parameters.
Due to the multiple and continuous bands of hyperspectral data, data redundancy is prominent, so it is necessary to reduce and select features. The Pearson correlation analysis can measure the correlation between two continuous variables numerically, that is, it can calculate the correlation coefficient between them, and the results are directional. Therefore, the Pearson correlation analysis method was used in this study to screen the characteristic bands of the optimal spectral estimation of agronomic parameters.
2.3.3. Model Construction and Accuracy Evaluation
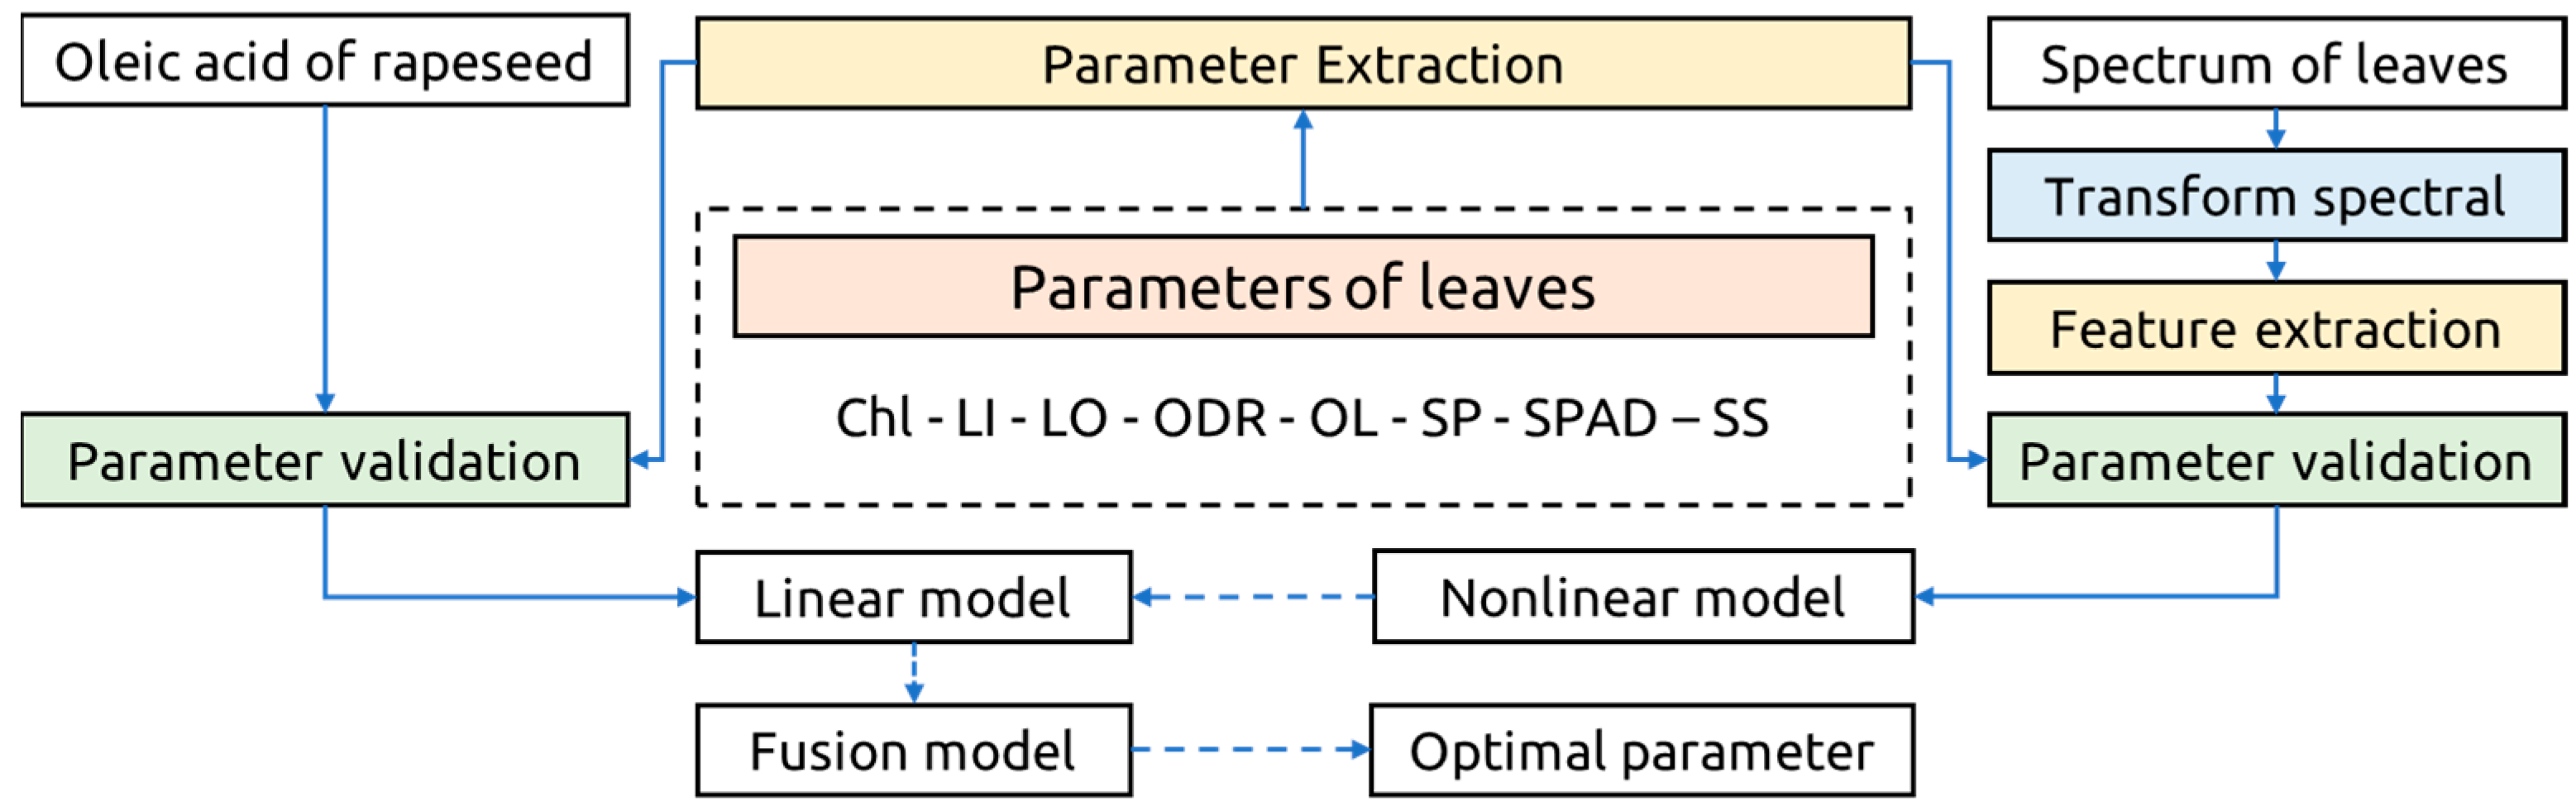
First, the grey correlation analysis and correlation analysis were used to screen the agronomic parameters sensitive to oleic acid content in rapeseed, and the Pearson correlation analysis was conducted between the spectral data after different pretreatments and the sensitive agronomic parameters. Then, the spectral sensitive bands were extracted. Then, a spectral estimation of sensitive agronomic parameters was realized based on MLR, RF, SVR, KNN, RR, and the blended integrated learning model. Finally, with sensitive agronomic parameters as intermediate variables, a transfer mode, “characteristic band—sensitive agronomic parameter—oleic acid content in rapeseed”, was established to achieve the indirect prediction of oleic acid content in rapeseed. Figure 1 shows the process. In the process of modelling, the accuracy of the model was verified internally by using 5-fold cross-validation and externally by independent samples. The coefficient of determination (R2), root mean square error (RMSE), and residual prediction deviation (RPD) were used to evaluate the prediction effect of the model. In this study, the programming language is Python 3.8, the data analysis libraries are scikit-learn and catboost, and the visualization libraries are matplotlib, seaborn, and plotnine.
where n is the number of samples; and are the predicted and measured values of oleic acid content, respectively; is the mean value of measured oleic acid content; SD is the standard deviation of the measured value of the test set; and RMSEv is the root mean square error of the testing set.
3. Results
3.1. Statistical Characteristics of Agronomic Parameters and Oleic Acid Content in Grains
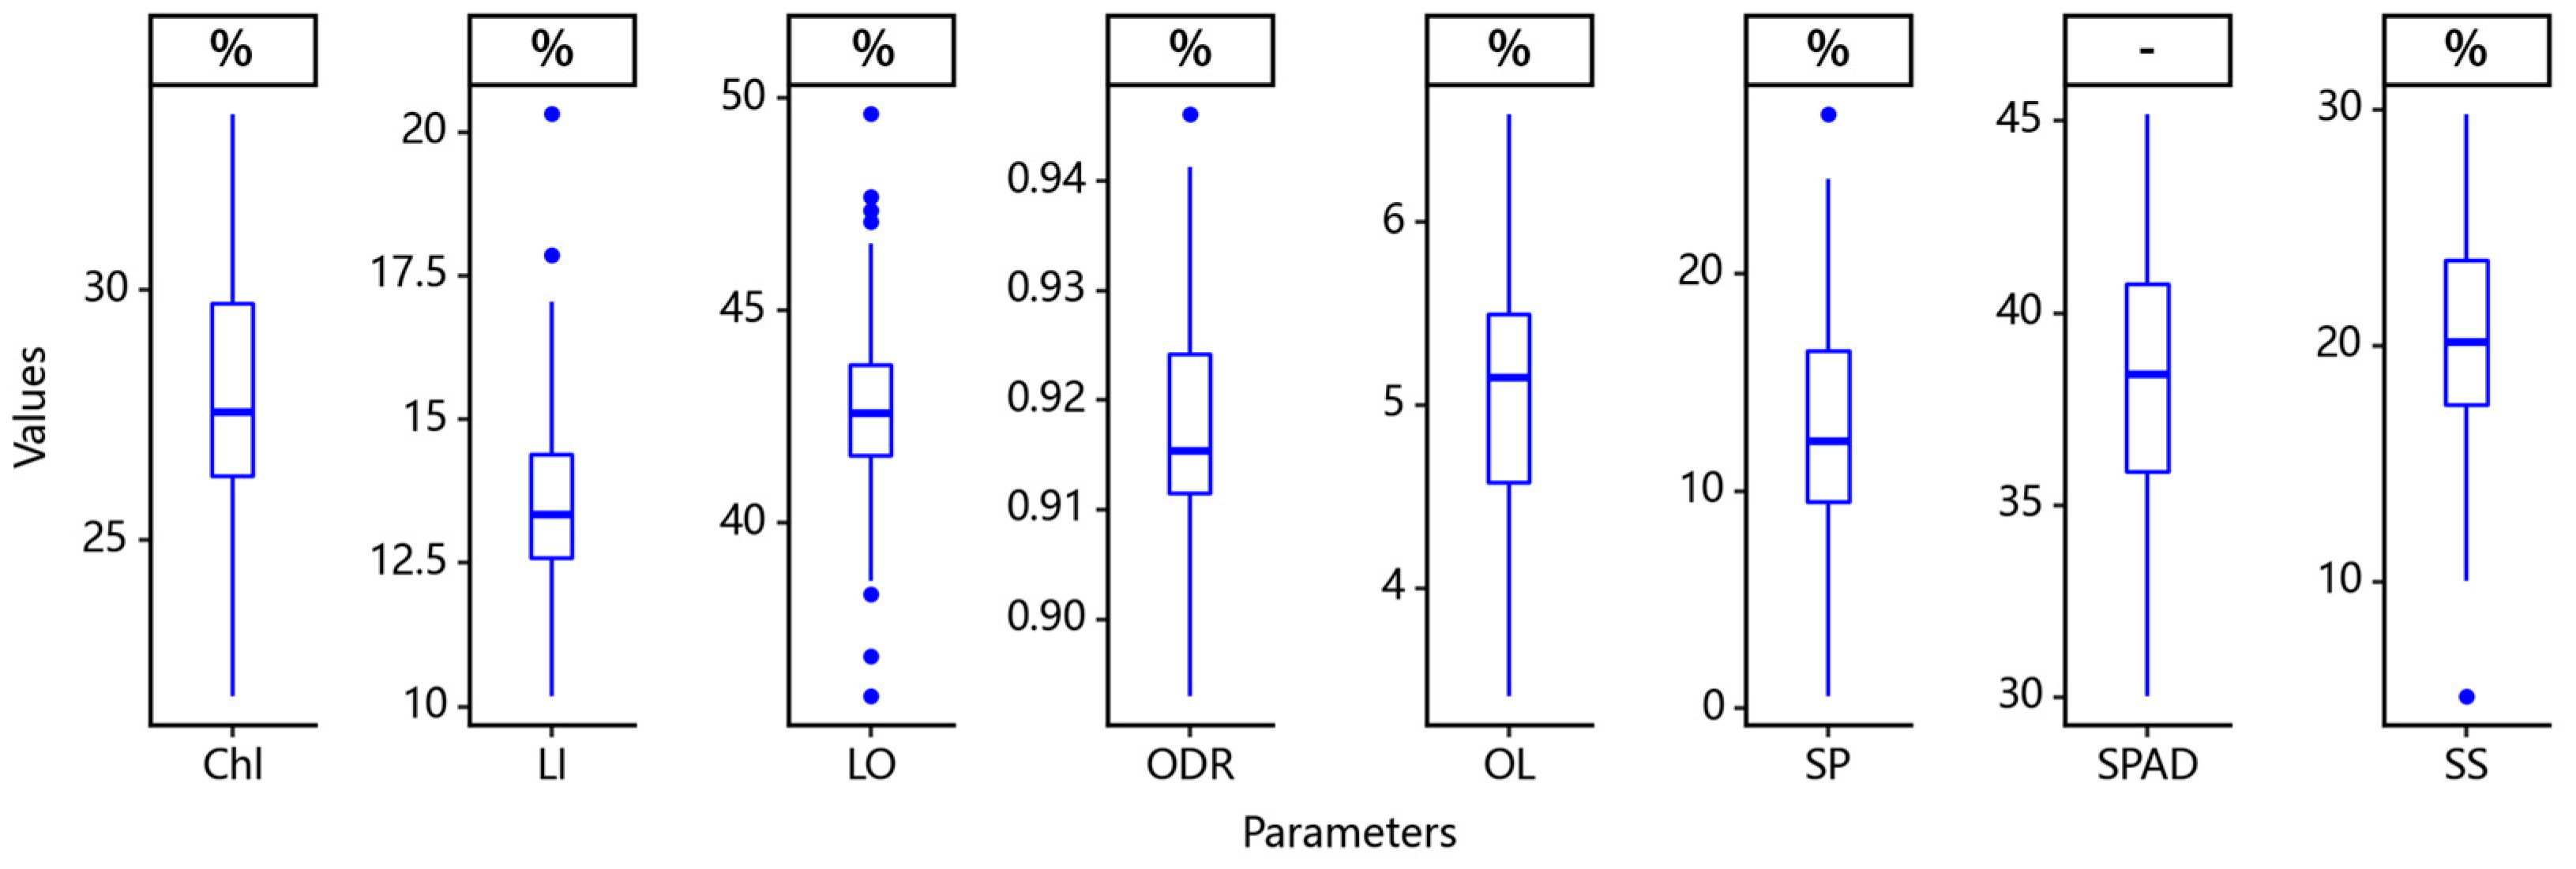
The leaf agronomic parameters of oilseed rape breeding material at the 5~6 leaf stage and oleic acid content in rapeseed after a mature harvest were statistically analysed, and the results are shown in Figure 2. As shown in Figure 2, except for ODR, the coefficient of variation of the other seven parameters was large, especially that of SP and SS, whose corresponding value ranges were 0.55~27.32 and 5.14~29.81, respectively. The values of fatty acids such as oleic acid, linoleic acid, and linolenic acid were 3.41–6.59, 10.18–20.31, and 35.91–49.63, respectively. The fatty acid contents of leaves were linolenic acid > linoleic acid > oleic acid at the 5~6 leaf stage. The distribution characteristics of the SPAD value and measured chlorophyll content were similar, indicating good consistency between them.
3.2. Reflectance Spectral Characteristics of Leaves of Materials with Different Oleic Acid Contents
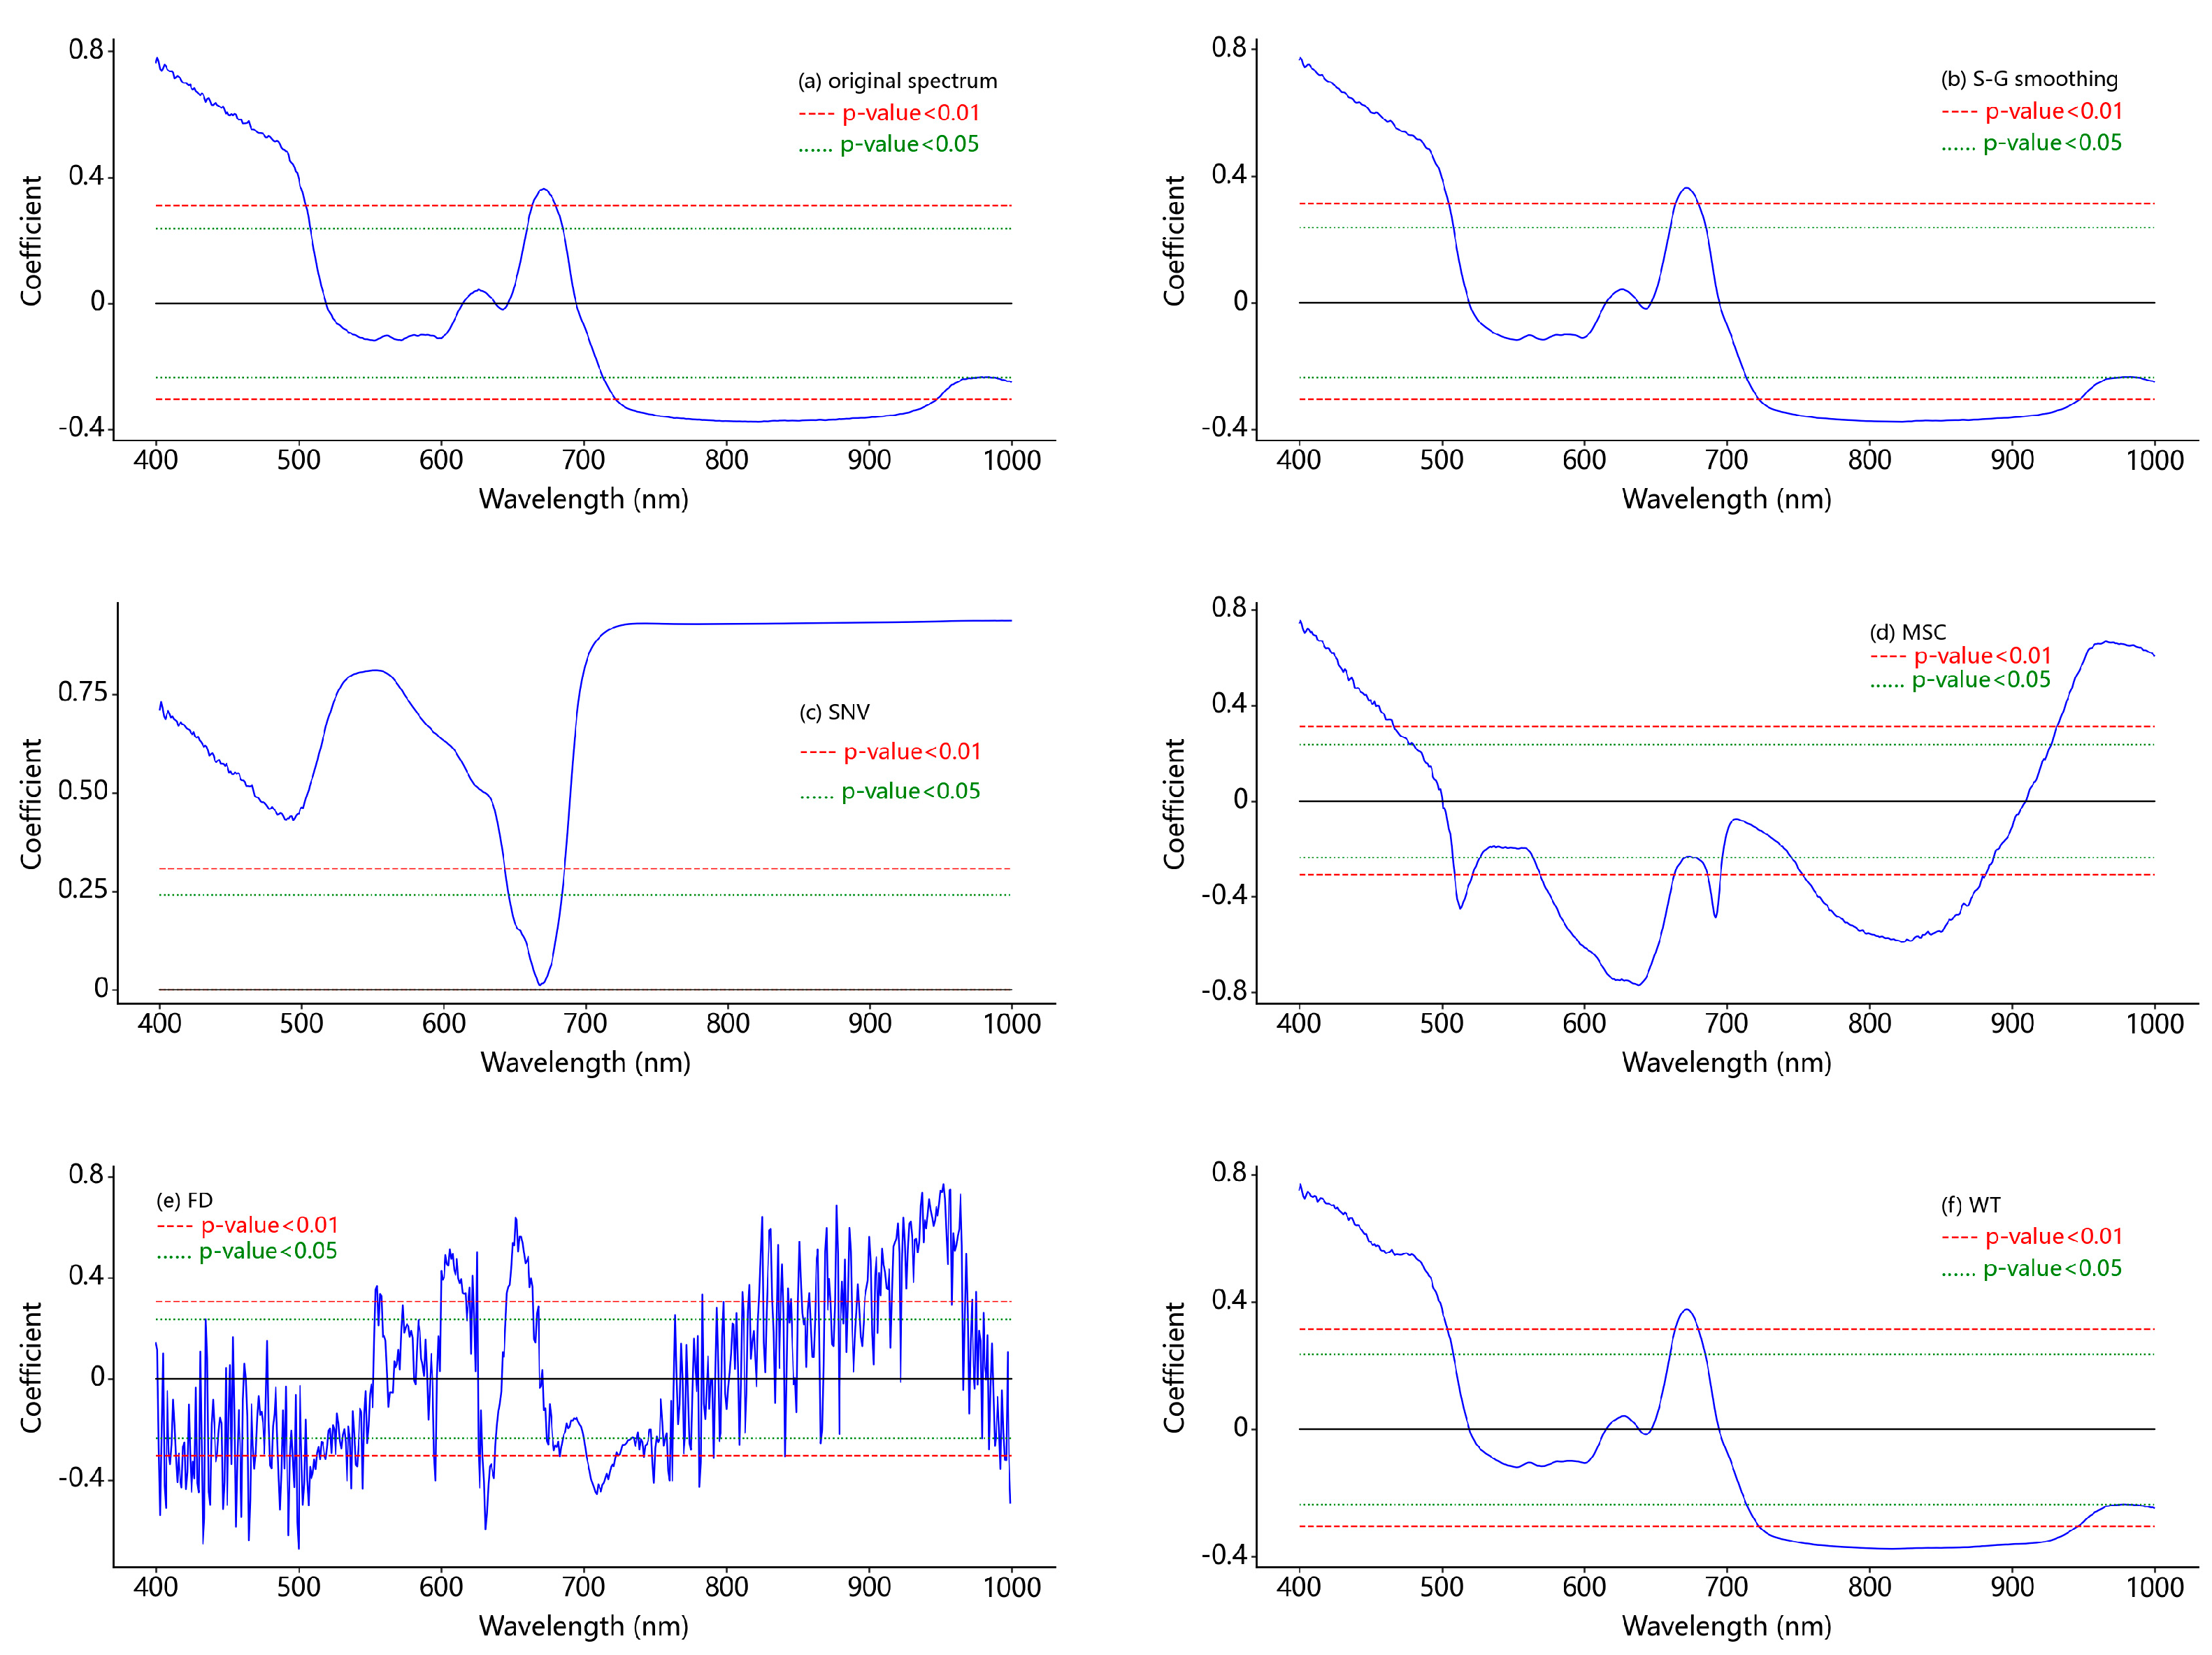
The original leaf spectral reflectance of 70 high oleic acid oilseed rape breeding materials at the 5~6 leaf stage and after different pretreatments were analysed, and the results are shown in Figure 3. Figure 3A shows that the spectral reflectance curve of oilseed rape leaves had typical spectral characteristics of green plants, that is, it presented obvious spectral characteristics such as a “blue valley”, “red valley”, “green peak”, “red edge steep slope”, and “near-infrared platform”. However, due to the difference in oleic acid content, the reflection intensity of oleic acid was different in certain spectral regions, such as the green band and near-infrared band, which laid a foundation for the prediction of oleic acid content using spectral characteristics. In this study, S−G smoothing, SNV, FD, and other methods were used to preprocess the original spectral data. As shown in Figure 3B,F, the changes before and after pretreatment were not obvious, which was basically consistent with the original spectral reflectance curve. As shown in Figure 3C,E, SNV and FD amplified the weak spectral information, making the spectral features more prominent. Figure 3D shows that the MSC weakened the spectral characteristics, and the spectral reflectance curves of leaves corresponding to breeding materials with different oleic acid contents after transformation were highly overlapping.
3.3. Correlation Analysis between Agronomic Parameters and Oleic Acid Content in Rapeseed
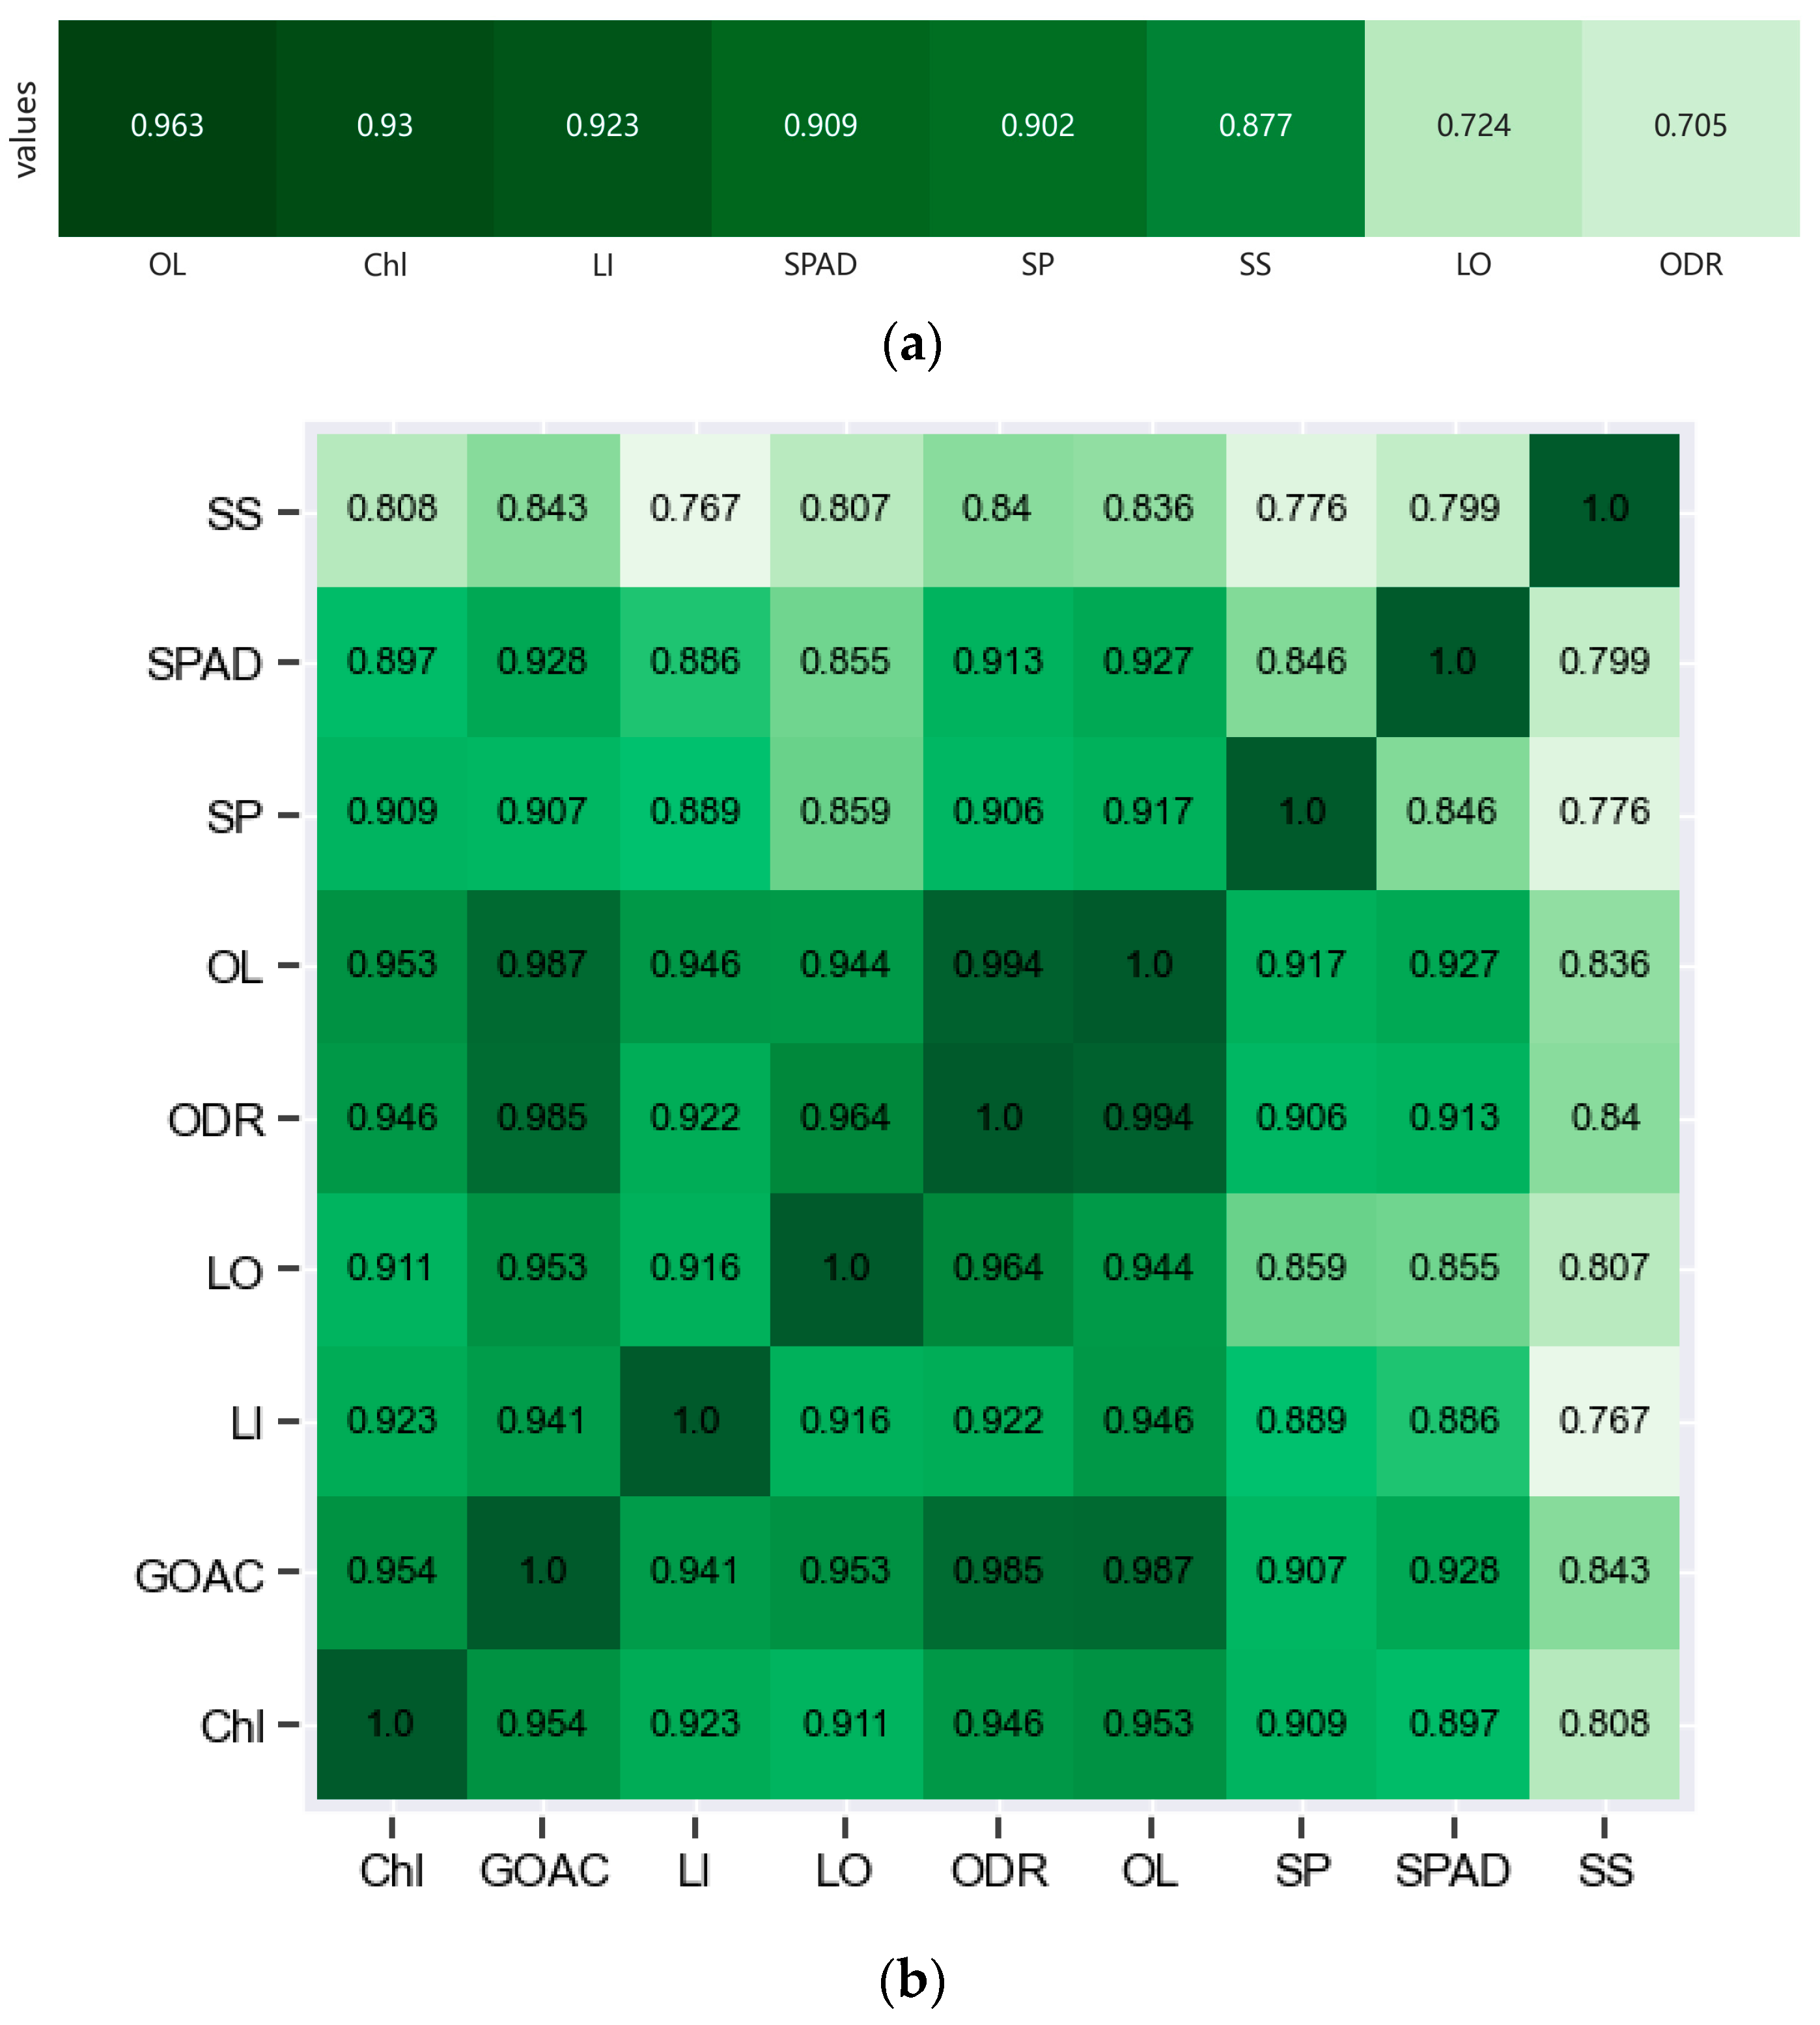
The eight agronomic parameters were subjected to a grey correlation analysis and Pearson correlation analysis (n = 70) with the oleic acid content in rapeseed, and the results are shown in Figure 4. From Figure 4a, the grey correlation coefficients of the eight agronomic parameters with the oleic acid content in rapeseed were in the range of 0.705–0.963, among which the correlation coefficients of five parameters, including OL, Chl, LI, the SPAD value, SP, and SS, were all greater than 0.8, indicating that these five parameters had a good correlation with the oleic acid content in rapeseed, especially the correlation between the oleic acid content in leaves and the oleic acid content in rapeseed, which was the highest, with a grey correlation coefficient of 0.963. As shown in Figure 4b, eight agronomic parameters also had a good correlation with the oleic acid content in rapeseed, with their correlation coefficients ranging from 0.843 to 0.987. The correlation coefficients between the eight agronomic parameters and the content of the oleic acid in rapeseed were as follows: OL > ORD > Chl > LO > LI > SPAD value > SP > SS. The correlation coefficient of the oleic acid content in leaves was the strongest, reaching 0.987. In conclusion, although the correlation coefficients between the two correlation analysis methods and the oleic acid content in rapeseed were slightly different, the correlation between the oleic acid content in leaves was the strongest. Therefore, the oleic acid content in leaves was selected as a sensitive agronomic parameter to predict the oleic acid content in rapeseed for subsequent analyses.
3.4. Correlation Analysis between Spectral Reflectance and Oleic Acid Content in Leaves
A Pearson correlation analysis (n = 70) was performed between the original spectral reflectance and the spectral reflectance obtained under different pretreatment methods and the oleic acid content in leaves, and the results are shown in Table 1. As shown in Figure 5, the region where p-values < 0.01 contains the most wavelengths in Figure 5c. Therefore, it encompasses lots of valuable spectral information. In Figure 5a,b,f, the three spectral reflectance curves were consistent with the curve of the correlation coefficient of the oleic acid content in rapeseed, showing a trend of “decreasing-rising-decreasing”. It also reflects a relatively small disparity in the spectral information content, and the region with p-values < 0.01 contains relatively fewer wavelengths.
In conclusion, implementing feature selection after spectral transformation was achieved through the analysis method of judging the p-value in the Pearson correlation analysis. Therefore, estimation models for the oleic acid content in leaves were constructed based on the spectral reflectance obtained after the change in SNV.
3.5. Construction and Verification of the Oleic Acid Content in Rapeseed Prediction Model Based on the Oleic Acid Content in Leaves
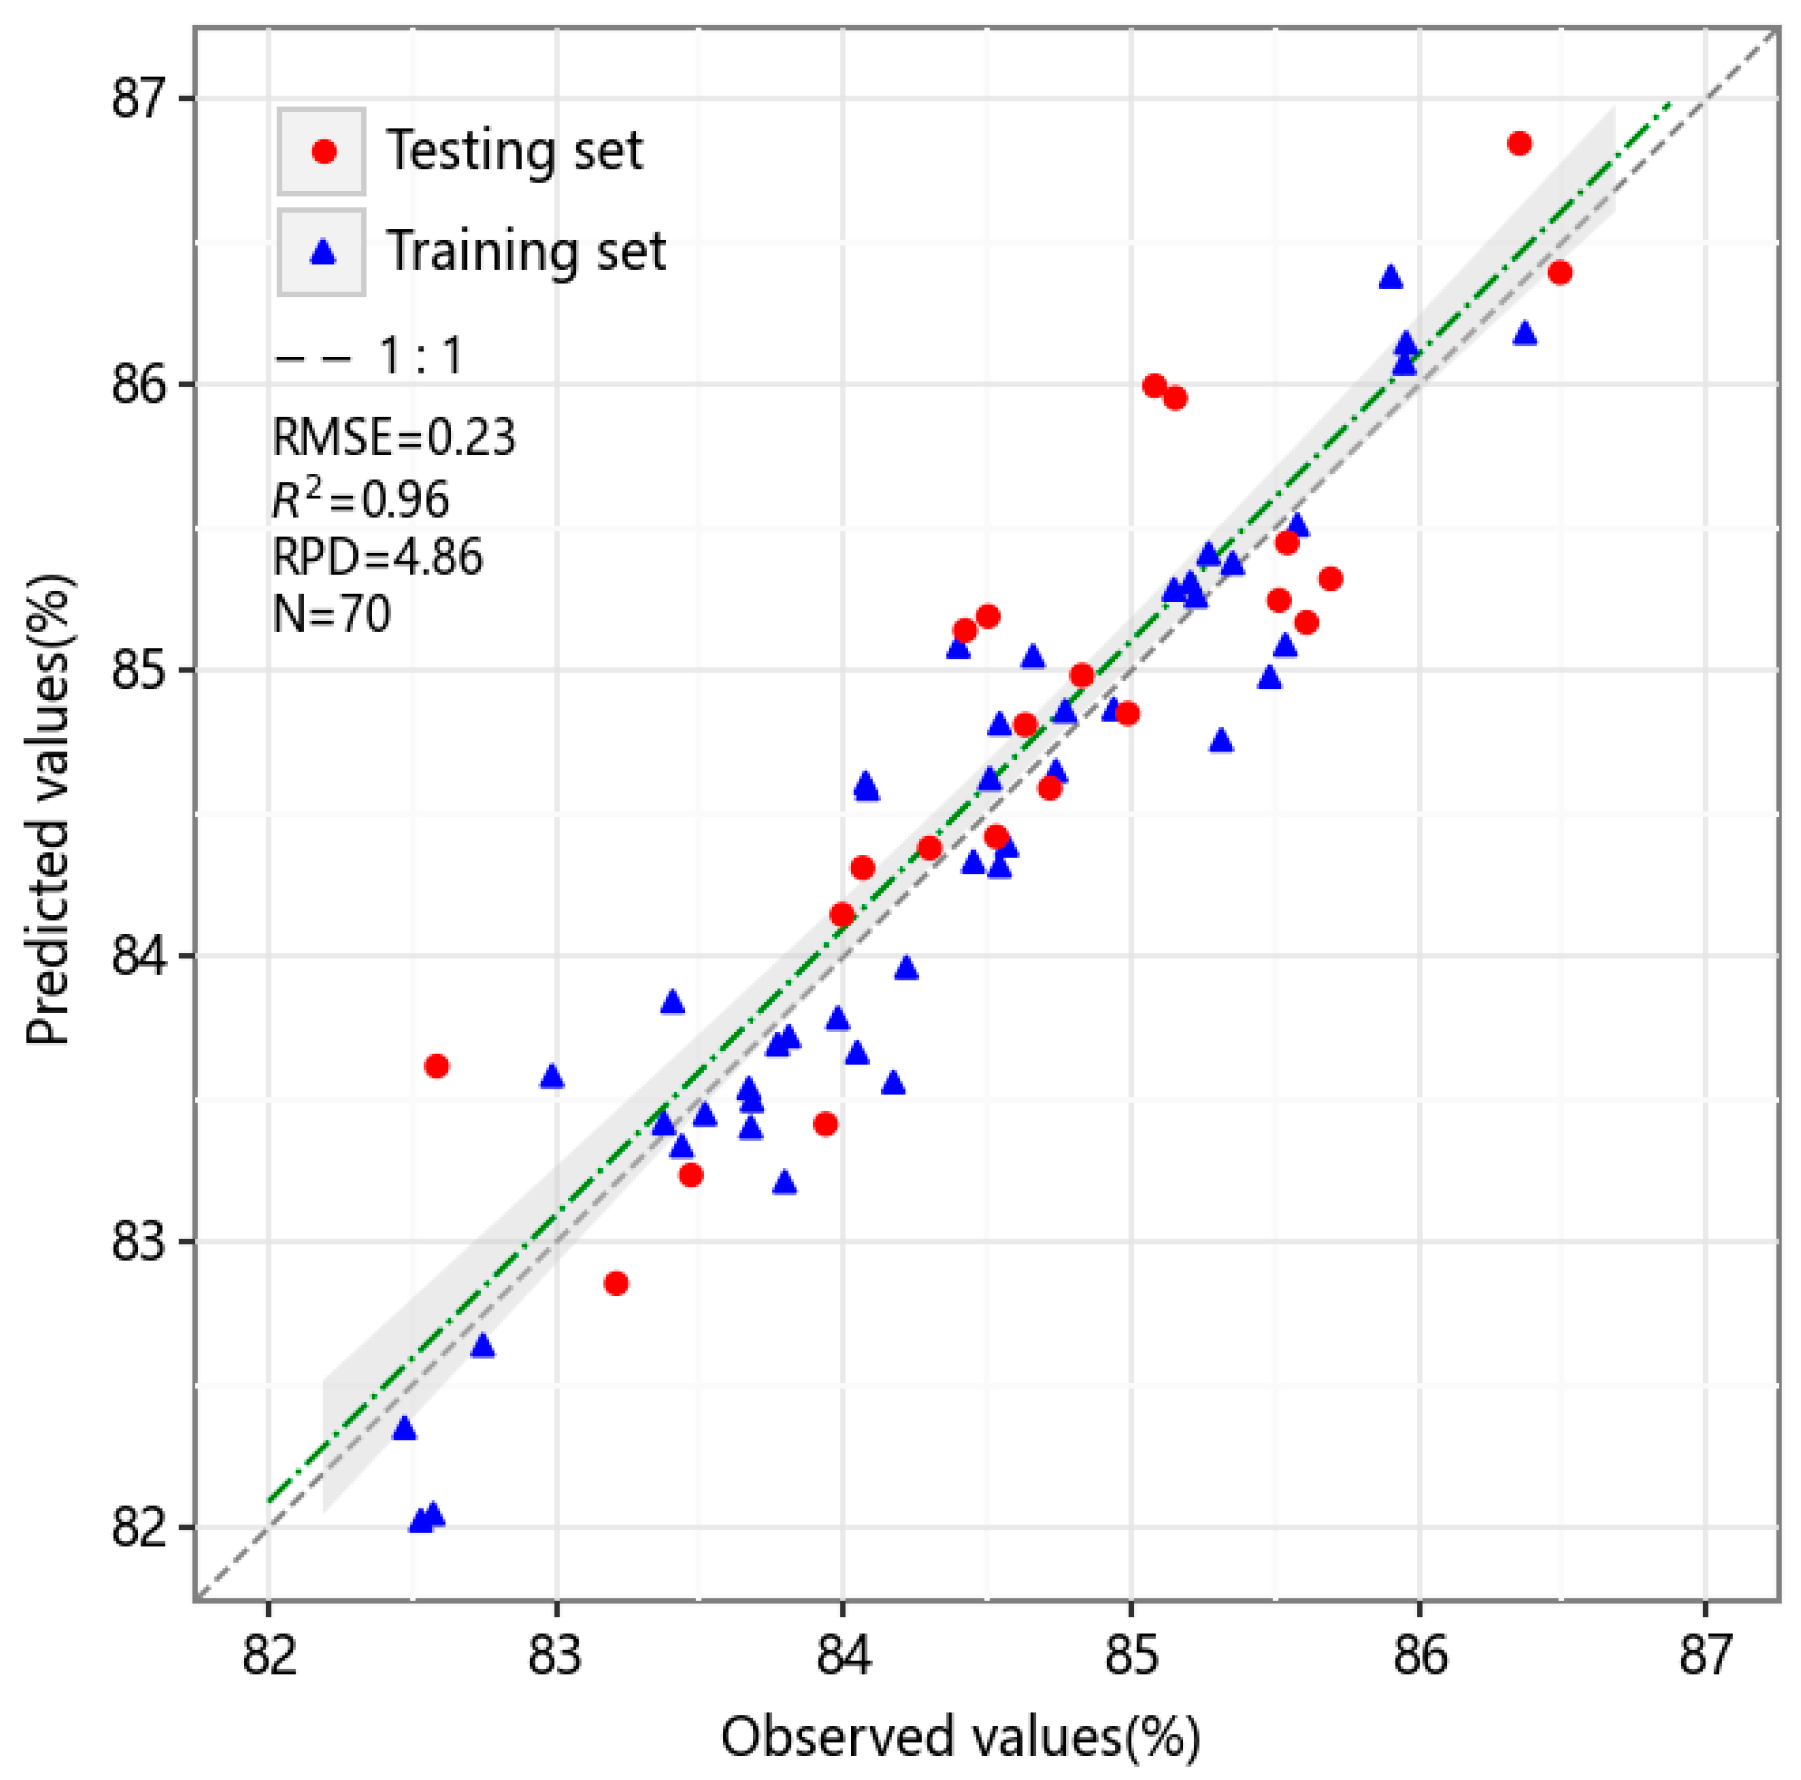
The random stratified sampling method was used to divide the oleic acid content in rapeseed into the training set and the testing set according to the ratio of 2:1. The results are shown in Table 2. As shown in Table 2, in the training set, the oleic acid content in rapeseed ranged from 80.94 to 87.52, with an average content of 84.38 ± 1.18. In the testing set, the content of oleic acid in rapeseed ranged from 82.02 to 86.61, and the average content was 84.70 ± 1.13. The oleic acid range of the testing set samples was within the oleic acid content of the training set samples, indicating that the test set samples can be used for the external verification of the model’s accuracy. The constructed prediction expression of the oleic acid content in rapeseed was y = 1.83x + 75.26 (y is the oleic acid content in rapeseed, and x is the oleic acid content in leaves). The training set’s R2, RMSE, and RPD were 0.98, 0.17%, and 7.05, respectively. External independent samples were used to verify the accuracy of the model, and the results are shown in Figure 6. As shown in Figure 6, the testing set’s R2, RMSE, and RPD are 0.96, 0.23%, and 4.86, respectively. The good fit between the observed and predicted values indicate that the model could achieve a better estimation of the kernel oleic acid content.
3.6. Construction and Verification of the Oleic Acid Content in the Leaf Estimation Model Based on Spectral Characteristic Bands
3.6.1. Sample Division
The SPXY algorithm was used to divide the training set (including the training set and the validation set) and the testing set, in which the ratio of the training set, the validation set, and the testing set was 2:1:1. The training set is employed to train the model using a 5-fold cross validation approach, and the validation set is used for tuning hyperparameters, while the testing set is solely utilized for evaluating the model. The sample division results of the oleic acid content in leaves are shown in Table 3. The oleic acid content in leaves in the training set ranged from 3.41 to 6.59, with an average content of 5.11 ± 0.72. In the testing set, the oleic acid content in leaves ranged from 4.43 to 5.72, and the average content was 4.98 ± 0.43. The oleic acid range of the testing set samples was within the oleic acid content of the training set samples, indicating that the testing set samples can be used for the external verification of the model’s accuracy. At the same time, the variation coefficients of the training set and verification set were 14.0 and 8.64, respectively, which were both large, indicating that different breeding materials with a high oleic acid content had a great effect on the oleic acid content of oilseed rape at the 5~6 leaf stage and were suitable for spectral estimation.
3.6.2. Independent Model
The 560 characteristic wavelengths that were significantly correlated with the oleic acid content in leaves obtained from the above analysis were used to construct the spectral estimation model of the oleic acid content in leaves. The MLR, RF, SVR, KNN, RR, and CatBoost regression algorithms were used to construct independent prediction models, and the results are shown in Figure 7 and Figure 8, and these hyperparameter settings in Table 4.
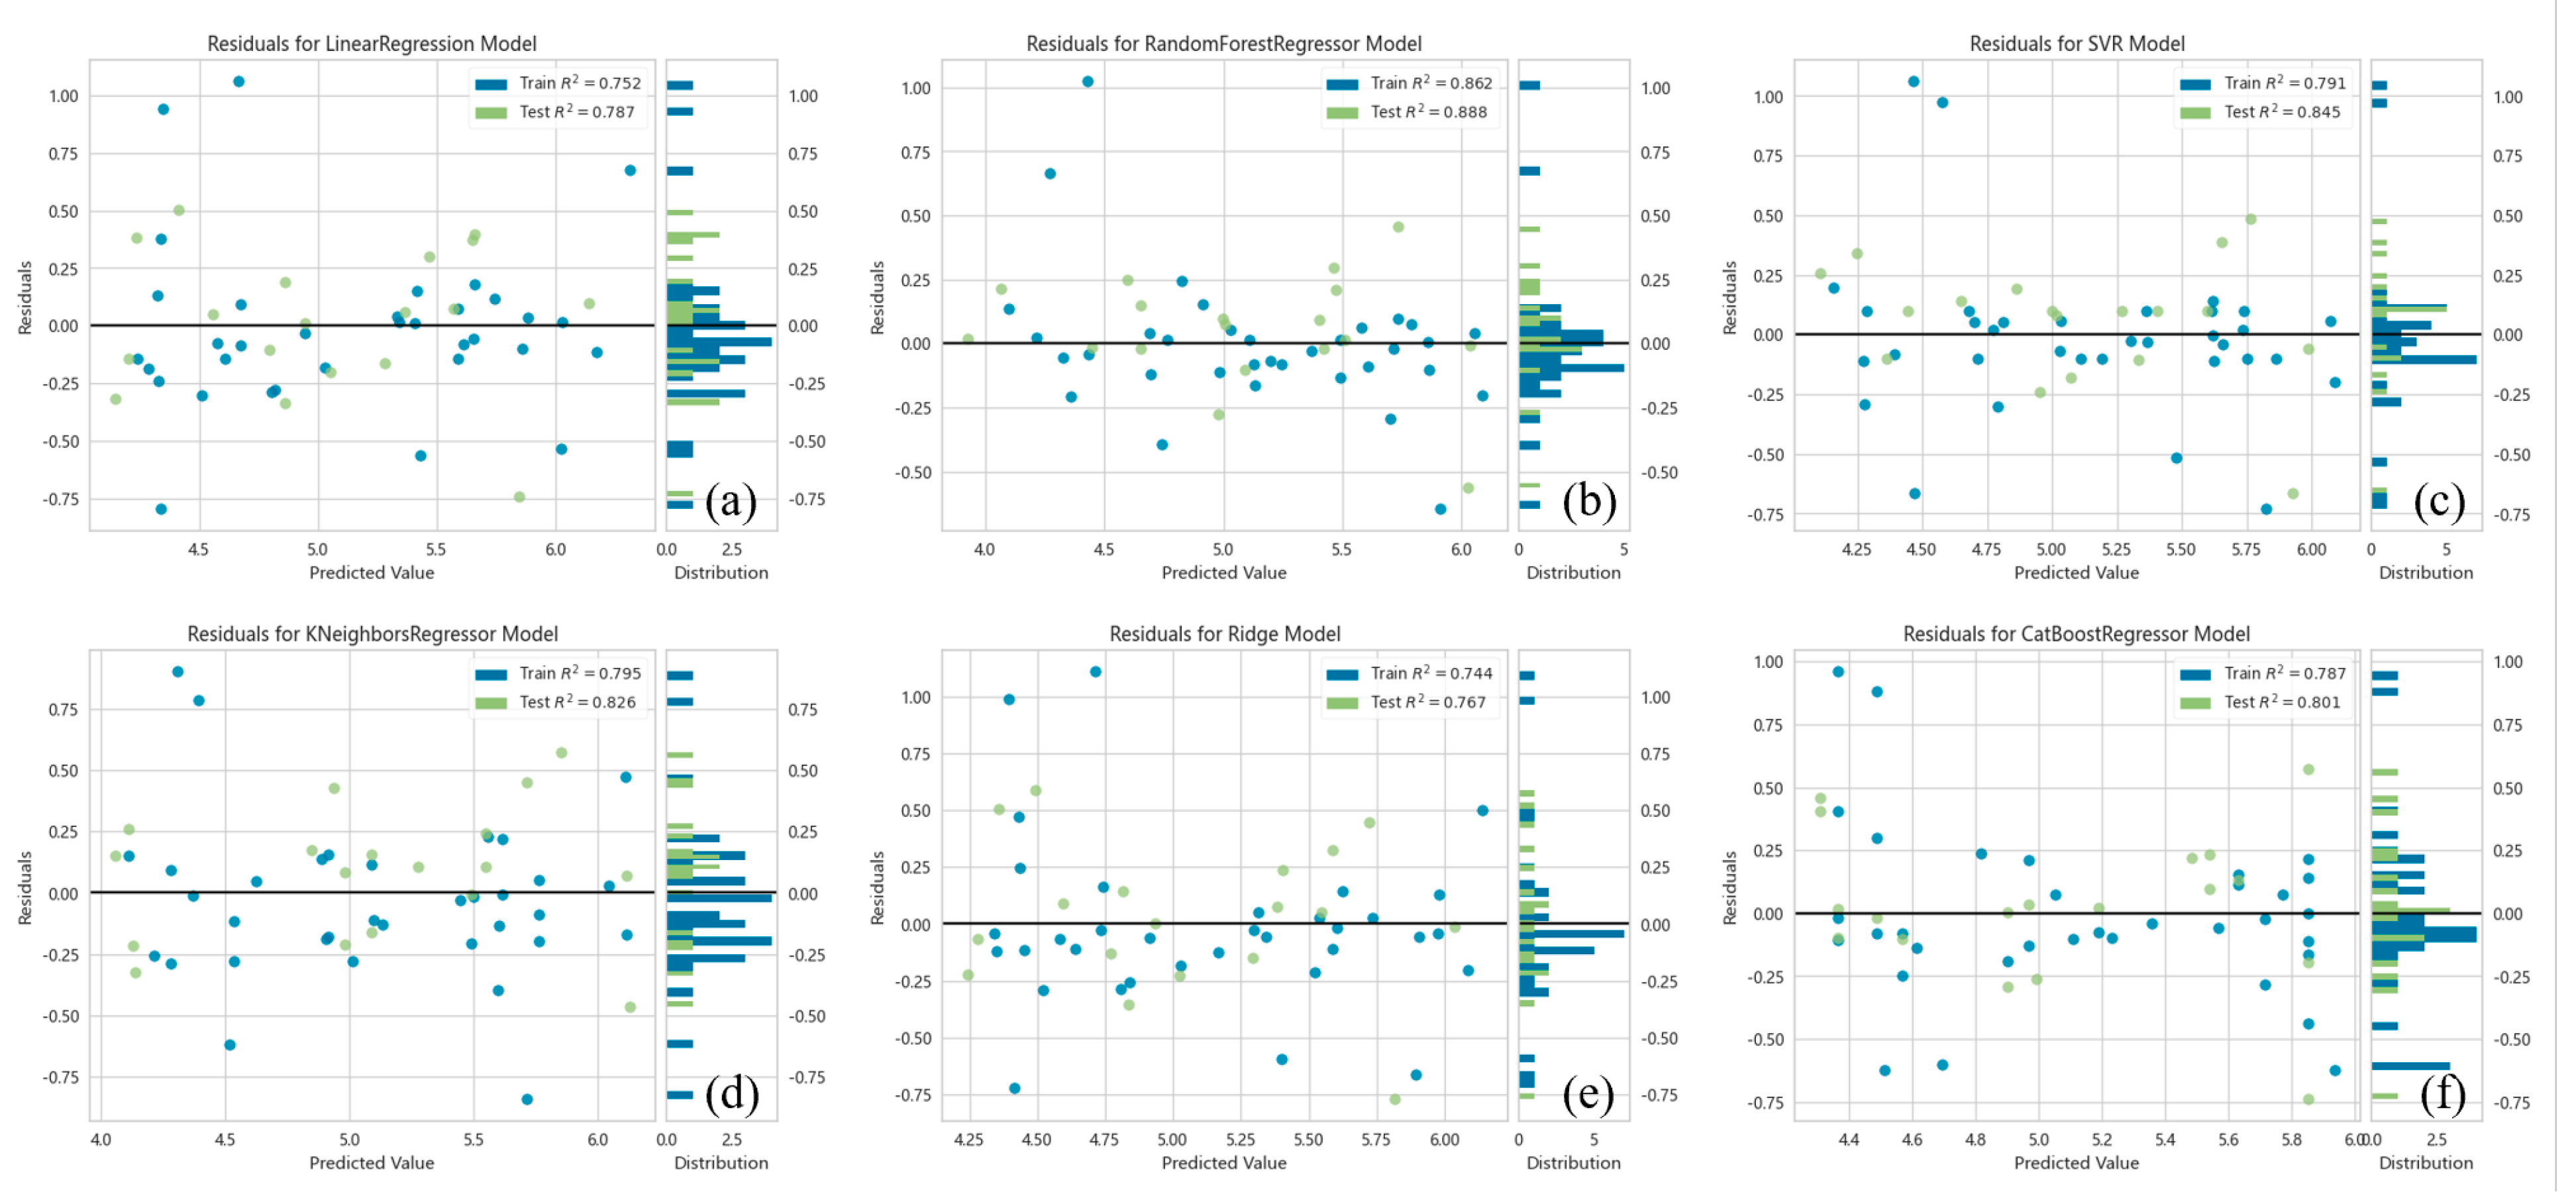
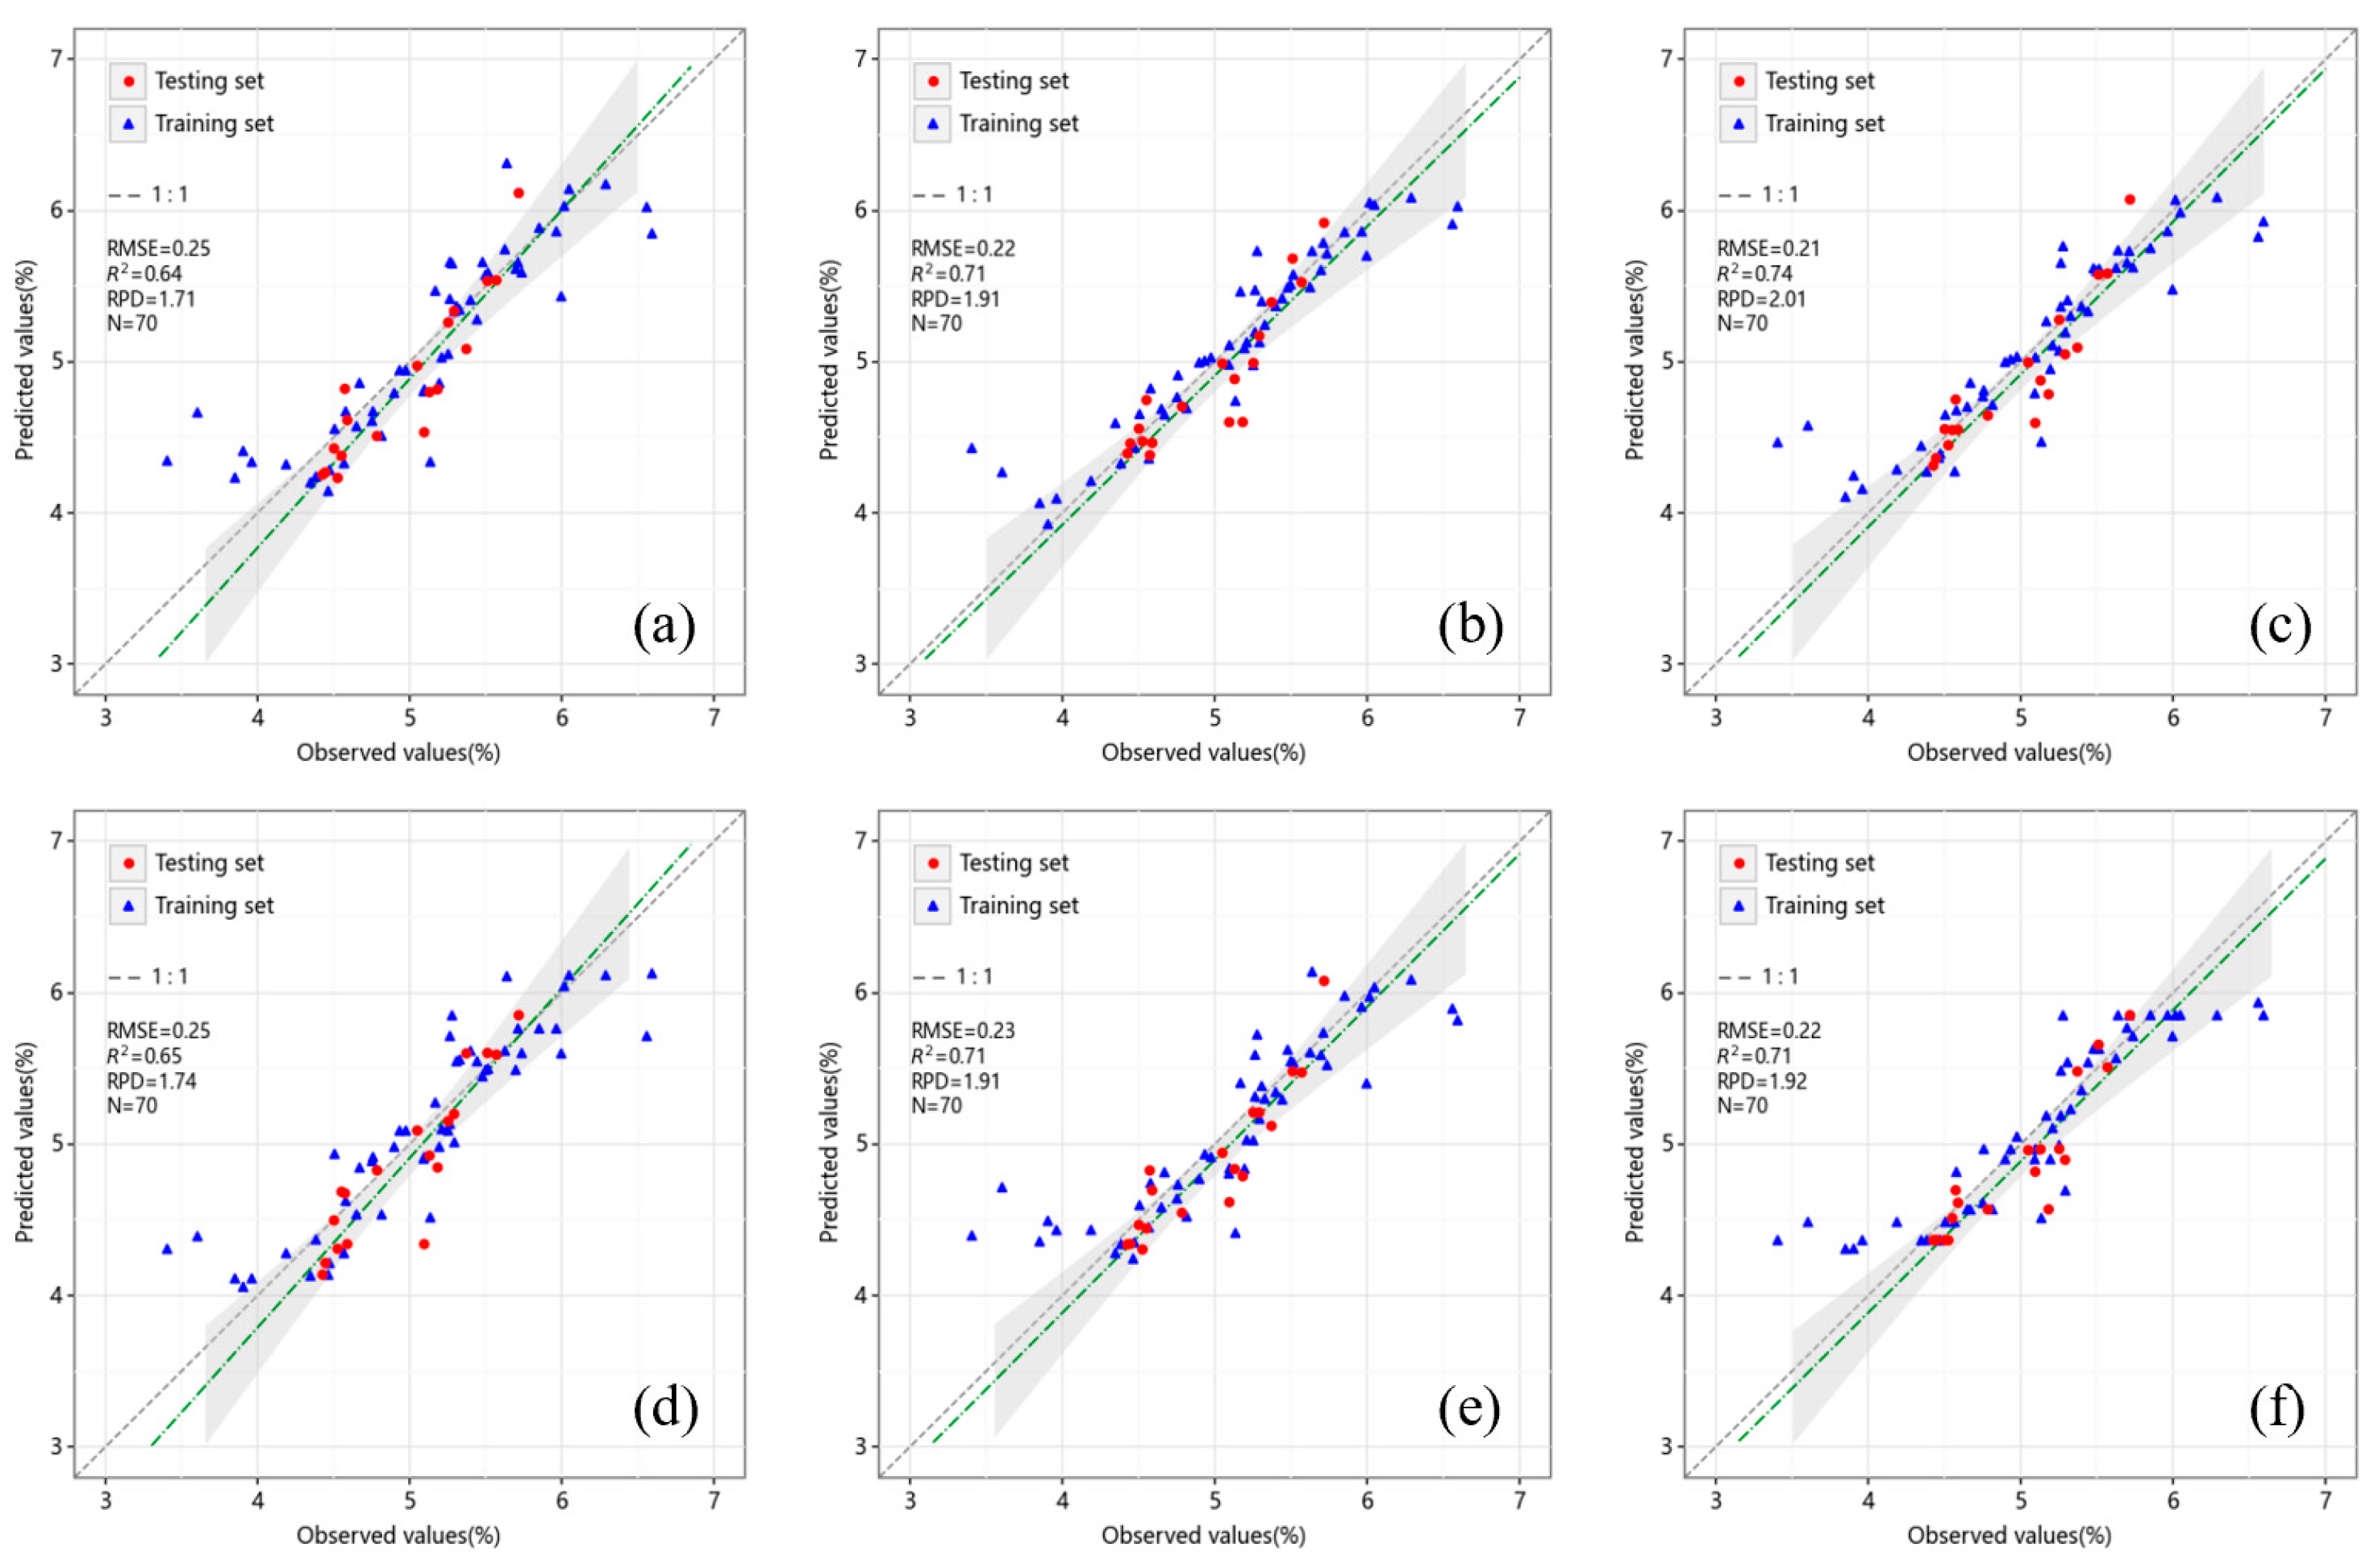
Figure 7 is the residual diagram of each model sample. The horizontal coordinate of each diagram is the model’s predicted value of the oleic acid content in leaves, and the vertical coordinate is the predicted error of the oleic acid content in leaves, namely, the residual. Since the residual diagram can intuitively grasp the error distribution of each sample, it can be used to evaluate the quality of the model. Except for the K-nearest neighbour regression model, the residuals of the other models were mostly randomly distributed near the centreline and were relatively concentrated. The R2 of each model training set was between 0.755 and 0.862, and the R2 of the internal cross-validation was between 0.767 and 0.888. Eighteen external independent samples were used to test the accuracy and stability of the model. The R2 of each model testing set was between 0.64 and 0.74, the RMSE was between 0.21% and 0.25%, and the RPD was between 1.71 and 2.01. The K-nearest neighbour model had the worst performance. Although its RPD was greater than 1.4, the R2 of the testing set was significantly lower than that of the training set and the verification set, indicating that the model was overfitted and was not suitable for the quantitative estimation of the oleic acid content in leaves. The SVR model showed the best performance, and its RPD was greater than 2.0, indicating that the model had an excellent predictive ability for the oleic acid content in leaves.
3.6.3. Blending Model
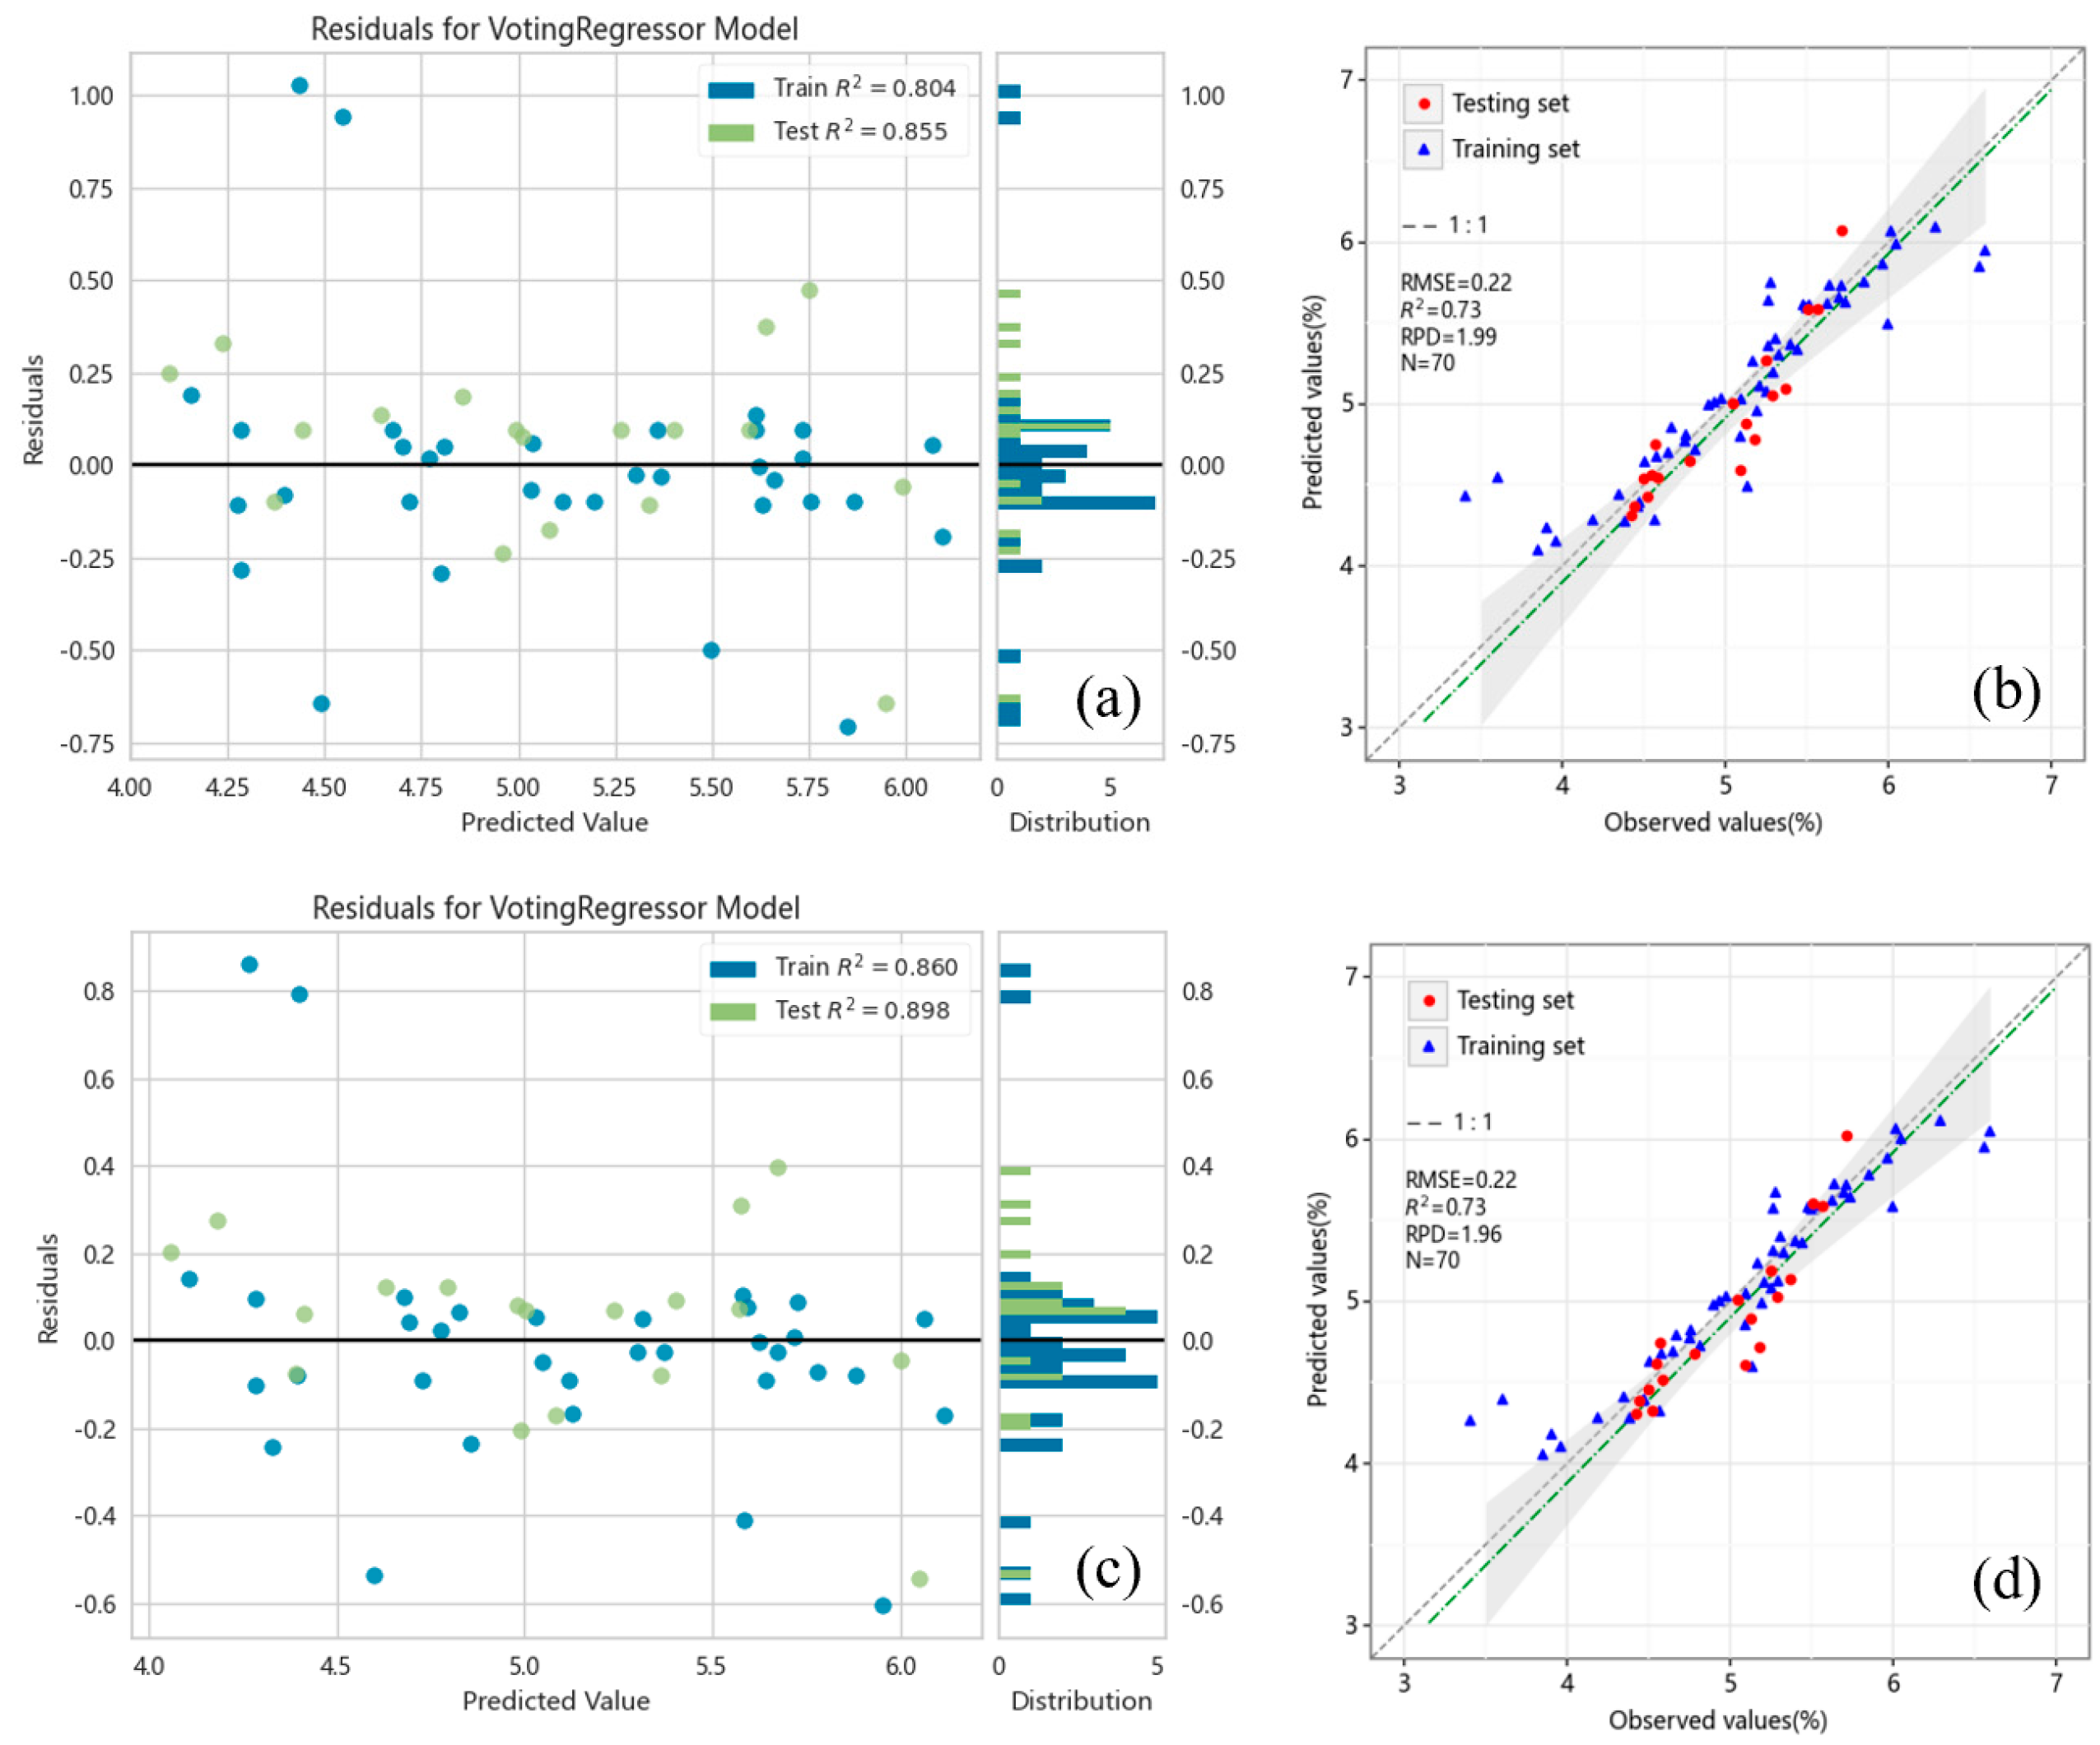
Through the analysis of the prediction effect of the above six independent models on the oleic acid content in leaves, it was found that the prediction effect of each independent model was as follows: SVR > CatBoost > RF > RR > KNN > MLR. Therefore, the top two and top three models were selected to construct the blended integrated learning model, and the results are shown in Figure 9. From Figure 9a,c, it can be seen that the training set’s R2 of the Blending Top 2 model was 0.804, and the internal cross-verification’s R2 was 0.855. The residual distribution of the Blending Top 2 model was relatively concentrated, being roughly distributed between −0.10 and 0.10. The training set’s R2 of the Blending Top 3 model was 0.860, the internal cross-validation’s R2 was 0.898, and the residual’s R2 was roughly distributed at approximately 0. This indicates that the predicted value of the oleic acid content in the leaves of the model was close to the measured value, and the prediction effect was good. To further evaluate the accuracy and robustness of the model, 18 external independent samples were used for external tests. As shown in Figure 9b,d, the testing set’s R2 and the RMSE of the two integrated models were both 0.73 and 0.22%, and the RPD was 1.99 and 1.96, respectively. Although the determination coefficients were decreased compared with the training set, the RPD value was still close to 2.0, indicating that both models can still achieve a better estimation of the oleic acid content in leaves.
3.7. Construction and Verification of the Prediction Model Based on “Spectral Characteristic Band—Leaf Oleic Acid Content—Oleic Acid Content in Rapeseed”
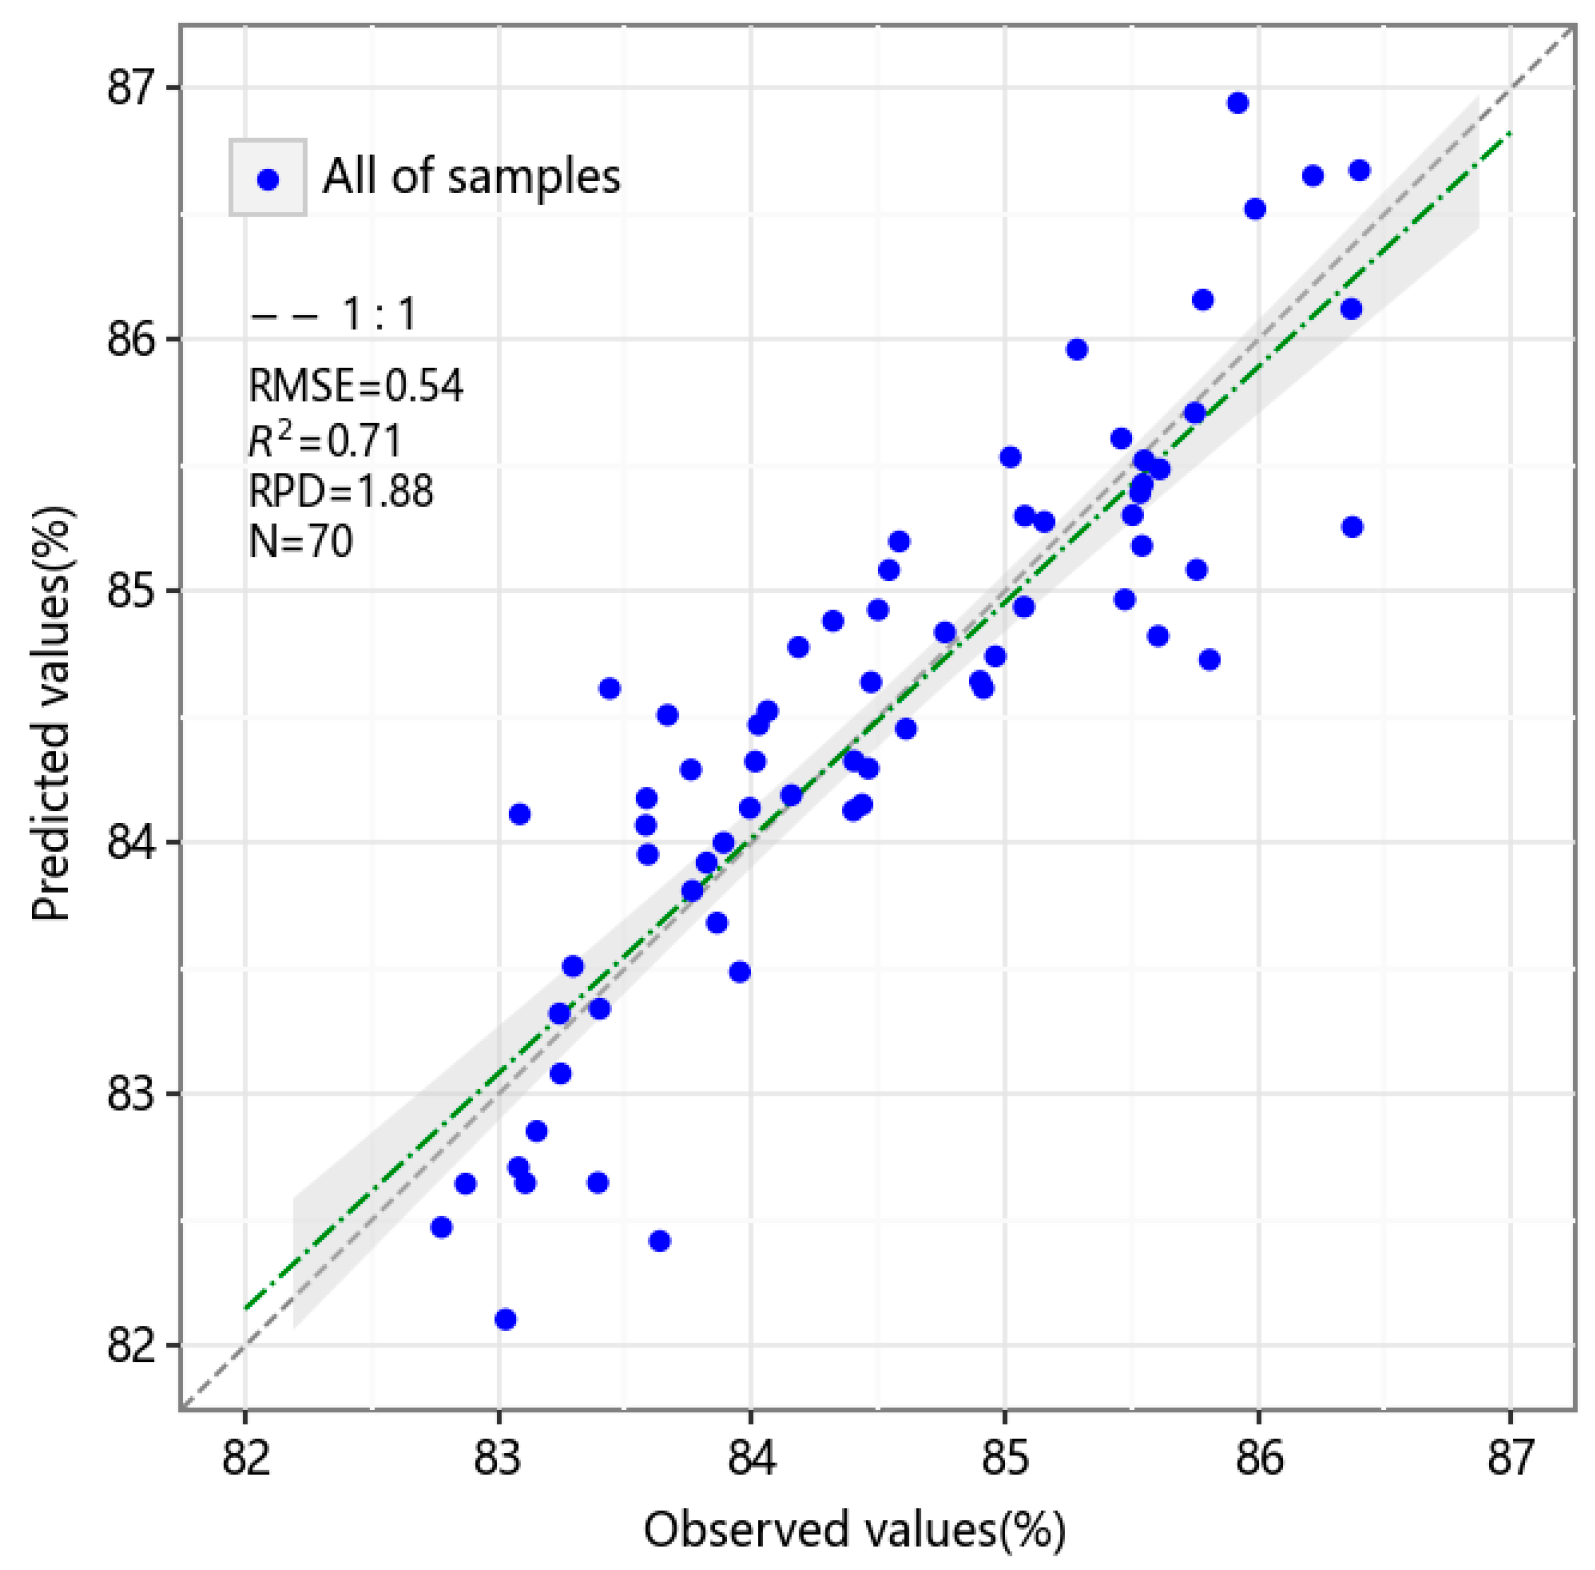
It can be seen from the above that the spectral estimation model of the oleic acid content in leaves treated with SNV−SVR has the highest accuracy. Therefore, according to the technical route of “spectral characteristic band—oleic acid content in leaves—oleic acid content in seeds”, the prediction model of the oleic acid content in seeds based on the hyperspectral characteristics of leaves at the 5~6 leaf stage of high oleic acid rapeseed was constructed with the oleic acid content in leaves as the intermediate variable. The output value of the spectral estimation model of the leaf oleic acid content was put into the prediction model of the seed oleic acid content based on the leaf oleic acid content as the input value, and the model’s prediction result based on “spectral characteristic band—leaf oleic acid content—seed oleic acid content” was finally obtained (Figure 10). As shown in Figure 10, the predicted R2 was 0.71, the RMSE was 0.54%, and the RPD was 1.88 (greater than 1.4). The measured values fit well with the predicted values, indicating that the seed oleic acid content transfer model constructed based on the spectral estimation of the leaf oleic acid content has a good prediction effect and can realize the quantitative estimation of the seed oleic acid content.
4. Discussion
4.1. Oleic Acid Content in Leaves Can Be Used as a Sensitive Parameter for Spectral Prediction of Oleic Acid Content in Rapeseed
In this study, the grey correlation analysis and Pearson correlation analysis were used to analyse the correlation between eight agronomic parameters and the oleic acid content in rapeseed. Both methods showed that the correlation between the oleic acid content in leaves and the oleic acid content in rapeseed was the highest. Therefore, the estimation model of the oleic acid content in leaves was further constructed based on the spectral characteristic band. It was concluded that the estimation model constructed by the SVR algorithm had the best effect, and the testing set’s R2 was 0.74, the RMSE was 0.21%, and the RPD was 2.01. Finally, with the oleic acid content in leaves as the link point, the spectral prediction transfer model of the oleic acid content in rapeseed was further constructed, and it was found that the prediction’s R2 was 0.71, the RMSE was 0.54%, and the RPD was 1.88, which could still achieve a good estimation of the oleic acid content in rapeseed. The content of the oleic acid in leaves can be used as a sensitive agronomic parameter for the prediction of the oleic acid spectra in rapeseed. This conclusion is similar to the research results of Schierholt et al. [17] and Gao et al. [18]; that is, in breeding, materials with a high oleic acid content in seeds can be predicted and screened by detecting the oleic acid content in vegetative organs. However, this study only discussed the effect of the most sensitive parameter as the intermediate variable in constructing the prediction model and did not consider the case in which multiple agronomic parameters were used to estimate the oleic acid content in rapeseed. Therefore, further research can be carried out in terms of increasing the number of agronomic parameters in modelling. In addition, LiDAR or synthetic aperture radar technology can be integrated to build a multisource heterogeneous fusion model to compensate for the failure to obtain spectral data due to continuous rain at the 5–6 leaf stage of rape in southern China.
4.2. Mechanism of Spectral Response of Leaves of Materials with Different Oleic Acid Contents
In this study, spectral reflectance data of the 5~6 leaf stage of 70 high oleic acid oilseed rape materials with different oleic acid contents, which, of the offspring induced by radiation, were obtained, and the spectral signals were enhanced by different spectral transformation forms. It was found that the spectral reflectance of materials with different oleic acid contents was significantly different in the green band and near-infrared band, indicating that the change in oleic acid content was the root cause of the spectral difference. Therefore, it may be inferred that a gene controlling oleic acid synthesis and accumulation is changed due to radiation mutagenesis, and then its spectral response is produced. According to Miller et al. [19] and Kinney and Knowlton et al. [20], fad2 gene mutation could reduce the content of linoleic acid and significantly increase the content of oleic acid. At the same time, because the dominant precursor of woody organisms is linoleic acid [21], the decrease in linoleic acid will lead to a decrease in woody organisms and then affect the structure of the outer layer of wax embedded in the keratinized chimera [22], resulting in a change in the light reflection on the surface and finally a change in spectral reflectance. However, only the possibility of the spectral response of oleic acid was analysed in this study, and no specific experiments were carried out to verify it. Therefore, the microscopic mechanism of the spectral response of the oleic acid in oilseed rape remains to be further explored.
4.3. The Effect of the Indirect Prediction Model Is Slightly Worse Than that of the Direct Estimation Model
In this study, a one-dimensional linear direct estimation model for the oleic acid content in rapeseed was constructed based on the oleic acid content in leaves. External independent samples were used to test the accuracy of the model, and it was found that the testing sets R2, RMSE, and RPD were 0.96, 0.23%, and 4.86, respectively, which had a good estimation effect. Then, with the oleic acid content in leaves as the intermediate variable, an indirect prediction model for the oleic acid content in rapeseed was constructed according to the technical route of “spectral characteristic band—oleic acid content in leaves—oleic acid content in rapeseed”, and the prediction’s R2 was 0.71, the RMSE was 0.54%, and the RPD was 1.88. The effect of the indirect prediction model is slightly worse than that of the direct estimation model. This may be due to error propagation in the model. Although the direct estimation model has high accuracy, it relies on a large number of manually measured samples, which has low efficiency, a high cost, and is harmful to crops. Although the accuracy of the indirect spectral prediction is reduced, it can still reach the accuracy of quantitative estimation, and hyperspectral technology can achieve fast, efficient, and non-destructive oleic acid content prediction, which is of great significance for assisting the rapid screening of the oleic acid traits of high-oleic-acid rape-breeding materials. Therefore, how to further improve the accuracy and robustness of the spectral prediction of oleic acid content should be the focus of future research.
5. Conclusions
In this study, the correlation between the oleic acid content in rapeseed and eight agronomic parameters, such as SS, SP, and Chl, was analysed by the grey correlation analysis and Pearson correlation analysis. It was concluded that the correlation between the oleic acid content in leaves and the oleic acid content in rapeseed was the highest, and this could be used as a sensitive agronomic parameter for the estimation of the oleic acid content in rapeseed. Then, a linear estimation model of the oleic acid content in rapeseed based on the oleic acid content in leaves was constructed, which was verified by external independent samples. The model’s R2, RMSE, and RPD were 0.96, 0.23%, and 4.86, respectively, which indicates a good estimation effect. On this basis, the estimation effect of different model algorithms on the oleic acid content in leaves was compared and analysed, and it was found that the SVR estimation model based on the feature band extracted after the SNV transformation had the best effect. Finally, with the oleic acid content in leaves as the intermediate variable, an indirect spectral prediction model of the oleic acid content in rapeseed was established, with an R2 of 0.71, an RMSE of 0.54%, and an RPD of 1.88, which could realize the spectral quantitative estimation of the oleic acid content in rapeseed. Overall, this study identified the oleic acid content in leaves as a sensitive agronomic parameter for the spectral prediction of the oleic acid content in rapeseed, verified by the feasibility of the indirect prediction idea of “spectral characteristic band—oleic acid content in leaves—oleic acid content in rapeseed” and enhanced by the agronomic interpretation of the spectral prediction of oleic acid content. This study primarily focused on the interpretability of utilizing spectral technology for the early screening of high-oleic-acid rapeseed-breeding materials. Consequently, varieties or materials with a low oleic acid content and a medium oleic acid content were not included in the scope of this study. Different planting regions, cultivation practices, environmental conditions, and varieties of rapeseed may exhibit significant variations. The broader applicability of methods for predicting rapeseeds’ oleic acid content could be explored by increasing the sample size, encompassing a wider range of diversity types, and assimilating multimodal data.
Author Contributions
Data curation, R.T.; funding acquisition, C.G.; investigation and validation, S.W.; soft, J.L.; writing—review and editing, J.L. and C.G. All authors have read and agreed to the published version of the manuscript.
Funding
China Agriculture Research System of MOF and MARA (CARS-13).
Data Availability Statement
Not applicable.
Conflicts of Interest
The authors declare no conflict of interest.
References
- Zhang, J.; Xu, B.; Feng, H.K.; Jing, X.; Wang, J.J.; Ming, S.K.; Fu, Y.Q.; Song, X.Y. Monitoring nitrogen nutrition and grain protein content of rice based on ensemble learning. Spectrosc. Spectr. Anal. 2022, 42, 1956–1964. [Google Scholar] [CrossRef]
- Sun, J.F.; Wang, G.X.; Zhang, H.; Xia, L.M.; Zhao, W.P.; Guo, Y.M.; Sun, X. Detection of fat content in peanut kernels based on chemometrics and hyperspectral imaging technology. Infrared Phys. Technol. 2020, 105, 103226. [Google Scholar] [CrossRef]
- Li, S.M.; Wang, N.M.; Zhang, M.; Liu, C.; Wang, R. Establishment of near infrared analytic model for major fatty acids content of Brassica napus L. Guangdong Agric. Sci. 2014, 41, 16–21. [Google Scholar] [CrossRef]
- Wu, J.G.; Shi, C.H.; Zhang, H.Z. Study on developing calibration models of fat acid composition in intact rapeseed by near infrared reflectance spectroscopy. Spectrosc. Spectr. Anal. 2006, 26, 259–262. [Google Scholar] [CrossRef]
- Gao, J.Q.; Zhang, J.F.; Pu, H.M.; Qi, C.K.; Fu, S.Z. Analysis of oil, oleic acid and erucic acid contents in rapeseed by near infrared reflectance spectroscopy (NIRS). Jiangsu J. Agric. Sci. 2007, 23, 189–195. [Google Scholar] [CrossRef]
- Velasco, L.; Möllers, C.; Becker, H.C. Estimation of seed weight, oil content and fatty acid composition in intact single seeds of rapeseed (Brassica napus L.) by near-infrared reflectance spectroscopy. Euphytica 1999, 106, 79–85. [Google Scholar] [CrossRef]
- Li, J.G.; Xue, X.M.; Zhang, Z.H.; Wang, Z.H.; Yan, L.Y.; Chen, Y.N.; Wang, L.Y.; Kang, Y.P.; Huai, D.X.; Jiang, H.F.; et al. Establishment and applicant of near-infrared reflectance spectroscopy models for predicting main fatty acid contents of single seed in peanut. Acta Agron. Sin. 2019, 45, 1891–1898. [Google Scholar]
- Cantarelli, M.A.; Funes, I.G.; Marchevsky, E.J.; Camiña, J.M. Determination of oleic acid in sunflower seeds by infrared spectroscopy and multivariate calibration method. Talanta 2009, 80, 489–492. [Google Scholar] [CrossRef]
- Jiang, P.; Luo, Y.H.; Hu, W.W.; Liao, D.J. Research on optimal predicting model for the detection of internal quality by hyperspectral technology. J. Agric. Mech. Res. 2015, 37, 56–60. [Google Scholar] [CrossRef]
- Weinstock, B.A.; Janni, J.; Hagen, L.; Wright, S. Prediction of oil and oleic acid concentrations in individual corn (Zea mays L.) kernels using near-infrared reflectance hyperspectral imaging and multivariate analysis. Appl. Spectrosc. 2006, 60, 9–16. [Google Scholar] [CrossRef]
- Parsaeiana, M.; Shahabib, M.; Hassanpourc, H. The integration of image processing and artificial neural network to estimate four fatty acid contents of sesame oil. LWT 2020, 129, 109476. [Google Scholar] [CrossRef]
- Jin, Y.H.; Shi, N.; Wen, S.Y.; Chen, C.Y.; Lu, J.W.; Gao, Z.Q. Building hyperspectral model of oleic acid content in rapeseed of vegetable and oil type Brassica napus. J. South Agric. 2021, 52, 1674–1682. [Google Scholar] [CrossRef]
- Wang, Z.J.; Wang, J.H.; Liu, L.Y.; Huang, W.J.; Zhao, C.J.; Wang, C.Z. Prediction of grain protein content in winter wheat (Triticum aestivum L.) using plant pigment ratio (PPR). Field Crop. Res. 2004, 90, 311–321. [Google Scholar] [CrossRef]
- Xue, L.H.; Cao, W.X.; Yang, L.Z. Predicting grain yield and protein content in winter wheat at different N supply levels using canopy reflectance spectra. Pedosphere 2007, 17, 646–653. [Google Scholar] [CrossRef]
- Wang, Z.; Huang, W.J.; Yang, K.M.; Tian, L.; Cui, L.; Yang, G.J.; Li, H.L. Estimation of leaf nitrogen and grain protein content by hyperspectral vegetation index in winter wheat. Sens. Lett. 2013, 11, 1115–1120. [Google Scholar] [CrossRef]
- Huang, W.J.; Wang, J.H.; Liu, L.Y.; Wang, Z.J.; Tan, C.W.; Song, X.Y.; Wang, J.D. Study on grain quality forecasting method and indicators by using hyperspectral data in wheat. Proc. SPIE 2005, 5655, 291–300. [Google Scholar] [CrossRef]
- Schierholt, A.; Becker, H.C. Influence of Oleic Acid Content on Yield in Winter Oilseed Rape. Crop Sci. 2011, 51, 1973–1979. [Google Scholar] [CrossRef]
- Gao, J.Q.; Pu, H.M.; Long, W.H.; Hu, M.L.; Qi, C.K. Dynamics of oleic acid contents in organs of high-oleic rapeseed lines. Chin. J. Oil Crop Sci. 2012, 34, 359–365. [Google Scholar]
- Miller, J.F.; Zimmerman, D.C.; Vick, B.A. Genetic Control of High Oleic Acid Content in Sunflower Oil1. Crop Sci. 1987, 27, 923–926. [Google Scholar] [CrossRef]
- Kinney, A.J.; Knowlton, S. Designer Oils: The High Oleic Acid Soybean. Genetic Modification in the Food Industry. In Genetic Modification in the Food Industry; Roller, S., Harlander, S., Eds.; Blackie: London, UK, 1998; pp. 193–213. [Google Scholar] [CrossRef]
- Villena, J.F.; Domínguez, E.; Stewart, D.; Heredia, A. Characterization and Biosynthesis of Non-Degradable Polymers in Plant Cuticles. Planta. 1999, 208, 181–187. Available online: http://www.jstor.org/stable/23385547 (accessed on 9 May 2023). [CrossRef]
- Wang, J.Q.; Chen, W.; Zeng, L.Q.; He, J.M.; Dong, Y.S.; Cun, S.X.; Li, G.Z. Effects of Δ12-Fatty Acid Desaturase Gene (fad2) Mutation on Epidermal Construct and Permeability of Brassica napus Leaf. J. Plant Physiol. Mol. Biol. 2003, 3, 192–198. [Google Scholar] [CrossRef]
Figure 1.
A map of the technical flowchart. chlorophyll content (Chl), linoleic acid (LI), linolenic acid (LO), oleic acid desaturation rate (ODR), oleic acid (OL), soluble protein content (SP), SPAD value (SPAD) and sugar content (SS).
Figure 1.
A map of the technical flowchart. chlorophyll content (Chl), linoleic acid (LI), linolenic acid (LO), oleic acid desaturation rate (ODR), oleic acid (OL), soluble protein content (SP), SPAD value (SPAD) and sugar content (SS).

Figure 2.
Boxplot of agronomic parameters for the samples. Chlorophyll (Chl), linoleic acid (LI), linolenic acid (LO), oleic acid desaturation rate (ODR), oleic acid (OL), soluble protein (SP), SPAD value (SPAD), and soluble sugar (SS).
Figure 2.
Boxplot of agronomic parameters for the samples. Chlorophyll (Chl), linoleic acid (LI), linolenic acid (LO), oleic acid desaturation rate (ODR), oleic acid (OL), soluble protein (SP), SPAD value (SPAD), and soluble sugar (SS).

Figure 3.
Spectral reflectance curves of leaves in different spectral transforms from 70 experimental materials: (A) original spectrum; (B) S−G smoothing; (C) SNV; (D) MSC; (E) FD; (F) WT.
Figure 3.
Spectral reflectance curves of leaves in different spectral transforms from 70 experimental materials: (A) original spectrum; (B) S−G smoothing; (C) SNV; (D) MSC; (E) FD; (F) WT.

Figure 4.
Correlation analysis of agronomic parameters in leaves with oleic acid content in rapeseed: (a) grey correlation coefficient; (b) correlation coefficient. chlorophyll content (Chl), linoleic acid (LI), linolenic acid (LO), oleic acid desaturation rate (ODR), oleic acid (OL), soluble protein content (SP), relative chlorophyll content (SPAD), sugar content (SS) and grain oleic acid content (GOAC). The deeper the green, the stronger the correlation.

Figure 5.
Correlation coefficients of spectral reflectance and oleic acid content in leaves under different pretreatment methods: (a) original spectrum; (b) S−G smoothing; (c) SNV; (d) MSC; (e) FD; (f) WT.
Figure 5.
Correlation coefficients of spectral reflectance and oleic acid content in leaves under different pretreatment methods: (a) original spectrum; (b) S−G smoothing; (c) SNV; (d) MSC; (e) FD; (f) WT.

Figure 6.
A 1:1 relationship between measured and predicted values of oleic acid content in rapeseed.
Figure 6.
A 1:1 relationship between measured and predicted values of oleic acid content in rapeseed.

Figure 7.
Residuals in different training models for the prediction of oleic acid content of leaves from experimental materials: (a) MLR; (b) RF; (c) SVR; (d) KNN; (e) RR; (f) CatBoost.
Figure 7.
Residuals in different training models for the prediction of oleic acid content of leaves from experimental materials: (a) MLR; (b) RF; (c) SVR; (d) KNN; (e) RR; (f) CatBoost.

Figure 8.
Prediction errors in different models for the testing set of oleic acid content of leaves from 70 experimental materials: (a) MLR; (b) RF; (c) SVR; (d) KNN; (e) RR; (f) CatBoost.
Figure 8.
Prediction errors in different models for the testing set of oleic acid content of leaves from 70 experimental materials: (a) MLR; (b) RF; (c) SVR; (d) KNN; (e) RR; (f) CatBoost.

Figure 9.
Estimation and validation results of leaf oleic acid content based on the Blending Top 2 and Top 3: (a,c) residuals; (b,d) testing set prediction error.
Figure 9.
Estimation and validation results of leaf oleic acid content based on the Blending Top 2 and Top 3: (a,c) residuals; (b,d) testing set prediction error.

Figure 10.
A 1:1 relationship between measured and predicted oleic acid content in rapeseed based on the spectral prediction of oleic acid content in leaves.
Figure 10.
A 1:1 relationship between measured and predicted oleic acid content in rapeseed based on the spectral prediction of oleic acid content in leaves.


Table 1.
The Pearson correlation analysis results between pretreatment of spectral reflectance and oleic acid content in leaves.
Table 1.
The Pearson correlation analysis results between pretreatment of spectral reflectance and oleic acid content in leaves.
| Data Set | rmax | Wavelength of rmax | rmin | Wavelength of rmin | Number of Wavelength with p-Value < 0.05 | Number of Wavelength with p-Value < 0.01 |
|---|---|---|---|---|---|---|
| Original spectrum | 0.78 | 401 nm | −0.38 | 822 nm | 67 | 348 |
| SG | 0.78 | 401 nm | −0.38 | 823 nm | 65 | 348 |
| SNV | 0.94 | 996 nm | 0.02 | 668 nm | 13 | 560 |
| MSC | 0.75 | 401 nm | −0.77 | 638 nm | 62 | 383 |
| FD | 0.77 | 952 nm | −0.67 | 500 nm | 99 | 252 |
| WT | 0.77 | 401 nm | −0.38 | 815 nm | 76 | 346 |
S−G smoothing (SG), standard normal variate (SNV), multiple scattering correction (MSC), first-order derivative transform (FD), and wavelet transform (WT).
Table 2.
Classification of the training set and testing set for oleic acid content in rapeseed.
| Sample Set | n | Max. | Min. | Mean | SD | CV |
|---|---|---|---|---|---|---|
| Training set | 46 | 87.52 | 80.94 | 84.38 | 1.18 | 1.39 |
| Testing set | 24 | 86.61 | 82.02 | 84.70 | 1.13 | 1.34 |
Table 3.
Classification of the training set and testing set for oleic acid content in leaves.
| Sample Set | n | Max. | Min. | Mean | SD | CV |
| Training set | 52 | 6.59 | 3.41 | 5.11 | 0.72 | 14.0 |
| Testing set | 18 | 5.72 | 4.43 | 4.98 | 0.43 | 8.64 |
Table 4.
Hyperparameter settings for machine learning algorithms.
| Algorithm | Hyperparameters |
|---|---|
| MLR | Normalize = zscore, polynomial_degree = 3 |
| RF | n_estimators = 100, max_features = 4, max_depth = 3 |
| SVR | Kernel = rbf, C = 9.251, γ = scale |
| KNN | K = 5, weights = uniform, leaf_size = 30, p = 2, metric = minkowski |
| RR | k = 0.001 |
| CatBoost | n_estimators = 1000, learning_rate = 0.024, max_depth = 6 |
multiple linear regression (MLR), random forest (RF), support vector regression (SVR), k-nearest neighbors (KNN) and ridge regression (RR).
Disclaimer/Publisher’s Note: The statements, opinions and data contained in all publications are solely those of the individual author(s) and contributor(s) and not of MDPI and/or the editor(s). MDPI and/or the editor(s) disclaim responsibility for any injury to people or property resulting from any ideas, methods, instructions or products referred to in the content. |
© 2023 by the authors. Licensee MDPI, Basel, Switzerland. This article is an open access article distributed under the terms and conditions of the Creative Commons Attribution (CC BY) license (https://creativecommons.org/licenses/by/4.0/).
Share and Cite
MDPI and ACS Style
Lu, J.; Tian, R.; Wen, S.; Guan, C. Selection of Agronomic Parameters and Construction of Prediction Models for Oleic Acid Contents in Rapeseed Using Hyperspectral Data. Agronomy 2023, 13, 2233. https://doi.org/10.3390/agronomy13092233
AMA Style
Lu J, Tian R, Wen S, Guan C. Selection of Agronomic Parameters and Construction of Prediction Models for Oleic Acid Contents in Rapeseed Using Hyperspectral Data. Agronomy. 2023; 13(9):2233. https://doi.org/10.3390/agronomy13092233
Chicago/Turabian StyleLu, Junwei, Rongcai Tian, Shuangya Wen, and Chunyun Guan. 2023. "Selection of Agronomic Parameters and Construction of Prediction Models for Oleic Acid Contents in Rapeseed Using Hyperspectral Data" Agronomy 13, no. 9: 2233. https://doi.org/10.3390/agronomy13092233
Note that from the first issue of 2016, this journal uses article numbers instead of page numbers. See further details here.