Article

Spatial Rice Yield Estimation Using Multiple Linear Regression Analysis, Semi-Physical Approach and Assimilating SAR Satellite Derived Products with DSSAT Crop Simulation Model

by
Sellaperumal Pazhanivelan
1,*,
Vellingiri Geethalakshmi
1,
R. Tamilmounika
2,
N. S. Sudarmanian
2,
Ragunath Kaliaperumal
1,
Kumaraperumal Ramalingam
2,
A. P. Sivamurugan
1,
Kancheti Mrunalini
1,
Manoj Kumar Yadav
3 and
Emma D. Quicho
4
1
Water Technology Centre, Tamil Nadu Agricultural University, Coimbatore 641003, India
2
Department of Remote Sensing and GIS, Tamil Nadu Agricultural University, Coimbatore 641003, India
3
Deutsche Gesellschaft für Internationale Zusammenarbeit (GIZ) GmbH, New Delhi 110029, India
4
International Rice Research Institute, Los Baños 4031, Laguna, Philippines
*
Author to whom correspondence should be addressed.
Agronomy 2022, 12(9), 2008; https://doi.org/10.3390/agronomy12092008
Submission received: 24 July 2022 / Revised: 13 August 2022 / Accepted: 19 August 2022 / Published: 25 August 2022

Abstract

:
Accurate and consistent information on the area and production of field crops is vital for national and state planning and ensuring food security in India. Satellite-based remote sensing offers a suitable and cost-effective technique for regional- and national-scale crop monitoring. The use of remote sensing data for crop yield estimation has been demonstrated using a semi-physical approach with reasonable success. Assimilating remote sensing data with the DSSAT model and spectral indices-based regression analysis are promising methods for spatially estimating rice crop yields. Rice area and yield in the Cauvery delta zone of Tamil Nadu, India was estimated during samba (August–January) season in the years 2020–2021 using Sentinel 1A Synthetic Aperture Radar satellite data with three different spatial yield estimation methods, namely a spectral indices-based regression analysis, semi-physical approach, and integrating remote products with DSSAT crop growth model. A rice area map was generated for the study area using a rule-based classifier approach utilizing parameterization with a classification accuracy of 94.5% and a kappa score of 0.89. The total classified rice area in Cauvery Delta Region was 379,767 ha, and the Start of Season (SoS) maps for samba season revealed that the major planting period for rice was between 22 September and 9 November in 2020. The study also aimed to identify promising spatial yield estimation techniques for optimal rice yield prediction over large areas. Regression models resulted in rice yields of 3234 to 3905 kg ha−1 with a mean of 3654 kg ha−1. The net primary product was computed using the periodical PAR, fAPAR, Wstress, Tstress, and maximum radiation use efficiency in a semi-physical approach. The resultant rice yields ranged between 2652 and 3438 kg ha−1 with the mean of 3076 kg ha−1. During the integration of remote sensing products with crop growth models, LAI values were extracted from dB images and utilized to simulate rice yields in the range of 3684 to 4012 kg ha−1 with the mean of 3855 kg ha−1. When compared to the semi-physical approach, both integrating remote sensing products with the DSSAT crop growth model and spectral indices-based regression analysis had R2 greater than 0.80, NRMSE of less than 10%, and agreement of more than 90%, indicating that these two approaches could be used for spatial rice yield estimation.

1. Introduction

Rice is an important component of global food production as it is consumed on a routine basis by hundreds of millions of people worldwide. Predicting food grain yields earlier can help farmers and policymakers plan accordingly. Accurate statistical data on rice yield production availability assists planners in making tactical decisions and regulating import and export activities. However, the traditional crop area and yield estimation approach, which requires a huge labour force, is time-consuming, inaccurate, and practically impossible to apply on a broad scale. Therefore, the agricultural policy programme now relies on timely information-collecting via field and aerial surveys. Although operational systems produce reliable data, they have several intrinsic flaws, such as difficulty in comparing statistics and authenticating information acquired by numerous agencies. Remote sensing technology has provided a solid platform for agricultural crop inventories, mapping, monitoring, crop resource management, and crop biomass estimation. The recent launch of advanced remote sensing satellites helps us to estimate accurate crop area and yield precisely using the fine spatial and temporal resolution of data.
Furthermore, improved spatial, spectral, and temporal resolution help us to discriminate crops easily [1]. The availability of these high-resolution satellite sensors, software with automated processing chains, and enhanced agricultural yield models enable the provision of reliable information on crop area, crop conditions, and yields. Time series satellite data improves crop classification accuracy with repetitive coverage over the cropped area [2]. SAR sensors respond very well to crop canopy structural differences. In addition, they are sensitive to several crop biophysical parameters, namely LAI, biomass, and canopy height, resulting in precise identification of crop types [3].
Numerous factors like soil parameters, weather, crop genetic characteristics, and management approaches determine crop growth and production. Crop health and yield are tracked using satellite-based vegetation indices. Vegetation indices like Normalized Difference Vegetation Index (NDVI), Land Surface Water Index (LSWI), and Leaf Area Index (LAI) are the best indicators for the amount of biomass in the crop canopy. NDVI and EVI time series data of MODIS, field data, and crop calendar information were utilized to estimate rice crop yield in Thailand. The highest correlation was reported between MODIS EVI and rice yield in point level yield analysis [4]. Chandra Paul et al. [5] estimated rice yield using LSWI and other vegetation indices based on a regression model. Vegetation indices were calculated from LANDSAT satellite imageries during different phenological stages of rice. He et al. [6] evaluated the relationship of rice LAI at different phenological stages with backscattering coefficients of SAR data. The accuracy of LAI retrieval using the water cloud model indicated that vegetation coverage had a better relationship with LAI [7]. LAI, fAPAR, and NPP are remote sensing products related to the metabolism of the biosphere. Dwivedi et al. [8] developed a semi-physical method to predict rice yield using remote sensing and physiological concepts. The Monteith model was used to calculate Net Primary Product, actual NPP, radiation use efficiency and harvest index to predict Kharif rice yield. Crop simulation models predict crop yield as a function of soil, climate, genetic coefficients, and crop management [9]. Crop simulation models have been developed using a set of mathematical equations that integrate data from agrometeorology, soil, crop physiology, and management to predict growth, development, and crop yield. Crop growth models successfully simulate the potential crop growth and crop characteristics and may provide real-time vegetation cover status [10]. The DSSAT model for crop simulation is a powerful tool to promote the production of the sustainable agriculture industry. Guo et al. [11] estimated the rice yield gaps in China using the CERES-Rice model. Remote sensing products used with the DSSAT CERES-Rice model can simulate rice yields based on soil, weather, crop cultivars, and cultivation practices. Under Indian weather conditions, crop growth simulation and linear regression models have repeatedly done well in projecting rice yields accurately [9]. Satellite-based inputs into the crop simulation model simplify the process, time, and labour required for regional-level data collection. The remote sensing images could be used for aggregation of results of crop growth models to regional scales. The remote sensing product and crop model can be integrated with three ways: driving method, initialization parameter method, and assimilation method. Several studies proved that satellite-derived products have been utilized in crop acreage and spatial crop yield estimation. Son et al. [12] integrated remotely sensed data into a DSSAT crop simulation model for rice yield estimation using Taiwan’s Particle Swarm Optimization (PSO) algorithm. RMSE observed between estimated yield and actual yield was 11.7%. Setiyono et al. [13] used multi-temporal X-band and C-band SAR imagery, automated image processing, rule-based classification, and field observation to identify rice in multiple locations across Tropical Asia. They incorporated this information and basic crop input files into the ORYZA Crop Growth Simulation model to generate high-resolution yield maps. The cultivated rice area maps had a classification accuracy greater than 85% and yield estimates within 81 to 93% agreement against district-level reported yields. Sentinel 1A, Sentinel 2, and LANDSAT 8 were the satellite data used for area and yield estimation. Rice area and LAI were estimated from MAPscape-RICE software, and rice yield was calculated from the ORYZA crop growth model [14].
There is an urgent need to identify the optimum spatial-yield-estimating algorithm for properly predicting rice yields in near real-time. Therefore, this study was conducted to compare the spatial rice yield estimation methods, namely spectral indices-based regression analysis, semi-physical approach, and integrating remote sensing products with the DSSAT crop growth model in the Cauvery delta region of Tamil Nadu, India.

2. Methodology

The research study was carried out in the Thanjavur, Thiruvarur, Nagapattinam, and Mayiladuthurai districts of the Cauvery Delta Region during the samba (August–January) season 2020–2021 (Figure 1). Rice is the main crop in this region, and it is cultivated in all three growing seasons. Therefore, 21 different field locations were chosen across the study region to monitor rice growth during the cropping season. In this paper, three spatial yield estimation techniques, namely spectral indices-based regression analysis, semi-physical approach, and integration of synthetic-aperture radar (SAR) based remote sensing products with crop growth model were employed to predict rice yield and their accuracy over the actual yield.

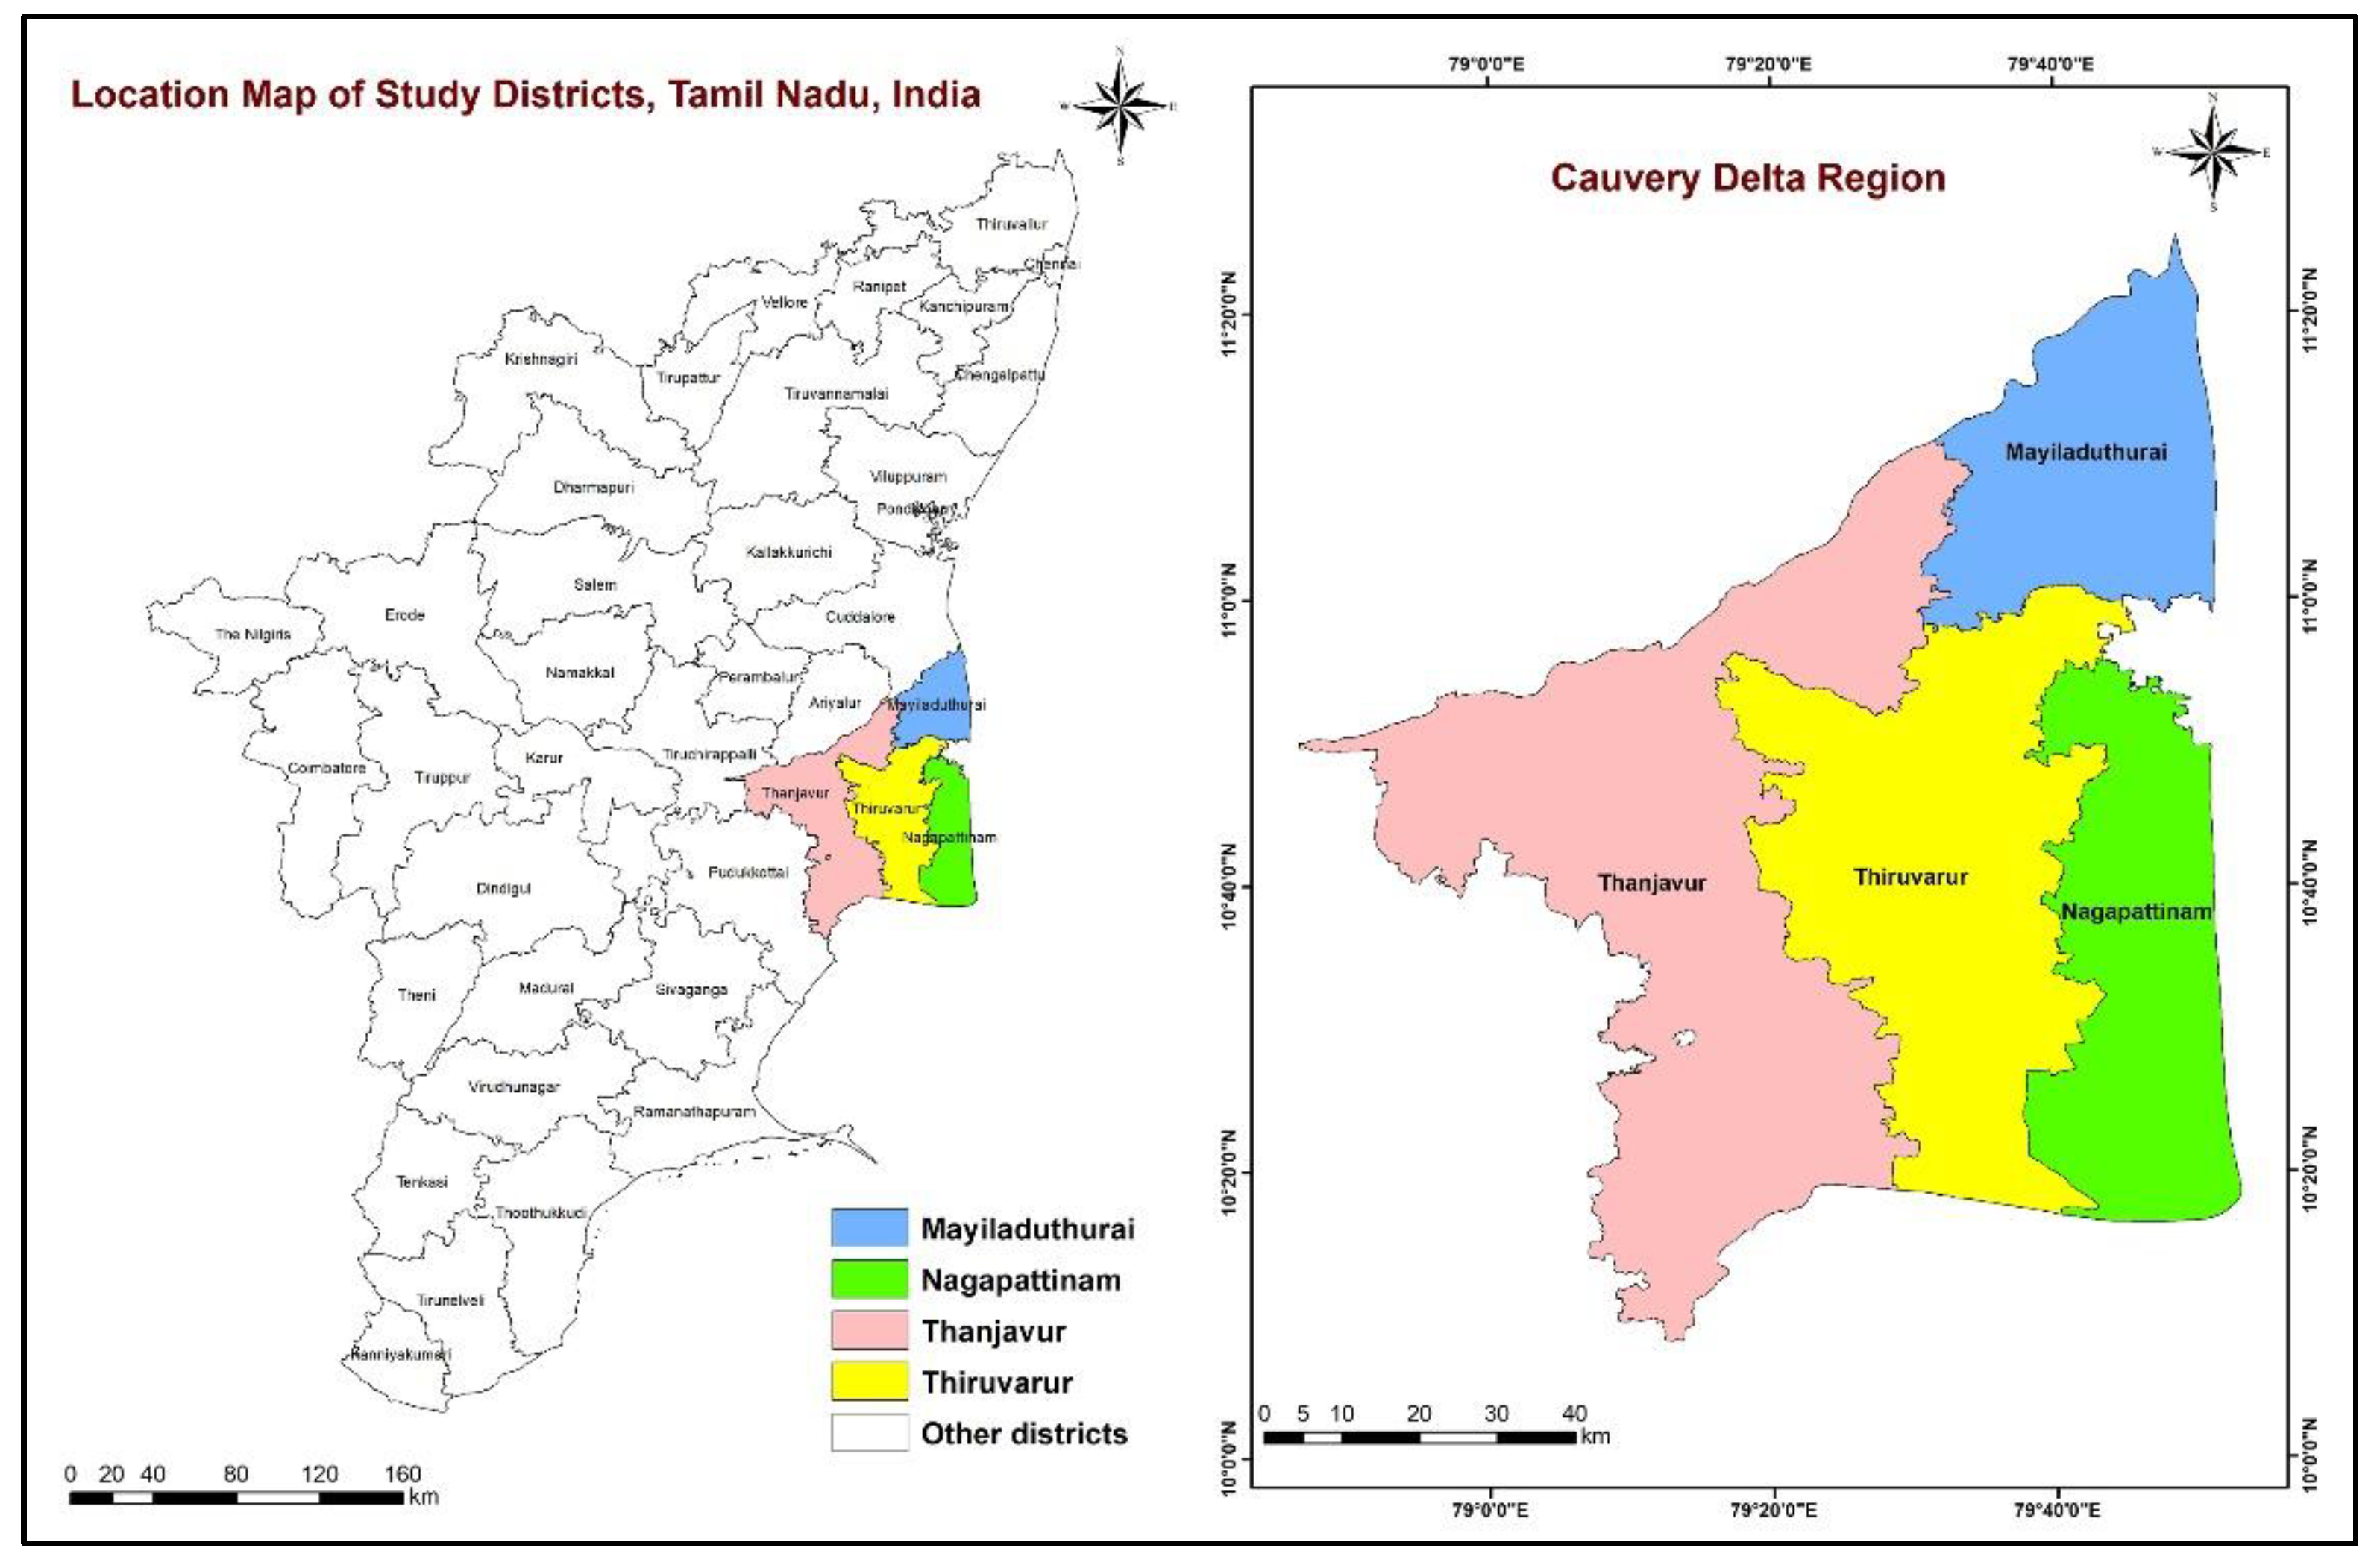
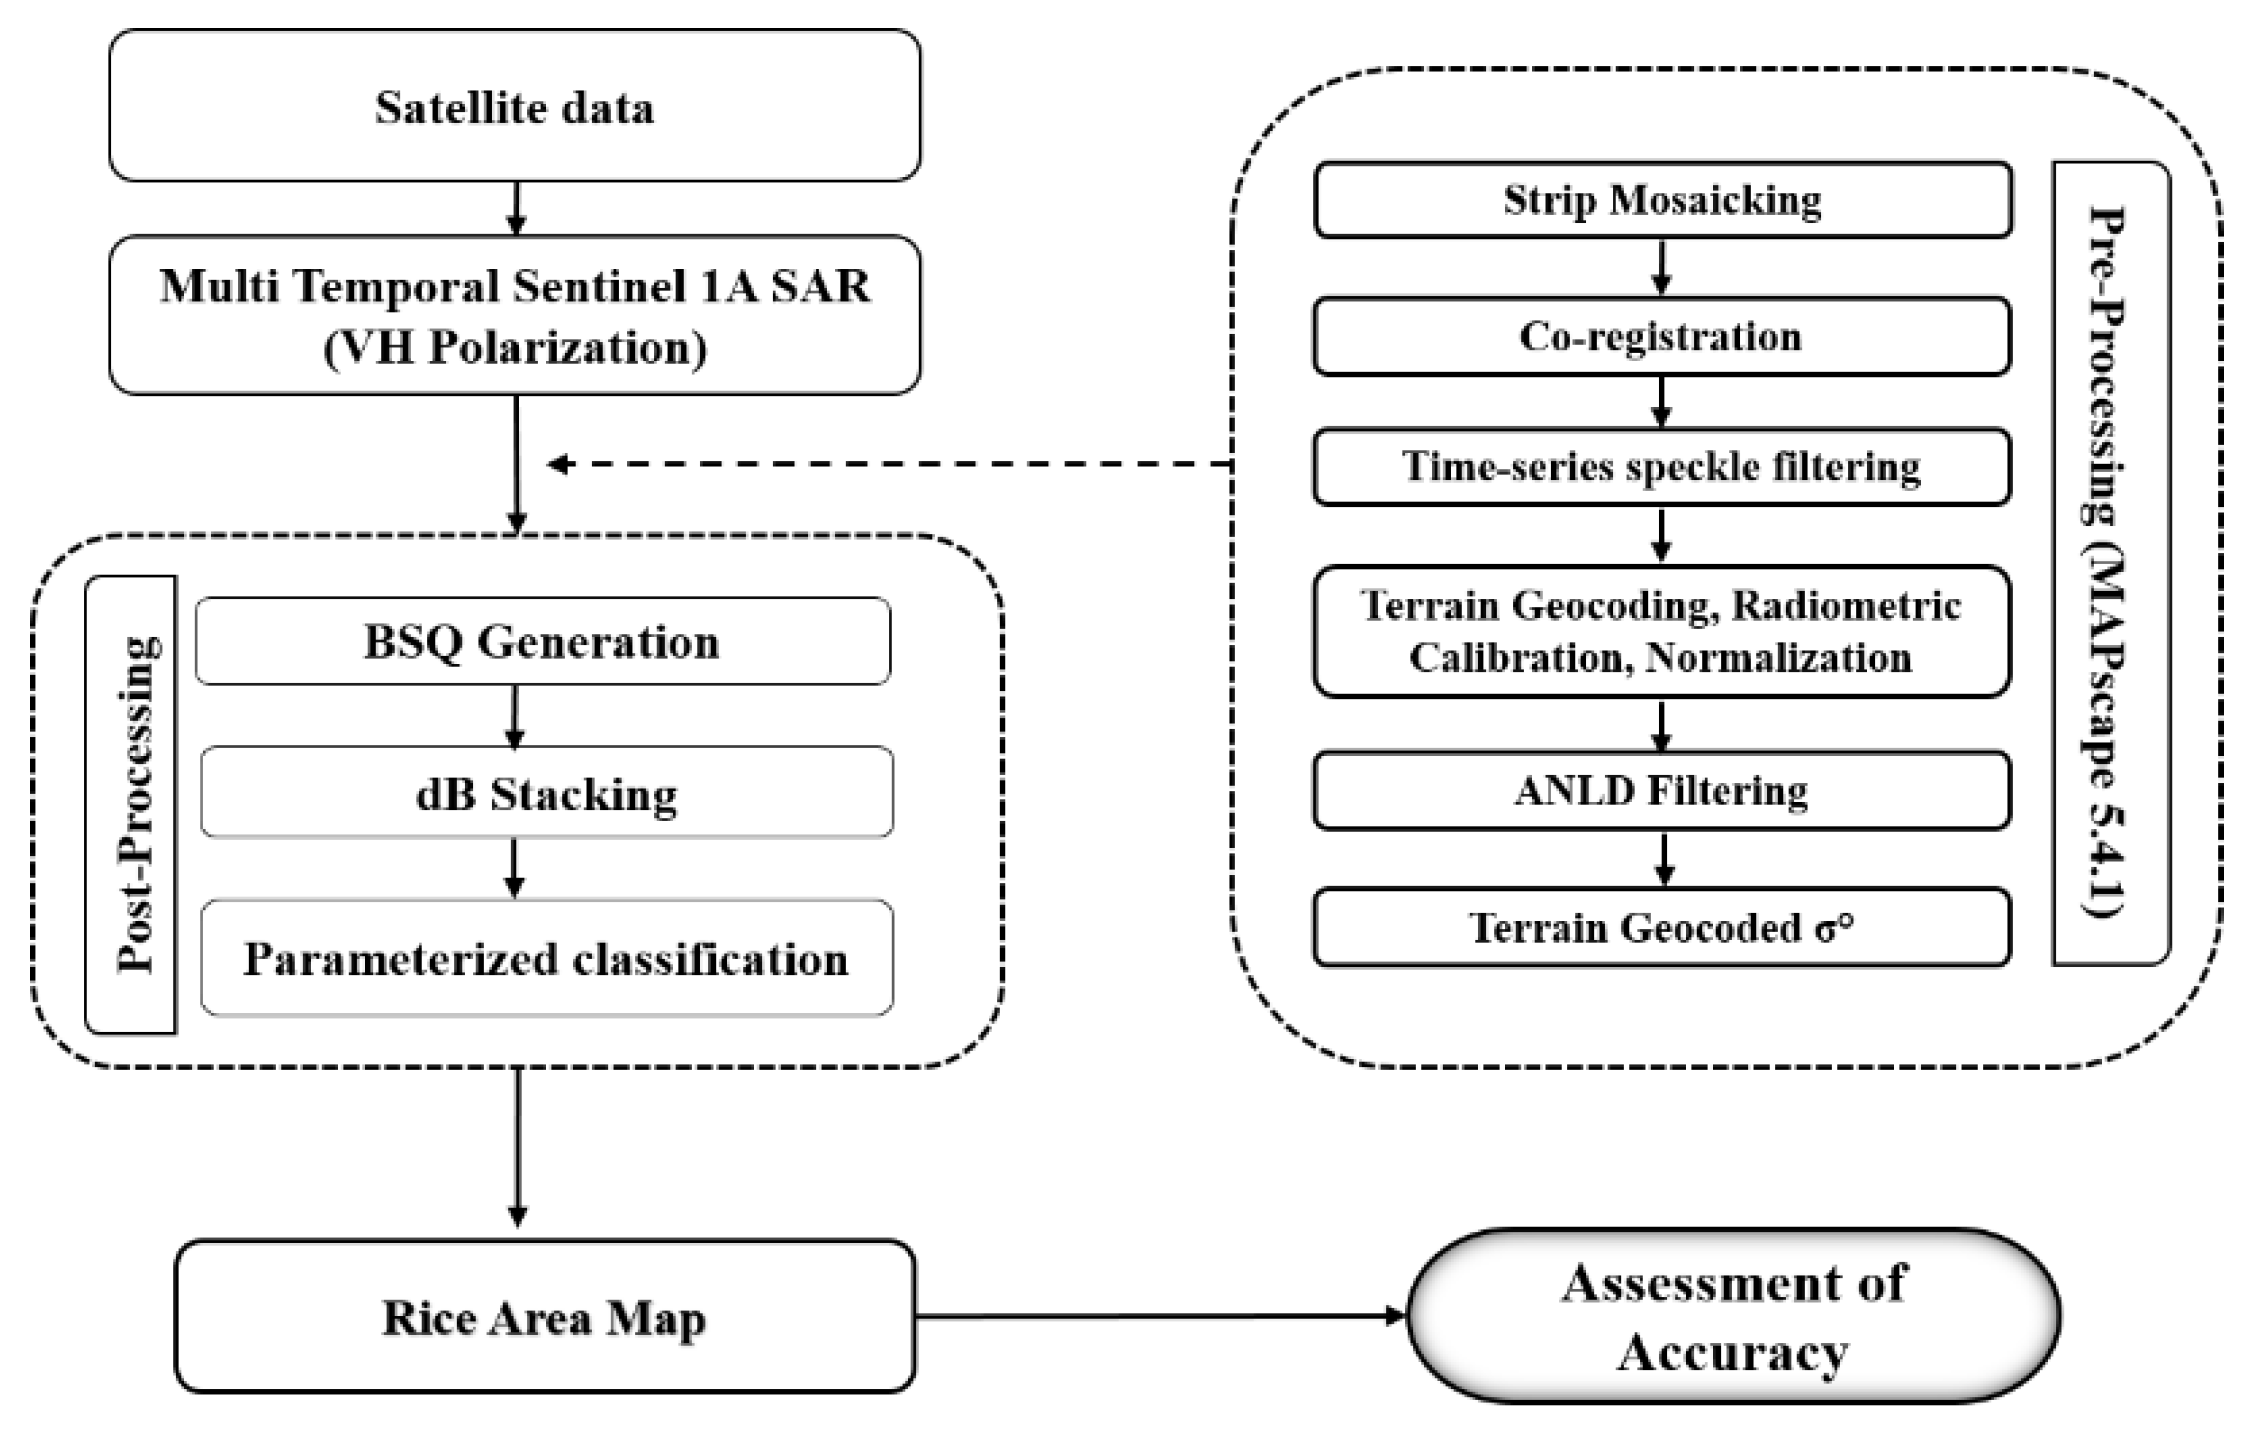
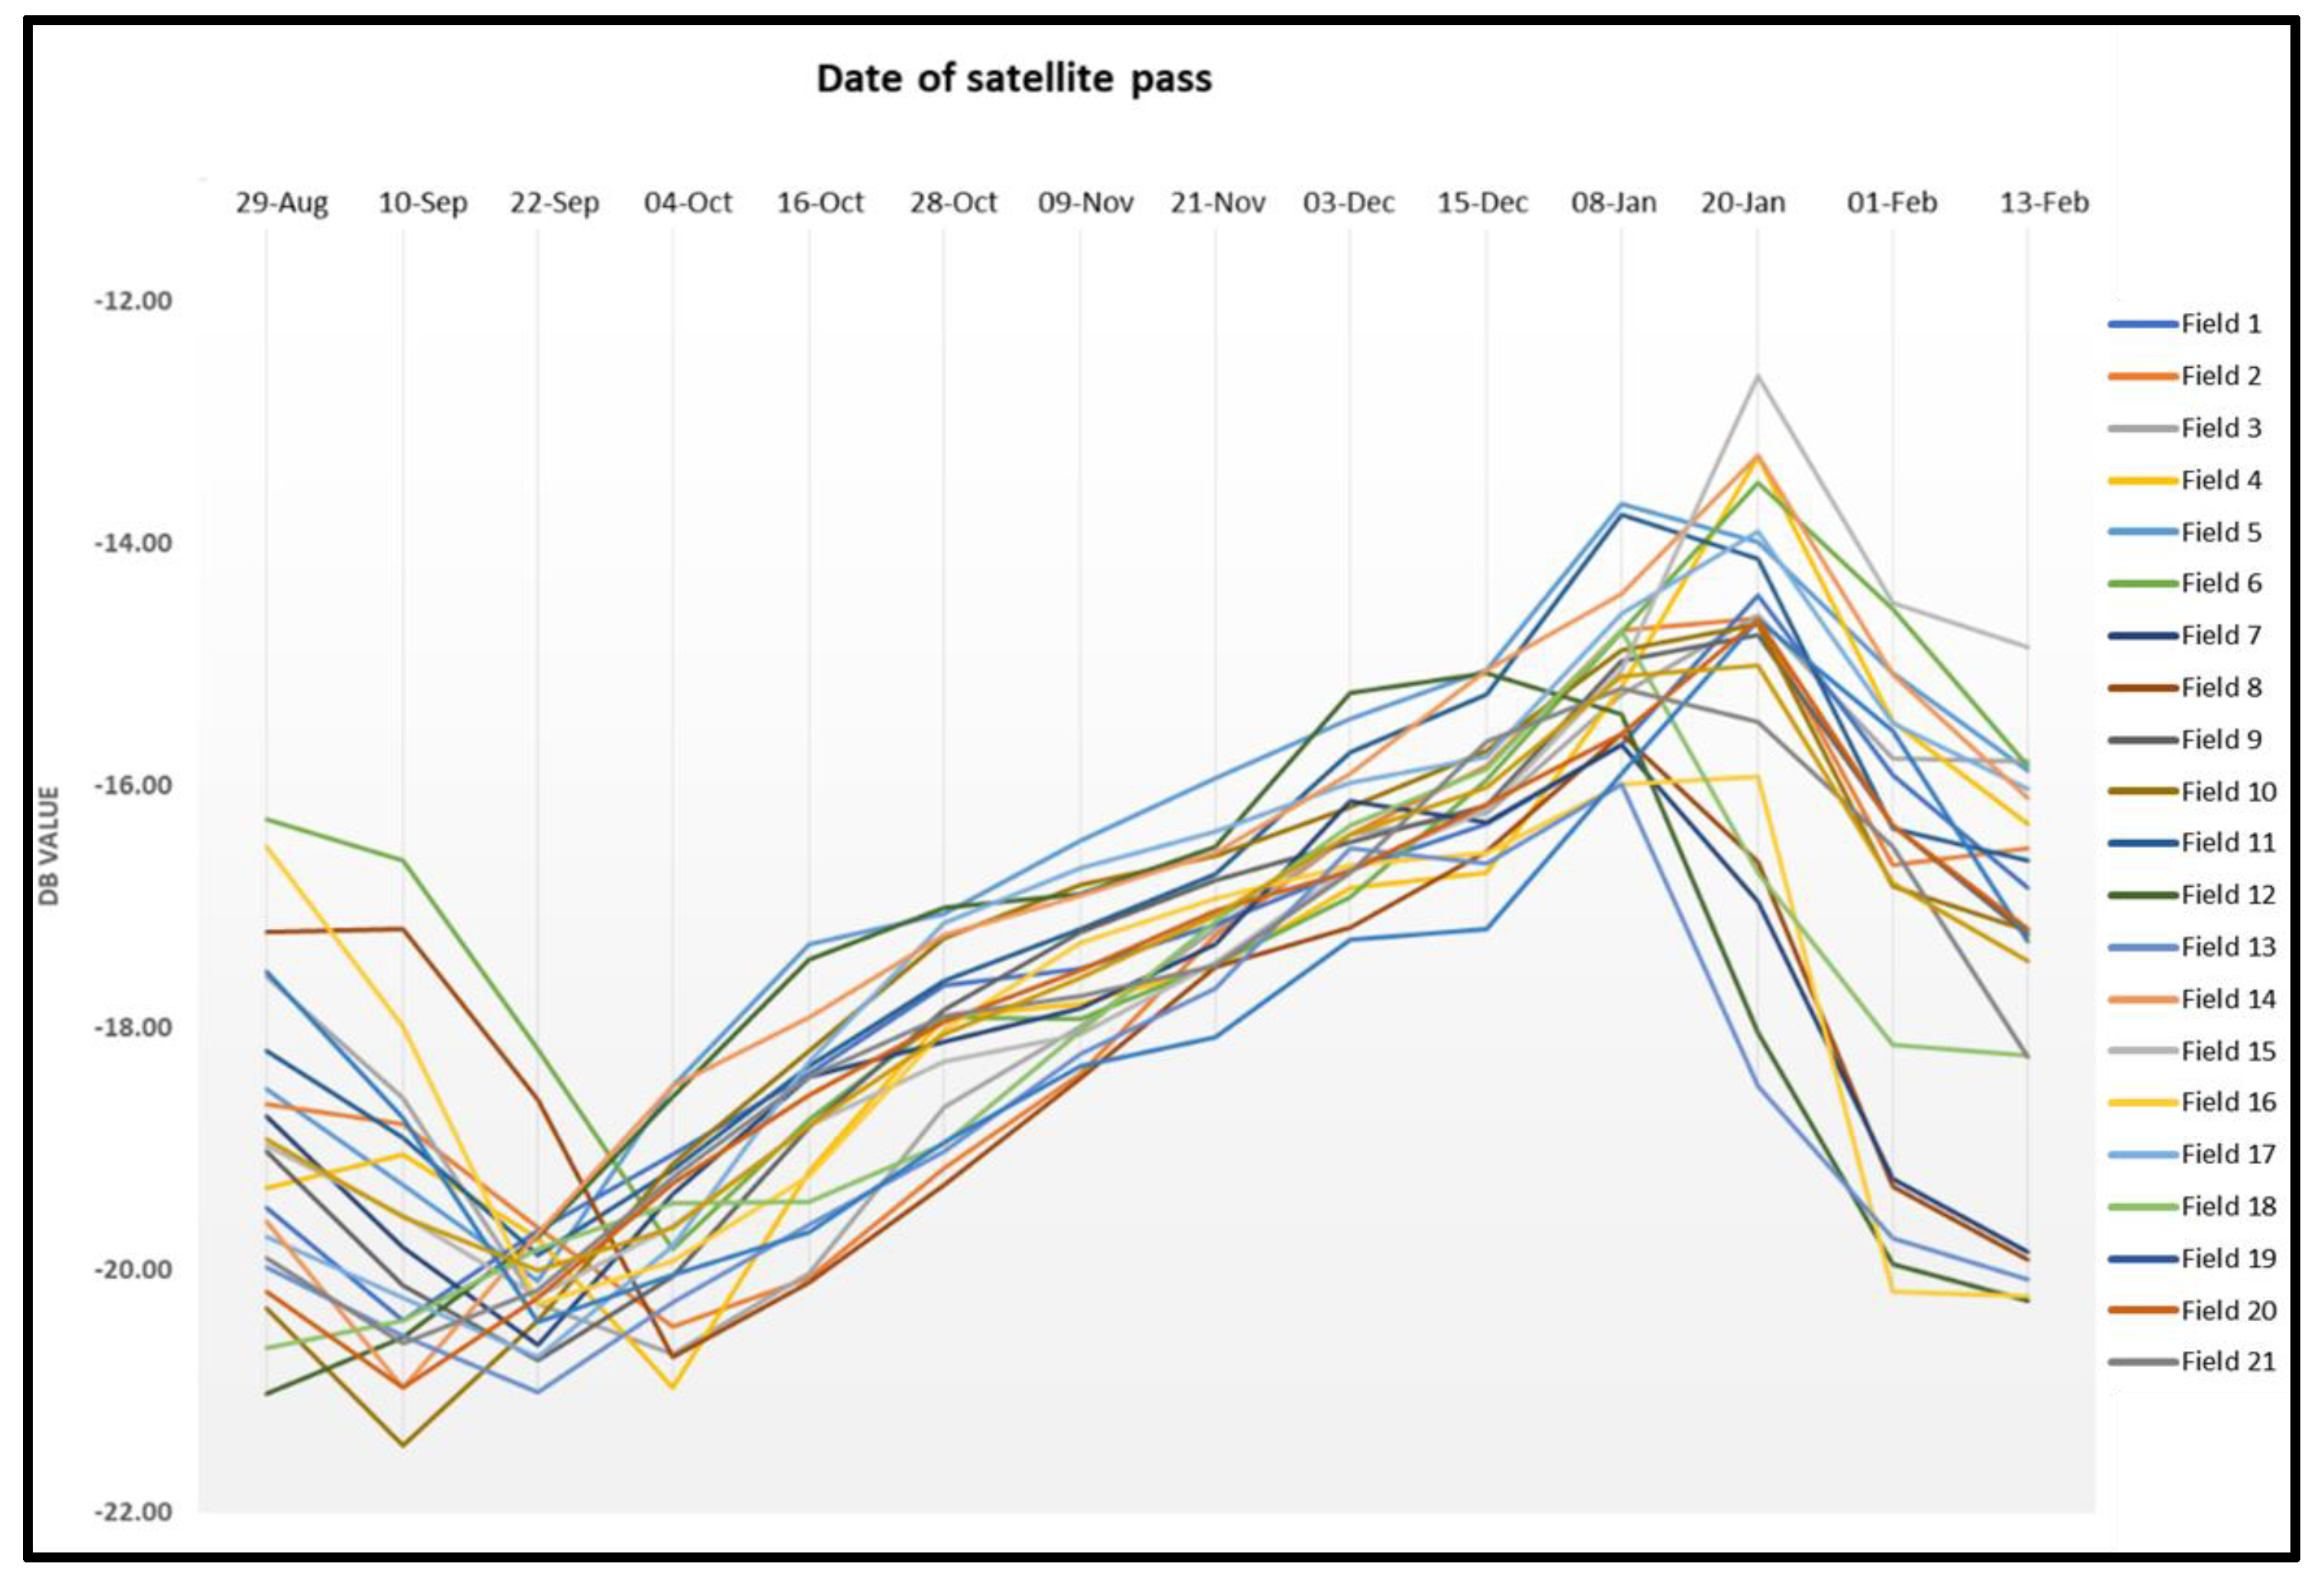
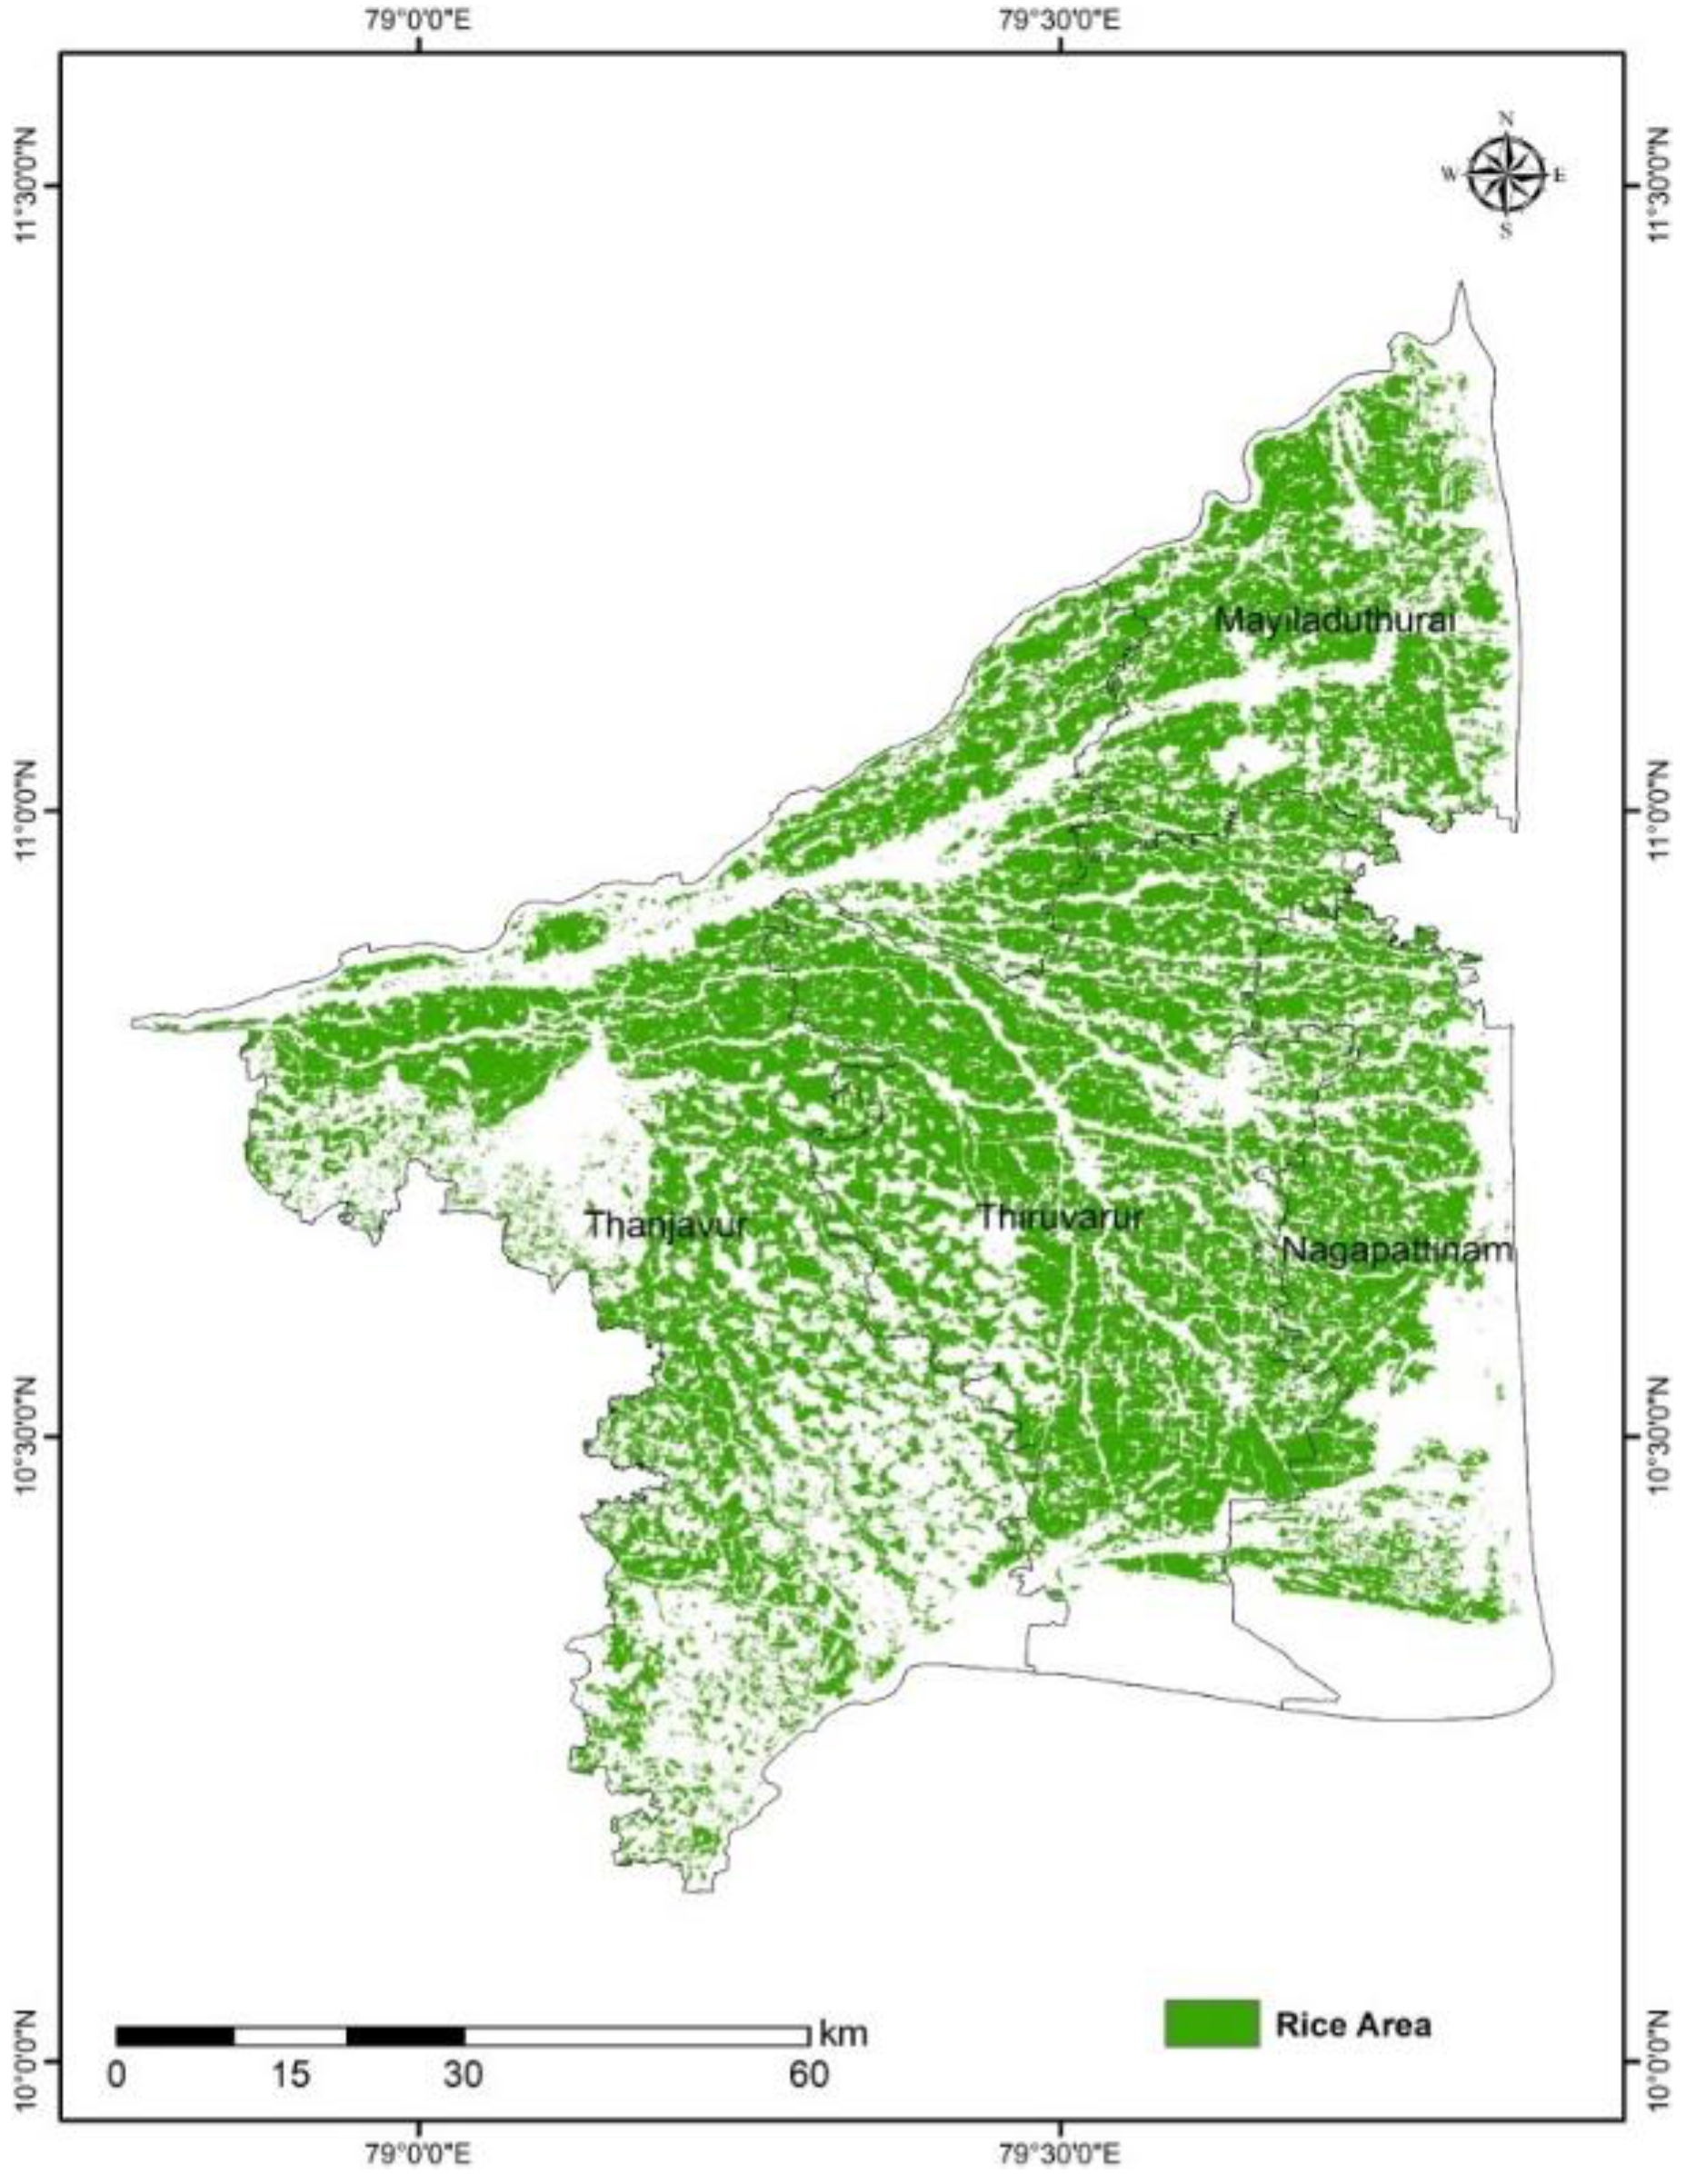
2.1. Rice Area Estimation

Detecting lowland rice in tropical and subtropical regions and tracking growth has been made effective through Synthetic Aperture Radar (SAR) imagery, especially where cloud cover restricts the use of optical imagery. Parameterized classification with multi-temporal features derived from regularly acquired, C-band, VV, and VH polarized Sentinel-1A SAR imagery was used for mapping rice area. The multi-temporal SAR data was converted into terrain-geocoded σ° values using a fully automated processing chain in MAPscape-Rice software developed by Holecz et al. [15] (Figure 2).
The process included strip mosaicking, co-registration, time-series speckle filtering, terrain geocoding, radiometric calibration, and normalization. Further Anisotropic Non-Linear Diffusion (ANLD) filtering was done to smoothen homogeneous targets while enhancing the difference between neighbouring areas. Multi-Temporal Features, namely max, min, mean, max date, min date, and span ratio were extracted from VV and VH polarizations to classify rice pixels. Rice detection was based on analyzing temporal signatures from SAR backscatter concerning crop stages.

2.2. Spectral Indices Based Regression Analysis

Sentinel 2 satellite datasets were acquired across the Cauvery Delta region during the crop growing season. Optical data for the research region was accessible in four tiles, and mosaicking makes handling datasets easier. The mosaicking of these tiles was carried out in ArcGIS software. Sentinel 2 data was used to estimate NDVI for the peak vegetative period of rice during the growing season. LSWI was calculated using high-resolution optical satellite data for rice’s peak vegetative season. LAI values at the early stage of leaf expansion were extracted from Sentinel 1A SAR backscatter using a modified version of the water cloud vegetation model established by Yang et al. [16], based on empirical assumptions of plant height and moisture dynamics.
A regression-based yield model was acquired using linear regression between vegetative indices and rice productivity, given in the equation below. Vegetation indices and real-time yield data are computed in different rice growth stages, namely tillering, booting, and maturity (Figure 2).
Y =   β 0 + β 1 X 1 + β 2 X 2 + β 3 X 3 + β n X n
where Y = Yield; X1 = LAI; X2 = NDVI; X3 = LSWI; β = Constant.

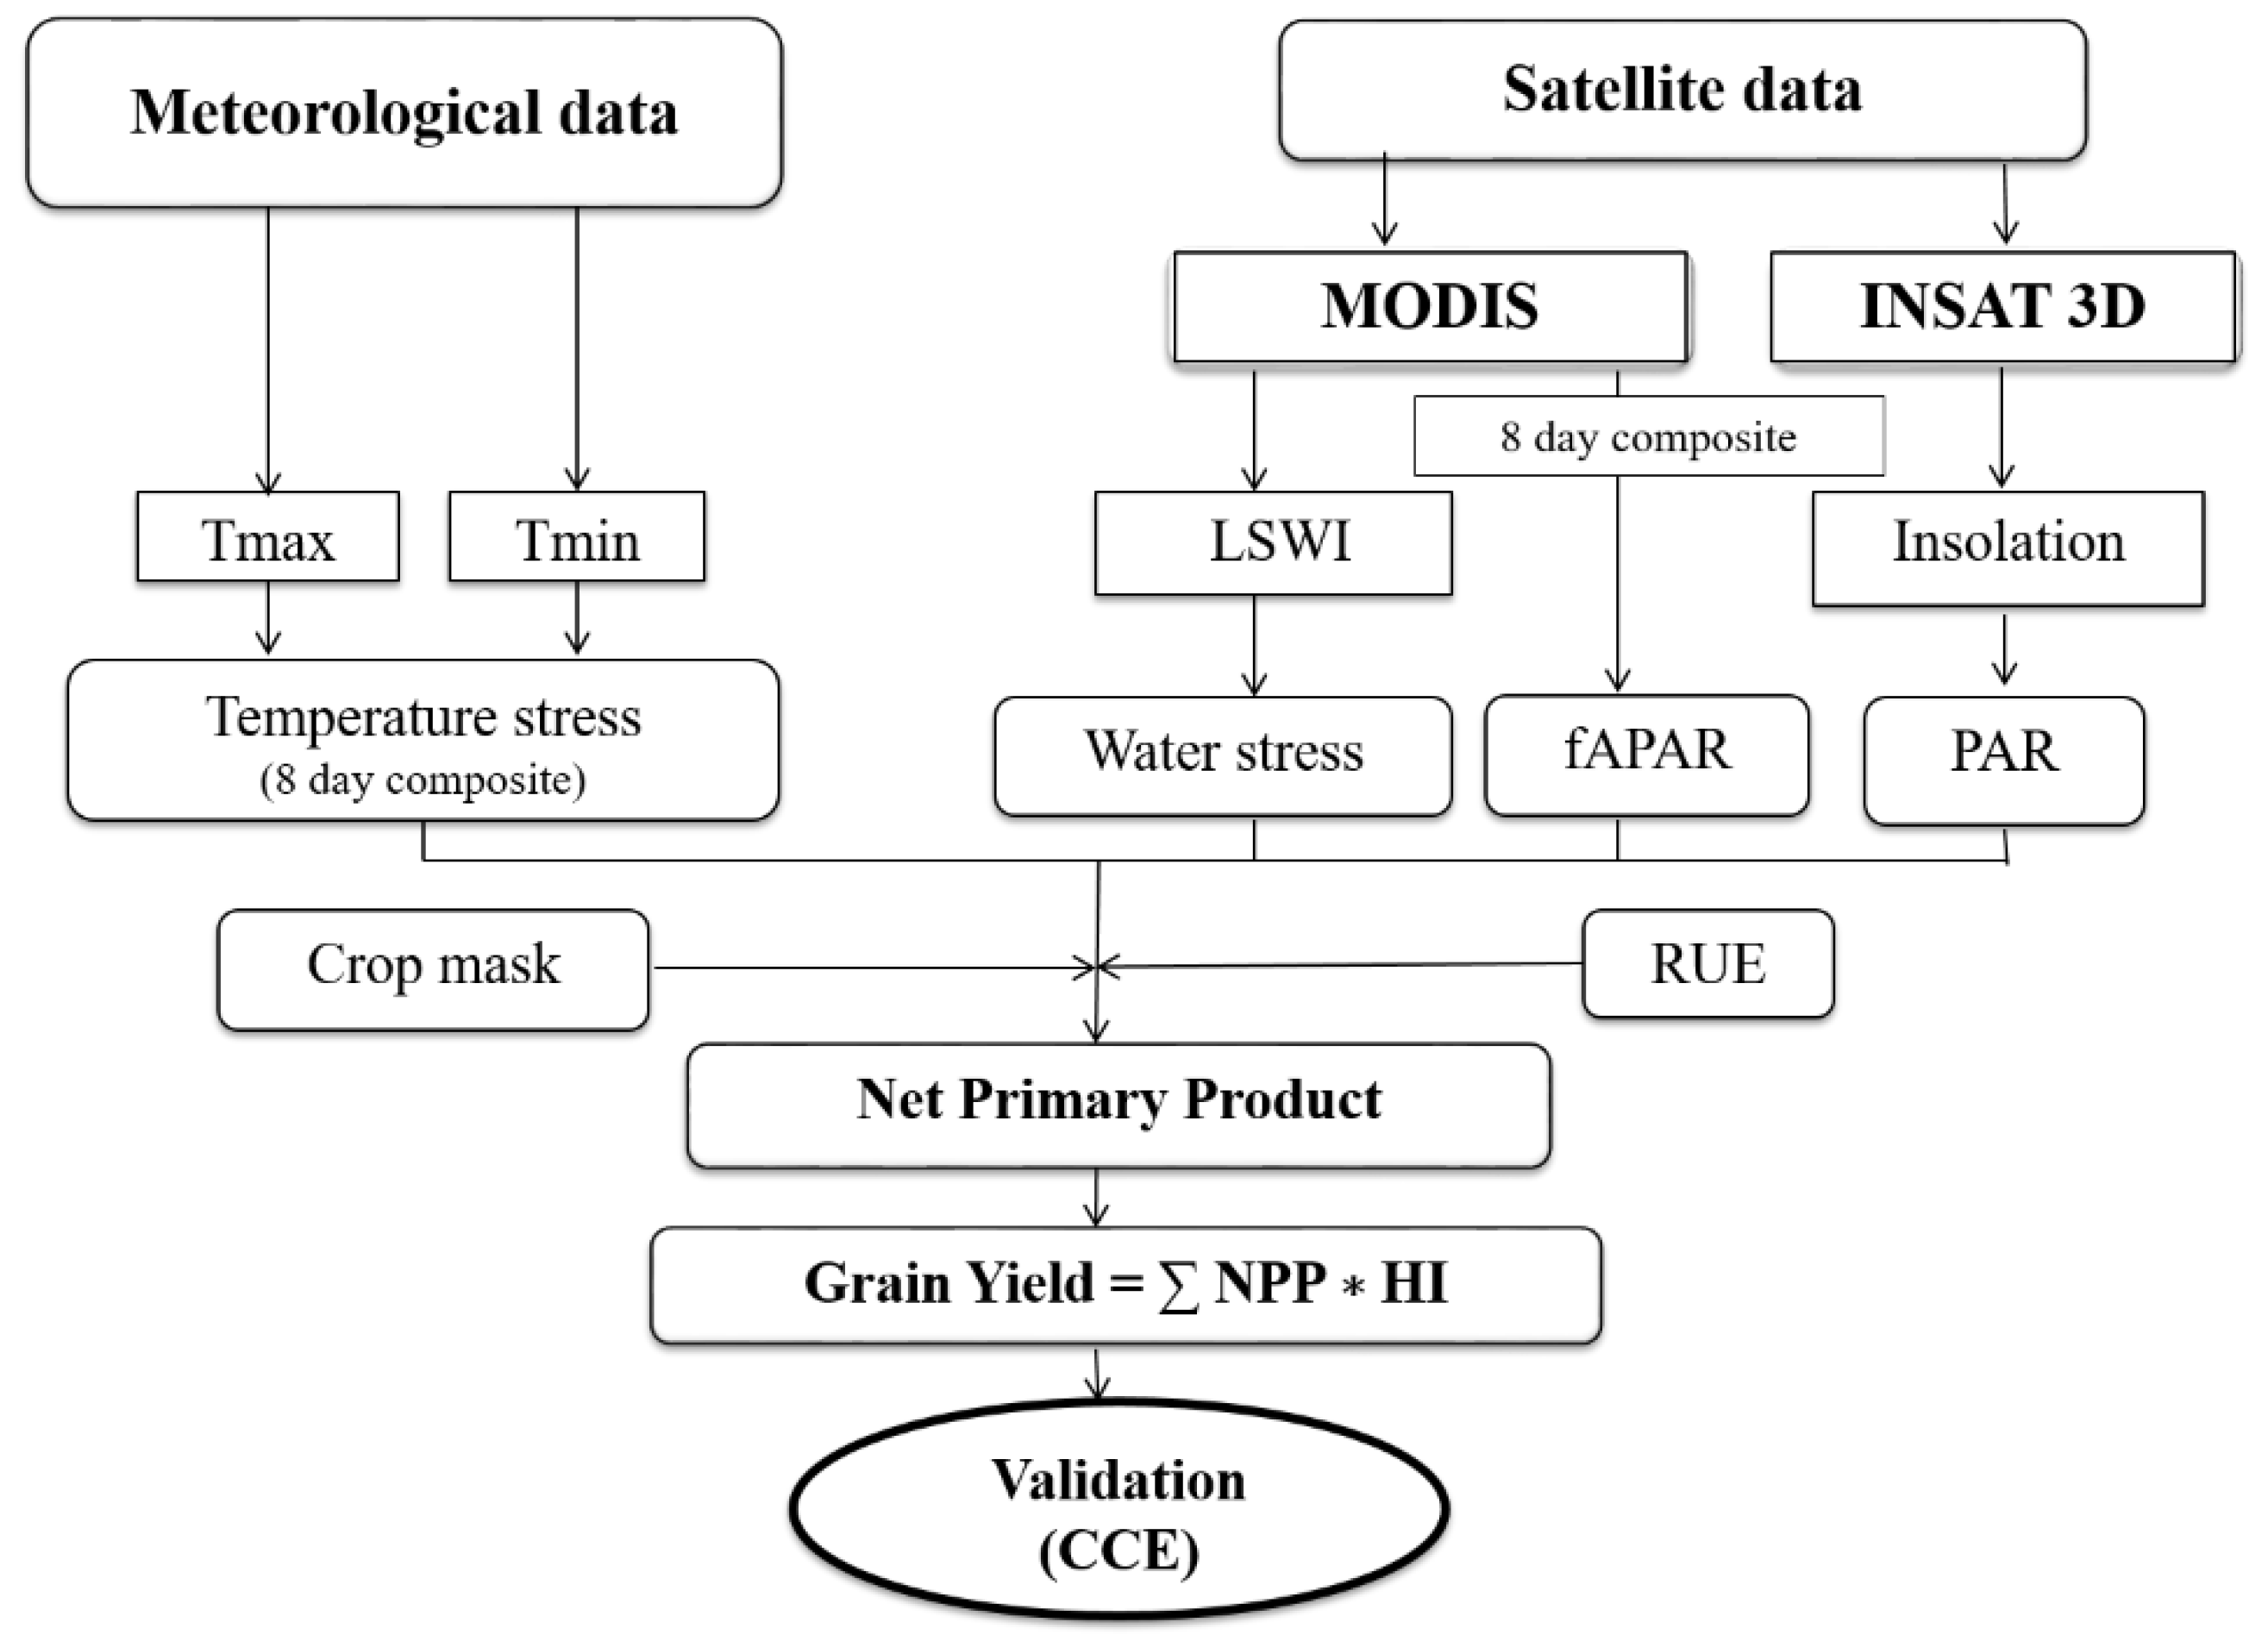
2.3. Semi-Physical Approach Based Yield Estimation

In this method, multi-temporal datasets from Sentinel 1A, INSAT 3D, MODIS, and the maximum and minimum temperatures collected from NASA POWER were used for analysis. ArcGIS 10.6 software (ESRI, Hyderabad, India) was used to process, analyze, and integrate geographical and non-spatial data. INSAT 3D imager insolation data products with a spatial resolution of 1 km were obtained daily from the MOSDAC data source for the growing season (August 2020–February 2021). Photosynthetically Active Radiation (PAR) accounted for half of the total insolation. In the case of the fraction of Photosynthetically Active Radiation (fAPAR), MODIS surface reflectance (MOD09A1) and fAPAR product (MOD15A2H) 8-day composites were available at 500 m spatial resolution (https://lpdaac.usgs.gov (accessed on 3 December 2020)).
For the computation of water stress, LSWI was used [17] and calculated using the formula.
W   stress = 1   LSWI   1 +   LSWI max
where Wstress = Water stress; LSWI max = maximum Land Surface Water Index.
Likewise, Temperature stress was calculated using the following equation [18].
Tstress = ( T T min ) ( T T max ) ( T T min ) ( T T max ) ( T T opt ) 2
where Tmin = minimum temperature for photosynthesis (°C); Tmax = maximum temperature for photosynthesis (°C); Topt = optimal temperature for photosynthesis (°C); T = the daily mean temperature (°C).
Net Primary Product (NPP) for the period of sowing to harvest date has been computed at an interval of 8 days with a spatial resolution of 500 m using the periodical PAR, fAPAR, Wstress, Tstress, and maximum radiation use efficiency.
NPP (g m−2day−1) = PAR ∗ fAPAR ∗ RUE ∗ W stress ∗ T stress
where PAR = Photosynthetically Active Radiation; fAPAR = Fraction of Absorbed Photosynthetically Active Radiation; RUE = Radiation Use Efficiency.
Total NPP was computed for the whole growing season of the rice from 8-day composite datasets. Rice yield was calculated from the product total NPP and harvest index of the rice. The overall methodology of the semi-physical approach is presented in Figure 3.

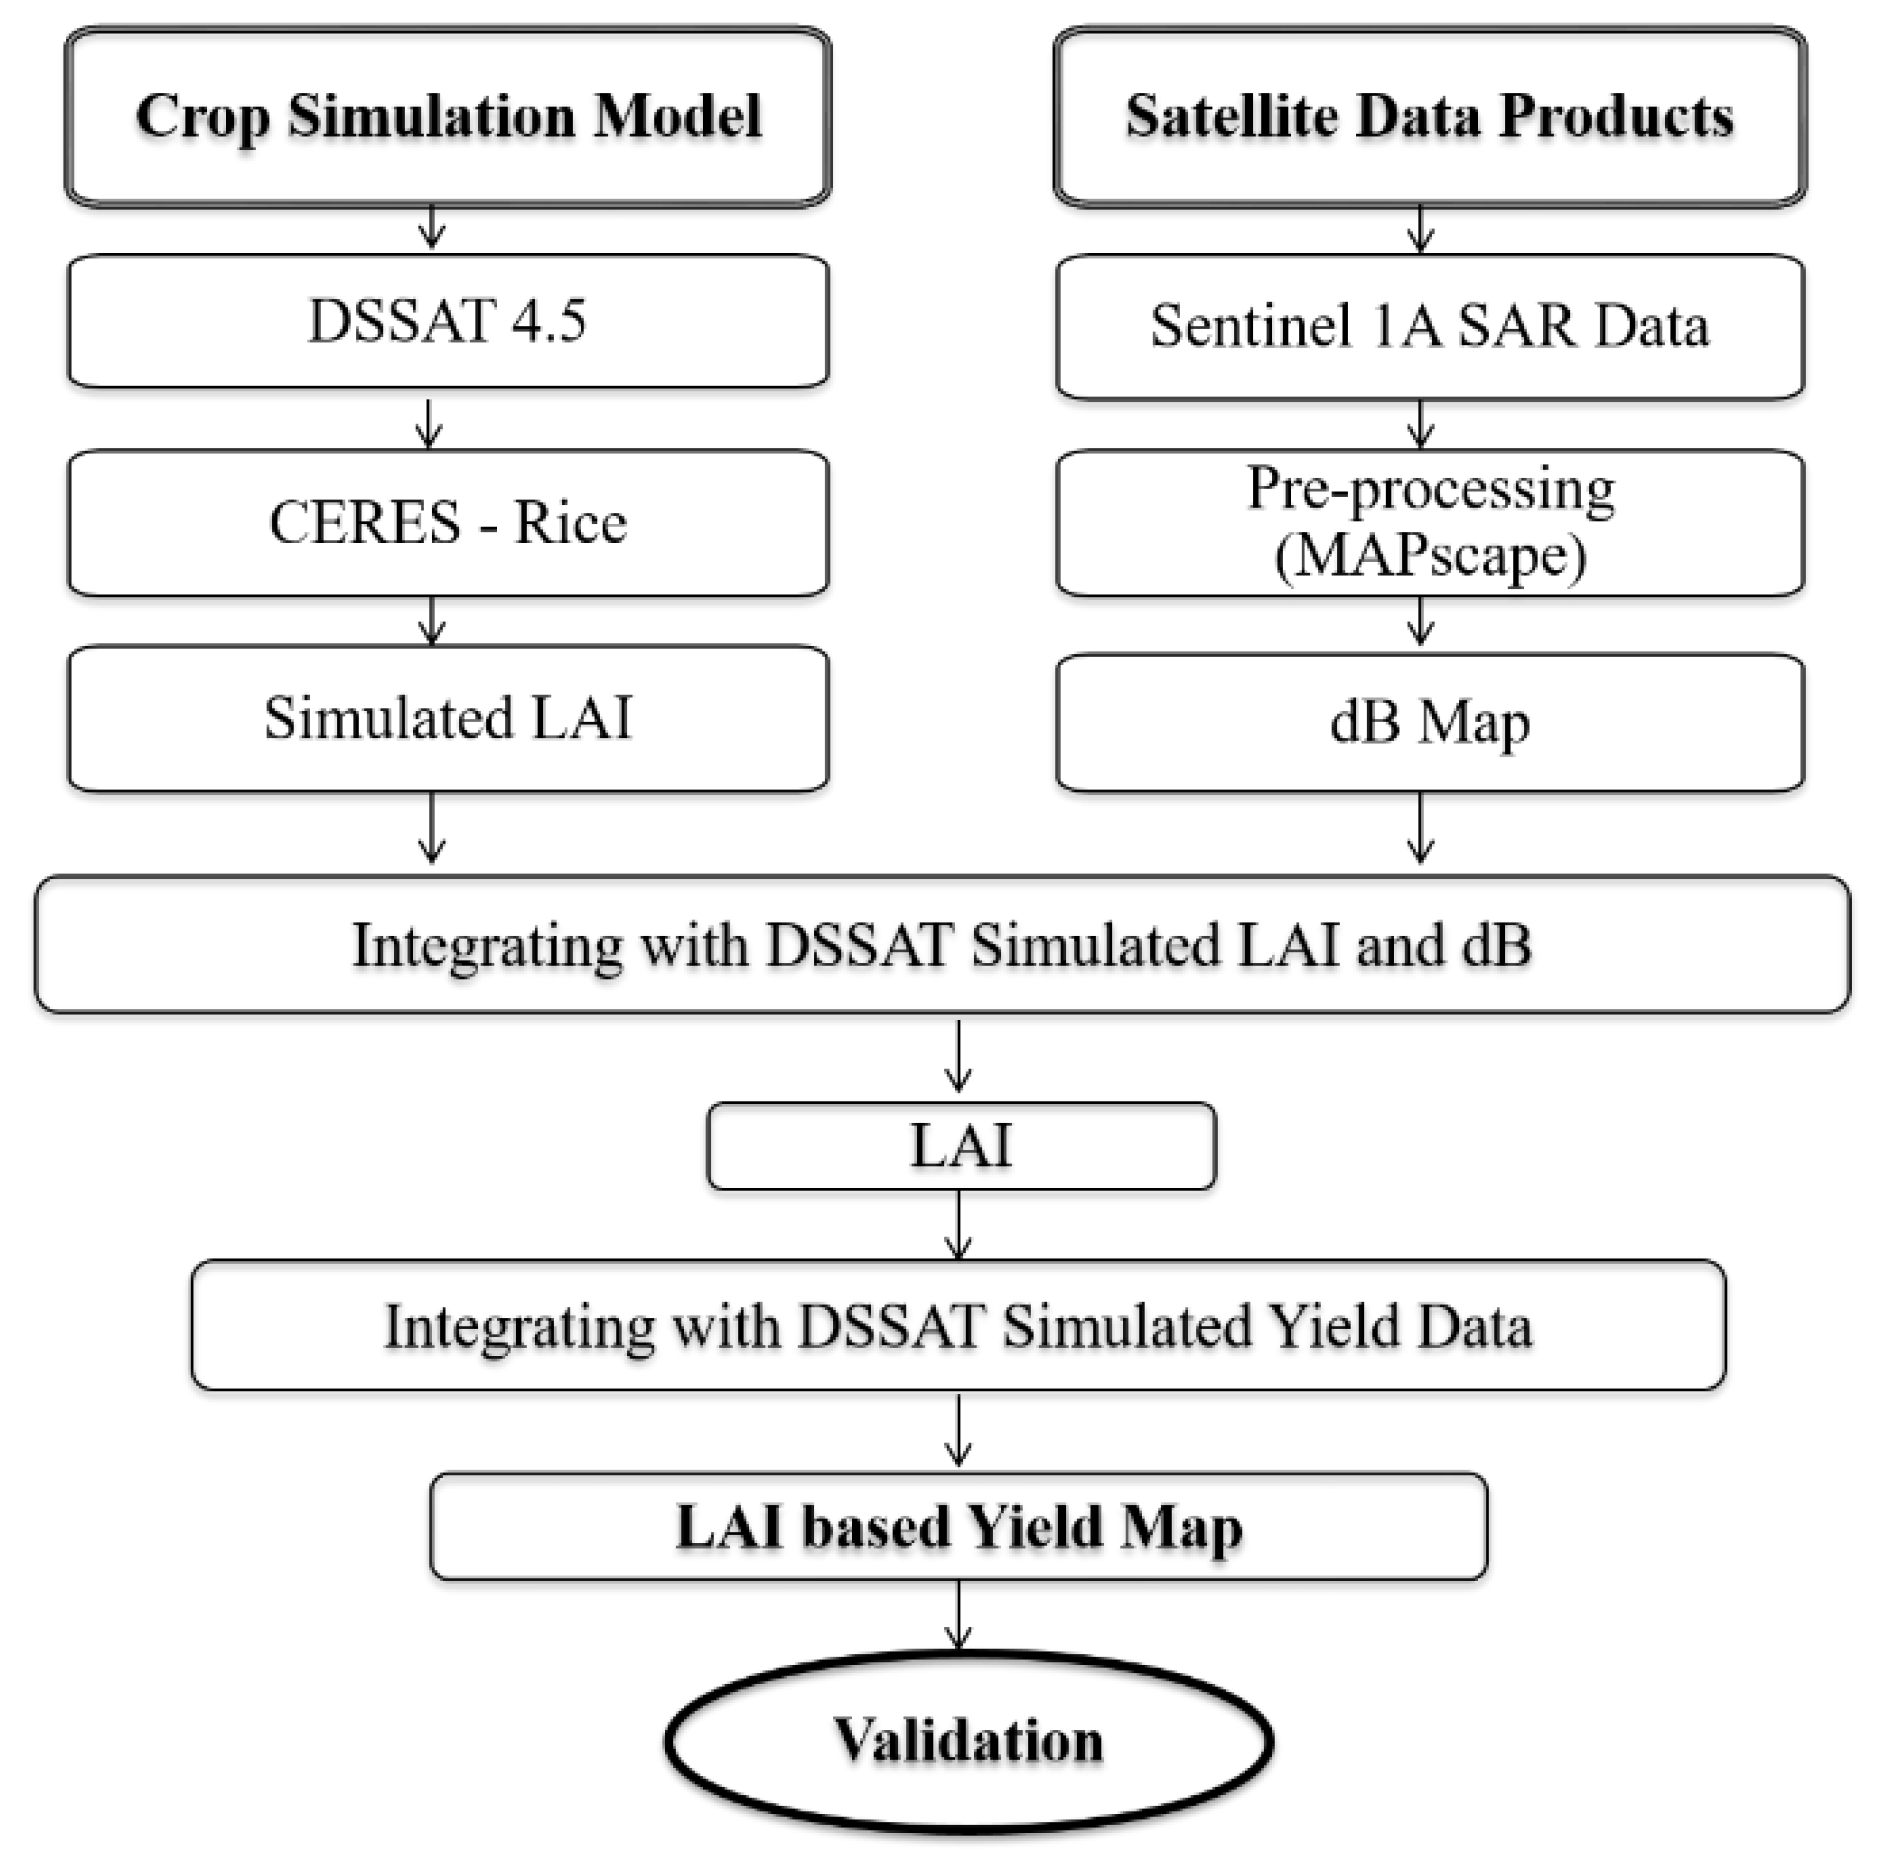
2.4. Integration of SAR Based Remote Sensing Products and Crop Growth Model

The CERES-Rice model available in DSSAT v 4.7.5 (DSSAT Foundation, Inc., Gainesville, FL, USA) simulates crop growth and development on a daily basis. All input data like weather, soil, cultivar/genotypes, and crop management files for the DSSAT crop simulation model were created through extraction from different sources. The model was calibrated in DSSAT using data collected during the 2020 rice crop growing season to determine the genetic coefficient for CR 1009, BPT 5204, and ADT (R) 45 utilizing spatial analysis mode. The crop growth model was validated by comparing the simulated yield to the observed yield. LAI values extracted from SAR data dB images were utilized to integrate the DSSAT simulated yield with remote sensing data (Figure 4).
Statistical evaluation and validation of products were done as an analysis of the degree of coincidence between estimated and observed values using R2, Root Mean Square Error (RMSE), Normalized Root Mean Square Error (NRMSE), and agreement %.

3. Results and Discussion

Spatial rice yields of the Thanjavur, Thiruvarur, Nagapattinam, and Mayiladuthurai districts of Cauvery Delta Region of Tamil Nadu were estimated using regression analysis of spectral indices, semi-physical approach, and integration of remote sensing products with DSSAT crop growth model.

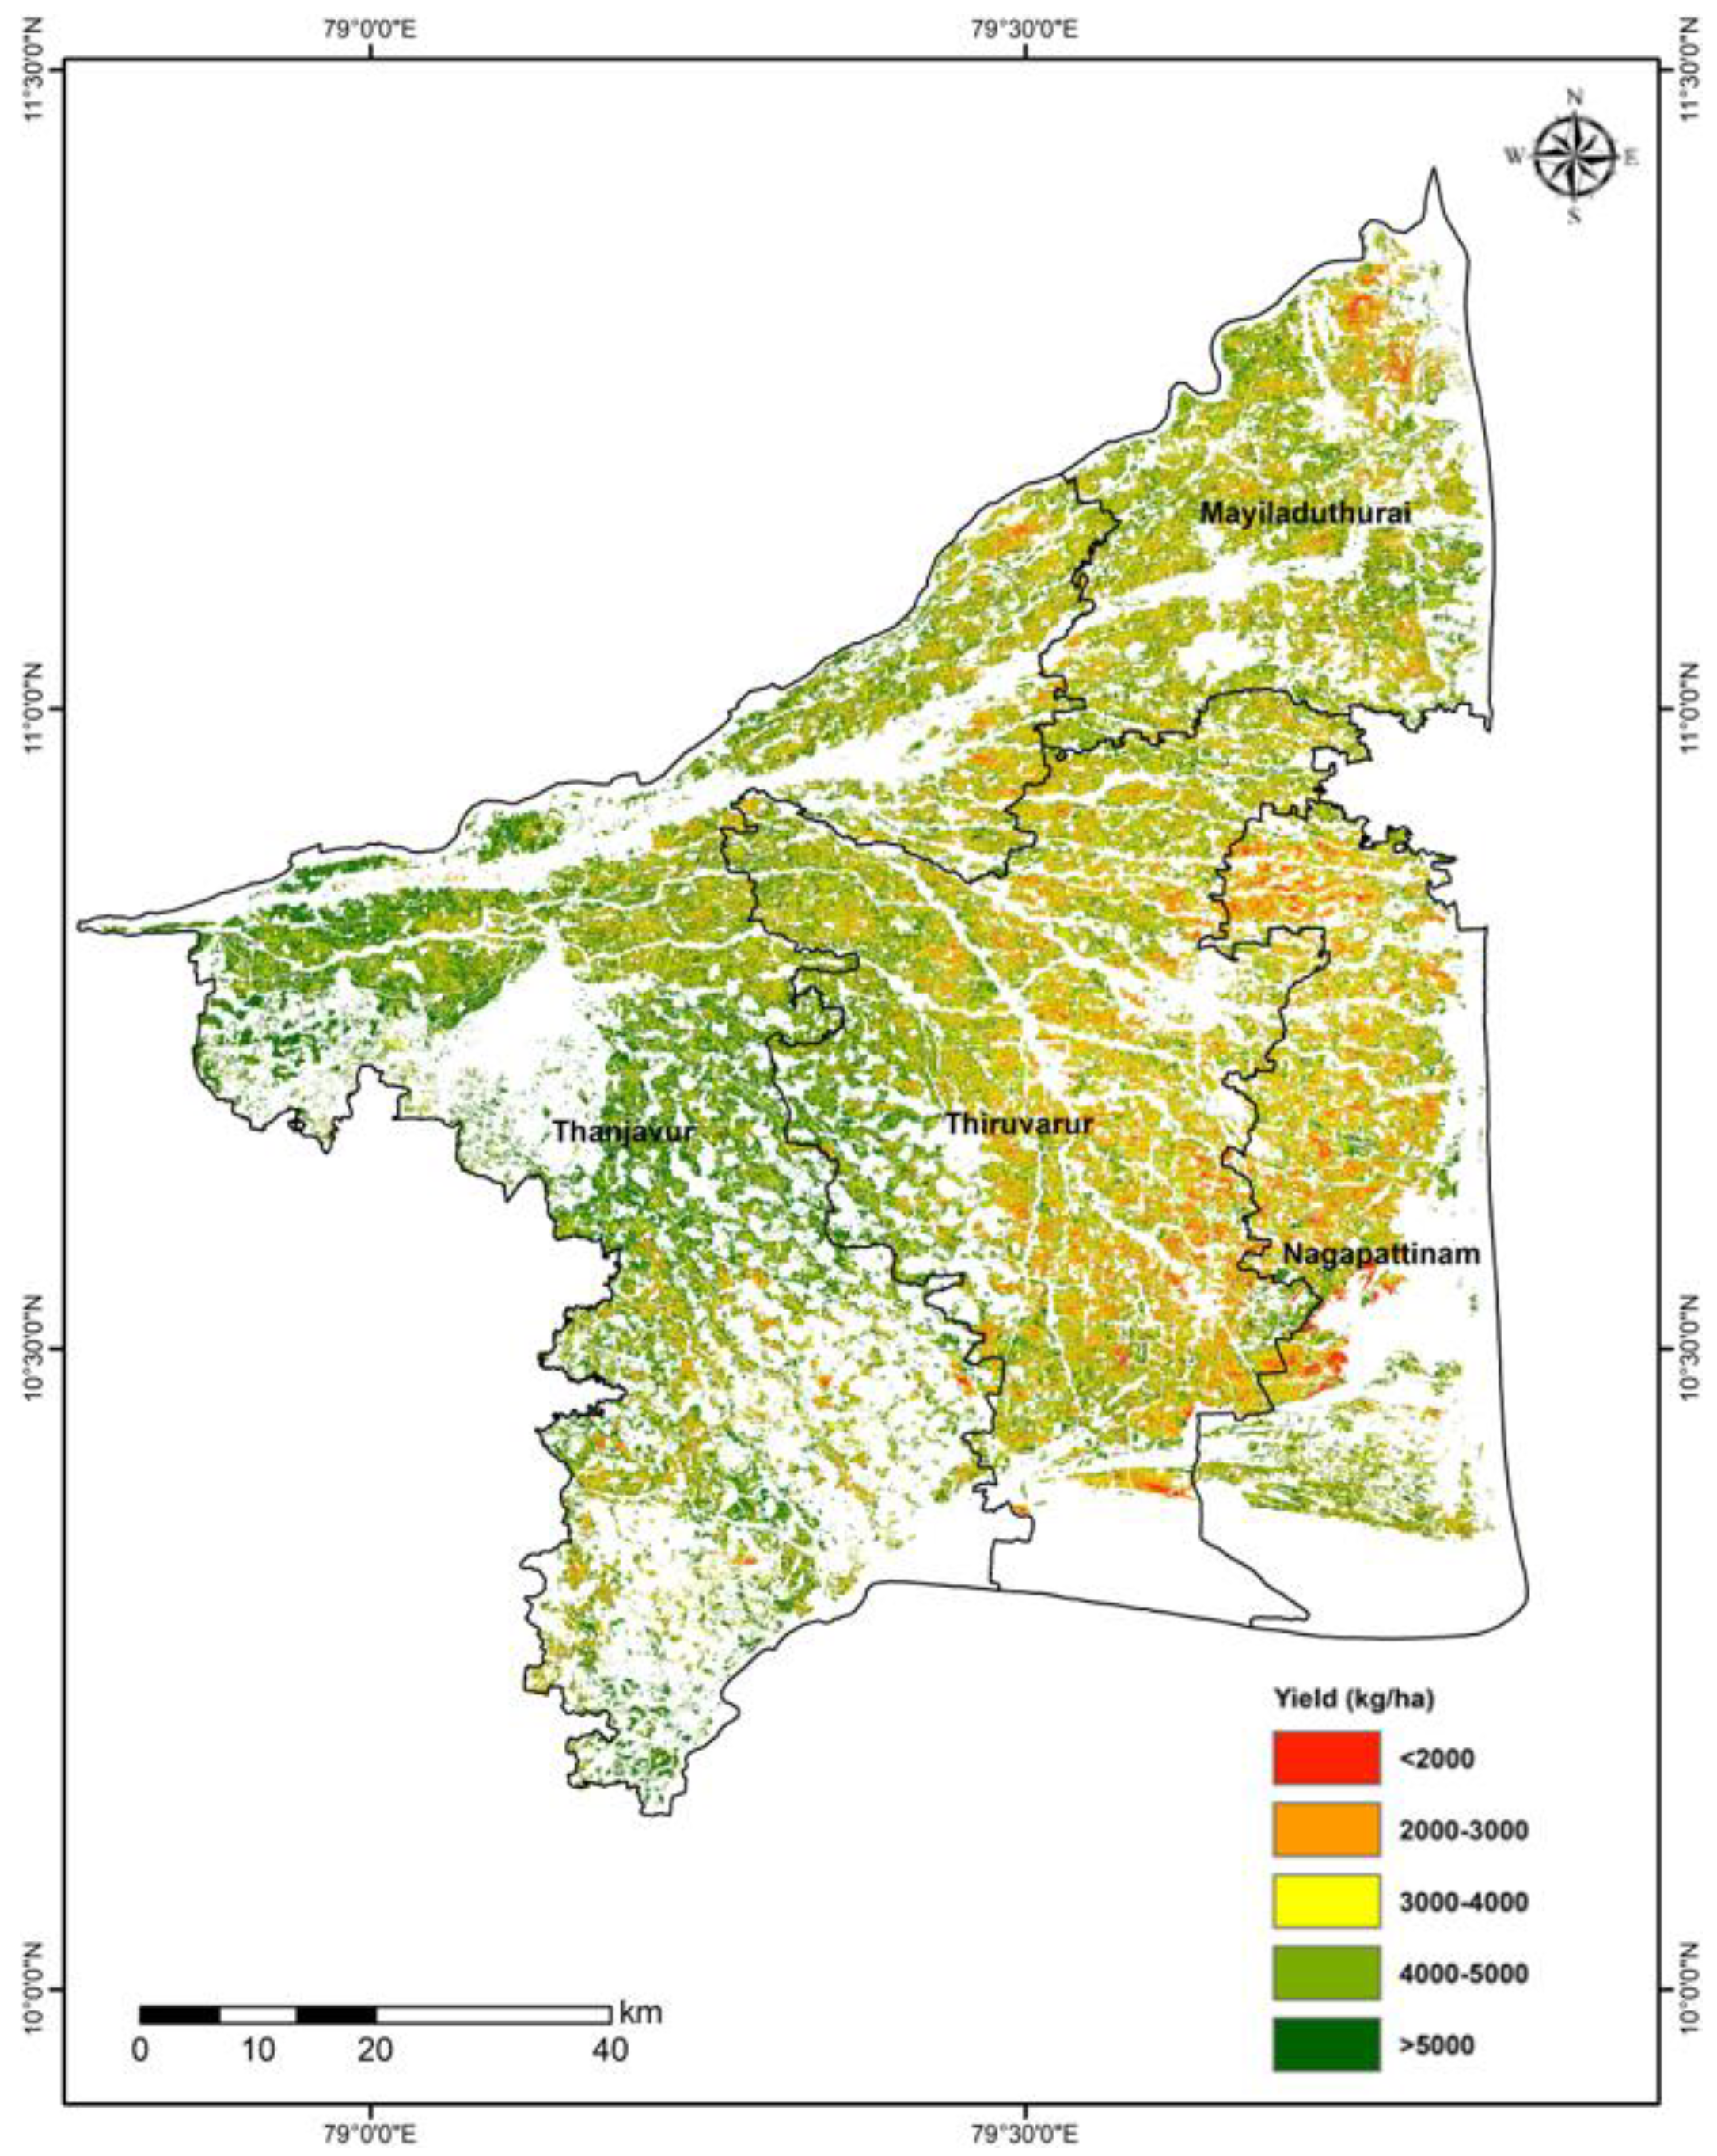
3.1. Rice Area Estimation

Sentinel 1A SAR satellite datasets were acquired at 12-day intervals with 20 m spatial resolution during the crop growing season for the study area. The backscattering coefficient and multi-temporal features were extracted and used to map the rice area.
The backscatter signature of rice showed a minimum dB value at agronomic flooding and a peak at the maximum tillering to the flowering stage, and a decline after that (Figure 5). At flooding, dB values ranging from −21.44 and −19.82 were recorded with a mean of −20.60. The mean maximum value at the peak flowering stage was −14.50 with a range of −15.99 to −13.28 in VH polarization. The increase in dB corresponding to crop growth from seedling to flowering stage ranged from 4.36 to 7.70 dB with a mean value of 6.10 dB during 2020.
The rice area map for the study area was derived from multi-temporal imagery of Sentinel 1A (Figure 6). Using the shapefiles of administrative boundaries, rice area maps and statistics were extracted for the districts of Thanjavur, Thiruvarur, Nagapattinam, and Mayiladuthurai. In the study area, a total of 379,767 ha of rice area were delineated during samba season 2020 from the multi-temporal Sentinel 1A SAR data using a parameterized classification integrating multi-temporal features. Among the districts, Thanjavur recorded the highest area of about 141,077 ha, followed by Thiruvarur, Mayiladuthurai, and Nagapattinam with 127,752 ha, 60,441 ha and 50,497 ha, respectively. District related samba rice area is given in Table 1.
In total, 200 ground truth points were collected randomly during the crop growing season in the study area for validation processes. The accuracy of the rice area map was assessed through the confusion matrix using the ground truth points to classify rice and non-rice pixels. Rice points were classified with an accuracy of 95.3%, while non-rice points were classified with an accuracy of 92.0%. Considering the efficiency of the methodology of mapping rice area with SAR data, the overall accuracy of the rice area map was 94.5%, with an average reliability of 92.0%. The Kappa Coefficient was 0.89, indicating good accuracy levels of the products.

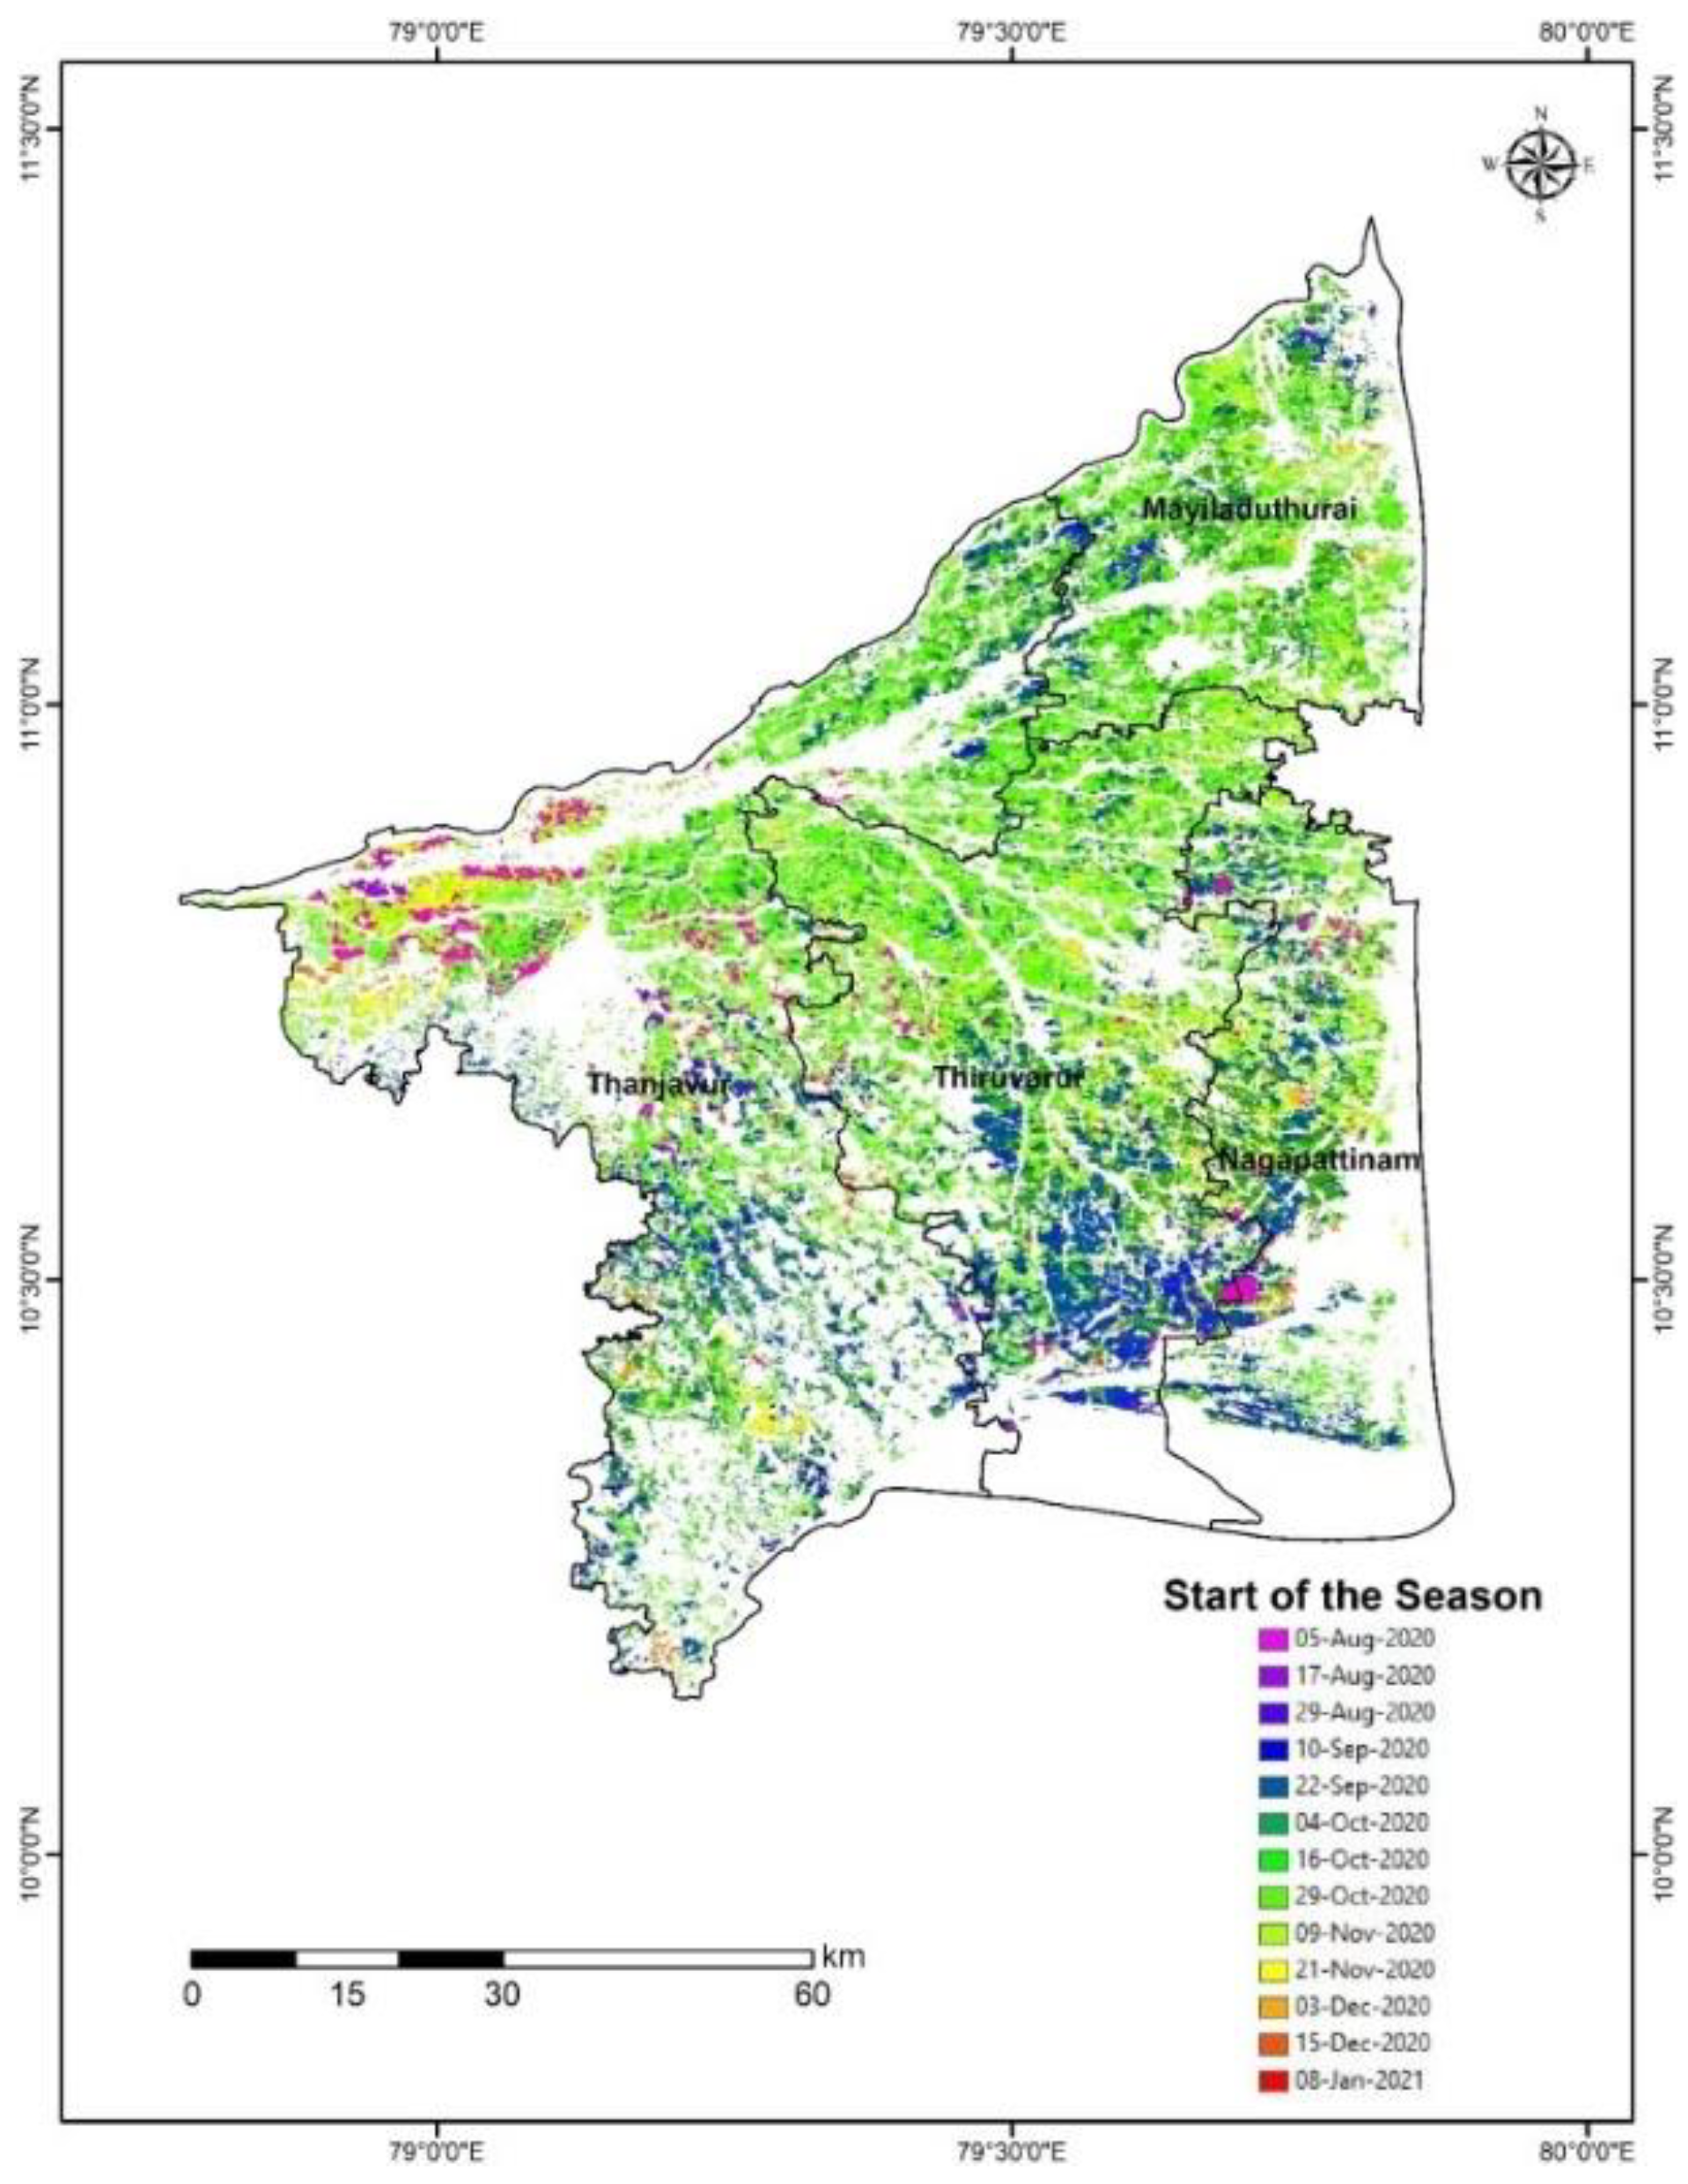
3.2. Start of the Season

Start of the season (SoS) maps and statistics were generated for the rice area using the threshold of minimum dB in the backscattering for each pixel from the Sentinel 1A SAR data and depicted in Figure 7. In the study area, the Cauvery Delta Region, with a total rice area of 379,767 ha, had the largest area of 96,935 ha at the SoS on 16 October 2020, followed by 4 October 2020 with an area of 67,353 ha. Planting had taken place in an area of 62,454 ha during SoS of 28 October 2020 and 56,831 ha during 22 September 2020, followed by 48,201 ha during SoS on 9 November 2020. An area of 3.31 lakh ha had the SoS between 22 September 2020 and 9 November 2020, indicating the major planting period for samba season. The early sown area accounted for 34,666 ha from 5 August 2020 to 10 September 2020. The late sown area accounted for 13,326 ha with SoS on 21 November, 3 December to 15 December 2020.

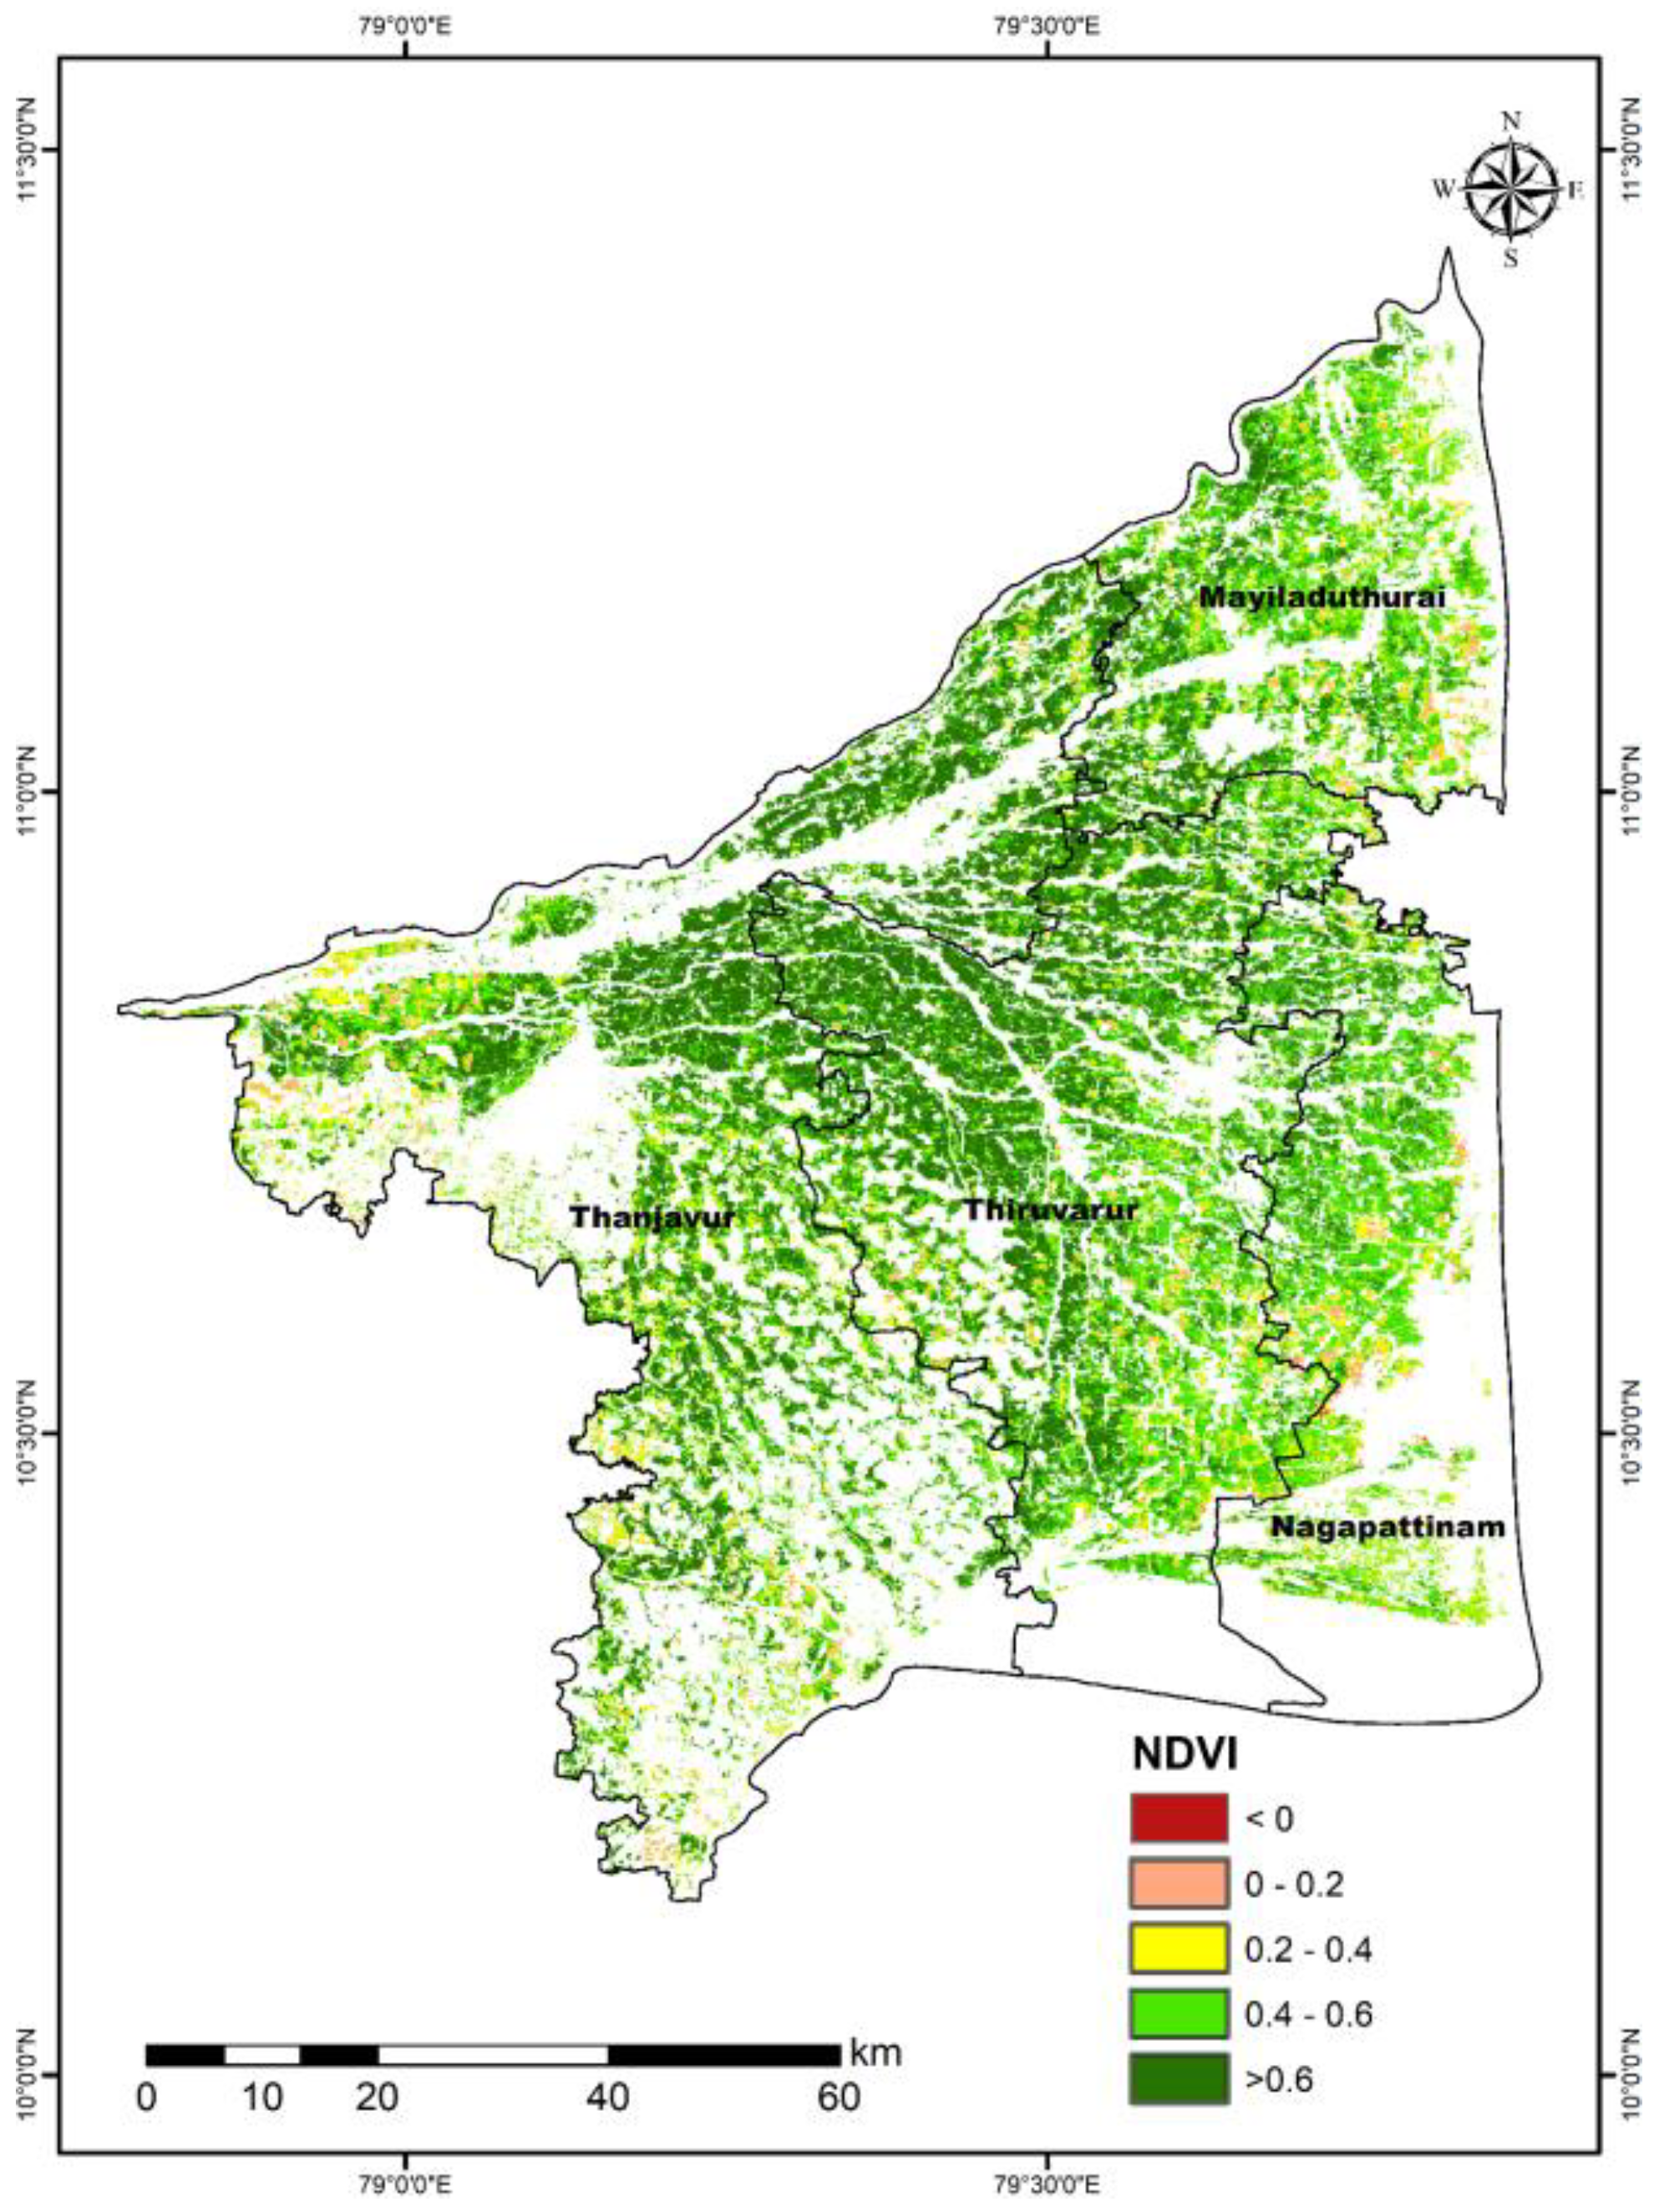
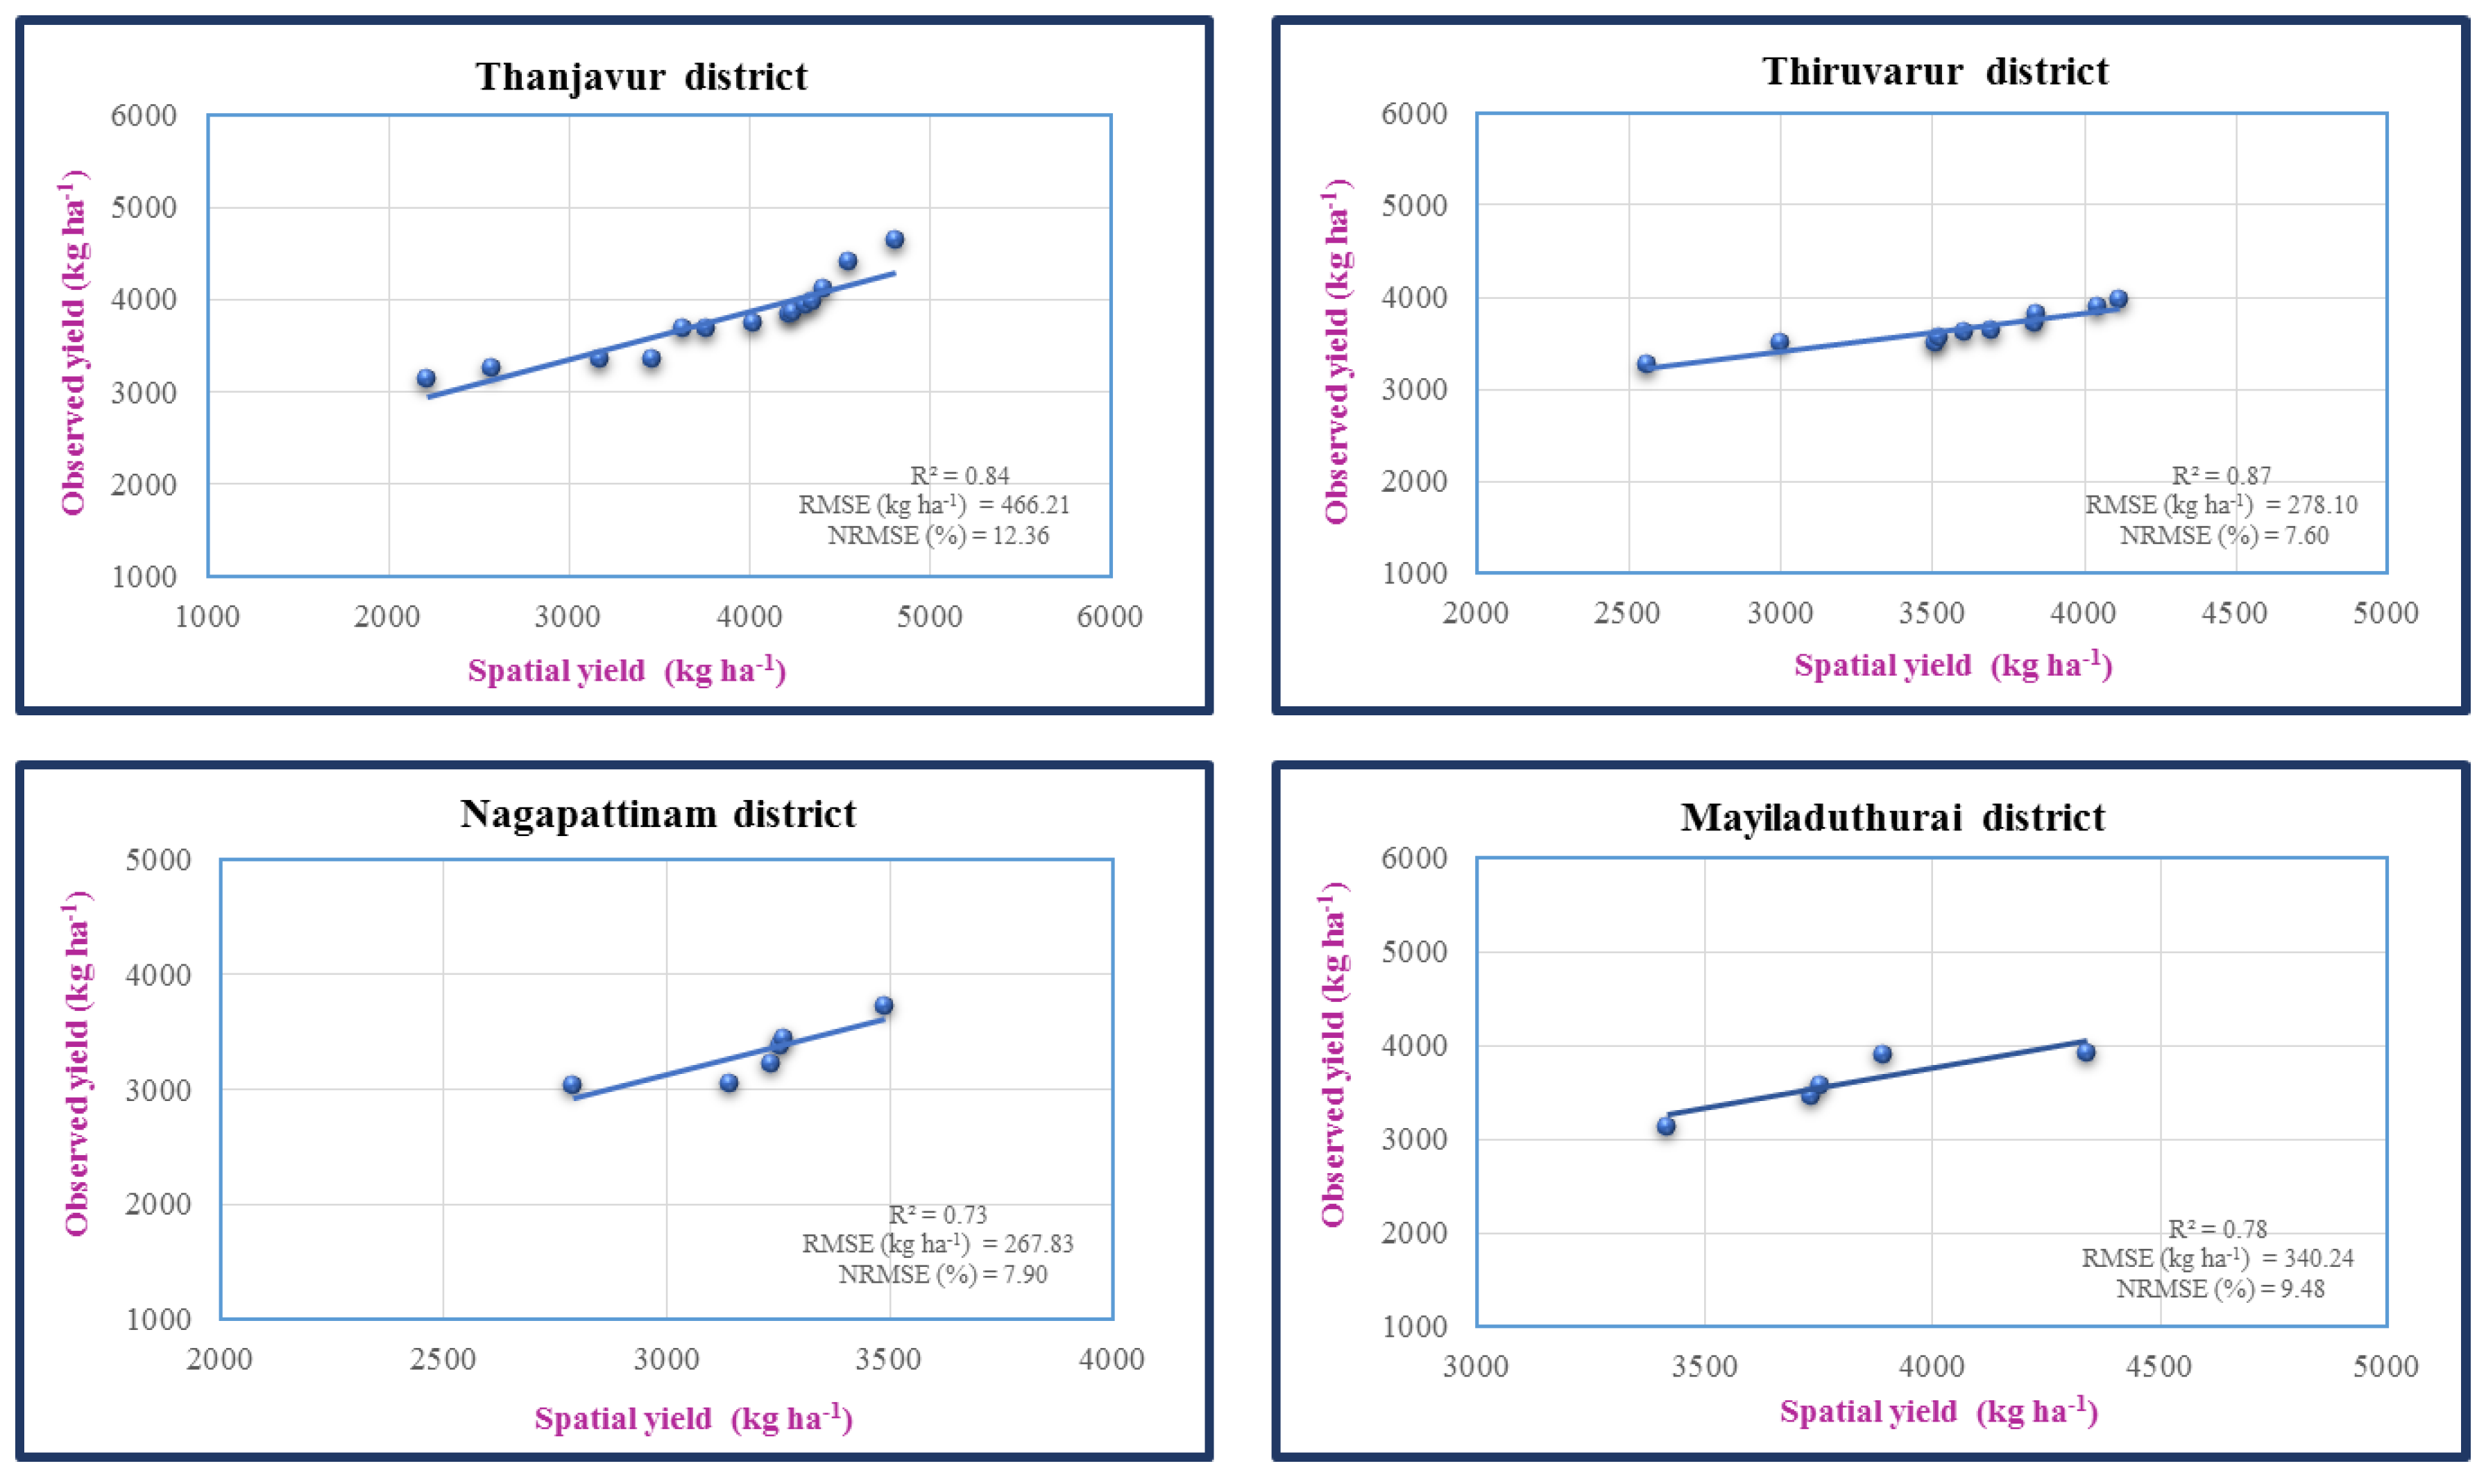
3.3. Estimated Yield by Using Regression Analysis of Spectral Indices

Crop health and productivity were measured indirectly using spectral vegetation indices. According to Groten [19], regressions based on averaged maximum values yielded better results than regressions based on NDVI integration throughout growth stages. The Thanjavur, Thiruvarur, and Mayiladuthurai districts mean NDVI values varied between 0.34 and 0.38, with a mean of 0.36. With a mean of 0.68, the maximum NDVI value was between 0.67 and 0.70 (Figure 8). LSWI is a useful tool for assessing early-season drought and a reliable predictor of vegetation dynamics and crop yield. The mean LSWI for the studied area is 0.27 to 0.31, with the mean LSWI ranging from 0.27 to 0.31. Rice has a maximum LSWI value of 0.36 to 0.41 and a lowest LSWI value of 0.12 to 0.19 (Figure 9). According to Prasetyo et al. [20], a yield model based on NDVI and LSWI proved reliable in estimating rice production. Siyal et al. [21] utilized peak vegetative rice growth period NDVI values and found strong correlations between peak NDVI and actual rice yield. Satir and Berberoglu [22] reported that NDVI positively correlated with crop yield.
Leaf Area Index maps and statistics were obtained using Sentinel 1A SAR data and the model proposed by Setiyono et al. [23]. The mean LAI observed for the research region ranged from 4.00 to 5.99, with a mean value of 5.40. Thiruvarur had the highest mean value of 5.74, while Nagapattinam had the lowest LAI score of 5.10 (Figure 10). Zhou et al. [24] estimated rice grain yield based on the LAI value and concluded that LAI was a reliable indicator for estimating yield. Setiyono et al. [25] used LAI obtained from SAR data to simulate rice yield from the ORYZA crop model.
According to Maloom et al. [26], regression analysis is a valuable tool for developing yield prediction models. Spectral indices based on regression analysis resulted in a mean rice yield of 3654 kg ha−1 in the study area. The highest rice yield of 3905 kg ha−1 was registered in the Thanjavur district, followed by Mayiladuthurai, Thiruvarur, and Nagapattinam districts with the values of 3826, 3652, and 3234 kg ha−1, respectively (Figure 11) (Table 2). The mean agreement between estimated and observed yield at the district level was found between 87.64 to 92.40, with a mean of 90.52. The mean R2, RMSE, and NRMSE were 0.81, 340.24 kg ha−1, and 9.48%, respectively.

3.4. Estimated Yield by Using a Semi-Physical Approach

NPP was the product of PAR, fAPAR, radiation use efficiency, water stress, and temperature stress. Photosynthetically Active Radiation was observed by plants which help to assess the crop growing conditions at any crop growth stage. The PAR value ranges from 150 to 350 MJ m−2. Maximum PAR was observed in August 2020, ranging from 278 to 334 MJ m−2, while minimum PAR was recorded in November 2020, ranging from 153 to 177 MJ m−2 (Figure 12). The incoming solar radiation was relatively low in November and December. The fraction of Absorbed Photosynthetically Active Radiation gives real-time information on crop growth conditions during crop growing seasons; fAPAR varies with ecosystem and time. The fAPAR value ranged between 0 and 1 (Figure 13). Water stress and temperature stress affect crop growth and productivity if they persist for a long time. Water and temperature were optimum for rice growth throughout the crop growing season (Figure 14). Radiation Use Efficiency was the capacity of the plant to convert radiation into dry matter; it varies with cultivars and growth stages. RUE value for rice was found to be 2.9 g MJ−1. Peng et al. [27] adopted a RUE value of 2.9 g MJ−1 at all stages of rice to predict rice yield.
The rice grain yield was calculated from the total NPP and harvest index product, which was found to be 0.4. This approach resulted in a mean rice yield of 3076 kg ha−1. Thanjavur recorded the highest mean rice yield of 3438 kg ha−1, followed by Thiruvarur, Mayiladuthurai, and Nagapattinam districts with the value of 3216, 3000 and 2652 kg ha−1, respectively (Figure 15) (Table 2). The agreement between estimated and observed mean yields at the district level ranged from 80.46 to 89.49%, with a mean of 85.47. Mean R2, RMSE and NRMSE were 0.78, 532.74 kg ha−1 and 14.52%.

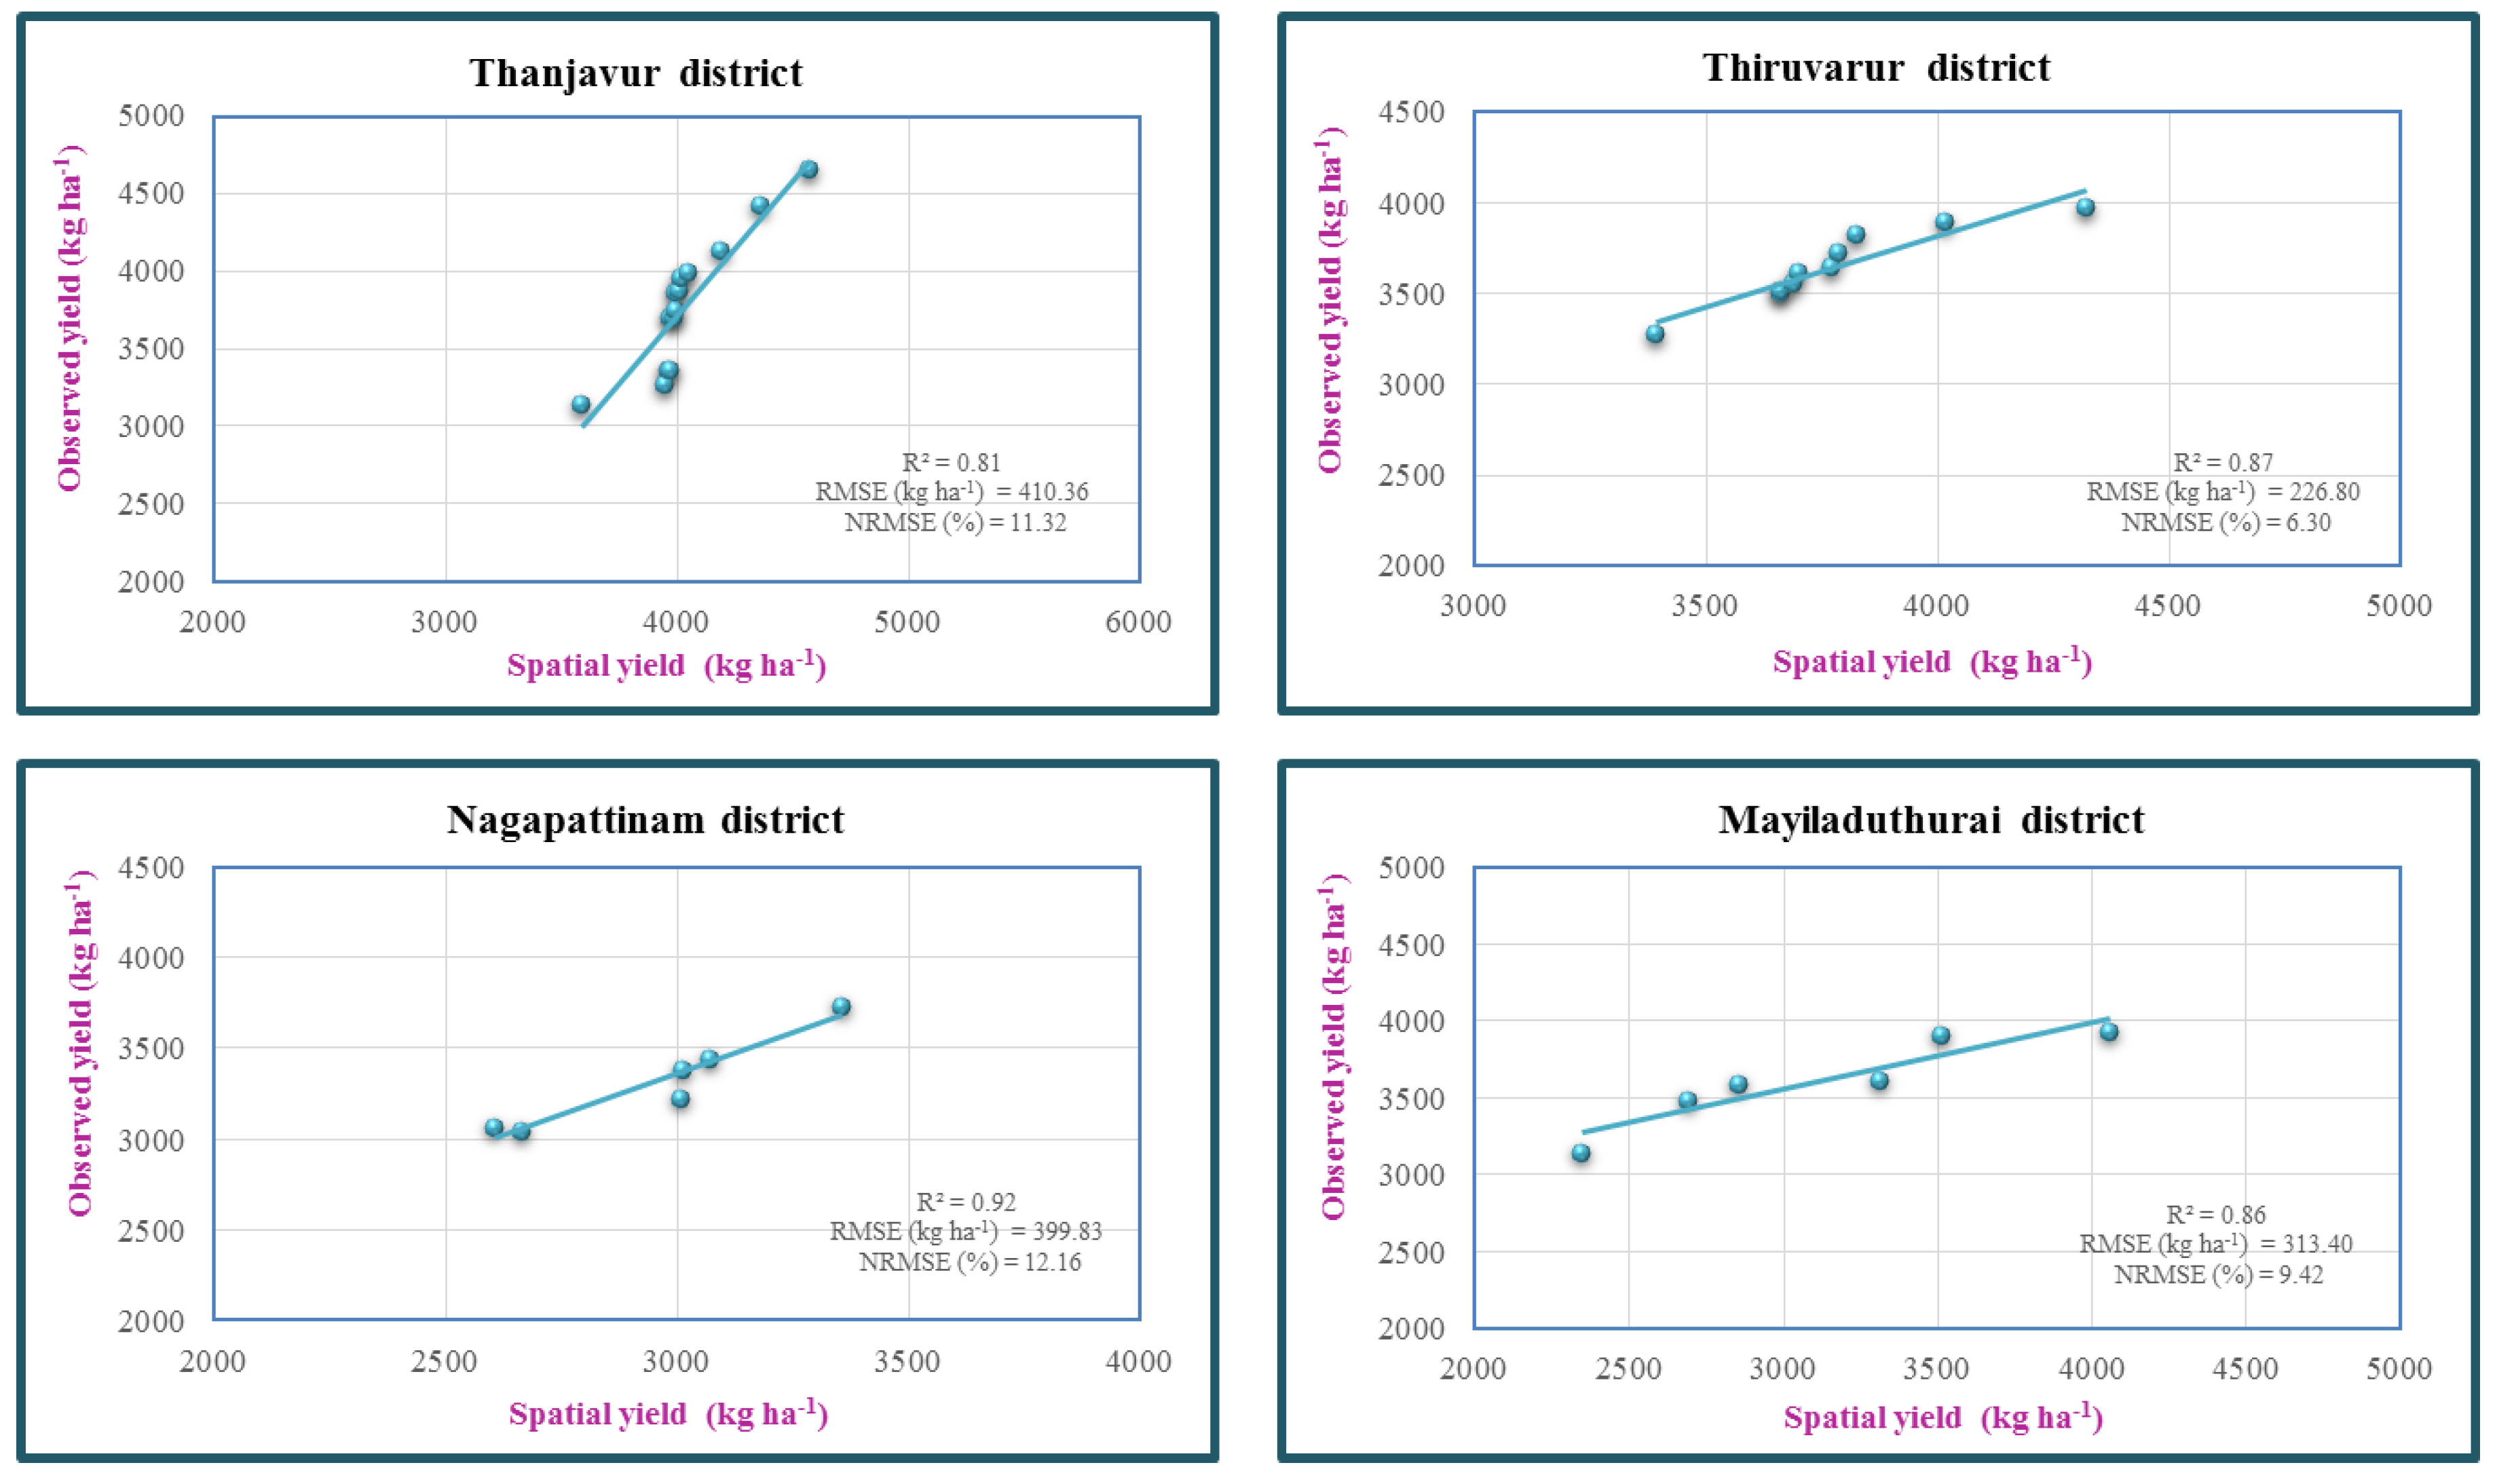
3.5. Estimated Yield by Using Integrating Remote Sensing Products with Crop Growth Model

The crop simulation model is a simple representation of a crop in relation to growth as influenced by different factors: variety, soil, weather, management, etc. In the present study, the CERES-Rice model was calibrated, tested, and validated to simulate rice yields as spatially influenced by these input factors.

3.5.1. Generation of Input Files for DSSAT

Weather File

The weather input files were generated for four districts in the study area using weathermen in DSSAT covering the Thanjavur, Thiruvarur, Nagapattinam, and Mayiladuthurai districts. The generated input files showed a range of mean maximum temperature from 29.14 to 30.22 °C, mean minimum temperature from 23.74 to 25.93 °C and mean solar radiation from 16.70 to 17.14 MJ m−2 day−1 (Figure 16). During the cropping period, rainfall of 1142 to 1297 mm was recorded in the study area.

Soil File

The input files for soil were generated with the parameters derived from soil analysis (Table 3). A total of 12 soil series were found in the study area. The input files generated using ‘S’ build showed that the sand content ranged from 21.40 to 85.90%, the silt content ranged from 1.00 to 29.60%, clay content ranged from 8.40 to 54.10%, bulk density ranged from 1.28 to 1.65 g cm−3, and the soil organic carbon content ranged from 0.04 to 1.43%.

Calibration and Derivation of Genetic Coefficient

The genetic coefficients were estimated by incorporating varietal characters of crop cultivars in the model. An inbuilt program called GENCALC in DSSAT calculated genetic coefficients. The genetic coefficients derived for CR 1009, BPT 5204, and ADT (R) 45 varieties of rice in the model using identical management and other conditions are given in Table 4.
One solution for expanding point-based simulations to a large area is integrating remote sensing data and crop simulation models by using remotely sensed products as a proxy for crop variables. In this study, remotely sensed LAI values were spatially assimilated with DSSAT model inputs as a driving variable. Rice crop growth and development parameters were simulated in DSSAT using the CERES-Rice model. The growth simulation model simulated parameters were days to emergence, days to anthesis, days to physiological maturity, yield at harvest, leaf area index, harvest index, and biomass. Suitable regression models were used to generate LAI from dB images of Sentinel 1A SAR, with simulated LAI from DSSAT models at the spatial level derived from various monitoring fields across the study area as an explanatory variable for spatial yield estimation. By integrating remotely sensed data with the DSSAT CERES-Rice model-simulated data, a rice yield map was generated for the study area, resulting in a mean rice yield of 3855 kg ha−1. Thanjavur recorded the highest mean yield of 4012 kg ha−1, and Nagapattinam recorded the lowest yield of 3684 kg ha−1. Mayiladuthurai and Thiruvarur recorded the mean yield of 3944 and 3781 kg ha−1, respectively (Figure 17) (Table 2). Deka et al. [28] reported that the CERES-Rice model is capable of estimating growth stages and rice yield accurately.
Satellite-derived yields compared to observed yields had agreeable results. The agreement at the district level was found to range from 88.97 to 93.12%. Mean R2, RMSE, and NRMSE were 0.86, 331.97 kg ha−1 and 9.43%, respectively. Similarly, Guo et al. [11] estimated the rice yield for early and late mature rice with NRMSE of 11.38% and 15.27% indicated good model performance. Rugira et al. [29] simulated maize yield as 7692 kg ha−1, 8642 kg ha−1, and 9506 kg ha−1 with NRMSE of 9.06, 5.8, and 4.1% for 2017, 2018, and 2019, respectively. Pazhanivelan et al. [30] utilized SAR derived LAI to spatially estimate rice yield by integrating with the ORYZA crop growth model. It was shown that the combination of satellite-derived LAI and simulated growth parameters of rice could improve the micro-level yield predictions. Variability in weather, soil, and rainfall contributed to rice LAI variability at field level and explained the yield variability.

3.6. Comparison of Different Spatial Yield Estimation Techniques

Among the different yield estimation methods, the remote sensing products with crop growth model recorded the highest mean R2 value of 0.86, followed by the spectral indices-based regression analysis with 0.81 (Figure 18 and Figure 19). Similarly, remote sensing with crop modelling registered the highest agreement % of 90.57, followed closely by spectral indices-based regression analysis with the agreement of 90.52%. The semi-physical approach resulted in an R2 value of 0.78, RMSE of 532.74, and NRMSE of 14.52 with 85.47% agreement. The result indicated that both rice yield estimation techniques of integrating remote sensing products with the DSSAT crop growth model and spectral indices-based regression analysis could be utilized precisely for spatial yield estimation of rice.

4. Conclusions

The multidate Sentinel 1A SAR data can be recommended for estimating rice area, Start of Season and days of agronomic flooding at regional scale. Rice area maps and statistics of Cauvery delta districts of Tamil Nadu were generated with an accuracy of 94.5% within an area of 379,767 ha. A Start of Season (SoS) map was derived from satellite data showing rice emergence dates in the Cauvery delta region. In the study area, 12 SoS dates were generated and the major planting season was found to be between 22 September and 9 November during samba 2020. District-wise mean rice yields for spectral indices-based regression analysis, semi-physical approach, and integrating remote sensing products with the DSSAT model were estimated to be 3654, 3076, and 3855 kg ha−1, respectively. Among the three spatial yield estimation techniques, both integrating remote sensing products with DSSAT crop growth model and spectral indices-based regression analysis had R2 more than 0.80, NRMSE of less than 10.00%, and agreement of more than 90% compared to the semi-physical approach, indicating that these two approaches could be utilized for spatial rice yield estimation. Therefore, we conclude that spatial rice yield estimation techniques, namely integrating remote sensing products with DSSAT model and spectral indices-based regression analysis, can be recommended to estimate rice yield spatially. The resultant spatial rice yields have the potential to be utilized in import/export policy decisions, production forecasting and quicker payouts of crop insurances.

Author Contributions

Conceptualization, S.P.; Data curation, N.S.S. and K.M.; Formal analysis, S.P., V.G., R.T. and K.R.; Funding acquisition, S.P. and M.K.Y.; Investigation, R.T. and A.P.S.; Methodology, S.P., V.G., R.T. and E.D.Q.; Project administration, S.P. and M.K.Y.; Resources, R.K., K.R. and E.D.Q.; Software, N.S.S., R.K. and E.D.Q.; Supervision, S.P., V.G., R.K. and A.P.S.; Validation, R.T. and N.S.S.; Visualization, N.S.S.; Writing—original draft, S.P. and R.T.; Writing—review & editing, N.S.S., K.R., A.P.S., K.M. and E.D.Q. All authors have read and agreed to the published version of the manuscript.

Funding

This research was funded by World Bank and GIZ, Germany and The APC was funded by Deutsche Gesellschaft für Internationale Zusammenarbeit (Grant number 81278637).

Acknowledgments

This work is part of Tamil Nadu Irrigated Agriculture Modernization Project (TNIAMP), GIZ-ICRI Project and Space Technology for Groundnut area and Yield estimation for insurances (SUFALAM) projects. SAR data were provided by the European Space Agency (ESA) from Sentinel-1. Some maps in this manuscript are overlaid on Google Maps layers, © Google, 2014. The boundaries, colours, denominations, and other information shown on any map in this work do not imply any judgment on the part of the authors or their institutes concerning the legal status of any territory or the endorsement or acceptance of such boundaries.

Conflicts of Interest

The authors declare no conflict of interest.

References

  1. Paul, G.C.; Saha, S.; Hembram, T.K. Application of phenology-based algorithm and linear regression model for estimating rice cultivated areas and yield using remote sensing data in Bansloi River Basin, Eastern India. Remote Sens. Appl. Soc. Environ. 2020, 19, 100367. [Google Scholar] [CrossRef]
  2. Deka, R.L.; Hussain, R.; Singh, K.K.; Rao, V.U.M.; Balasubramaniyam, R.; Baxla, A.; Rao, V.; Balasubramaniyam, R. Rice phenology and growth simulation using CERES-rice model under the agro-climate of upper brahmaputra valley of Assam. Mausam 2016, 67, 591–598. [Google Scholar] [CrossRef]
  3. Dwivedi, M.; Saxena, S.; Ray, S.S. Assessment of rice biomass production and yield using semi-physical approach and remotely sensed data. Int. Arch. Photogramm. Remote Sens. Spat. Inf. Sci. 2019, 42, 217–222. [Google Scholar] [CrossRef]
  4. Groten, S.M. NDVI-crop monitoring and early yield assessment of burkina faso. Int. J. Remote Sens. 1993, 14, 1495–1515. [Google Scholar] [CrossRef]
  5. Guo, Y.; Wu, W.; Bryant, C.R. Quantifying spatio-temporal patterns of rice yield gaps in double-cropping systems: A case study in Pearl River Delta, China. Sustainability 2019, 11, 1394. [Google Scholar] [CrossRef]
  6. He, Z.; Li, S.; Wang, Y.; Dai, L.; Lin, S. Monitoring rice phenology based on backscattering characteristics of multi-temporal RADARSAT-2 datasets. Remote Sens. 2018, 10, 340. [Google Scholar] [CrossRef]
  7. Holecz, F.; Barbieri, M.; Collivignarelli, F.; Gatti, L.; Nelson, A.; Setiyono, T.D.; Boschetti, M.; Manfron, G.; Brivio, P.A.; Quilang, E.J.; et al. An Operational Remote Sensing based Service for Rice Production Estimation at National Scale. Proc. Living Planet Symp. 2013. [Google Scholar] [CrossRef]
  8. Huang, J.; Gómez-Dans, J.L.; Huang, H.; Ma, H.; Wu, Q.; Lewis, P.E.; Liang, S.; Chen, Z.; Xue, J.H.; Wu, Y.; et al. Assimilation of remote sensing into crop growth models: Current status and perspectives. Agric. For. Meteorol. 2019, 276, 107609. [Google Scholar] [CrossRef]
  9. Kumar, S.; Saxena, S.; Dubey, S.K.; Chaudhary, K.; Sehgal, S.; Ray, S.S. Analysis of wheat crop forecasts, in India, generated using remote sensing data, under FASAL project. Int. Arch. Photogramm. Remote Sens. Spat. Inf. Sci. 2019, XLII-3/W6, 223–228. [Google Scholar] [CrossRef]
  10. Ma, Y.; Xing, M.; Ni, X.; Wang, J.; Shang, J.; Zhou, J. Using a modified water cloud model to retrive leaf area index (LAI) from RADARSAT-2 SAR data over an agriculture area. In Proceedings of the International Geoscience and Remote Sensing Symposium (IGARSS) 2018, Valencia, Spain, 22–27 July 2018. [Google Scholar] [CrossRef]
  11. Maloom, J.M.; Saludes, R.B.; Dorado, M.A.; Cruz, P.C.S. Development of a GIS-Based Model for Predicting Rice Yield. Philipp. J. Crop Sci. 2014, 39, 8–19. [Google Scholar]
  12. McNairn, H.; Shang, J. A review of multitemporal synthetic aperture radar (SAR) for crop monitoring. In Multitemporal Remote Sensing: Methods and Applications; Ban, Y., Ed.; Springer International Publishing: Cham, Switzerland, 2016; Volume 20, pp. 317–340. [Google Scholar] [CrossRef]
  13. Pazhanivelan, S.; Kannan, P.; Mary, P.C.N.; Subramanian, E.; Jeyaraman, S.; Nelson, A.; Setiyono, T.; Holecz, F.; Barbieri, M.; Yadav, M. Rice crop monitoring and yield estimation through COSMO Skymed and TerraSAR-X: A SAR-based experience in India. Int. Arch. Photogramm. Remote Sens. Spat. Inf. Sci. 2015, 40, 85–92. [Google Scholar] [CrossRef]
  14. Peng, D.; Huang, J.; Li, C.; Liu, L.; Huang, W.; Wang, F.; Yang, X. Modelling paddy rice yield using MODIS data. Agric. For. Meteorol. 2014, 184, 107–116. [Google Scholar] [CrossRef]
  15. Prasetyo, Y.; Sukmono, A.; Aziz, K.W.; Prakosta Santu Aji, B.J. Rice Productivity Prediction Model Design Based on Linear Regression of Spectral Value Using NDVI and LSWI Combination on Landsat-8 Imagery. IOP Conf. Ser. Earth Environ. Sci. 2018, 165, 012002. [Google Scholar] [CrossRef]
  16. Quicho, E.; Setiyono, T.; Maunahan, A.; Satapathy, S.; Ganesan, P.; Kumar, K.; Reddy, R.; Romuga, G.; Garcia, C.; Rala, A.; et al. Application of remote sensing and crop modeling for rice in Andhra Pradesh, India. In Proceedings of the 40th Asian Conference on Remote Sensing (ACRS 2019): Progress of Remote Sensing Technology for Smart Future, Daejeon, Korea, 14–18 October 2019. [Google Scholar]
  17. Raich, J.W.; Rastetter, E.B.; Melillo, J.M.; Kicklighter, D.W.; Steudler, P.A.; Peterson, B.J.; Grace, A.L.; Moore, B.; Vorosmarty, C.J. Potential net primary productivity in South America: Application of a global model. Ecol. Appl. 1991, 1, 399–429. [Google Scholar] [CrossRef] [PubMed]
  18. Rugira, P.; Ma, J.; Zheng, L.; Wu, C.; Liu, E. Application of DSSAT CERES-maize to identify the optimum irrigation management and sowing dates on improving maize yield in northern china. Agronomy 2021, 11, 674. [Google Scholar] [CrossRef]
  19. Satir, O.; Berberoglu, S. Crop yield prediction under soil salinity using satellite derived vegetation indices. Field Crop. Res. 2016, 192, 134–143. [Google Scholar] [CrossRef]
  20. Setiyono, T.D.; Holecz, F.; Khan, N.I.; Barbieri, M.; Quicho, E.; Collivignarelli, F.; Maunahan, A.; Gatti, L.; Romuga, G.C. Synthetic Aperture Radar (SAR)-based paddy rice monitoring system: Development and application in key rice producing areas in Tropical Asia. IOP Conf. Ser. Earth Environ. Sci. 2017, 54, 012015. [Google Scholar] [CrossRef]
  21. Setiyono, T.D.; Quicho, E.D.; Holecz, F.H.; Khan, N.I.; Romuga, G.; Maunahan, A.; Garcia, C.; Rala, A.; Raviz, J.; Collivignarelli, F.; et al. Rice yield estimation using synthetic aperture radar (SAR) and the ORYZA crop growth model: Development and application of the system in South and South-east Asian countries. Int. J. Remote Sens. 2018, 40, 8093–8124. [Google Scholar] [CrossRef]
  22. Setiyono, T.D.; Quicho, E.D.; Gatti, L.; Campos-Taberner, M.; Busetto, L.; Collivignarelli, F.; García-Haro, F.J.; Boschetti, M.; Khan, N.I.; Holecz, F. Spatial rice yield estimation based on MODIS and Sentinel-1 SAR data and ORYZA crop growth model. Remote Sens. 2018, 10, 293. [Google Scholar] [CrossRef] [Green Version]
  23. Siyal, A.A.; Dempewolf, J.; Becker-Reshef, I. Rice yield estimation using Landsat ETM + Data. J. Appl. Remote Sens. 2015, 9, 095986. [Google Scholar] [CrossRef]
  24. Son, N.T.; Chen, C.F.; Chen, C.R.; Chang, L.Y.; Chiang, S.H. Rice yield estimation through assimilating satellite data into a crop simumlation model. Int. Arch. Photogramm. Remote Sens. Spat. Inf. Sci. 2016, 8, 993–996. [Google Scholar] [CrossRef]
  25. Srivastava, R.; Halder, D.; Swain, D.; Panda, R. Prediction of rice yield with DSSAT crop simulation model and multiple linear regression analysis. In Proceedings of the International Symposium on “New-Dimensions in Agrometeorology for Sustainable Agriculture”, Pantnagar, Uttrakhand, India, 16–18 October 2014. [Google Scholar]
  26. Wijesingha, J.S.J.; Deshapriya, N.L.; Samarakoon, L. Rice crop monitoring and yield assessment with MODIS 250 m gridded vegetation product: A case study in Sa Kaeo Province, Thailand. Int. Arch. Photogramm. Remote Sens. Spat. Inf. Sci. 2015, XL-7/W3, 121–127. [Google Scholar] [CrossRef]
  27. Xiao, X.; Hollinger, D.; Aber, J.; Goltz, M.; Davidson, E.A.; Zhang, Q.; Moore, B. Satellite-based modeling of gross primary production in an evergreen needleleaf forest. Remote Sens. Environ. 2004, 89, 519–534. [Google Scholar] [CrossRef]
  28. Xiao, X.; Lu, Y. Temporal Series Crop Classification Study in Rural China Based on Sentinel-1 SAR Data. In Proceedings of the 2019 6th Asia-Pacific Conference on Synthetic Aperture Radar (APSAR), Xiamen, China, 26–29 November 2019. [Google Scholar] [CrossRef]
  29. Yang, S.; Shen, S.; Li, B.; Tan, B. Study on ENVISAT ASAR data assimilation in rice growth model for yield estimation. In Atmospheric and Environmental Remote Sensing Data Processing and Utilization V: Readiness for GEOSS III 7456; SPIE: Bellingham, WA, USA, 2009. [Google Scholar] [CrossRef]
  30. Zhou, X.; Zheng, H.B.; Xu, X.Q.; He, J.Y.; Ge, X.K.; Yao, X.; Cheng, T.; Zhu, Y.; Cao, W.X.; Tian, Y.C. Predicting grain yield in rice using multi-temporal vegetation indices from UAV-based multispectral and digital imagery. ISPRS J. Photogramm. Remote Sens. 2017, 130, 246–255. [Google Scholar] [CrossRef]
Figure 1. Study area in Cauvery Delta Region of Tamil Nadu.
Agronomy 12 02008 g001
Figure 2. Sequence of stages of Sentinel 1A satellite data processing for rice area estimation.
Agronomy 12 02008 g002
Figure 3. Flow chart depicting the methodology of the semi-physical approach-based rice yield estimation.
Agronomy 12 02008 g003
Figure 4. Flow chart depicting methodology of integration of remote sensing products and DSSAT model.
Agronomy 12 02008 g004
Figure 5. dB curves for rice at monitoring fields during 2020.
Agronomy 12 02008 g005
Figure 6. Rice area map of Cauvery Delta Region during 2020.
Agronomy 12 02008 g006
Figure 7. Start of the Season (SoS) map for rice in Cauvery Delta Region during 2020.
Agronomy 12 02008 g007
Figure 8. NDVI map for rice crops in Cauvery Delta Region.
Agronomy 12 02008 g008
Figure 9. LSWI map for rice crops in Cauvery Delta Region.
Agronomy 12 02008 g009
Figure 10. LAI map for rice crops in Cauvery Delta Region.
Agronomy 12 02008 g010
Figure 11. Rice yield map of Cauvery Delta Region using regression analysis.
Agronomy 12 02008 g011
Figure 12. Total PAR (MJ m−2) map of Cauvery Delta Region during cropping period (2020–2021).
Agronomy 12 02008 g012
Figure 13. Mean fAPAR map of Cauvery Delta Region during cropping period (2020–2021).
Agronomy 12 02008 g013
Figure 14. Mean water stress map of Cauvery Delta Region during cropping period (2020–2021).
Agronomy 12 02008 g014
Figure 15. Rice Yield map of Cauvery Delta Region using semi-physical approach.
Agronomy 12 02008 g015
Figure 16. (a) Weather chart generated from DSSAT for Keelaiyur. (b) Weather chart generated from DSSAT for Kilvelur. (c) Weather chart generated from DSSAT for Kollidam. (d) Weather chart generated from DSSAT for Kuthalam.
Agronomy 12 02008 g016
Figure 17. Rice yield map of Cauvery Delta Region using remote sensing integrated with DSSAT.
Agronomy 12 02008 g017
Figure 18. Validation of district-wise mean rice yield in different Cauvery delta districts from spectral indices-based regression analysis.
Agronomy 12 02008 g018
Figure 19. Validation of district-wise mean rice yield in different Cauvery delta districts from integration of RS and DSSAT.
Agronomy 12 02008 g019
Table 1. District-wise samba rice area (ha) estimated using SAR data.
S. No.BlockArea (in ha)
1Thanjavur141,077
2Thiruvarur127,752
3Nagapattinam50,497
4Mayiladuthurai60,441
Cauvery Delta Region379,767
Table 2. District wise rice yield of Cauvery delta region using different spatial yield estimation approaches.
S. No.DistrictsObserved Yield (kg/ha)I
Spectral Indices-Based Yield (kg/ha)
II
Semi-Physical Approach-Based Yield (kg/ha)
III
Integration of RSandDSSAT Based Yield (kg/ha)
Method Having Best Agreement with Observed Yield
1.Thanjavur3792390534384012Spectral indices
2.Thiruvarur3650365232163781Spectral indices
3.Nagapattinam3317323426523684Spectral indices
4.Mayiladuthurai3611382630003944Spectral indices
Cauvery Delta Region3592365430763855Spectral indices
Table 3. Soil file generated and used in DSSAT Crop Simulation Model.
Soil SeriesSLBSLLLSDULSSATSRGFSSKSSBDMSLOCSLCLSLSISLCFSLHWSCEC
Chennapatti100.1220.1670.2041.0000.121.560.2040.2012.3047.505.6018.00
310.1630.2290.2740.6640.061.470.1044.6020.2035.206.5022.00
520.1710.2400.2850.4360.061.460.0545.7021.3033.106.2025.80
820.1950.2750.3200.2620.061.420.0448.3024.3027.406.0026.70
Kalattur200.0380.0720.1471.0002.591.520.3113.7022.8063.505.3010.00
710.1930.2640.2930.4030.061.390.6350.2015.5034.408.3030.80
1040.1890.2560.2880.1740.061.430.3050.4015.8033.808.3027.90
Kivalur150.2180.3170.3571.0000.061.340.5149.0027.5023.407.6025.60
550.2060.2950.3420.4970.061.390.1048.5027.4024.108.0032.30
1000.2290.3240.3620.2120.061.360.1952.1026.5021.408.1034.00
1450.2250.3060.3340.0860.061.390.2254.1020.2025.708.2034.80
Marungulam120.1140.1580.1991.0000.121.540.3638.2012.1049.605.208.00
330.1270.1790.2170.6380.121.480.7239.1013.4047.505.706.90
500.1450.2020.2370.4360.061.480.5442.8014.3042.905.007.40
900.1680.2330.2650.2470.061.430.6346.1015.3038.605.207.90
Mudukulathur130.0210.0350.0811.0002.591.610.2412.609.3078.106.6011.60
400.0340.0480.0870.5890.431.650.2221.502.5075.506.7014.00
680.0510.0690.1100.3400.431.610.3227.202.6070.206.8019.40
Nagapattinam340.0750.1040.1461.0000.431.530.6832.004.8063.207.0012.60
460.1760.2350.2590.4490.061.440.6050.0010.3039.707.4013.20
1020.1770.2520.2970.2280.061.420.3045.3022.5032.207.4017.90
Nannilam340.0750.1040.1461.0000.431.530.6832.004.8063.207.0012.60
460.1760.2350.2590.4490.061.440.6050.0010.3039.707.4013.20
1020.1770.2520.2970.2280.061.420.3045.3022.5032.207.4017.90
Niravi160.1420.1960.2331.0000.061.510.3142.6014.8042.606.2014.60
360.1370.1810.2070.5950.121.540.3645.207.3047.507.2014.20
590.1300.1710.2000.3870.121.550.3344.007.1048.907.4019.00
800.1270.1690.2000.2490.121.560.2443.008.5048.507.6022.00
1020.1330.1870.2310.1620.061.530.1540.2017.4042.408.2025.20
1660.1460.1990.2360.0690.061.530.1243.6015.3041.108.2028.60
Pattukottai80.0130.0230.0581.0006.111.480.908.405.7085.906.6014.70
260.0530.0720.1121.0000.431.570.5428.201.2070.605.1016.20
560.0660.0920.1370.4400.431.550.5729.405.8064.906.6017.40
1400.0650.0910.1360.1410.431.560.4829.405.8064.906.2018.00
Punniyavayal100.0850.1200.1671.0000.431.550.4032.3010.4057.206.9038.00
500.1130.1600.2020.5490.121.520.5137.1013.2049.707.2039.20
720.1220.1730.2140.2950.121.500.5738.1014.4047.508.6036.80
1100.1470.2070.2440.1620.061.470.5442.1016.2041.608.9042.00
Vedaranyam150.1160.1640.2001.0000.121.401.4237.907.8054.306.2019.00
290.1820.2670.3010.6440.061.311.4343.8020.2036.006.3027.80
540.2260.3130.3370.4360.061.320.8953.0018.6028.406.2032.00
870.2400.3450.3730.2440.061.281.0051.6024.8023.006.6033.60
1280.2140.3220.3660.1160.061.281.0046.0029.6024.406.5034.00
SLB—Depth until base of layer (cm); SLLL—Lower limit of plant extractable soil water; SDUL—Drained upper limit; SSAT—Saturated upper limit; SRGF—Root growth factor (0–1 scale); SSKS—Saturated hydraulic conductivity (cm h−1); SBDM—Bulk density (moist) (g cm−3); SLOC—Soil organic carbon concentration (%); SLCL—Clay (%); SLSI—Silt (%); SLCF—Coarsefraction(%); SCEC—Cationic exchange capacity (cmol kg−1); SLHW—pH in water.
Table 4. Genetic coefficient (GC) of rice varieties generated and used in DSSAT CERES-Rice model.
Coefficient CodeDescriptionGenetic Coefficient
CR 1009BPT 5204ADT(R) 45
P1Time period (expressed as growing degree days [GDD] in °C above a base temperature of 9 °C from seedling emergence during which the rice plant is not responsive to changes in photoperiod. This period is also referred to as the basic vegetative phase of the plant.850783365
P2OCritical photoperiod or the longest day length (in hours) at which the development occurs at a maximum rate. At values higher than P2O developmental rate is slowed, hence there is delay due to longer day lengths.11.411.411.4
P2RExtent to which phasic development leading to panicle initiation is delayed (expressed as GDD in °C) for each hour increase in photoperiod above P2O.130164200
P5Timeperiod in GDD °C) from beginning of grain filling (3 to 4 days after flowering) to physiological maturity with a base temperature of 9 °C.540556480
G1Potential spikelet number coefficient as estimated from the number of spikelets per g of main culm dry weight (less lead blades and sheaths plus spikes) at anthesis.554636
G2Single grain weight (g) under ideal growing conditions, i.e., nonlimiting light, water, nutrients, and absence of pests and diseases.0.2000.1800.280
G3Tillering coefficient (scaler value) relative to IR64 cultivar under ideal conditions.1.001.001.00
G4Temperature tolerance coefficient.1.001.001.00
Publisher’s Note: MDPI stays neutral with regard to jurisdictional claims in published maps and institutional affiliations.

