
Investigating Stability Parameters for Agronomic and Quality Traits of Durum Wheat Grown under Mediterranean Conditions


1
Department of Vegetable Crops, Agricultural Research Institute, Athalassa, Nicosia 1516, Cyprus
2
Department of Plant Improvement, Agricultural Research Institute, Athalassa, Nicosia 1516, Cyprus
3
Department of Agricultural Science, Biotechnology and Food Science, Cyprus University of Technology, 30 Archbishop Kyprianos Street, Lemesos 3036, Cyprus
*
Authors to whom correspondence should be addressed.
Agronomy 2022, 12(8), 1774; https://doi.org/10.3390/agronomy12081774
Submission received: 15 June 2022
/
Revised: 20 July 2022
/
Accepted: 24 July 2022
/
Published: 28 July 2022
(This article belongs to the Special Issue Current Status and Future Prospects of Genotype X Environment Interaction in Plant Breeding and Crop Adaptation)
Abstract
:Durum wheat in the Mediterranean grows under rainfed conditions, where unpredictable climatic conditions result in substantial variation in grain yield and quality. Climate change intensifies Genotype × Environment interactions and urges breeders to escalate their efforts to breed cultivars combining high performance and stability. The current study aimed to appraise the relations between twelve stability parameters derived by different statistical models for yield, yield-related and quality traits of durum wheat grown under Mediterranean conditions. Stability parameters were estimated in two experiments of twenty and sixteen cultivars, respectively. The parameters were categorized into three groups. Group A included Additive Main Effect and Multiplicative Interaction (AMMI)-derived parameters (ASV and AWAI), Wrickle’s ecovalence (Wi), Shukla’s stability variance (σ2), and the nonparametric parameters Si(1) and Si(2). Group B included regression parameters (bi, Bi_A), Coefficient of Variance (CV), and Superiority measure (Pi). Group C encompassed deviation from regression parameters (s2di-DJi) when the heterogeneity of the slope was significant. Correlations between stability parameters for different traits and the between stability parameters and the traits per se were modest. Stability parameters of Group B had higher repeatability for grain yield. The results of the present study contribute to the adjustment of durum wheat breeding strategies.
1. Introduction
Durum wheat is a major crop for the Mediterranean basin [1]. This area is also the most significant import market and the largest consumer of durum wheat products [2,3]. The crop has been closely linked with regional diet and tradition. Further to pasta production, durum wheat is widely used for the preparation of bread, couscous, bourghul, and other traditional products [4].
The primary goal of all breeding programs has been the increase of grain yield. Studies have shown that genetic gains in grain yield are mainly achieved by increasing harvest index and number of seeds/m2, the latter trait being determined by number of spikes/m2 and seeds/spike [5,6]. Adjusting the major components of plant phenology, that is plant height and days to anthesis (or heading), according to the targeting environment has been also crucial [2,7]. Moreover, breeding efforts target quality traits that are desirable for the industry, such as yellow pigment concentration, protein content, gluten quality and volume weight [8,9,10].
Durum wheat in the Mediterranean basin usually grows under rainfed conditions. Sowing occurs on November-December and the plants complete their cycle by the end of spring. Plants often experience drought and heat stress events during their development resulting in yield loss and, to lesser extent, affecting quality [9,10,11]. The Mediterranean basin is severely affected by climate change [12], increasing yield uncertainty, deteriorating quality, and impairing genetic gains [1]. On the other hand, breeders need to intensify their efforts to meet the demand arising from the growing population and the quality requirements of the industry. Thus, the ultimate goal of plant breeders is to breed cultivars combining high performance and stability for agronomic and quality traits. However, major challenges arise from the significant Genotype × Environment interactions (G × E) resulting from the differential response of genotypes at different environments [13,14]. The large proportion of G × E, which is usually associated with cross over interactions, impairs breeders’ goal for high yielding and stable cultivars across environments [15,16]. This goal is especially cumbersome in the Mediterranean area due to high annual variation in grain yield and quality traits resulting from the unpredictable climate conditions [1,9,10].
A number of statistical models have been developed for analyzing G × E interactions [13]. The genotypic specific response in different environments (norm of reaction) can be captured by stability parameters [7,16,17]). The most widely used model for analyzing G × E is the linear model with the regression of individual genotypes’ mean values over environmental means [18]. The slope of the regression of individual genotypes and their deviation from regression can be used as stability parameters [19,20]. Later, bilinear models have been introduced which are more efficient to overcome the limitations of the linear regression models [21] because they can capture a higher percentage of the variability in G × E interactions [13,16]. The most widely used bilinear model is the Additive Main Effect and Multiplicative Interaction (AMMI) model [22]. Stability parameters derived from AMMI models have been proposed [23], among them AMMI Stability Value (ASV) [24] and AMMI wide adaptation Index (AWAI) [25]. Several other parametric stability parameters have been introduced including the Wrickle’s ecovalence (Wi) [26], Shukla’s stability variance (σ2) [27], Coefficient of Variance (CV) [28], and Superiority measure (Pi) [29]. Stability parameters based on non-parametric procedures have also been proposed [30,31] having advantages over parametric procedures, including that no assumptions about the distribution of the data are needed and that they are less sensitive to bias caused by outliers [13,17].
Lin et al. [32] categorized stability parameters into three types. Type I includes genotypes with small variance among environments and corresponds to the static (biological) stability. Type II refers to genotypes of which their response to environments is parallel to the mean response of all genotypes and corresponds to the dynamic (agronomic) stability. Type III is related to genotypes’ residual mean square from the linear regression models. Stability parameters related to the regression coefficients on linear models can correspond to the biological or the agronomic concept depending on how a stable genotype is defined. Agronomic stability is more relevant to breeders’ objectives for yield, nevertheless, biological stability may deserve consideration for quality traits [15].
Most of the published literature focuses on stability for grain yield. However, stability for yield, yield components, phenotypic (heading data and plant height), and quality traits may be related and may interact with the traits per se [33,34,35,36,37]. Significant correlations between stability parameters related to different stability concepts or between stability parameters and the traits per se implies the existence of trade-offs that need to be considered by plant breeders [38]. Therefore, the relations between agronomic and quality traits and their stability deserves further investigation.
The calculation of stability parameters depends on the set of genotypes and environments included in the analysis [21,32,39]. Furthermore, stability for wheat yield, heading date, and plant height might have more complex architecture than the traits per se [40]. The complex genetic structure of traits’ stability implies that their expression can be substantially affected by the environment and might exhibit lower repeatability and heritability than the traits per se. Such attributes can limit the usefulness of stability parameters in plant breeding programs [41]. Despite its importance for plant breeding, the repeatability of the stability parameters has not been exhaustively studied [39,42,43].
The current study aimed to appraise the relations between twelve stability parameters derived by different statistical models for agronomic and quality traits of durum wheat grown under Mediterranean conditions. Stability parameters were estimated in two experiments of twenty and sixteen modern cultivars, respectively, with diverse origin. The correlations between stability parameters for different traits and the traits per se were investigated to shade light on plausible implications in their use and existence of trade-offs that need to be considered by plant breeders. The repeatability of the stability parameters has been marginally tackled by the literature. Therefore, the relations between stability parameters derived from eight cultivars that were common to the two experiments were investigated as a measure of their repeatability.
2. Materials and Methods
2.1. Plant Material
In Experiment One, twenty durum wheat cultivars (Triticum turgidum subsp. durum) of diverse origin, released for cultivation over the last 40 years, were selected (Table 1). These cultivars were found to be genetically diverse in previous studies applying molecular markers [44,45]. Six cultivars were bred by the Cypriot National Breeding Program and represent the main commercial cultivars grown in Cyprus over the last forty years. The other fourteen cultivars were released by other breeding programs, targeting areas with similar climatic conditions. ‘Ourania’ and ‘Hekabe’ are the cultivars currently grown in Cyprus combining high yield and good quality traits [46]. ‘Omrabi5’, ‘Waha’, and ‘Korifla’ are among the most widely grown cultivars released by ICARDA and are usually used as checks to international nurseries [25]. ‘Simeto’, ‘Claudio’, ‘Iride’, and ‘Svevo’ are appreciated for their quality traits, e.g., kernel weight, volume weight, gluten quality and protein content, respectively [47]. ‘Matt’, ‘Mexicali81′, and ‘Pisti’ were selected because of their early heading which is one of the most important adaptation traits under Mediterranean environments [2].
The calculation of stability indices depends on the set of genotypes and environments included in the analysis. Therefore, a different set comprised of sixteen durum wheat cultivars were selected in Experiment Two, out of which eight were common to the two experiments (Table 1). Seven cultivars were bred by the Cypriot National Breeding Program including the two most widely grown cultivars in Cyprus ‘Ourania’, and ‘Hekabe’ and four promising lines. Five widely grown cultivars were kindly provided by the ICARDA. Based on the results of Experiment One, ‘Pisti’ and ‘Matt’ were included as early heading while ‘Simeto’ and ‘Claudio’ as late heading cultivars. The later ones were also included for their high kernel and volume weight, respectively.
2.2. Field Experimental Conditions and Design
The first field experiment (Experiment One) was conducted in three locations (Achelia-34°43′ N, 32°29′ E, 30 m a.s.l, Dromolaxia-34°53′ N, 33°35′ E, 20 m a.s.l, and Athalassa 35°08′ N, 33°24′ E, 100 m a.s.l,) for two consecutive growing seasons (2011/12 and 2012/13 in Achelia and Dromolaxia and 2012/13 and 2013/14 in Athalassa) (six environments in total). The three experimental locations exhibit diverse edaphoclimatic conditions (Annex S1). Achelia has higher temperatures during winter and lower temperatures during spring, higher precipitation and deep clay soil favoring high yields. Athalassa has shallow sandy clay loam soil and lower precipitation during crop cycle resulting in drought stress during heading and grain filling. In addition, the higher day temperatures in spring and the frequent occurrence of extreme high temperatures during grain filling, very often result in heat stress. Dromolaxia also has sandy clay loam soil and it depicts intermediate climatic conditions and intermediate yield. Durum wheat is not cultivated in Athallasa because of the high probability of crop failure due to the adverse conditions. However, it was selected to represent the climatic conditions that would likely prevail in the current durum wheat Mediterranean zone in the future due to climate change [12].
The design of Experiment One was a randomized complete block with four replications. Each plot was 8 m long, and comprised of six rows, spaced apart 0.175 m. Seed rate was adjusted to 226 germinating seeds/m2. Experiments were set up at the end of November in Athalassa, and on December in Dromolaxia and Achelia. Planting always occurred after fallow. The fields were fertilized before sowing with 60 Kg/ha of N2 and 60 Kg/ha of P2O5, respectively. In the 1st growing season, experiments in Achelia and Dromolaxia were additionally top dressed with 40 Kg/ha of N2 at tillering. Weeds were chemically controlled at tillering (Atlantis® Bayer, Illoxan® Bayer, Granstar® DuPont). During the 1st growing season, Valiant® (Agriphar) was sprayed to control high infestation of cereal tortricid (Cnephasia pumicana) in Achelia. Infestation from diseases was negligible. Irrigation was applied in Athalassa during booting (30 mm) in the 1st growing season, and during tillering (50 mm) and booting (50 mm) in the 2nd growing season. Irrigation was also applied in Achelia during anthesis (60 mm) in the 2nd growing season.
The second experiment (Experiment Two) was conducted at three locations, Achelia, Dromolaxia and Polis (35°01′ N, 32°25′ E) for three consecutive growing seasons (2014/15, 2015/16, 2016/17). The three experimental sites represent the main durum wheat-producing areas of Cyprus. Polis and Achelia favor higher yields compared to Dromolaxia because of their higher precipitation and the lower temperatures during grain filling (Annex S1).
The design of Experiment Two was as described in Experiment One with two modifications. Plots were 6 m long and the number of replications was six. Experiments were set up in December, except from Polis at the growing season 2016/17 and Dromolaxia at the growing season 2014/15 where experiments were set up in January and November, respectively. In Achelia and Polis, the fields were fertilized before sowing with 60 Kg/ha of N2 and 60 Kg/ha of P2O5, respectively, except in Polis during the growing season 2016/17 where 80 Kg/ha of N2 and 48 Kg/ha P2O5 were applied. In Dromolaxia, fields were fertilized before sowing with 40 Kg/ha of N2 and 40 Kg/ha of P2O5. In all experiments, fields were additionally top dressed with 41.4 Kg/ha of N2 at tillering. Weeds were chemically controlled at tillering (Atlantis® Bayer, Biopower® Bayer, Denok amine® Nufarm S.A.S) according to the manufacturer’s instructions. Infestation from pest and diseases were negligible.
2.3. Data Collection for Agronomic and Quality Traits
For both experiments, heading date was recorded when the ears of 50% of the tillers had emerged from the flag leaf sheaths for approximately half their length and was expressed as growing degree days from emergence to heading (GDD). Plant height (PH) was measured at physiological maturity as an average of three measurements/plot, excluding awns. The plots were mechanically harvested and grain yield (GRYLD) was adjusted to 12% moisture level. Thousand kernel weight (TKW) was calculated as the mean weight of two samples of 200 seeds/plot. Volume weight (VW) was measured with a 0.5 L chondrometer (Seedburo) and expressed as Kg hl−1.
In Experiment One, the number of fertile tillers/m2 (NTLSM) was counted from the second and fifth rows in order to eliminate the border effect. Plants from these rows were hand harvested to estimate the number of seeds/spike (SPS). Sampling area for determining NTLSM and SPPS was 2 m long at each row. Number of seeds/m2 (NSSM) was calculated using the formula “NSSM = NTLSM × SPS”. In Experiment Two, NSSM was calculated according to the formula NSSM = (GRYLD (Kg/ha) × 100)/TKW. The two different methods applied for the calculation of NSSM provided similar results (data not shown).
Protein content (PRO), yellow pigment content (CAR), and gluten index (GI) were assessed on whole grain flour samples, only in Experiment One. Grain nitrogen content was determined according to Kjeldahl method. PRO was calculated multiplying the n value by 5.7 and expressed as a percentage on a dry weight base. CAR was determined as described by [48] and expressed in ppm. GI was measured according to [49], using a Perten Glutomatic (Perten Hägersten Sweden) with a minimum of two repeats per sample. PRO, CAR, and GI were assessed on two samples per cultivar. Each sample was collected from the bulk of two replications.
2.4. Statistical Analysis
Combined analysis of variance was conducted for all traits considering cultivars and environments as fixed factors using META-R software [50]. Means were compared by applying the LSD test at significance level 0.05. Broad sense heritability was calculated according to the formula H2 = σ2g/[σ2g + (σ2ge/nLoc) + σ2e/(nLoc × nRep)], where σ2g, σ2e and σ2ge are the genotype, error, and G × E interaction variance components, respectively, nRep is the number of replicates and nLoc is the number of environments. Box plots were constructed to depict the trait variation in each environment. Additive Main Effect and Multiplicative Interactions (AMMI) analysis was performed by GEA-R [51]. The F-test proposed by [52] was used for determining the number of terms to be retained in a multiplicative model. The following stability parameters were calculated using GEA-R; Coefficient of Variance (CV) [28], Wrickle’s ecovalence (Wi) [26], Shukla’s stability variance (σ2) [27], the slope of the regression of individual genotypes, and their deviation from regression bi and s2di according to Eberhart and Russell [19] and Bi_A and DJi according to Perkins and Jinks [20], Superiority measure (Pi) [29] and nonparametric coefficients Si(1) and Si(2) [30,31]. The former parameter is based on the mean of the absolute rank differences of a genotype over all tested environments and the latter on the variance among the ranks over all tested environments. In addition, two stability parameters derived from AMMI analysis were calculated; AMMI Stability Value (ASV) [24] and AMMI wide adaptation Index (AWAI) [25]. ASV is genotypes’ stability considering its distance from IPCA1 and IPCA2 axes. AWAI is genotypes’ stability as determined by its distance from each significant IPCs axis. Hierarchical cluster analysis was conducted to assess the relations between stability parameters for each trait. Squared Euclidean distances were calculated on standardized Z values, with a mean of 0 and a standard deviation of 1. Clustering was performed using the ’WARD’ method. Spearman correlations were computed to depict relations between stability parameters and between stability parameters and the traits per se. For the assessment of parameters’ repeatability, Spearman correlations between parameters derived from eight cultivars that were common to the two field experiments were calculated. Box plots construction, hierarchical cluster analysis and estimation of Spearman correlations were carried out using SPSS (IBM, SPSS ver. 26). Heat maps on Spearman correlations were constructed by Morpheus online software (https://software.broadinstitute.org/morpheus) [53].
3. Results
Average maximum and minimum temperatures were higher than normal for most months during growing seasons with the exception of the growing season 2011/12 (Annex S1). In some cases, temperatures were up to 2 °C higher than normal. Precipitation was exceptionally high during the growing season 2011/12, substantially lower than normal during the growing seasons 2015/16 and 2016/17, and close to average the other seasons. There were months with extremely higher or lower precipitation than normal. For example, February precipitation was negligible during the growing season 2016/17.
There were significant differences between cultivars for all traits for both experiments (Table 2 and Table 3). The differences were significant in all environments with the exception of GRYLD in Athalassa and for PH in Dromolaxia during growing seasons 2013/14 and 2015/16, respectively. The percentage of variance explained by cultivar was low, particularly for GRYLD for both experiments. The yield component with the highest contribution to the genotypic variance was SPS, which had the highest heritability. The lower heritability was recorded for GRYLD for both experiments. The highest heritability and percentage of variance explained by genotypic effect was recorded for CAR followed by GI.
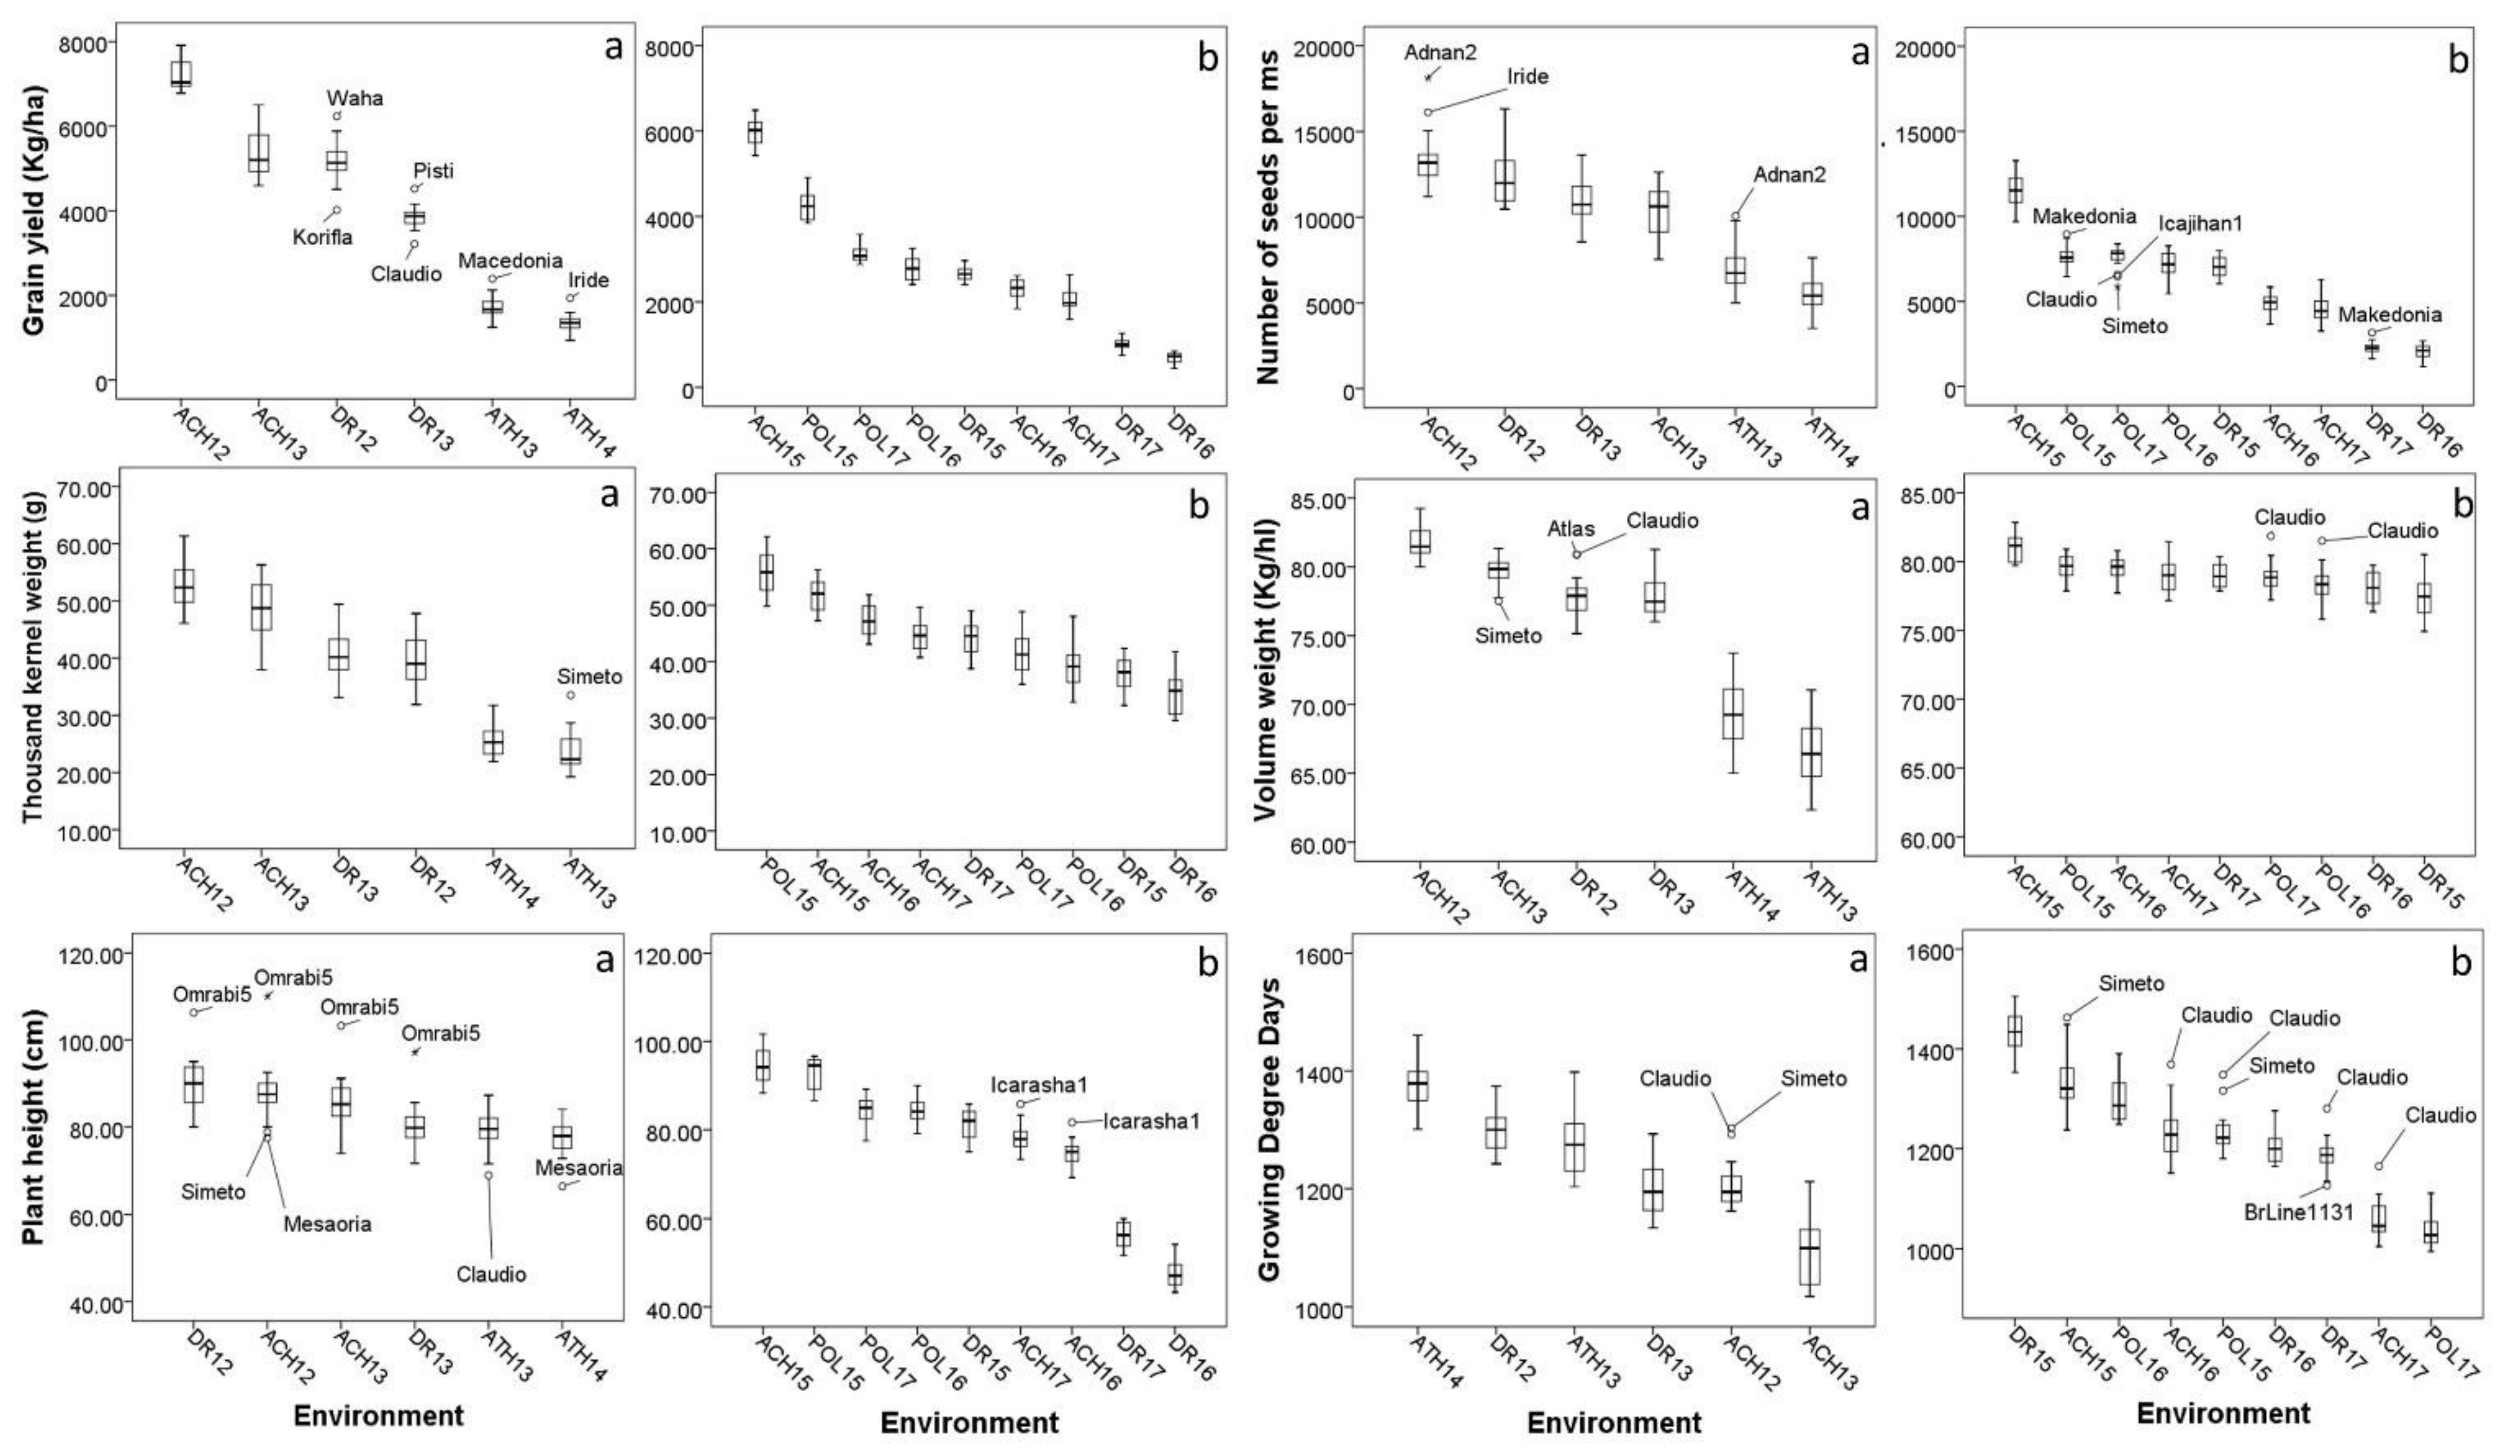
The differences between environments were significant for all traits for both experiments (Table 2 and Table 3). The high percentage of variance explained by environments, particularly for GRYLD reflects the diverse climatic conditions during the experimentation (Annex S1). The favorable climatic conditions in Achelia during season 2011/12 resulted in high yield (7192 Kg/ha) while yield was below 2000 Kg/ha at the location Athalassa (Figure 1). The adverse climatic conditions in Athalasa were particularly evident during grain filling. Two of the major characteristics appreciated by the industry, TKW and VW, were substantially lower in Athalassa. TKW was 23,56 g in 2012/13 and 25,46 g in 2014/15 and the respective VW was 66.55 and 69.31 (Kg/hl). On the other hand, CAR and PRO were substantially higher in Athalassa.
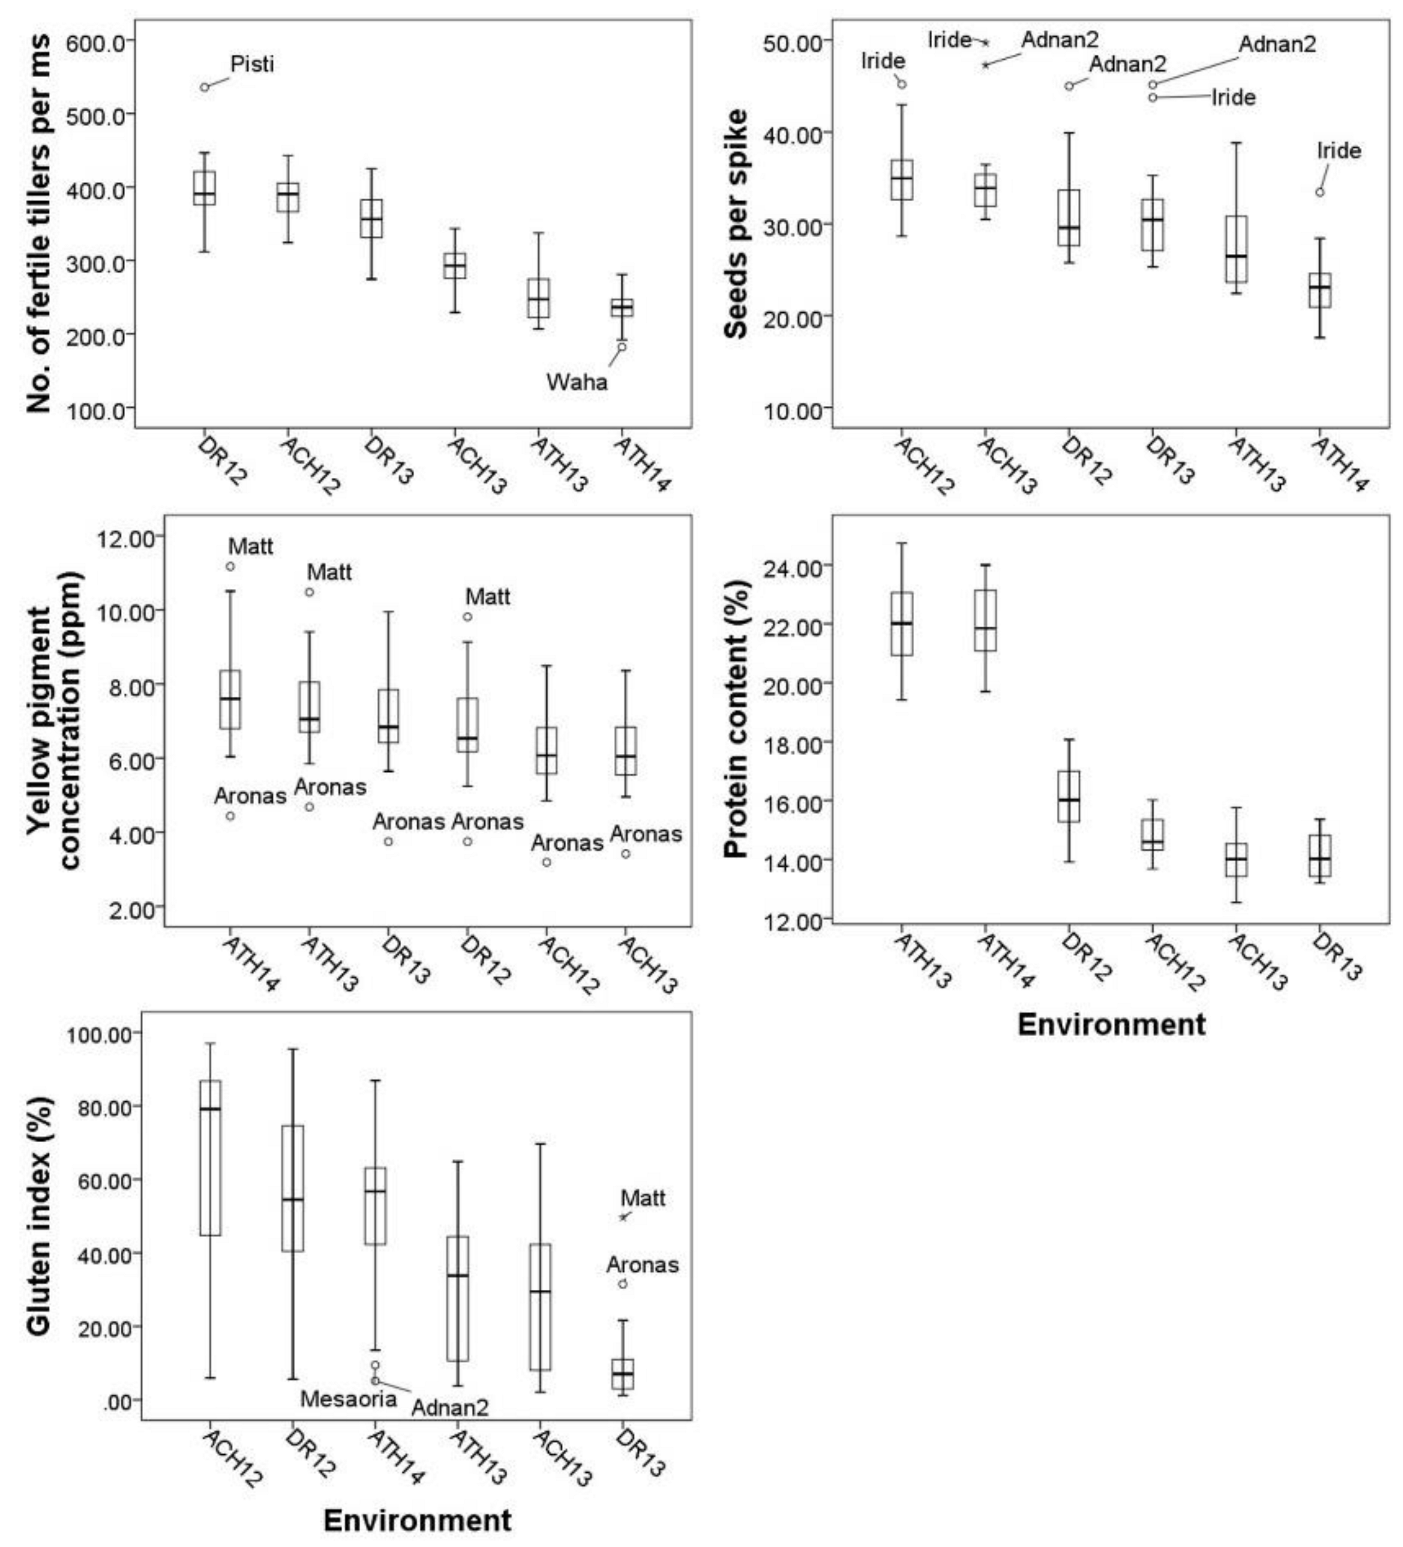
For Experiment Two, the highest yield was obtained in Achelia during the season 2015/16 (5982 Kg/ha) and the lower in Dromolaxia during seasons 2015/16 and 2016/17 (689 and 997 Kg/ha, respectively). Figure 1 and Figure 2 show the genetic variation and the variation between environments for all traits. Some cultivars manage to sustain high or low performance for particular traits and appear on the box plots as outliers. For example, CAR was consistently low to all environments for cultivar ‘Aronas’ contrary to cultivar ‘Matt’. Cultivars ‘Iride’ and ‘Adnan2’ retained their high SPS in most environments. The superiority of cultivar ‘Simeto’ for thousand kernel weight was more evident under the adverse conditions during grain filling at the location Athalassa.
Cultivar × Environment interactions were significant for all traits (Table 2 and Table 3) with the percentage of variance explained ranging from 1.94% for GRYLD to 14.1% for GI in Experiment One and from 1.34% for GRYLD to 17.1% for VW in Experiment Two. Among yield components, G × E interactions were larger for SPS (7.08%) in Experiment One and for TKW (5.48%) in Experiment Two. In most cases, two or more PC axes from AMMI analysis were significant according to the Gollob test. The biplots of AMMI analysis are shown in Annex S2. The first two axes explained 74.81% and 53.26% of the variability for GRYLD, in Experiments One and Two, respectively. The percentage of variance explained by the heterogeneity of the slopes from the linear regression model was lower than that of the AMMI model. The heterogeneity of the slopes explained 11.23% and 21.17% of the variability for GRYLD in Experiments One and Two, respectively. The linear model was more efficient for explaining higher percentage of variability for quality traits (54.07% for CAR and 55.99% for GI). Significant differences between the slopes were detected to all traits except GRYLD, NTLSM, NSSM and SPS in Experiment One, and except TKW and VW in Experiment Two.
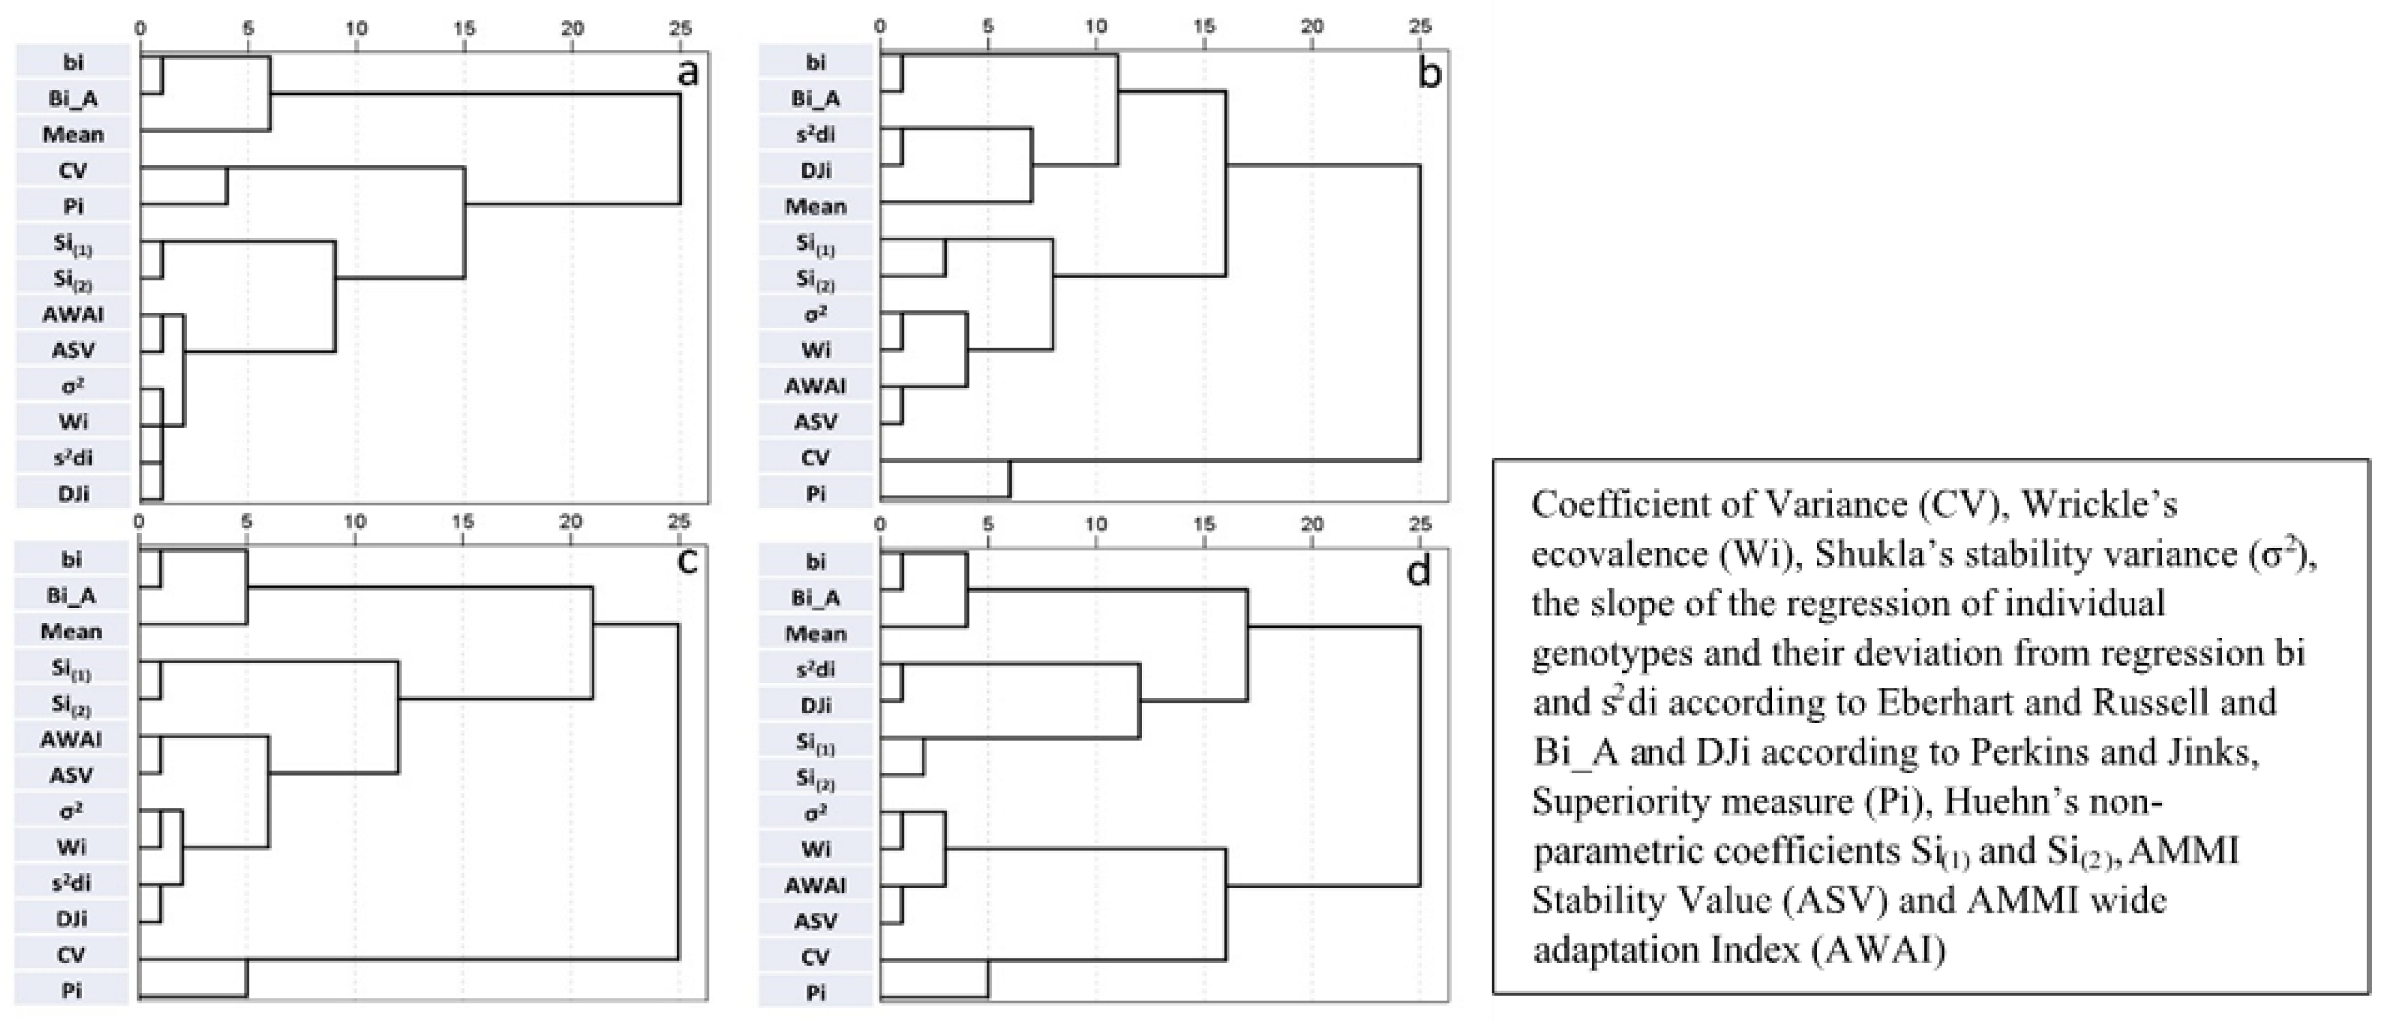
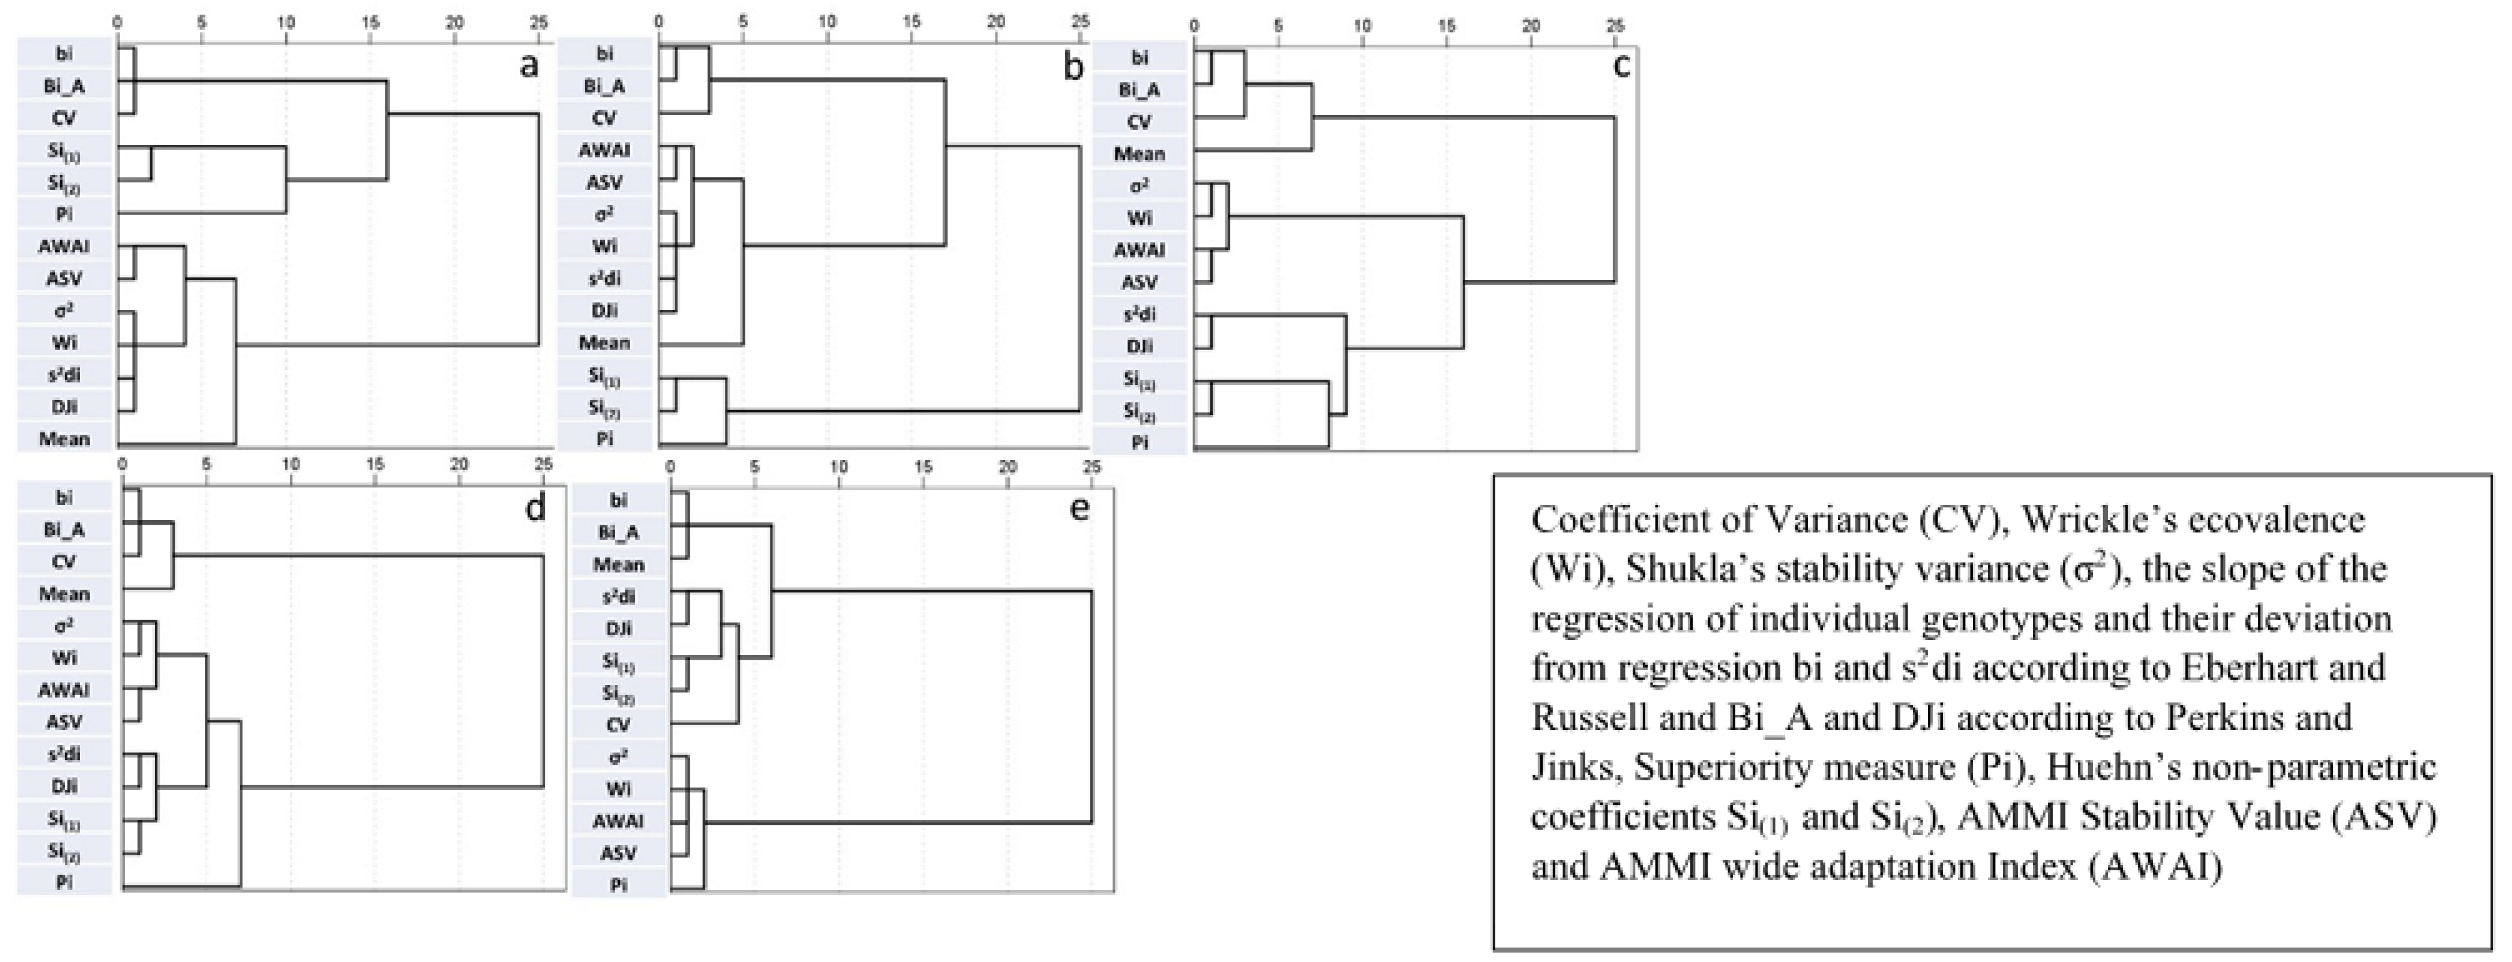
Figure 3, Figure 4 and Figure 5 depict the relations between stability parameters for each trait. There were consistent high relations between Bi_A and bi, DJi and s2di, and Wi and σ2. The two stability parameters derived by the AMMI model (ASV and AWAI) consistently clustered together. This was also the case for the two nonparametric parameters (Si(1) and Si(2)). With few exceptions, Wi-σ2 and s2di-DJi grouped together in cluster analysis. Pi was the parameter which consistently had strong negative correlations with trait mean values. Significant negative correlations between CV and traits were observed in some cases and to a lesser extent positive correlations between bi-Bi_A and the traits, with the exception of VW where the correlation was negative. The correlations between trait mean values and the other stability parameters were non-significant. Pi and CV cluster together in the majority of cases. ASV and AWAI consistently clustered with σ2 and Wi, in most cases with DJi, s2di and to lesser extent with Si(1) and Si(2). Mean value, bi and Bi_A formed a distinct group for GRYLD in Experiment One, whereas in Experiment Two, CV and Pi had the greater distances from the other parameters (Figure 3a,b). CV, bi and Bi_A formed a distinct group for TKW and VW (both experiments—Figure 4) and for CAR and PRO (Figure 5c,d).
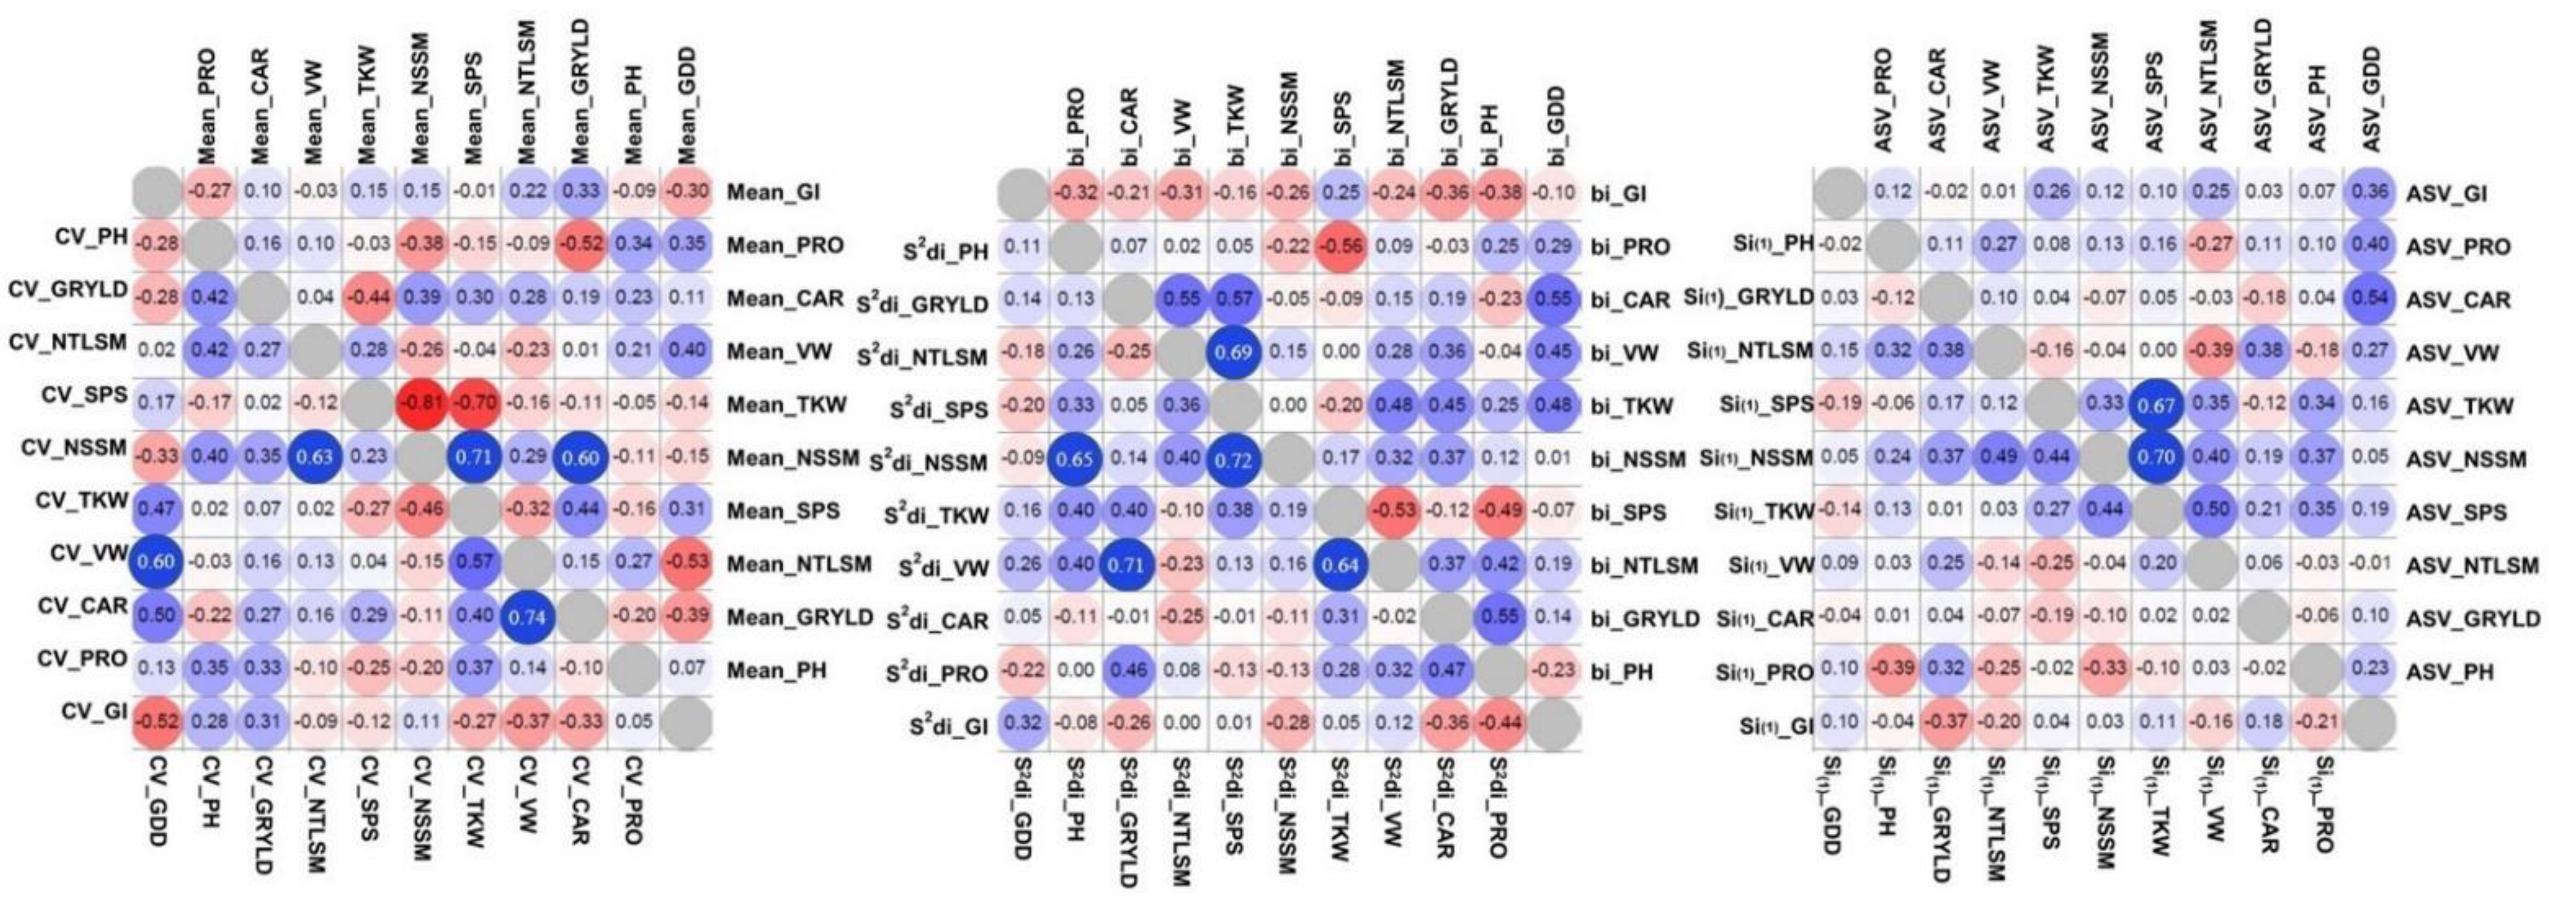
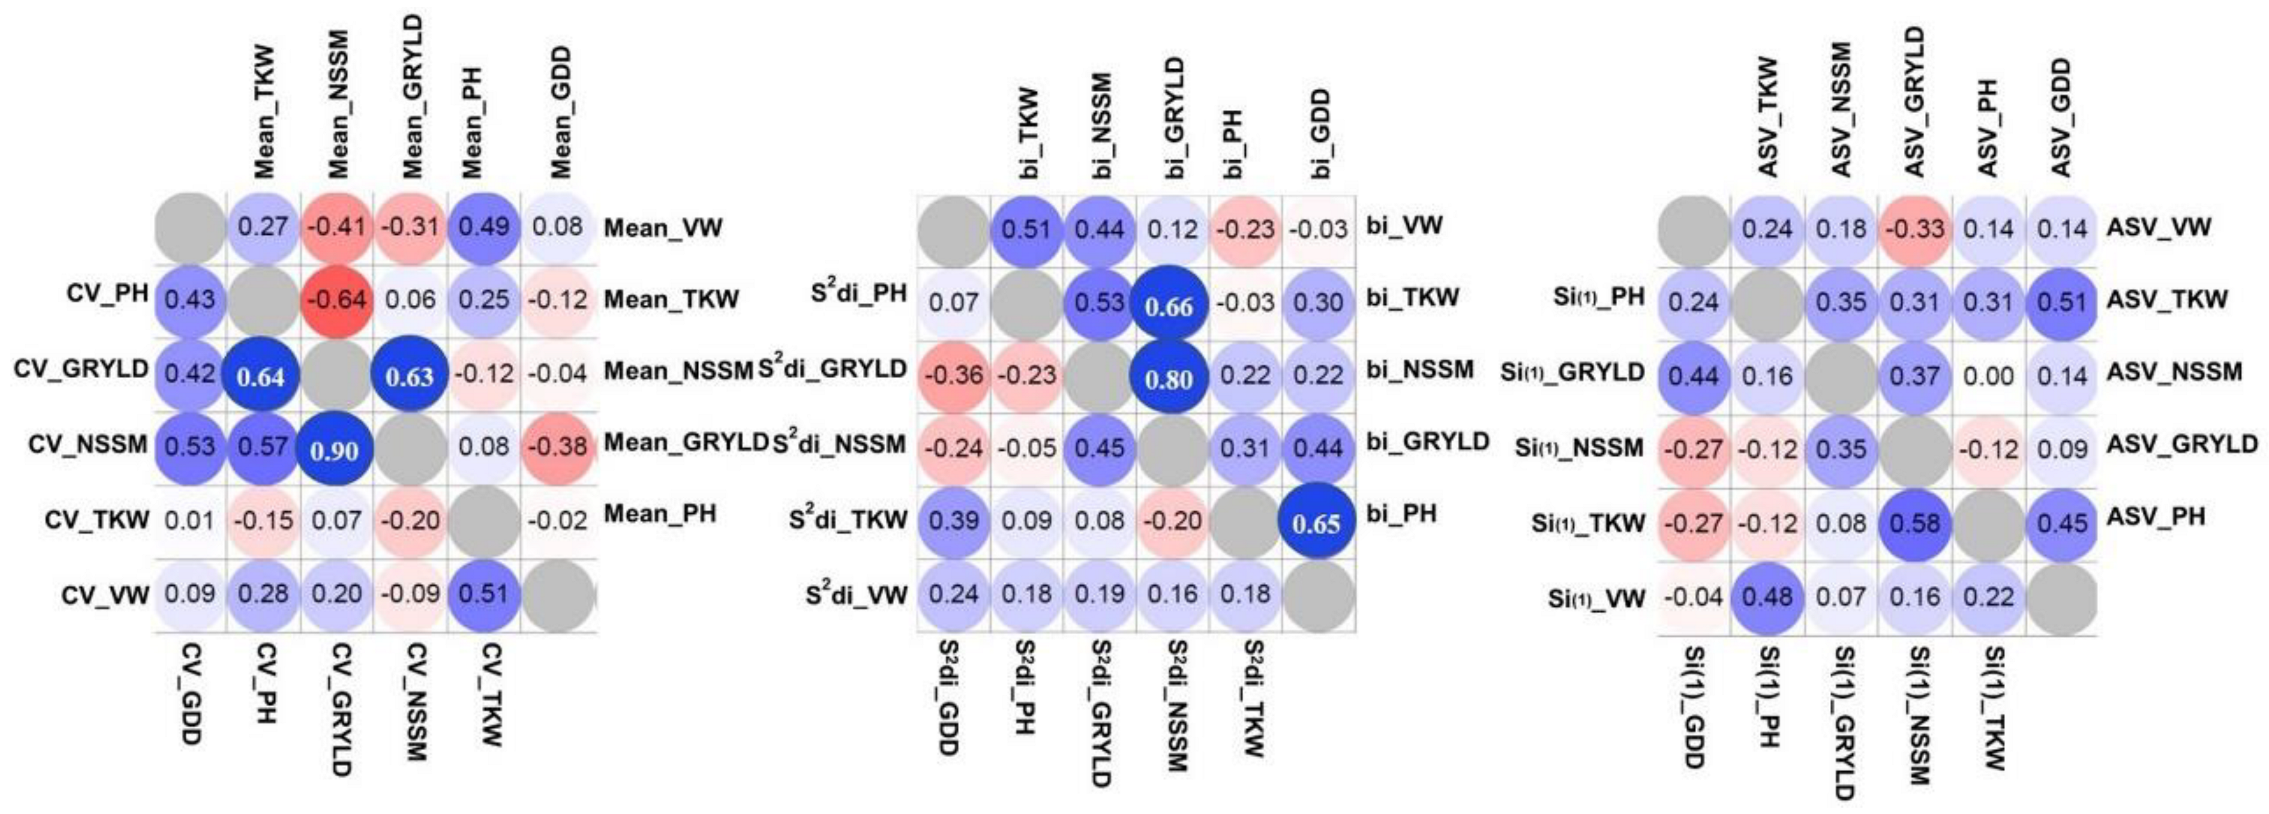
GRYLD was positively correlated to NSSM in both experiments (Figure 6 and Figure 7) and the correlations between these traits were significant to almost all environments and stronger in lower yield environments (data not shown). Significant negative correlations between NSSM and TKW were observed in both experiments, contrary to the strong positive correlations between NSSM and SPS. This trend was consistent in almost all environments. GRYLD was not related with GDD, however, significant negative correlations were detected in few environments (data not shown). On the contrary, correlations between stability parameters for different traits were in general low and non-significant in most cases and for both experiments. Higher correlations were recorded between traits bi and CV stability parameters than the others. GRYLD stability parameter bi was significantly correlated with bi TKW (p < 0.05) and bi PH (p < 0.05) in Experiment One and with bi NSSM (p < 0.01) and bi TKW (p < 0.01) in Experiment Two. GRYLD stability parameter CV was significantly correlated with CV TKW (p < 0.01) and CV PH (p < 0.01) in Experiment Two. In some cases, significant correlations were observed between yield components stability parameters, nevertheless, the significant level was inconsistent among stability parameters and between the two experiments. For example, NSSM parameter CV was significantly correlated with CV NTLSM (p < 0.01) in Experiment One, however this trend was detected neither in Experiment Two nor in the other parameters. NTLSM parameter bi was negatively correlated with bi SPS (p < 0.05), while ASV NTLSM was negatively correlated with ASV SPS (p < 0.05). TKW parameters CV and bi were positively correlated with CV and bi VW in both experiments (p < 0.01 and p < 0.05 in Experiment One and Two, respectively). TKW parameters bi and CV were also positively correlated with the respective GDD parameter (p < 0.05) in Experiment One, while in Experiment Two, TKW ASV was positively correlated with ASV GDD (p < 0.05). Positive correlations were observed between bi, CV and ASV GDD parameters and their respective CAR parameters (p < 0.05).
Traits’ stability parameters were not significantly correlated with the traits per se in most cases and for both experiments (Annex S3). In general, the correlations were higher for CV and bi parameters than the others. GRYLD was significantly correlated only with bi NSSM in Experiment One. In a few cases, yield components were significantly correlated with yield components’ stability parameters, although this trend was inconsistent between parameters and the two experiments.
The repeatability of the trait means values and the stability parameters derived from the eight cultivars that were common to the two experiments are shown in Table 4. Mean values were highly and significantly correlated for GDD, PH, and GRYLD. Pi was the stability parameter with highly significant correlations for all traits. CV and bi GRYLD parameters were significantly correlated, while AMMI derived parameters (ASV and AWAI), S2di and σ2 had higher correlations for PH and GDD.
4. Discussion
Genetic variation between cultivars was observed for all traits, although the environmental effect explained higher percentage of variability for almost all traits reflecting the substantial variation in climatic conditions between locations and years. GRYLD varied from 689 Kg/ha up to 7192 Kg/ha, representing the expected range in durum wheat yield under Mediterranean conditions [3]. In agreement with previous studies, SPS showed the largest genetic control, and G × E interactions among yield components [54], CAR was largely under genetic control [10], and GI was the trait equally affected by the genotypes and the environment [4].
G × E interactions were significant in all cases, and the percentage of variance explained by the interactions was higher than the genetic effect for GRYLD. The superiority of the AMMI model to explain higher percentage of G × E interactions compared to linear regression models [8,21] was also evident in the present study. The usefulness of the linear regression models are doubtful if heterogeneity of the slopes do not reach significance [15] and if it explains a small part of the G × E interactions [55]. The heterogeneity of the slopes was not significant for GRYLD and yield components except TKW in Experiment One and the percentage of variance explained was generally low in both experiments. The linear regression model, however, was more efficient to explain G × E variation for phenotypic and quality traits, suggesting that it can be used with less caution for these traits.
Regression coefficient according to Finlay and Wilkinson [18] and Perkins and Jinks [20] are similar notions except that, in the latter case, observed values are adjusted for location effects before regression [32]. The MS of the deviation from regression in both cases is the measure of stability in the above two linear regression models. Wrickle’s and Shukla’s stability parameters are equivalent because their second terms are constant and their first terms are proportional to each other [32]. Therefore, the strong and consistent relations between bi and Bi_A, between s2di and DJi, and between σ2 and Wi observed in this study are frequently reported [14,56].
Becker and Leon [15] stated that the information given by Wi is rather similar to s2di, confirmed by the high correlations reported between these parameters [14,57,58]. Lin et al. [32] recommended that when data do not fit to the linear regression models or if the residual MS from the regression are heterogenous, Wi and σ2 parameters should be used. In the present study, the relations between Wi-σ2 with s2di-DJi were stronger in cases where the percentage of variance explained by the heterogeneity of the slope of the linear regression models was low. This trend was also observed in the relations between s2di-DJi and AMMI-derived parameters (ASV and AWAI) while the strong relations between AMMI-derived parameters and Wi-σ2 were consistent. Consistent correlations between σ2, s2di, and AMMI-derived parameters were previously reported [43]. The relation between CV, bi, and Pi and the correlation between these parameters with grain yield is in agreement with the results of Flores et al. [57], Mohammadi and Amri [58], and Vaezi et al. [14]. Correlations between nonparametric parameters Si(1) and Si(2) and Wi, s2di, and ASV were reported for durum wheat grain yield [56,58].
Based on the above, the stability parameters in the present study can be categorized into three groups. Group A includes AMMI-derived parameters (ASV and AWAI) which provide very similar information to Wi and σ2. Deviation from regression parameters (s2di-DJi) also fall in this group when the heterogeneity of the slopes was not significant. Nonparametric parameters Si(1) and Si(2) were moderately related with the former parameters. Parameters in group A were not related with the trait mean values indicating that the stability calculated based on these parameters is an independent trait and accord to the static (biological) concept of stability. Group B includes parameters bi, Bi_A, CV, and Pi. These parameters were significantly related with the trait mean values suggesting that breeders can employ them for simultaneous selection for stability and the traits per se. The attributes of parameters in group B were related to the dynamic (agronomic) concept. It should be stressed though that, contrary to bi, Bi_A, and CV, Pi had very high and consistent correlations with the trait mean values (over 0.95). Pi was associated with durum wheat yield improvement under Mediterranean conditions [54]. However, the very high correlation of Pi with the traits’ mean values implies that this parameter may provide to large extent similar information with the trait per se. Group C encompass s2di-DJi when the heterogeneity of the slope was significant. The deviation from regression parameters have received some criticism concerning their employment as stability statistics. Lin et al. [32] argued about the efficiency of s2di to estimate stability when s2di is large or MS deviation is heterogenous. Flores and Cubero [57], on the other hand, stated that when regression coefficients are not significantly different, s2di becomes an important statistic in estimating stability. Our results signify that the adequacy of the statistical model employed needs to be considered before interpreting the genotypes’ stability parameters derived by the model, information that is frequently missing from the literature. Such information was also reported to be crucial for assessing the repeatability of stability parameters over seasons [39].
The strong relations between yield, yield components, and phenology, particularly heading date and the existence of trade-offs between these traits, are well established [59] and they were evident in the present study. Sadras et al. [34] and Grogan et al. [37] showed associations between stabilities (plasticities) of yield and phenology. Associations between stability (plasticity) for yield, yield components, and physiological traits were also presented [35,36]. Relations between stability for quality traits were reported by Knapp et al. [38] and Peterson et al. [33]. In the present study, correlations between traits’ stability parameters and the traits per se were, in general, low and non-significant in most cases and for both experiments indicating that contrary to the traits, stability parameters are likely to be independent and can be employed with less caution regarding possible trade-offs. This was particularly evident for the stability parameters of groups A and C (ASV, AWAI, Wi, σ2, s2di-DJi, Si(1), Si(2)). Stability parameters of group B (CV, Bi_A, bi, and Pi) showed a higher tendency to corelate and the same trend was observed in the correlation of these parameters with the traits per se. Therefore, selection for stability based on parameters of group B could result to the simultaneous selection for stability for other trait(s) or trade-offs, thus breeders need to consider possible implications when using them.
The correlations between traits’ mean values derived from the eight cultivars that were common to the two experiments were high and significant for GDD, PH, and GRYLD. The respective correlations between stability parameters were less consistent and non-significant in most cases which signifies the well-established notion that genotypes’ stability depends on the set of genotypes and environments included in the analysis [21,32,38,39]. These results are in agreement with previous studies reporting higher and consistent repeatability of grain yield than the repeatability of stability parameters [39,42]. Exceptionally, Pi was the only stability parameter showing high repeatability for almost all traits, although this parameter was highly and consistently correlated with the respective trait mean values, raising consideration about the independence of the information that it provides.
Regression coefficient (bi) and CV were the parameters that showed repeatability for GRYLD. Coefficient of variation (CV) had the highest heritability for grain yield among other parameters in wheat [60]. Jalaluddin and Harrison [42] also reported high repeatability of these two parameters for wheat while repeatability of bi was less consistent in the work by Annicchiarico [39]. Repeatability of regression coefficients for soybean yield were moderate and higher than σ2, s2di, Si(1), and AMMI-derived parameters except SIPCf [43].
It has been suggested that the linear model can be used for the prediction of untested environments as long as it is in the range of the characteristics of the environments used for testing [16]. Despite their limitations, Flores et al. [57] stated that linear regression models remain useful when the number of genotypes and environments considered in the analyses are sufficiently large and when there are no extreme environments that bias the regression slope. The significant correlation of the regressions coefficient (bi) for GRYLD denotes that the inclusion of the extreme location of Athalassa in Experiment One did not affect the repeatability of this parameter. This can be attributed to the extremely low yield obtained in location Dromolaxia during the growing seasons 2015/16 and 2016/17 in Experiment Two.
The significant repeatability of bi for GRYLD in the present study implies that regression models can provide repeatable regression coefficients when specific assumptions are met. However, repeatability of the correlation coefficient was lower for the other agronomic traits, particularly for the phenotypic traits PH and GDD, for which stability parameters of groups A and C (ASV, AWAI, Wi, σ2, s2di-DJi, Si(1), Si(2)) showed higher repeatability. Further to a well-established notion that several stability parameters should be employed in a plant breeding program because unrelated parameters provide independent information associated with different contexts of stability [14,56], our results imply that unrelated stability parameters can show different repeatability depending on the trait. The later needs to be further investigated in future studies.
Climate change is severely affecting agricultural production in the Mediterranean, including Cyprus. According to recent models, higher temperatures and lower precipitation are expected and this trend is likely to be more evident during the hottest periods of the year [12]. These climatic scenarios were represented in the current study by the location Athalassa where the adverse climatic conditions, particularly during grain filling, resulted in lower grain yield and deteriorated quality in terms of kernel and volume weight. These findings argue for new breeding strategies where emphasis should be given to the breeding of cultivars that can sustain high kernel and volume weight under adverse climatic conditions. The cultivar ‘Simeto’ managed to sustain high kernel weight in Athalassa despite its lower yield potential due to the moderate tillering capacity and lower number of SPS. On the other hand, cultivars ‘Iride’ and ‘Adnan’ managed to retain high NSSM in Athalassa due to their high number of SPS, although they also retained very low kernel and volume weight which is a point of concern. These findings denote that, cultivars which are characterized by high and stable kernel weight might represent an alternative yielding strategy in Mediterranean environments, in the effort to sustain both yield and quality. Accordingly, Royo et al. [61] found that cultivars with high kernel weight are more stable in Mediterranean environments.
5. Conclusions
Twelve stability parameters were evaluated for agronomic and quality traits in two experiments of twenty and sixteen cultivars, respectively, of diverse origin. Genetic variation between cultivars was significant for all traits. However, the environmental effect explained higher percentage of variability for almost all traits, reflecting the substantial variation in climatic conditions between locations and years. G × E interactions were significant in all traits. The AMMI model was more effective to explain higher percentage of G × E interactions compared to linear regression models. The linear regression model was more efficient to explain G × E variation for phenotypic and quality traits than for grain yield and yield components. Stability parameters were categorized into three groups. Group A included AMMI-derived parameters (ASV and AWAI), Wi, σ2, Si(1), and Si(2). Deviation from regression parameters (s2di-DJi) also fell in group A when the heterogeneity of the slopes was not significant. Group B included parameters bi, Bi_A, CV, and Pi. Group C encompassed s2di-DJi when the heterogeneity of the slope was significant. Stability parameters in groups A and C were not related with the trait mean values contrary to the stability parameters in group B which showed significant correlations. In general, correlations between stability parameters for different traits and between traits stability parameters and the traits per se were low and non-significant, although a tendency for higher correlation was observed for stability parameters in group B. Stability parameters in group B had higher repeatability for grain yield while repeatability for growing degree days to heading and plant height was higher for stability parameters in groups A and C. The results of the present study allowed the detection of cultivars combining high performance and stability for agronomic and quality traits. The accumulation of such knowledge is crucial for adjusting plant breeding strategies and variety recommendations to farmers.
Supplementary Materials
The following supporting information can be downloaded at: https://www.mdpi.com/article/10.3390/agronomy12081774/s1, Annex S1: Normal climatic conditions based on historical records and climatic conditions during the experimentation years. Annex S2: Biplots of AMMI analysis. Annex S3: Spearman correlations between stability parameters and the traits perse.
Author Contributions
Conceptualization, A.C.K. and A.K.; Methodology, A.C.K.; Software, A.C.K.; Validation, A.C.K., A.P. and A.K.; Formal Analysis, A.C.K.; Investigation, A.C.K.; Resources, A.P.; Data Curation, A.C.K.; Writing—Original Draft Preparation, A.C.K.; Writing—Review & Editing, A.P. and A.K.; Visualization, A.C.K.; Supervision, A.K.; Project Administration, A.C.K.; Funding Acquisition, A.C.K., A.P. and A.K. All authors have read and agreed to the published version of the manuscript.
Funding
This work was supported by internal funds from the Agricultural Research Institute (Cyprus) and the Cyprus University of Technology.
Data Availability Statement
Data are available upon reasonable request from the authors.
Acknowledgments
The assistance in carrying out the experiments and data recording by the staff of the Plant Improvement Sector of the Agricultural Research Institute is acknowledged.
Conflicts of Interest
The authors declare no conflict of interest.
References
- Habash, D.Z.; Kehel, Z.; Nachit, M. Genomic approaches for designing durum wheat ready for climate change with a focus on drought. J. Exp. Bot. 2009, 60, 2805–2815. [Google Scholar] [CrossRef] [PubMed]
- Royo, C.; Ammar, K.; Alfaro, C.; Dreisigacker, S.; del Moral, L.F.G.; Villegas, D. Effect of Ppd-1 photoperiod sensitivity genes on dry matter production and allocation in durum wheat. Field Crops Res. 2018, 221, 358–367. [Google Scholar] [CrossRef]
- Royo, C.; Maccaferri, M.; Álvaro, F.; Moragues, M.; Sanguineti, M.C.; Tuberosa, R.; Maalouf, F.; Moral, L.F.G.d.; Demontis, A.; Rhouma, S.; et al. Understanding the relationships between genetic and phenotypic structures of a collection of elite durum wheat accessions. Field Crops Res. 2010, 119, 91–105. [Google Scholar] [CrossRef]
- Guzmán, C.; Autrique, J.E.; Mondal, S.; Singh, R.P.; Govindan, V.; Morales-Dorantes, A.; Posadas-Romano, G.; Crossa, J.; Ammar, K.; Peña, R.J. Response to drought and heat stress on wheat quality, with special emphasis on bread-making quality, in durum wheat. Field Crops Res. 2016, 186, 157–165. [Google Scholar] [CrossRef]
- Hadjichristodoulou, A. The stability of the number of tillers of barley varieties and its relation with consistency of performace. Euphytica 1985, 34, 641–649. [Google Scholar] [CrossRef]
- De Vita, P.; Nicosia, O.L.D.; Nigro, F.; Platani, C.; Riefolo, C.; Di Fonzo, N.; Cattivelli, L. Breeding progress in morpho-physiological, agronomical and qualitative traits of durum wheat cultivars released in Italy during the 20th century. Eur. J. Agron. 2007, 26, 9–53. [Google Scholar] [CrossRef]
- van Eeuwijk, F.A.; Bustos-Korts, D.V.; Malosetti, M. What Should Students in Plant Breeding Know About the Statistical Aspects of Genotype × Environment Interactions? Crop Sci. 2016, 56, 2119–2140. [Google Scholar] [CrossRef]
- Rharrabti, Y.; del Moral, L.G.; Villegas, D.; Royo, C. Durum wheat quality in Mediteranean environments III stability and comparative methods in analysing GE interactions. Field Crops Res. 2003, 80, 141–146. [Google Scholar] [CrossRef]
- De Santis, M.A.; Soccio, M.; Laus, M.N.; Flagella, Z. Influence of Drought and Salt Stress on Durum Wheat Grain Quality and Composition: A Review. Plants 2021, 10, 2599. [Google Scholar] [CrossRef] [PubMed]
- Rharrabti, Y.; Villegas, D.; Royo, C.; Martos-Núñez, V.; del Moral, L.G. Durum wheat quality in Mediterranean environments II Influence of climatic variables and relationships between quality parameters. Field Crops Res. 2003, 80, 133–140. [Google Scholar] [CrossRef]
- Rharrabti, Y.; Villegas, D.; Del Moral, L.F.G.; Aparicio, N.; Elhani, S.; Royo, C. Environmental and genetic determination of protein content and grain yield in durum. Plant Breed. 2001, 120, 381–388. [Google Scholar] [CrossRef]
- Papadaskalopoulou, C.; Moriondo, M.; Lemesios, I.; Karali, A.; Konsta, A.; Dibari, C.; Brilli, L.; Varotsos, K.V.; Stylianou, A.; Loizidou, M.; et al. Assessment of Total Climate Change Impacts on the Agricultural Sector of Cyprus. Atmosphere 2020, 11, 608. [Google Scholar] [CrossRef]
- Elias, A.A.; Robbins, K.R.; Doerge, R.W.; Tuinstra, M.R. Half a Century of Studying Genotype × Environment Interactions in Plant Breeding Experiments. Crop Sci. 2016, 56, 2090–2105. [Google Scholar] [CrossRef]
- Vaezi, B.; Pour-Aboughadareh, A.; Mohammadi, R.; Mehraban, A.; Hossein-Pour, T.; Koohkan, E.; Ghasemi, S.; Moradkhani, H.; Siddique, K.H.M. Integrating different stability models to investigate genotype × environment interactions and identify stable and high-yielding barley genotypes. Euphytica 2019, 215, 63. [Google Scholar] [CrossRef]
- Becker, H.C.; Leon, J. Stability Analysis in Plant Breeding. Plant Breed. 1988, 101, 1–23. [Google Scholar] [CrossRef]
- Malosetti, M.; Ribaut, J.-M.; van Eeuwijk, F.A. The statistical analysis of multi-environment data: Modeling genotype by environment interaction and its genetic basis. Front. Physiol. 2013, 4, 44. [Google Scholar] [CrossRef] [Green Version]
- Pour-Aboughadareh, A.; Khalili, M.; Poczai, P.; Olivoto, T. Stability Indices to Deciphering the Genotype-by-Environment Interaction (GEI) Effect: An Applicable Review for Use in Plant Breeding Programs. Plants 2022, 11, 414. [Google Scholar] [CrossRef] [PubMed]
- Finlay, K.W.; Wilkinson, G.N. The analysis of adaptation in a wheat breeding program. Aust. J. Agric. Resour. 1963, 14, 742–754. [Google Scholar] [CrossRef] [Green Version]
- Eberhart, S.T.; Russell, W.A. Stability parameters of comparing varieties. Crop Sci. 1966, 6, 36–40. [Google Scholar] [CrossRef] [Green Version]
- Perkins, J.M.; Jinks, J.L. Environmental and genotype environmental componets of variability. Heredity 1967, 23, 339–356. [Google Scholar] [CrossRef] [Green Version]
- Crossa, J. Statistical Analyses of Multilocation Trials. Adv. Agron. 1990, 44, 55–85. [Google Scholar]
- Zobel, R.W.; Wright, M.J.; Gauch, H.G., Jr. Statistical Analysis of a Yield Trial. Agron. J. 1988, 80, 388–393. [Google Scholar] [CrossRef]
- Sabaghnia, N.; Sabaghpour, S.; Dehghani, H. The use of an AMMI model and its parameters to analyse yield stability in multi-environment trials. J. Agric. Sci. 2008, 146, 571–581. [Google Scholar] [CrossRef]
- Purchase, J.L.; Hatting, H.; Van Deventer, C.S. Genotype × environment interaction of winter wheat (Triticum aestivum L.) in South Africa: II. Stability analysis of yield performance. S. Afr. J. Plant Soil 2000, 17, 101–107. [Google Scholar] [CrossRef]
- Zaïm, M.; El Hassouni, K.; Gamba, F.; Filali-Maltouf, A.; Belkadi, B.; Sourour, A.; Amri, A.; Nachit, M.; Taghouti, M.; Bassi, F.M. Wide crosses of durum wheat (Triticum durum Desf.) reveal good disease resistance, yield stability, and industrial quality across Mediterranean sites. Field Crops Res. 2017, 214, 219–227. [Google Scholar] [CrossRef]
- Wricke, G. Übereine Methode zur Erfassung der ökologischen Streubreite in Feldversuchen. Z. Pflanzenzücht. 1962, 47, 92–96. [Google Scholar]
- Shukla, G.K. Some statistical aspects of partitioning genotype-environmental components of variability. Heredity 1972, 28, 237–245. [Google Scholar] [CrossRef]
- Francis, T.R.; Kannenberg, L.W. Yield stability studies in short season maize. I. A descriptive method for grouping genotypes. Can. J. Plant Sci. 1978, 58, 1029–1034. [Google Scholar] [CrossRef]
- Lin, C.S.; Binns, M.R. A superiority measure of cultivar performace for cultivar × location data. Can. J. Plant Sci. 1987, 68, 193–198. [Google Scholar] [CrossRef]
- Huehn, V.M. Beitrage zur erfassung der phanotypischen stabilitat. Med. Biol. 1979, 10, 112–117. [Google Scholar]
- Nassar, R.; Huehn, M. Studies on estimation of phenotypic stability test of significance for nonparametric measures of phenotypic stability. Biometrics 1987, 43, 45–53. [Google Scholar] [CrossRef]
- Lin, C.S.; Binns, M.R.; Lefkovitch, L.P. Stability Analysis: Where Do We Stand. Crop Sci. 1986, 26, 894–900. [Google Scholar] [CrossRef] [Green Version]
- Peterson, C.J.; Graybosch, R.A.; Baenziger, P.S.; Grombacher, A.W. Genotype and Environment Effects on Quality Characteristics of Hard Red Winter Wheat. Crop Sci. 1992, 32, 98–103. [Google Scholar] [CrossRef]
- Sadras, V.O.; Reynolds, M.P.; de la Vega, A.J.; Petrie, P.R.; Robinson, R. Phenotypic plasticity of yield and phenology in wheat, sunflower and grapevine. Field Crops Res. 2009, 110, 242–250. [Google Scholar] [CrossRef]
- Mohammadi, R. Phenotypic plasticity of yield and related traits in rainfed durum wheat. J. Agric. Sci. 2014, 152, 873–884. [Google Scholar] [CrossRef]
- Sadras, V.O.; Rebetzke, G.J. Plasticity of wheat grain yield is associated with plasticity of ear number. Crop Pasture Sci. 2013, 64, 234–243. [Google Scholar] [CrossRef]
- Grogan, S.M.; Anderson, J.; Baenziger, P.S.; Frels, K.; Guttieri, M.J.; Haley, S.D.; Kim, K.S.; Liu, S.; McMaster, G.S.; Newell, M.; et al. Phenotypic Plasticity of Winter Wheat Heading Date and Grain Yield across the US Great Plains. Crop Sci. 2016, 56, 2223–2236. [Google Scholar] [CrossRef]
- Knapp, S.; Brabant, C.; Oberforster, M.; Grausgruber, H.; Hiltbrunner, J. Quality traits in winter wheat: Comparison of stability parameters and correlations between traits regarding their stability. J. Cereal Sci. 2017, 77, 186–193. [Google Scholar] [CrossRef]
- Annicchiarico, P. Joint regression vs. AMMI analysis of genotype-environment interactions for cereals in Italy. Euphytica 1997, 94, 53–62. [Google Scholar] [CrossRef]
- Lozada, D.; Carter, A. Insights into the Genetic Architecture of Phenotypic Stability Traits in Winter Wheat. Agronomy 2020, 10, 368. [Google Scholar] [CrossRef] [Green Version]
- Araus, J.L.; Slafer, G.A.; Royo, C.; Serret, M.D. Breeding for yield potential and stress adaptation in cereals. Crit. Rev. Plant Sci. 2008, 27, 377–412. [Google Scholar] [CrossRef]
- Jalaluddin, M.D.; Harrison, S.A. Repeatability of Stability Estimators for grain yield in wheat. Crop Sci. 1993, 33, 720–725. [Google Scholar] [CrossRef]
- Sneller, C.H.; Kilgore-Norquest, L.; Dombek, D. Repeatability of yield stabillity statistics in soybean. Crop Sci. 1997, 37, 383–390. [Google Scholar] [CrossRef]
- Kabbaj, H.; Sall, A.T.; Al-Abdallat, A.; Geleta, M.; Amri, A.; Filali-Maltouf, A.; Belkadi, B.; Ortiz, R.; Bassi, F.M. Genetic diversity within a global panel of durum wheat landraces and modern germplasm reveals the history of alleles exchange. Front. Plant Sci. 2017, 8, 1277. [Google Scholar] [CrossRef] [Green Version]
- Kyratzis, A.C.; Nikoloudakis, N.; Katsiotis, A. Genetic variability in landraces populations and the risk to lose genetic variation. The example of landrace ‘Kyperounda’ and its implications for ex situ conservation. PLoS ONE 2019, 14, e0224255. [Google Scholar] [CrossRef]
- Josephides, C.M. Ourania, kholina and josephina, three new durum wheat cultivars adapted to cyprus conditions. Tech. Bull. 2007, 229, 1–8. [Google Scholar]
- De Santis, M.A.; Giuliani, M.M.; Giuzio, L.; De Vita, P.; Lovegrove, A.; Shewry, P.R.; Flagella, Z. Differences in gluten protein composition between old and modern durum wheat genotypes in relation to 20th century breeding in Italy. Eur. J. Agron. 2017, 87, 19–29. [Google Scholar] [CrossRef] [PubMed]
- AACC (American Asssociation of Cereal Chemists). Approved Methods of the AACC, Method 14–50. In American Association of Cereal Chemists Methods; AACC: Saint Paul, MN, USA, 1995. [Google Scholar]
- McDonald, C.E. Collaborative study on wet gluten and gluten index determinations for wheat flour or meal (AACC Method 38–12). Cereal Foods World 1994, 39, 403–405. [Google Scholar]
- Alvarado, G.; Marco, L.; Mateo, V.; Ángela, P.; Juan, R.F.B.; José, C. META-R (Multi Environment Trail Analysis with R for Windows) Version 6.04; CIMMYT: Veracruz, Mexico, 2015; Volume 23. [Google Scholar]
- Pacheco, Á.; Mateo, V.; Gregorio, A.; Francisco, R.; José, C.; Juan, B. GEA-R (Genotype × Environment Analysis with R for Windows) Version 4.1; CIMMYT: Veracruz, Mexico, 2015; Volume 16. [Google Scholar]
- Gollob, H.F. A statistical model which combines features of factor analytic and analysis of variance techniques. Psychometrika 1968, 33, 73–115. [Google Scholar] [CrossRef] [PubMed]
- Morpheus Online Software. Available online: https://software.broadinstitute.org/morpheus (accessed on 9 March 2022).
- Subira, J.; Álvaro, F.; del Moral, L.F.G.; Royo, C. Breeding effects on the cultivar × environment interaction of durum wheat yield. Eur. J. Agron. 2015, 68, 78–88. [Google Scholar] [CrossRef] [Green Version]
- Solomon, K.F.; Smit, H.A.; Malan, E.; Du Toit, W.J. Parametric model based assessment of genotype × environment interavctions of grain yield in durum wheat under irrigation. Int. J. Plant Prod. 2008, 2, 23–35. [Google Scholar]
- Mohammadi, R.; Sadeghzadeh, B.; Poursiahbidi, M.M.; Ahmadi, M.M. Integrating univariate and multivariate statistical models to investigate genotype × environment interaction in durum wheat. Ann. Appl. Biol. 2020, 178, 450–465. [Google Scholar] [CrossRef]
- Mohammadi, R.; Amri, A. Comparison of parametric and non-parametric methods for selecting stable and adapted durum wheat genotypes in variable environments. Euphytica 2007, 159, 419–432. [Google Scholar] [CrossRef]
- Flores, F.; Moreno, M.T.; Cubero, J.I. A comparison of univariate and multivariate methods to analyze G × E interaction. Field Crops Res. 1998, 56, 271–286. [Google Scholar] [CrossRef]
- Quintero, A.; Molero, G.; Reynolds, M.P.; Calderini, D.F. Trade-off between grain weight and grain number in wheat depends on G × E interaction: A case study of an elite CIMMYT panel (CIMCOG). Eur. J. Agron. 2018, 92, 17–29. [Google Scholar] [CrossRef]
- Ortiz, R.; Wagoire, W.W.; Hill, J.; Chandra, S.; Madsen, S.; Stølen, O. Heritability of the correlations among genotype by environment stability statistics for grain yeild in bread wheat. Theor. Appl. Genet. 2001, 103, 469–474. [Google Scholar] [CrossRef] [Green Version]
- Royo, C.; Martos, V.; Ramdani, A.; Villegas, D.; Rharrabti, Y.; García del Moral, L.F. Changes in yield and carbon isotope discrimination of italian and spanish durum wheat during the 20th century. Agron. J. 2008, 100, 352–360. [Google Scholar] [CrossRef]
Figure 1.
Box plots depicting the genetic variation and the variation between environments for agronomic traits from Experiment One (a) and Experiment Two (b). Cultivars which performed as outliers are shown. Box plots are sorted in descending order. (ACH = Ahelia, DR = Dromolaxia, ATH = Athalassa, Pol = Polis, 12, 13, 14, 15, 16, 17 = growing seasons 2011/12, 2012/13, 2013/14, 2014/15, 2015/16, 2016/17, respectively).

Figure 2.
Box plots depicting the genetic variation and the variation between environments for agronomic and quality traits from Experiment One. Cultivars which performed as outliers are shown. Box plots are sorted in descending order. (ACH = Ahelia, DR = Dromolaxia, ATH = Athalassa, 12, 13, 14 = growing seasons 2011/12, 2012/13, 2013/14 respectively).

Figure 3.
Hierarchical cluster analysis based on stability parameters derived from Experiment One and Experiment Two for grain yield ((a) and (b), respectively) and for number of seeds per meter square ((c) and (d), respectively).
Figure 3.
Hierarchical cluster analysis based on stability parameters derived from Experiment One and Experiment Two for grain yield ((a) and (b), respectively) and for number of seeds per meter square ((c) and (d), respectively).

Figure 4.
Hierarchical cluster analysis based on stability parameters derived from Experiment One and Experiment Two for thousand kernel weight ((a) and (b), respectively) and for volume weight ((c) and (d) respectively).
Figure 4.
Hierarchical cluster analysis based on stability parameters derived from Experiment One and Experiment Two for thousand kernel weight ((a) and (b), respectively) and for volume weight ((c) and (d) respectively).

Figure 5.
Hierarchical cluster analysis based on stability parameters derived from Experiment One for number of tillers per meter square (a), seeds per spike (b), yellow pigment content (c), protein content (d), and gluten index (e).
Figure 5.
Hierarchical cluster analysis based on stability parameters derived from Experiment One for number of tillers per meter square (a), seeds per spike (b), yellow pigment content (c), protein content (d), and gluten index (e).

Figure 6.
Heat maps on Spearman correlations of stability parameters and mean values derived from Experiment One. Coefficient of Variance (CV), the slope of the regression of individual genotypes and their deviation from regression according to Eberhart and Russell (bi and s2di), Huehn’s non-parametric coefficient Si(1), and AMMI Stability Value (ASV), n = 20.

Figure 7.
Heat maps on Spearman correlations of stability parameters and mean values derived from Experiment Two. Coefficient of Variance (CV), the slope of the regression of individual genotypes and their deviation from regression according to Eberhart and Russell (bi and s2di), Huehn’s non-parametric coefficient Si(1), and AMMI Stability Value (ASV), n = 16.


Table 1.
List of the durum wheat cultivars used in the present study.
| Experiment One | |||||||
| A/A | Name | Country of Registration/Origin | Year of Release | A/A | Name | Country of Registration/Origin | Year of Release |
| 1 | Aronas | Cyprus | 1977 | 11 | Pisti * | Greece | 2008 |
| 2 | Mesaoria | Cyprus | 1982 | 12 | Simeto * | Italy | 1988 |
| 3 | Karpasia | Cyprus | 1985 | 13 | Duilio | Italy | 1984 |
| 4 | Makedonia = KIA * 2/VIC CYD85-345-18D-OP-3P-OP * | Cyprus | 1994 | 14 | Iride | Italy | 1996 |
| 5 | Ourania = CULT.DW/T.DIC. CYD88-0A-0A-88A-2A-0A-1P-0P * | Cyprus | 2006 | 15 | Claudio * | Italy | 1998 |
| 6 | Hekabe = DRA”S”//LLOYD/KIA CYD89-862-0D-18P-0P-3P-0P * | Cyprus | 2003 | 16 | Svevo | Italy | 1996 |
| 7 | Anna | Greece | 2000 | 17 | Adnan2 | ICARDA | - |
| 8 | Atlas | Greece | 1995 | 18 | Omrabi5 | ICARDA | - |
| 9 | Matt * | Greece | 2003 | 19 | Korifla | ICARDA | - |
| 10 | Mexikali81 | Greece | 1985 | 20 | Waha * | ICARDA | - |
| Experiment Two | |||||||
| A/A | Name | Country of Registration/Origin | Year of Release | A/A | Name | Country of Registration/Origin | Year of Release |
| 1 | Hekabe = DRA”S”//LLOYD/KIA CYD89-862-0D-18P-0P-3P-0P * | Cyprus | 2003 | 9 | Pisti * | Greece | 2008 |
| 2 | Ourania = CULT.DW/T.DIC. CYD88-0A-0A-88A-2A-0A-1P-0P * | Cyprus | 2006 | 10 | Simeto * | Italy | 1988 |
| 3 | Icajihan 1 | ICARDA | - | 11 | Claudio * | Italy | 1998 |
| 4 | Icarasha 1 | ICARDA | - | 12 | Makedonia = KIA * 2/VIC CYD85-345-18D-OP-3P-OP * | Cyprus | 1994 |
| 5 | Ammar 3 | ICARDA | - | 13 | BrLine988 = RASCON-37/2*TARRO-2//HEKABE CYD 03-1866-69P-2P-0P-1P-0P | Cyprus | Under registration process |
| 6 | Cham 3 | ICARDA | - | 14 | BrLine996 = ZEGZAG/ALTAR 84//DIPPER-2/3/LLOYD/KIA * 3 CYD 03-1884-44P-3P-0P-1P-0P | Cyprus | Under registration process |
| 7 | Cham 1 (Waha) * | ICARDA | - | 15 | BrLine1129 = GEROMTEL1/ICASYR1 ICD04-1101-TA-0AP-3AP-0AP-0D | Cyprus | Under registration process |
| 8 | Matt* | Greece | 2003 | 16 | BrLine1131= AGHRASS1/3/MRF1//MRB16/RU ICD00-0834-C-32AP-0AP-6AP-TR-0D | Cyprus | Under registration process |
* Cultivars that were common to the two field experiments.
Table 2.
Experiment One: Cultivars’ mean values across environments, overall means, least significant differences (LSD), broad sense heritability (H2), Coefficient of Variations (CVs), percentage of variance explained by the main effects, and the interaction of the combined analysis, percentage of variance explained by the two first axes of the AMMI analysis (PC1 and PC2), percentage of variance explained by the heterogeneity of the slopes [G × E (linear)], and the deviation from regression (Pooled dev). Statistically significant differences are shown.
| Genotype | GDD | PH | GRYLD | NTLSM | SPS | NSSM | TKW | VW | CAR | PRO | GI |
|---|---|---|---|---|---|---|---|---|---|---|---|
| Adnan | 1262 | 82.24 | 4204 | 302 | 41.3 | 12,781 | 32.7 | 75.4 | 6.73 | 16.0 | 4.13 |
| Anna | 1187 | 85.09 | 4175 | 361 | 26.5 | 9574 | 40.3 | 74.6 | 6.41 | 16.1 | 43.4 |
| Aronas | 1231 | 87.13 | 3920 | 320 | 28.0 | 9170 | 37.3 | 74.4 | 3.87 | 17.3 | 57.5 |
| Atlas | 1278 | 84.77 | 3802 | 307 | 25.7 | 8161 | 41.8 | 77.9 | 6.51 | 18.4 | 19.7 |
| Claudio | 1334 | 83.05 | 3929 | 302 | 28.5 | 8855 | 40.5 | 78.4 | 6.31 | 17.9 | 39.4 |
| Duillio | 1238 | 83.15 | 4135 | 299 | 30.0 | 9114 | 42.3 | 77.4 | 5.56 | 16.4 | 43.0 |
| Hekabe | 1238 | 86.63 | 4199 | 317 | 30.8 | 9898 | 39.1 | 74.7 | 8.95 | 17.4 | 46.7 |
| Iride | 1253 | 78.00 | 4169 | 267 | 41.3 | 11,237 | 34.8 | 76.2 | 6.48 | 16.9 | 52.9 |
| Karpasia | 1275 | 83.29 | 4097 | 316 | 34.1 | 10,967 | 33.0 | 74.5 | 7.39 | 18.2 | 6.22 |
| Korifla | 1293 | 82.63 | 3681 | 321 | 31.2 | 10,235 | 35.0 | 73.8 | 6.62 | 17.2 | 42.3 |
| Macedonia | 1222 | 84.29 | 4607 | 371 | 32.0 | 12,022 | 34.9 | 75.2 | 8.77 | 16.9 | 50.8 |
| Matt | 1191 | 82.31 | 4184 | 320 | 31.8 | 10,345 | 36.8 | 75.1 | 9.71 | 17.0 | 75.4 |
| Mesaoria | 1189 | 73.47 | 4066 | 325 | 27.9 | 9287 | 37.0 | 72.8 | 5.68 | 18.0 | 7.70 |
| Mexicali | 1195 | 81.44 | 4059 | 339 | 27.7 | 9555 | 39.8 | 74.3 | 6.86 | 16.0 | 46.5 |
| Omrabi5 | 1253 | 97.34 | 4042 | 333 | 28.5 | 9559 | 36.6 | 77.0 | 7.06 | 17.0 | 24.4 |
| Ourania | 1262 | 84.66 | 4352 | 340 | 31.9 | 11,084 | 36.1 | 76.8 | 7.83 | 17.3 | 49.2 |
| Pisti | 1181 | 82.11 | 4475 | 375 | 27.9 | 10,549 | 41.0 | 75.6 | 6.28 | 16.2 | 60.4 |
| Simeto | 1311 | 76.25 | 4110 | 288 | 28.0 | 8336 | 45.7 | 75.8 | 6.71 | 17.0 | 56.0 |
| Svevo | 1231 | 86.29 | 3910 | 329 | 27.2 | 9058 | 39.2 | 76.4 | 8.05 | 18.6 | 39.5 |
| Waha | 1217 | 82.49 | 4237 | 288 | 31.1 | 9160 | 42.3 | 74.7 | 6.25 | 16.9 | 27.3 |
| Mean | 1242 | 83.33 | 4118 | 321 | 30.6 | 9947 | 38.3 | 75.5 | 6.90 | 17.1 | 39.6 |
| LSD 0.05 | 7.23 | 1.71 | 212 | 18 | 1.38 | 713 | 0.99 | 0.54 | 0.18 | 0.52 | 2.87 |
| CV (%) | 1.22 | 4.32 | 10.8 | 11.5 | 9.51 | 15.1 | 5.42 | 1.49 | 3.88 | 4.44 | 10.7 |
| H2 | 97.3 | 93.0 | 59.1 | 87.7 | 96.3 | 91.4 | 92.7 | 87.3 | 98.9 | 83.0 | 93.4 |
| Environment | 76.6 *** | 33.0 *** | 91.9 *** | 60.3 *** | 38.0 *** | 64.0 *** | 85.1 *** | 86.5 *** | 16.1 *** | 86.6 *** | 41.9 *** |
| Cultivar | 17.3 *** | 31.5 *** | 0.95 *** | 10.7 *** | 37.7 *** | 11.2 *** | 8.27 *** | 5.47 *** | 77.6 *** | 4.11 *** | 42.8 *** |
| Env * Cult | 2.37 *** | 11.0 *** | 1.94 *** | 6.54 *** | 7.03 *** | 4.81 *** | 3.01 *** | 3.47 *** | 4.36 *** | 3.50 *** | 14.1 *** |
| PC1 | 42.04 *** | 51.81 *** | 44.93 *** | 43.61 ** | 33.43 ** | 43.20 * | 42.46 *** | 59.28 *** | 48.90 *** | 37.70 | 57.16 *** |
| PC2 | 30.87 *** | 20.89 * | 29.88 ** | 25.56 | 30.97 ** | 26.32 | 34.61 *** | 23.20 *** | 22.93** | 29.39 | 21.67 *** |
| G × E (linear) | 36.24 ** | 42.47 ** | 11.23 | 26.28 | 15.55 | 13.22 | 33.32 * | 54.07 *** | 45.75 *** | 33.91 ** | 55.99 *** |
| Pooled dev | 63.76 | 57.53 | 88.77 | 73.72 | 84.45 | 86.78 | 66.68 | 45.93 | 54.25 | 66.09 | 44.01 |
* p < 0.05, ** p < 0.01, *** p < 0.0001, [Growing degree days to heading (GDD), Plant height (PH), Grain yield (GRYLD), Number of seeds per m2 (NSSM), Number of fertile tillers per m2 (NTLSM), Seeds per spike (SPS), Thousand kernel weight (TKW), Volume weight (VW), Protein content (PRO), Yellow pigment concentration (CAR), Gluten index (GI)].
Table 3.
Experiment Two: Cultivars’ mean values across environments, overall means, least significant differences (LSD), broad sense heritability (H2), Coefficient of Variations (CVs), percentage of variance explained by the main effects and the interaction of the combined analysis, percentage of variance explained by the two first axes of the AMMI analysis (PC1 and PC2), percentage of variance explained by the heterogeneity of the slopes [G × E (linear)], and the deviation from regression (Pooled dev). Statistically significant differences are shown.
| Cultivar | GDD | PH | GRYLD | NSSM | TKW | VW |
|---|---|---|---|---|---|---|
| Ammar3 | 1245 | 77.3 | 2718 | 6221 | 42.2 | 79.6 |
| BrLine1129 | 1199 | 76.3 | 2808 | 6000 | 45.4 | 79.2 |
| BrLine1131 | 1207 | 78.8 | 2937 | 6266 | 45.8 | 79.5 |
| BrLine988 | 1191 | 77.6 | 3004 | 6407 | 45.6 | 78.9 |
| BrLine996 | 1242 | 77.4 | 2891 | 6469 | 43.6 | 79.7 |
| Cham1 | 1219 | 75.6 | 2700 | 6615 | 39.4 | 78.1 |
| Cham3 | 1258 | 78.5 | 2752 | 6313 | 42.3 | 77.9 |
| Claudio | 1321 | 78.7 | 2530 | 5577 | 43.5 | 80.4 |
| Hekabe | 1210 | 79.8 | 2894 | 5995 | 46.8 | 78.2 |
| Icajihan1 | 1216 | 78.2 | 2492 | 5150 | 46.6 | 80.0 |
| Icarasha1 | 1165 | 81.4 | 2640 | 5809 | 44.3 | 80.0 |
| Makedonia | 1207 | 75.7 | 2934 | 7127 | 39.9 | 77.9 |
| Matt | 1191 | 74.5 | 2689 | 6190 | 41.6 | 78.1 |
| Ourania | 1232 | 77.2 | 2776 | 6348 | 42.2 | 79.6 |
| Pisti | 1174 | 73.7 | 2828 | 5964 | 45.7 | 78.3 |
| Simeto | 1285 | 72.9 | 2543 | 4939 | 49.6 | 78.2 |
| Mean | 1223 | 77.1 | 2759 | 6087 | 44.0 | 79.0 |
| LSD 0.05 | 6.91 | 1.44 | 112 | 219 | 0.78 | 0.27 |
| CV (%) | 1.78 | 5.89 | 12.8 | 11.4 | 5.62 | 1.06 |
| H2 | 97.3 | 84.3 | 80.8 | 92.9 | 94.2 | 90.8 |
| Environment | 85.1 *** | 87.5 *** | 90.1 *** | 87.3 *** | 70.4 *** | 31.5 *** |
| Cultivar | 9.50 *** | 1.89 *** | 0.88 *** | 2.97 *** | 11.8 *** | 23.2 *** |
| Env*Cult | 2.06 *** | 2.38 *** | 1.34 *** | 1.69 *** | 5.48 *** | 17.1 *** |
| PC1 | 61.11 *** | 40.24 *** | 33.66 * | 36.42 ** | 42.46 *** | 50.84 *** |
| PC2 | 13.44 *** | 19.51 ** | 19.60 | 21.70 * | 34.61 *** | 16.23 *** |
| G × E (linear) | 29.44 ** | 23.24 ** | 21.17 * | 31.09 ** | 10.15 | 16.50 |
| Pooled dev | 70.56 | 76.76 | 78.83 | 68.91 | 89.95 | 83.50 |
* p < 0.05, ** p < 0.01, *** p < 0.0001, [Growing degree days to heading (GDD), Plant height (PH), Grain yield (GRYLD), Number of seeds per m2 (NSSM), Thousand kernel weight (TKW), Volume weight (VW)].
Table 4.
Spearman correlations of stability parameters and mean values derived from the eight cultivars that were common to the two experiments.
Table 4.
Spearman correlations of stability parameters and mean values derived from the eight cultivars that were common to the two experiments.
| Trait | Mean | CV(%) | bi | S2di | σ2 | Pi | Si(1) | Si(2) | AWAI | ASV |
|---|---|---|---|---|---|---|---|---|---|---|
| GDD | 0.929 ** | −0.095 | −0.238 | 0.738 * | 0.714 * | 0.929 ** | 0.479 | 0.096 | 0.643 | 0.595 |
| PH | 0.929 ** | −0.048 | 0.095 | 0.667 | 0.762 * | 0.881 ** | 0.675 | 0.905 ** | 0.762 * | 0.643 |
| GRYLD | 0.857 ** | 0.762 * | 0.857 ** | 0.595 | 0.690 | 0.929 ** | 0.024 | −0.119 | 0.048 | 0.024 |
| NSSM | 0.690 | 0.619 | 0.524 | 0.119 | −0.524 | 0.738 * | 0.405 | 0.476 | −0.024 | −0.190 |
| TKW | 0.405 | 0.548 | 0.619 | 0.286 | 0.048 | 0.405 | 0.762 * | 0.500 | 0.000 | −0.190 |
| VW | 0.643 | 0.000 | 0.619 | 0.476 | 0.571 | 0.714 * | −0.240 | 0.310 | 0.524 | 0.595 |
* p < 0.05, ** p < 0.01, n = 8, GDD = Growing Degree days to Heading, PH = Plant height, GRYLD = Grain Yield, NSSM, Number of seeds per square meter, TKW = Thousand Kernel Weight, VW = Volume Weight.
Publisher’s Note: MDPI stays neutral with regard to jurisdictional claims in published maps and institutional affiliations. |
© 2022 by the authors. Licensee MDPI, Basel, Switzerland. This article is an open access article distributed under the terms and conditions of the Creative Commons Attribution (CC BY) license (https://creativecommons.org/licenses/by/4.0/).
Share and Cite
MDPI and ACS Style
Kyratzis, A.C.; Pallides, A.; Katsiotis, A. Investigating Stability Parameters for Agronomic and Quality Traits of Durum Wheat Grown under Mediterranean Conditions. Agronomy 2022, 12, 1774. https://doi.org/10.3390/agronomy12081774
AMA Style
Kyratzis AC, Pallides A, Katsiotis A. Investigating Stability Parameters for Agronomic and Quality Traits of Durum Wheat Grown under Mediterranean Conditions. Agronomy. 2022; 12(8):1774. https://doi.org/10.3390/agronomy12081774
Chicago/Turabian StyleKyratzis, Angelos C., Andreas Pallides, and Andreas Katsiotis. 2022. "Investigating Stability Parameters for Agronomic and Quality Traits of Durum Wheat Grown under Mediterranean Conditions" Agronomy 12, no. 8: 1774. https://doi.org/10.3390/agronomy12081774
Note that from the first issue of 2016, this journal uses article numbers instead of page numbers. See further details here.