Article

Evaluation of the Effects of Airflow Distribution Patterns on Deposit Coverage and Spray Penetration in Multi-Unit Air-Assisted Sprayer

1
Centre for Chemicals Application Technology, China Agricultural University, Beijing 100193, China
2
College of Science, China Agricultural University, Beijing 100193, China
3
Tropics and Subtropics Group, Institute of Agricultural Engineering, University of Hohenheim, 70599 Stuttgart, Germany
*
Author to whom correspondence should be addressed.
Agronomy 2022, 12(4), 944; https://doi.org/10.3390/agronomy12040944
Submission received: 21 March 2022 / Revised: 11 April 2022 / Accepted: 12 April 2022 / Published: 14 April 2022
(This article belongs to the Special Issue Agricultural Environment and Intelligent Plant Protection Equipment)

Abstract

:
Efficient utilization is a pre-requisite for pesticide reduction, and appropriate airflow distribution pattern plays a key role in enhancing the effectiveness of pesticide application by air-assisted orchard sprayers, yet the mechanism of this is unclear. In order to clarify the specific effects of airflow velocity and direction on spraying efficacy, a series of spray tests on pear and cherry and airflow distribution tests in open areas were conducted by a multi-unit air-assisted sprayer on ten different fan settings. Several deposit indicators were analyzed and contrasted with the air distribution. The results showed that an increase in airflow velocity inside the canopy improved the abaxial side deposit coverage of both pear (from 3.33% to 11.80% in the Top canopy and from 6.26% to 11.00% in the Upper canopy) and cherry leaves (from 3.61% to 10.87% in the Top canopy, from 1.36% to 9.04% in the Middle canopy, and from 3.40% to 9.04% in the Bottom canopy), but had no significant effect on the spray penetration. The correlation between deposit indicators and airflow velocities/directions was evaluated, and the results indicated that the enhanced airflow velocities, both in the forward and horizontal direction, improved the abaxial side deposit coverage (CAB) on the outside of pear canopy (p < 0.001), but for cherry, none of the airflow indicators had a significant impact on the CAB independently. On the other hand, the increased airflow direction angle in the cross-row plane for pear, as well as the increased airflow velocities in forward and vertical direction for cherry, both showed negative effects on the adaxial side deposit coverage (p < 0.01). The findings in this study might be helpful to improve the performance of pesticide application in orchards, especially for abaxial side deposition, and could provide a reference for the further investigations about the effect of airflow on spray canopy deposition.

1. Introduction

The reduction of pesticide application has been a consistent proposition of the Chinese government for many years, and it has also been included in the most important national development plan [1] as a significant goal of agricultural reform several times. Normally, the efficient utilization of pesticide, which means the active ingredient should be delivered to the target precisely, uniformly, and exclusively, was considered a key way to achieve pesticide reduction.
Pear and cherry are two cash crops grown on a large scale in several provinces in China, and their market demand has been increasing year by year. Recently, several investigations on pear and cherry orchards and their managers have been conducted by our team, and it was found that several kinds of diseases and pests occurred on the abaxial side of leaves, such as Pear psylla [2] and brown rot [3], which had a serious detrimental effect on the yield and quality of the fruits. Therefore, during the pesticide application in orchard, it is necessary to ensure sufficient deposit on the abaxial side of the leaves.
For decades, the air-assisted sprayer has been recognized as a high efficiency pesticide application equipment and is widely used for disease and pest control in the orchards. The main principle of air-assisted sprayers to improve the spraying effect is that the airflow generated by the fan sends droplets into and disturbs the tree canopy to increase spray deposition and enhance the uniformity of the droplet distribution [4,5,6,7]. In recent years, the axial fan sprayer [8,9] (AAS) and air tower sprayer [10,11] (ATS) have been the most widely used orchard application equipment, due to the stability of performance and convenience of operation. Various studies have focused on the spray effect of both the two types of sprayers, and there seems to be a general consensus that the spray deposition can directly or indirectly be affected by not only the canopy structure [12], but also the physicochemical properties of pesticides [13], the meteorological conditions [14] and operation techniques [15], among others. However, in most cases, the canopy structure of trees in the orchard is relatively stable with good management, where the application of pesticides mainly depends on the type and outbreak degree of pest and disease. Furthermore, there is no doubt that the artificial control of meteorological conditions is hard to achieve. All these factors make the adjustment of sprayer operation the most direct and effective way to improve the spray effect.
To date, the influence of the operating techniques on the spray effect, including travel speed, nozzle type, spray pressure, etc., have been explored by many researchers. Salyani, M. and Whitney, J.D. [16] characterized the effects of sprayer ground speed (1.6–6.4 km/h) on spray deposition at different locations within citrus tree canopies, and the results showed that travel speed did not have a significant effect on mean deposition in the tree canopy; however, variability of deposition increased as speed increased. The spray characteristics of the nozzle play an essential role in the pesticide application, especially for spray deposition. Hence, Nuyttens, D. et al. [17] tested the droplet size spectra of 32 nozzle-pressure combinations and expounded the effect of the nozzle type, size, and pressure on the droplet size and velocity spectra. It should be emphasized that droplet velocity is important with regard to canopy penetration and leaving surface retention. On the other hand, smaller droplets, especially those less than 150 [18] or 200 μm [19] in diameter, are more susceptible to airflow. According to applications based on an axial-fan air-blast orchard sprayer made by Derksen et al. [20], the smaller droplets can provide higher coverage than larger droplets on the axial side of leaves, and the authors believed that greater air turbulence was needed to improve this. However, considering that smaller droplets also have a higher risk of off target or drift, the balance between the advantages and the risk of off-target pollution should also be taken into account [21,22].
In addition to the above factors, the impact of spray distribution pattern on the pesticide application performance cannot be ignored. According to Gil et al. [23], an adequate adjustment of spray liquid distribution to the canopy structure can reduce spray drift up to 90% and reduce pesticide use up to 20%. Li et al. [24] conducted a comparative experiment on profile variable rate spray and conventional air assisted spray in orchard, and the results showed that a 23.2% reduction of spray drift and a 67.4% reduction of ground losses happened after adjusting the spray distribution pattern, moreover, a 45.7% saving of the solution was also obtained. It is now generally accepted that the spray distribution is directly determined by and dependent on the airflow pattern [4], including airflow velocity, direction, and their distribution in space. Farooq et al. [25] evaluated the spray penetration into the citrus canopy in two different airflow rates using air-carrier sprayers, results indicated that the higher airflow resulted in a better spray penetration and a significantly larger deposition in the far section of the canopy than the lower airflow. Holownicki et al. [26] compared three axial fan sprayers with different air discharge systems in the modern orchard, including conventional, cross-flow, and a high-volume directed air-jet (HVDAS) with the air spouts directed at 20 and 40° upwards, and the HVDAS with air spouts set 20° upwards produced a higher canopy deposit and a lower off-target loss than the other two sprayers. Another work [27], by investigating the effects of changing the fan speeds (1400, 2000 and 2500 rpm) and the direction of the air-jet (90 and 120° backward angle of the outlet side deflectors in relation to the treated row), studied the performance of a sprayer fitted with two vertical adjustable air outlets in vineyards, the highest deposit was observed with 1400 and 2000 rpm fan speeds and 120° backward angled air outlets, and the high 2500 rpm fan speed improved the degree and the uniformity of the spray coverage. Proper adjustment of the airflow velocity plays a key role in the efficiency of spray application [28,29]. However, excessive airflow will also reduce the canopy deposition [30] and lead to more spray loss and drift [31]. All these studies show that proper adjustment of airflow plays a key role in the efficiency of spray application. Therefore, as a prerequisite for determining the optimal adjustment, the specific effect of airflow on spray canopy deposition should be defined.
In order to clarify the correlations of airflow velocity distribution and direction with spray deposit in different parts of the canopy, we conducted a series of spray tests in the orchard and airflow distribution tests in an open field with different unit fan parameters, which were determined by the canopy characteristics of pear and cherry. In the end, the effect of the fan unit adjustment was evaluated by analyzing the correlation between the airflow velocity and direction with the canopy deposition. These were all based on a multi-unit air-assisted sprayer independently developed by our team.

2. Materials and Methods

2.1. Sprayer Characteristics

Figure 1 shows the multi-unit air-assisted sprayer (MAS). The length and width of the MAS were 3.2 m and 1.5 m, the rated power of the engine is 6.3 Kw. Three units were installed on both sides of the sprayer with a fan hood depth of 150 mm. Each of the units, equipped with 20-inch carbon-fiber fan blades driven by a brushless motor, were connected to the vertical support rod by a mechanical joint that ensured the manual adjustment of installation height and tilt angle could be achieved. The rotation rate of each brushless motor could be controlled independently through a specially made control box, and both of the brushless motors and the box were powered by a 24 V storage battery (Fengfan, Baoding, China) linked to a 3.5 kW range extender to provide stable working voltage. Four hollow cone nozzles HCI4001 (ARAG, Rubiera, Italy) were equidistantly installed at the air outlet of the unit. The spray angle of HCI4001 was 40°, the volume flow rate was 0.39 L/min, and the volume median diameter of the droplet was 121 μm at a spray pressure of 0.3 MPa. The droplet diameter was tested by Spraytech Particle size analyzers [32] (Malvern Panalytical, Worcestershire, UK) according to ISO 13320:2020 [33].

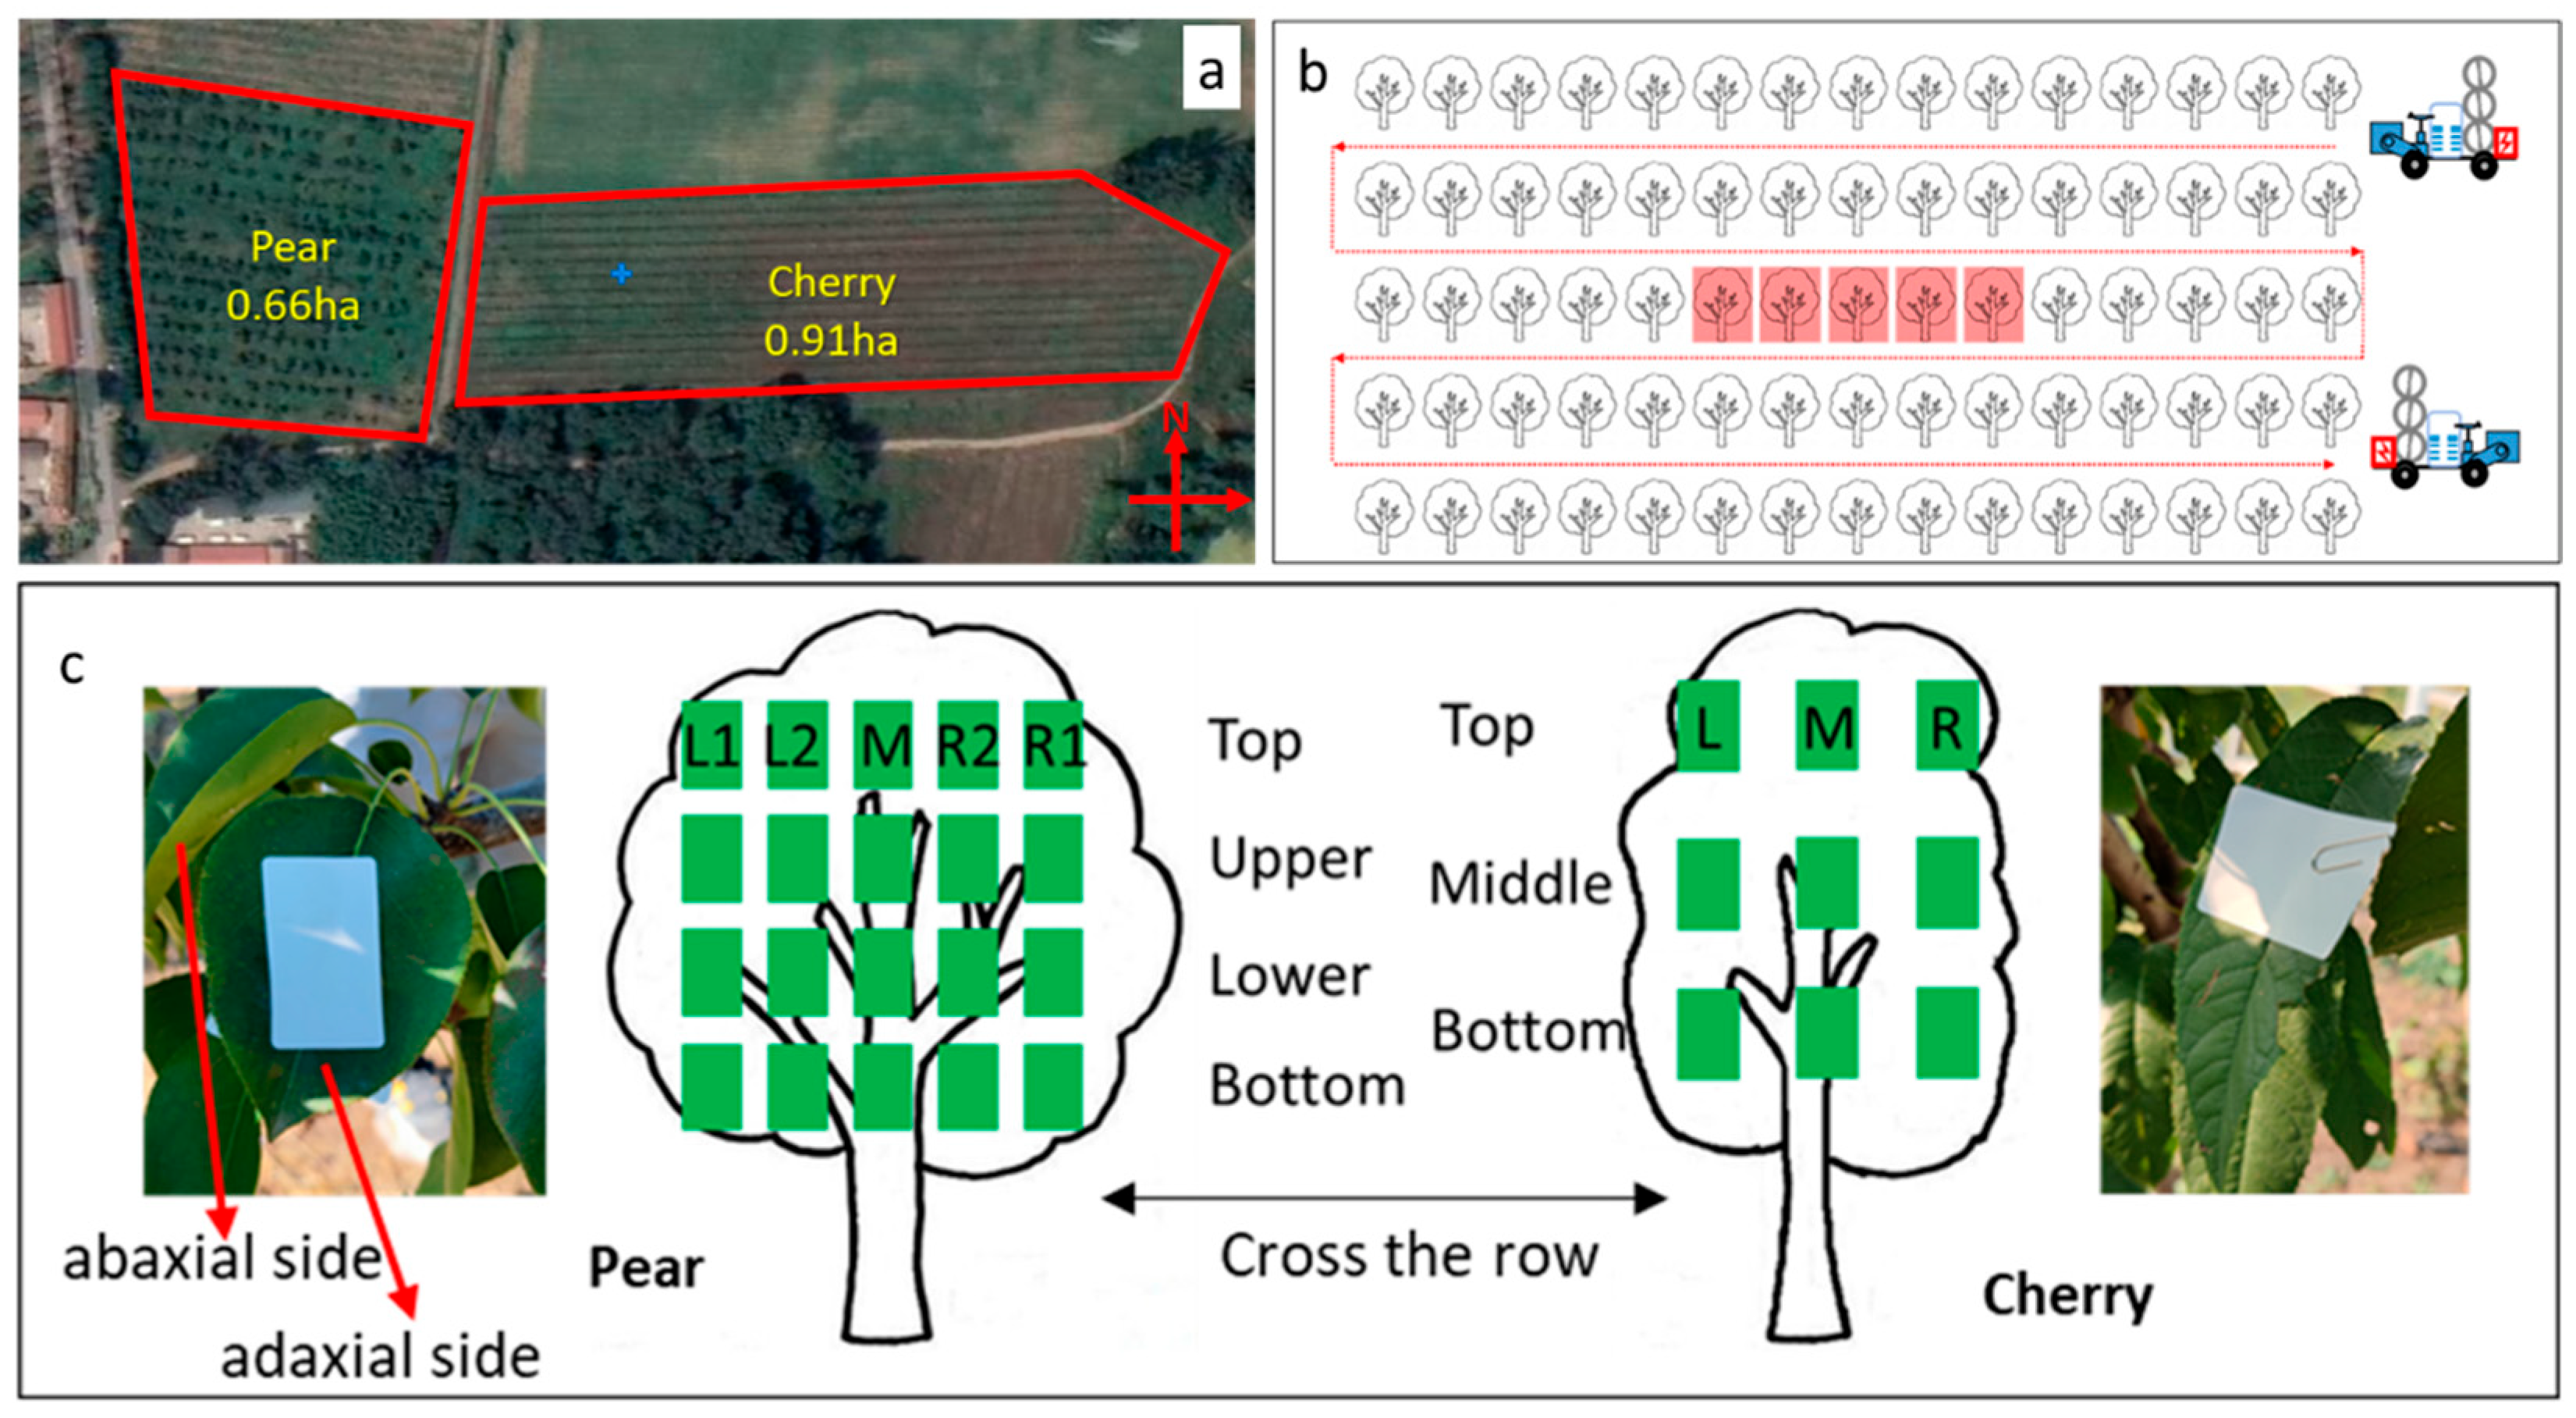
2.2. Spray Test Site

Figure 2a showed the spray test site in Haidian District, Beijing (116.19° E, 40.15° N), which was a plain area. The 15-years-old pear (Pyrus bretschneideri) orchard covered an area of 0.66 ha, trees were planted in a 6 m by 3 m row and tree spacing, and the average tree height was 3.1 m. The 4-years-old cherry (Cerasus pseudocerasus) orchard covered an area of 0.91 ha, the row and tree spacing were 4 m and 1 m, and the average tree height was 2.6 m. Tests were conducted in August 2021. During this period, the weather continued without rain, the temperature remained at 27.6–33.4 °C in the daytime, and the wind speed was below 1 m/s during the experiment—all of these provided a suitable meteorological condition for spraying.

2.3. Experimental Design

2.3.1. Spray Test

Five rows in the middle of the orchard were selected for application (Figure 2b). Five consecutive trees were sampled in the middle row, and these trees were not less than 10 m from the beginning and end of the row to make sure the MAS was working stably when passing through. There were 4 layers set on each of the sample trees of pear and 5 sample points were set in each layer (Figure 2c). There were 3 layers for cherry trees and 3 sample points in each layer. All of the layer and sample parameters, including layer height, layer width, and the distance between sample and trunk, were measured and shown in Table 1. A well-grown leaf was chosen within the area 15 cm from the sample point and 2 white art papers (60 mm × 40 mm) were attached on the adaxial side (ADS) and abaxial side (ABS) of it. The application volume was 225 L/ha. Ponceau 4R, a dye usually used as a food coloring with no risk of environmental pollution and human and animal poisoning, was added as a tracer with a concentration of 5 g/L. During each test, the time when the MAS entered and left the test area was recorded to ensure that the deviation of the actual application volume from the set value did not exceed 5%. All tests were repeated 3 times (Table 1).
According to the canopy characteristics of pear and cherry, 10 parameters were settled within the adjustable range of the fan (Table 2). OSC1–OSC6 were used on cherry, the fan speed was different between OSC1–OSC3, the installation height of the middle unit between OSC4 and OSC5 was different by 100 mm, and the vertical installation angle of the middle unit between OSC5 and OSC6 was different by 20°.

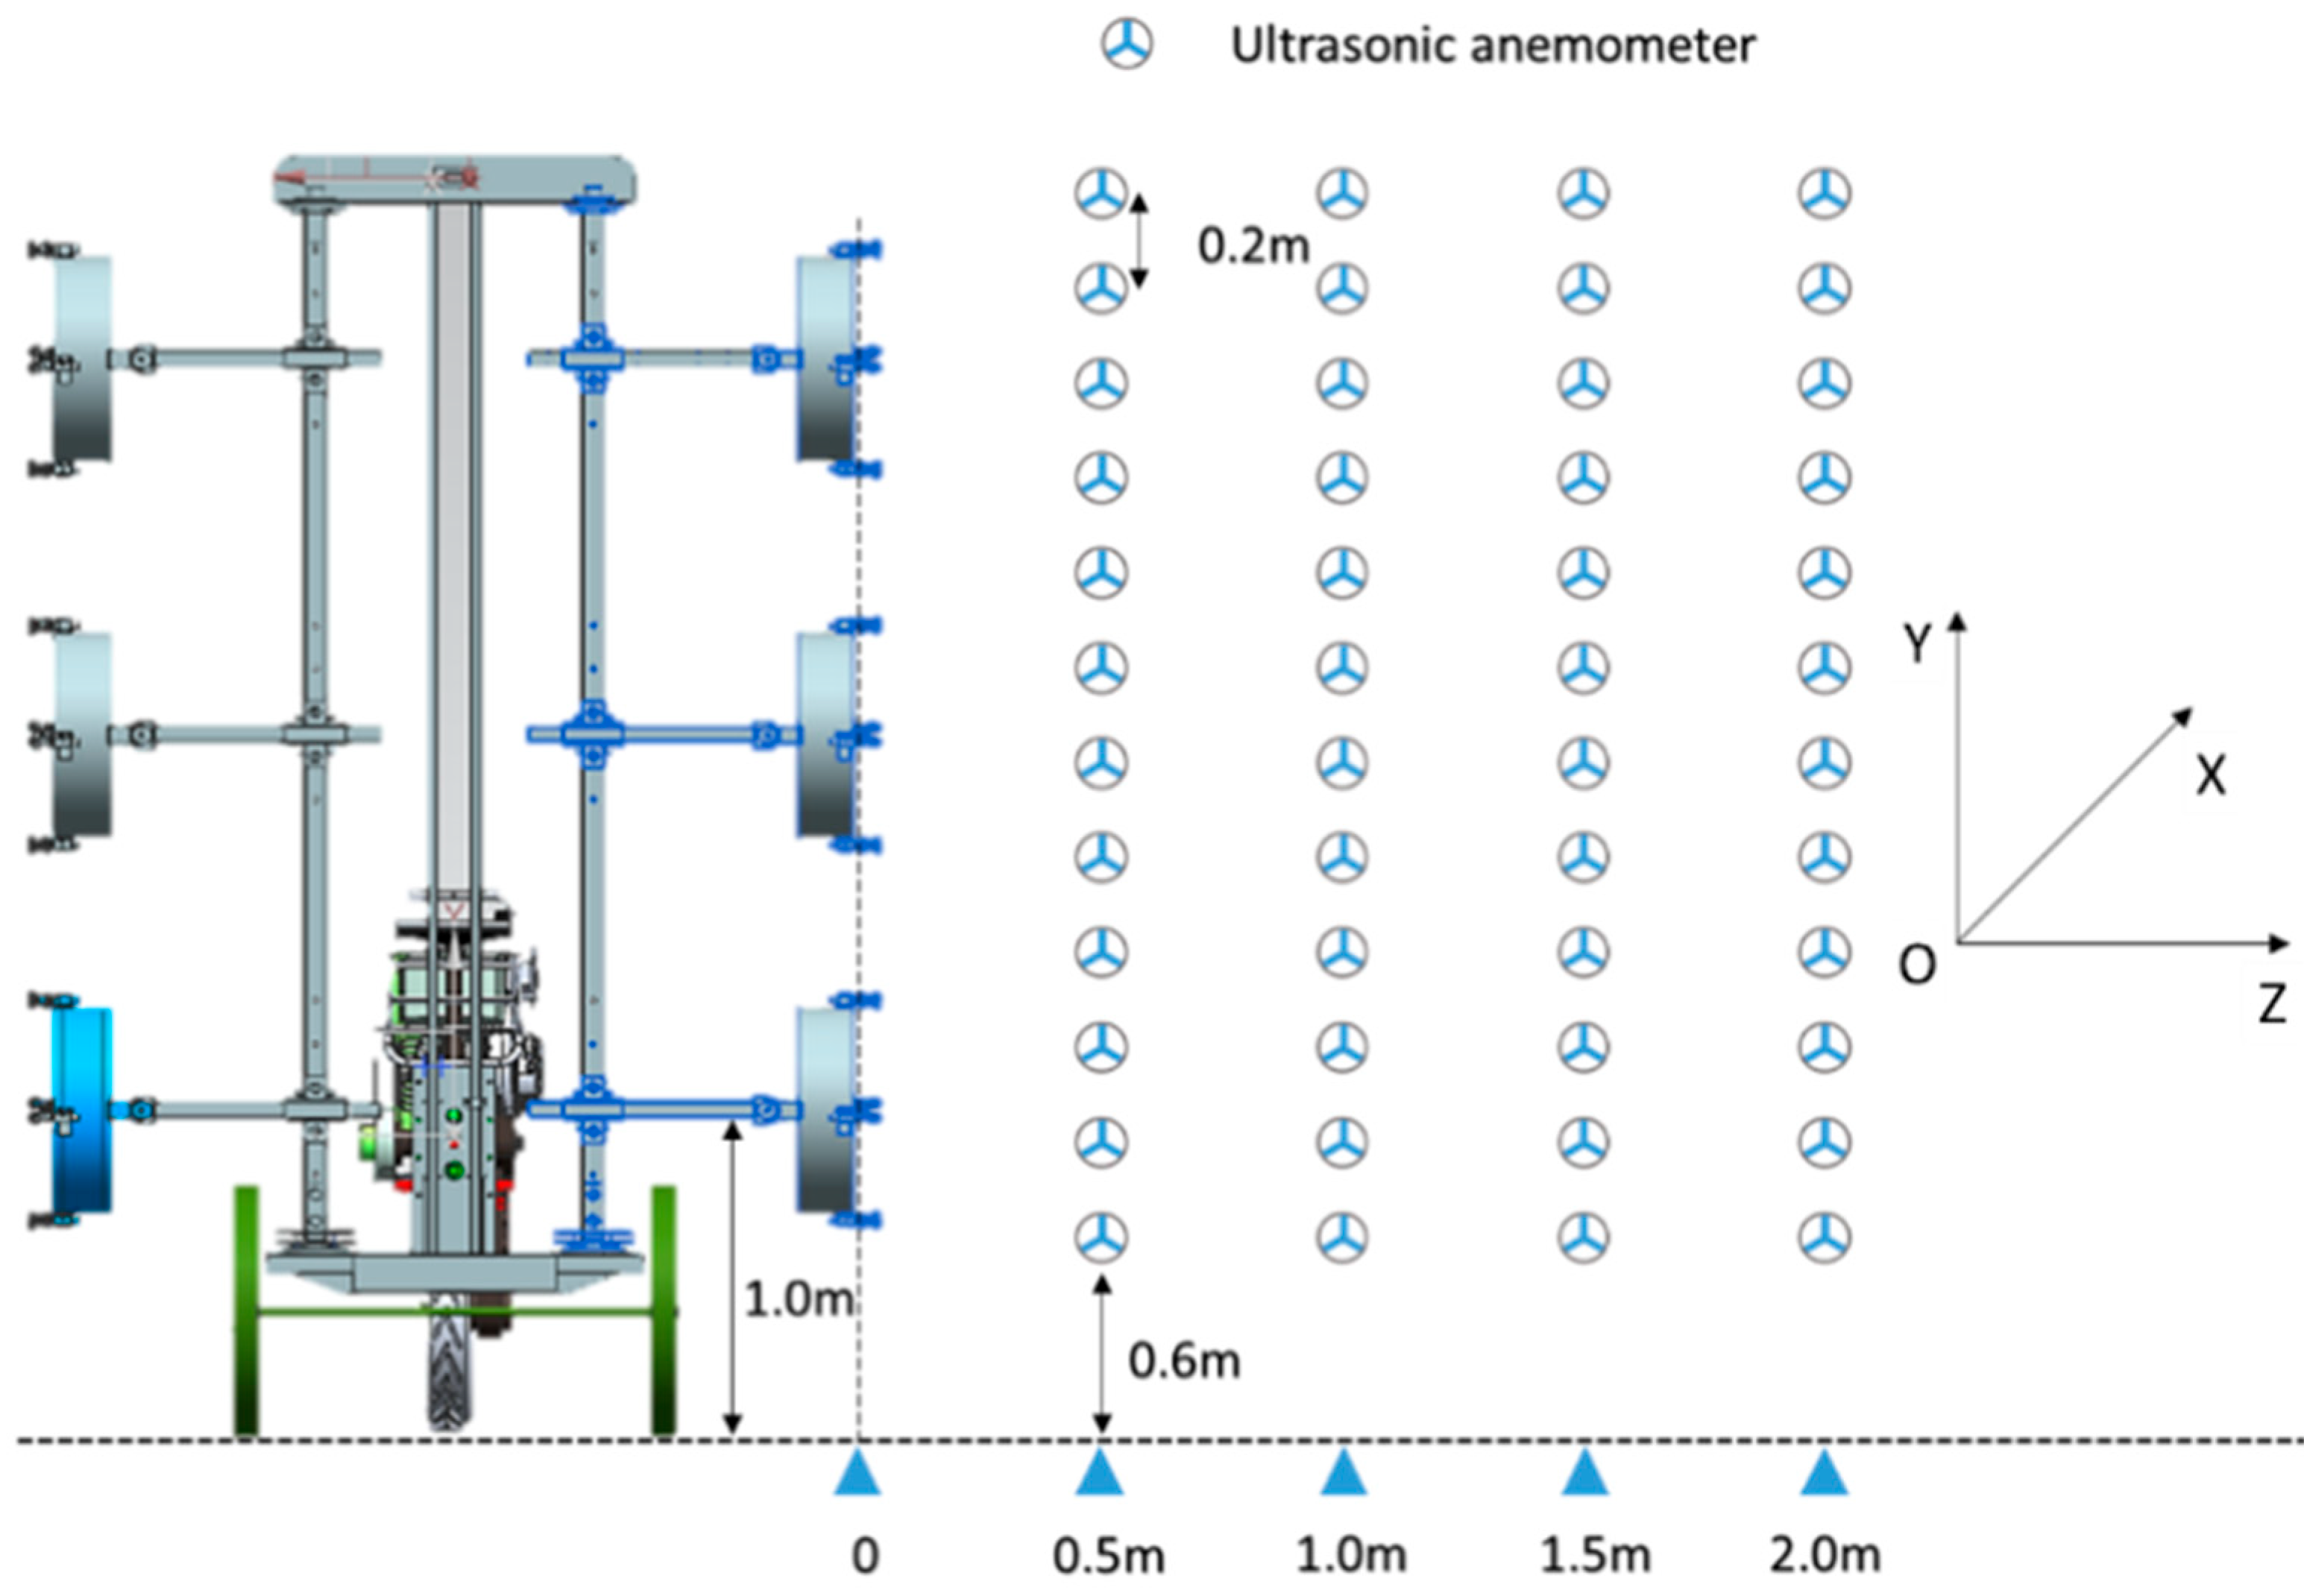
2.3.2. Airflow Pattern Test

The airflow pattern test of MAS was conducted in an open field outdoors in a static way according to ISO 9898:2000 [34]. Figure 3 showed the test layout, a group of 3 Axis wind sensors [35] (WindMaster 1590-PK-020, Gill Instruments Ltd., Hampshire, UK) was installed from 0.6 m away from the ground to 3.2 m according to the vertical interval of 0.2 m. All parameters listed in Table 2 were tested at 0.5 m, 1.0 m, 1.5 m, and 2.0 m away from the MAS, respectively. Fans on both sides of the sprayer opened simultaneously to keep the working condition consistent with the orchard application. All sensors were connected to the computer for the signal transmission, and the output data is received by the software at a frequency of 10 Hz and further calculated in Cartesian coordinates (X, Y, Z), including the airflow velocity and direction on the YZ plane and the air velocity on the X-axis. For each measuring point and parameter, data were recorded at least 15 s.

2.4. Data Analyses

All samples were scanned with a scanner (DS-1610, Epson (China), Beijing) at 400 dpi to obtain images. An image processing program ImageJ [36] (National Institutes of Health, United States) was used for the analysis to get spray coverage [37]. CAD and CAB represent deposit coverage on ADS and ABS of the leaf (%), and the deposit coverage of whole leaf (CW, %) was calculated as follows:
C W = C A D + C A B
Where the ratio of deposit coverage on ABS and whole leaf (RBW) was calculated to account for droplet distribution uniformity on leaves:
R B W = C A B C W
Where the ratio of deposit coverage on the center sample and the total sample in the same layer (RCT) was calculated to account for the penetration effect of droplets:
R C T = C W M C W L + C W M + C W R
where L, M, and R are sample sites in cherry canopy. As for pear, Left means L1 and L2, and R means R1 and R2 (Figure 2b).
The 3D airflow velocity and direction corresponding to all sample points are obtained through interpolation for 2D gridded data in meshgrid format [38] by Matlab 2021a (Mathworks, Natick, MA, USA). The interpolated value at a sample point is based on a cubic interpolation of the values at neighboring grid points in each respective dimension. The interpolation is based on a cubic spline using not-a-knot end conditions and 6 indicators were obtained: X-axis, Y-axis, and Z-axis airflow velocities, ZY plane (0° on Z-axis), ZX plane (0° on Z-axis), and YX (0° on Y-axis) plane airflow directions (X-v, Y-v, Z-v, ZY-d, ZX-d, YX-d). For assessing the impact of these indicators on canopy deposition, the method combining partial least square (PLS) and the variable importance in projection (VIP) scores (also called the PLS-VIP method [39]) have been introduced to quantify the contribution.
All statistical analyses were performed using IBM SPSS Statistics (IBM Corp., Armonk, NY, USA). The mean values of CAD, CAB, CW, RBW, and RCT in different test parameters were compared by using one-way analysis of variance (ANOVA) via the Duncan test (α = 0.05). The bivariate correlation analysis was adopted to evaluate the correlation between airflow indicators and CAD, CAB, CW, and RBW of all test parameters by using Pearson test and two-tailed significance test.

3. Results

3.1. Deposit Coverage Distribution in Layers

Table 3 shows mean values of all deposit indicators, including CAD, CAB, CW, RBW, and RCT, calculated from all samples in each layer of OSP1–OSP4 (results of all sample trees and replicates are involved). Intercomparison of OSP1–OSP3 was made on account of sharing the same installation height and tilt angle but different in fan speed. For the Top layer, the CAD and CW of OSP3 were significantly lower than those of OSP1 and had no significant difference with OSP2, and the CAB and RBW of OSP3 were significantly higher than those of OSP2 and had no significant difference with OSP1. For the Upper layer, the CAD of OSP3 was significantly lower than that of OSP1 and OSP2, the CAB of OSP3 was significantly higher than OSP1 and had no significant difference with OSP2, and the RBW of OSP3 was significantly higher than OSP1 and OSP2. The RCT of OSP1-OSP3 in all layers had no significant difference with each other. In the comparison between OSP2 and OSP4, the difference in deposition results was mainly due to the installation height and tilt angle of the Middle unit, the CAD and RCT of OSP4 in the Top layer were significantly lower than OSP2 but the CAB and RBW were higher. Meanwhile, in the Upper layer, the CAD of OSP4 was significantly lower than OSP2, and in the Lower layer the CAB of OSP4 was also lower than OSP2.
The only difference between OSC1-OSC3 is the fan speed setting, which was similar to OSP1-OSP3. There was no significant difference for CAD and RCT in all layers of OSC1-OSC3 as shown in Table 4, however in the Middle layer, the CAB of OSC2 and OSC3 were significantly higher than OSC1. In the Bottom layer, OSC3 also showed a higher CAB than OSC1. There was no significant difference in the deposition effect between OSC3 and OSC6, nor between OSC4 and OSC5, however, the CAB of OSC5 in the Top layer was significantly higher than that of OSC6.

3.2. Comparison between Airflow Velocity Distribution and Deposit Coverage Distribution

The distribution of both airflow and spray canopy deposit varied according to the fan setting. For this reason, a comparison was made between them. As can be seen in Figure 4, the airflow velocities of OSP1-OSP3 decreased with distance at Top, Lower, and Bottom heights, while at Upper height the airflow showed the opposite trend. In the meantime, the CAB of OSP3 improved, but the CAD decreased in the Top and Upper layers. Compared to OSP2, the air velocity of OSP4 attenuated less at Top height but was lower at Lower height. As for the canopy deposit coverage, the CAB of OSP4 was higher in the Top but lower in the Lower layer, meanwhile the CAD was lower in both of the Top and Upper layers, which was consistent with the results shown in Section 3.1.
OSC1–OSC3 shared a similar airflow velocity distribution pattern just like OSP1. OSP3, OSC2, and OSC3 have higher air velocities than OSC1 at Middle height, which made the CAB of OSC1 less than OSC2 and OSC3 at the same height. OSC3 has a higher airflow velocity at Middle height compared to OSC6, and OSC5 also has a higher airflow velocity at Top height compared to OSC4, however in the corresponding layers OSC6 has a similar CAB to OSC3 and OSC4 to OSC5. In addition, the OSC5 has a higher air velocity at Top height as well as a CAB compared to the OSC6 (see Figure 5).

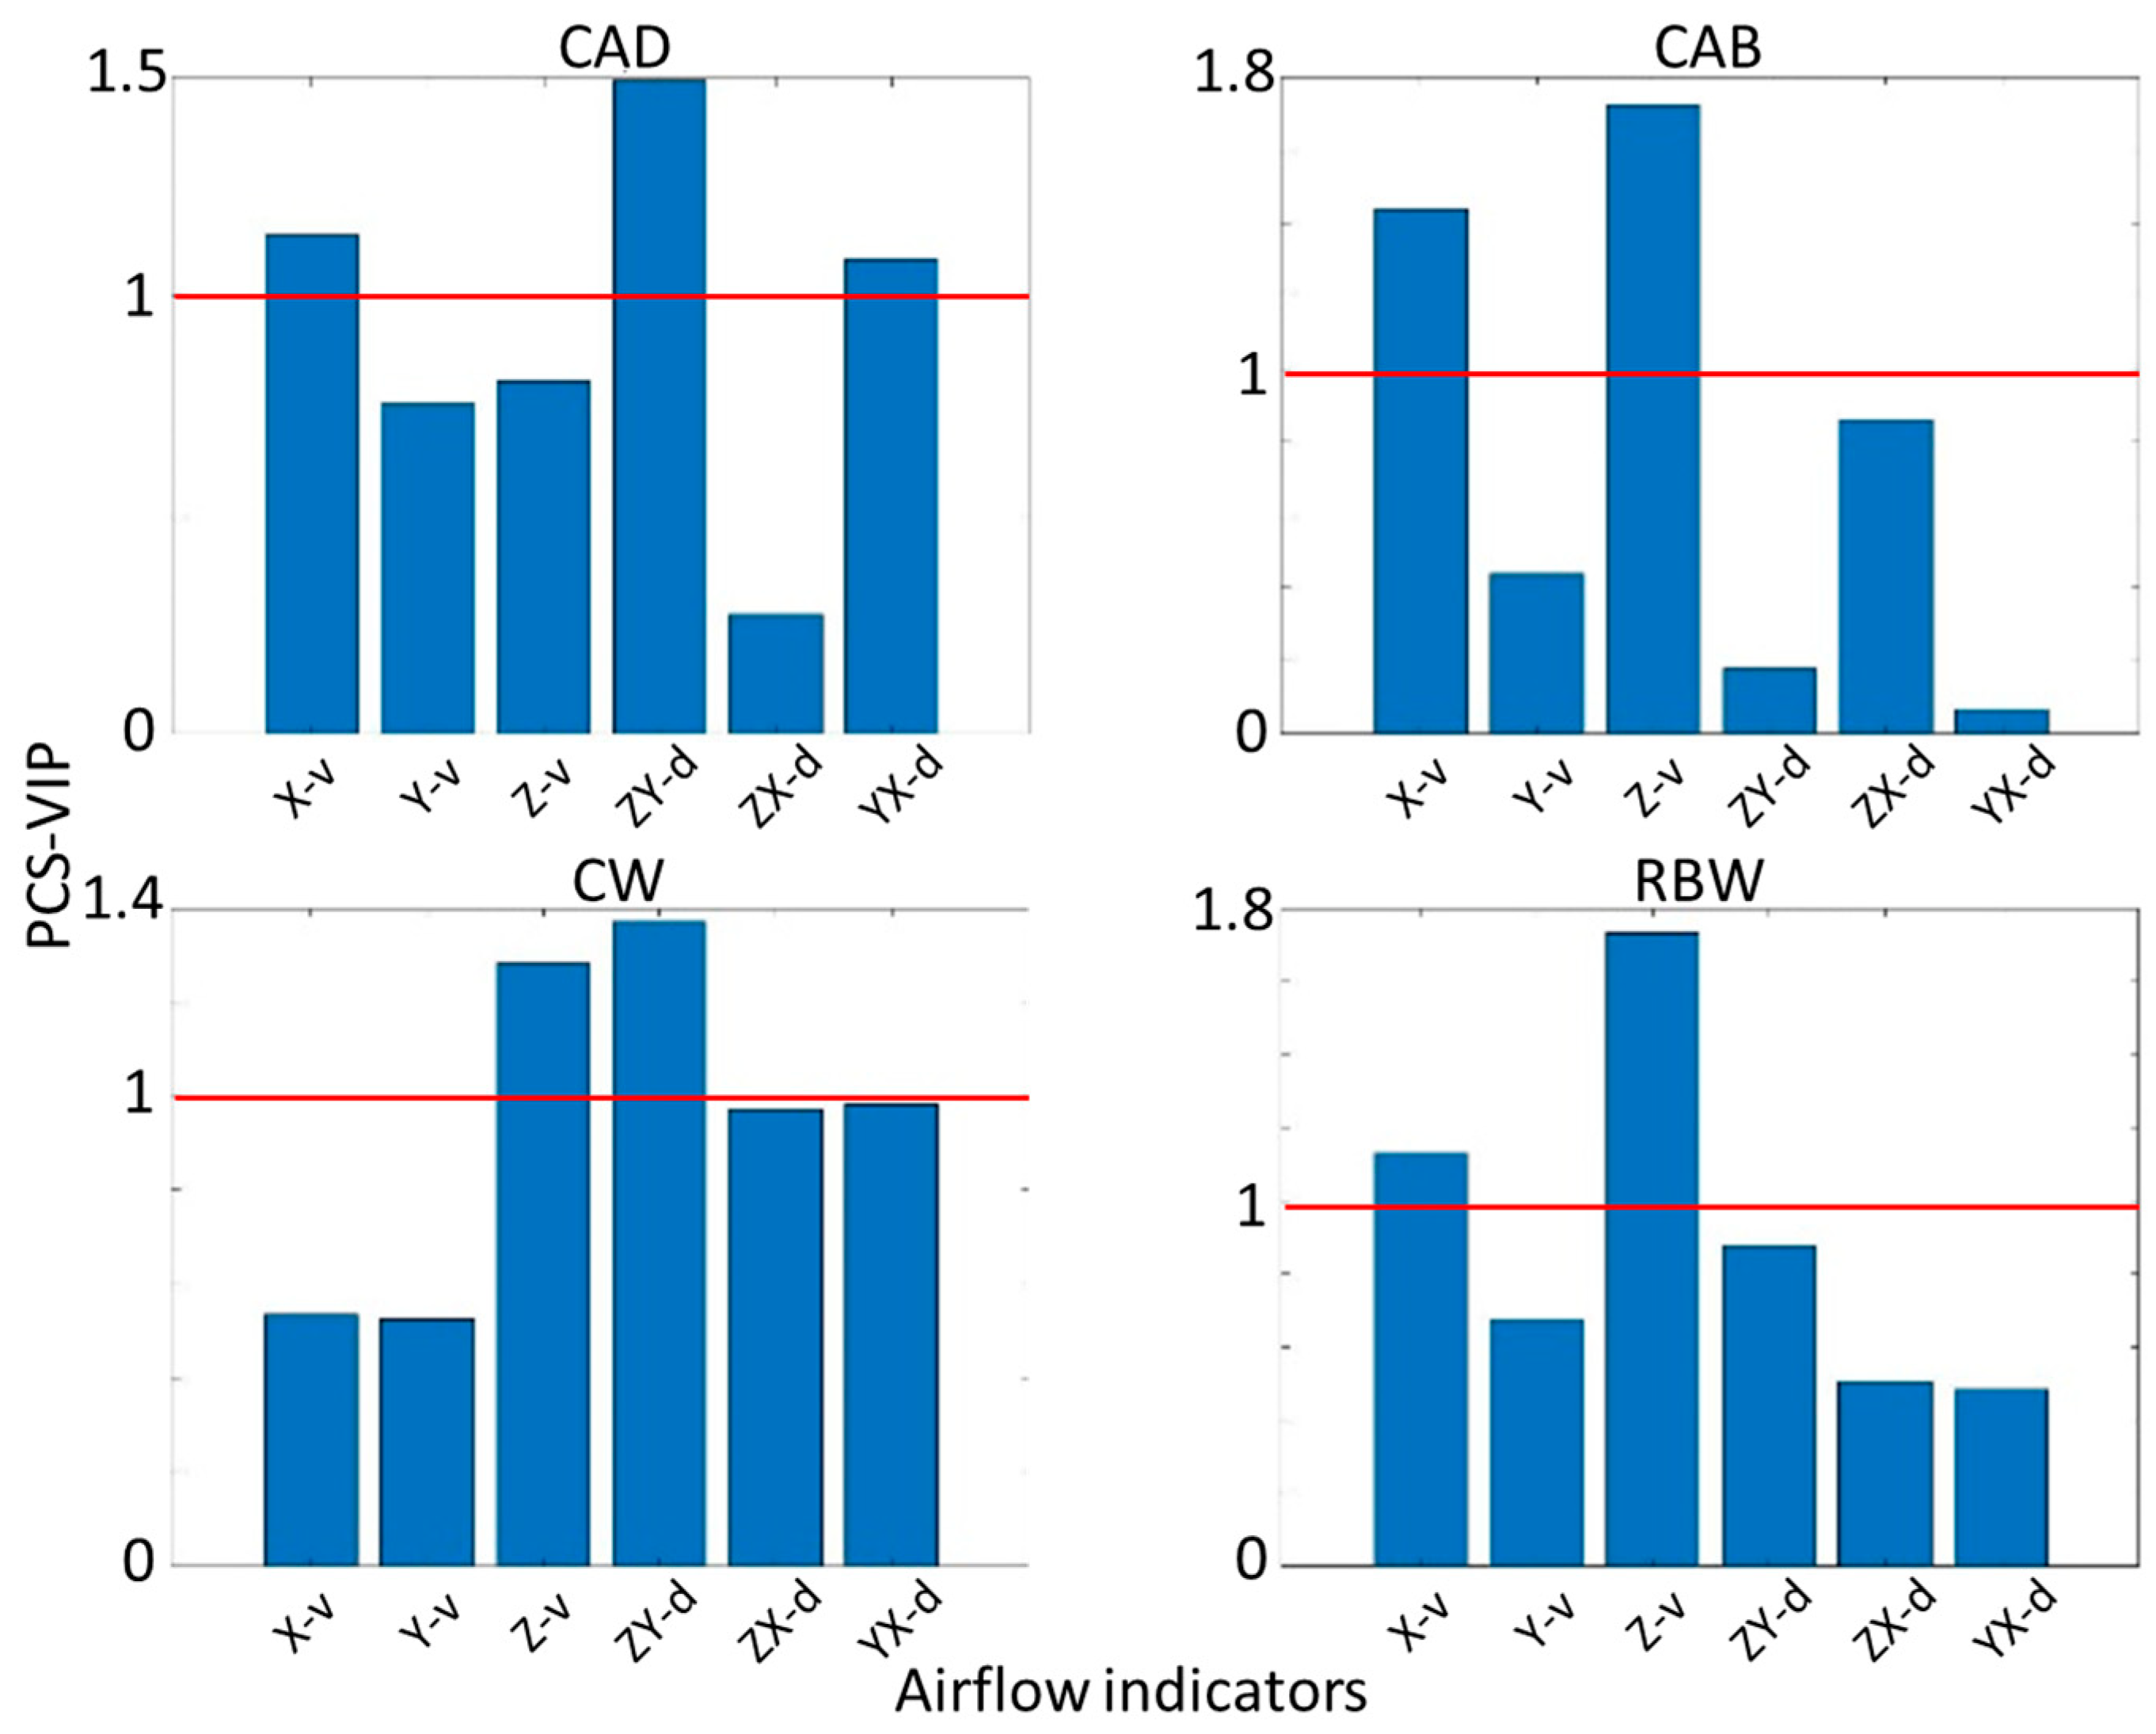
3.3. PLS-VIP and Correlation Analysis between Airflow Velocity, Direction, and Deposit Indicators

3.3.1. Results of OSP1-OSP4

For OSP1-OSP4, a PLS-VIP analysis was carried out between deposit indicators (CAD, CAB, CW, and RBW) and airflow indicators (X-v, Y-v, Z-v, ZY-d, ZX-d, YX-d). Results exhibited in Figure 6 showed that Z-v represented a more significant influence on CAB and RBW than the other indicators, while ZY-d made a greater contribution to CAD and CW. In addition, the effect of X-v on CAB and Z-v on CW cannot be ignored as well.
According to Table 5, X-v and Z-v showed extremely significant positive correlations (p < 0.001) with CAB and RBW in the total and outside canopy, but also negative correlations (p < 0.05) with CAD in the outside canopy, while ZY-d showed significant negative correlations (p < 0.01) with both CAD and CW in the total and outside canopy. All these were largely consistent with the results represented in Figure 7.

3.3.2. Results of OSC1-OSC6

According to Figure 7, for the CAD and CW of cherry, the most influential indicator was YX-d, followed by Y-v, then X-v showed a significant influence on CAB. Moreover, the most influential indicator on RBW was ZY-d.
As represented in Table 6, X-v had a relatively complex effect on canopy deposit coverage, showing positive correlations with CAB (p < 0.05) and RBW (p < 0.001) on the outside of the cherry canopy, but negative correlations with CAB and RBW (p < 0.05) on the inside of the canopy and CAD (p < 0.01) on the outside of the canopy. Y-v showed a negative correlation with CAD (p < 0.01) and CW (p < 0.05) inside the canopy, meanwhile YX-d showed the same negative correlation with CAD and CW of the total canopy (p < 0.05), in addition, ZY-d showed a significant positive correlation with RBW inside the canopy (p < 0.001). Although a few of the airflow indicators in Table 6 showed different contributions to those in Figure 7, this does not prevent the overall results from being consistent.

4. Discussion

In most cases, the air adjustments of AAS and ATS are based on the rotational speed of the fan and on the position of air deflectors [41] which impact air velocity and air direction. For this reason, there are limited options for adjusting the airflow pattern and vertical spray distribution. In this research the MAS allowed for more adjustments by changing the installation height, tilt angle, and fan speed, which offered a multivariate scenario in this study. As mentioned before, in the absence of a tree canopy, the spray volume distribution was directly influenced by the airflow pattern [4]. However, in the case of pesticide applications, the effects of airflow velocity and direction (mainly determined by fan parameters) on canopy deposition were relatively complex. By the influence of airflow, droplets are forced into the canopy and attached to the leaves. In the meantime, leaves are swung and lifted, which can somehow increase the deposition on the leaves, especially on the ABS.
For the spray test conducted on pear in this study, the distance between spray units and the trunk was 2.25 m, which means the airflow between 1.5 m and 2 m from the fan entered the canopy and had a significant impact on droplet deposition, therefore the velocity of airflow inside the canopy (AI) was used as the main reference for evaluating pear canopy deposition. Compared to the airflow distribution patterns of OSP1, the AI velocity of OSP3 was higher at Upper and lower at Top (Figure 4), which makes the leaves in both the two layers more susceptible to be uplifted. Due to this, the exposed area of the ABS was increased, resulting in a higher CAB for OSP3 (11.00%) than OSP1 (6.26%) at Upper. On the other hand, considering that the distance between units and the cherry trunk is 1.25 m, the airflow between 1.0 m and 1.5 m from the fan should be defined as AI for the evaluation of the spray effect. For OSC1-OSC3 (Figure 5), the AI velocities of OSC2 and OSC3 were higher than OSC1 at Middle height, which made the twisting frequency of leaves and the exposure probability of the ABS increase, and thus both OSC2 (4.81%) and OSC3 (9.04%) had greater CAB than OSC1 (1.36) in the Middle layer.
Compared to OSC6, OSC3 had greater AI velocity at Middle height, however there was no significant difference in CAD and CAB at Middle layer between them, which did not seem to be consistent with the previous analysis. On the other hand, OSC6 got higher AI velocity at Bottom than OSC3, so it was presumed that under the combined effect of airflow at both Middle and Bottom, the twisting frequencies of their Middle layer leaves were close. A similar situation occurred between OSC4 and OSC5, where OSC5 got a higher AI velocity at Top height but a lower AI velocity at Middle height compared to OSC4, from this point the CAD and CAB of OSC5 in the Top layer were also not significantly different from OSC4.
In general, the enhanced velocity of airflow inside the canopy resulted in an increase of deposition coverage on the ABS of leaves, for both pear and cherry, however it did not provide a significant improvement to the spray penetration. The difference is that the smaller pear leaves, compared to the cherry leaves, oscillated mainly in the longitudinal direction by airflow, which made that an increased exposed area of the ABS which was always accompanied by a decrease exposure of the ADS. For this reason, the increase of CAB happened frequently in conjunction with the decrease of CAD. The cherry leaves were slender and mainly twisted in the axial direction, which lead to an increase of CAB without decreasing the CAD. Furthermore, in many cases the spray coverage in a particular layer (e.g., Top layer of OSP3, Middle layer of OSC3, Top layer of OSC5) was simultaneously influenced by the effect of both the airflow in this height and that above or below it, which can be referred to as a regional airflow contribution, but the rationale for this phenomenon is unclear and needs to be explored in further studies.
Over the years, many reports have focused on spray penetration [25,42], distribution [43,44], and the mass balance [8,45] in orchards, which helps to clarify the practical application effects of different spray technologies and fan operating parameters. However, from the point of disease and pest control, the deposit on the ADS and ABS of leaves should also be taken into account.
The results of the PLS-VIP and correlation analysis showed that the enhanced X-v and Z-v improved (p < 0.001) the CAB on the outside of pear canopy, but for cherry, none of the airflow indicators had a significant impact on the CAB. On the other hand, for the increased ZY-d (p < 0.01) for pear as well as the increased X-v and Y-v (p < 0.01) for cherry, both showed negative effects on the CAD. Obviously, pear and cherry are very different in canopy structure and leaf shape. By the influence of airflow, the pear leaves swung violently and the exposure of the ABS increased, which resulted in the improvement of the CAB. However, for the cherry leaves, the changes in airflow did not significantly increase the exposure of the ABS. Moreover, it is worth noting that the reduction of CAD is very detrimental to the efficacy of pesticide control and should be avoided in the application. For pear and cherry orchards, we should adopt different airflow patterns to improve the spraying effect. Based on the structure of the MAS, the adjustment of X-v can be achieved by changing the angle between the unit and the travel direction, Z-v is mainly dependent on the fan speed setting, while the ZY-d can be adjusted by changing the tilt angle.
In recent years, efforts have focused on improving the design of pesticide application equipment. Grella et al. [46] tested the effect of different fan settings, air-conveyor orientation, and nozzle configuration on both airflow pattern and vertical spray distribution, and the results showed that a forward air-conveyor orientation was selected as one of the most optimal settings for spray applications in a trellised vineyard. Interestingly, in this study a similar trend was observed (the enhanced X-v could be adjusted by changing the install angle between the unit and the travel direction) that improved the deposit coverage in the ABS. Therefore, to some extent we can conclude that the forward airflow has a positive contribution to the spray effect.
In the last decade, agricultural unmanned aerial vehicle (UAV) has become a widely used piece of equipment for orchard pesticide application, especially in East Asian countries [47]. The downwash airflow of the UAV plays an important role in the transportation of droplets to the target [48,49], which was similar to the horizontal and/or vertical airflow from air-assisted sprayers. However, the UAV had a much lower deposition on leaves compared to the AAS [28,50,51]. Zhang et al. [52] pointed out that, in order to improve the spraying efficacy of UAV sprayers and reduce off-target losses, it is essential to understand the distribution characteristics of downwash airflow inside and around the target tree canopy. From this point of view, we suggest that the velocity and directional distribution characteristics of the downwash airflow should be focused on, which is a key factor affecting the droplets deposit distribution in the canopy, as reported in the present study.
Clearly, the airflow velocity and direction had a significant effect on spray deposit, and the fundamental cause of this is that the behaviors of droplets [53] and leaves [54] are influenced by airflow, which will be the focus of our future research. Although there is a correlation between the spray indicators, considering that this study aims to make a preliminary exploration of the effects of airflow indicators on deposition indicators, a large number of field tests for different fan parameters are still needed before we can build a predictive model.

5. Conclusions

Spray tests and airflow distribution tests were conducted with ten different fan settings using a multi-unit air-assisted sprayer. The effects of various airflow distribution patterns on spray deposition coverage and penetration were compared, and the correlation between airflow indicators and deposition indicators was evaluated. The results showed that the increased AI improved the CAB of pear (from 3.33% to 11.80% in the Top canopy and from 6.26% to 11.00% in the Upper canopy) and cherry leaves (from 3.61% to 10.87% in the Top canopy, from 1.36% to 9.04% in the Middle canopy, and from 3.40% to 9.04% in the Bottom canopy) but had no significant effect on spray penetration. As a whole, spray deposition in one part of the canopy was influenced by the combined effects of airflow in a wider area. The enhanced X-v and Z-v improved the CAB on the outside of pear canopy (p < 0.001), but for cherry, none of the airflow indicators had a significant impact on the CAB independently. On the other hand, the increased ZY-d for pear as well as the increased X-v and Y-v for cherry both showed negative effects on the CAD (p < 0.01).
According to our findings, for fruits with small leaves, such as pears, apples, citrus, etc., it is recommended to increase the airflow velocity in the horizontal and forward direction to optimize the spraying effect. As for cherry and other fruits with larger leaves, such as mangoes, lychees, etc., an increase in the upward airflow and an appropriate reduction of airflow velocity are suggested. For years, we have been committed to the improvement of spray performance on the abaxial side of leaves in orchards by setting optimal application parameters and improving the spray system. More research is still needed to clarify the multiple correlations between airflow velocity/direction and spray deposit distribution. Furthermore, the dynamical behavior of droplets and leaves in the airflow, as a fundamental principle of droplet deposition in the canopy, will be further investigated to improve our understanding of air-assisted spraying.

Author Contributions

Conceptualization, X.H. and Z.W.; methodology, T.L., P.Q. and Z.W.; validation, X.H.; formal analysis, T.L. and Z.W.; investigation, T.L., P.Q., S.X., Z.H. and L.H.; resources, S.X., Z.H. and L.H.; data curation, T.L., S.X., Z.H. and L.H.; writing—original draft preparation, T.L.; writing—review and editing, X.H. and Z.W.; visualization, T.L., Z.W.; supervision, X.H.; funding acquisition, X.H. All authors have read and agreed to the published version of the manuscript.

Funding

This research was funded by the National Natural Science Foundation of China (No. 31761133019), the earmarked fund for China Agriculture Research System (CARS-28) and the Deutsche Forschungsgemeinschaft (DFG, German Research Foundation)—project number 391697993.

Institutional Review Board Statement

Not applicable.

Informed Consent Statement

Not applicable.

Data Availability Statement

The data presented in this study are available on request from the corresponding author.

Acknowledgments

The authors would like to give special thanks to Dong Xue for providing the test orchard and the sprayer storage.

Conflicts of Interest

The authors declare no conflict of interest.

References

  1. The 14th Five-Year Plan for National Economic and Social Development of the People’s Republic of China and Outline of the Vision for 2035. Available online: http://www.gov.cn/xinwen/2021-03/13/content_5592681.htm (accessed on 13 April 2022).
  2. Dong, Z.X.; Wang, Y.W.; Liu, Q.Z.; Tian, B.L.; Liu, Z.L. Laboratory Screening of 26 Essential Oils Against Cacopsylla chinensis (Hemiptera: Psyllidae) and Field Confirmation of the Top Performer, Perilla frutescens (Lamiales: Lamiaceae). J. Econ. Entomol. 2019, 112, 1299–1305. [Google Scholar] [CrossRef]
  3. De Curtis, F.; Ianiri, G.; Raiola, A.; Ritieni, A.; Succi, M.; Tremonte, P.; Castoria, R. Integration of biological and chemical control of brown rot of stone fruits to reduce disease incidence on fruits and minimize fungicide residues in juice. Crop Prot. 2019, 119, 158–165. [Google Scholar] [CrossRef]
  4. Dekeyser, D.; Duga, A.T.; Verboven, P.; Endalew, A.M.; Hendrickx, N.; Nuyttens, D. Assessment of orchard sprayers using laboratory experiments and computational fluid dynamics modelling. Biosyst. Eng. 2013, 114, 157–169. [Google Scholar] [CrossRef]
  5. Delele, M.A.; De Moor, A.; Sonck, B.; Ramon, H.; Nicolaï, B.M.; Verboven, P. Modelling and Validation of the Air Flow generated by a Cross Flow Air Sprayer as affected by Travel Speed and Fan Speed. Biosyst. Eng. 2005, 92, 165–174. [Google Scholar] [CrossRef]
  6. Escolà, A.; Rosell-Polo, J.R.; Planas, S.; Gil, E.; Pomar, J.; Camp, F.; Llorens, J.; Solanelles, F. Variable rate sprayer. Part 1–Orchard prototype: Design, implementation and validation. Comput. Electron. Agric. 2013, 95, 122–135. [Google Scholar] [CrossRef] [Green Version]
  7. Khot, L.R.; Ehsani, R.; Albrigo, G.; Larbi, P.A.; Landers, A.; Campoy, J.; Wellington, C. Air-assisted sprayer adapted for precision horticulture: Spray patterns and deposition assessments in small-sized citrus canopies. Biosyst. Eng. 2012, 113, 76–85. [Google Scholar] [CrossRef]
  8. Garcerá, C.; Moltó, E.; Chueca, P. Spray pesticide applications in Mediterranean citrus orchards: Canopy deposition and off-target losses. Sci. Total Environ. 2017, 599–600, 1344–1362. [Google Scholar] [CrossRef]
  9. Sinha, R.; Ranjan, R.; Khot, L.R.; Hoheisel, G.A.; Grieshop, M.J. Comparison of within canopy deposition for a solid set canopy delivery system (SSCDS) and an axial–fan airblast sprayer in a vineyard. Crop Prot. 2020, 132, 105124. [Google Scholar] [CrossRef]
  10. Michael, C.; Gil, E.; Gallart, M.; Stavrinides, M.C. Influence of Spray Technology and Application Rate on Leaf Deposit and Ground Losses in Mountain Viticulture. Agriculture 2020, 10, 615. [Google Scholar] [CrossRef]
  11. Blanco, M.N.; Fenske, R.A.; Kasner, E.J.; Yost, M.G.; Seto, E.; Austin, E. Real-Time Monitoring of Spray Drift from Three Different Orchard Sprayers. Chemosphere 2019, 222, 46–55. [Google Scholar] [CrossRef]
  12. Rosell, J.R.; Sanz, R. A review of methods and applications of the geometric characterization of tree crops in agricultural activities. Comput. Electron. Agric. 2012, 81, 124–141. [Google Scholar] [CrossRef] [Green Version]
  13. Vallet, A.; Tinet, C. Characteristics of droplets from single and twin jet air induction nozzles: A preliminary investigation. Crop Prot. 2013, 48, 63–68. [Google Scholar] [CrossRef]
  14. Grella, M.; Gallart, M.; Marucco, P.; Balsari, P.; Gil, E. Ground Deposition and Airborne Spray Drift Assessment in Vineyard and Orchard: The Influence of Environmental Variables and Sprayer Settings. Sustainability 2017, 9, 728. [Google Scholar] [CrossRef] [Green Version]
  15. Nuyttens, D.; Taylor, W.A.; De Schampheleire, M.; Verboven, P.; Dekeyser, D. Influence of nozzle type and size on drift potential by means of different wind tunnel evaluation methods. Biosyst. Eng. 2009, 103, 271–280. [Google Scholar] [CrossRef]
  16. Salyani, M.; Whitney, J.D. GROUND SPEED EFFECT ON SPRAY DEPOSITION INSIDE CITRUS TREES. Trans. ASAE 1990, 33, 0361–0366. [Google Scholar] [CrossRef]
  17. Nuyttens, D.; Baetens, K.; De Schampheleire, M.; Sonck, B. Effect of nozzle type, size and pressure on spray droplet characteristics. Biosyst. Eng. 2007, 97, 333–345. [Google Scholar] [CrossRef]
  18. Combellack, J.H.; Westernt, N.M.; Richardson, R.G. A comparison of the drift potential of a novel twin fluid nozzle with conventional low volume flat fan nozzles when using a range of adjuvants. Crop Prot. 1996, 15, 147–152. [Google Scholar] [CrossRef]
  19. Bouse, L.F.; Kirk, I.W.; Bode, L.E. Effect of spray mixture on droplet size. Trans. ASAE 1990, 33, 0783–0788. [Google Scholar] [CrossRef]
  20. Derksen, R.C.; Fox, R.D.; Brazee, R.D.; Krause, C.R. Coverage and drift produced by air induction and conventional hydraulic nozzles used for orchard applications. Am. Soc. Agric. Biol. Eng. 2000, 1, 3131–3149. [Google Scholar] [CrossRef]
  21. Cross, J.V.; Walklate, P.J.; Murray, R.A.; Richardson, G.M. Spray deposits and losses in different sized apple trees from an axial fan orchard sprayer: 2. Effects of spray quality. Crop Prot. 2001, 20, 333–343. [Google Scholar] [CrossRef]
  22. Garcerá, C.; Román, C.; Moltó, E.; Abad, R.; Insa, J.A.; Torrent, X.; Planas, S.; Chueca, P. Comparison between standard and drift reducing nozzles for pesticide application in citrus: Part II. Effects on canopy spray distribution, control efficacy of Aonidiella aurantii (Maskell), beneficial parasitoids and pesticide residues on fruit. Crop Prot. 2017, 94, 83–96. [Google Scholar] [CrossRef] [Green Version]
  23. Gil, E.; Landers, A.; Gallart, M.; Llorens, J. Development of two portable patternators to improve drift control and operator training in the operation of vineyard sprayers. Span. J. Agric. Res. 2013, 11, 615–625. [Google Scholar] [CrossRef] [Green Version]
  24. Li, L.; He, X.; Song, J.; Liu, Y.; Wang, Z.; Li, J.; Jia, X.; Liu, Z. Comparative experiment on profile variable rate spray and conventional air assisted spray in orchards. Nongye Gongcheng Xuebao/Trans. Chin. Soc. Agric. Eng. 2017, 33, 56–63. [Google Scholar] [CrossRef]
  25. Farooq, M.; Salyani, M.; Engineering, B.; Largo, K. Spray Penetration into the Citrus Tree Canopy from Two Air-Carrier Sprayers. In Proceedings of the 2002 ASAE Annual Meeting, Chicago, IL, USA, 28–31 July 2002; p. 1. [Google Scholar] [CrossRef]
  26. Holownicki, R.; Doruchowski, G.; Godyn, A.; Swiechowski, W. Variation of spray deposit and loss with air-jet directions applied in orchards. J. Agric. Eng. Res. 2000, 77, 129–136. [Google Scholar] [CrossRef]
  27. Pezzi, F.; Rondelli, V. The performance of an air-assisted sprayer operating in vines. J. Agric. Eng. Res. 2000, 76, 331–340. [Google Scholar] [CrossRef]
  28. Miranda-Fuentes, A.; Rodríguez-Lizana, A.; Gil, E.; Agüera-Vega, J.; Gil-Ribes, J.A. Influence of liquid-volume and airflow rates on spray application quality and homogeneity in super-intensive olive tree canopies. Sci. Total Environ. 2015, 537, 250–259. [Google Scholar] [CrossRef]
  29. Cross, J.V.; Walklate, P.J.; Murray, R.A.; Richardson, G.M. Spray deposits and losses in different sized apple trees from an axial fan orchard sprayer: 3. Effects of air volumetric flow rate. Crop Prot. 2003, 22, 381–394. [Google Scholar] [CrossRef]
  30. Li, J.; Li, Z.; Ma, Y.; Cui, H.; Yang, Z.; Lu, H. Effects of leaf response velocity on spray deposition with an air-assisted orchard sprayer. Int. J. Agric. Biol. Eng. 2021, 14, 123–132. [Google Scholar] [CrossRef]
  31. Dekeyser, D.; Foqué, D.; Duga, A.T.; Verboven, P.; Hendrickx, N.; Nuyttens, D. Spray deposition assessment using different application techniques in artificial orchard trees. Crop Prot. 2014, 64, 187–197. [Google Scholar] [CrossRef]
  32. Wachter, S.; Jakobs, T.; Kolb, T. Effect of solid particles on droplet size applying the time-shift method for spray investigation. Appl. Sci. 2020, 10, 7615. [Google Scholar] [CrossRef]
  33. ISO-ISO 13320:2020-Particle Size Analysis—Laser Diffraction Methods. Available online: https://www.iso.org/standard/69111.html (accessed on 3 March 2022).
  34. ISO-ISO 9898:2000-Equipment for Crop Protection—Test Methods for Air-Assisted Sprayers for Bush and Tree Crops. Available online: https://www.iso.org/standard/17781.html (accessed on 4 March 2022).
  35. Javier García-Ramos, F.; Vidal, M.; Boné, A.; Malón, H.; Aguirre, J. Analysis of the Air Flow Generated by an Air-Assisted Sprayer Equipped with Two Axial Fans Using a 3D Sonic Anemometer. Sensors 2012, 12, 7598. [Google Scholar] [CrossRef] [PubMed] [Green Version]
  36. Zhu, H.; Salyani, M.; Fox, R.D. A portable scanning system for evaluation of spray deposit distribution. Comput. Electron. Agric. 2011, 76, 38–43. [Google Scholar] [CrossRef]
  37. Owen-Smith, P.; Perry, R.; Wise, J.; Jamil, R.Z.R.; Gut, L.; Sundin, G.; Grieshop, M. Spray coverage and pest management efficacy of a solid set canopy delivery system in high density apples. Pest Manag. Sci. 2019, 75, 3050–3059. [Google Scholar] [CrossRef] [PubMed]
  38. Interpolation for 2-D Gridded Data in Meshgrid Format. Available online: https://www.mathworks.com/help/releases/R2021a/matlab/ref/interp2.html#btyq8s0-1-method (accessed on 4 March 2021).
  39. Mehmood, T.; Liland, K.H.; Snipen, L.; Sæbø, S. A review of variable selection methods in Partial Least Squares Regression. Chemom. Intell. Lab. Syst. 2012, 118, 62–69. [Google Scholar] [CrossRef]
  40. Chong, I.G.; Jun, C.H. Performance of some variable selection methods when multicollinearity is present. Chemom. Intell. Lab. Syst. 2005, 78, 103–112. [Google Scholar] [CrossRef]
  41. Marucco, P.; Tamagnone, M.; Balsari, P. Study of Air Velocity Adjustment to Maximise Spray Deposition in Peach Orchards. Agr. Eng. Int. CIGR J. 2008, X, 1–13. [Google Scholar]
  42. Cross, J.V.; Walklate, P.J.; Murray, R.A.; Richardson, G.M. Spray deposits and losses in different sized apple trees from an axial fan orchard sprayer: 1. Effects of spray liquid flow rate. Crop Prot. 2001, 20, 13–30. [Google Scholar] [CrossRef]
  43. Musiu, E.M.; Qi, L.; Wu, Y. Spray deposition and distribution on the targets and losses to the ground as affected by application volume rate, airflow rate and target position. Crop Prot. 2019, 116, 170–180. [Google Scholar] [CrossRef]
  44. Glotfelty, D.E.; Schomburg, C.J.; McChesney, M.M.; Sagebiel, J.C.; Seiber, J.N. Studies of the distribution, drift, and volatilization of diazinon resulting from spray application to a dormant peach orchard. Chemosphere 1990, 21, 1303–1314. [Google Scholar] [CrossRef]
  45. Balsari, P.; Marucco, P.; Tamagnone, M. A system to assess the mass balance of spray applied to tree crops. Trans. ASAE 2005, 48, 1689–1694. [Google Scholar] [CrossRef]
  46. Grella, M.; Marucco, P.; Zwertvaegher, I.; Gioelli, F.; Bozzer, C.; Biglia, A.; Manzone, M.; Caffini, A.; Fountas, S.; Nuyttens, D.; et al. The effect of fan setting, air-conveyor orientation and nozzle configuration on airblast sprayer efficiency: Insights relevant to trellised vineyards. Crop Prot. 2022, 155, 105921. [Google Scholar] [CrossRef]
  47. He, X.K.; Bonds, J.; Herbst, A.; Langenakens, J. Recent development of unmanned aerial vehicle for plant protection in East Asia. Int. J. Agric. Biol. Eng. 2017, 10, 18–30. [Google Scholar] [CrossRef]
  48. Zhang, H.; Qi, L.; Wu, Y.; Liu, W.; Cheng, Z.; Musiu, E. Spatio-temporal Distribution of Down-wash Airflow for Multi-rotor Plant Protection UAV Based on Porous Model. Nongye Jixie Xuebao/Trans. Chin. Soc. Agric. Mach. 2019, 50, 112–122. [Google Scholar] [CrossRef]
  49. Zhang, H.; Qi, L.; Wu, Y.; Cheng, Z.; Liu, W.; Musiu, E.; Xiao, Y.; Yang, Z. Distribution characteristics of rotor downwash airflow field under spraying on orchard using unmanned aerial vehicle. Nongye Gongcheng Xuebao/Trans. Chin. Soc. Agric. Eng. 2019, 35, 44–54. [Google Scholar] [CrossRef]
  50. Pan, Z.; Lie, D.; Qiang, L.; Shaolan, H.; Shilai, Y.; Yande, L.; Yongxu, Y.; Haiyang, P. Effects of citrus tree-shape and spraying height of small unmanned aerial vehicle on droplet distribution. Int. J. Agric. Biol. Eng. 2016, 9, 45–52. [Google Scholar] [CrossRef]
  51. Zhang, H.; Qi, L.; Wan, J.; Musiu, E.M.; Zhou, J.; Lu, Z.; Wang, P. Numerical simulation of downwash airflow distribution inside tree canopies of an apple orchard from a multirotor unmanned aerial vehicle (UAV) sprayer. Comput. Electron. Agric. 2022, 195, 106817. [Google Scholar] [CrossRef]
  52. Xue, S.; Xi, X.; Lan, Z.; Wen, R.; Ma, X. Longitudinal drift behaviors and spatial transport efficiency for spraying pesticide droplets. Int. J. Heat Mass Transf. 2021, 177, 121516. [Google Scholar] [CrossRef]
  53. Shao, C.P.; Chen, Y.J.; Lin, J.Z. Wind induced deformation and vibration of a Platanus acerifolia leaf. Acta Mech. Sin. 2012 283 2012, 28, 583–594. [Google Scholar] [CrossRef]
  54. Jiang, H.; Xin, D.; Zhang, H. Wind-tunnel study of the aerodynamic characteristics and mechanical response of the leaves of Betula platyphylla Sukaczev. Biosyst. Eng. 2021, 207, 162–176. [Google Scholar] [CrossRef]
Figure 1. The multi-unit air-assisted orchard sprayer used in this study: ① Top Unit, ② Electronic Speed Control, ③ Middle Unit, ④ Bottom Unit, ⑤ Speed control box, ⑥ Proportional control valve with pressure gauge, ⑦ Tank.
Agronomy 12 00944 g001
Figure 2. (a) Test fields for spray test (b) Layout of spray test: the red line showed the application route, trees with red background were sampled; (c) Sample site: green marks represented samples. The indicators L, M, R in the cherry canopy and the L1, L2, M, R2, R1 in the pear canopy represent the sample positions in per layer.
Agronomy 12 00944 g002
Figure 3. Layout of airflow pattern test of MAS in an open field. The X-axis represented the forward direction, the Y-axis represented the vertical direction, and the Z-axis represented the cross-row direction.
Agronomy 12 00944 g003
Figure 4. The airflow distribution at different distances from the MAS (left), CAD (black block), and CAB (blue block) of samples in all layers (right) of OSP1–OSP4.
Agronomy 12 00944 g004
Figure 5. The airflow distribution at different distances from the MAS (left); CAD (black block) and CAB (blue block) of samples in all layers (right) of OSC1–OSC6.
Agronomy 12 00944 g005
Figure 6. PLS-VIP analysis results between the airflow indicators and the deposit indicators of OSP1–OSP4. The red line indicates that the PLS-VIP = 1, PLS-VIP > 1 indicates a significant effect [40]. The red line marks the position where the PLS-VIP value is 1.
Agronomy 12 00944 g006
Figure 7. PLS-VIP analysis results between the airflow indicators and the deposit indicators of OSC1–OSC6. The red line marks the position where the PLS-VIP value is 1.
Agronomy 12 00944 g007
Table 1. Layers and samples setting parameters of pear and cherry.
PlantSample LayerLayer Height/mWidth of Layer/mDistance between Sample and Trunk/m
LMR
L1L2R2R1
PearTop2.82.8–3.21.3–1.60.5–0.900.4–0.71.0–1.2
Upper2.32.9–3.41.4–1.70.5–0.800.5–0.81.1–1.3
Lower1.82.6–3.11.3–1.50.6–0.900.5–0.81.2–1.4
Bottom1.32.0–2.61.0–1.30.4–0.600.4–0.71.0–1.2
CherryTop2.51.2–1.40.5–0.600.5–0.7
Middle1.91.3–1.50.6–0.800.6–0.8
Bottom1.30.7–0.80.2–0.400.3–0.5
Table 2. The test parameters of MAS used in spray tests.
ParametersSpray UnitsFan Speed
(rpm)
Installation Height
(m)
Tilt Angle
(°)
OSC1Top22752.95−40
Middle22751.950
Bottom22751.0020
OSC2Top26352.95−40
Middle26351.950
Bottom26351.0020
OSC3Top26352.95−40
Middle30901.950
Bottom26351.0020
OSC4Top26352.95−40
Middle30901.7520
Bottom26351.0020
OSC5Top26352.95−40
Middle30901.8520
Bottom26351.0020
OSC6Top26352.95−40
Middle30901.850
Bottom26351.0020
OSP1Top26352.95−15
Middle26351.8510
Bottom26351.0020
OSP2Top26352.95−15
Middle30901.8510
Bottom26351.0020
OSP3Top30902.95−15
Middle30901.8510
Bottom30901.0020
OSP4Top26352.95−15
Middle30901.7530
Bottom26351.0020
Note: Tilt angle < 0 means tilt down, Tilt angle > 0 means tilt up.
Table 3. Results of spray tests on pear: CAD, CAB, CW, RBW, and RCT of OSP1-OSP4.
Sample LayerTest ParametersCADCABCWRBWRCT
Mean/%SEMean/%SEMean/%SEMeanSEMeanSE
TopOSP125.58 ab3.196.91 bc1.2032.50 abc2.960.28 cd0.040.13 bcde0.01
OSP222.54 abc2.543.33 d0.4425.87 bcdef2.550.19 c0.020.16 abcde0.02
OSP314.14 cdef2.037.75 abc1.5521.89 def2.300.37 bc0.040.12 abcdef0.03
OSP413.83 def1.8111.80 abc2.0525.62 bcdef2.540.41 abc0.040.08 f0.01
UpperOSP113.93 ef1.276.26 c0.9320.18 ef1.390.30 c0.030.19 a0.02
OSP216.26 bcde1.697.67 bc0.9523.93 cdef1.870.35 bc0.030.17 abc0.02
OSP37.81 g0.9311.00 ab1.3718.81 f1.480.53 a0.040.17 ab0.02
OSP48.98 fg1.1513.25 ab2.2322.23 def2.070.49 ab0.050.11 bcdef0.02
LowerOSP129.97 a3.1114.40 a2.1044.37 a3.170.33 bc0.040.10 cdef0.02
OSP222.14 abcd2.5113.88 a1.8836.02 ab2.840.36 bc0.040.10 cdef0.02
OSP318.25 bcde2.089.17 abc1.6227.42 bcde2.380.33 bc0.040.10 ef0.02
OSP414.32 cdef1.705.81 cd1.2720.13 def2.010.30 ab0.040.16 abcdef0.04
BottomOSP117.49 bcde1.5411.03 abc2.4528.52 bcd2.560.27 cd0.040.15 abcde0.02
OSP218.07 bcde2.888.13 abc1.8226.20 bcdef3.070.26 cd0.040.15 abcd0.01
OSP312.81 efg1.657.93 abc1.8720.74 def1.970.32 bc0.050.11 def0.02
OSP415.94 bcde2.256.90 abc1.9522.84 cdef2.650.24 cd0.040.10 cdef0.02
Note: SE means standard error. Different letters in the same column indicate significant differences at p < 0.05 level.
Table 4. Results of spray tests on cherry: CAD, CAB, CW, RBW, and RCT of OSC1-OSC6.
Sample LayersTest ParametersCAD CAB CW RBW RCT
Mean/%SEMean/%SEMean/%SEMeanSEMeanSE
TopOSC120.69 ab2.654.00 bc0.8424.70 abc2.780.22 bcd0.040.27 a0.04
OSC220.38 ab3.338.53 abc2.0028.91 abc3.780.31 abcd0.050.23 ab0.04
OSC320.54 ab2.826.36 abc1.5026.90 abc2.700.25 bcd0.050.22 ab0.03
OSC420.99 ab3.177.85 abc1.6828.84 abc3.030.33 abc0.060.25 a0.04
OSC519.71 ab3.2210.87 a1.6330.58 ab3.340.46 a0.060.27 a0.05
OSC614.90 ab2.353.61 bcd0.9418.52 c2.360.29 abcd0.050.24 abc0.06
MiddleOSC118.94 ab3.201.36 d0.4820.30 bc3.300.14 d0.040.12 bc0.03
OSC220.78 ab2.874.81 bc0.8025.59 abc2.860.25 bcd0.040.18 abc0.04
OSC321.67 ab2.889.04 ab2.0030.71 ab2.620.31 abc0.050.23 ab0.03
OSC421.74 ab3.728.60 abc2.1530.34 abc3.830.37 ab0.060.11 c0.01
OSC521.76 ab3.578.98 ab1.9030.74 ab3.220.36 ab0.060.15 abc0.03
OSC627.65 a3.407.43 abc1.6535.08 a3.360.24 bcd0.050.16 abc0.03
BottomOSC119.09 ab2.273.40 cd0.6322.48 bc2.220.18 cd0.030.20 ab0.03
OSC220.57 ab2.819.04 ab2.0229.60 ab2.850.32 abcd0.060.18 ab0.02
OSC324.63 ab2.756.90 abc1.5231.52 ab2.520.23 bcd0.050.27 a0.04
OSC425.54 ab3.495.01 bc0.9930.54 ab3.540.21 bcd0.040.23 ab0.04
OSC522.18 ab2.926.85 abc1.3929.02 ab2.880.28 abcd0.050.21 ab0.04
OSC626.00a b3.387.59 ab1.3833.60 a3.210.27 abcd0.050.22 ab0.03
Note: SE means standard error. Different letters in the same column indicate significant differences at p < 0.05 level.
Table 5. Results of the correlation analysis between airflow and deposit indicators at different parts of pear canopy.
Deposit IndicatorsCanopy PartsX-vY-vZ-vZY-dZX-dYX-d
rprprprprprp
CADTotal−0.0670.060−0.0270.454−0.0600.092−0.1020.004−0.0070.845−0.0660.063
Inside−0.0470.554−0.0080.916−0.0160.844−0.1150.148−0.1050.185−0.0130.868
Outside−0.0830.036−0.0280.479−0.1280.001−0.1190.002−0.0060.873−0.0600.128
CABTotal0.2030.000−0.0370.2920.2050.000−0.0020.9450.0930.0090.0010.966
Inside0.1180.1360.1630.039−0.0160.837−0.0740.351−0.0330.678−0.0790.319
Outside0.1920.000−0.0480.2280.1800.000−0.0060.8700.0970.0140.0280.483
CWTotal0.0750.033−0.0480.1770.0830.019−0.0910.0100.0550.119−0.0570.109
Inside0.0180.8230.0710.369−0.0210.793−0.1310.099−0.1030.194−0.0490.538
Outside0.0560.159−0.0580.1430.0070.864−0.1120.0040.0610.125−0.0350.370
RBWTotal0.1360.0000.0610.0840.1720.0000.0810.0220.0620.0820.0380.281
Inside0.1910.0160.1820.022−0.0640.4240.0240.7650.0630.427−0.0650.411
Outside0.1240.0020.0520.1880.1740.0000.0900.0230.0500.2080.0700.076
Note: The r value represents the Pearson correlation coefficient, p < 0.05 indicates a correlation between the two indicators, p < 0.01 indicates a significant correlation, and p < 0.001 indicates an extremely significant correlation.
Table 6. Results of the correlation analysis between airflow and deposit indicators at different parts of cherry canopy.
Deposit IndicatorsCanopy PartsX-vY-vZ-vZY-dZX-dYX-d
rprprprprprp
CADTotal−0.0680.112−0.0530.2170.0520.230−0.0070.879−0.0390.364−0.0850.048
Inside0.0150.845−0.2020.007−0.0390.605−0.1560.0370.0110.8840.1160.121
Outside−0.1570.003−0.0300.5710.0130.811−0.0600.259−0.1280.015−0.0340.518
CABTotal0.0830.055−0.0040.9230.0280.5210.0340.4350.0110.805−0.0350.418
Inside−0.1730.0200.0300.694−0.1460.0510.1470.049−0.1040.163−0.1130.131
Outside0.1300.014−0.0130.8090.0560.287−0.0360.4990.0450.3900.0340.516
CWTotal−0.0270.539−0.0550.2050.0650.1320.0100.812−0.0330.439−0.1020.018
Inside−0.0550.463−0.1570.036−0.0890.234−0.0730.332−0.0310.6750.0530.482
Outside−0.0920.082−0.0400.4500.0470.372−0.0860.105−0.1100.036−0.0160.757
RBWTotal0.0680.1120.0360.403−0.0310.4730.0790.0660.0220.614−0.0190.658
Inside−0.1740.0200.1900.011−0.0260.7310.2450.001−0.0860.253−0.2130.004
Outside0.1720.001−0.0050.930−0.0090.8630.0350.5050.1060.0440.0350.510
Publisher’s Note: MDPI stays neutral with regard to jurisdictional claims in published maps and institutional affiliations.

